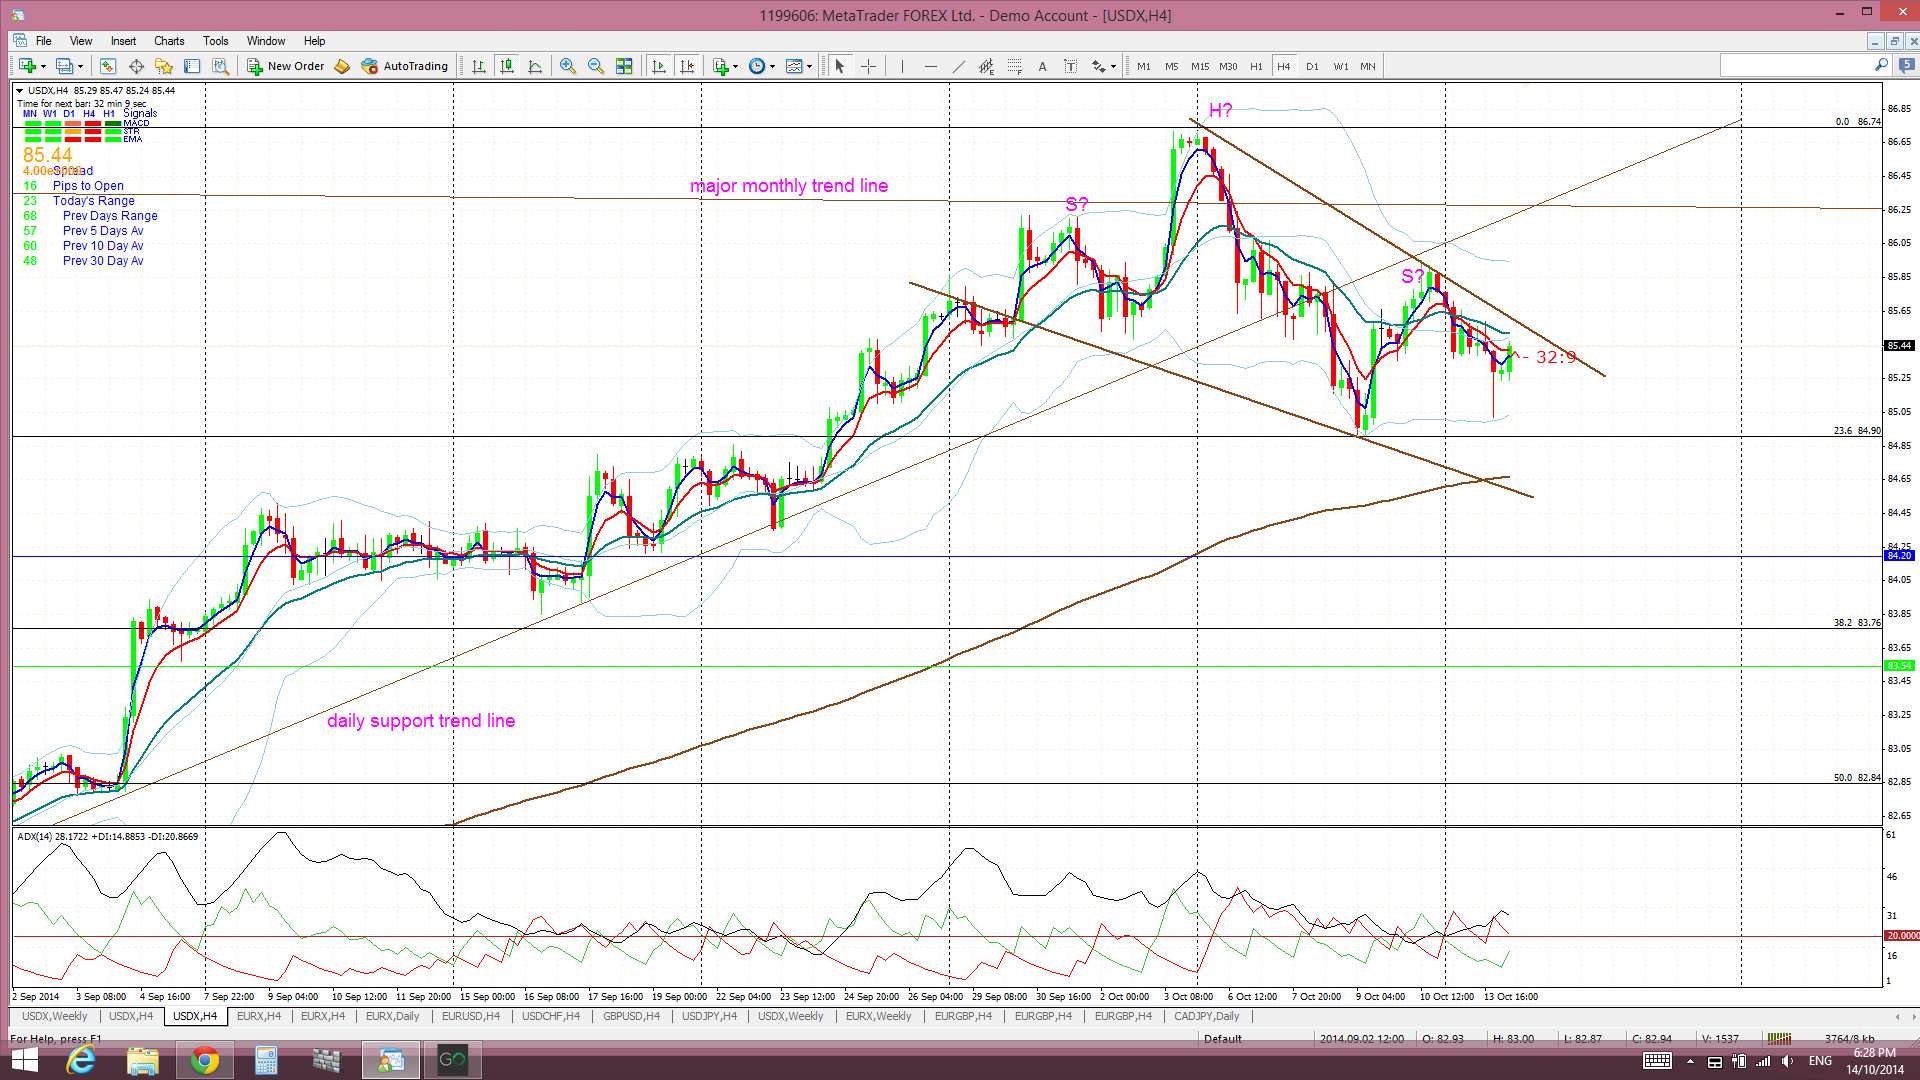
I noted earlier today how the USD index could be viewed as setting up within a potential bearish H&S pattern on the 4hr chart. This is still a possibility but a re-think of overall trend lines here shows that price action could also be forming up into another ‘Bull Flag’.
USDX 4hr: the possible bearish H&S is still evident but the overall price action could also be seen as consolidating under major resistance within yet another ‘Bull Flag:
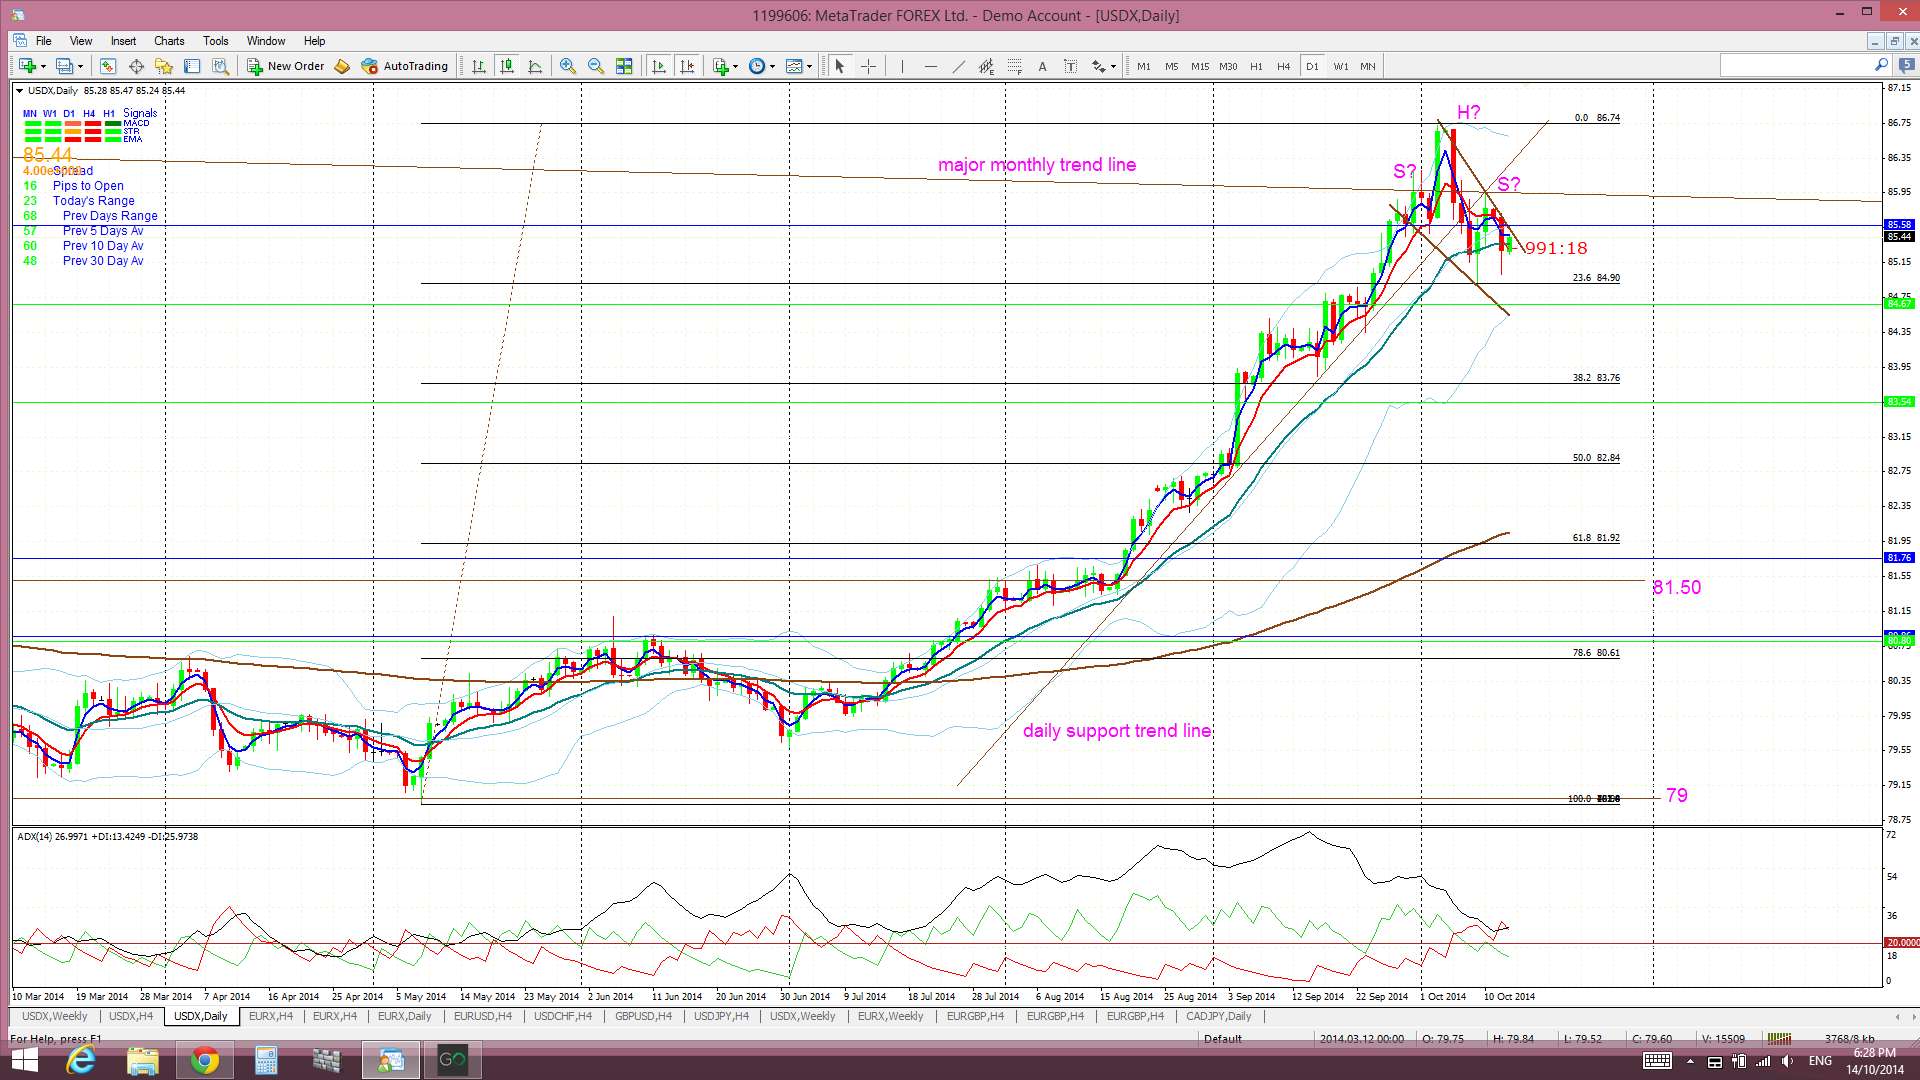
USDX daily: the ‘Bull Flag’ option looks clear on the daily chart too. Trend line breaks might help traders to determine the next major directional move on the USDX:
- A bullish breakout above the ‘Flag’ would suggest the ‘Bull Flag’ option.
- A bearish break below the ‘Flag’/H&S neck line would support the bearish H&S option:
USDX 4hr Cloud: the index is still below the 4hr Cloud and this may help to contain price:

Summary: the USD index is still consolidating below the major resistance of the monthly chart’s bear triangle trend line. Watching for a breakout from the ‘Flag’ pattern might help traders determine the next major directional move for the index.Â
The post USDX & conflicting signals: trend lines might help! appeared first on www.forextell.com.