USDX
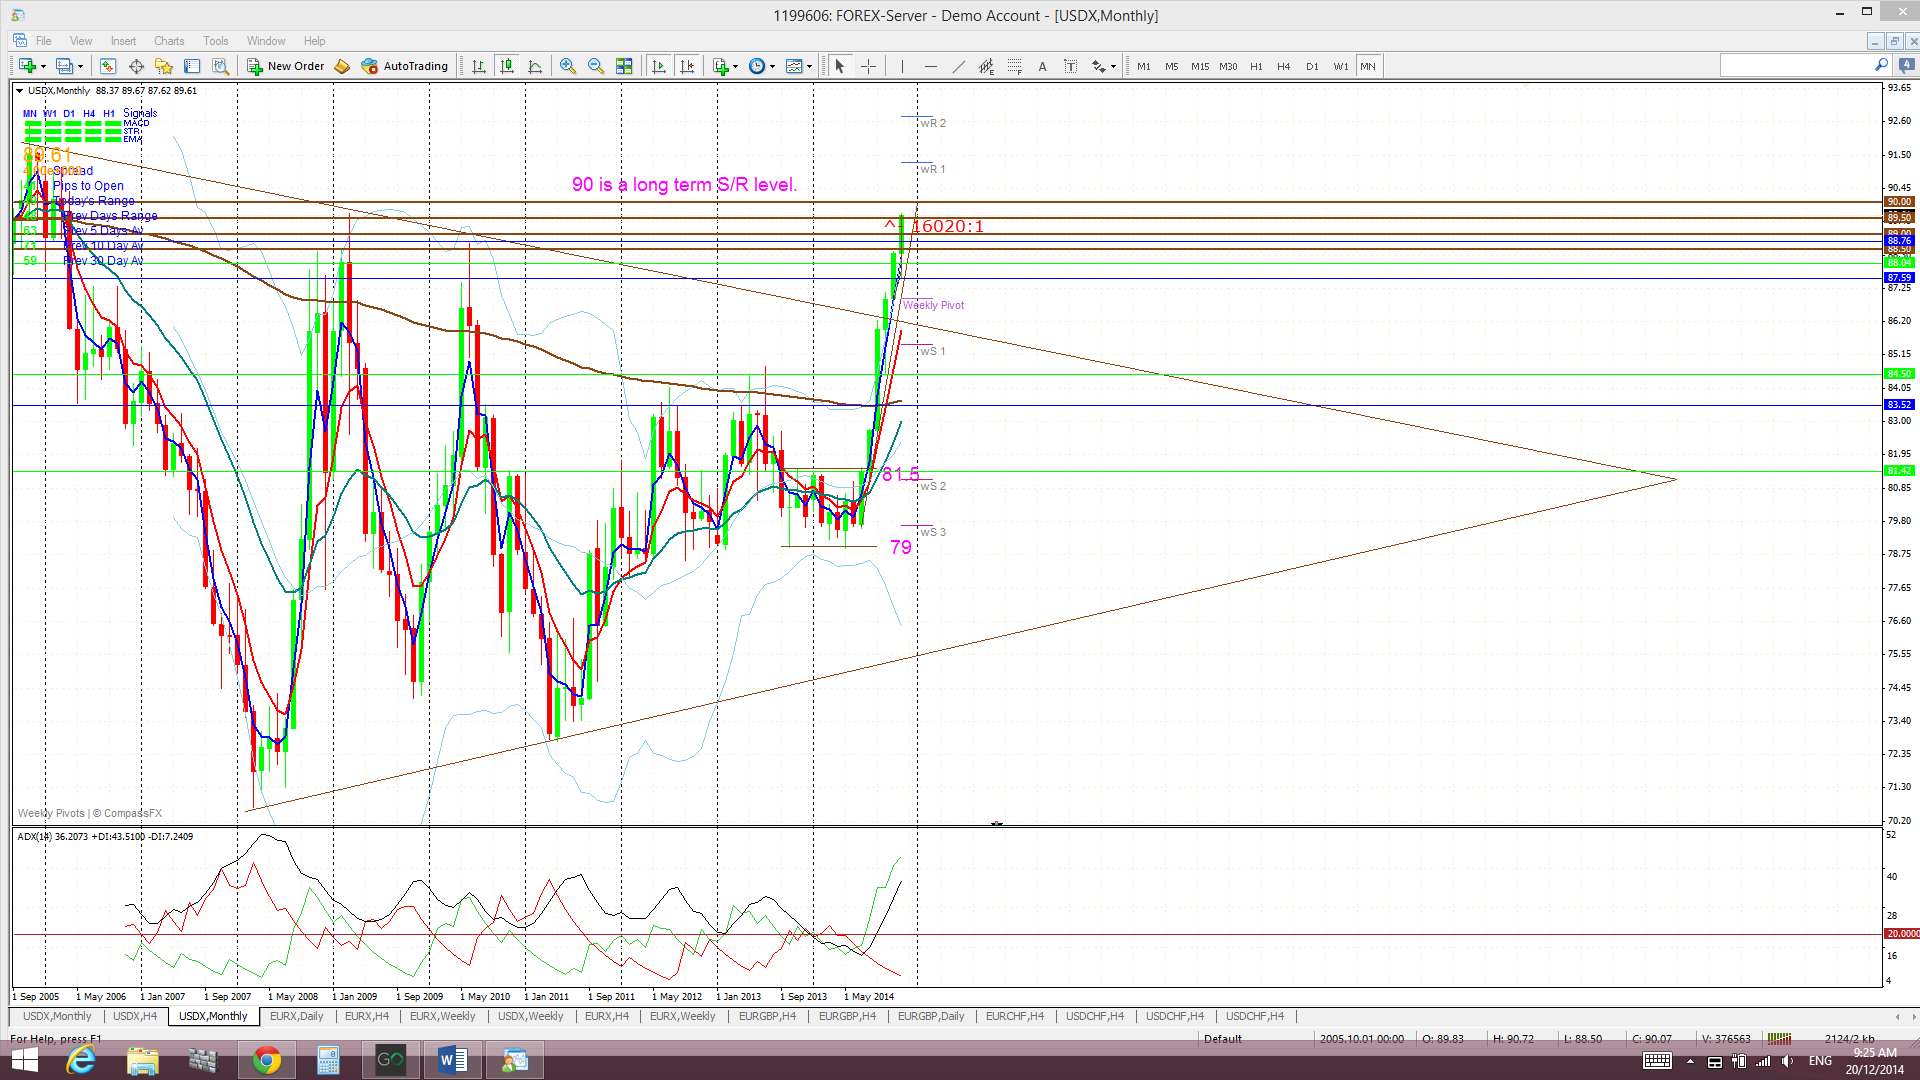
Monthly: The December candle is currently printing a bullish candle and is just below the key 90 S/R level.
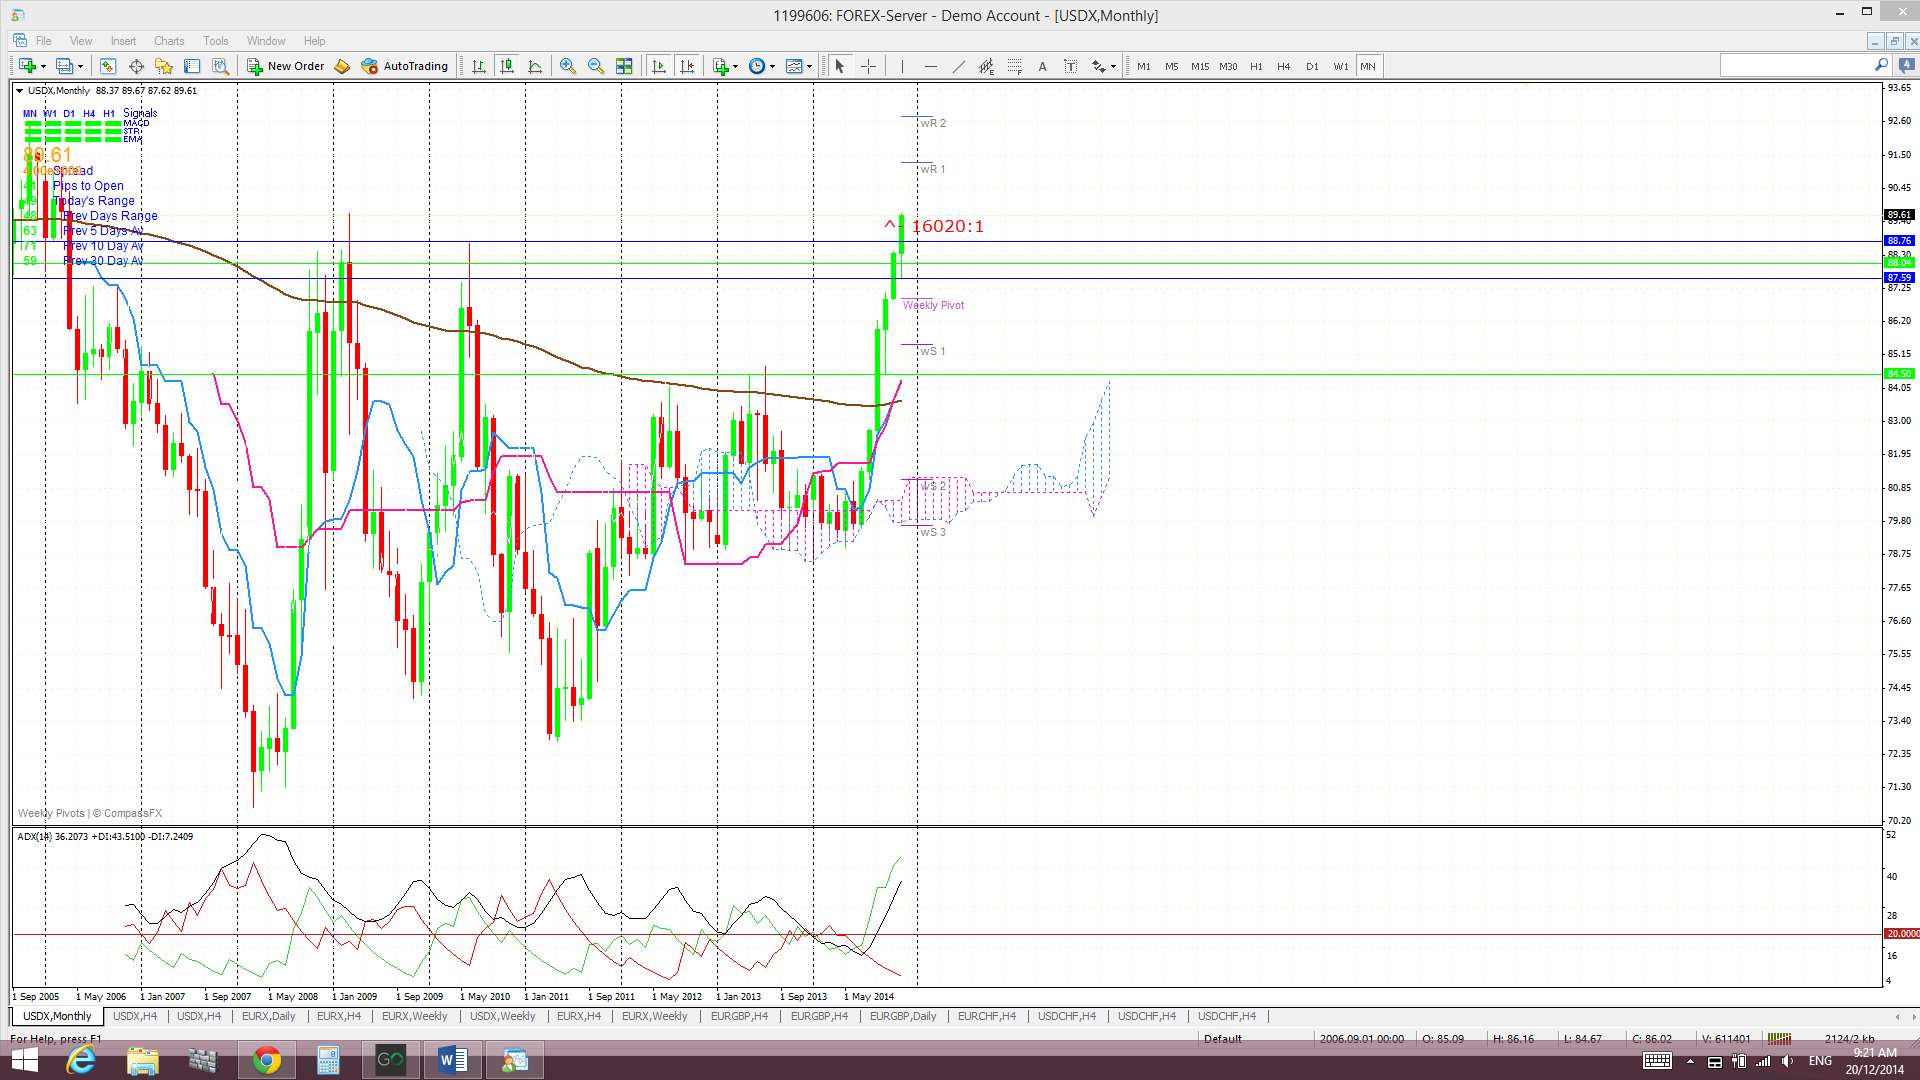
Monthly Ichimoku: The December candle is trading well above the monthly Cloud.
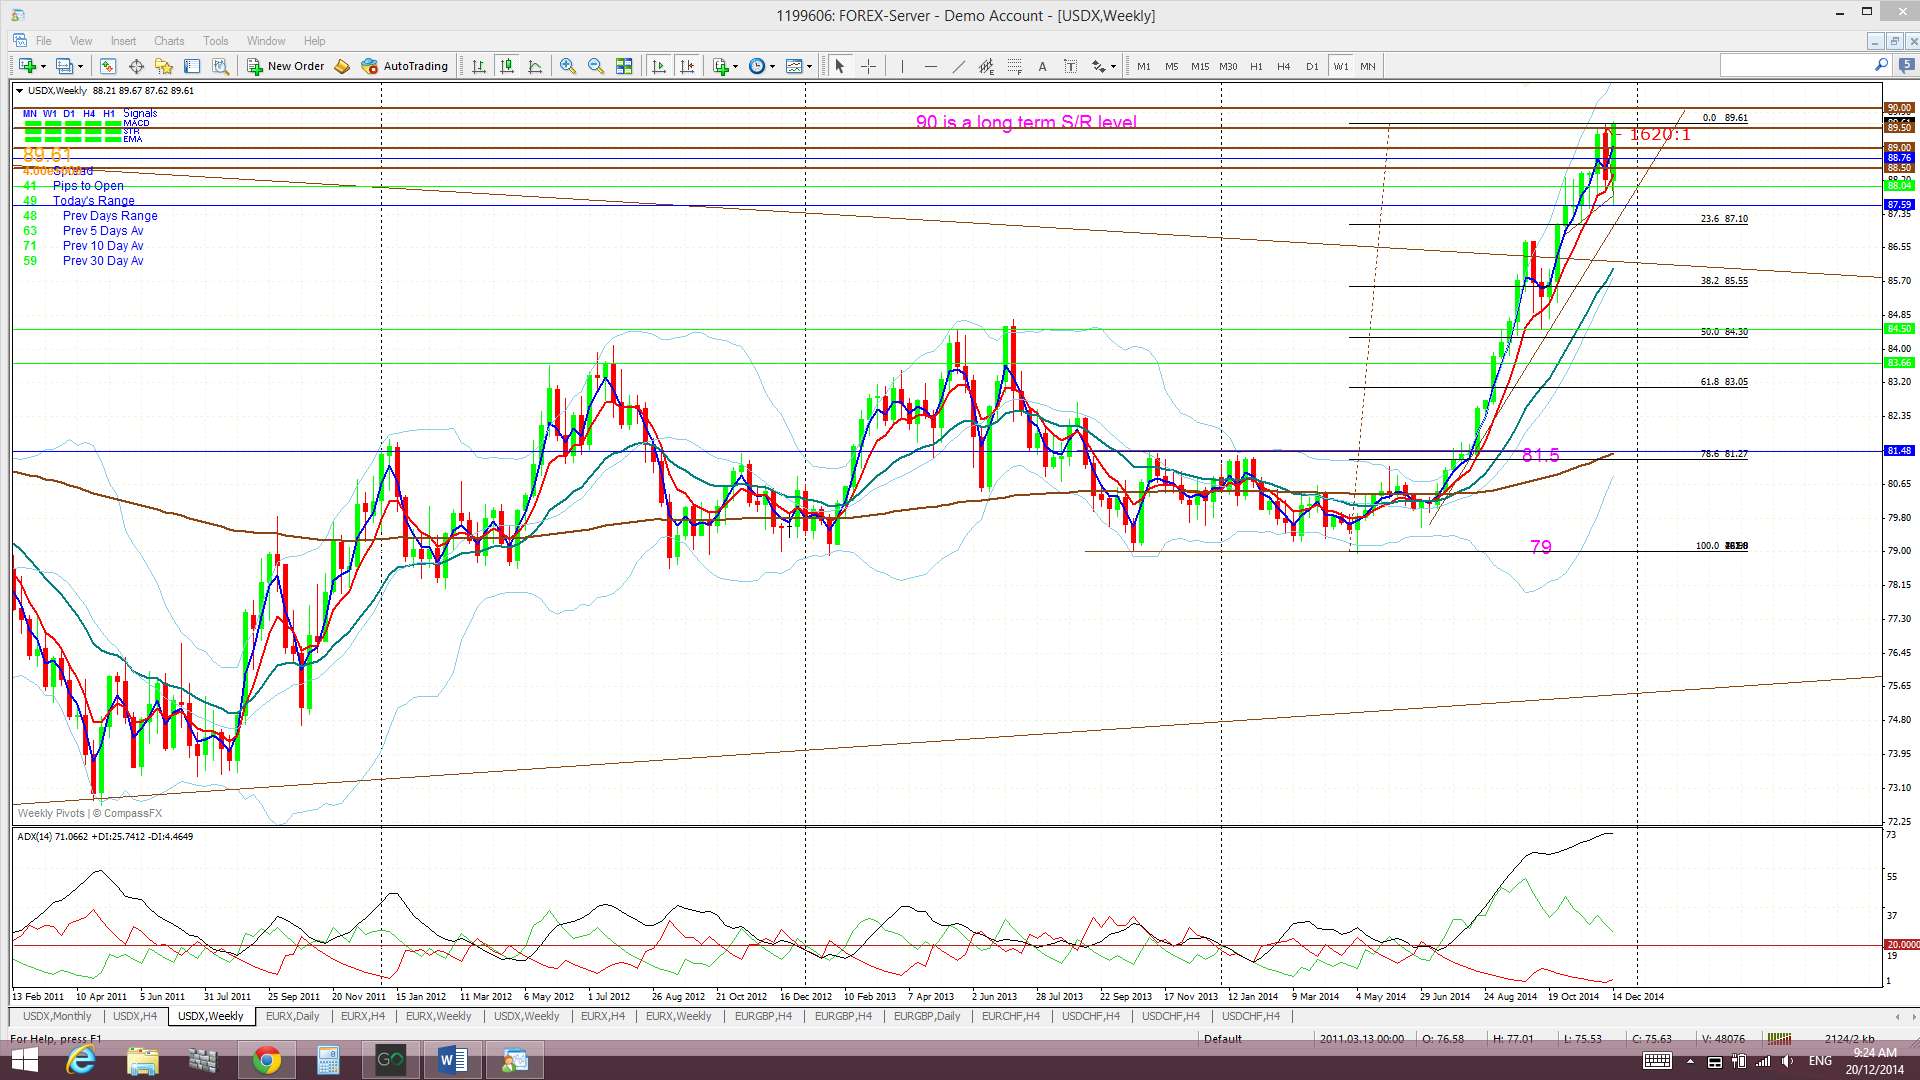
Weekly: Last week’s candle closed as a bullish engulfing candle. So much for the previous week’s bearish-reversal ‘Railway Track’ candle!
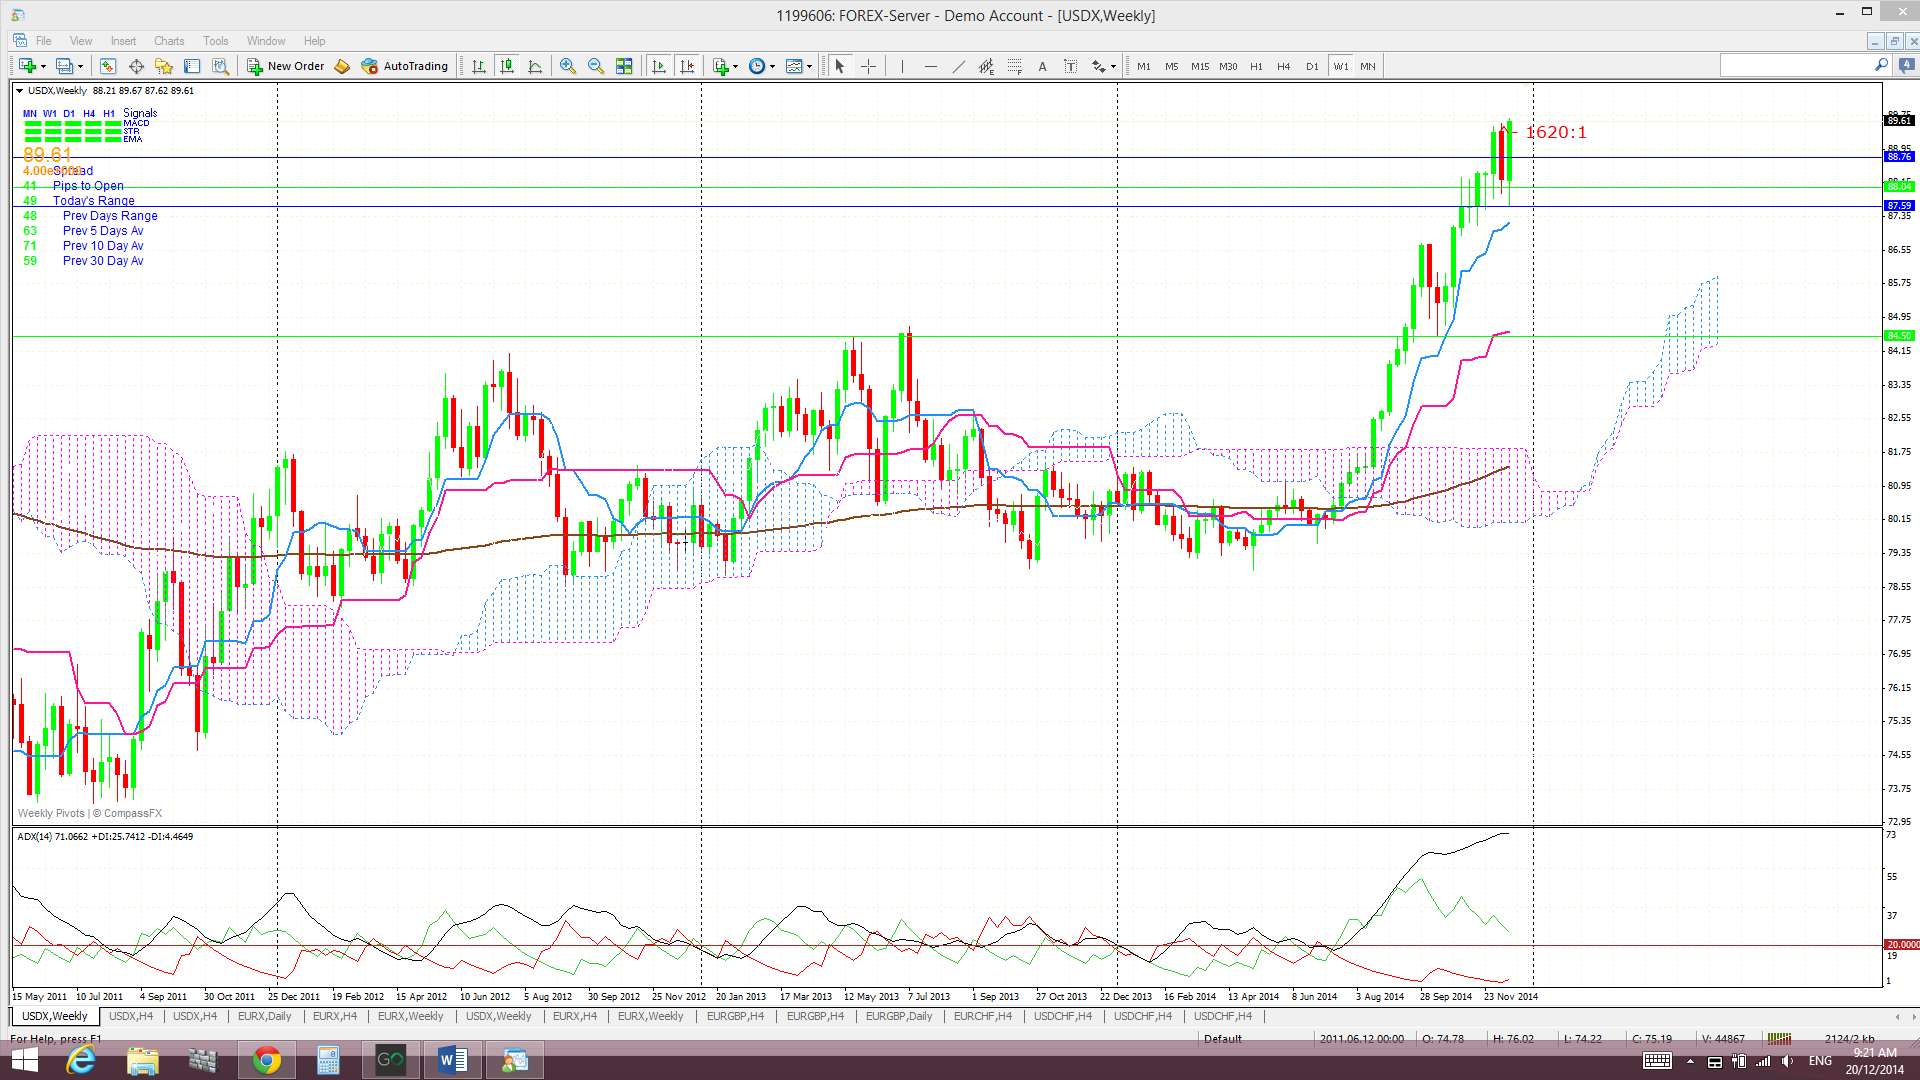
Weekly Ichimoku: Price is still trading ABOVE the weekly Cloud.
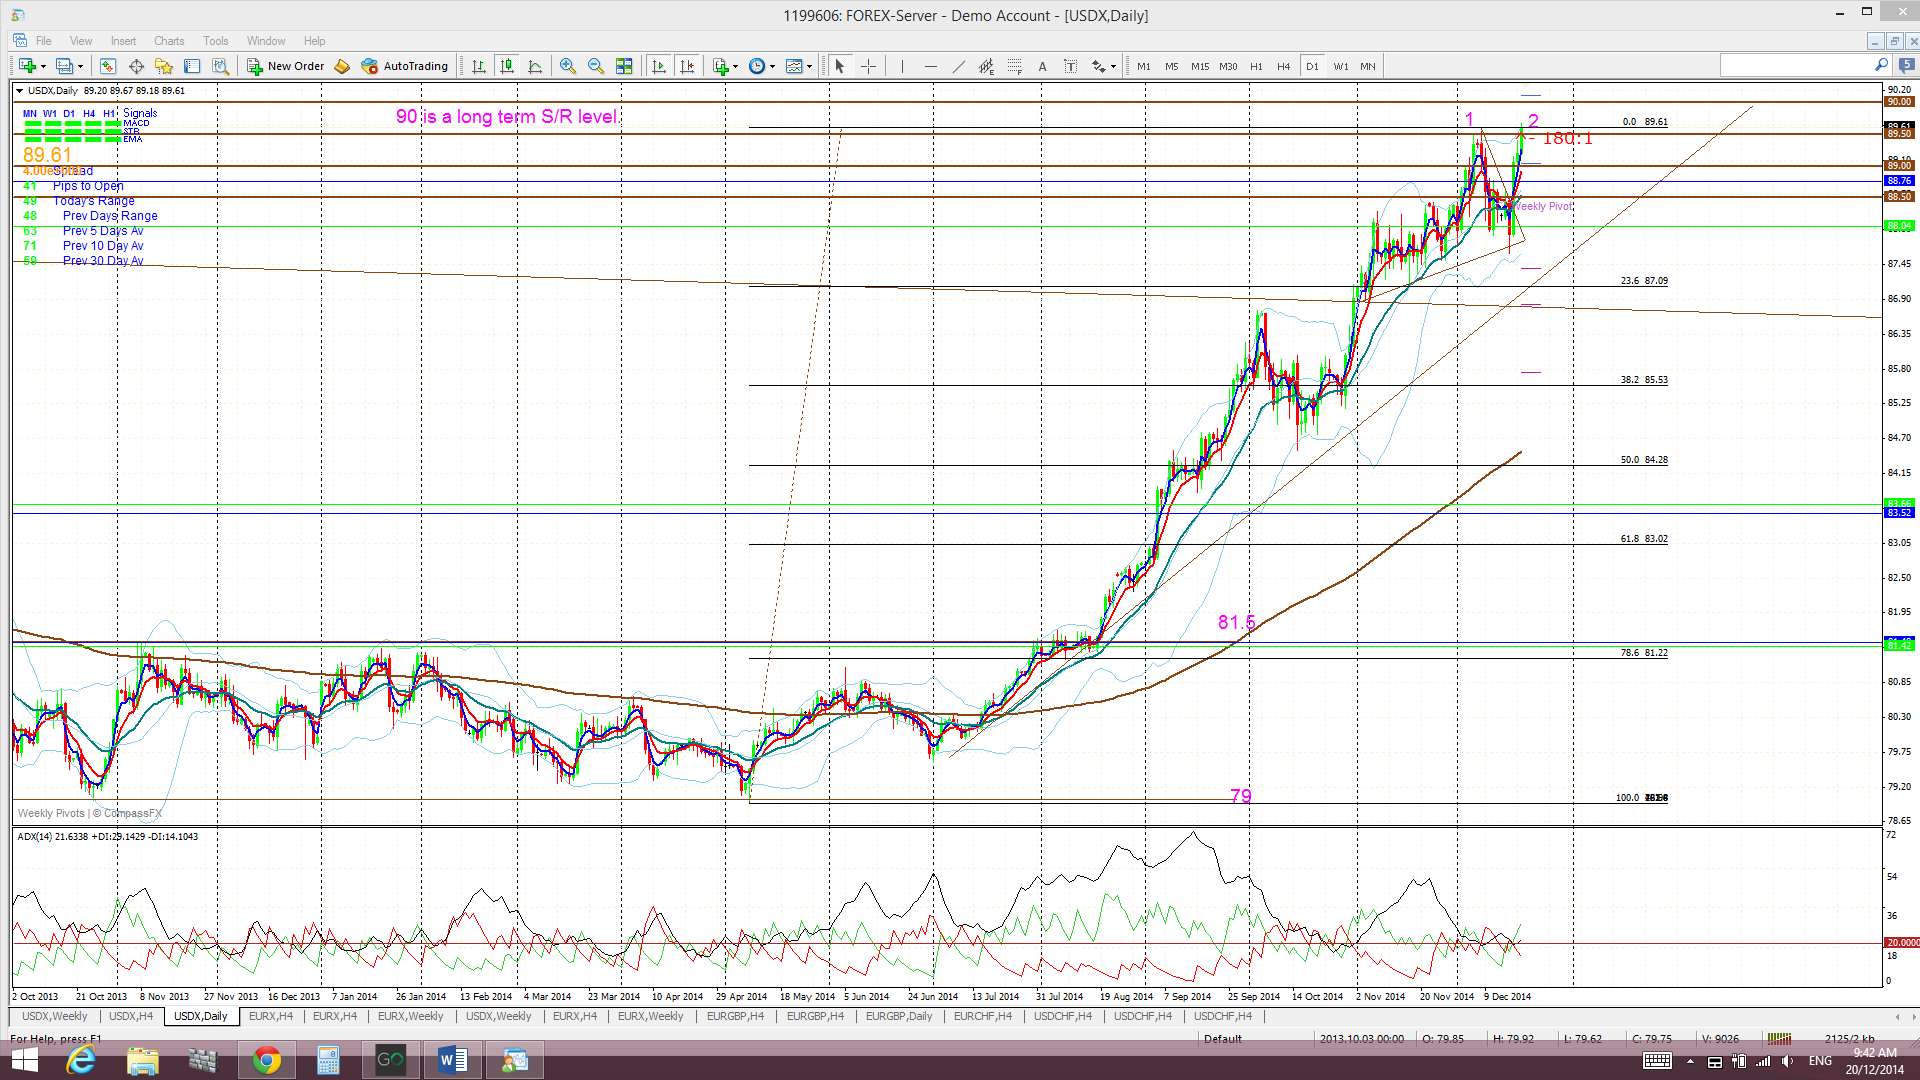
Daily: Price finished the week strongly to close just under the major 90 resistance level.
Daily Ichimoku Cloud chart: Price traded above the Cloud all week and there is still an open bullish Tenkan/Kijun cross in play.

4hr: Price chopped lower to start the week but recovered on Wednesday with FOMC, made a bullish triangle breakout and kept going from there.
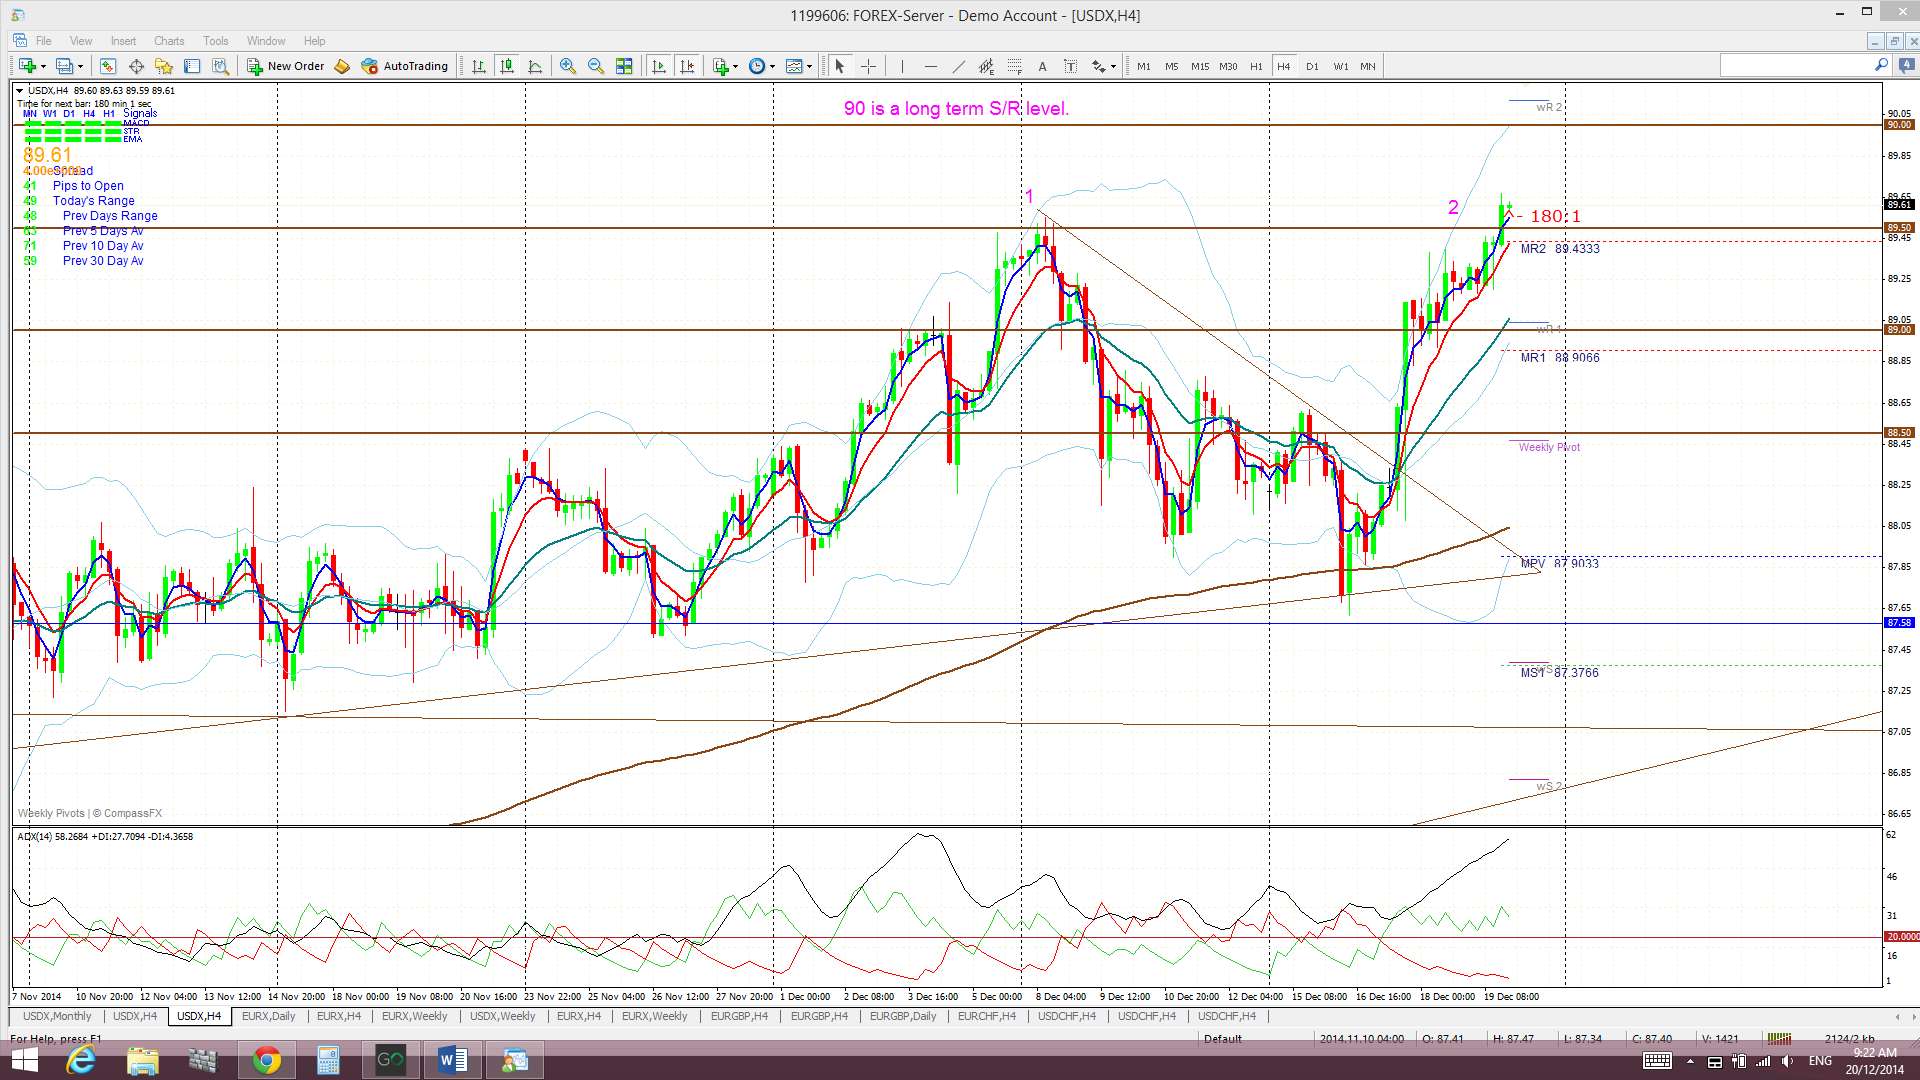
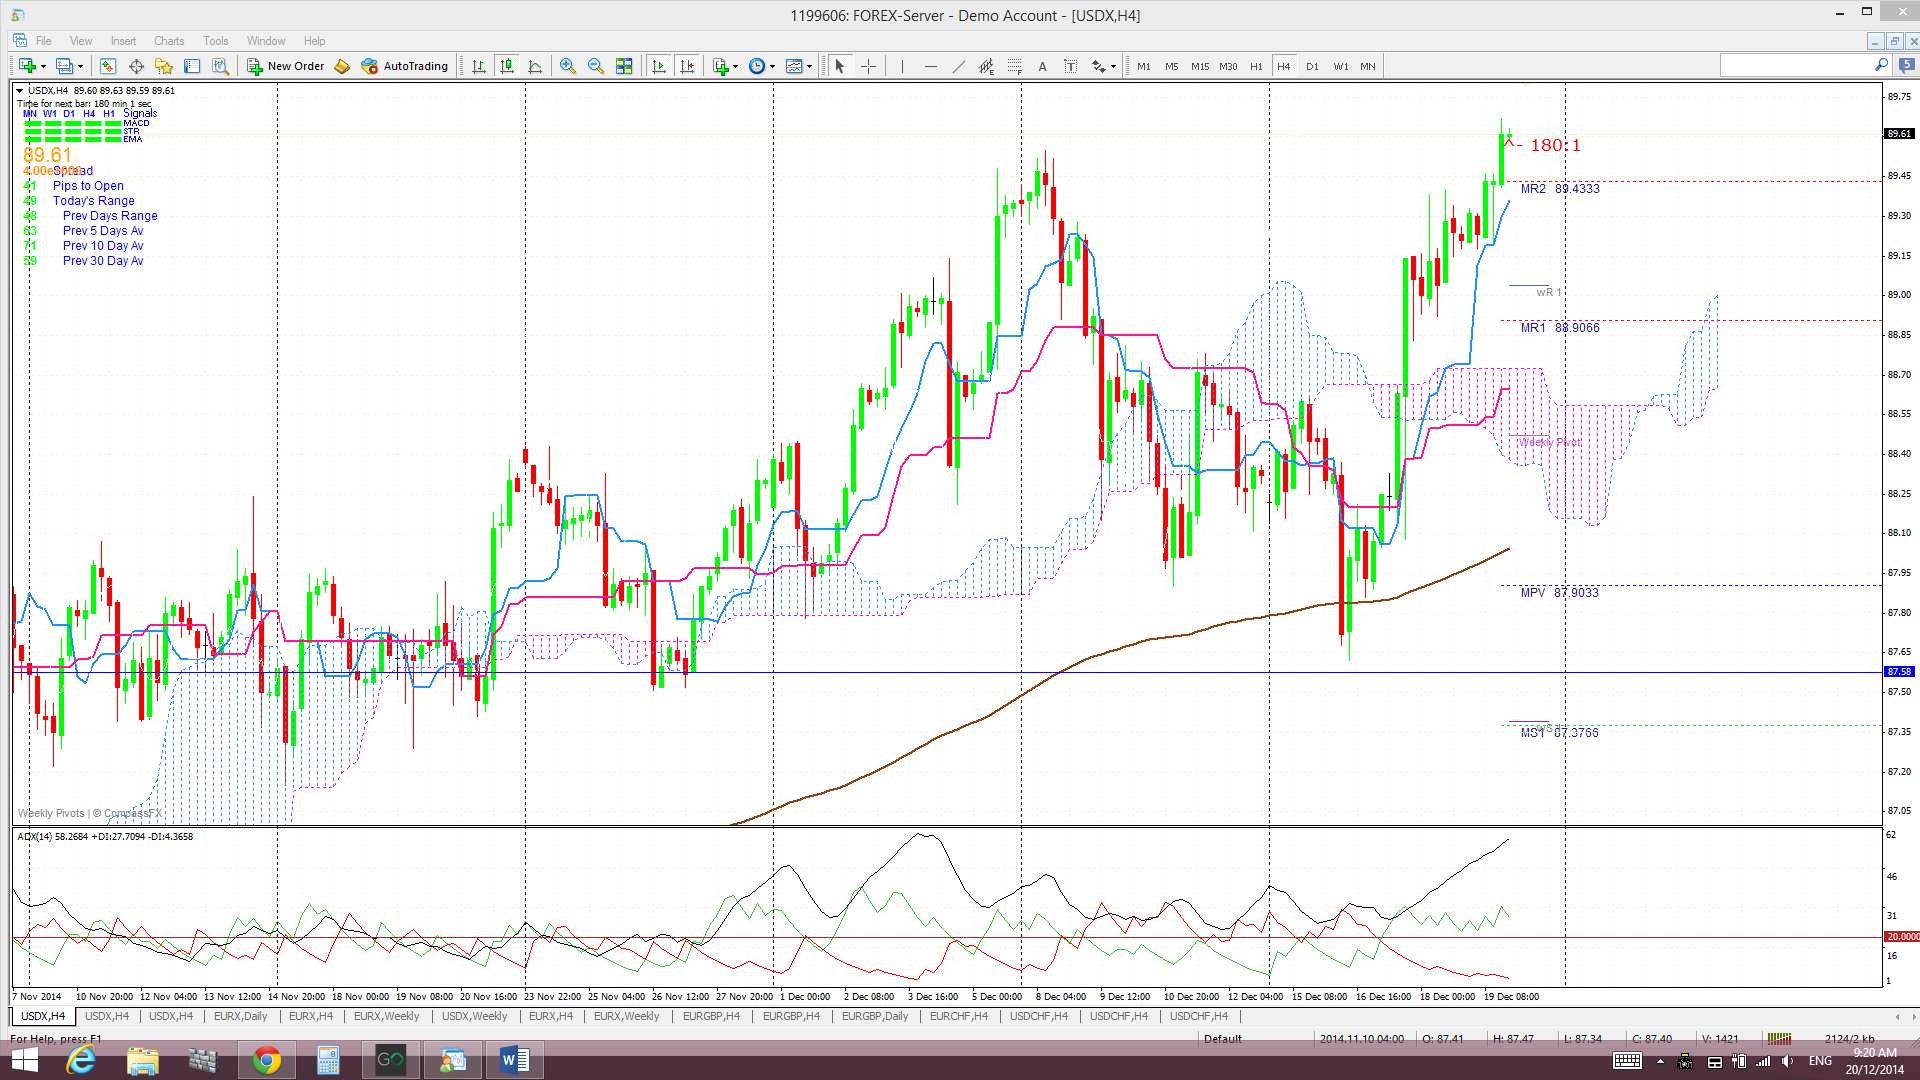
4hr Ichimoku Cloud chart: Price started the week below thin Cloud band but rallied from Wednesday and closed above the Cloud. This chart is now aligned with the daily chart and suggests long USD.
EURX
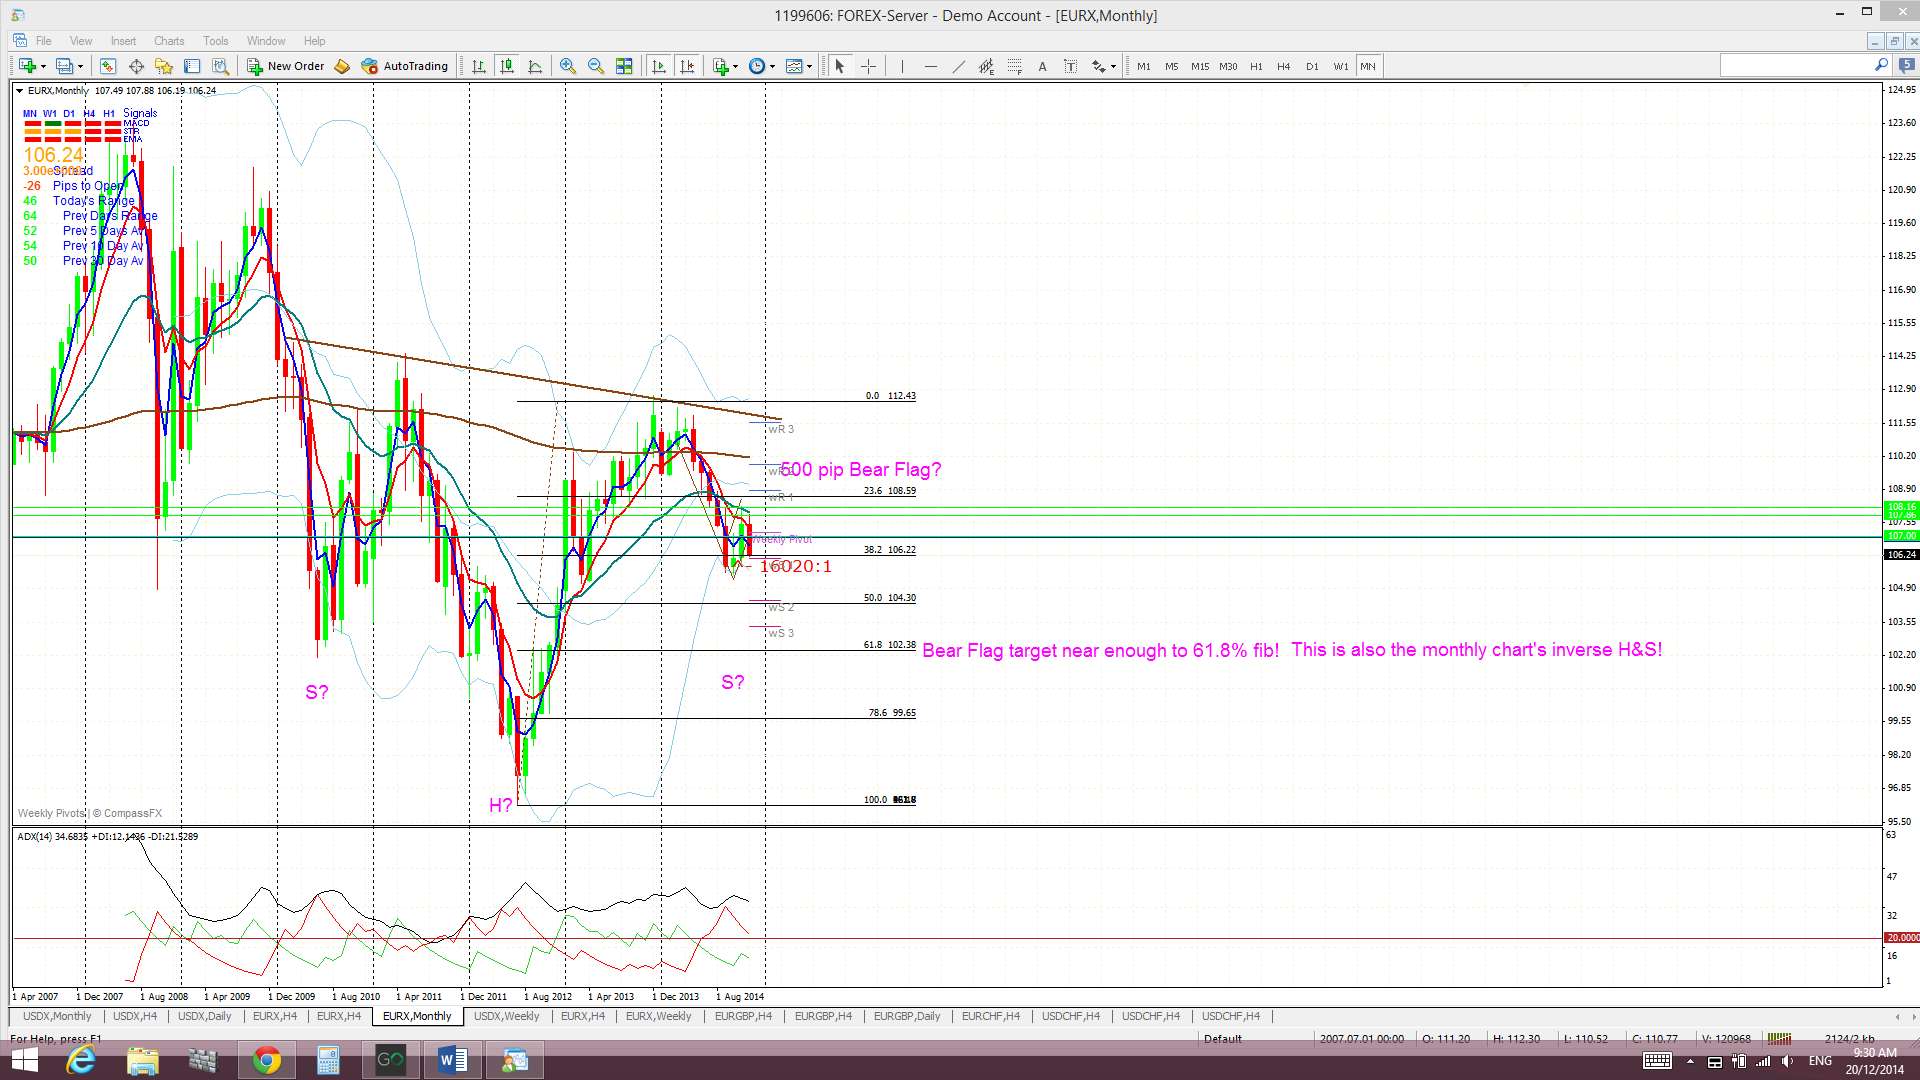
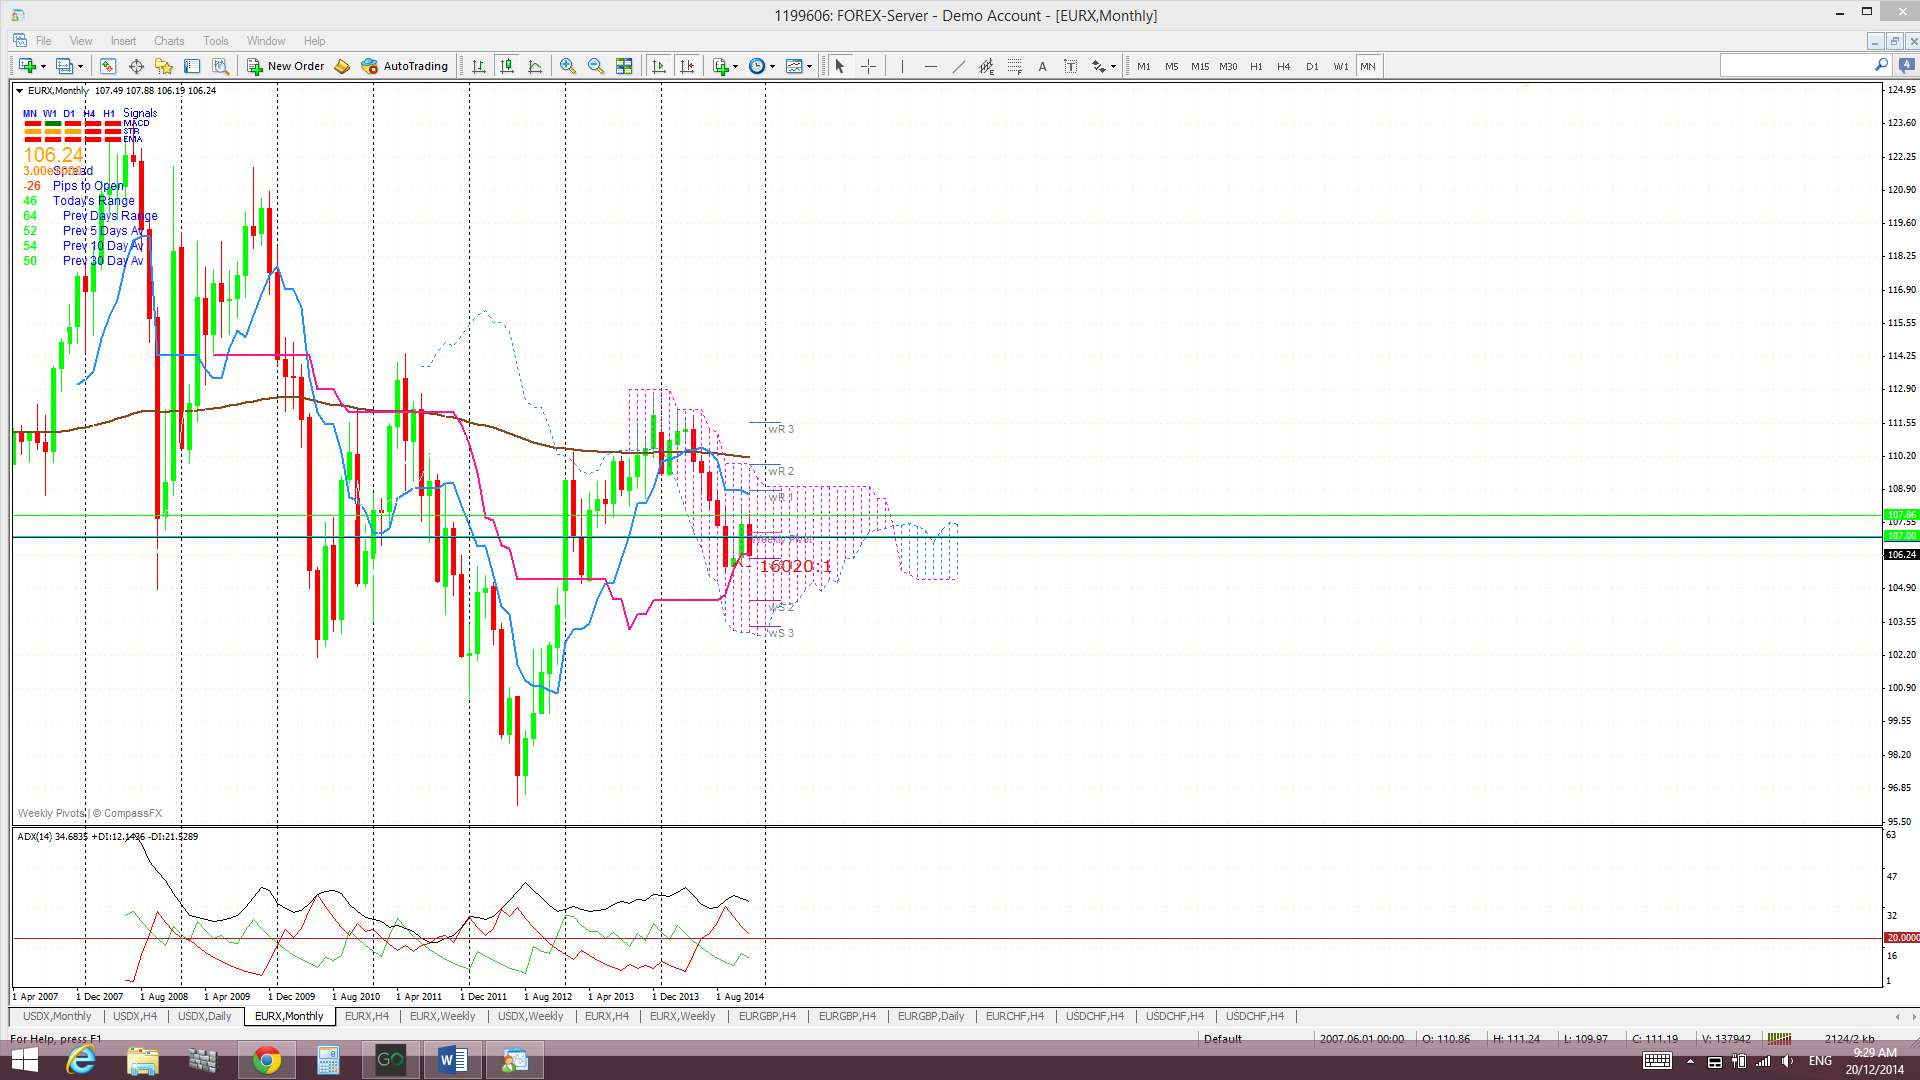
Monthly: The December candle is currently printing a bearish coloured ‘Inside’ candle. I am still seeing a larger-scale bullish ‘inverse H&S’ pattern developing here though.
Monthly Ichimoku: The December candle is trading within the monthly Cloud.
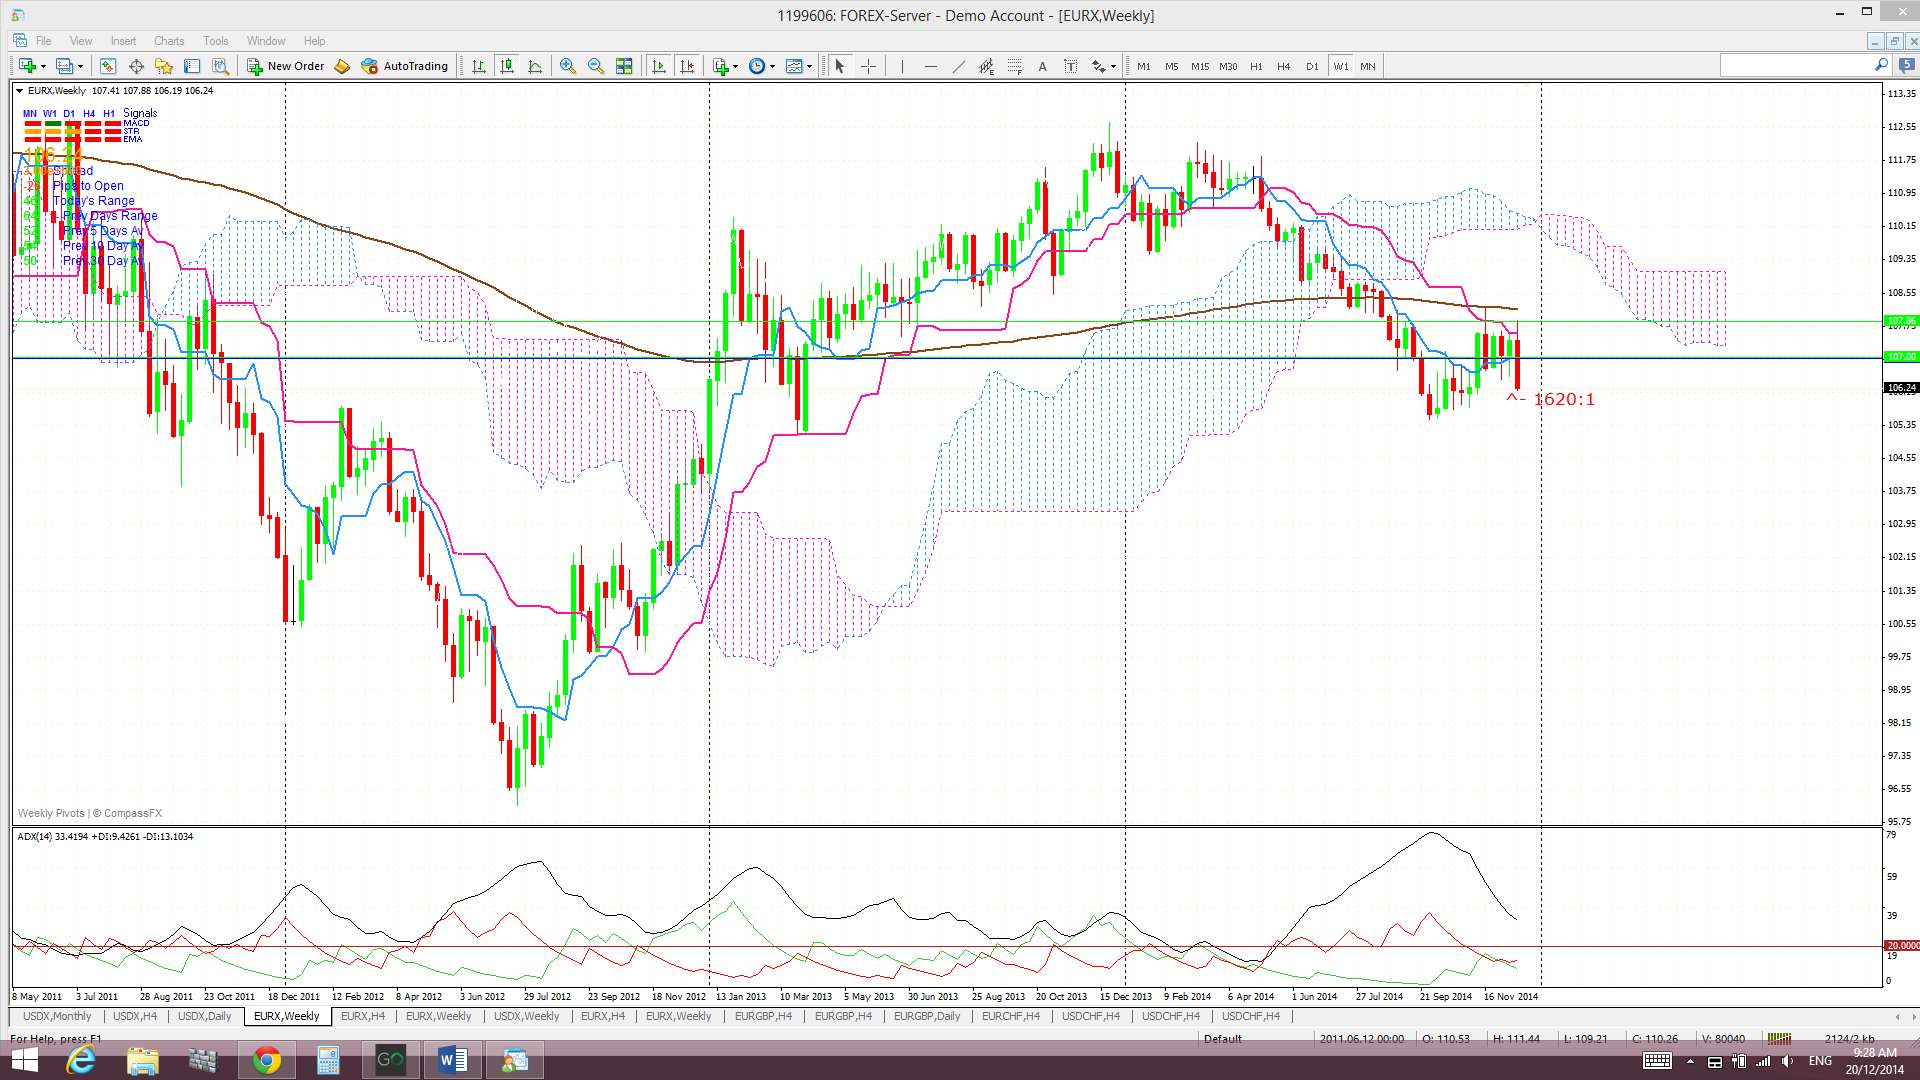
Weekly: The weekly candle closed as a large bearish engulfing candle and below a recent support trend line. This break has contributed to what looks like the start of a Bear Flag pattern (notes on this below).
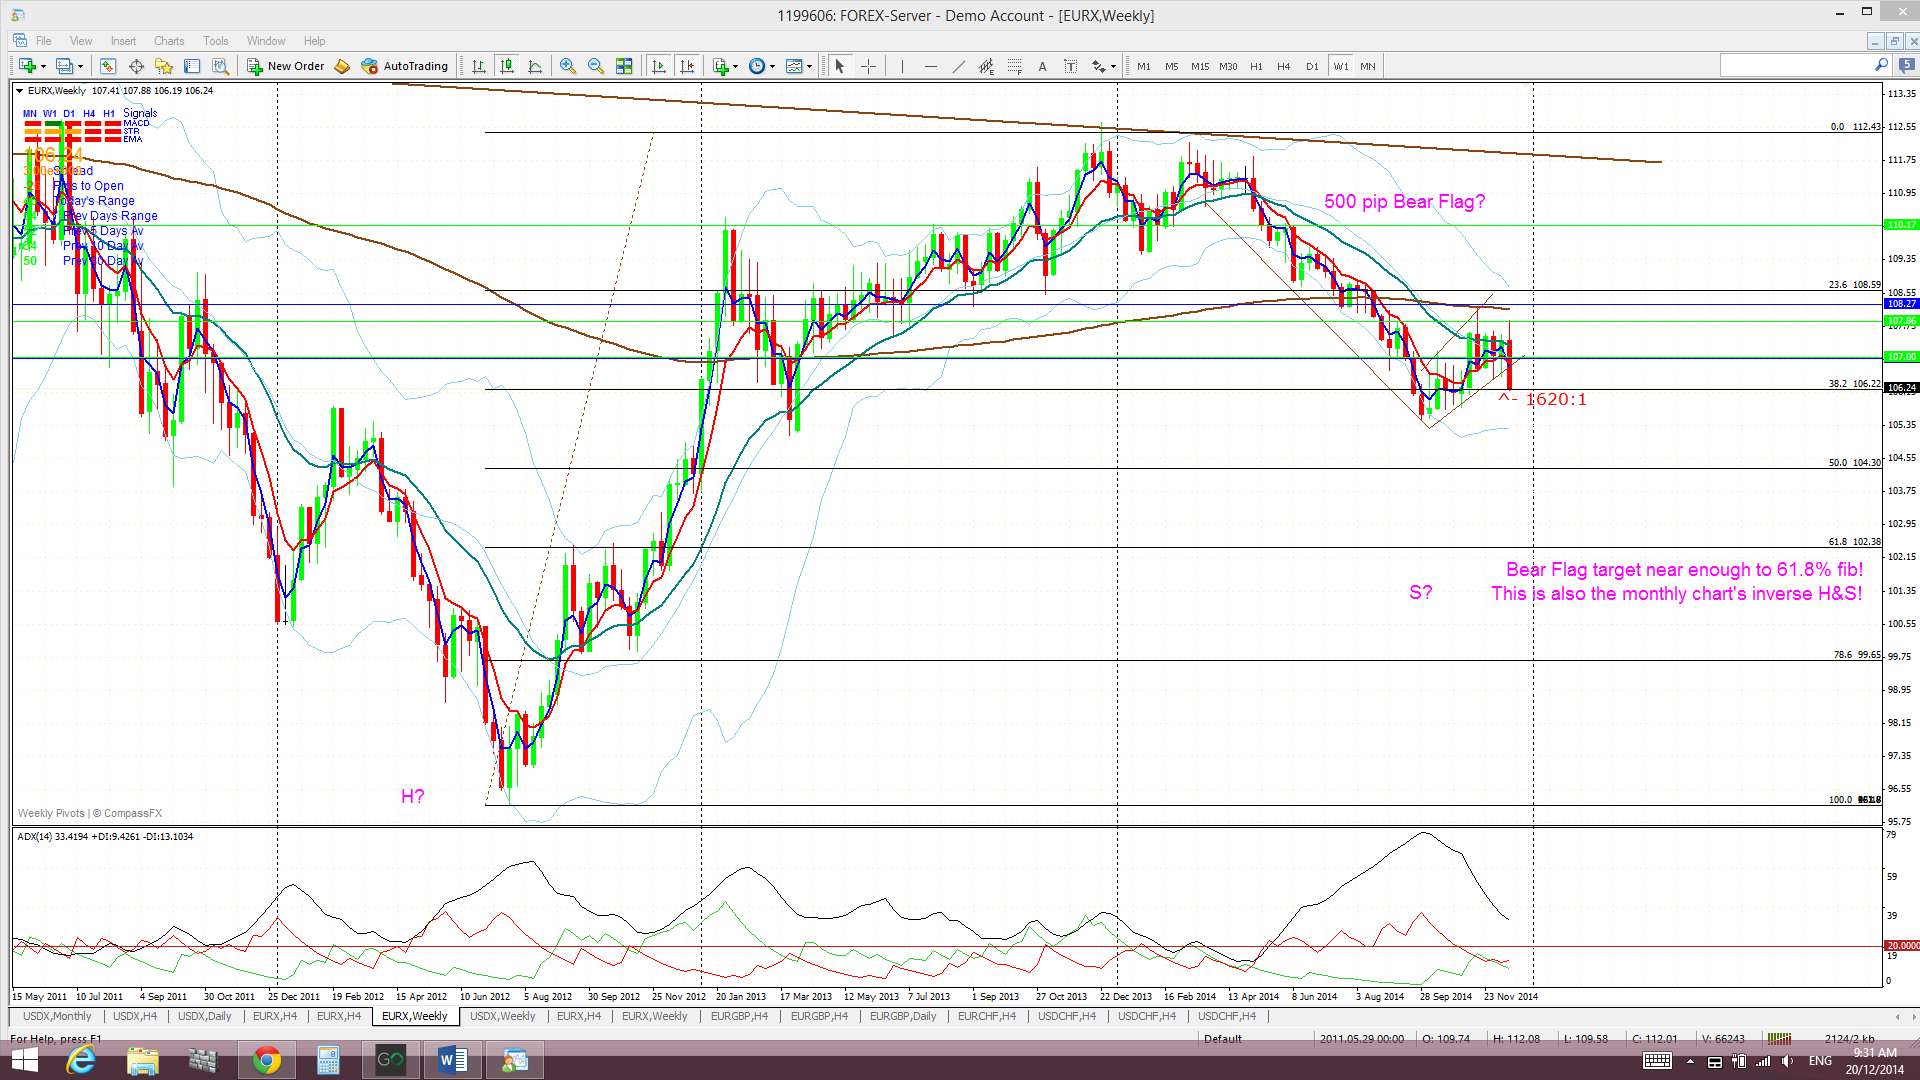
Weekly Ichimoku: Price is still trading below the weekly Cloud.
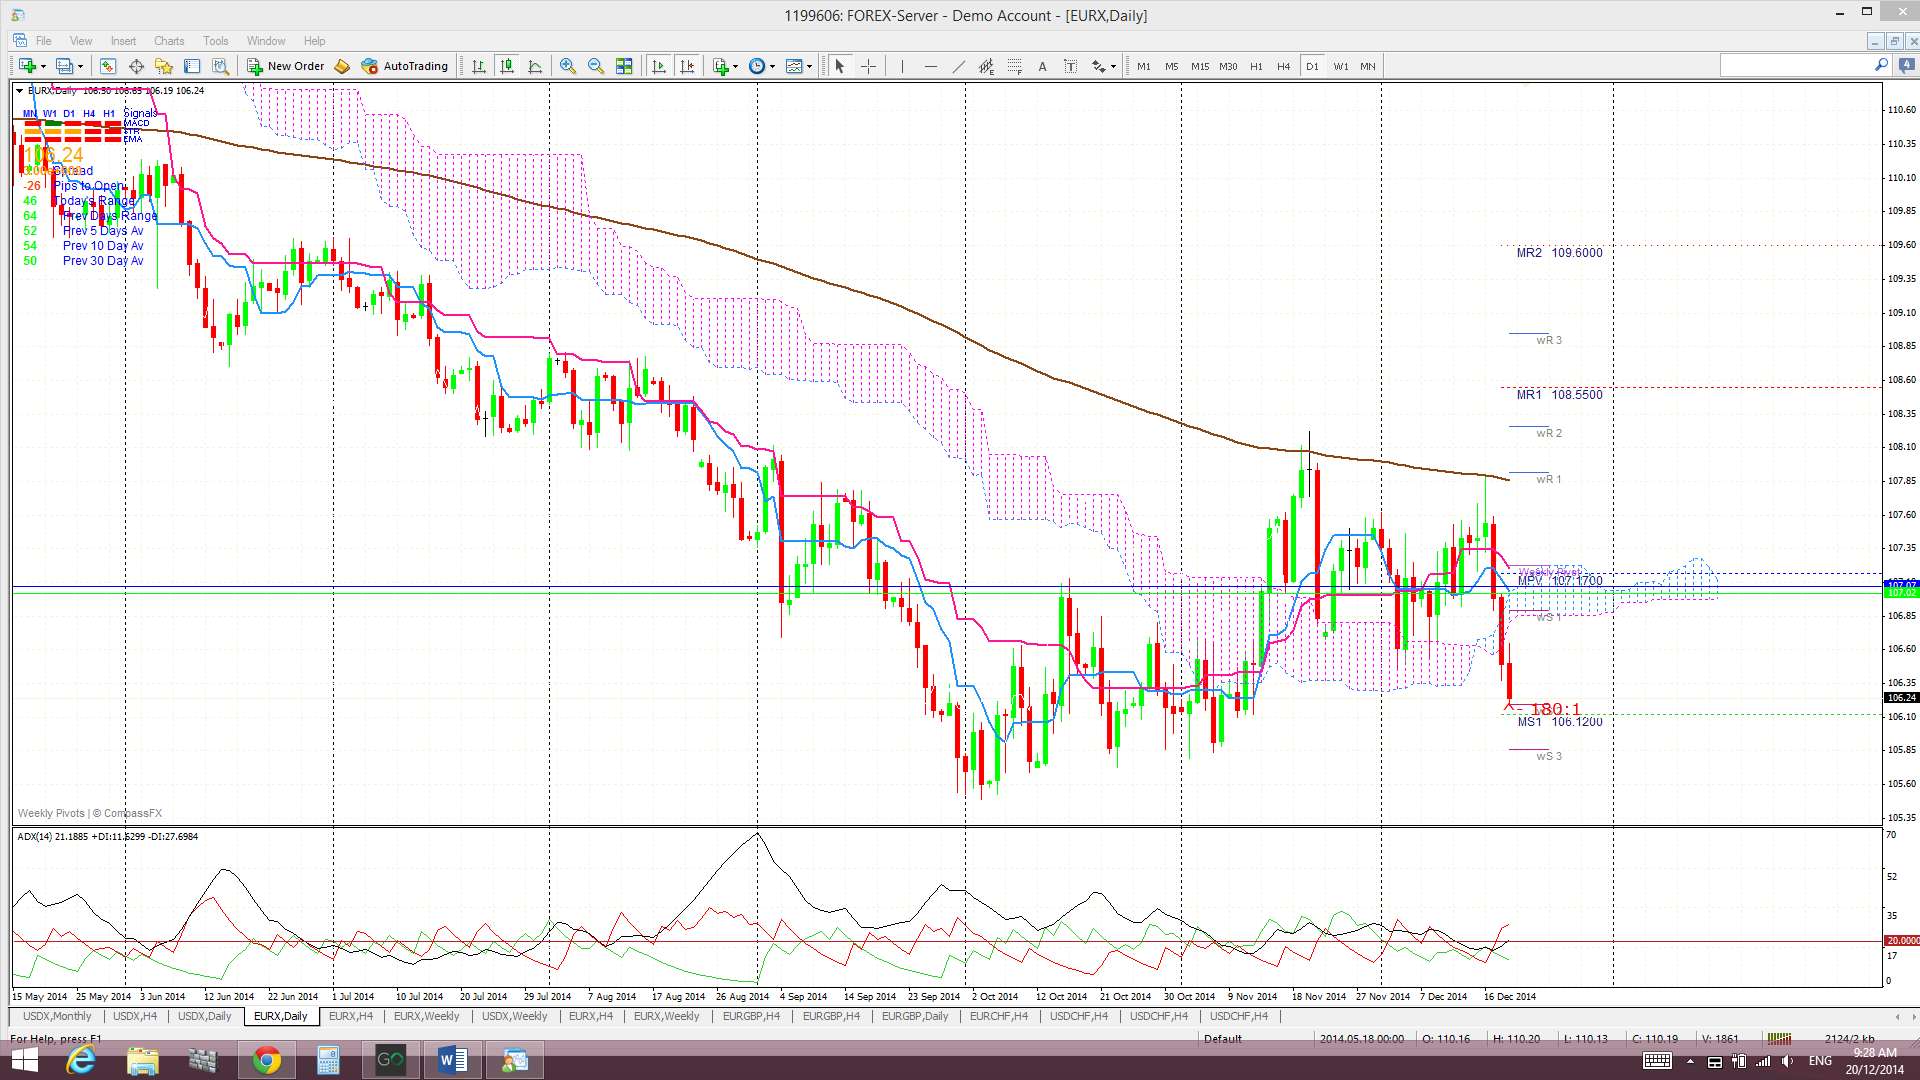
Daily: Price fell heavily from Wednesday and broke through a recent support trend line initiating a possible Bear Flag.
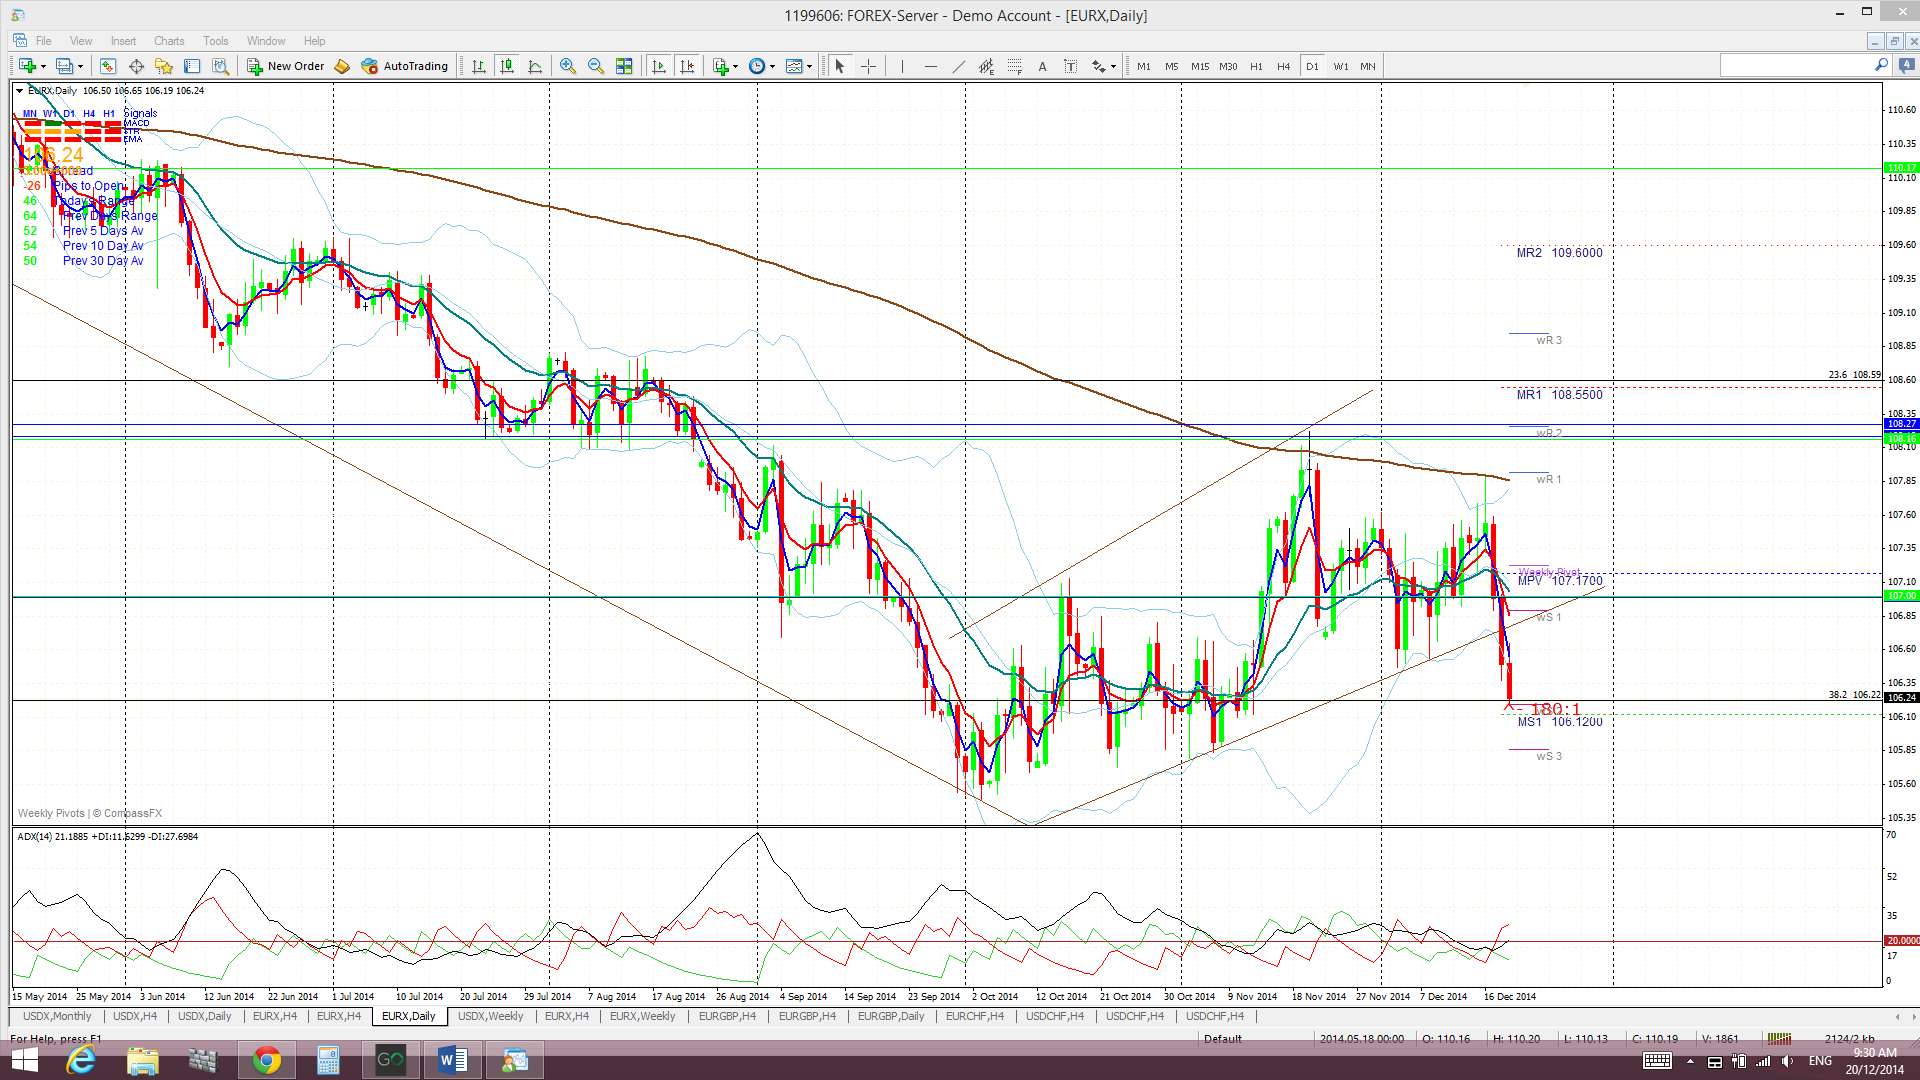
Daily Ichimoku Cloud chart: Price is now back trading below the daily Cloud.
4 hr: Price chopped sideways to up until Tuesday but then fell heavily from there.
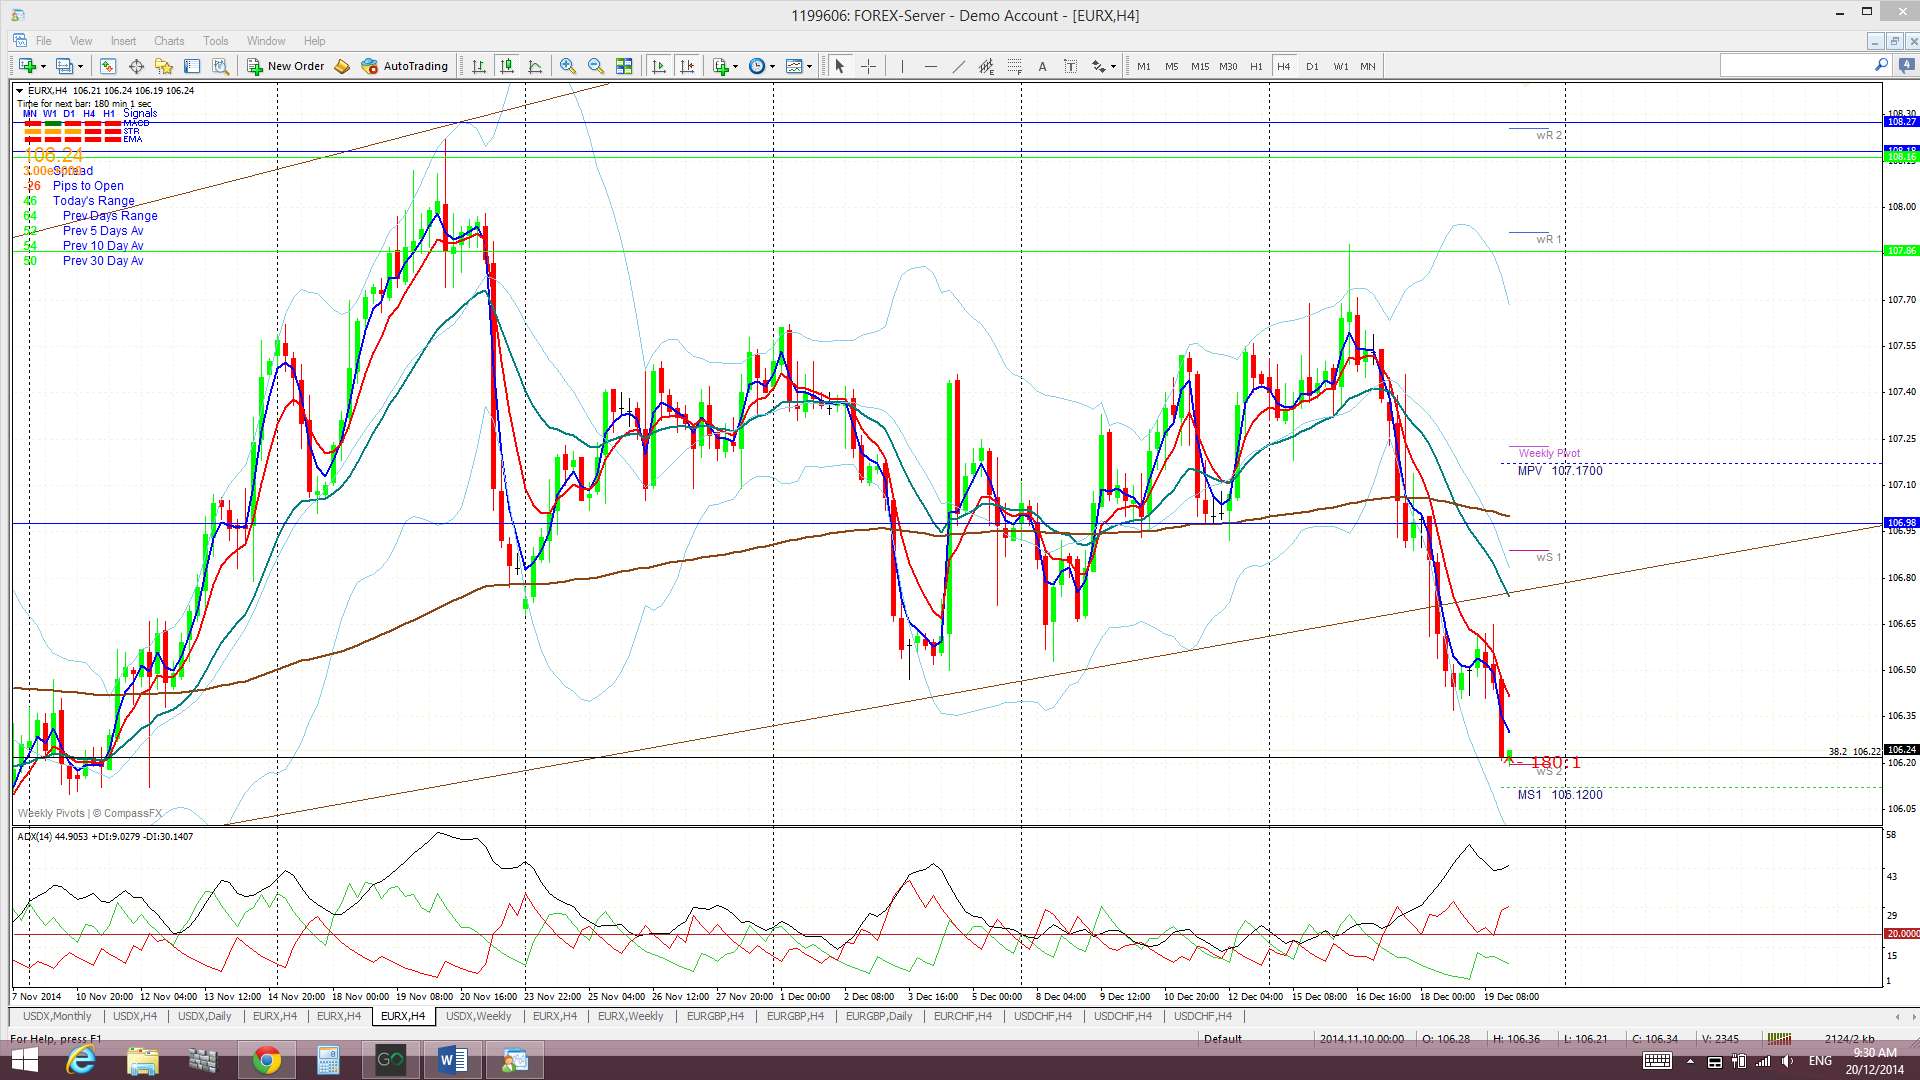
4 hr Ichimoku Cloud chart: The EURX started the week above thin Cloud but fell heavily to close below the Cloud. This chart is aligned with the daily chart but now suggests short EUR.
Comments:
USDX: the USDX closed higher for the week following FOMC and has broken above the ‘Double Top’ region of 89.50. A hold above this level would avoid the bearish ‘Double Top’ from developing but it does look like this index is headed towards a test of the key 90 level. It is a shorter trading week with Christmas next week but I do wonder whether any good print with next Tuesday’s US GDP might just get the index up to this 90 level?
The weekly candle answered last week’s bearish-reversal ‘Railway Track’ and bearish engulfing candle pattern with a new bullish engulfing candle! ‘ One can almost hear the index crying out ‘Take that’!
The main level to watch from here is the big kahuna 90 level. This is just above current price and is a long term S/R level. A break and hold above this level would be a significant bullish shift. The 7-week support trend line is well below current price now but any pull back would look to test the 89 and 88.50 levels and, then, this trend line.
EURX: the EURX had a bearish week and divergence between the EZ and US economies continues to be a dominant theme that is reinforced by economic data.
EURX Bear Flag? The weekly chart’s trend line break suggests the start of a Bear Flag. The length of the ‘Flagpole’ is about 500 pips or so. This would suggest a bearish continuation move below the trend line of about 500 pips as well. Such a move would bring the index down to near the 102 region. This is worth noting as this is also the location of the 61.8% fib of the recent 2012-2103 bull run and is the ‘Shoulder’ position on the monthly chart’s ‘Inverse H&S’. I am now looking for this index to head to test this 102 region.
Note: The analysis provided above is based purely on technical analysis of the current chart set ups. As always, Fundamental-style events, by way of any Ukraine, Ebola, Eurozone or Middle East events and/or news announcements, continue to be unpredictable triggers for price movement on the indices. These events always have the potential to undermine any technical analysis.
The post USDX headed to 90 & EURX ‘Bear Flag’ started? appeared first on www.forextell.com.