USDX
Monthly: The new November candle is printing a bullish candle and sitting above the ‘resistance-now- turned support’ of the monthly chart’s bear triangle tend line

Monthly Ichimoku: The new November candle is well above the monthly Cloud.

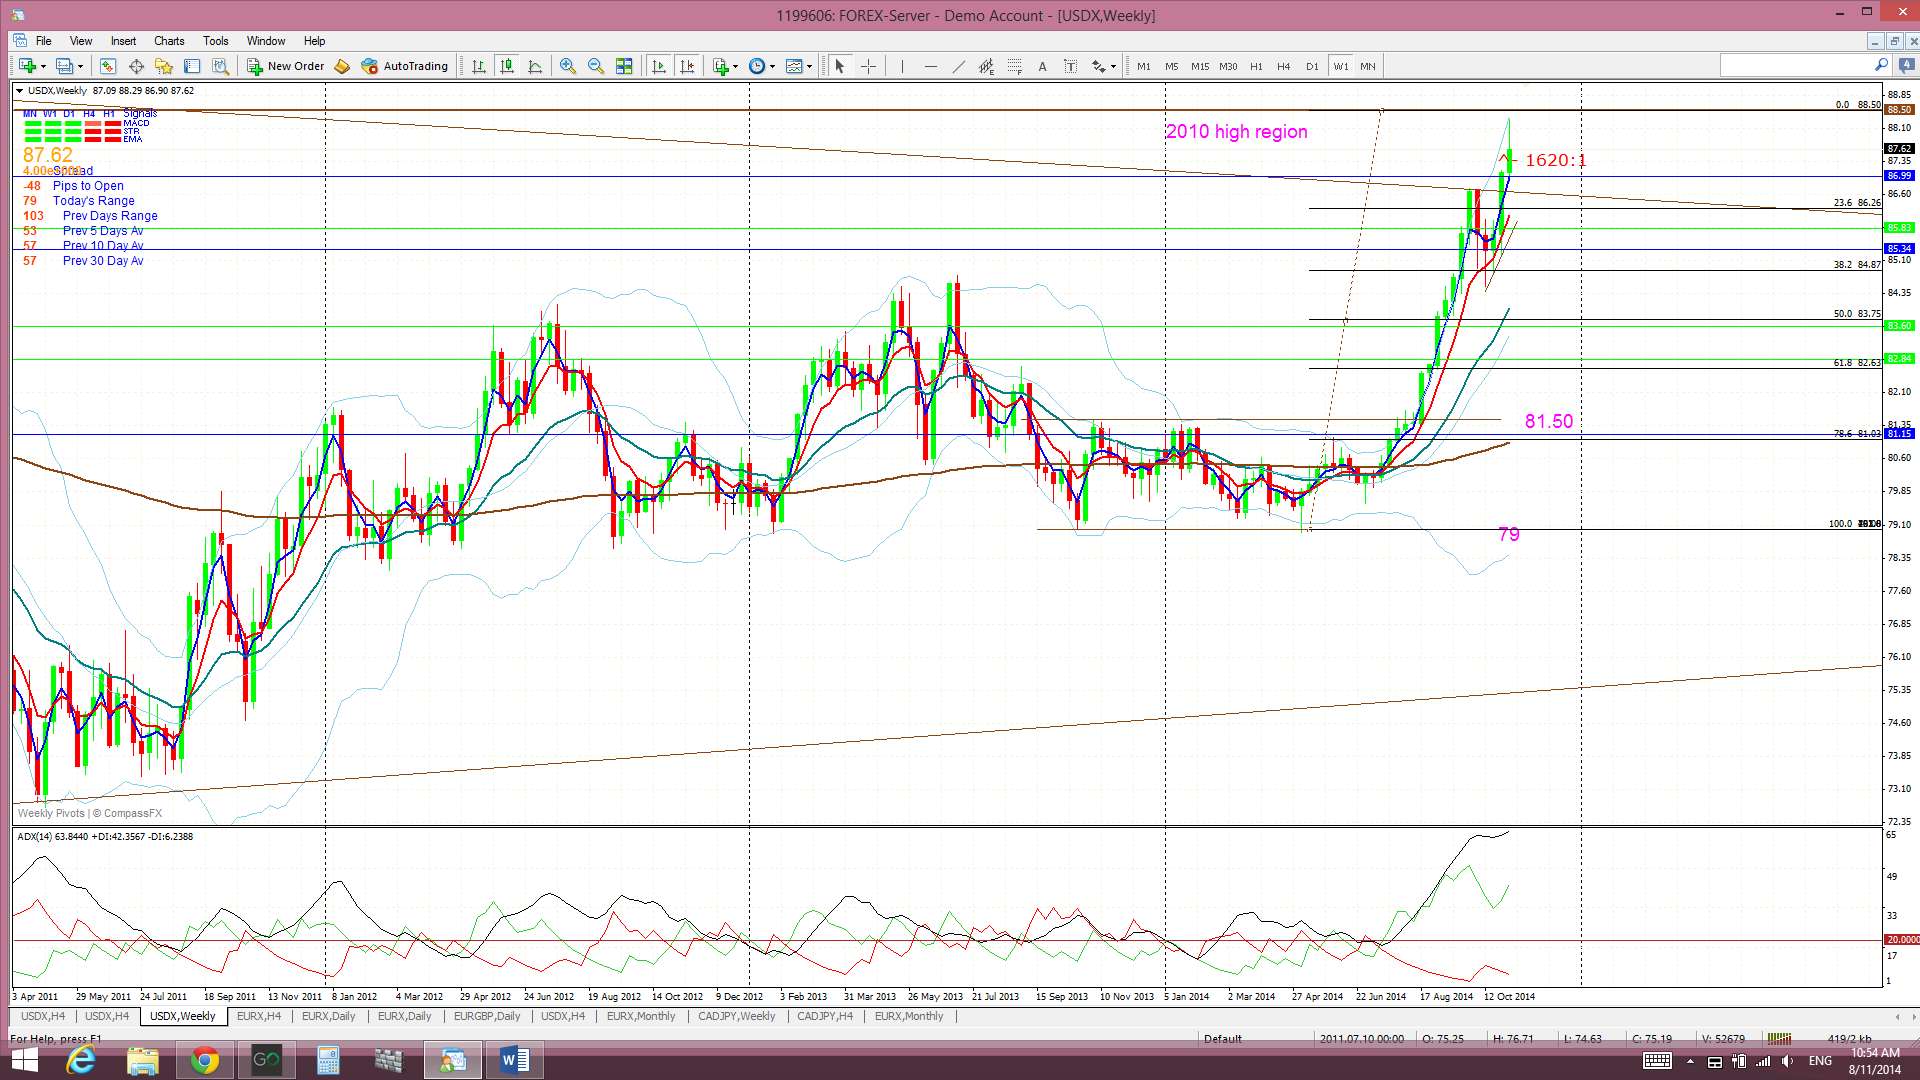
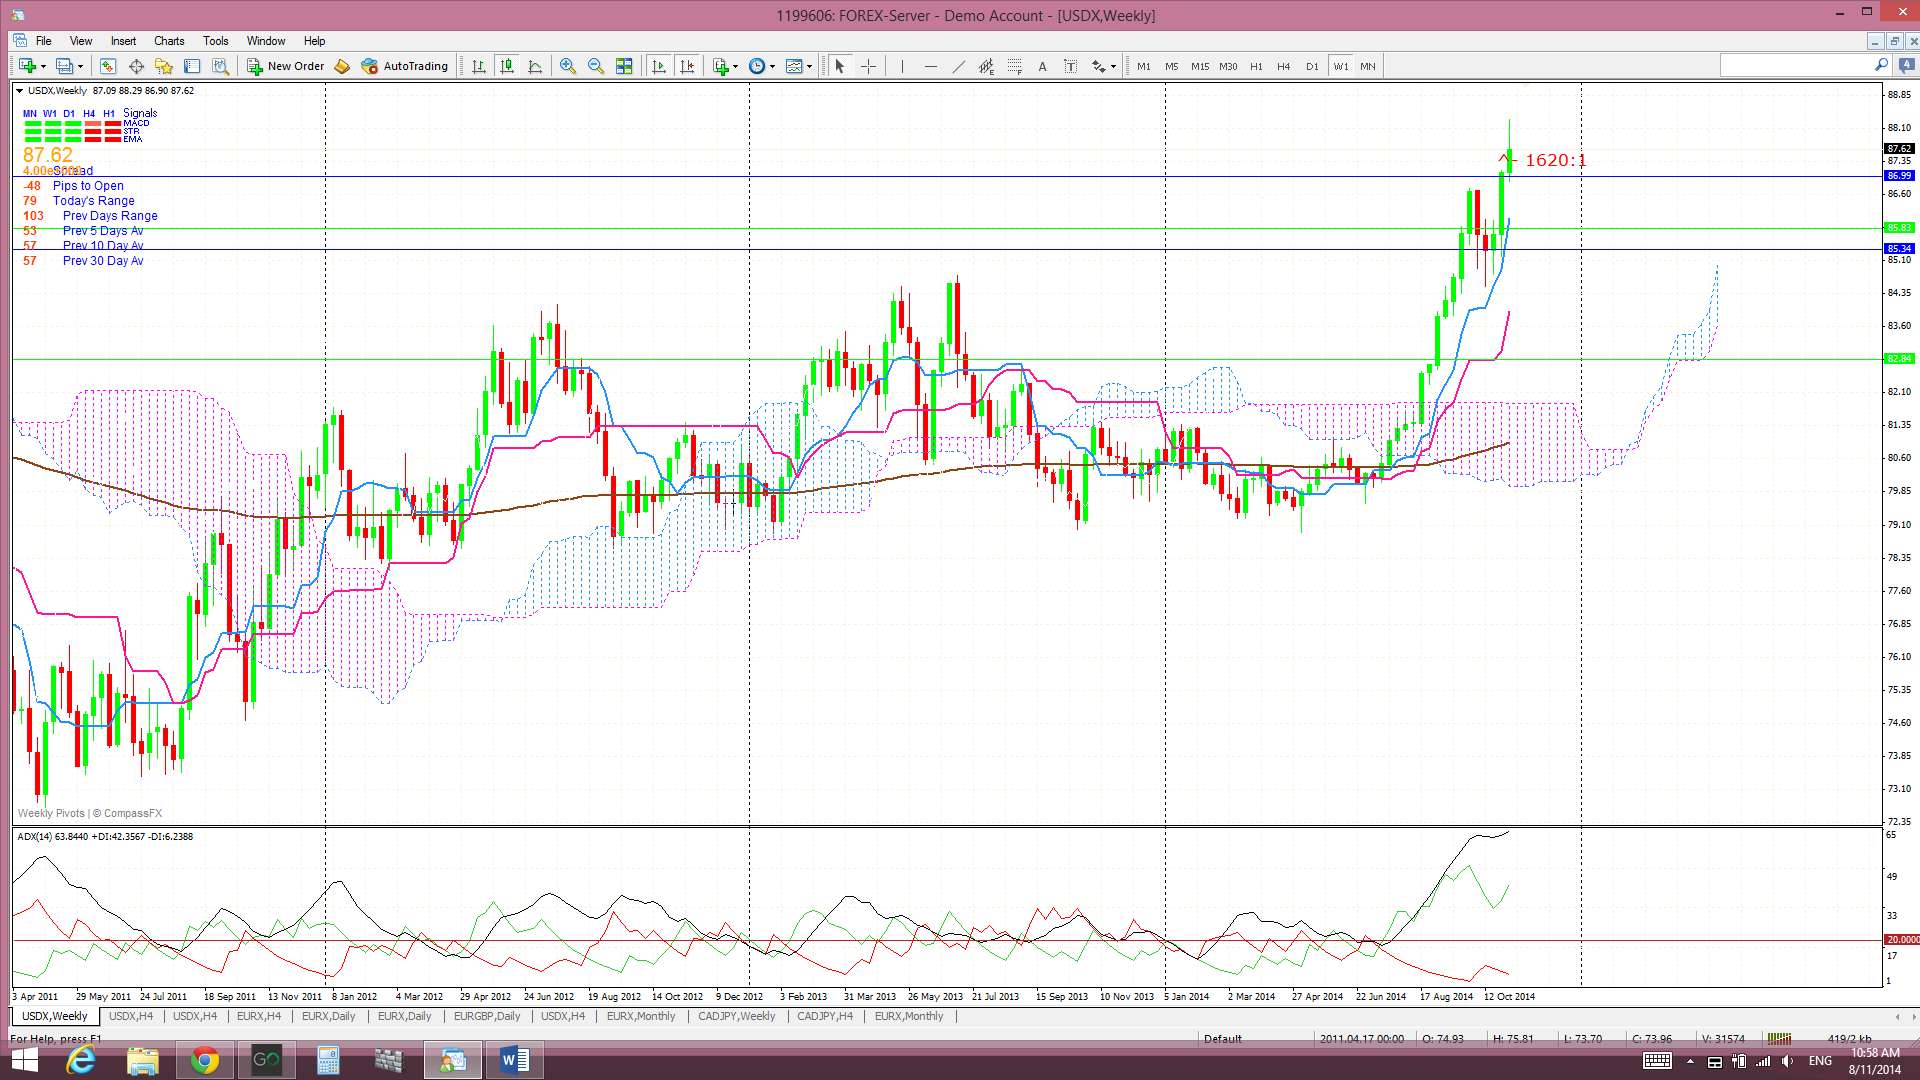
Weekly: Last week’s candle closed as a bullish candle but the index stalled up near the highs from 2010.
Weekly Ichimoku: Price is still trading ABOVE the weekly Cloud.
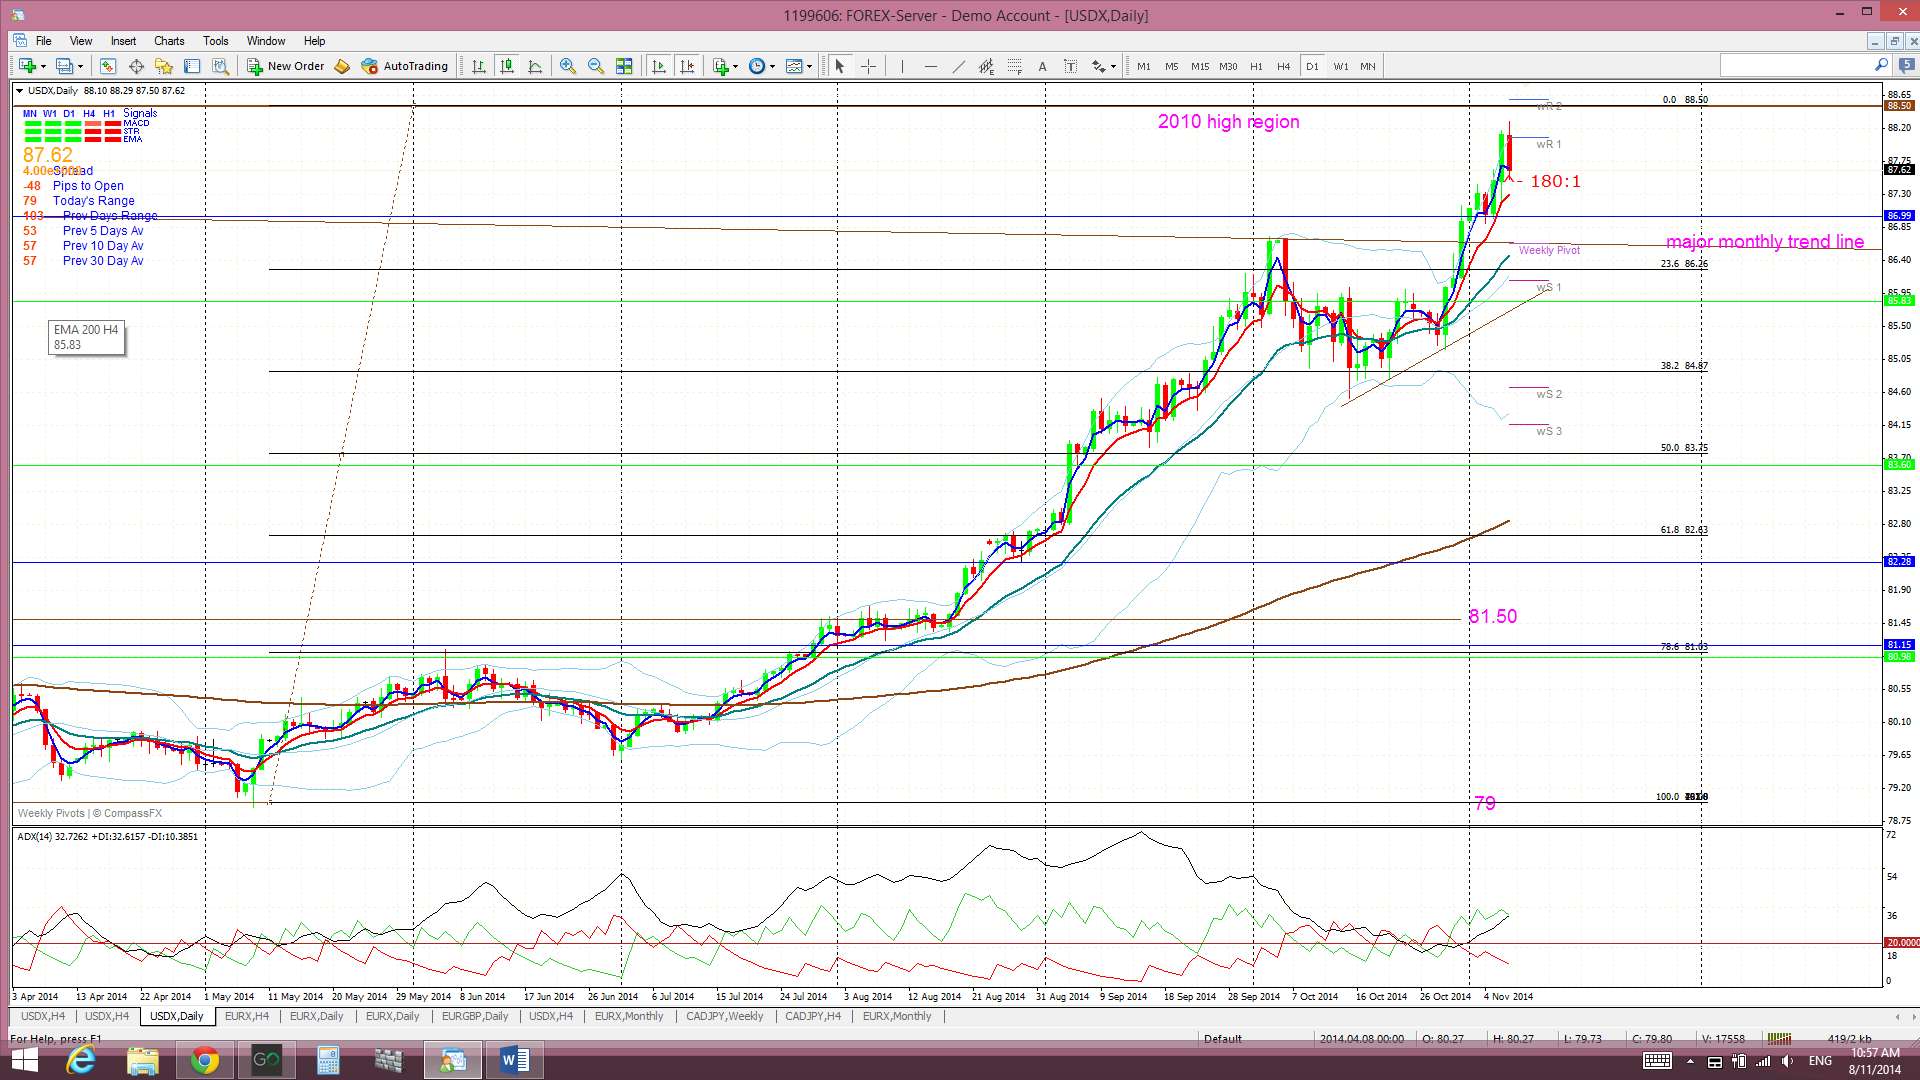
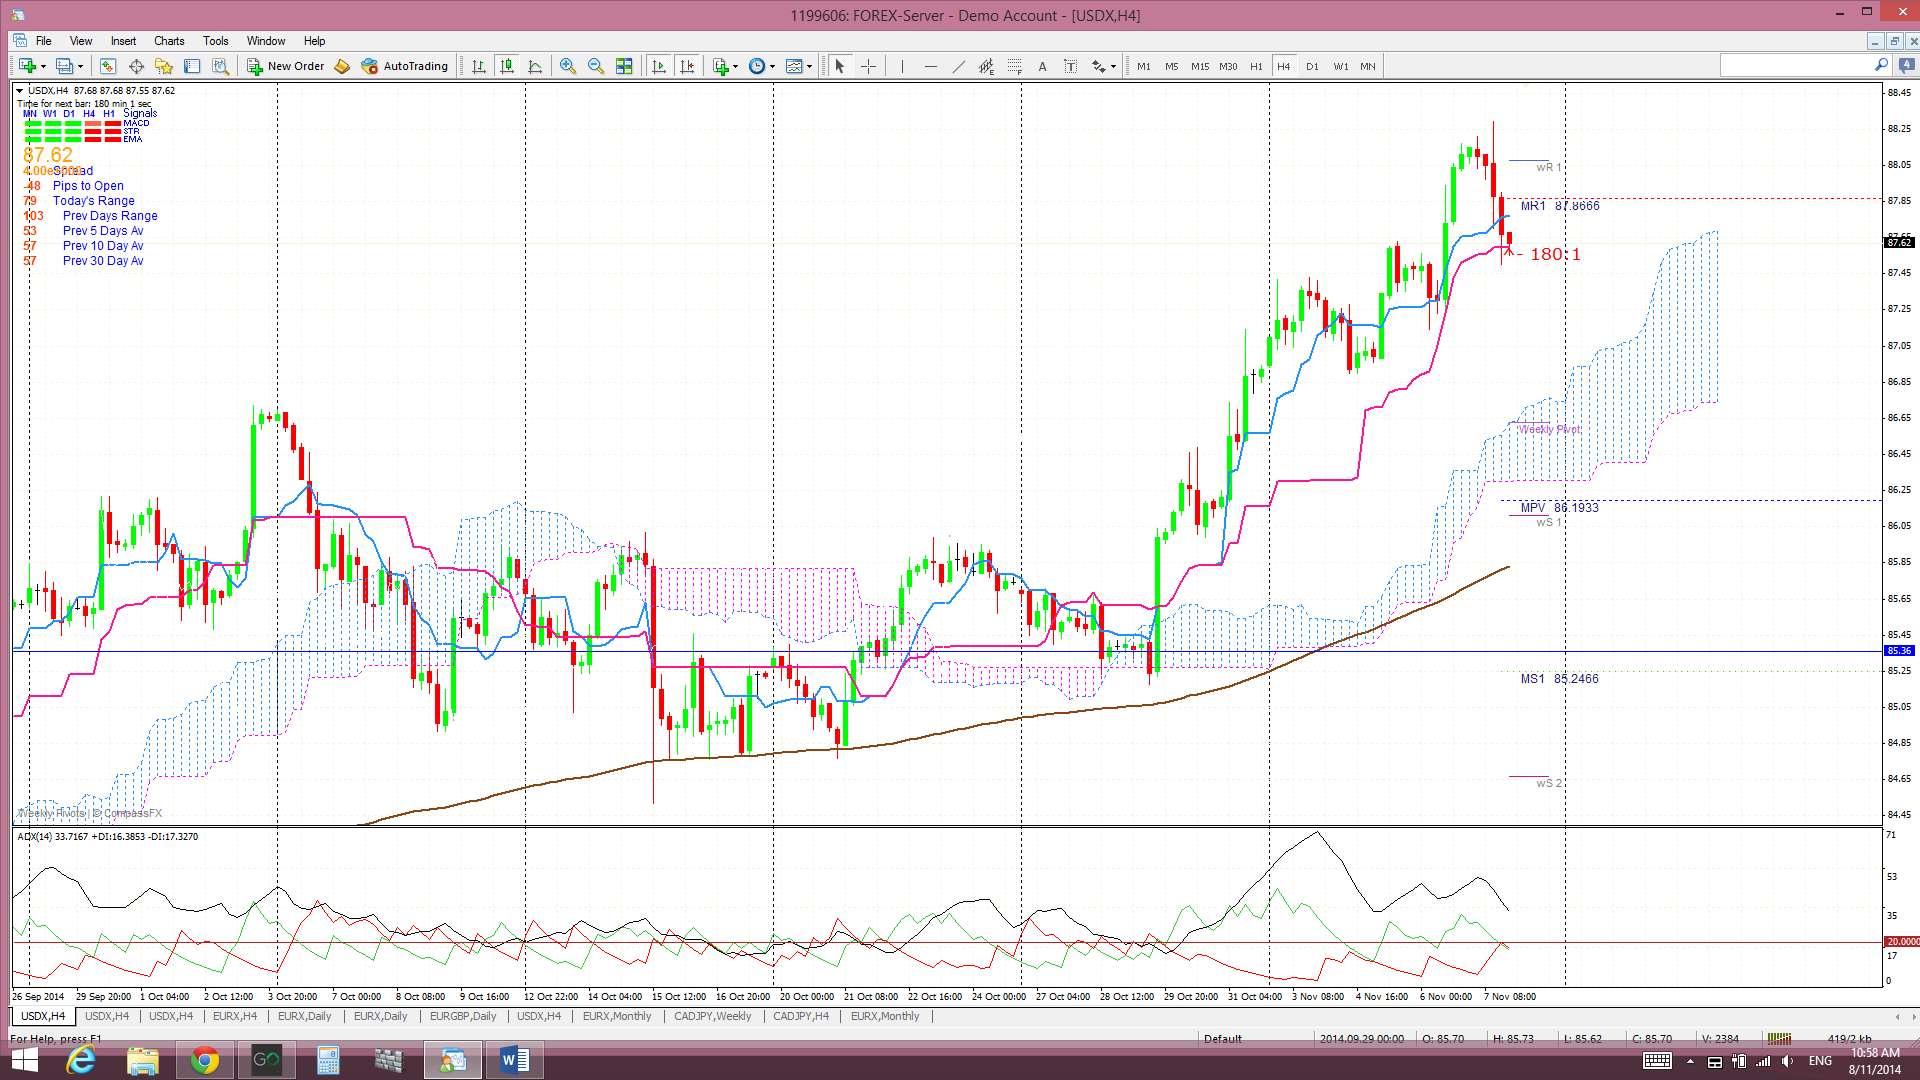
Daily: Price continued higher following last week’s major triangle breakout but price stalled up near 88.50 which was the region of the 2010 highs. Friday’s candle was bearish after hitting up near this resistance level and also following the mixed US jobs report. The index has been on a lengthy bullish run and some pull back, even if only temporary, would not be out of order. One obvious pull back target would be the monthly chart’s triangle trend line which is near the weekly pivot and 86 region. Fib levels placed on the last major swing move might help identify any deeper pull back targets. The 61.8% fib coincides with the daily 200 EMA near 83 and would be another obvious level to watch.
Daily Ichimoku Cloud chart: Price traded above the Cloud all week. Price is still above the daily Cloud and there is still an open bullish Tenkan/Kijun cross in play.

4hr: Price chopped higher last week.
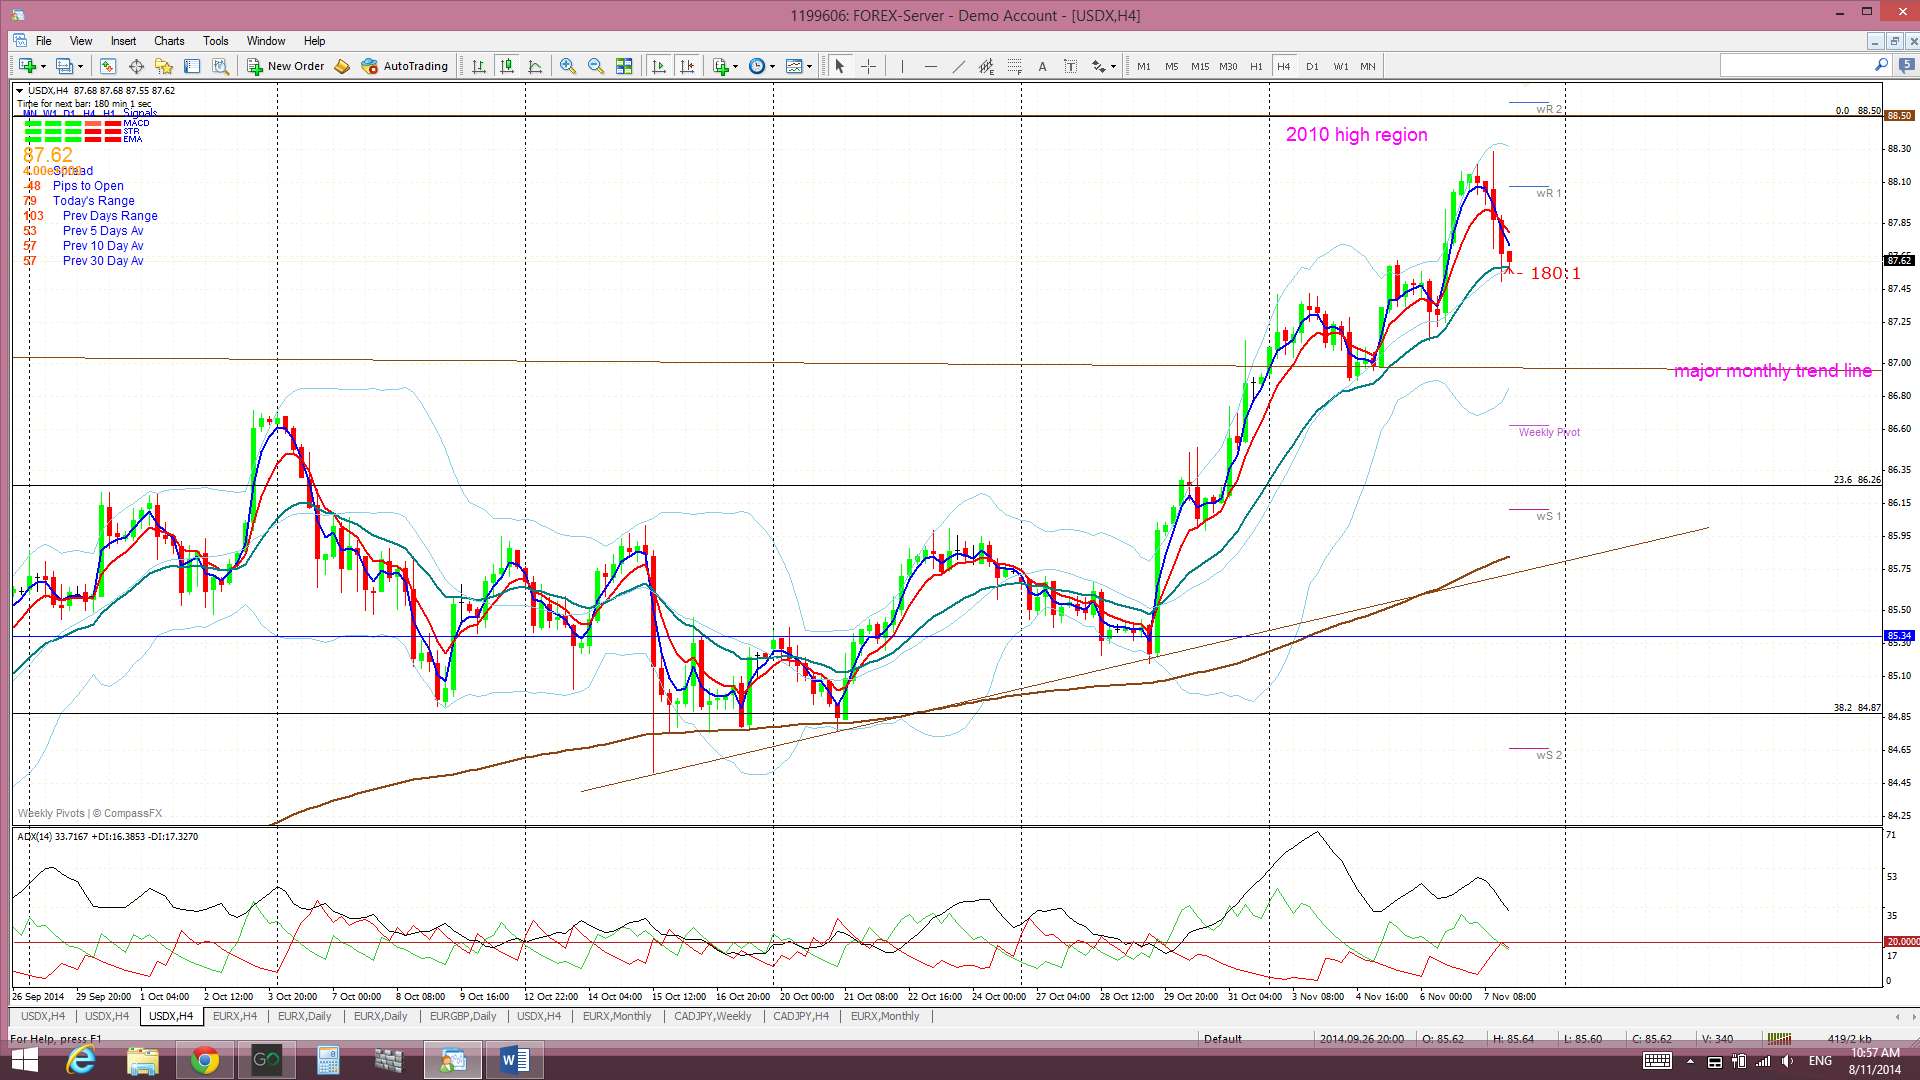
4hr Ichimoku Cloud chart: Price traded above the Cloud last week. This chart is aligned with the daily chart and suggests long USD.
EURX
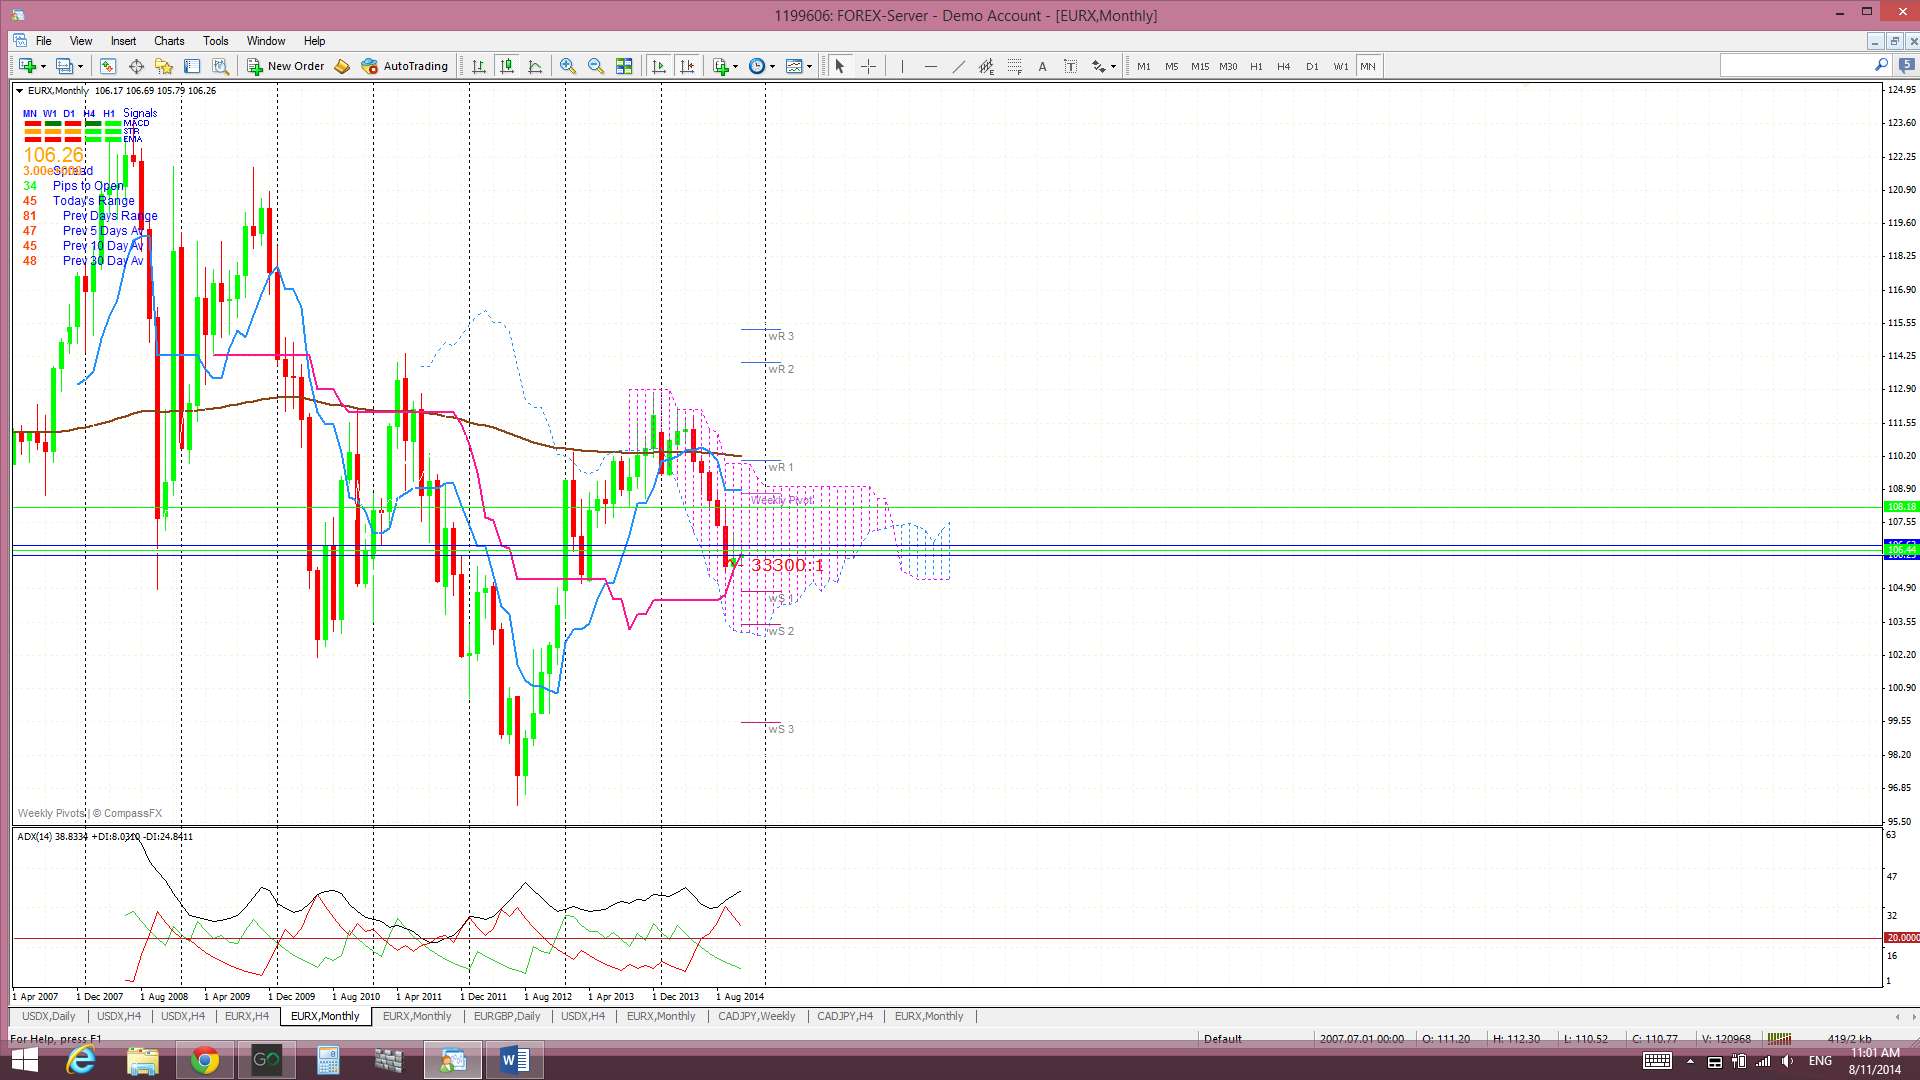
Monthly: The new November candle is printing a bullish coloured ‘Spinning Top’ candle reflecting some indecision here. This follows on from the bullish-reversal ‘Inverted Hammer’ candle for October though. I am still seeing a larger scale bullish ‘inverse H&S’ pattern developing as well.
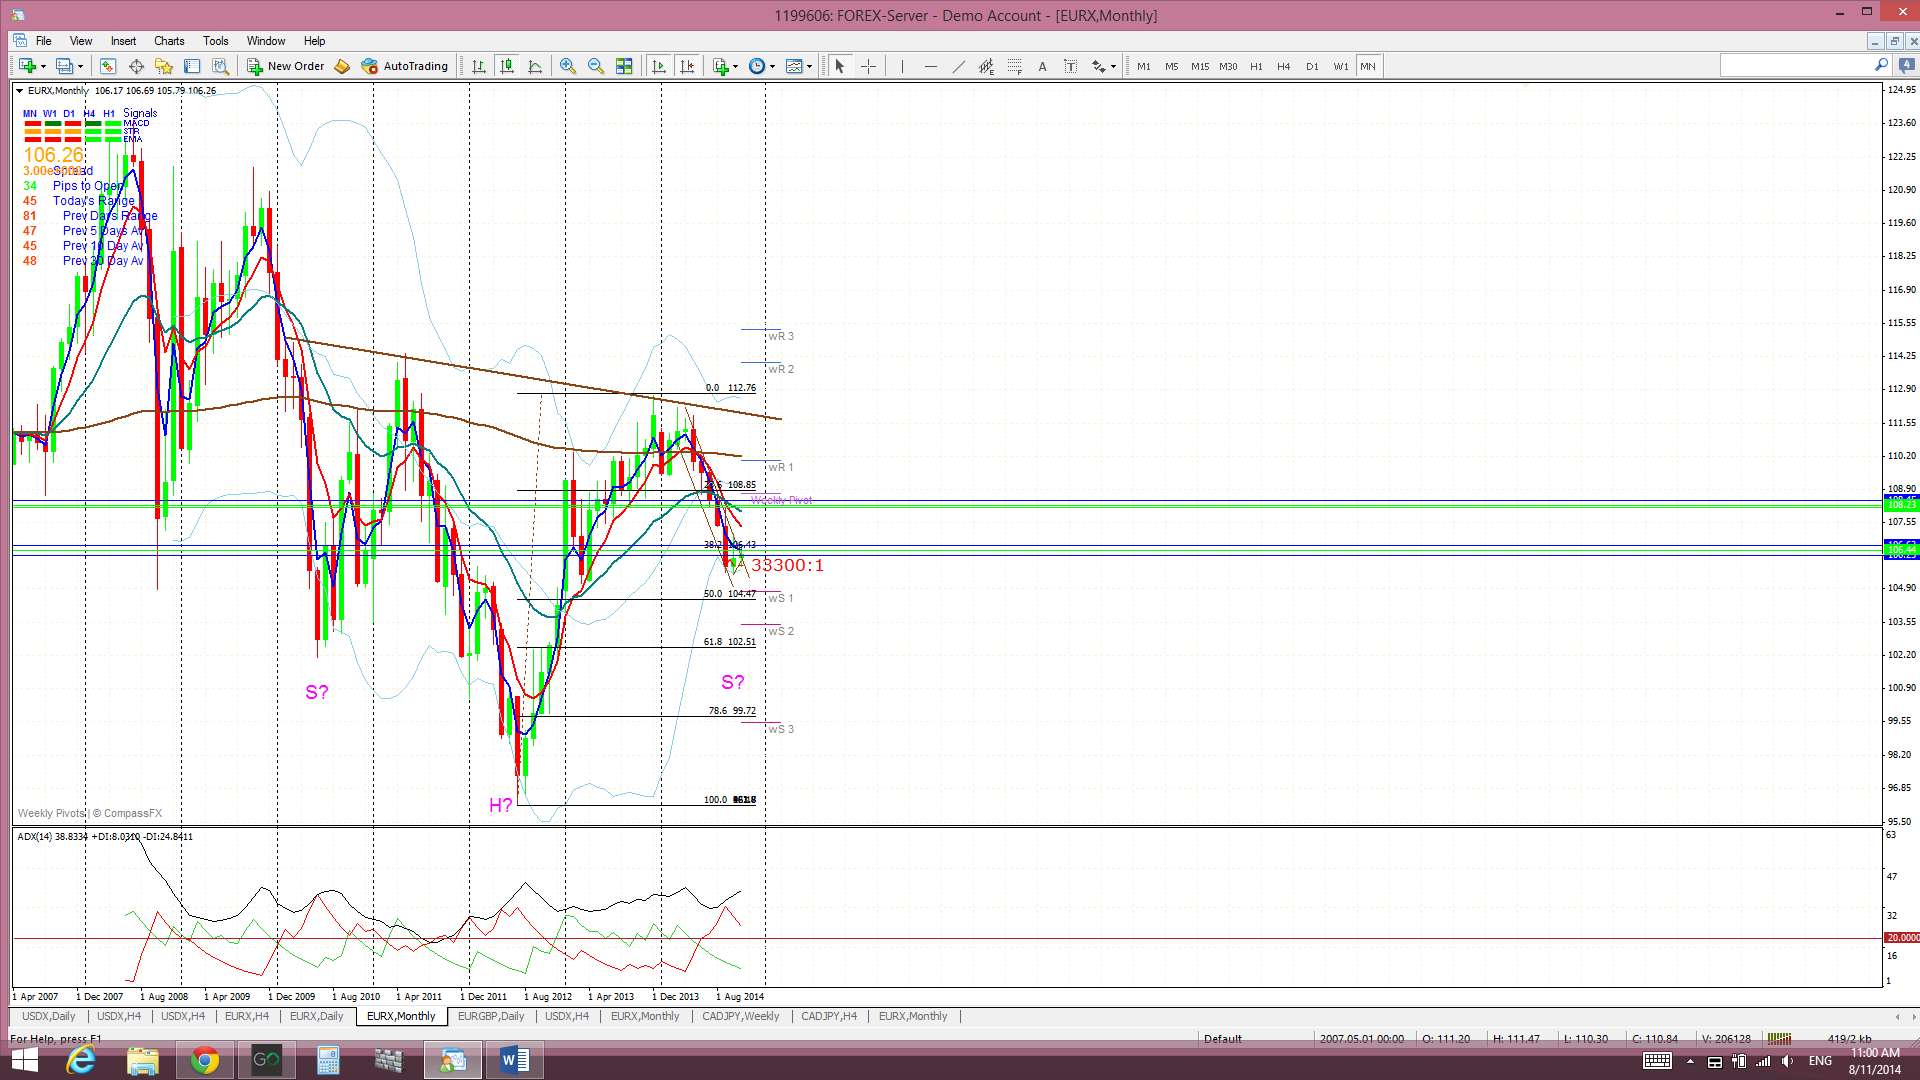
Monthly Ichimoku: The November candle is trading within the monthly Cloud.
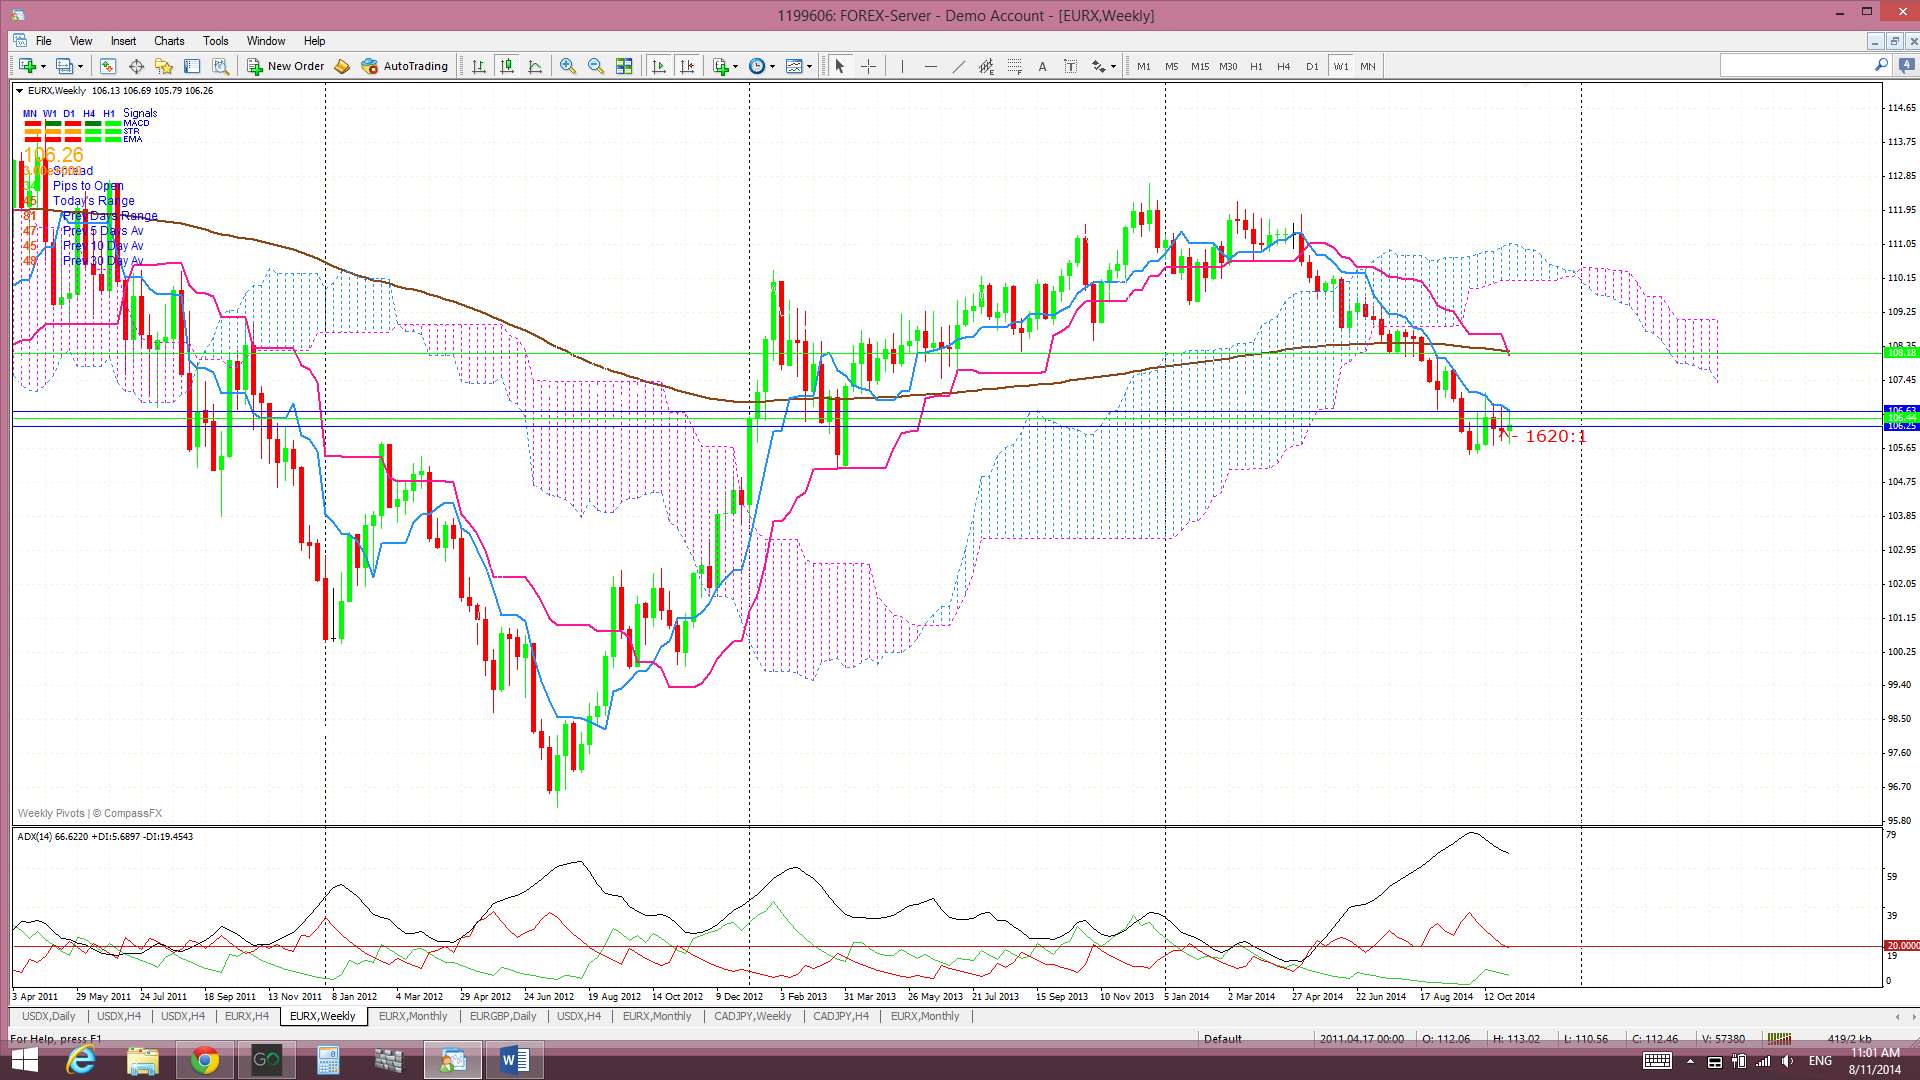
Weekly: The weekly candle also closed as a bullish coloured ‘Spinning Top’.

Weekly Ichimoku: Price is still trading below the weekly Cloud.
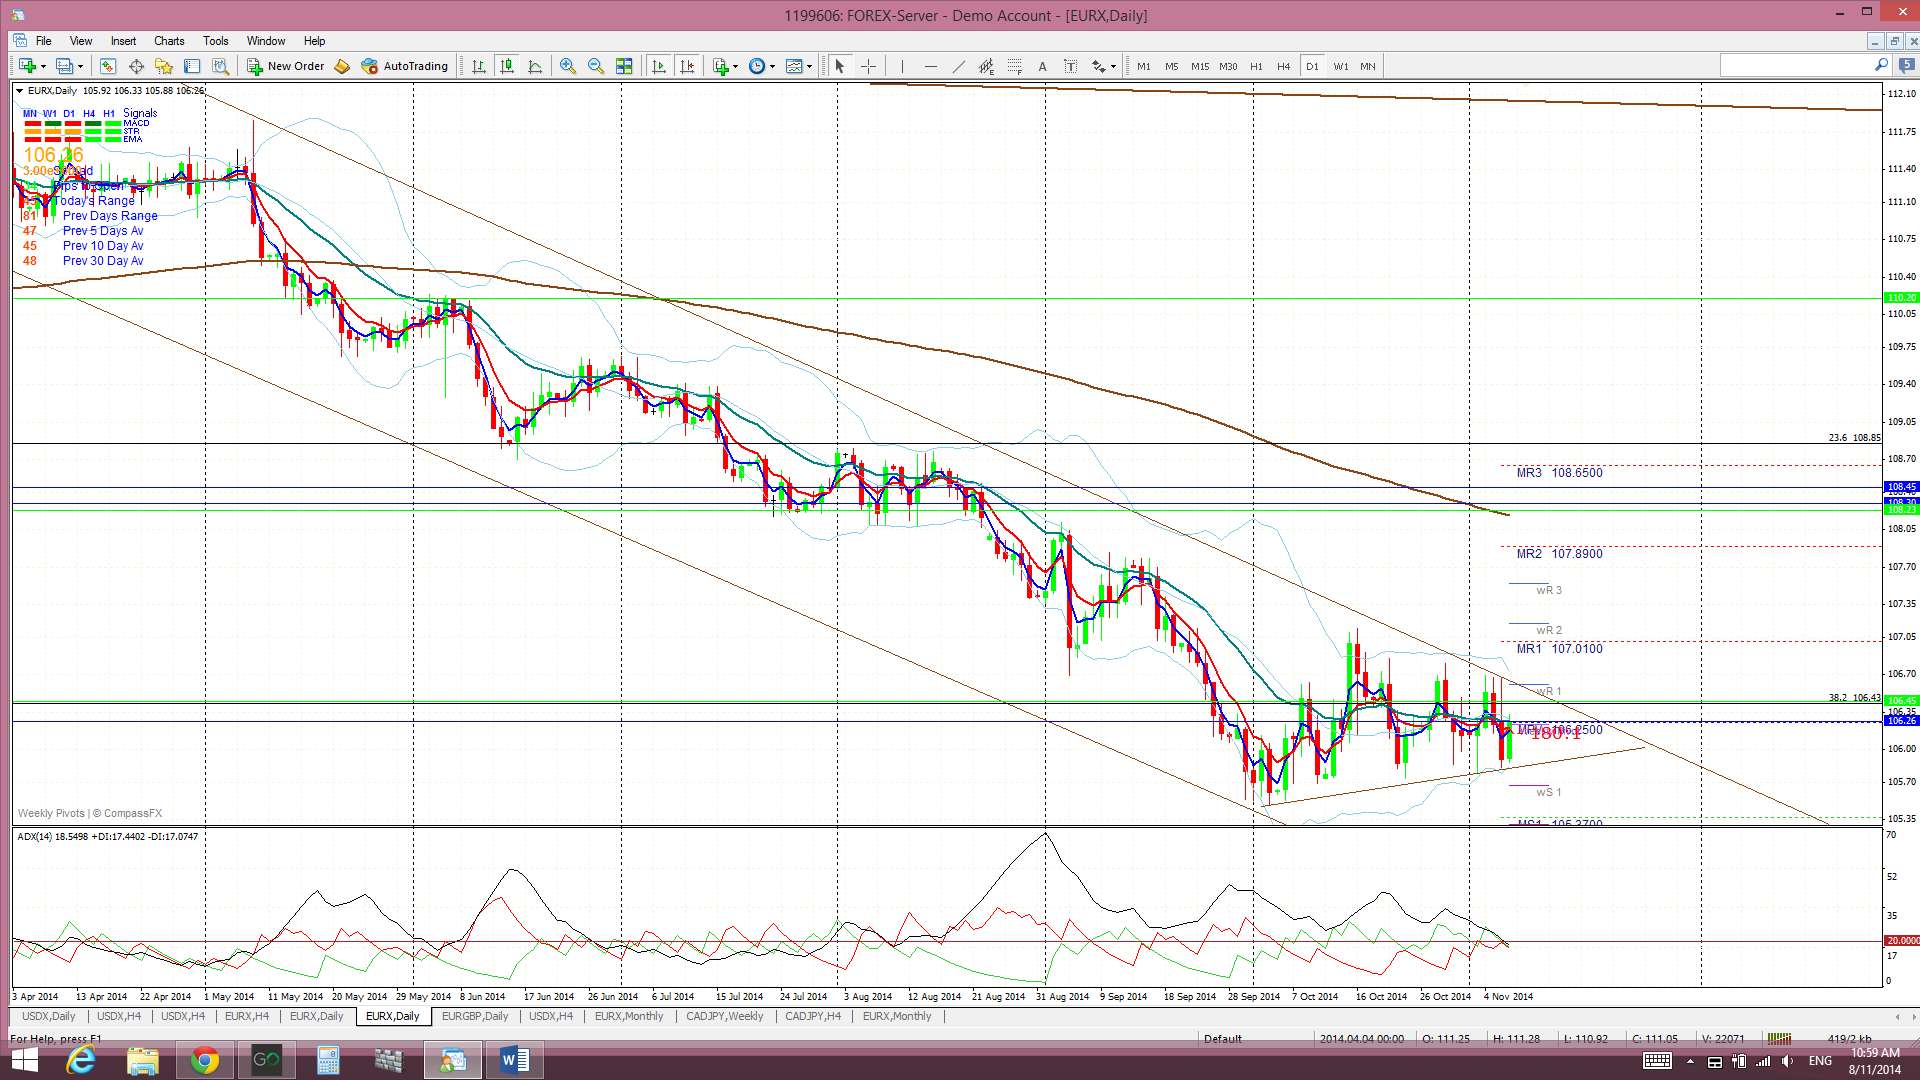
Daily: Price chopped up and down last week but is still within the descending trading channel. Note how the index is holding above a recent support trend line within this channel. Price action is being increasing squeezed as it edges towards the apex of the resultant triangle. Traders should watch for any triangle breakout here; bullish or bearish!
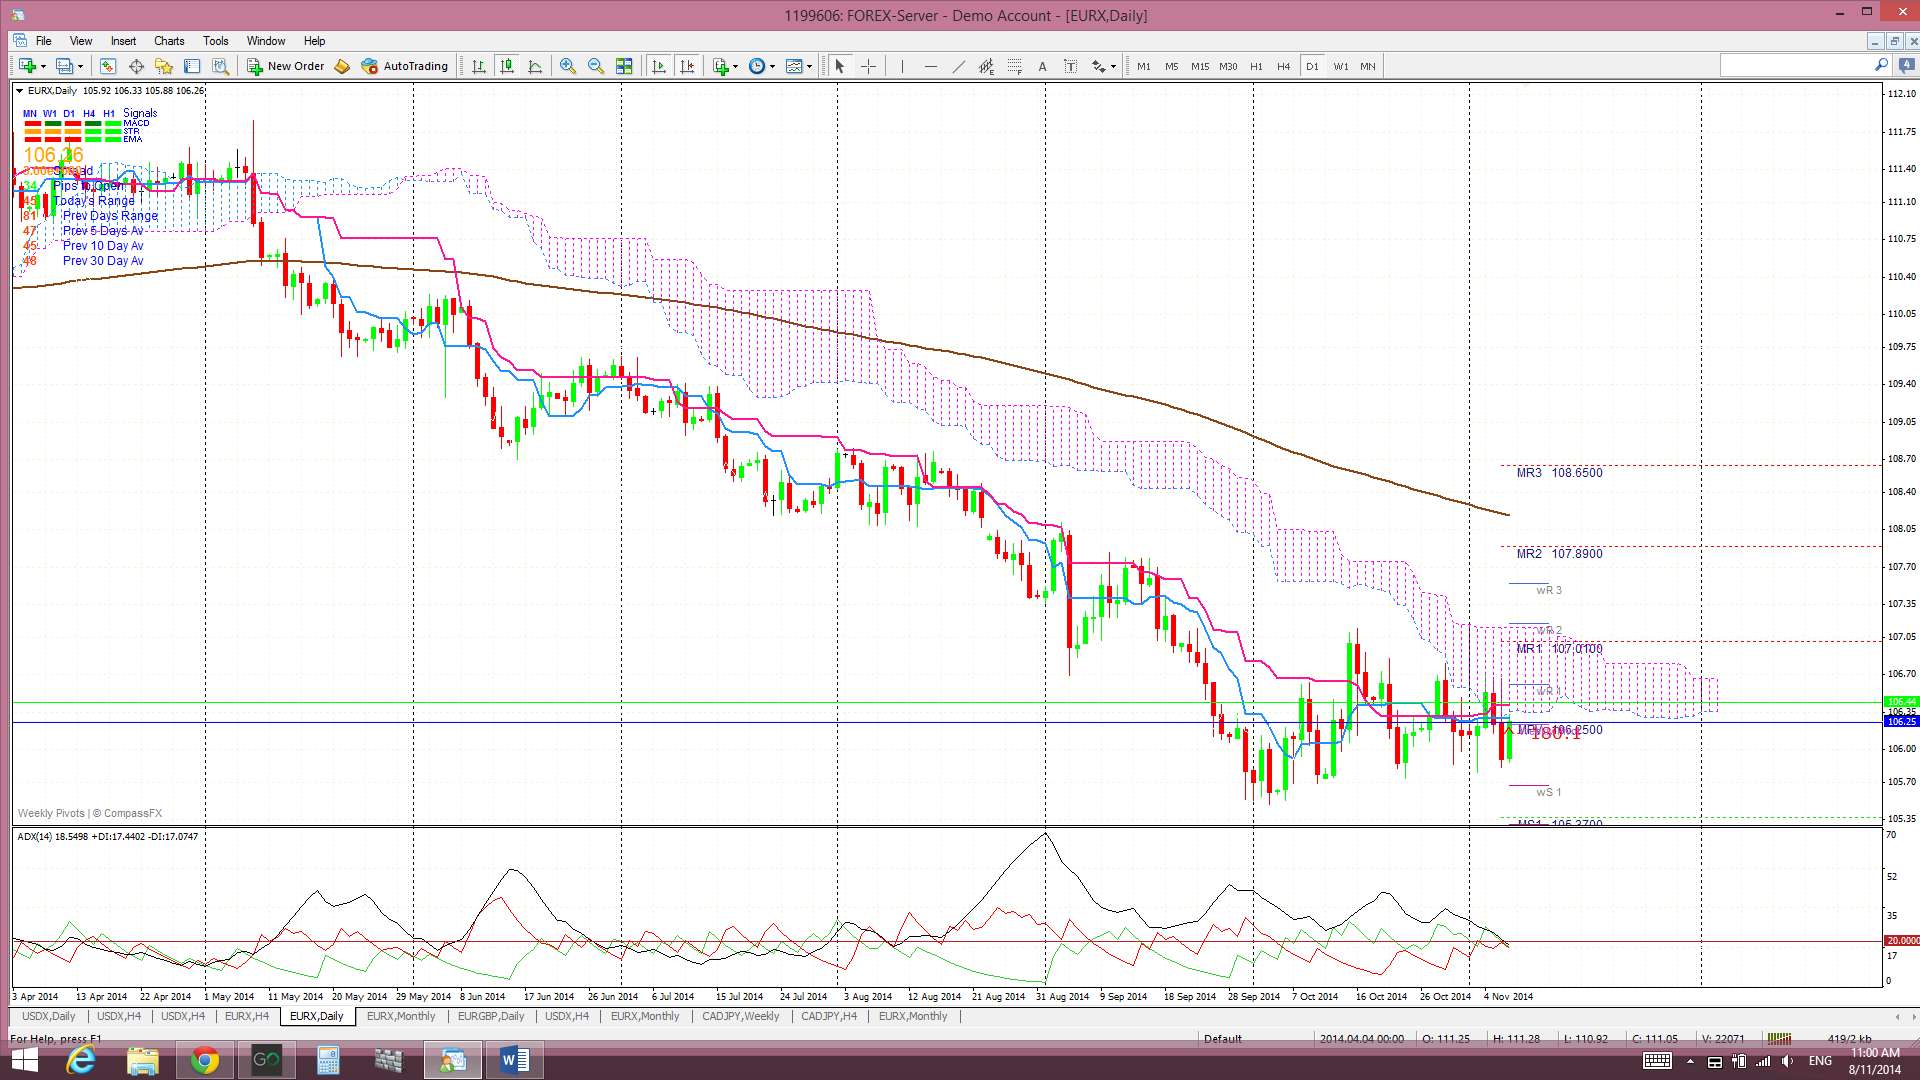
Daily Ichimoku Cloud chart: Price is still below the Cloud but only just.
4 hr: Price chopped up and down last week.
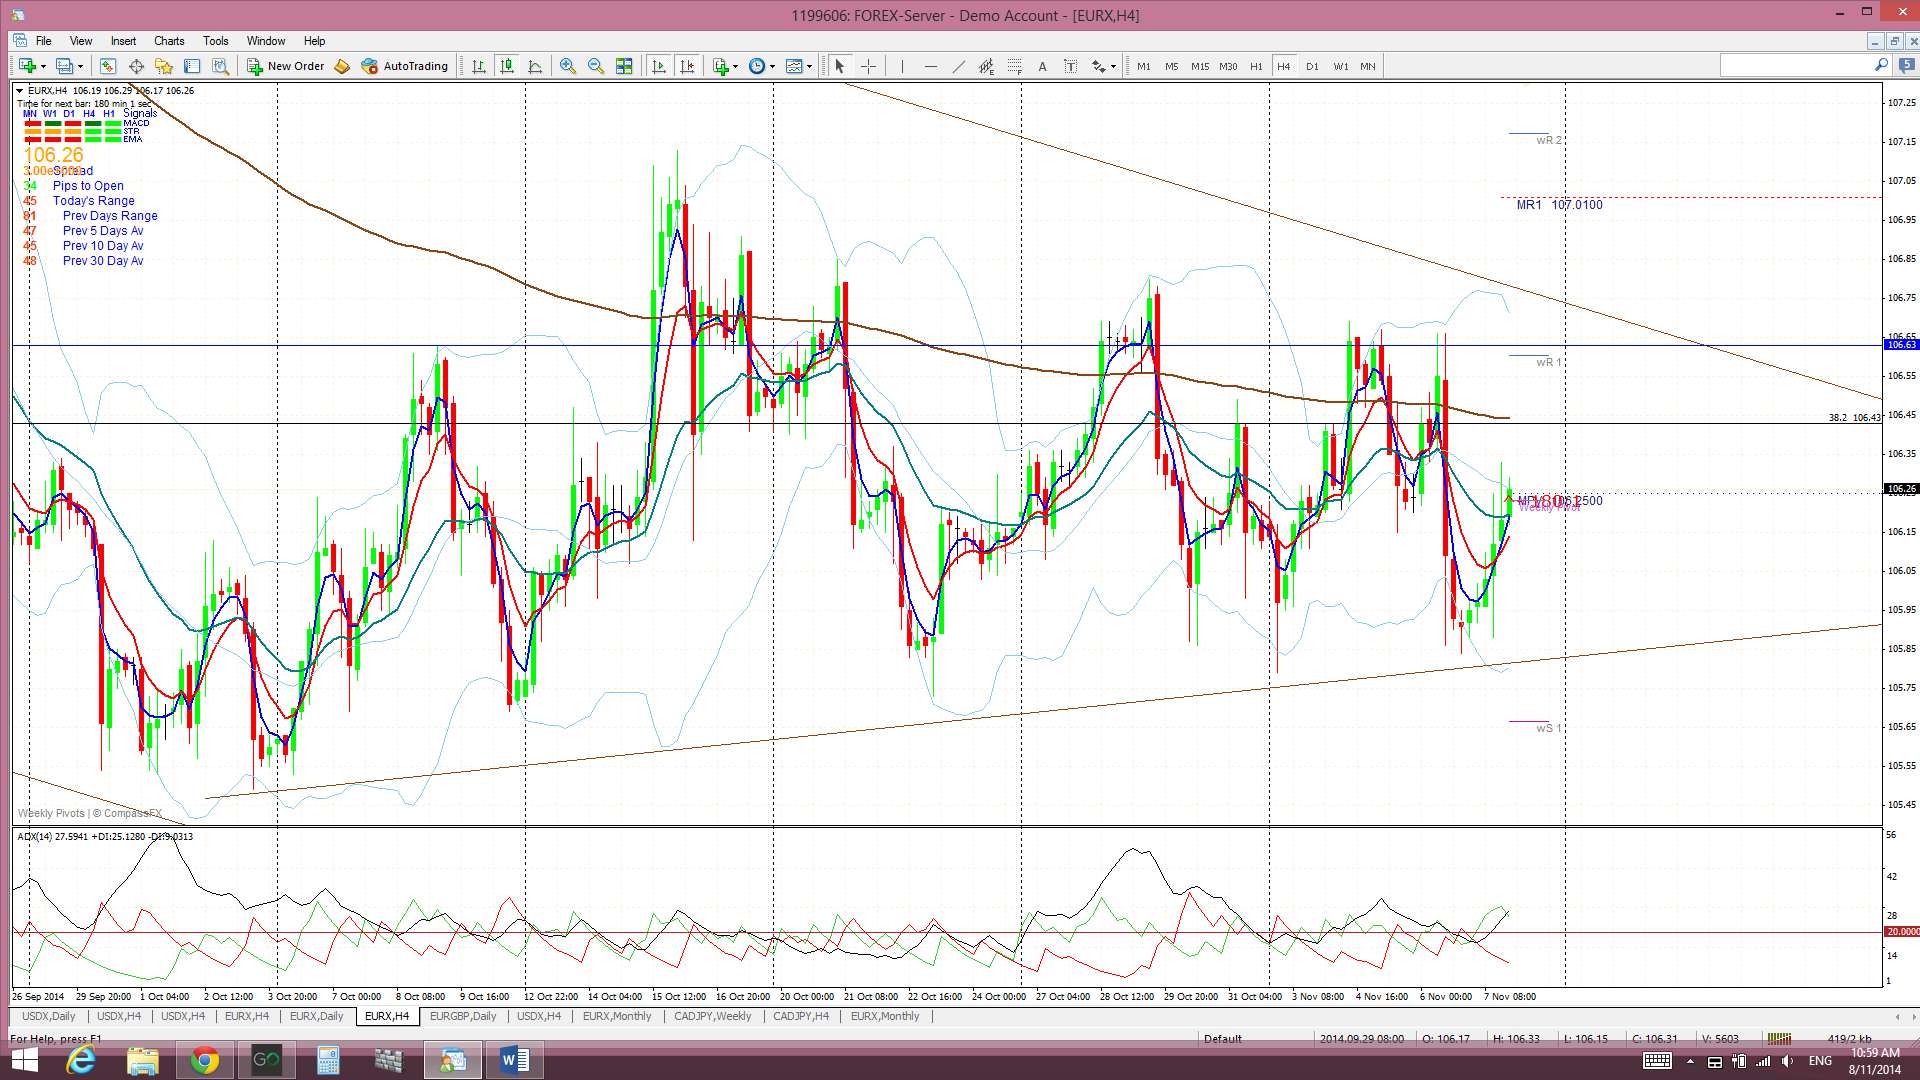
4 hr Ichimoku Cloud chart: As for last week, the EURX chopped up through the Cloud during the week then fell below and ended up closing within the Cloud. This chart is divergent from the daily chart and suggests choppiness.

Comments:
USDX: the USDX had another bullish week. The new monthly candle is holding above the major triangle bear trend line following last week’s bullish triangle breakout but is now struggling at the previous 2010 highs near 88.50. The 89.50 region from April 2009 is the next resistance zone after that.
The index pulled back on Friday following the mixed US jobs report and I’ll be watching out for any further weakness. Obvious pull back targets include the previously broken monthly trend line and then the region near the daily 200 EMA and 61.8% fib of the recent bull run.
EURX: the EURX closed marginally higher again for the week which remains impressive given the continued gains on the USDX and bearish Euro sentiment. The issue for the EUR remains that divergence between the Eurozone and US economies continues to widen and this discrepancy shows little sign of abating just yet.
I am still on the lookout for a possible continued pull back with the EURX down to the 103 region as this is a 61.8% fib pull back of the latest bull move (2012-2013). However, the index remains above a recent support trend line within the descending trading channel and this is resulting in price squeezing towards a triangle apex. I’ll be watching for any breakout here, short as well as long, as I still have my eye on possible bullish ‘inverse H&S’ building on the monthly chart.
Note: The analysis provided above is based purely on technical analysis of the current chart set ups. As always, Fundamental-style events, by way of any Ukraine, Ebola, Eurozone or Middle East events and/or news announcements, continue to be unpredictable triggers for price movement on the indices. These events always have the potential to undermine any technical analysis.
The post USDX: hits a bit of a wall. appeared first on www.forextell.com.