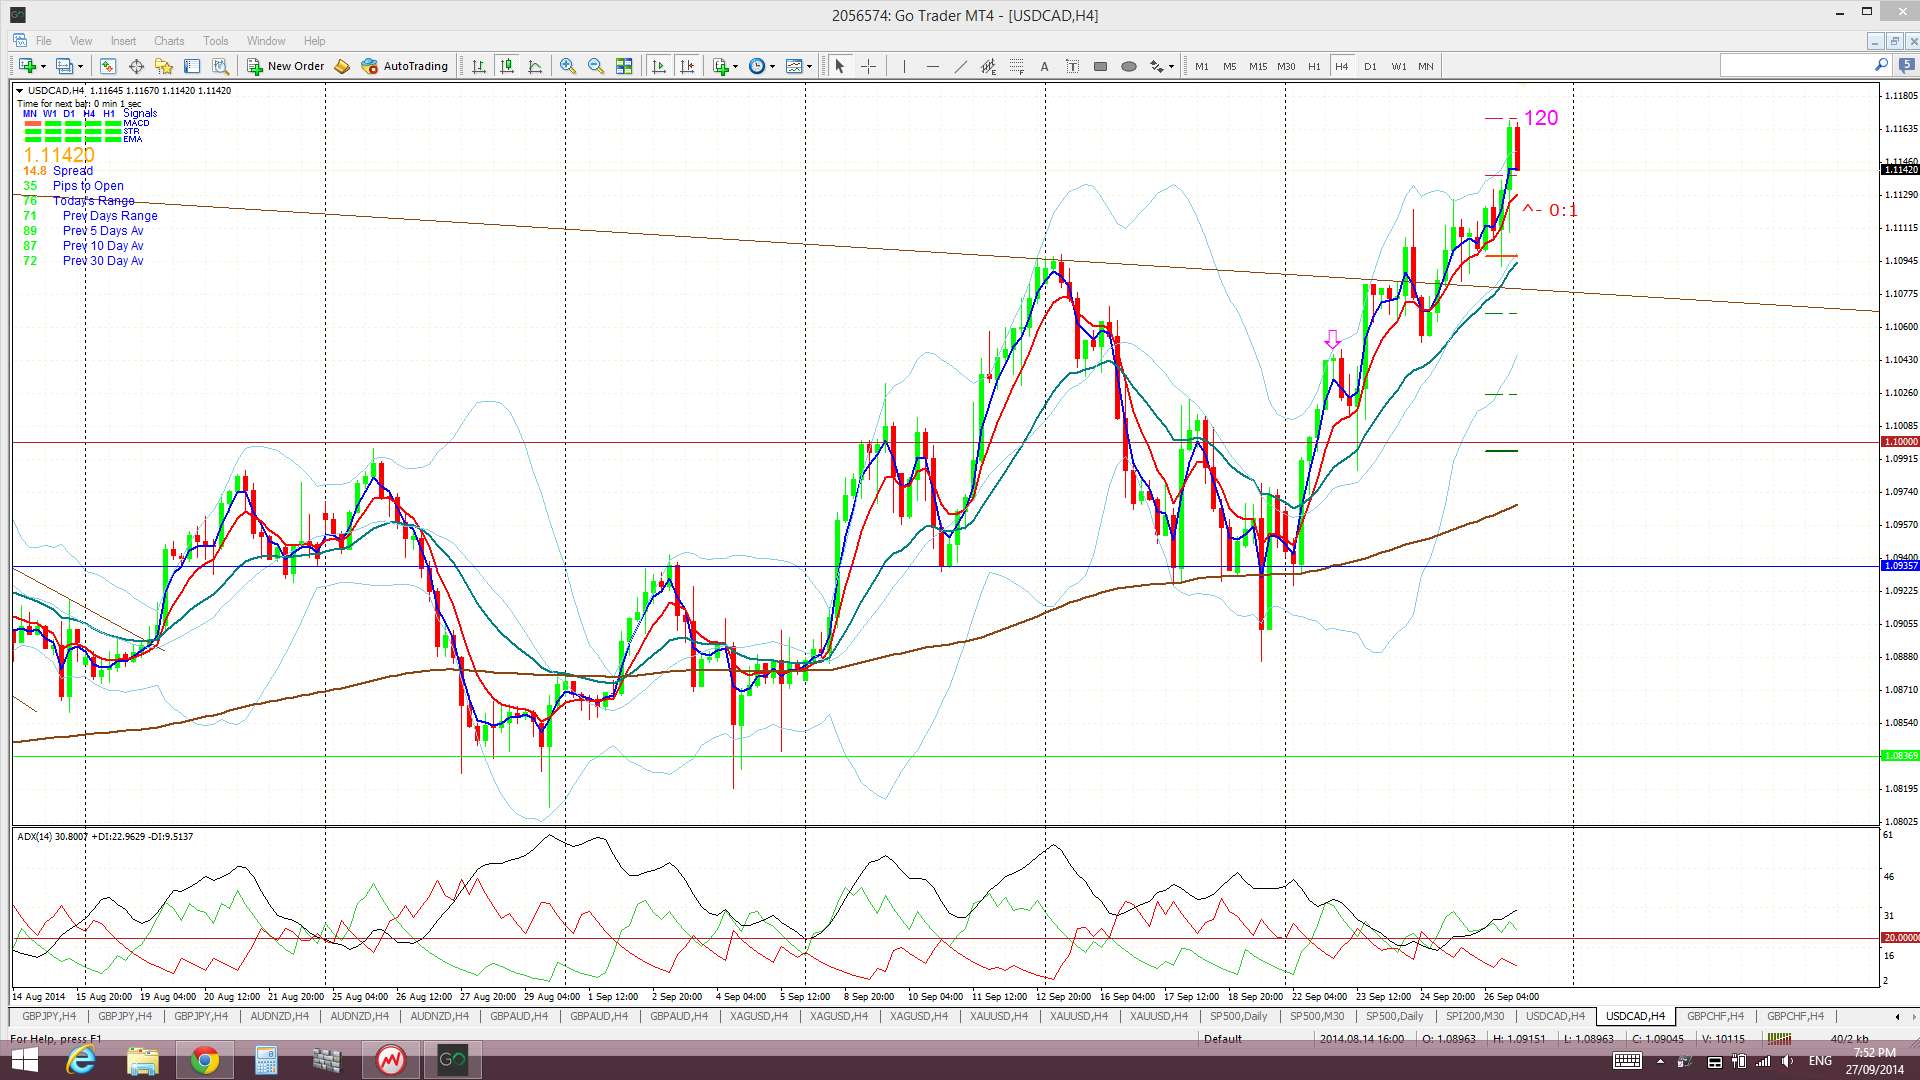
TC Signals: USD/CAD = 120 pips (open), CAD/JPY = 50 closed. EUR/AUD= – 60 (I closed this signal early for a loss but it actually continued to be a winning trade) and GBP/CHF = 100 (closed).
Next week:
- Monthly candles will close off next Tuesday. This marks the end of month and, also, the end of quarter so it may be a choppy period. Traders need to watch for new monthly pivots after Tuesday.
- Traders need to check their trading calendar for high impact data. I am away at the moment and have not detailed these events in this write up. I have also only reviewed a few of the major pairs.
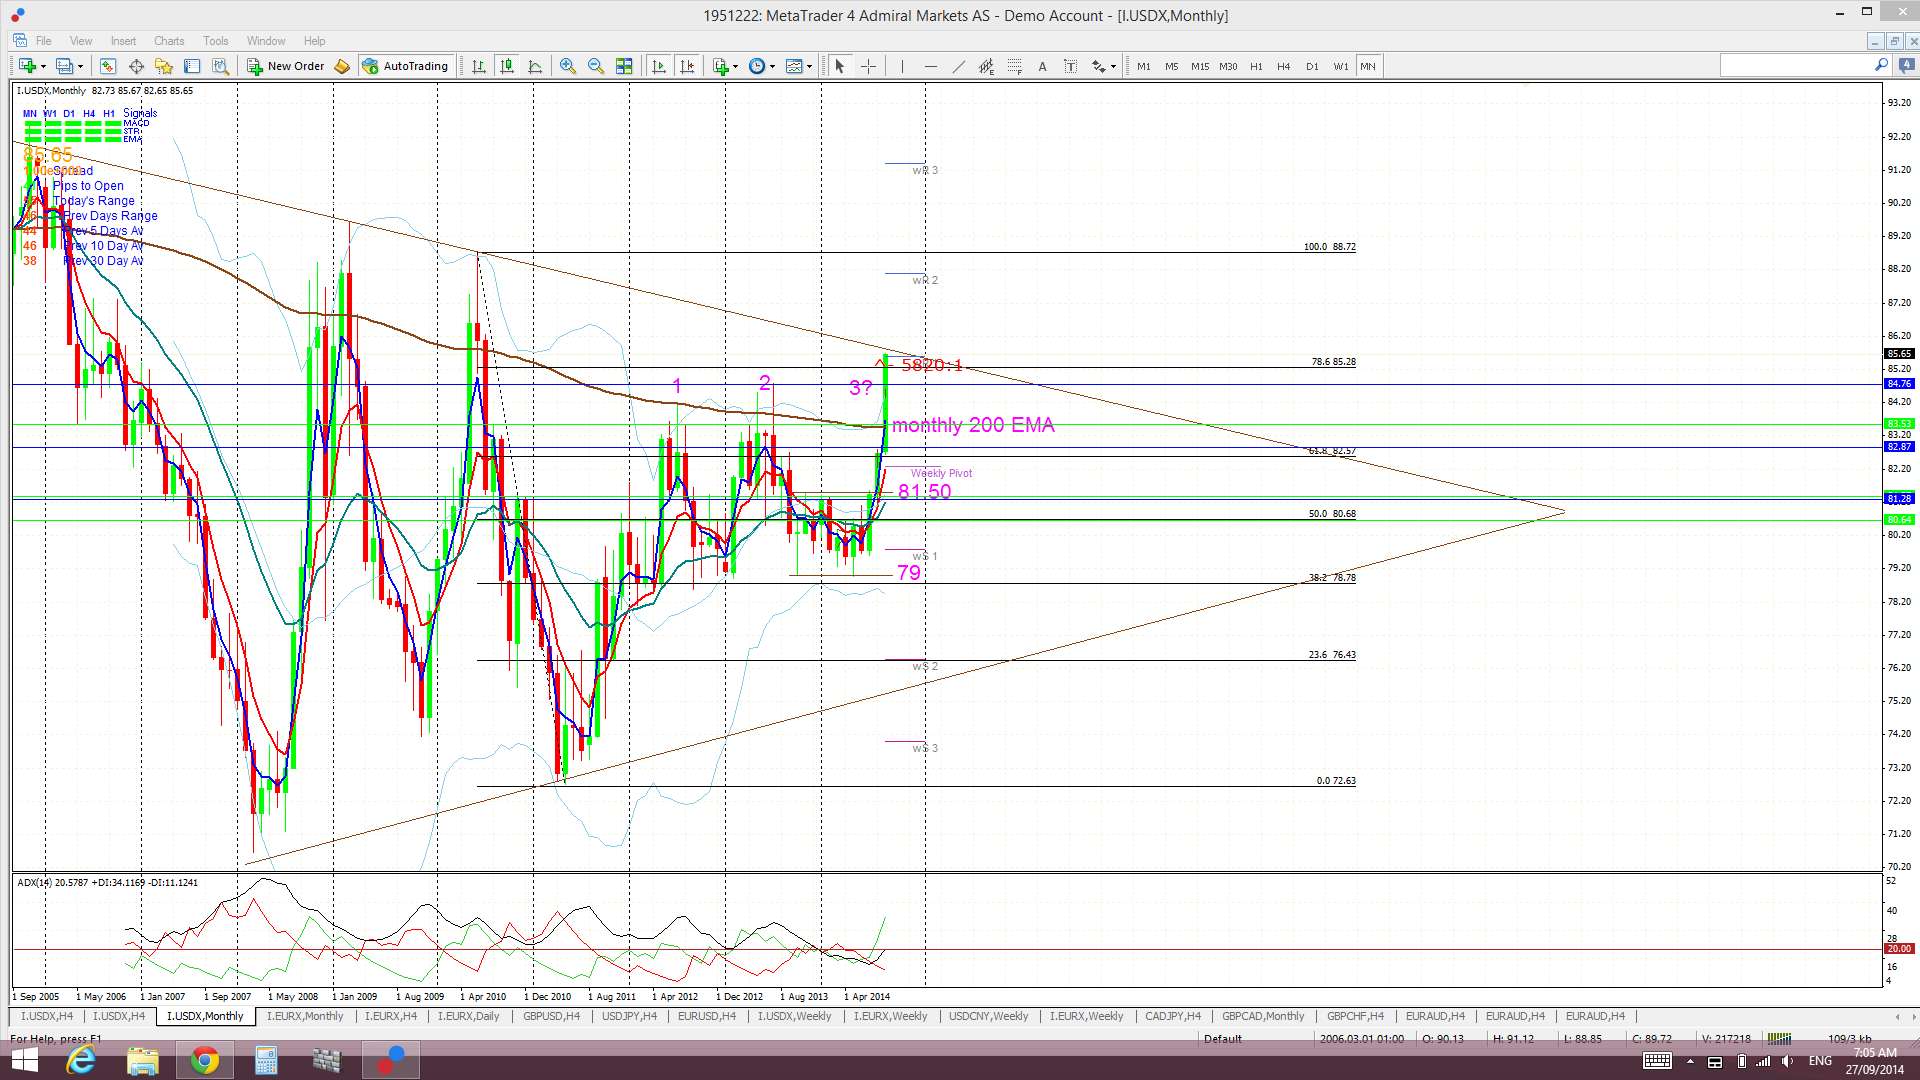
- The USDX continues to be a driving force with most currency pairs but it is still facing some potentially considerable resistance. See this link for a more detailed explanation. A bullish breakout for the USDX would be very bearish for many already battered pairs (E/U, A/U and Kiwi). A respect or pause of this resistance by the USDX may provide these currency pairs a bit of a reprieve though.
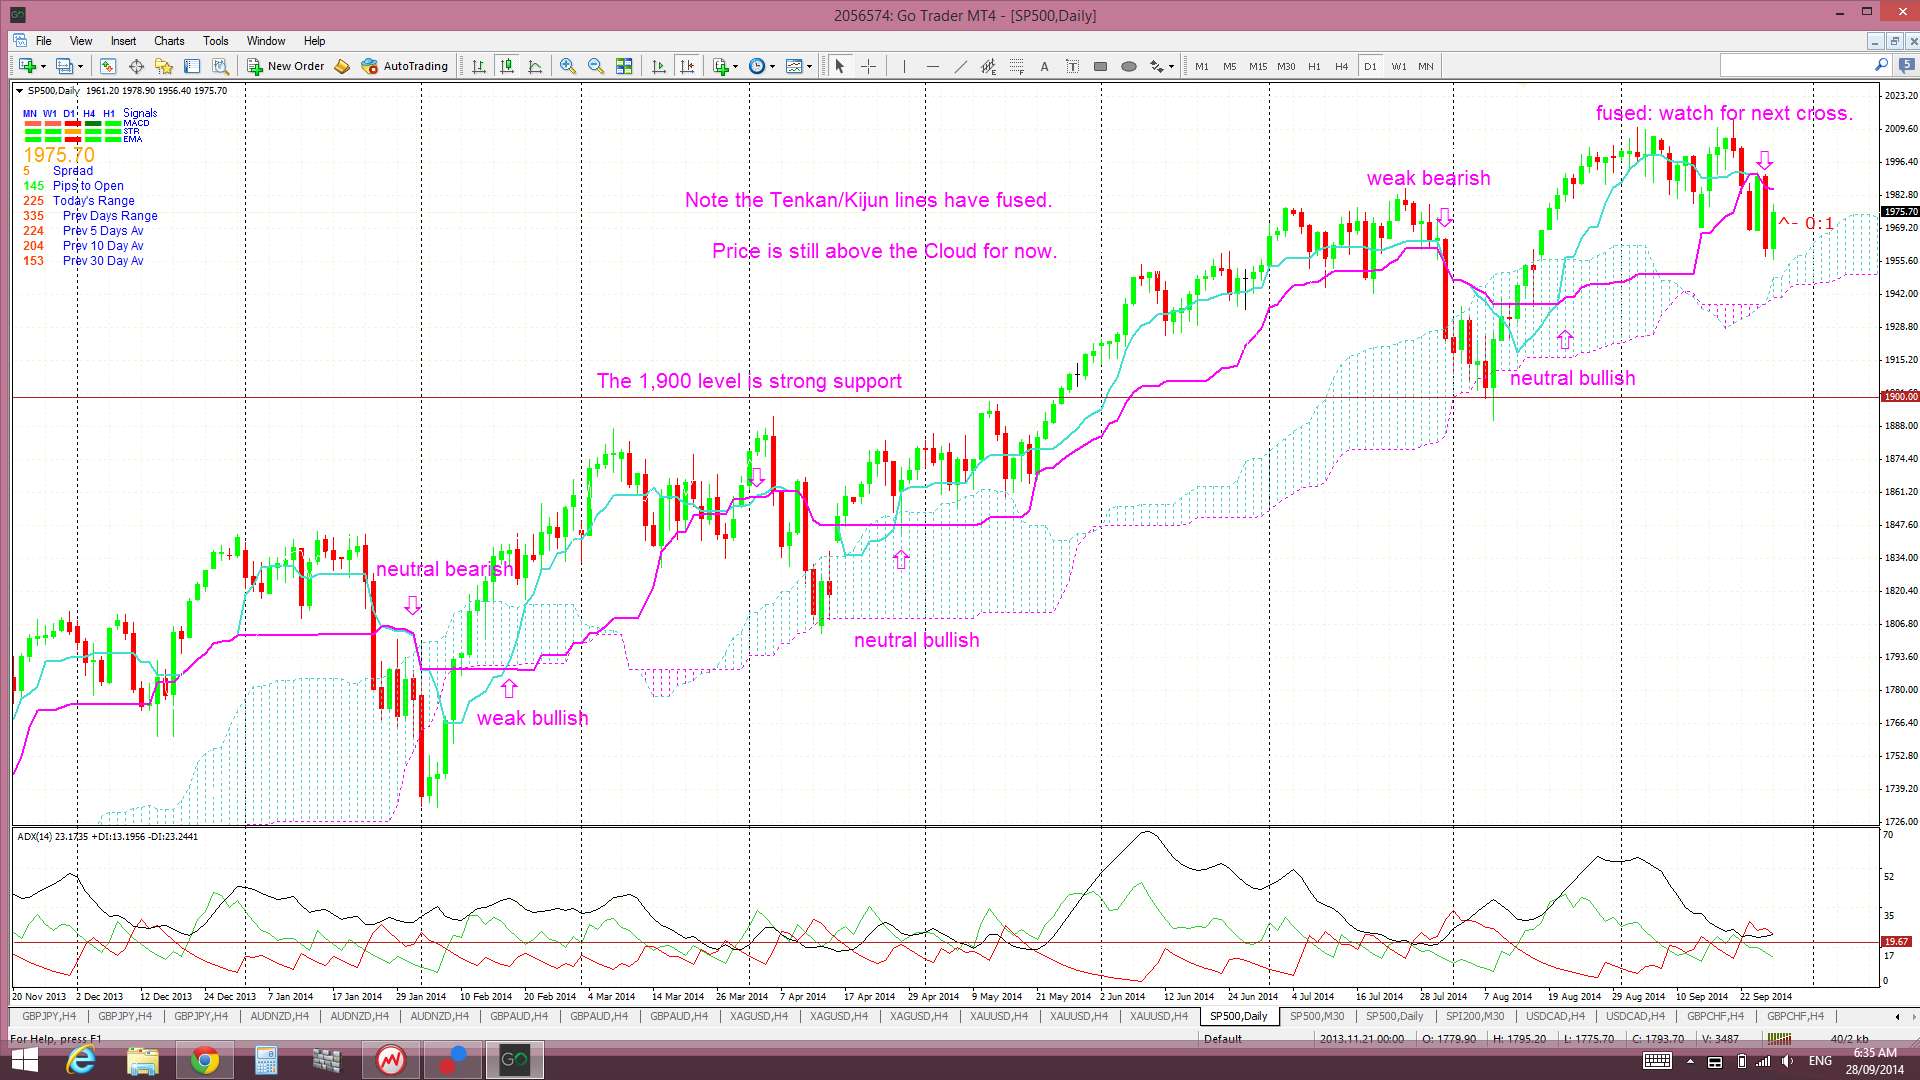
- US stocks have been choppy of late and, whilst daily support trend lines are still holding the major indices, the Tenkan/Kijun lines on the daily Ichimoku S&P500 chart have fused. The next cross here may offers some guidance to traders.
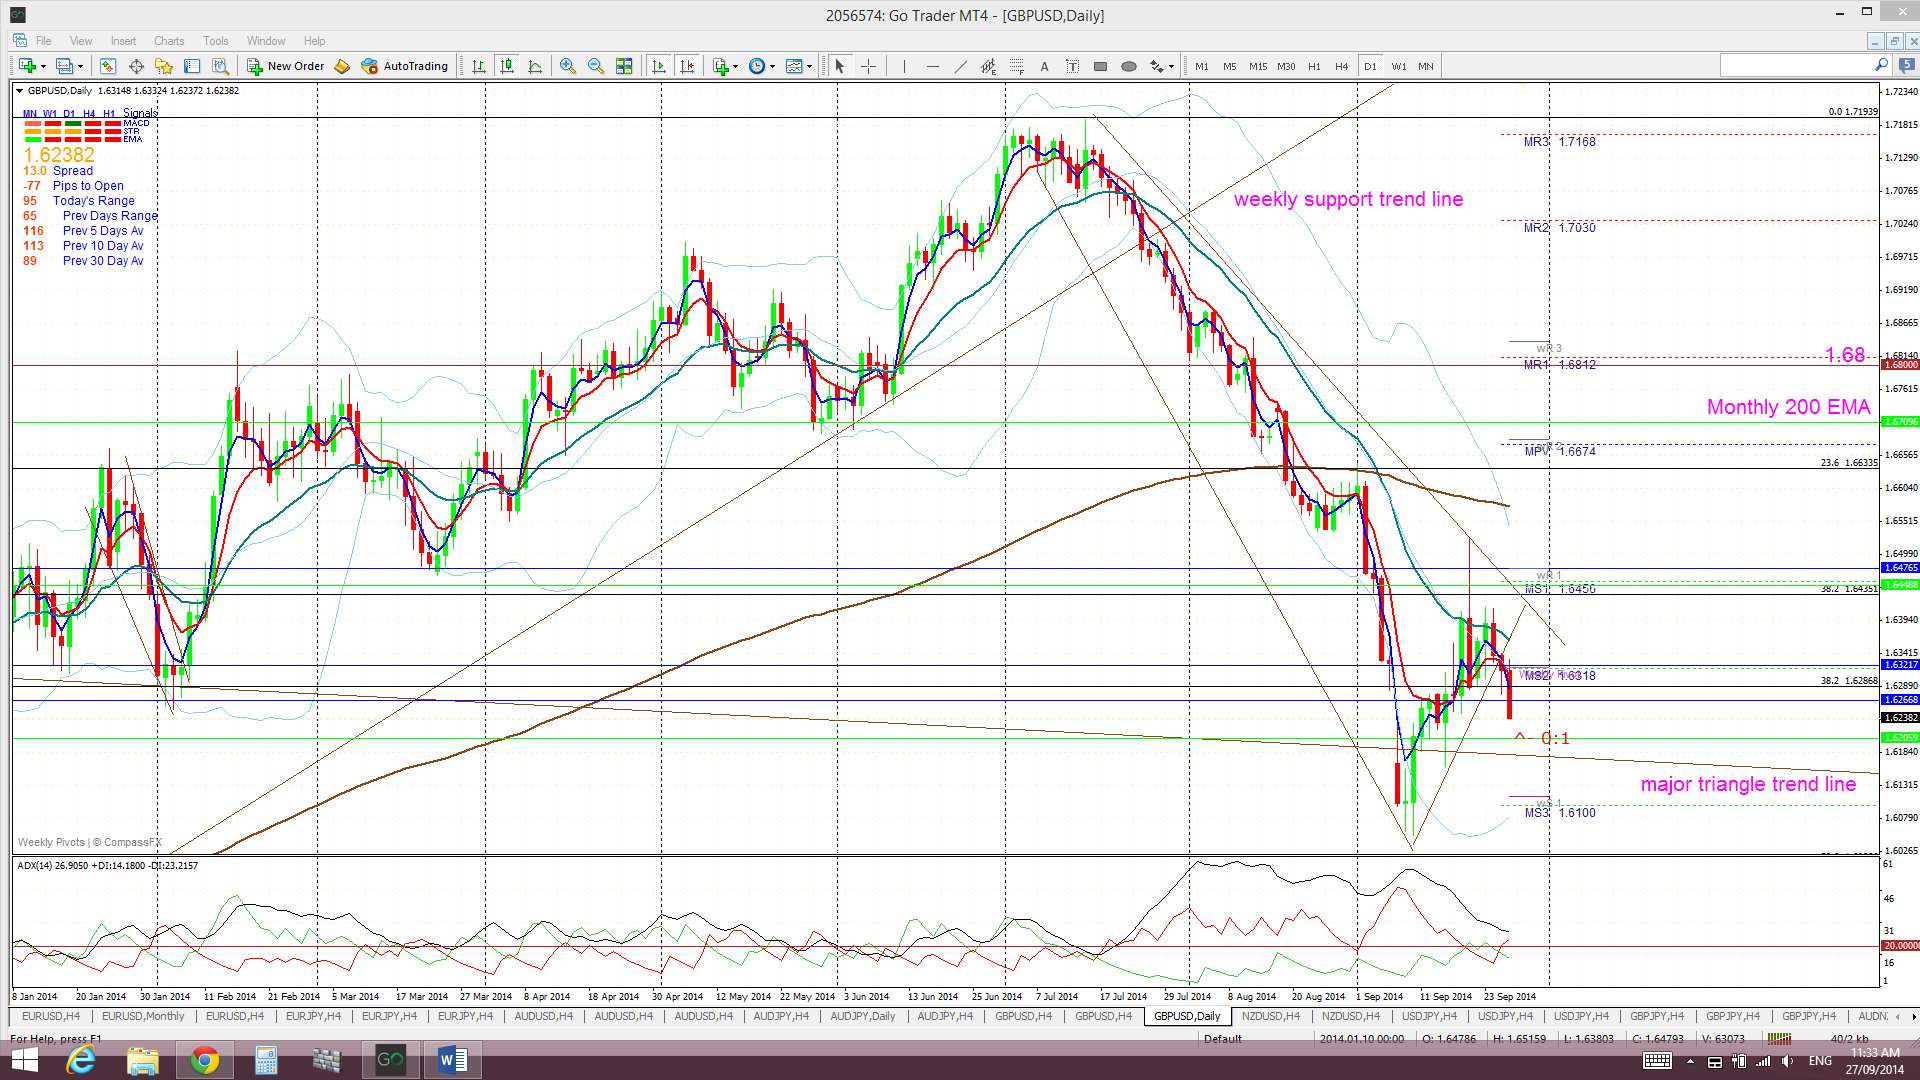
- The E/U, A/U, NZD/USD, USD/CAD and U/J have printed weekly candles that have closed outside of the Bollinger bands. Thus, traders need to watch out for any pause or possible pull back on these pairs. This is especially the case given that the USDX is running into a possible significant resistance zone.
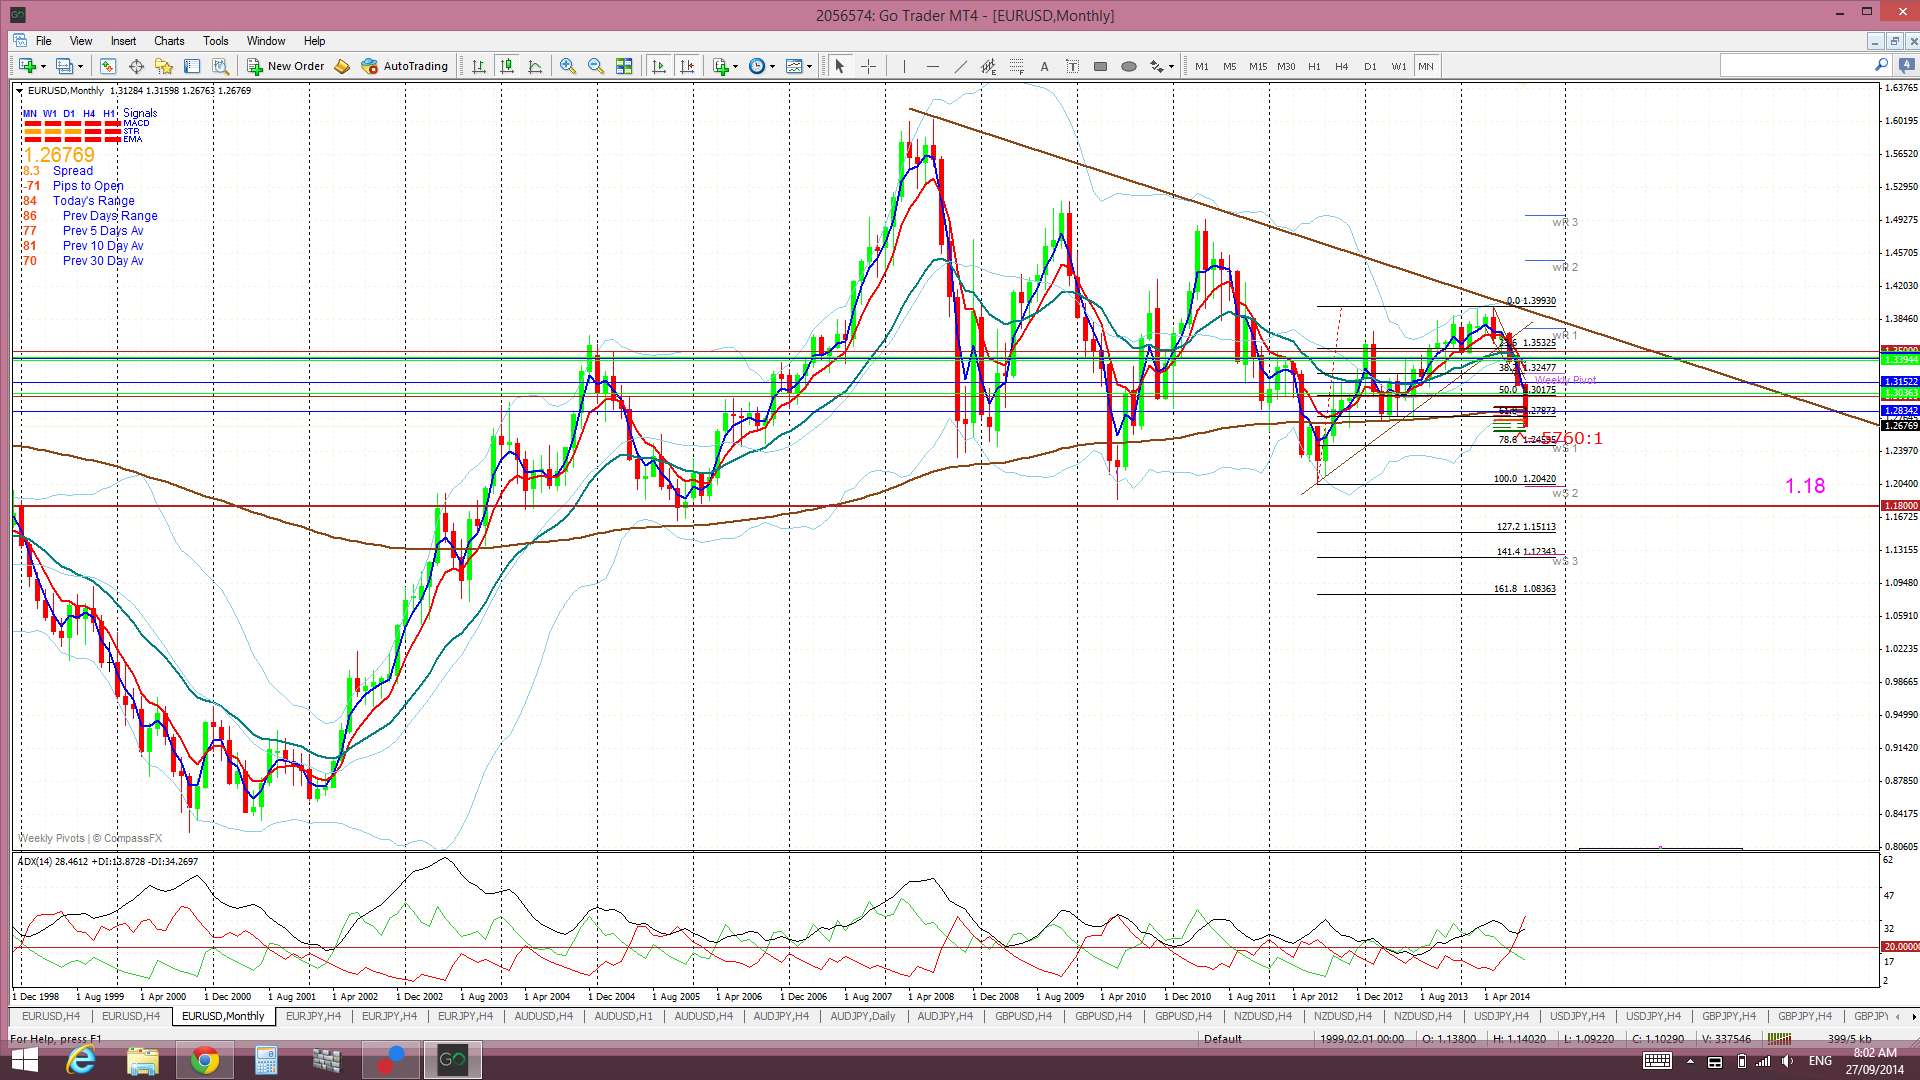
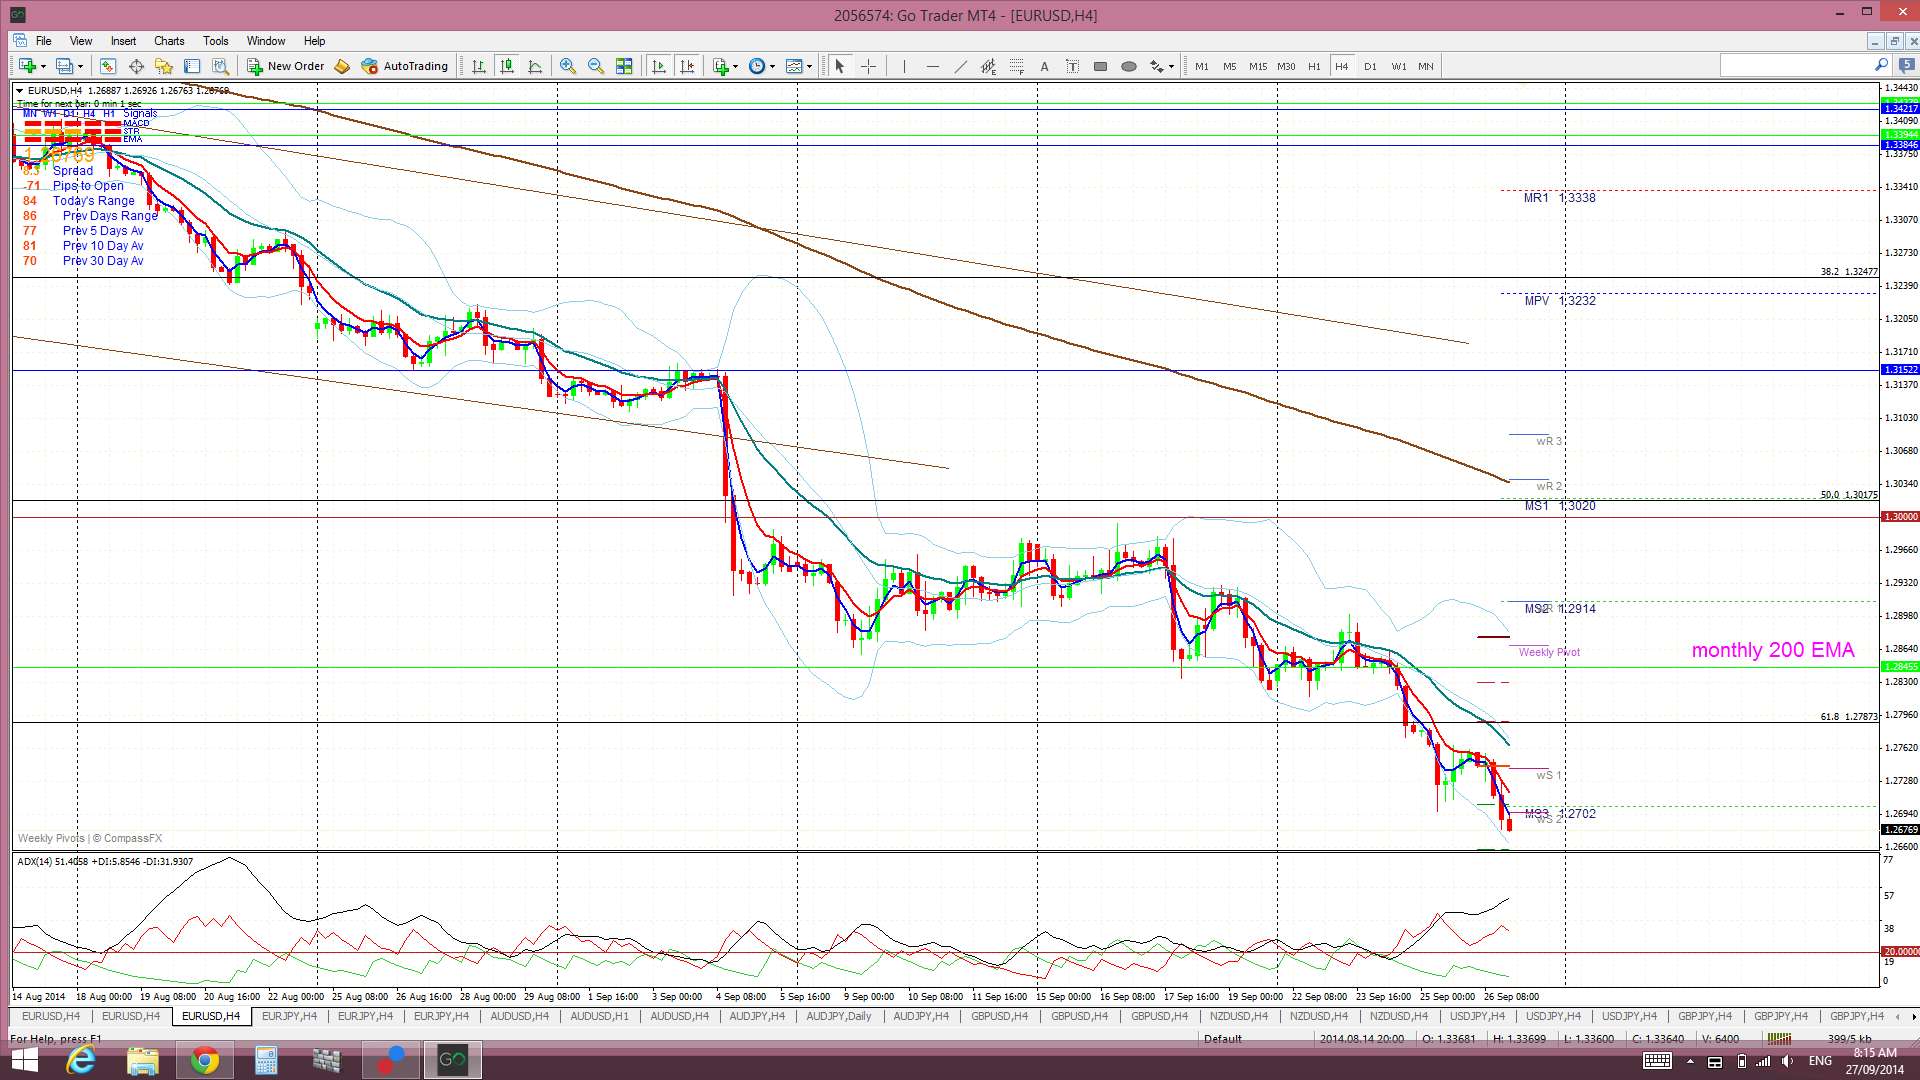
E/U: the E/U has printed 11 bearish candles out of the last 13. One has to wonder if this kind of sustained sell off can continue. I’m reading a fair bit of trading commentary suggesting the ‘short E/U’ trade is the way to go but that, in itself, might be a telling feature. Maybe its time to go long?  ![]()
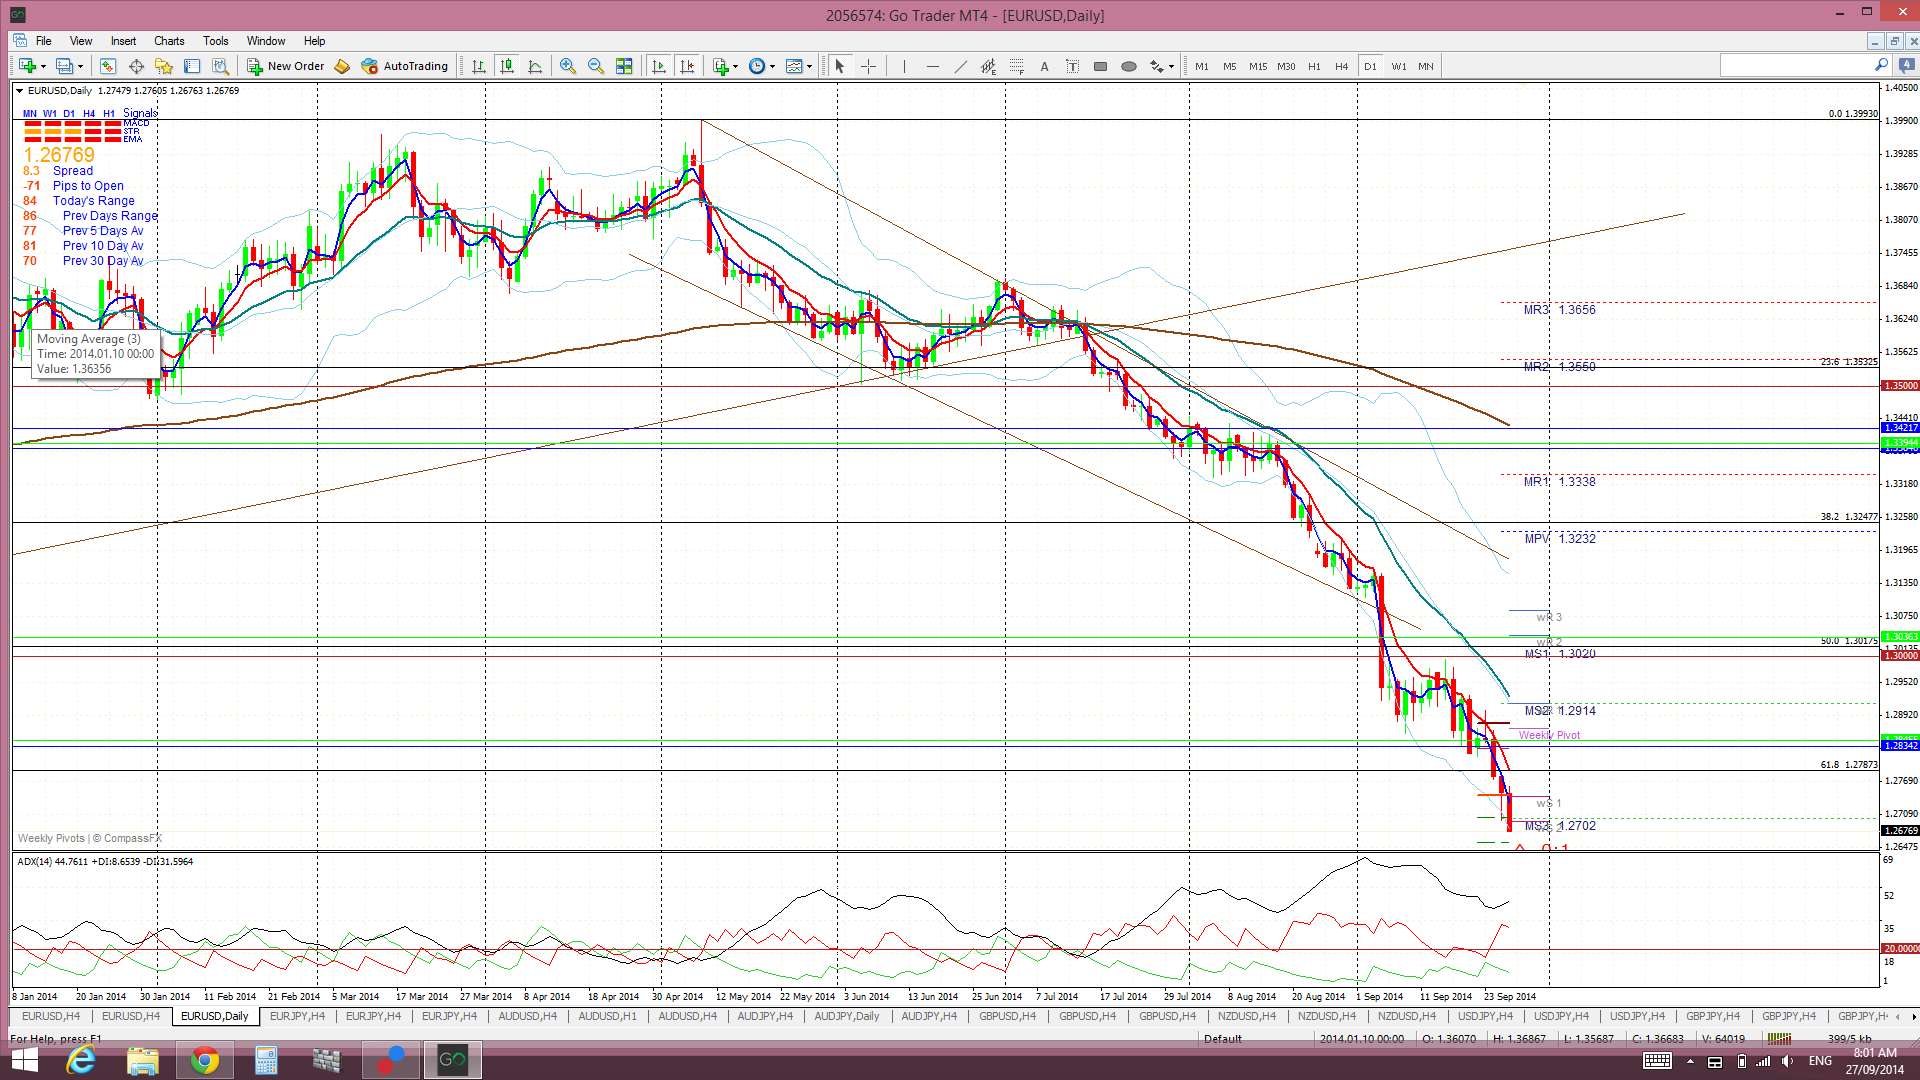
The weekly close below the 61.8% fib of the recent bull run is very bearish though and does suggest continuation down to the 1.18 region. However, a bit of a pull back here would not be out of order so jumping in short at these current low levels could be akin to the doomed trying to ‘catch the falling knife’ situation. There have been breaks of a few major levels and these could possibly be tested again, even if there is to be bearish follow through. Possible pull back targets would be the:
- 61.8% fib level near 1.28
- monthly 200 EMA near 1.285
- or even back to the 50% fib near the 1.30 level: the bottom of the monthly Cloud is near 1.30 and so a test of this region might be in order.
So, why would I be thinking that we could get a pull back on the E/U here? It is because of the situation on the USD index. This index has rallied hard for 3 months now and is currently butting up against major resistance from a monthly chart triangle trend line. This trend line dates back over 9 years and so could offer some considerable resistance and this may be sufficient to cause at least a pause, or maybe even a pull back, with the index. If so, this would possibly allow for some pull back on the E/U as well as the A/U, Cable, Loonie and Kiwi pairs.
USD index monthly: sitting under major resistance:Â
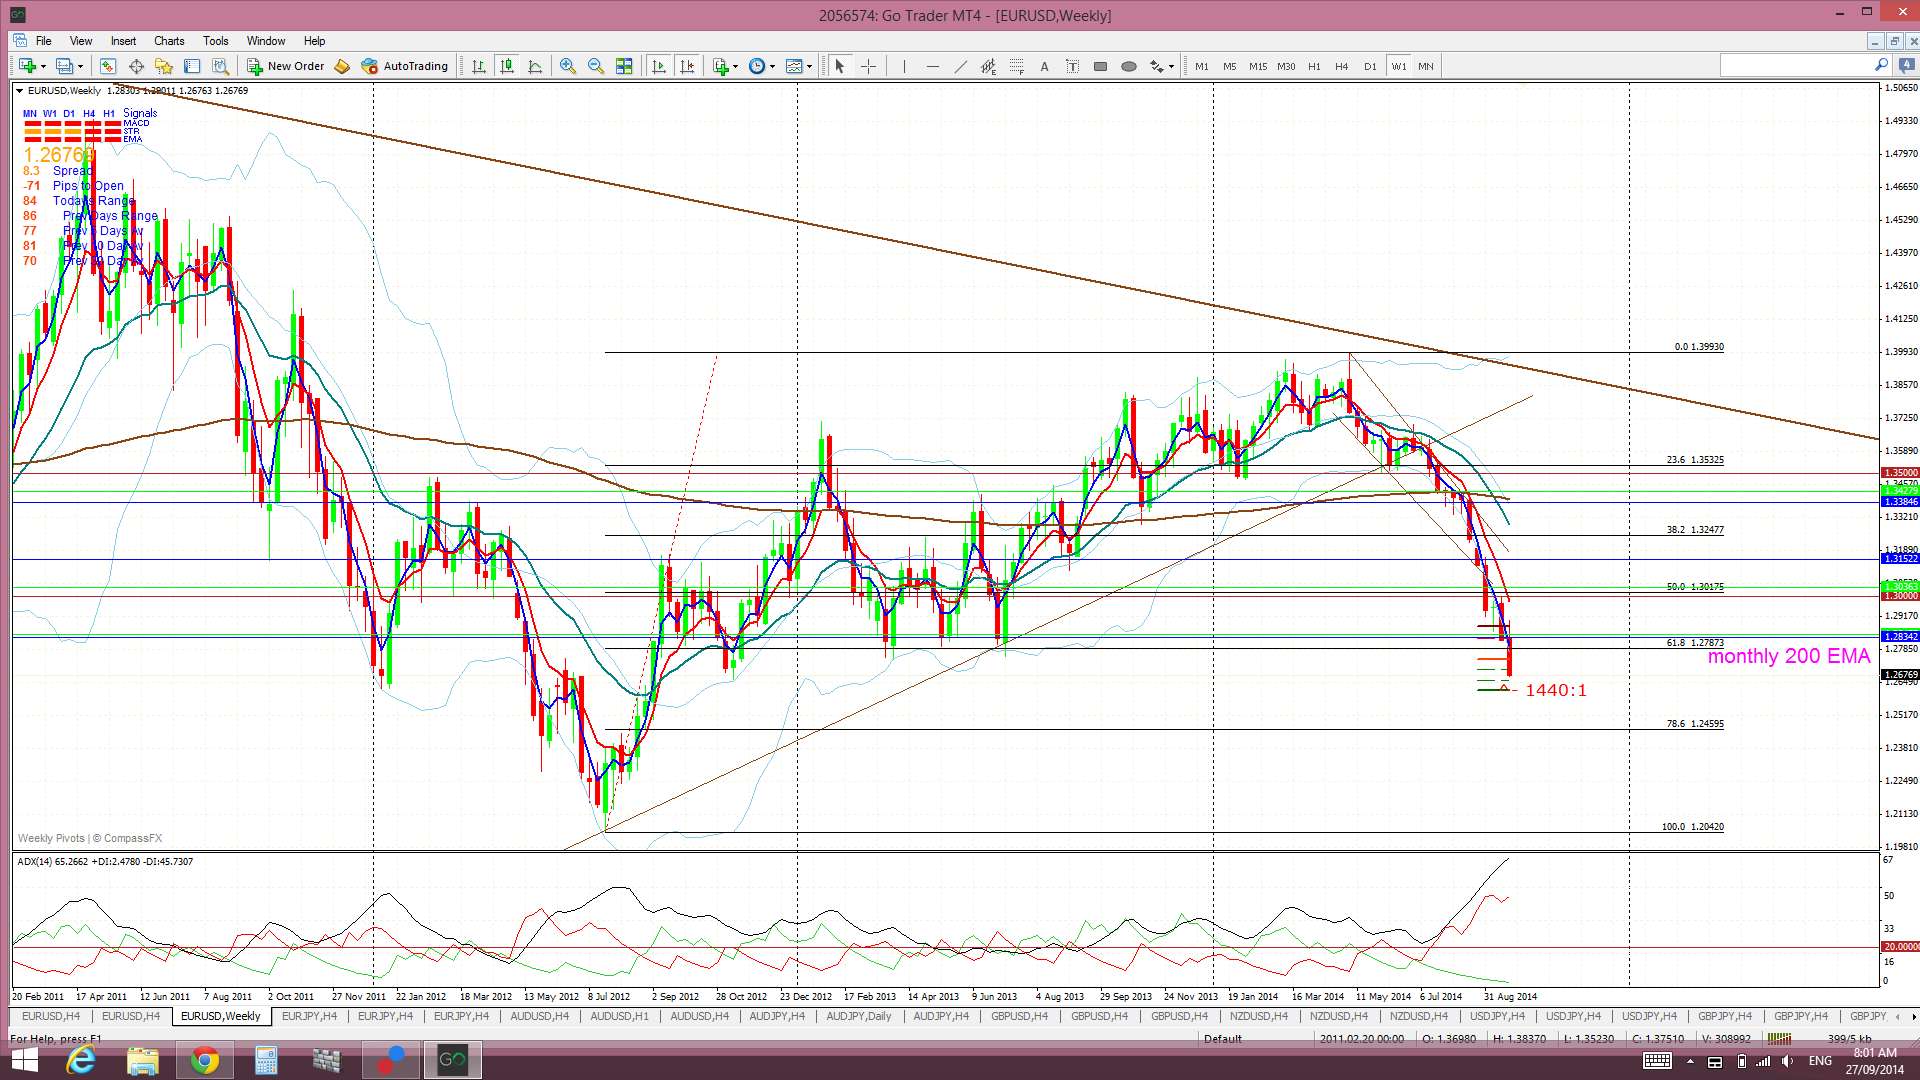
The E/U is trading below the Ichimoku Cloud on the 4hr, daily, weekly and monthly charts which is bearish.Â
The weekly candle closed as a large bearish candle and well outside the Bollinger bands. Thus, a pull back or pause may be in order here. However, if the USDX continues to plow ahead through resistance then I would suspect this pair is headed for monthly support down near 1.18.
- I will be looking for a new TC signal and for any pull back here but with a view down to 1.18.
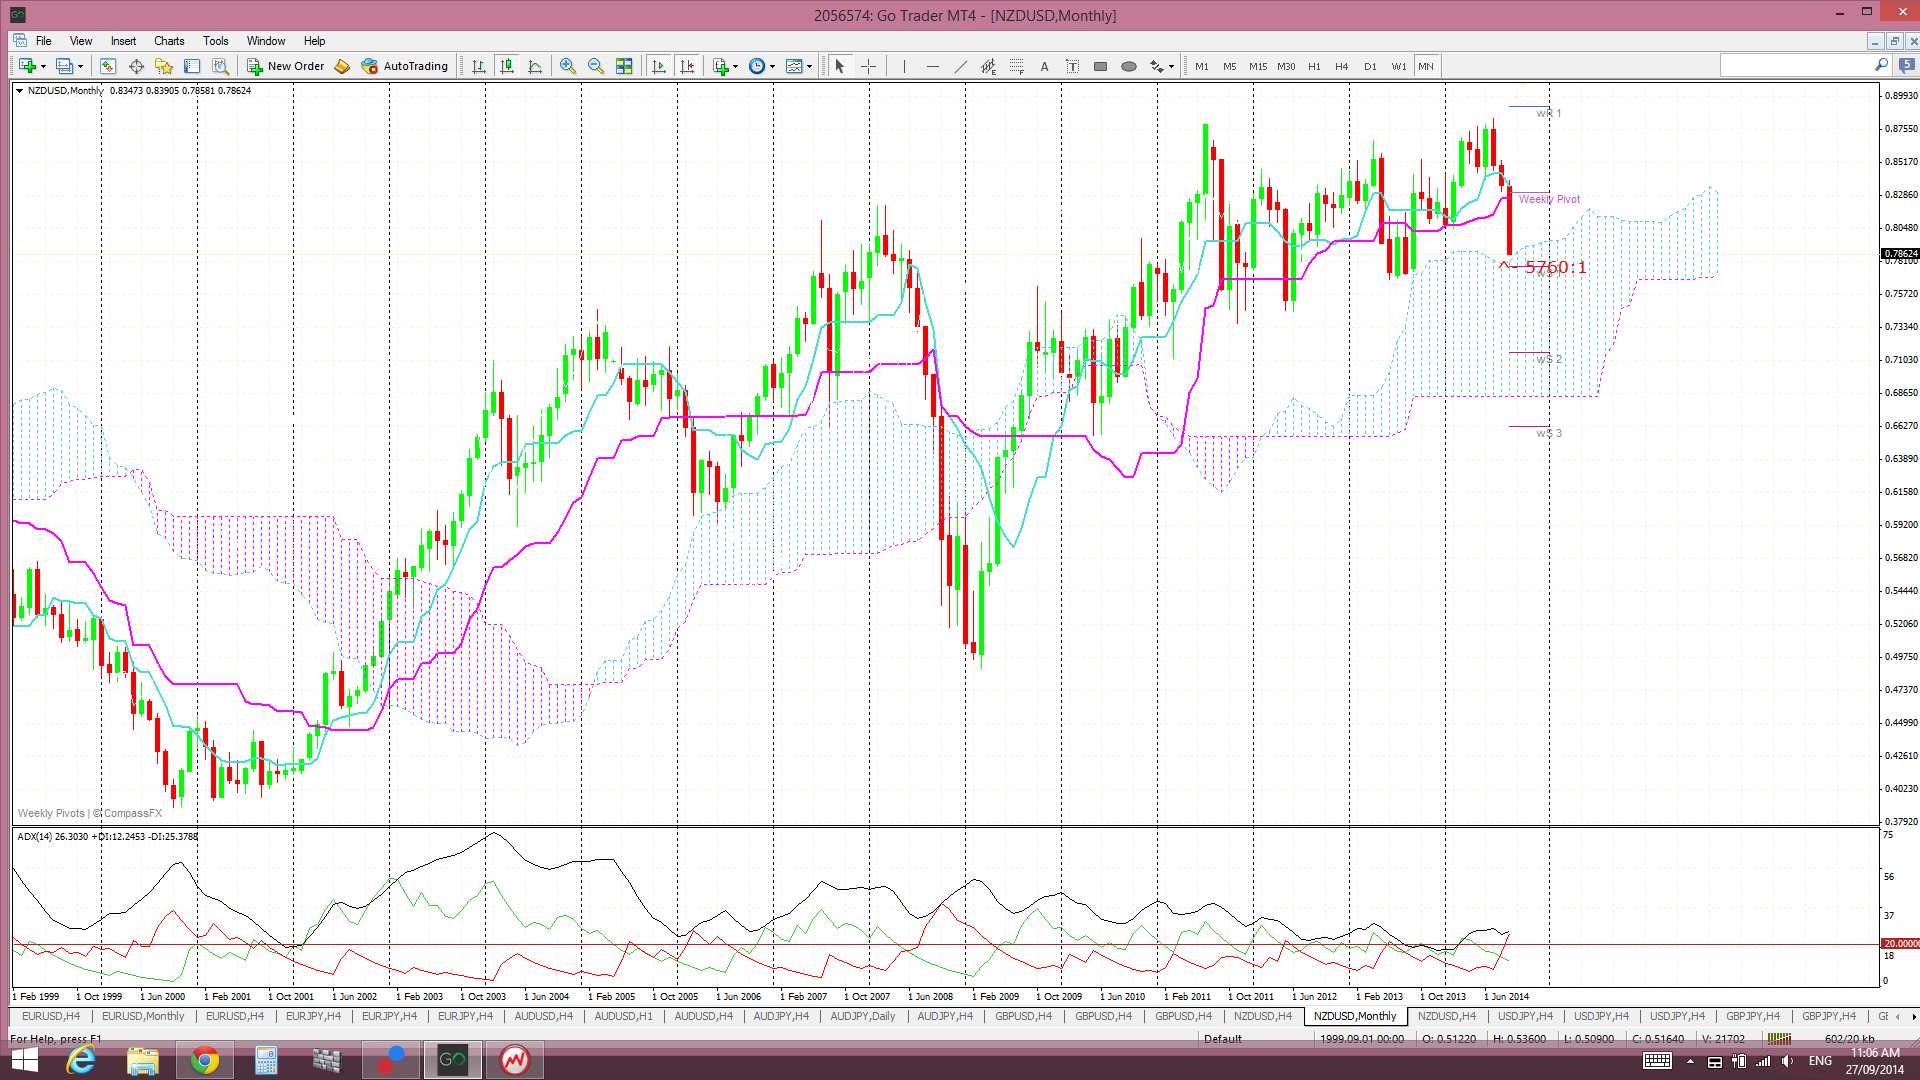
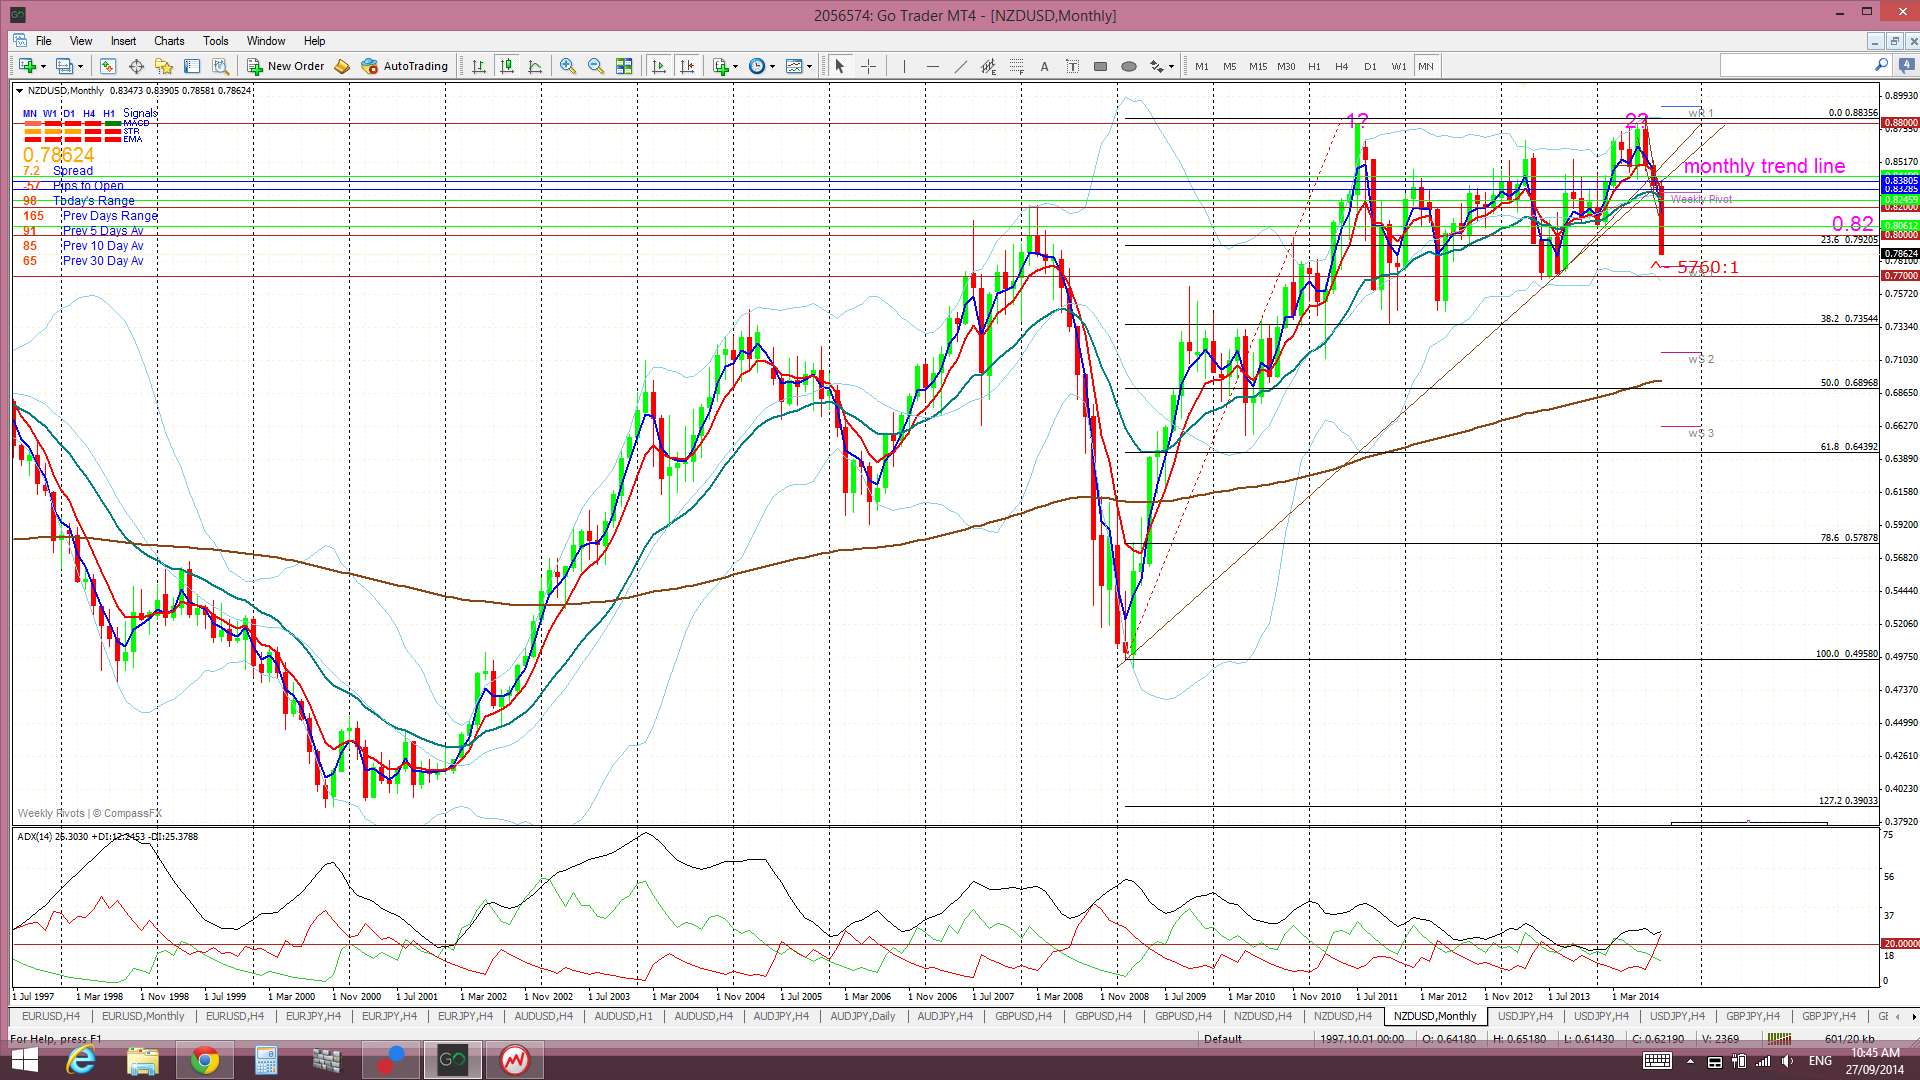
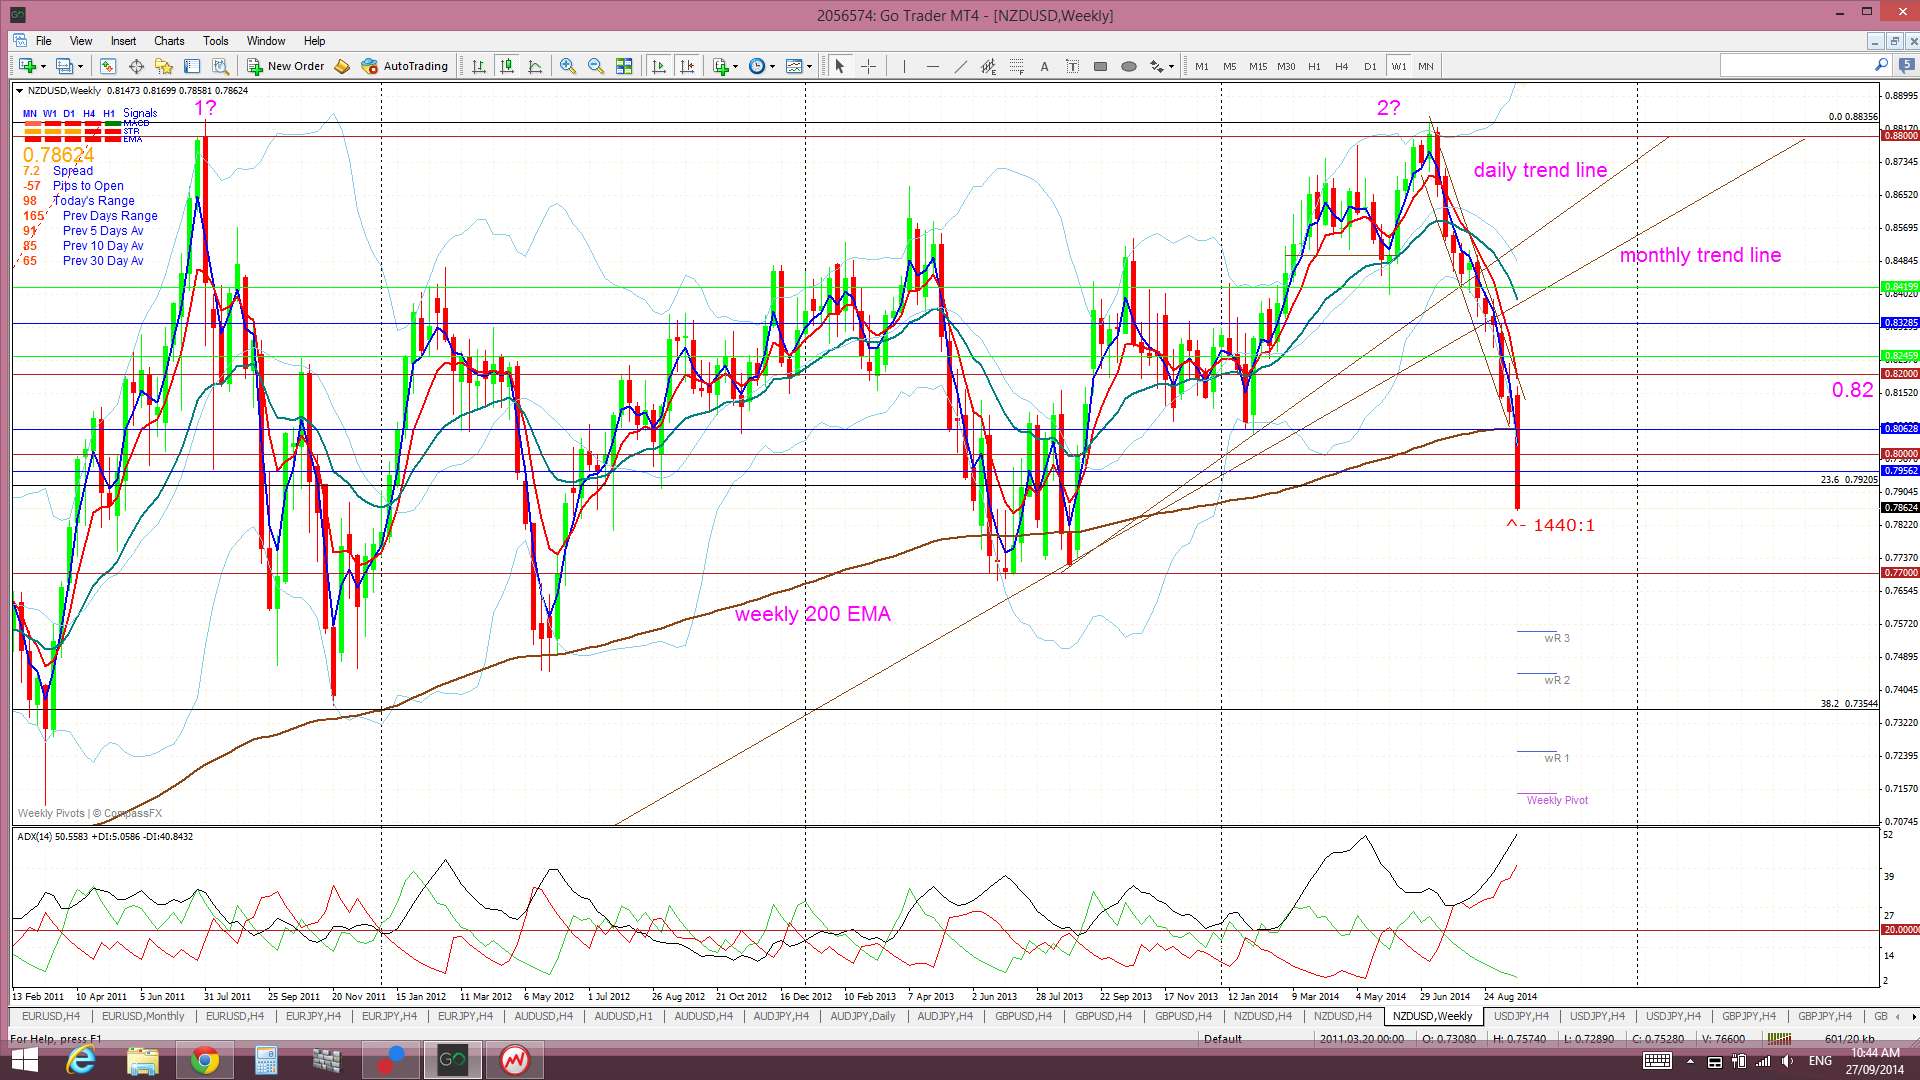
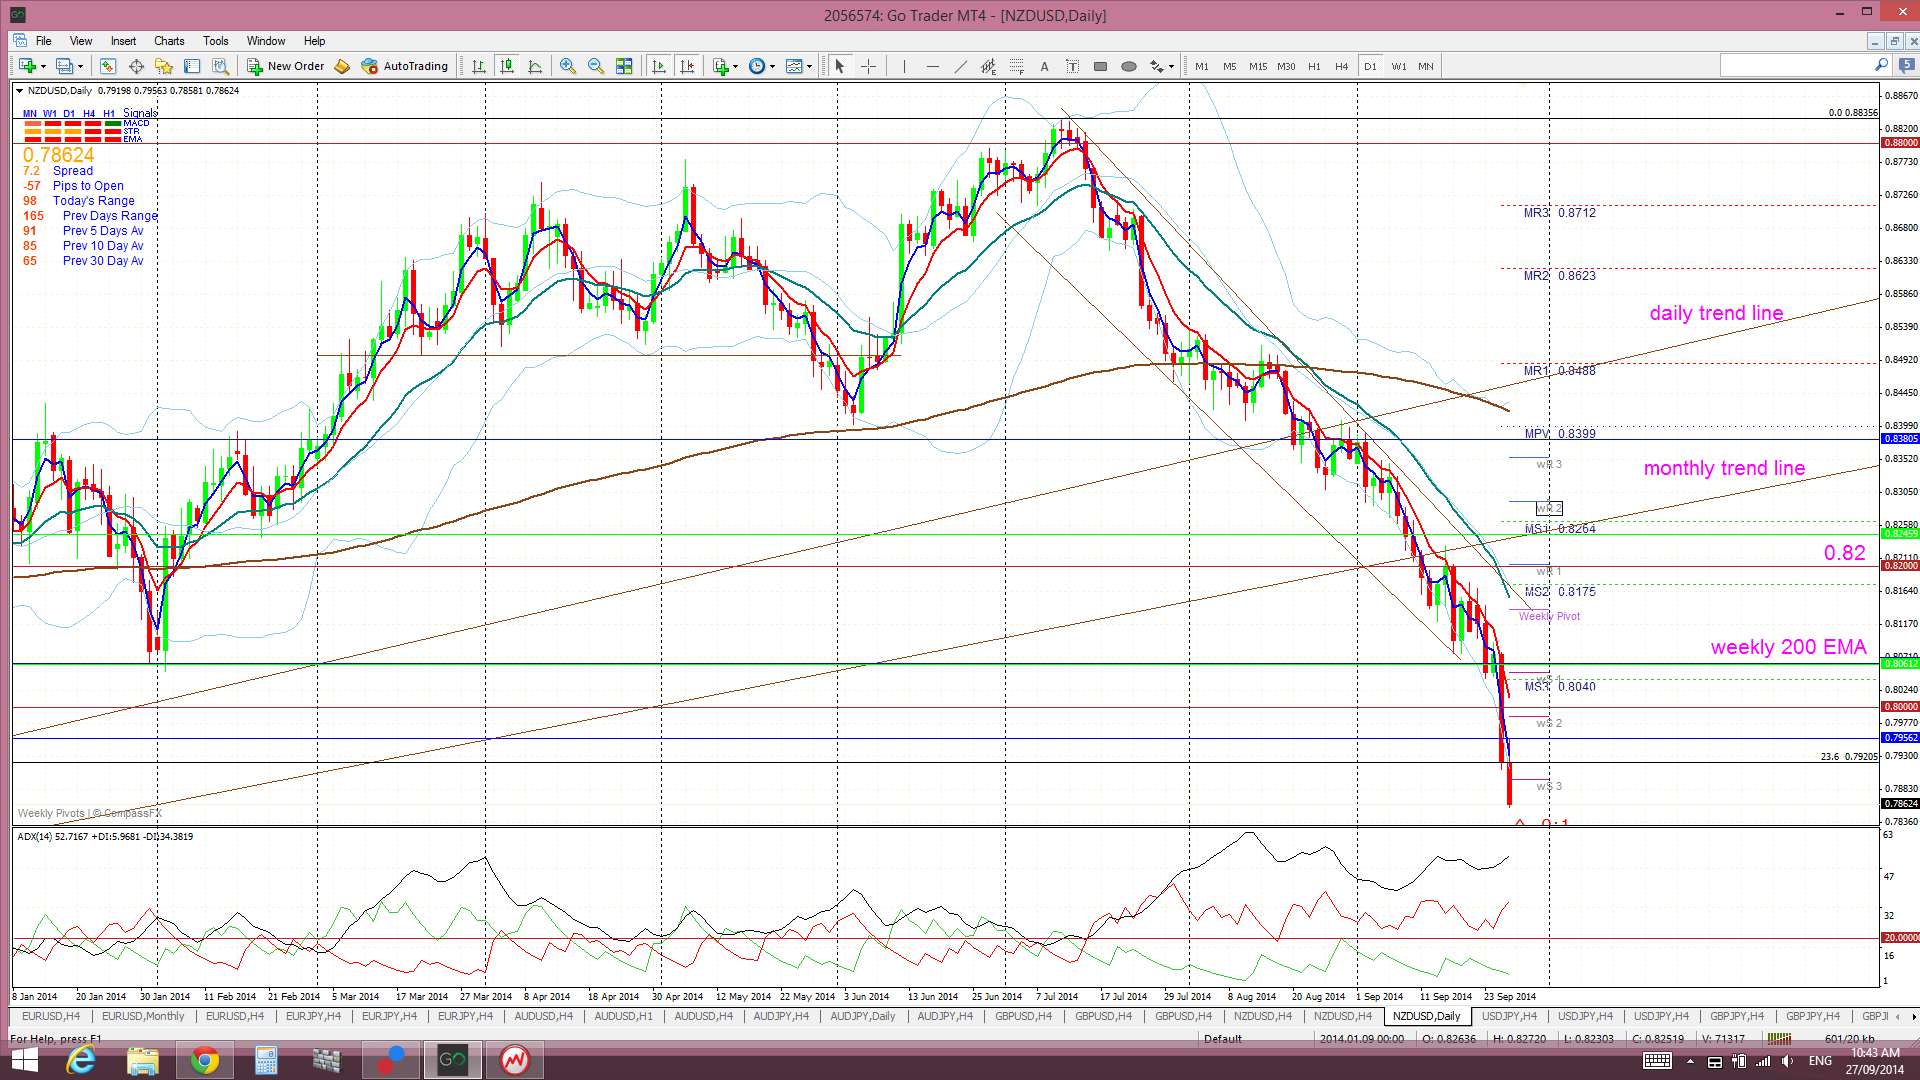
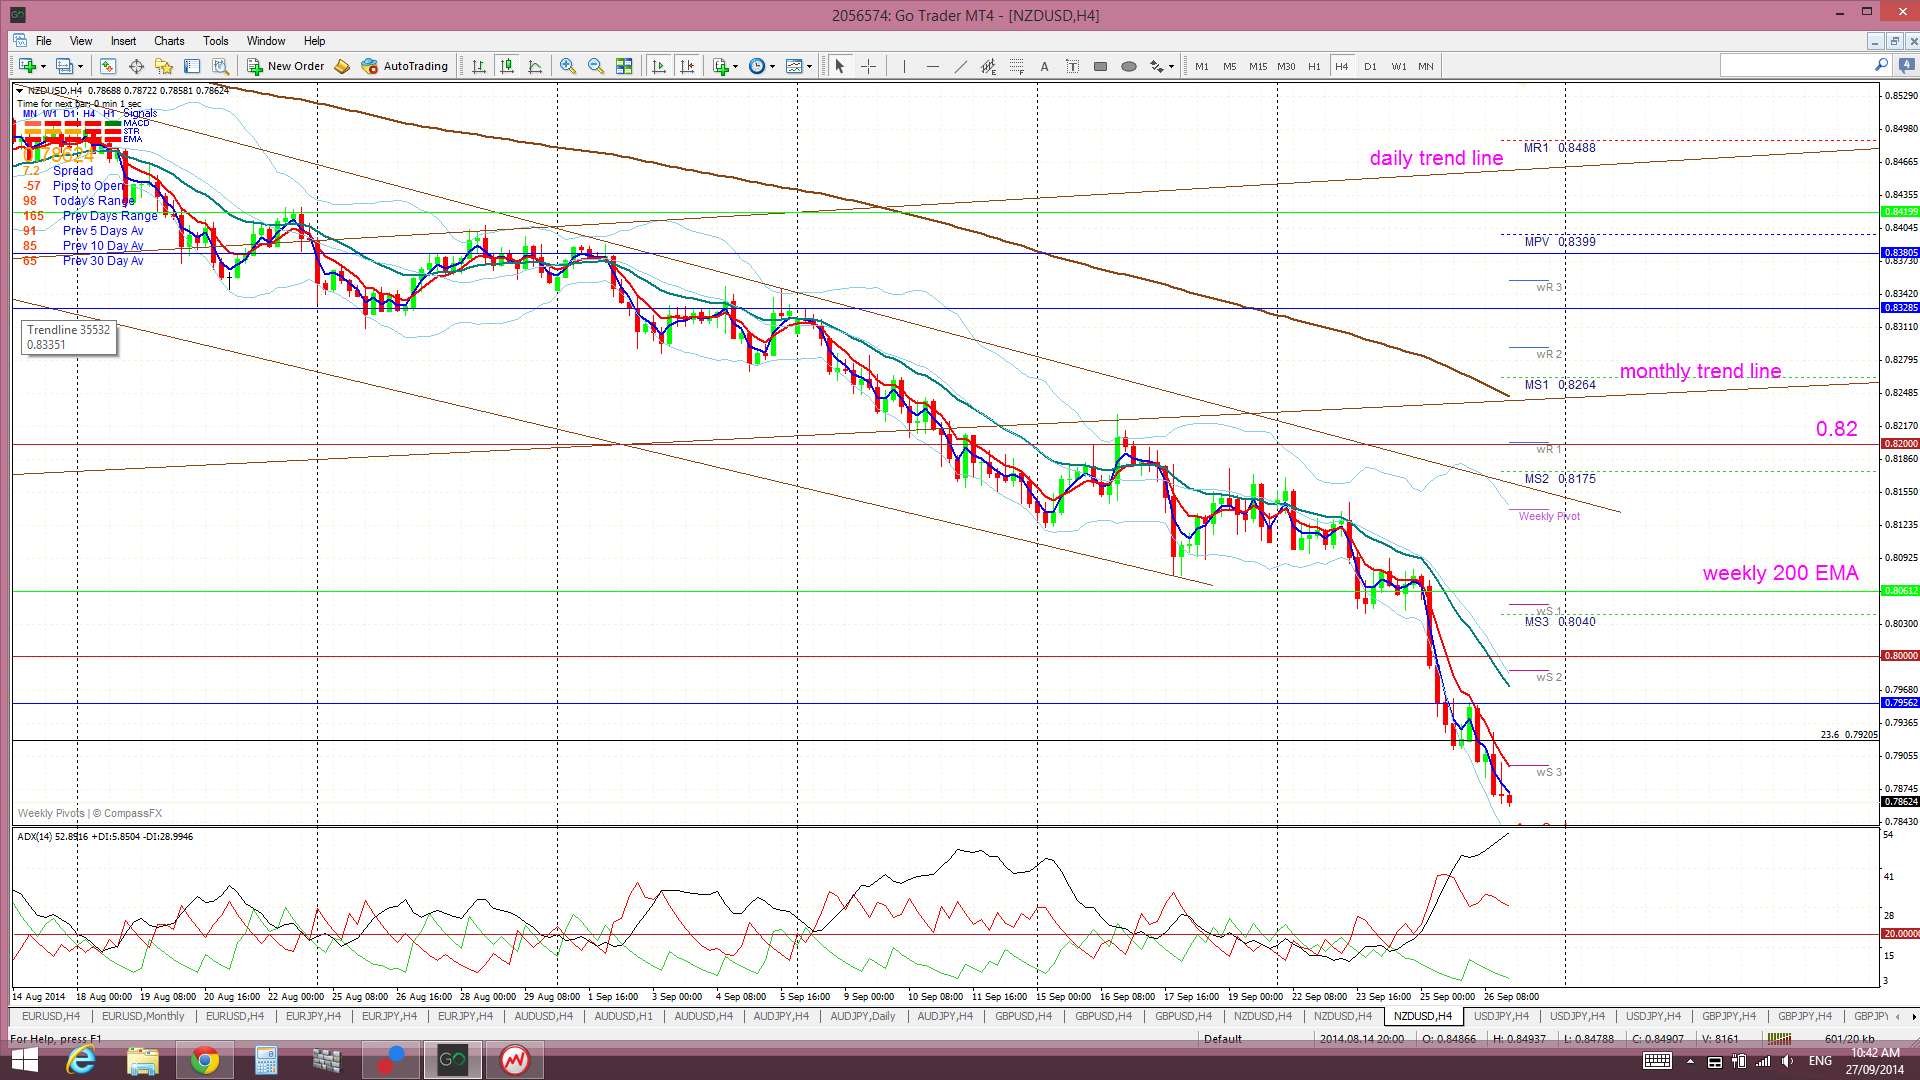
Kiwi: the Kiwi managed to hold above the support of the monthly 200 EMA until mid week but then fell heavily courtesy of some RBNZ comments. It also closed for the week below the key 80 support level which suggests bearish continuation.
As with the E/U, though, I would not be surprised to see a possible pull back here. Pull back levels to watch out for would include the:
- 0.80 level
- weekly 200 EMA
- or even the 0.82 level
The Kiwi is trading below the Ichimoku Cloud on the 4hr, daily and weekly time frame but is about to run into the top of the monthly Cloud. The top of the monthly Cloud could also help to support the Kiwi somewhat:
Kiwi Monthly Ichimoku: showing looming support from top of bullish Cloud:
As with the E/U, the weekly candle closed as a large bearish candle and well outside the Bollinger bands. Thus, a pull back may be in order here. However, if the USDX plows on through resistance then there are a number of bearish targets for the Kiwi:
- the psychological whole number 77 level, also a region of S/R.
- the 38.2% fib near 73.5
- the 50% fib near 70 and the monthly 200 EMA.
- the 61.8% fib down near 65.
I watching for any new TC signal but also looking for a possible pull back here.
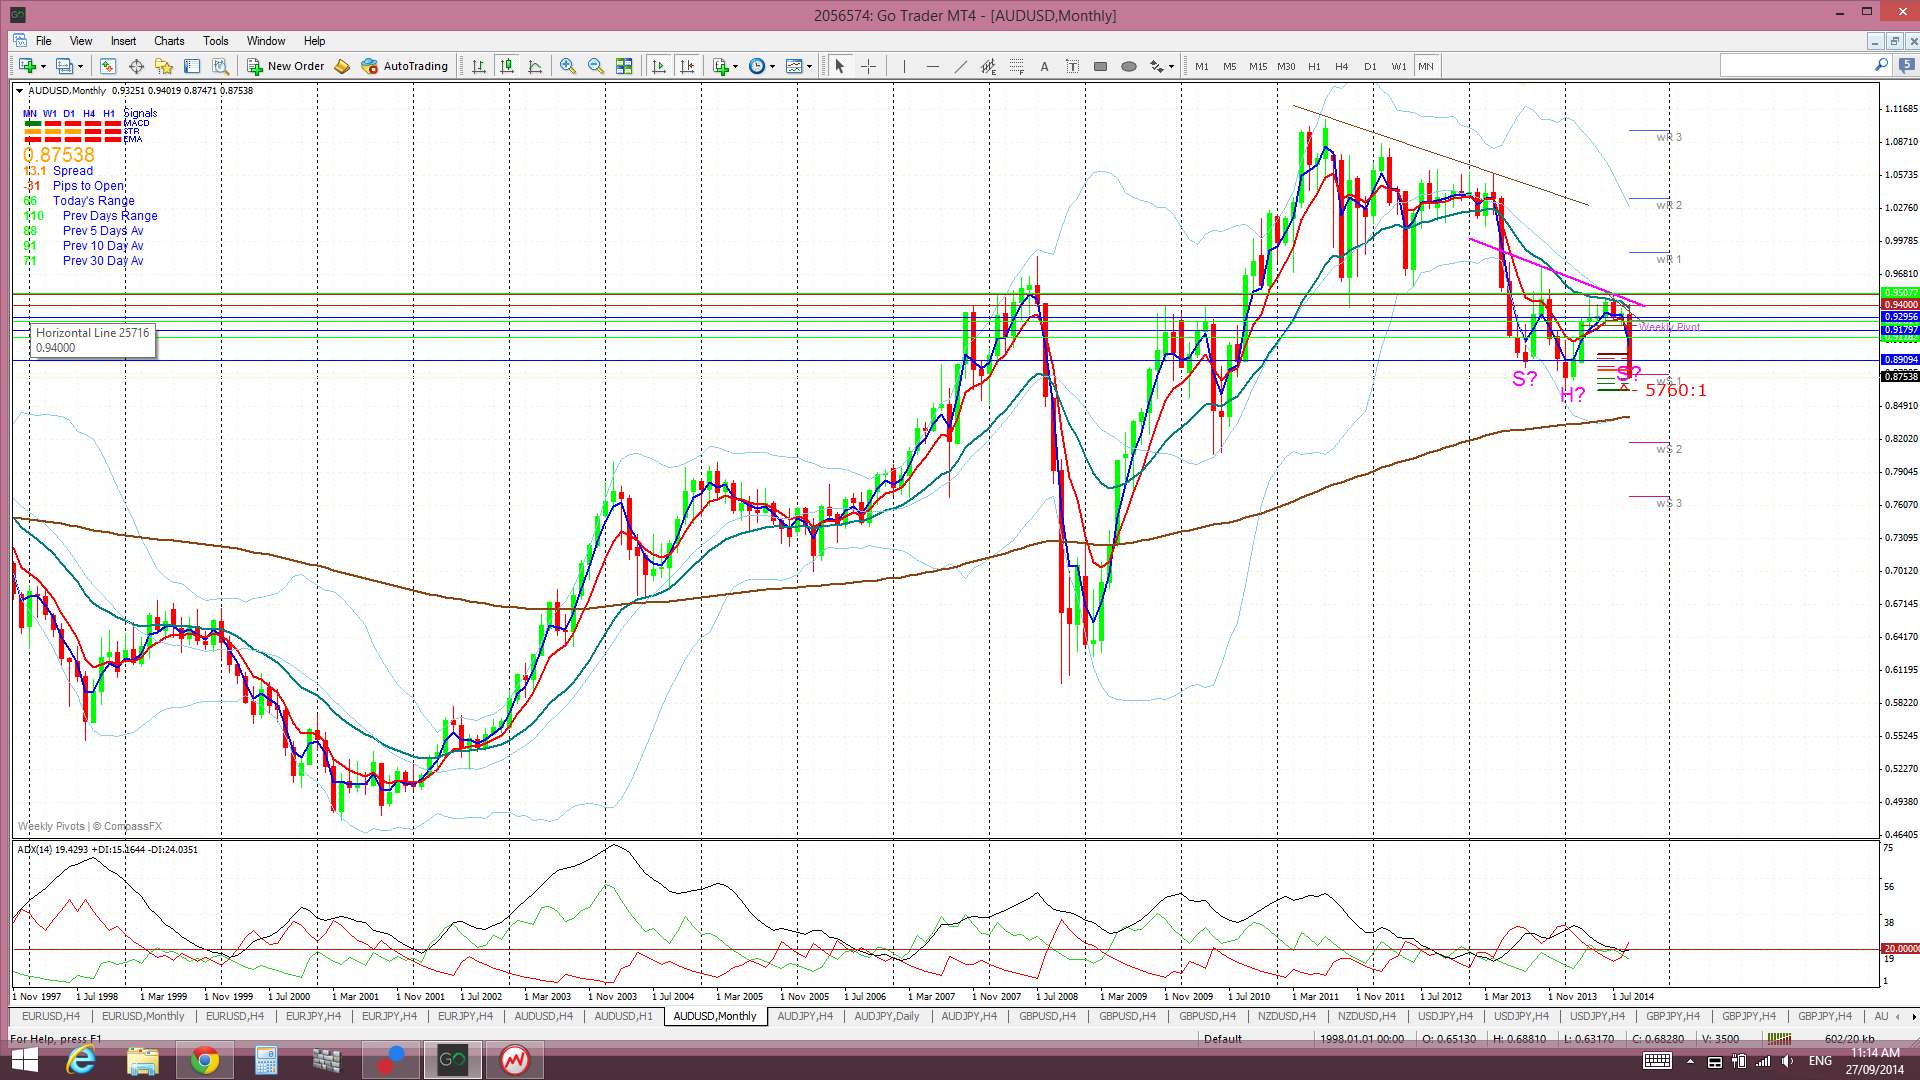
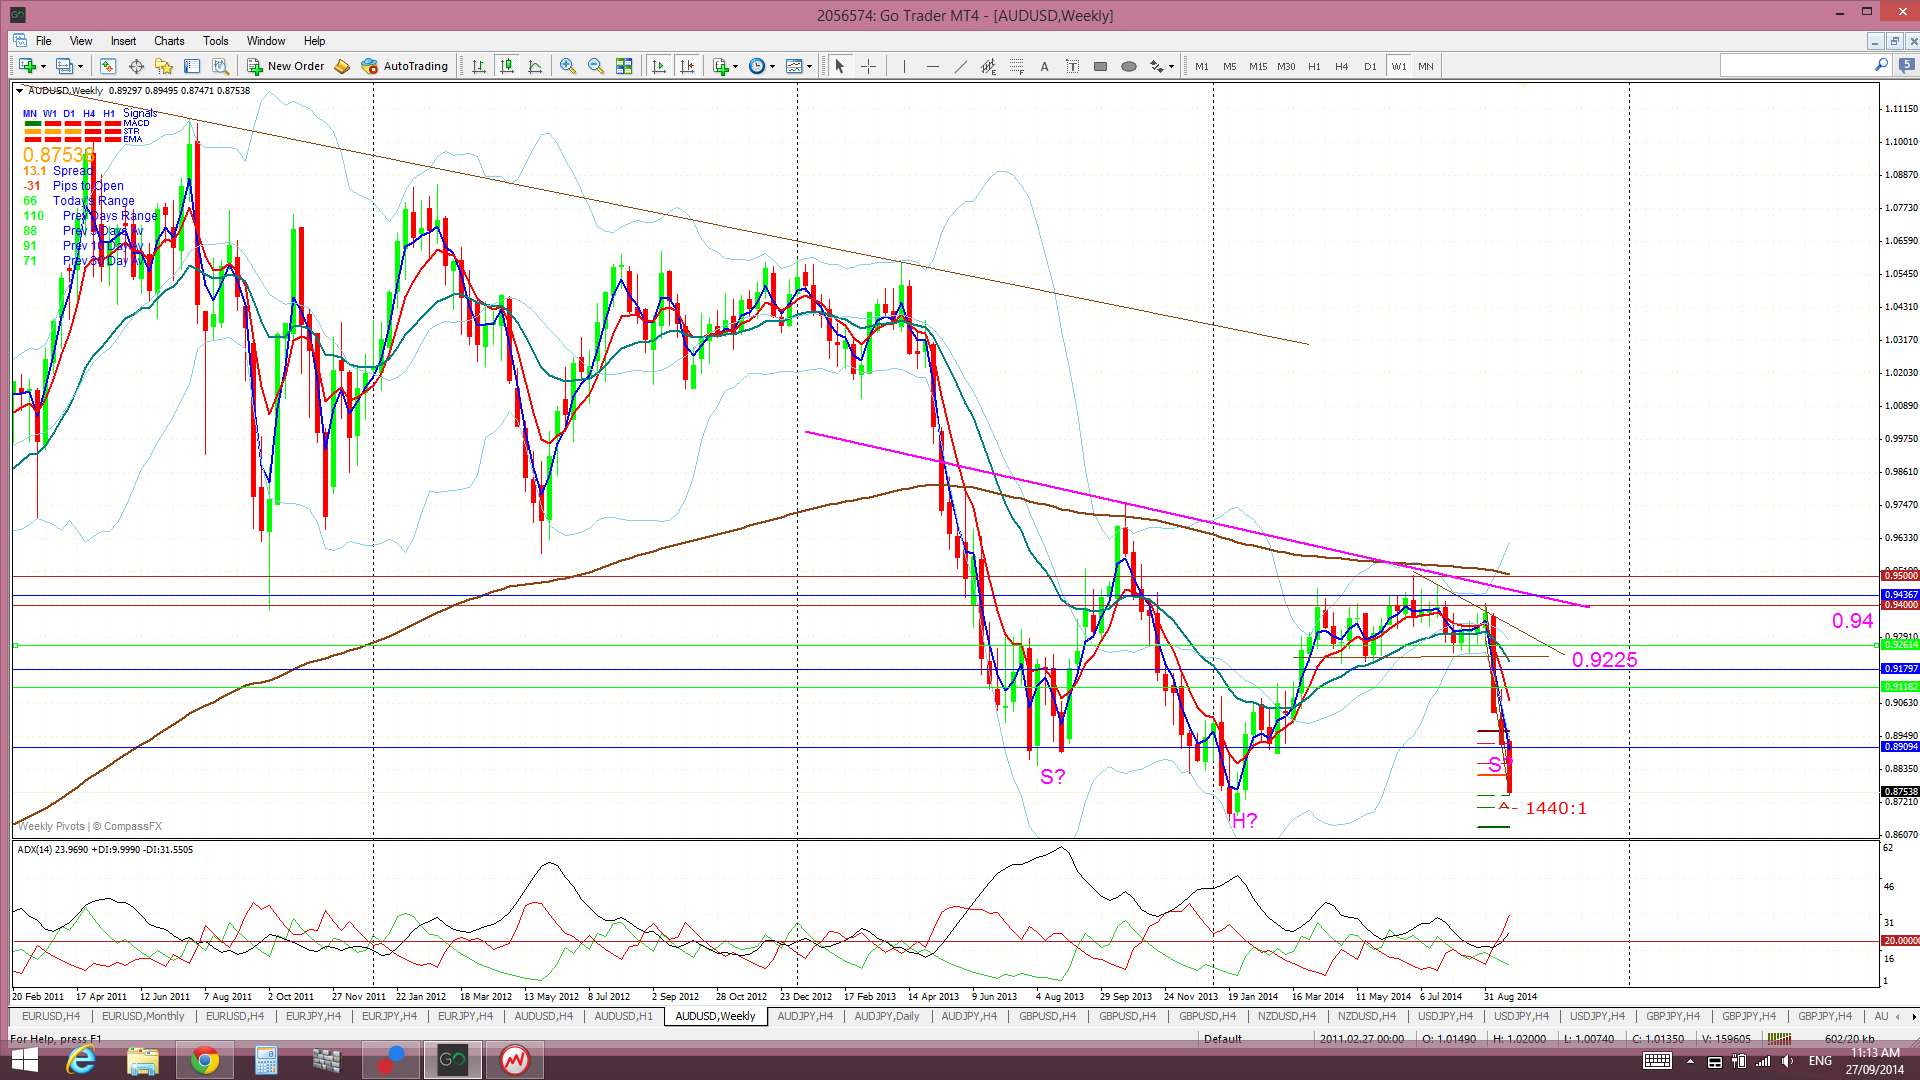
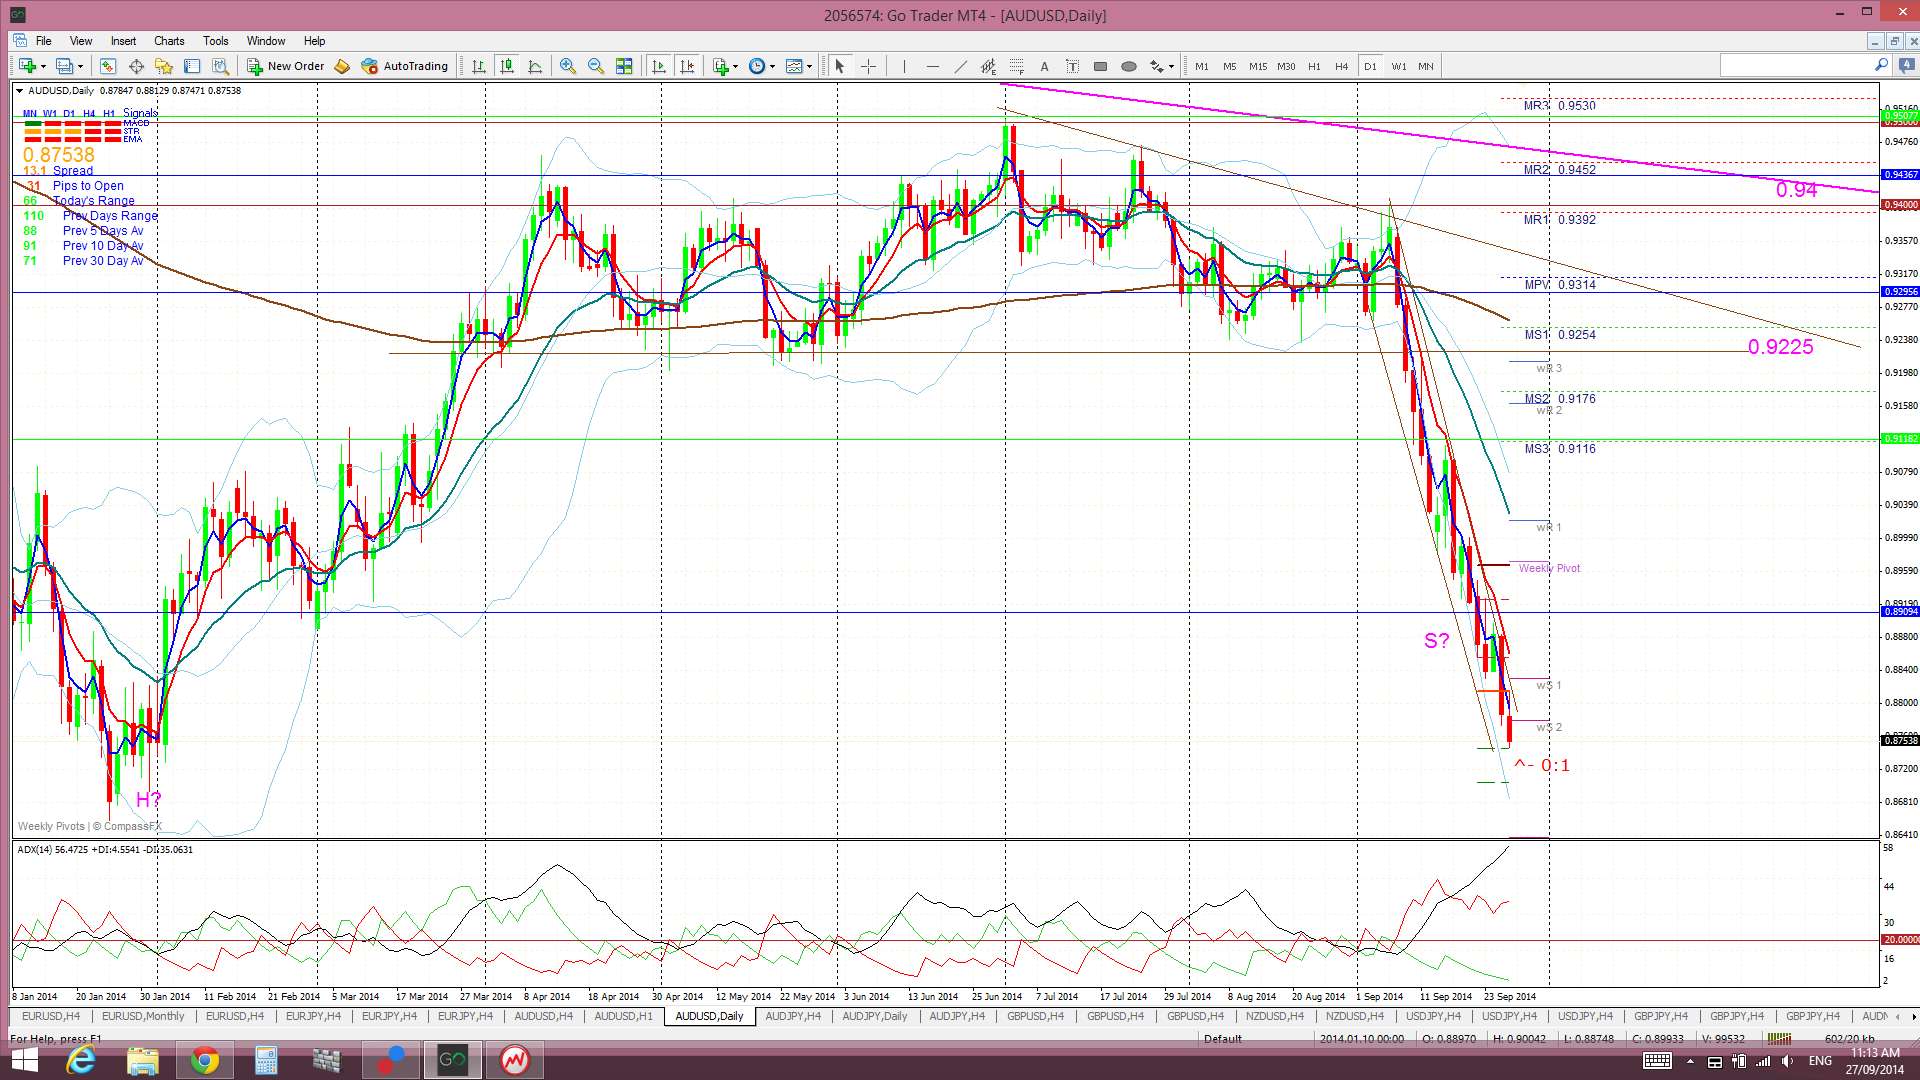
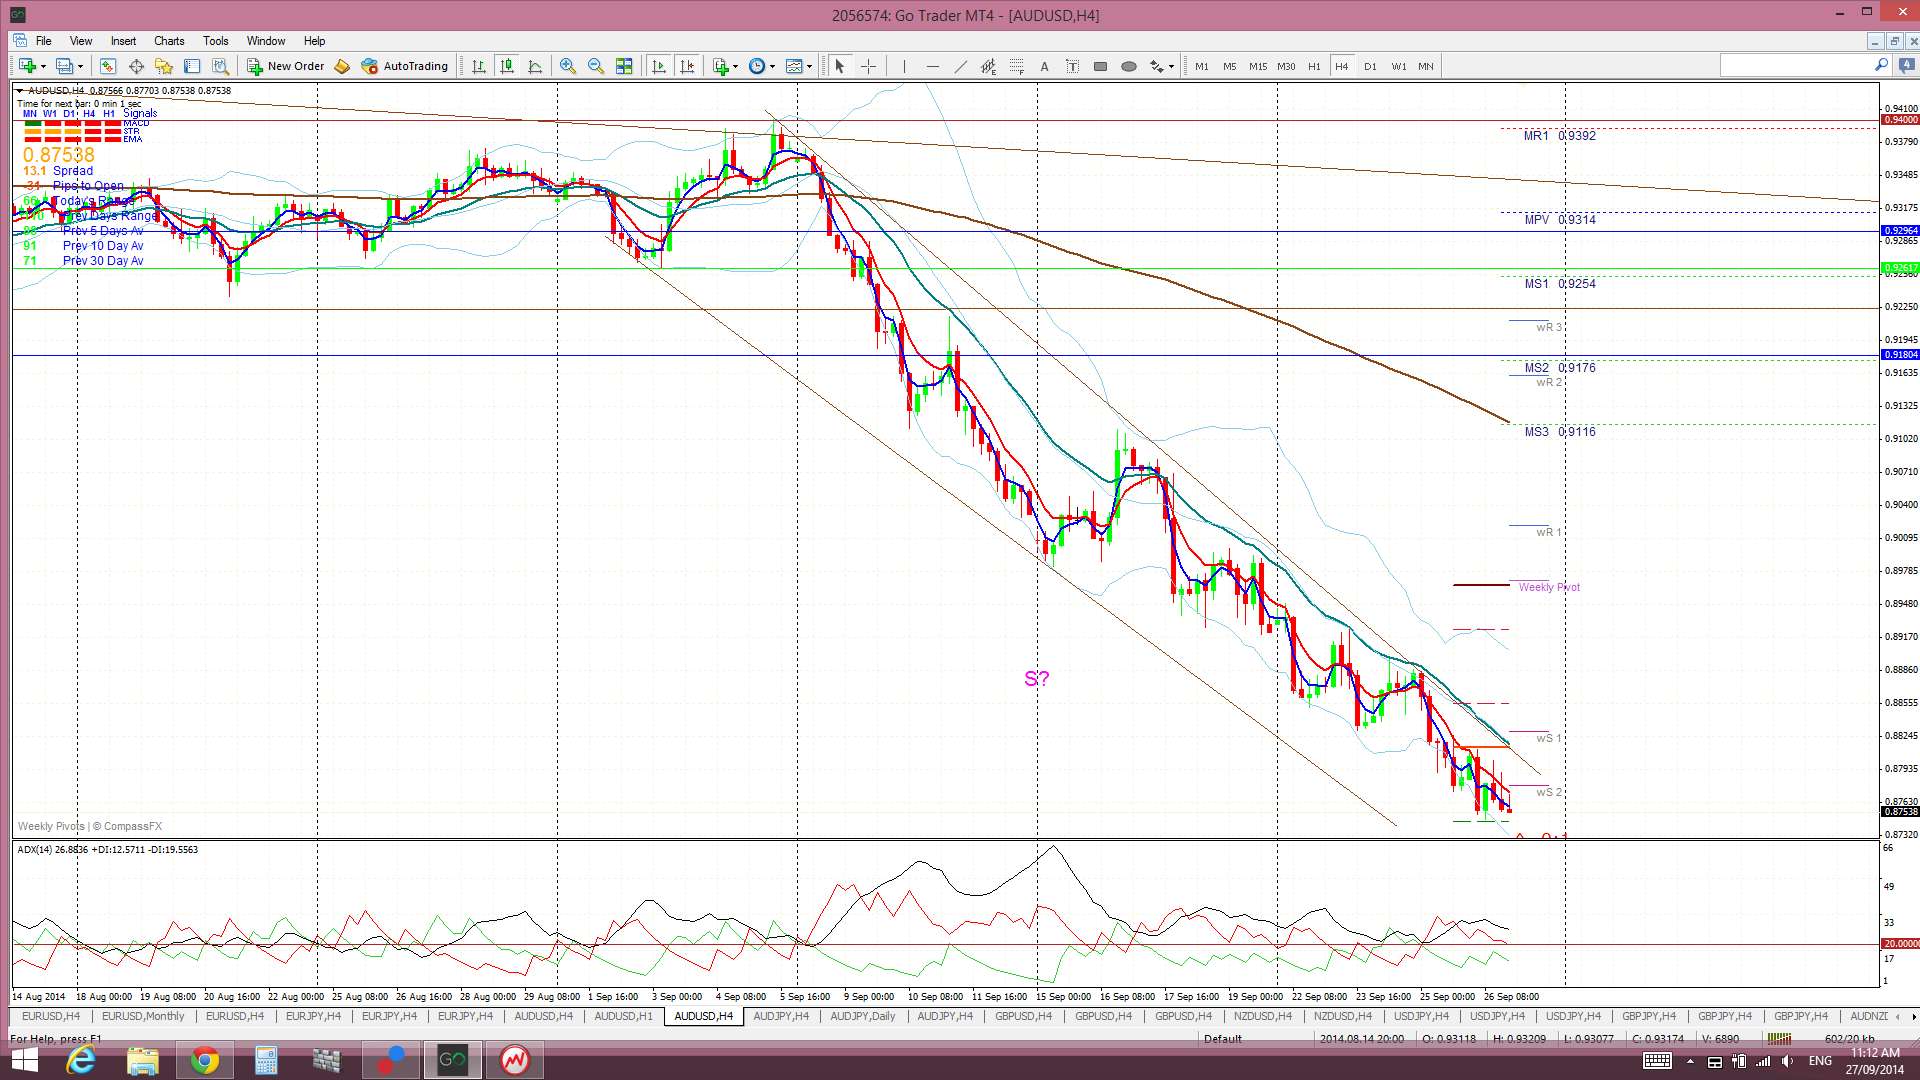
A/U: the A/U had a bearish week and continued trading lower but still within the descending trading channel.
As with the E/U and Kiwi, any pause with the USDX could offer some relief for this pair.
The A/U is below the Ichimoku Cloud on the 4hr, daily and weekly charts and is edging towards the bottom of the Cloud on the monthly chart.
The weekly candle also closed here as a large bearish candle and well outside the Bollinger bands. Thus, a pull back or pause may be in order here.
- I’m watching for any new TC signal and the trading channel trend lines (4hr chart).
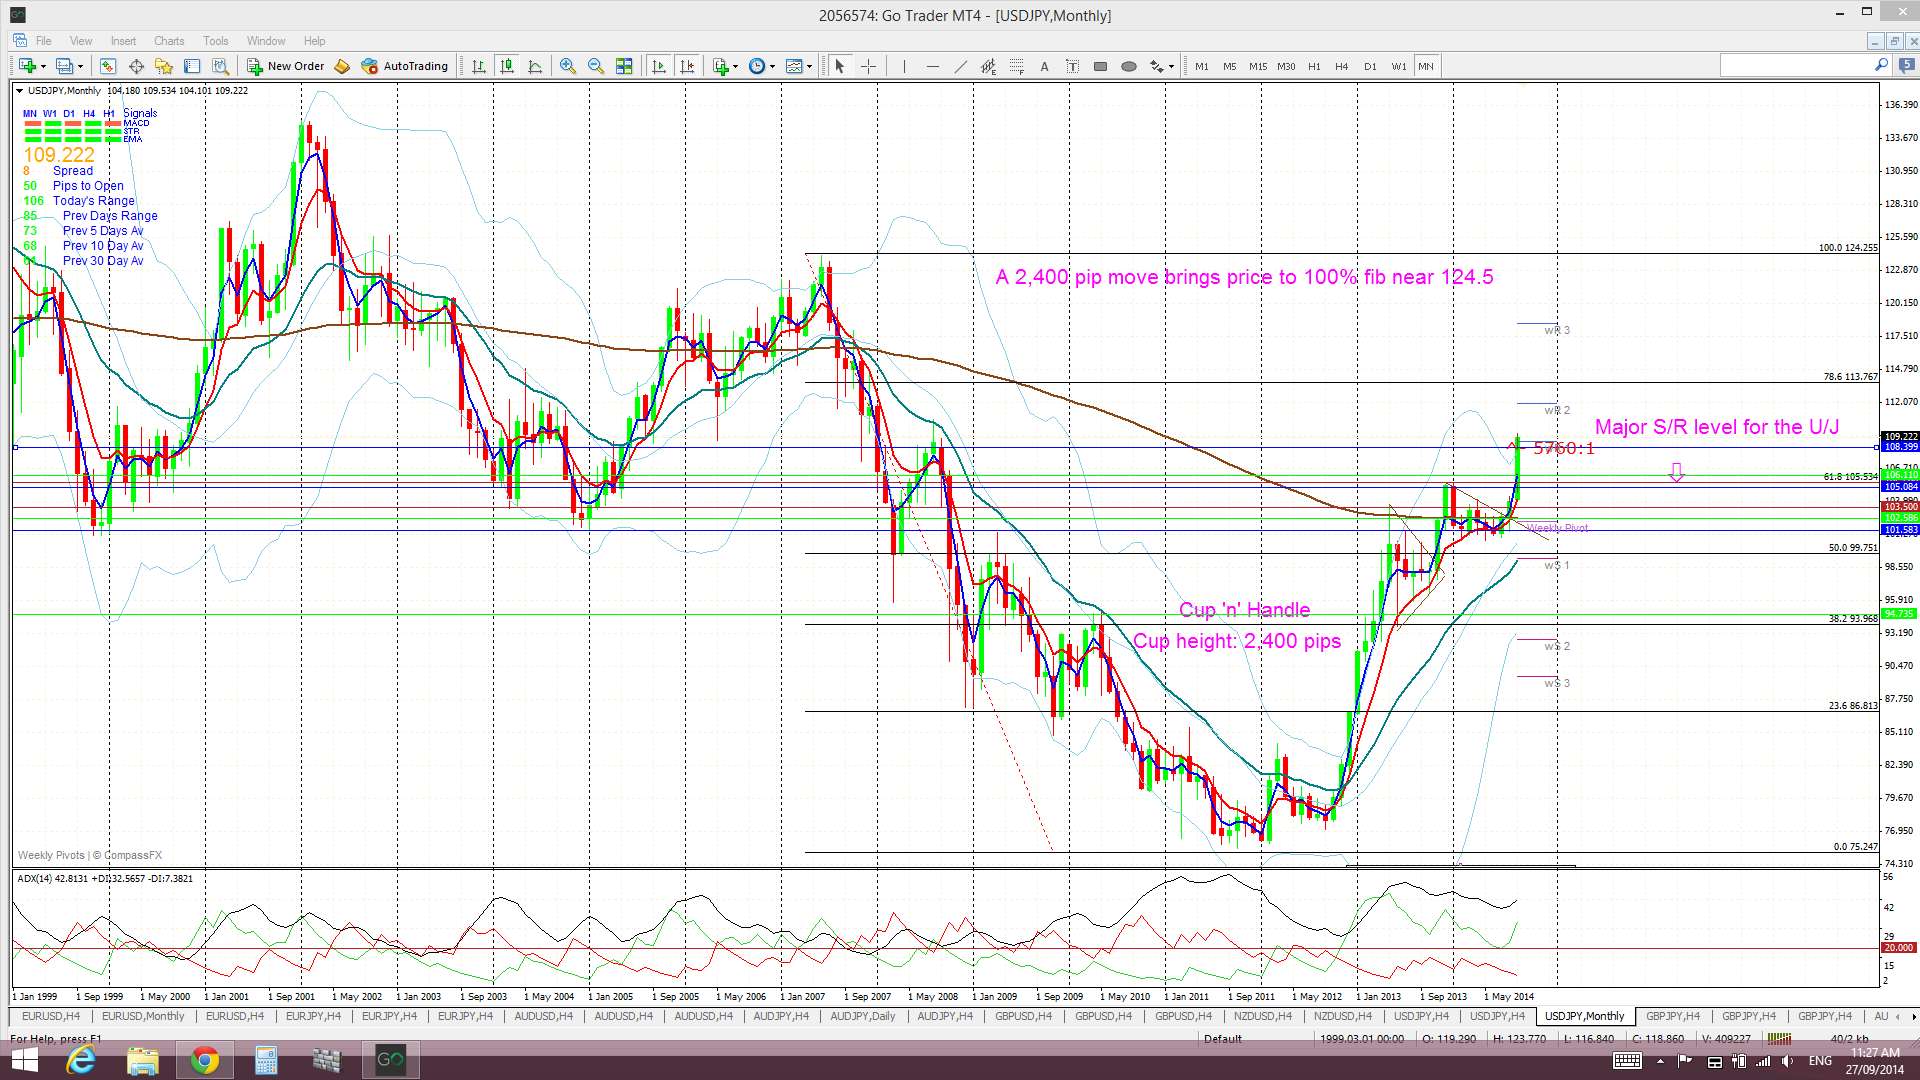
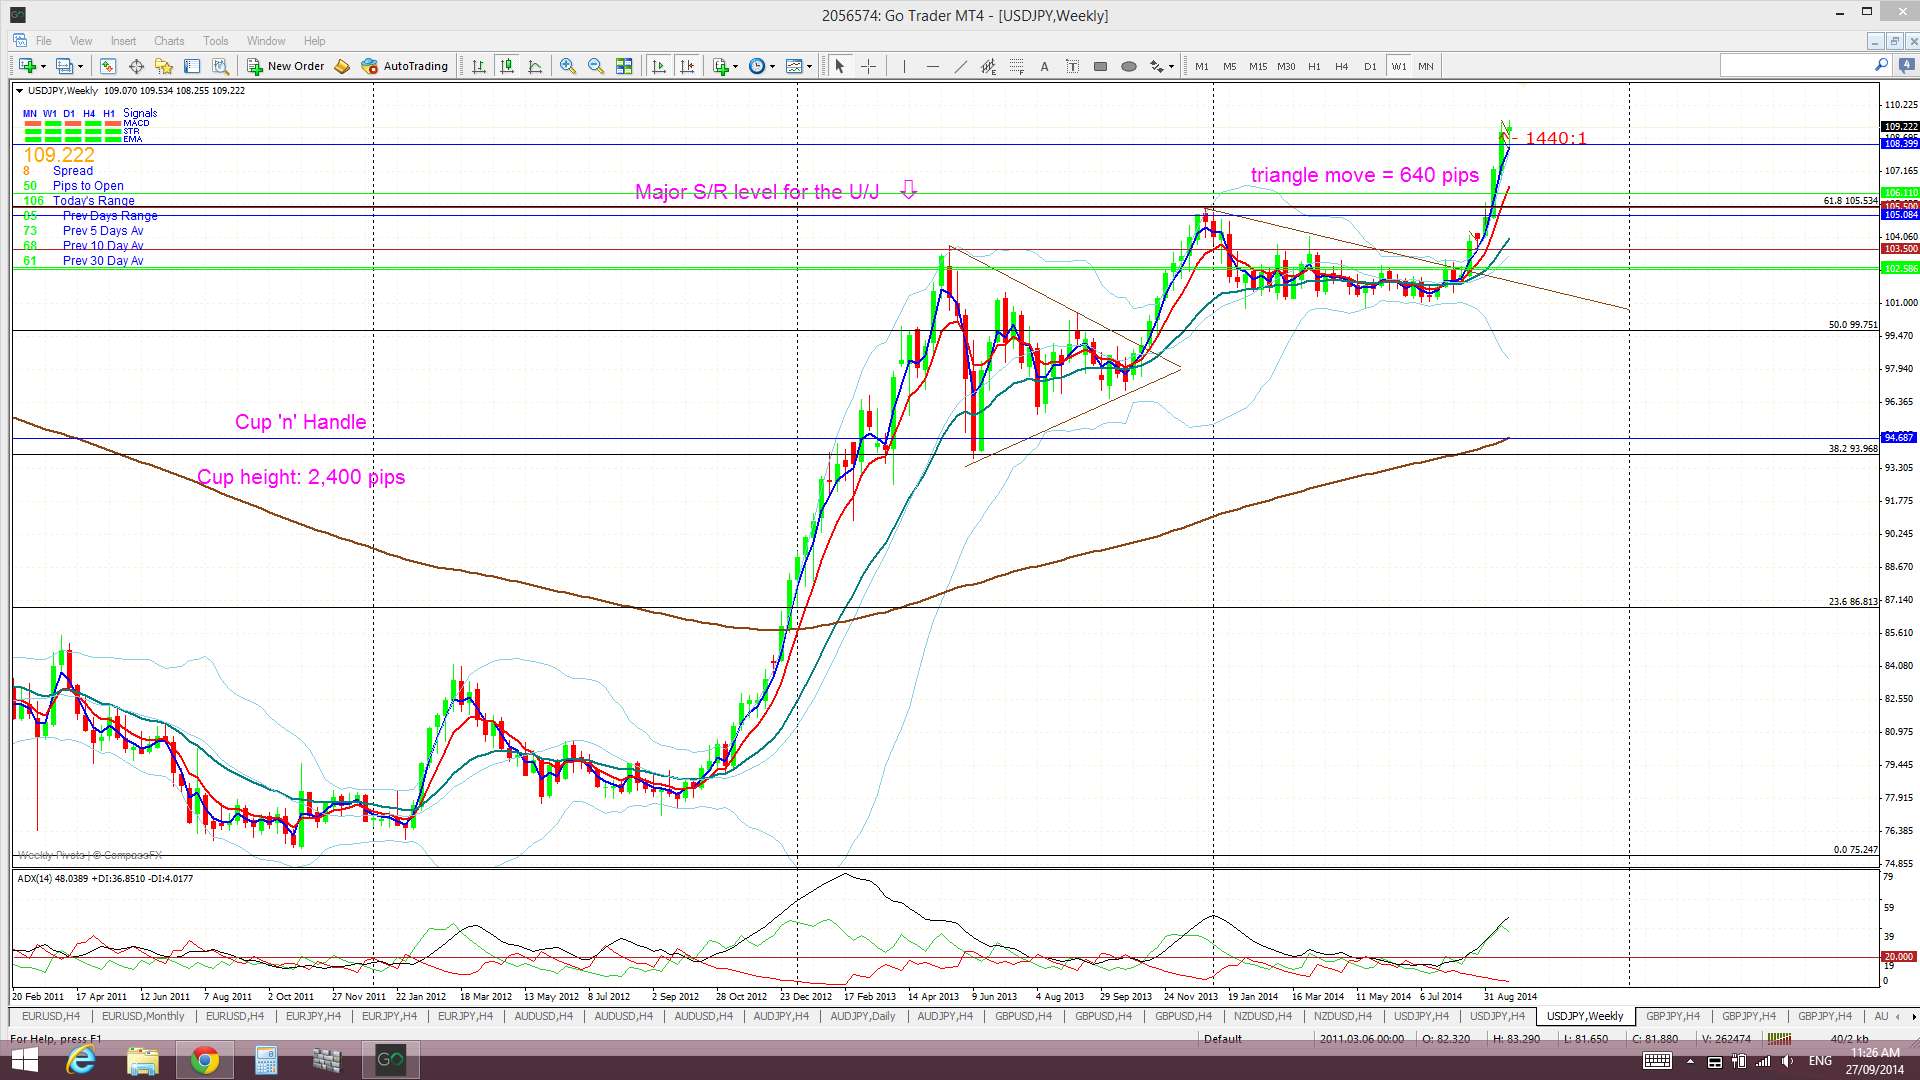
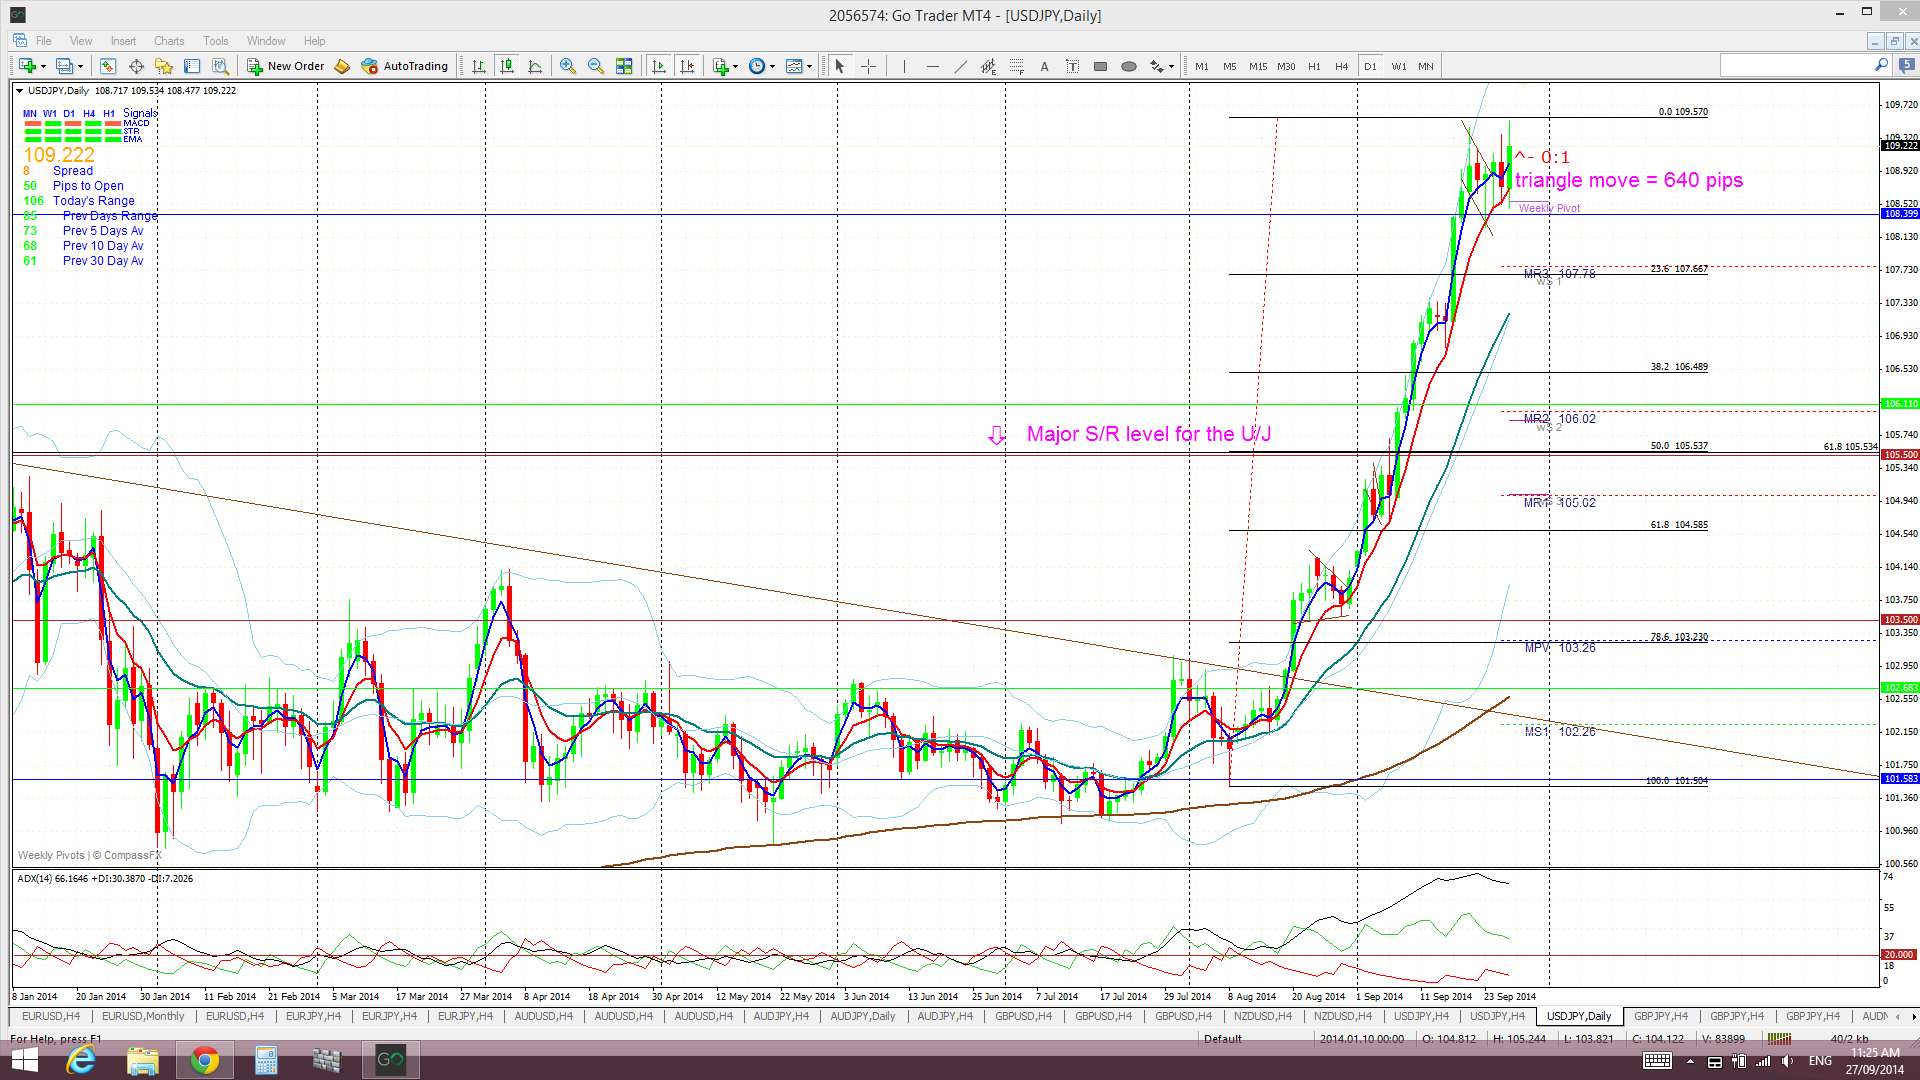
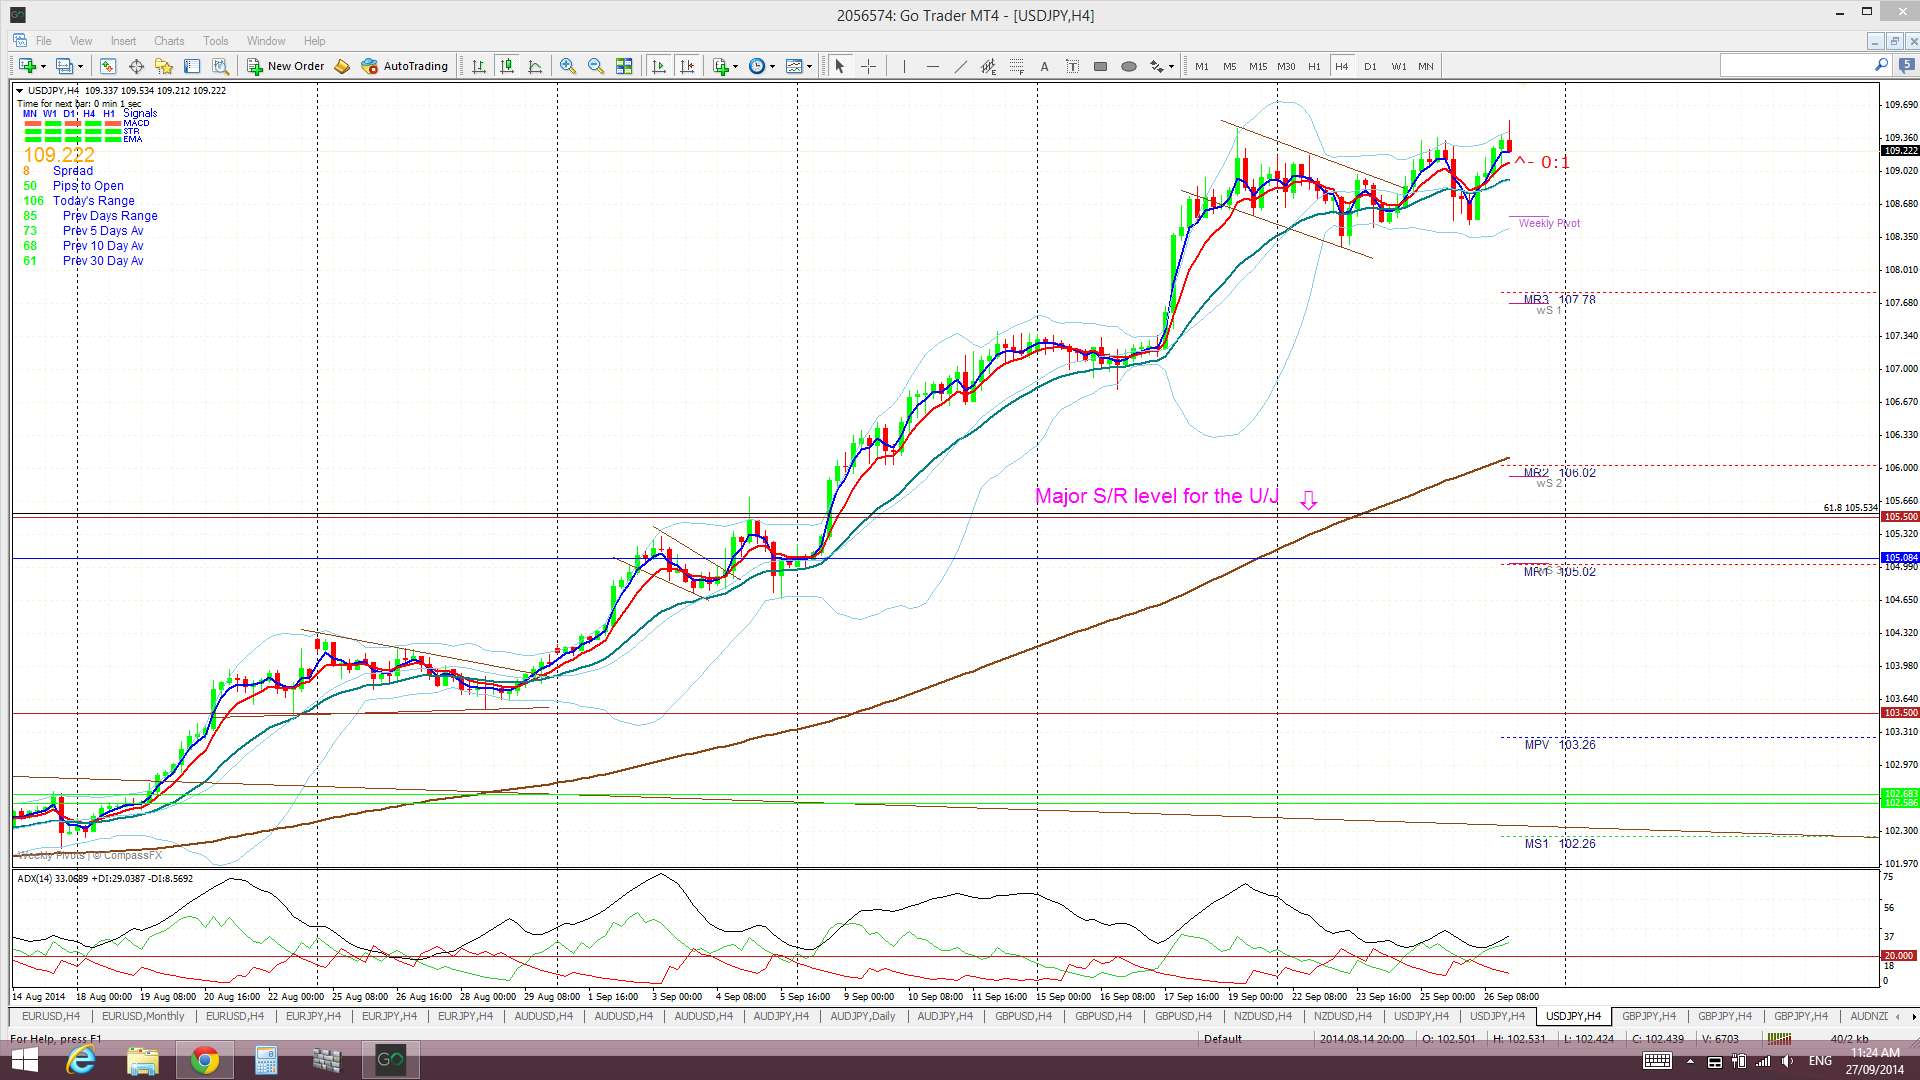
U/J: the U/J spent much of the week consolidating under the 109 level but made a weekly close above this resistance level.
I am still thinking we could get a pull back here even if there is to be ultimate bullish continuation as per my bullish Cup ‘n’ Handle pattern setting up on the monthly chart. The 105.5 is still the target zone for any pull back and this is now the 50% fib pull back on the recent bull run.
Weekly Chart Bullish Cup’ n’ Handle pattern: I am still seeing this pattern building on the weekly chart and the recent weekly chart triangle breakout supports the continued development of this pattern. The theory behind these patterns is that the height of the ‘Cup’ pattern is equivalent to the expected bullish move from the ‘handle’ breakout. The height of the Cup for the U/J weekly chart is around 2,400 pips. The interesting point here is that a 2,400 pip bullish move up from the ‘Handle’ would put price up near the 124 level. This level is the last major swing high for the U/J from back in 2007 and represents the 100% fib pullback for the move down in 2007 to the lows of 2012. Possible targets along the way include the 61.8% fib retrace level at the 105.5 region and the 78.6% fib up near the 112 region.
The weekly candle closed as a small bullish candle but is still outside the Bollinger bands. Thus, a pull back or pause may be in order here too.
- I’m watching for any new TC signal and the 105.5 level.
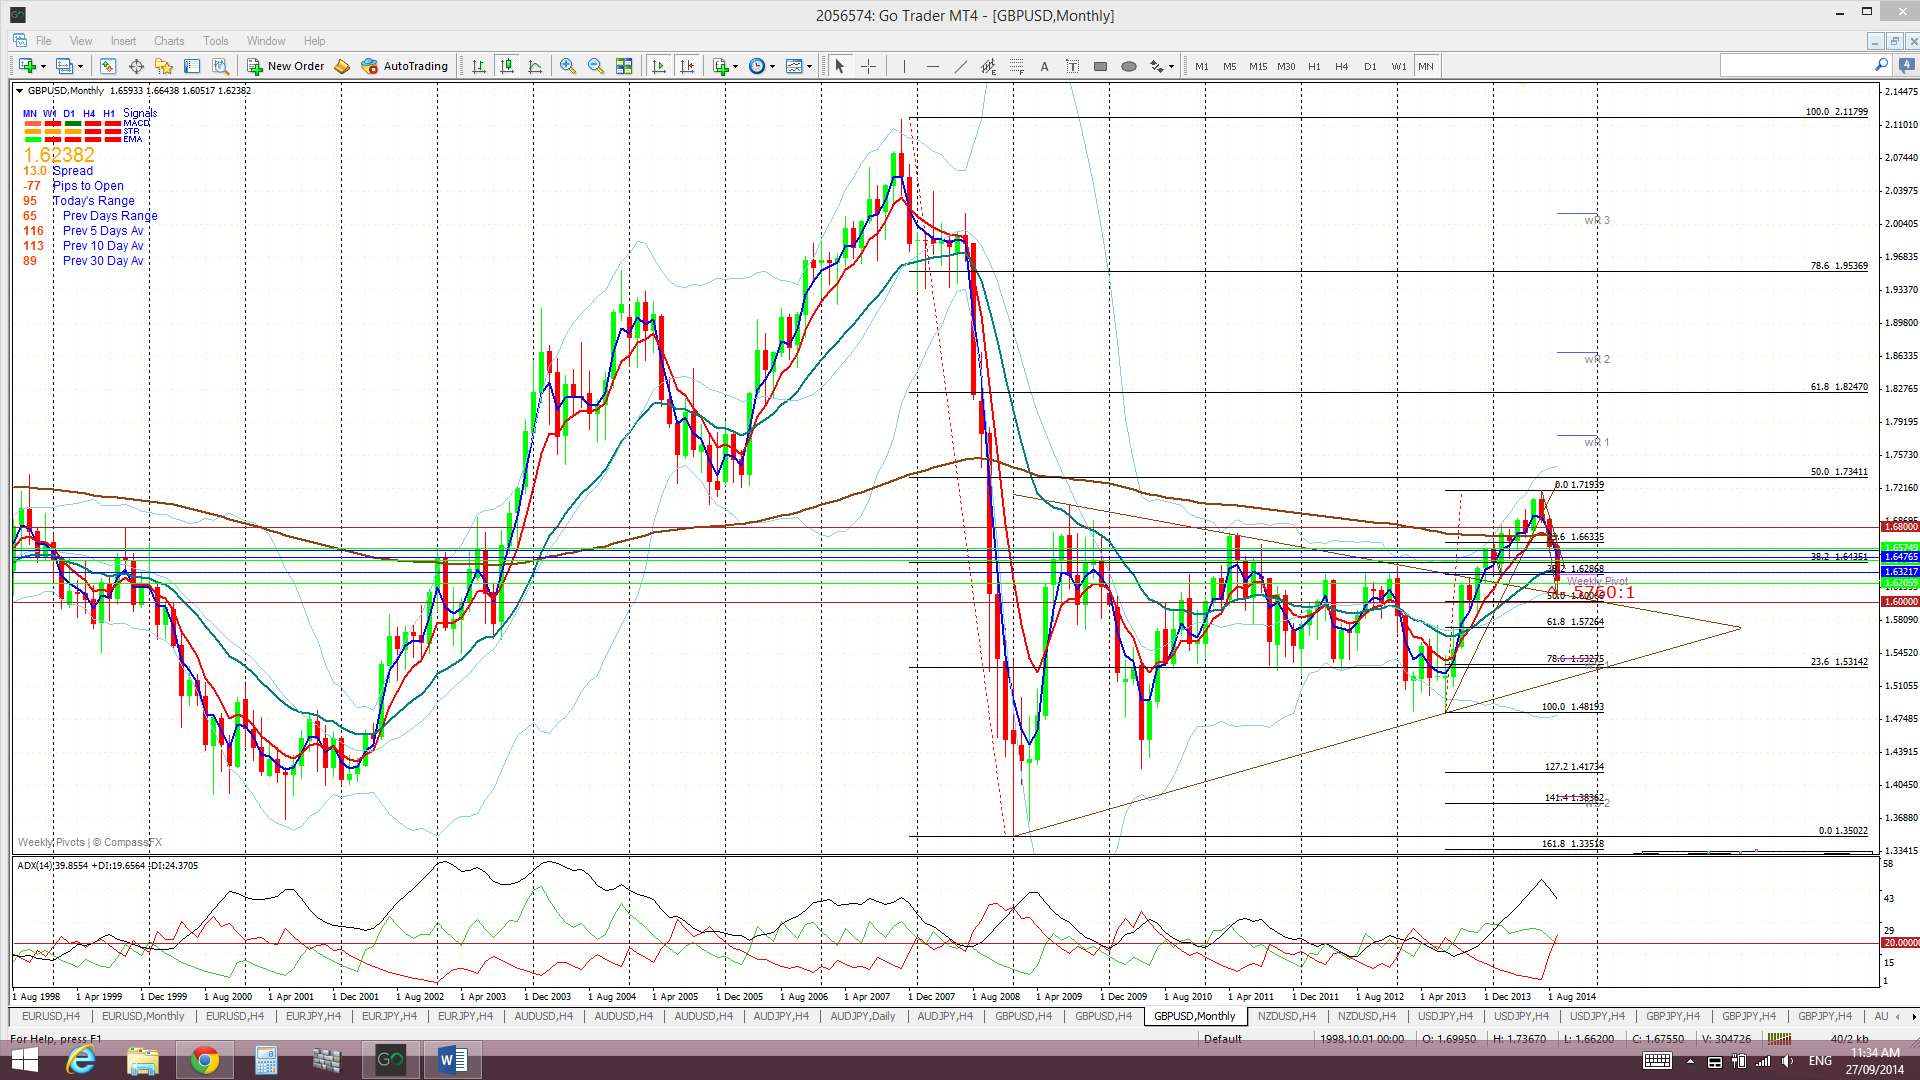
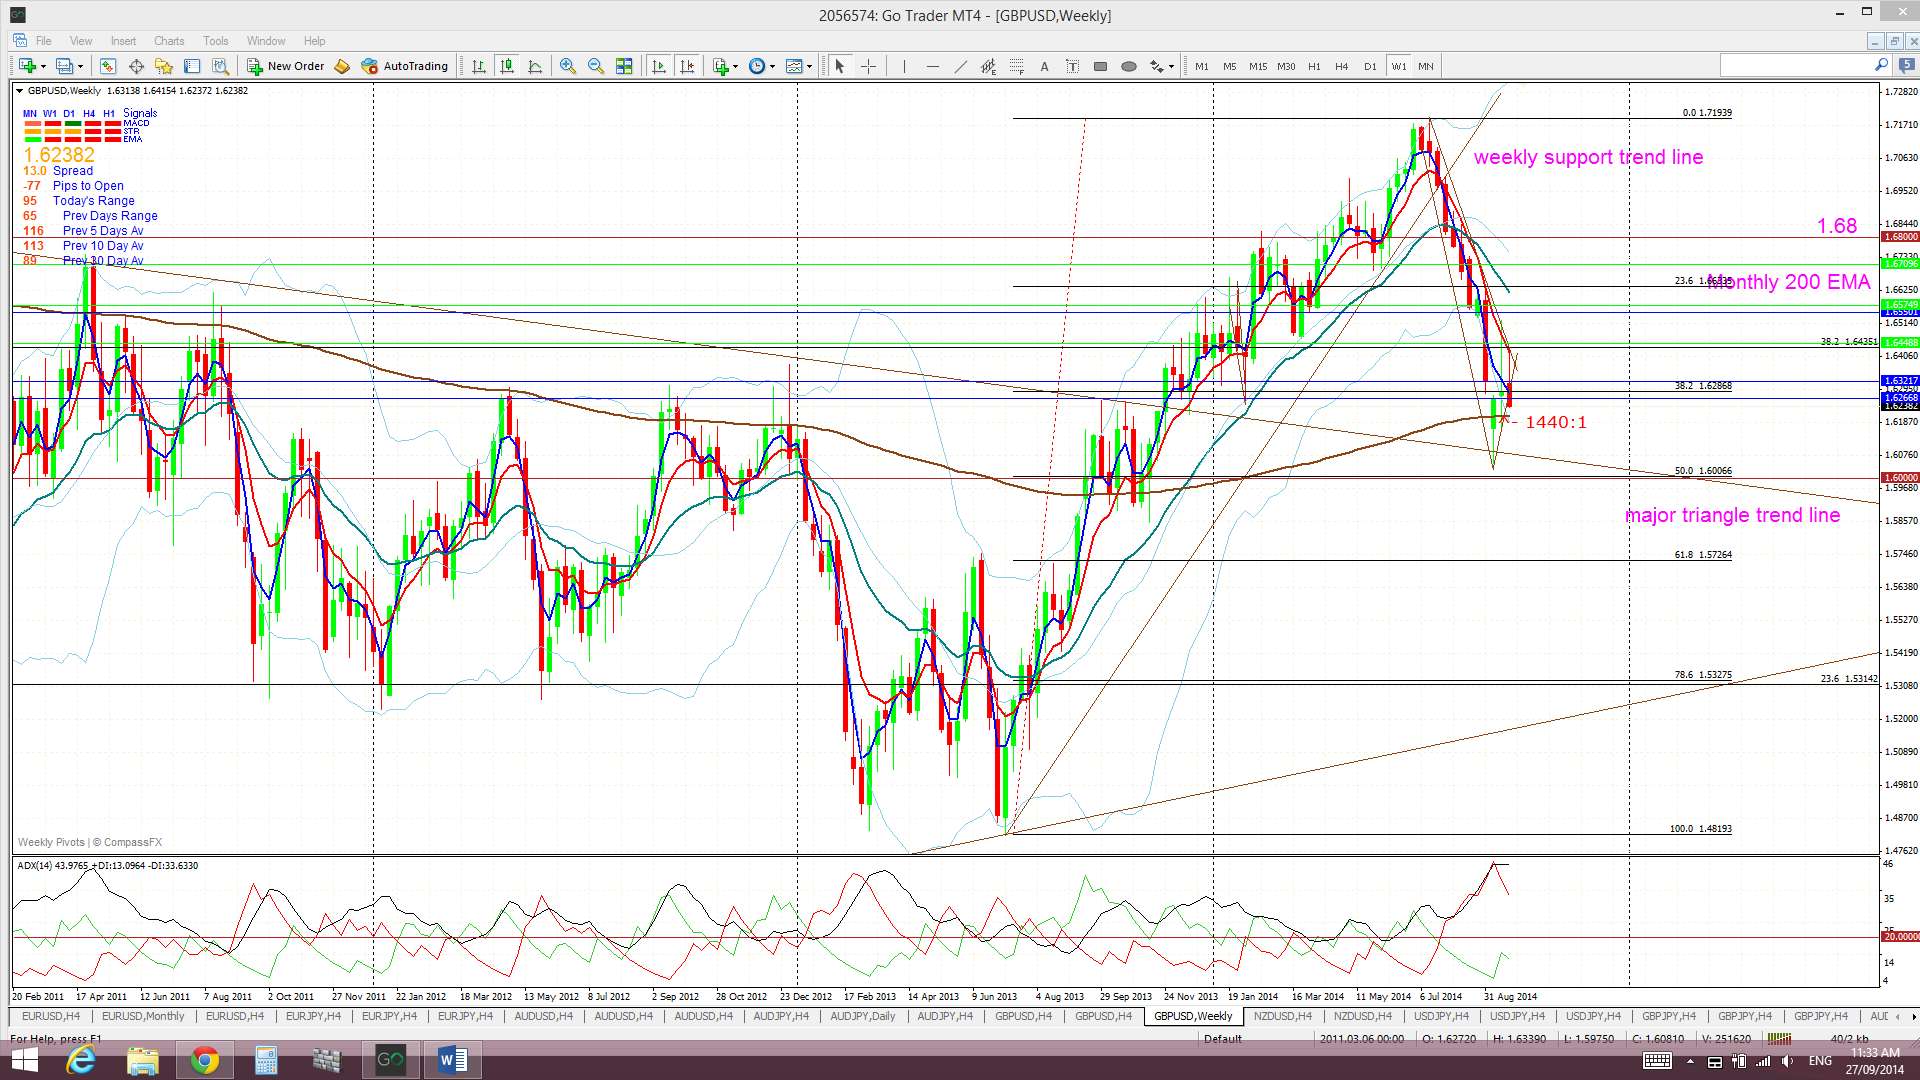
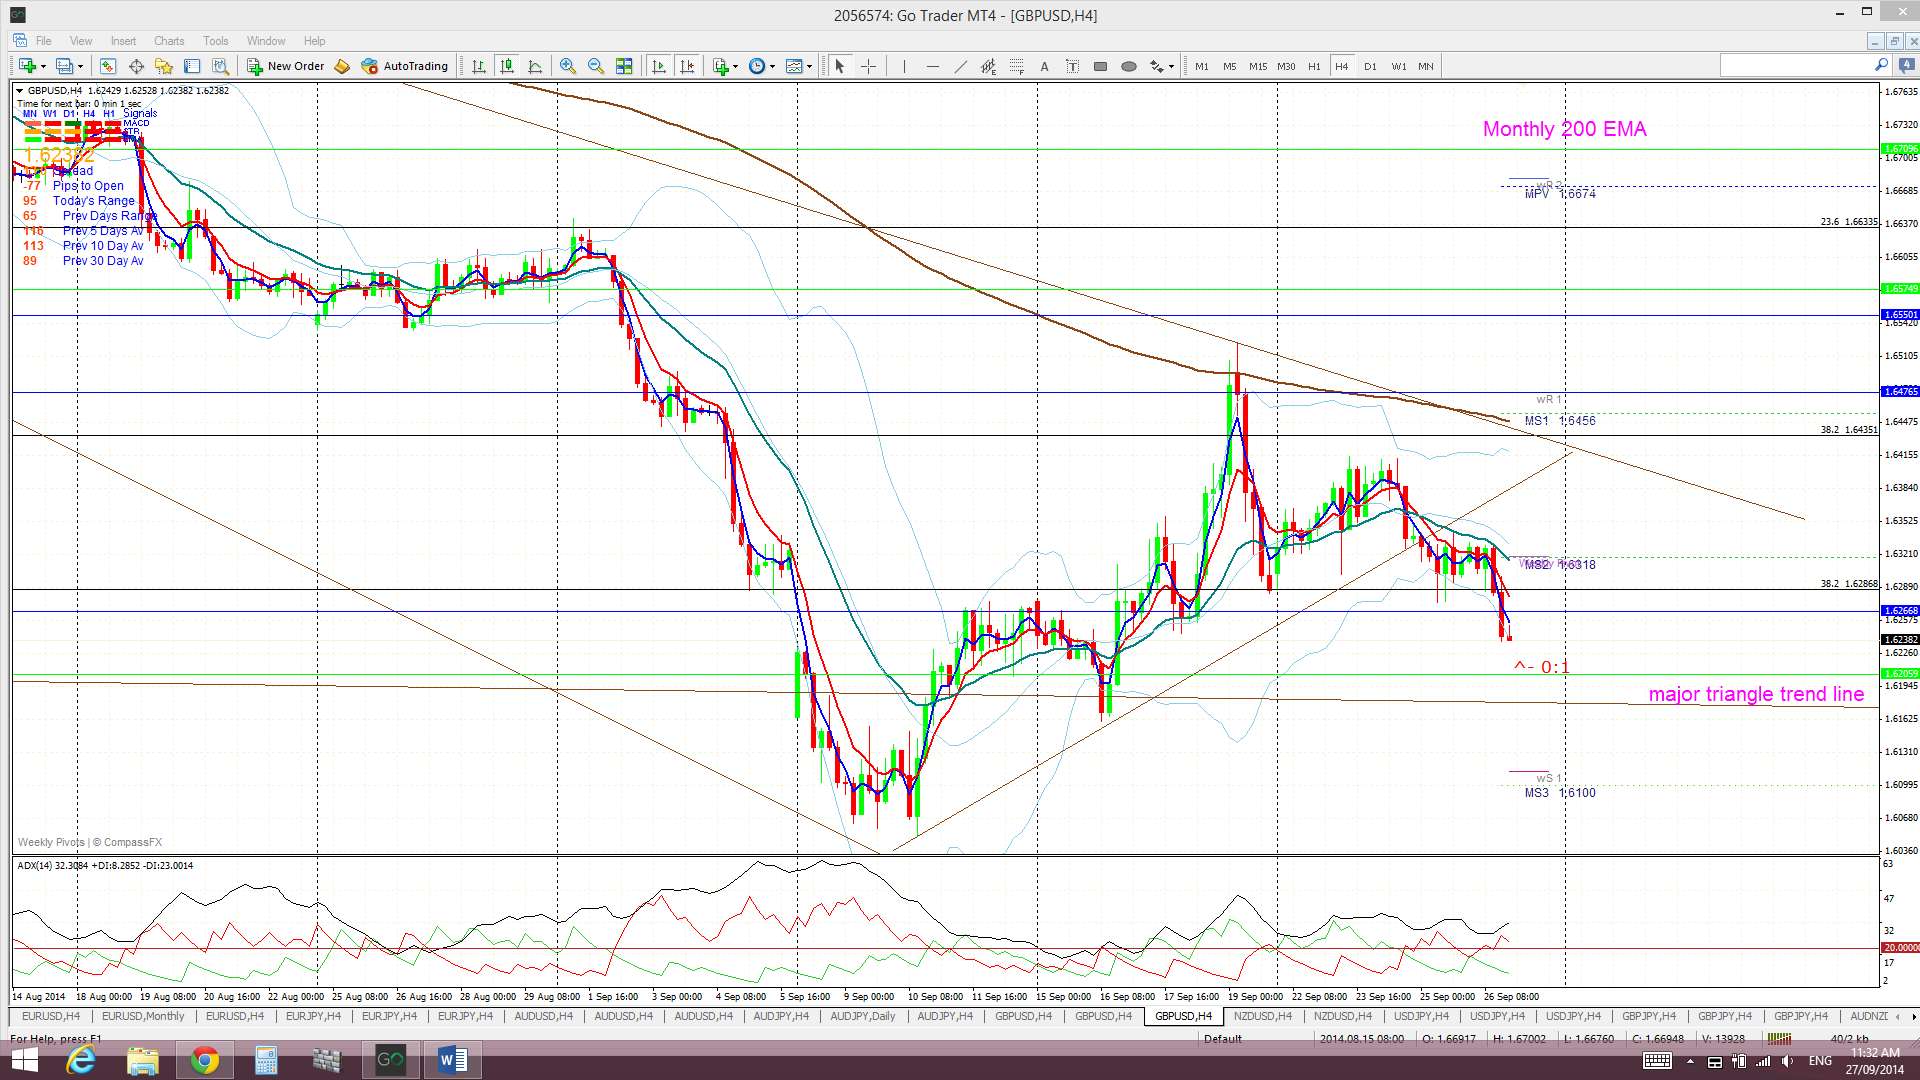
Cable: the G/U chopped lower last week and fell below a 4hr support trend line. I am still seeing this form up within a bullish broadening descending wedge on the daily chart though. Any potential USD index weakness could help to develop this bullish pattern here.
Bullish targets for any return back above the monthly 200 EMA: This level remains a key level to watch here and any new move back above this level would be quite bullish. It is important to remember that February was the first monthly close above this S/R level since September 2008 and, also, the highest monthly close since the bear move of 2007-2009. These were major achievements. A possible target for any continued bullish movement is best determined from the monthly chart. The 50 % fib level of the 2007-2009 bear move is up at around the 1.73 region and the 61.8 % fib is at the 1.82 region. Both of these levels might be possible profit targets. The 61.8% fib level is still almost 2,000 pips away.Â
Price is trading below the Cloud on the 4hr chart and daily charts but in the Cloud on the weekly and monthly charts so choppiness may be expected
The weekly candle closed as a bearish, almost, engulfing candle.
- I’m watching for any new TC signal on this pair and the descending wedge trend lines.
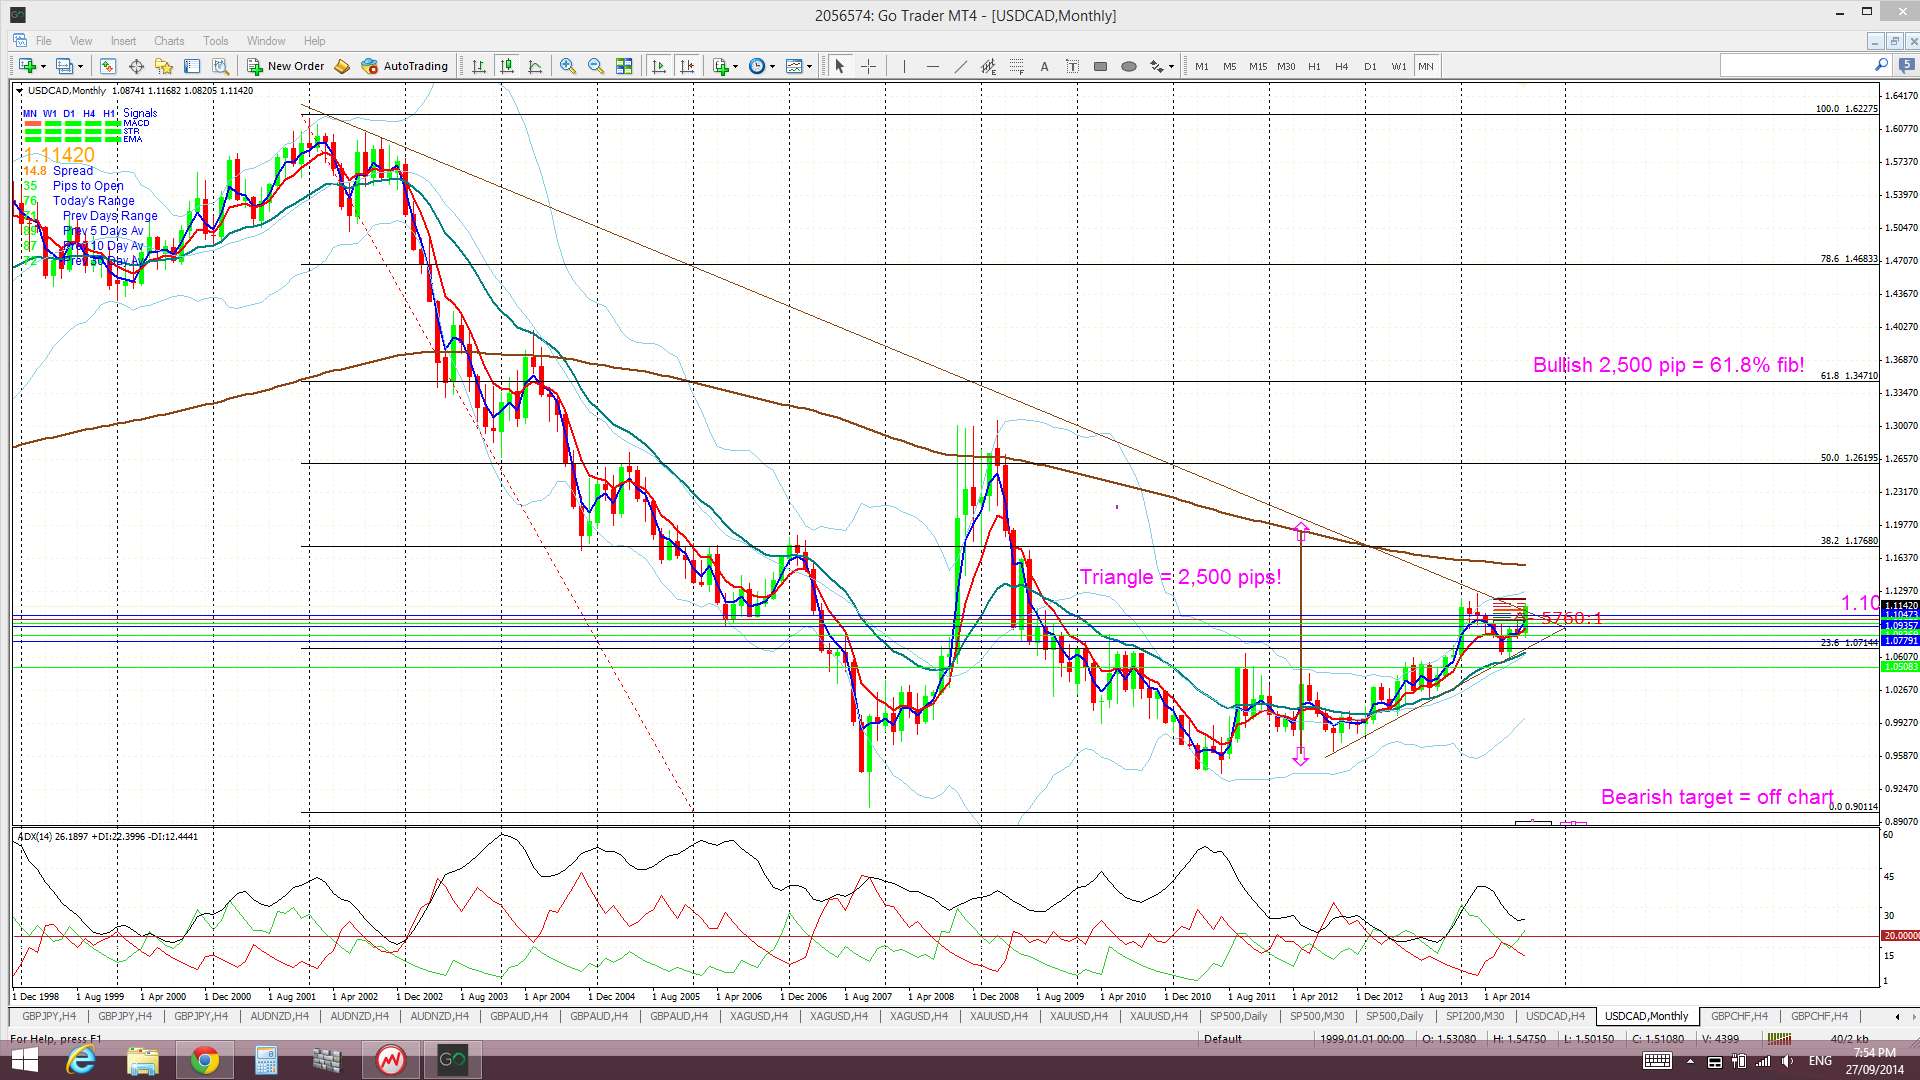
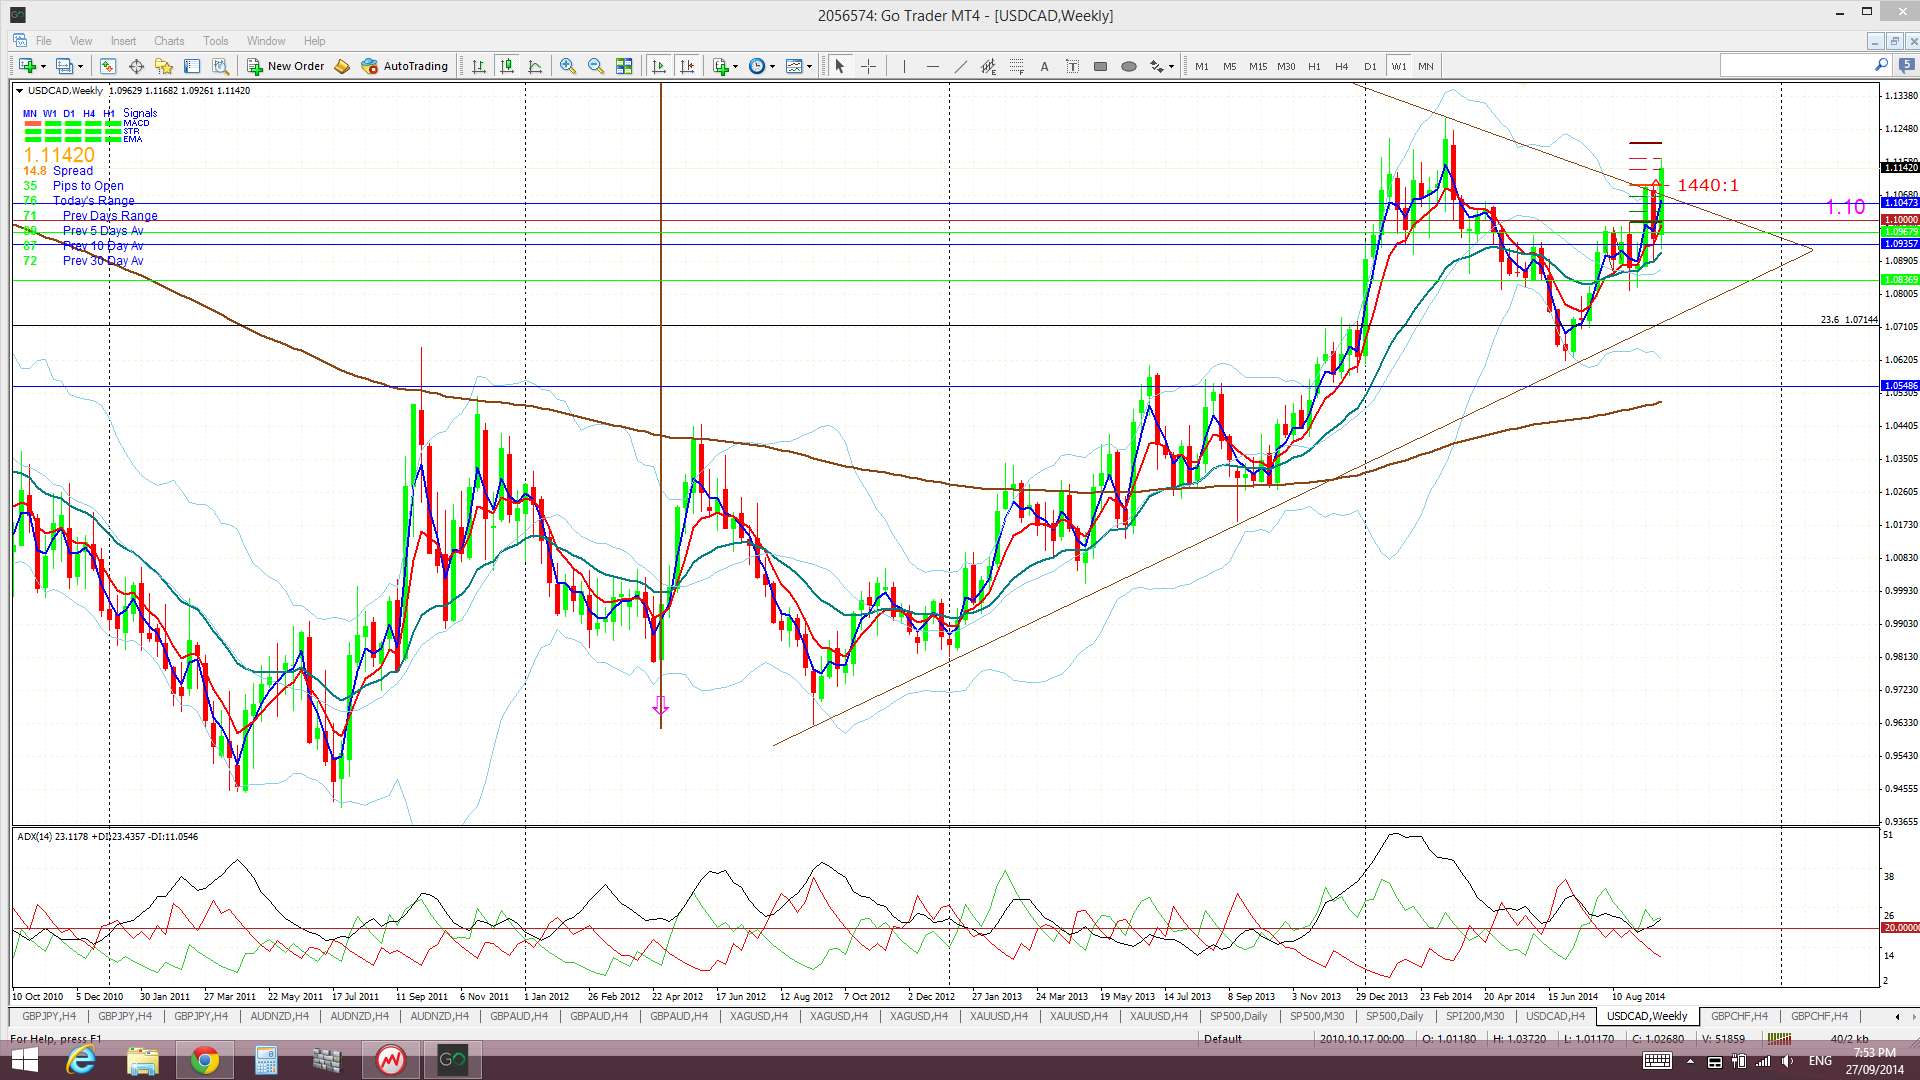
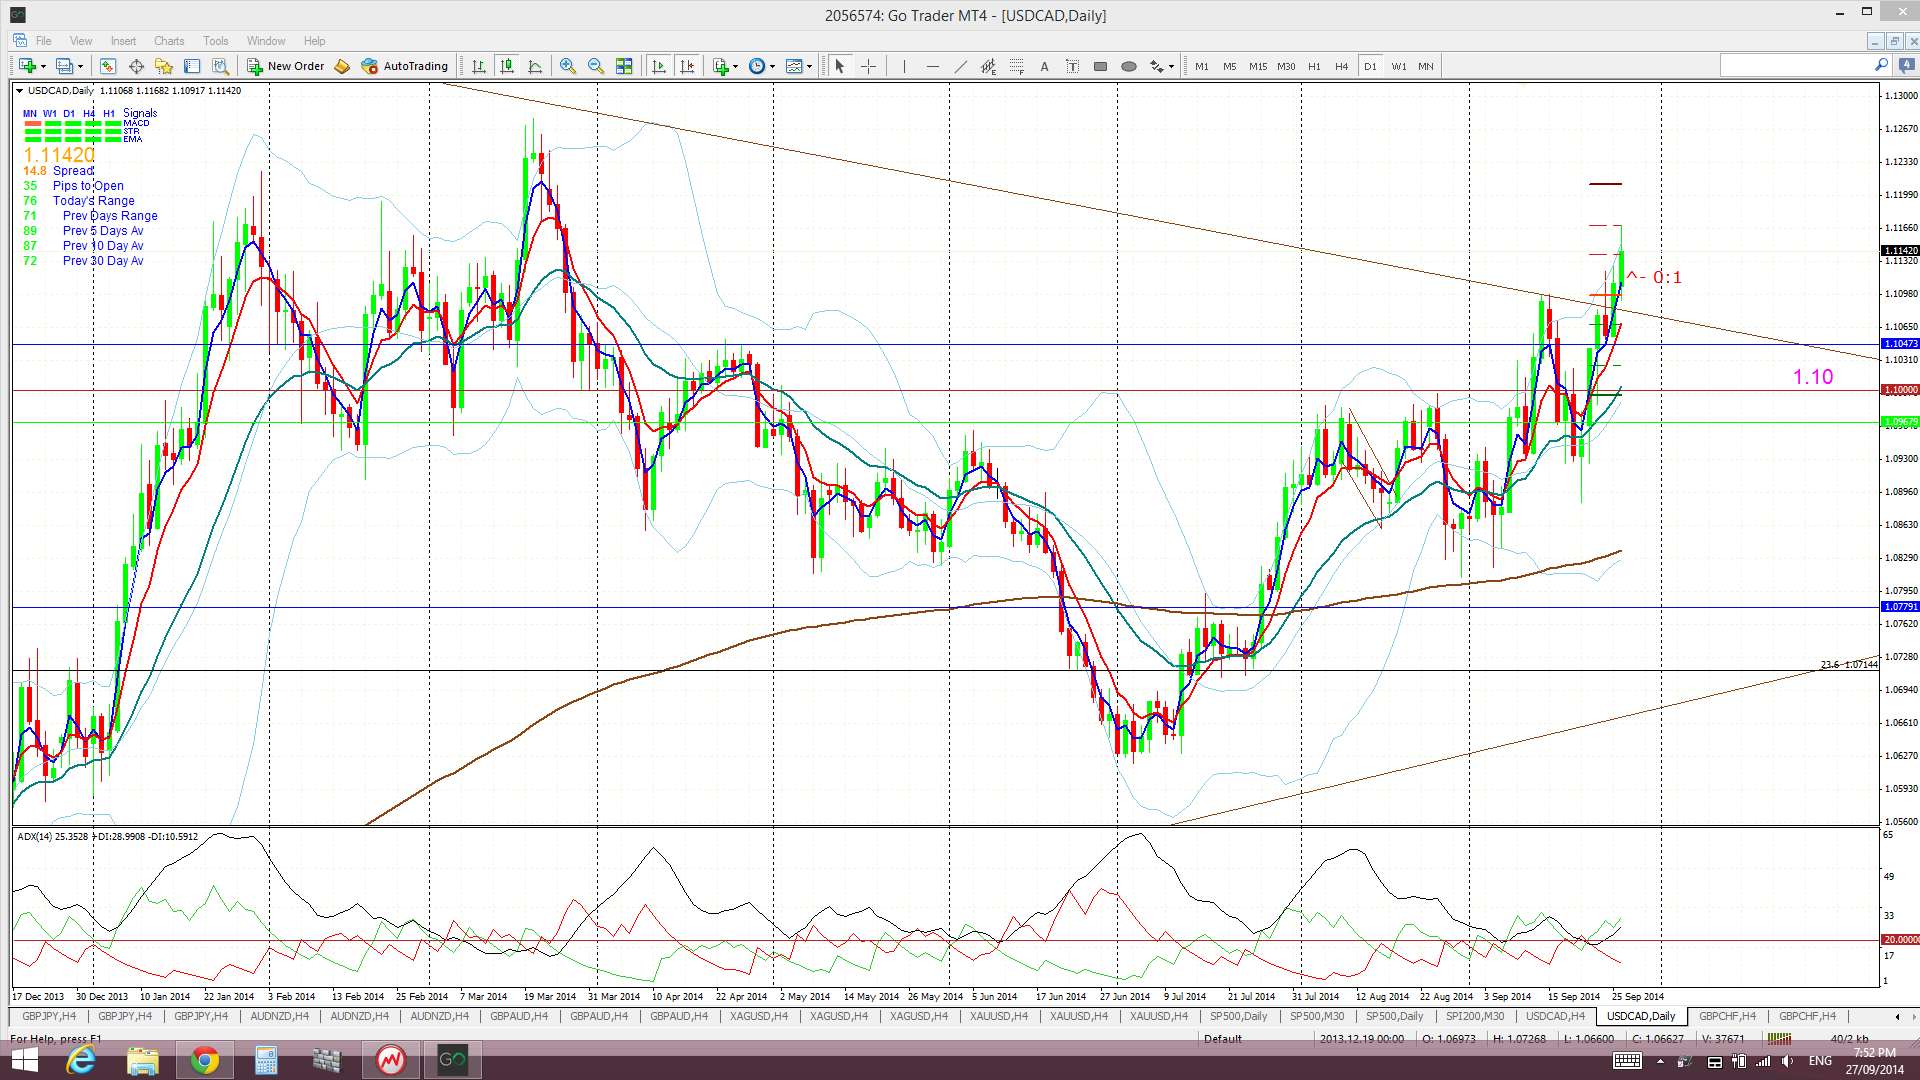
Loonie: The USD/CAD made a bullish weekly close up and out of the monthly triangle pattern. Traders need to see whether it can make a monthly candle close up and out from this triangle though and Tuesday marks the day for this monthly close. I will be looking for a pull back to test this monthly chart triangle trend line.
Triangle breakout target: There is a 2,500 pip triangle breakout move brewing on the monthly chart. This 2,500 pip figure is evaluated from the height of the triangle. I have used the triangle height from the beginning of the bull trend line, as shown in the monthly chart below. The height of the triangle is around 2,500 pips and, thus, this would be the expected move from any breakout action. This is where it gets interesting! Extrapolating a bullish move from this triangle places price up at the 61.8% fib level. These fibs levels are popular targets in retracement moves and so this adds some confluence to this as a possible target. The bear trend line of the triangle pattern is now just above current price BUT has been in play since 2001 so may offer some resistance to any potential bullish continuation.
Price is now trading above the Cloud on the 4hr, daily and weekly charts which is bullish. Price is close to making breaking out above the monthly Cloud as well.
The weekly candle closed as a large bullish candle but outside of the Bollinger band so a pause or pull back may be in order here too.
- There is an open TC signal here but I’m still watching the 1.10 level and the monthly chart’s triangle pattern.
Stocks and broader market sentiment:
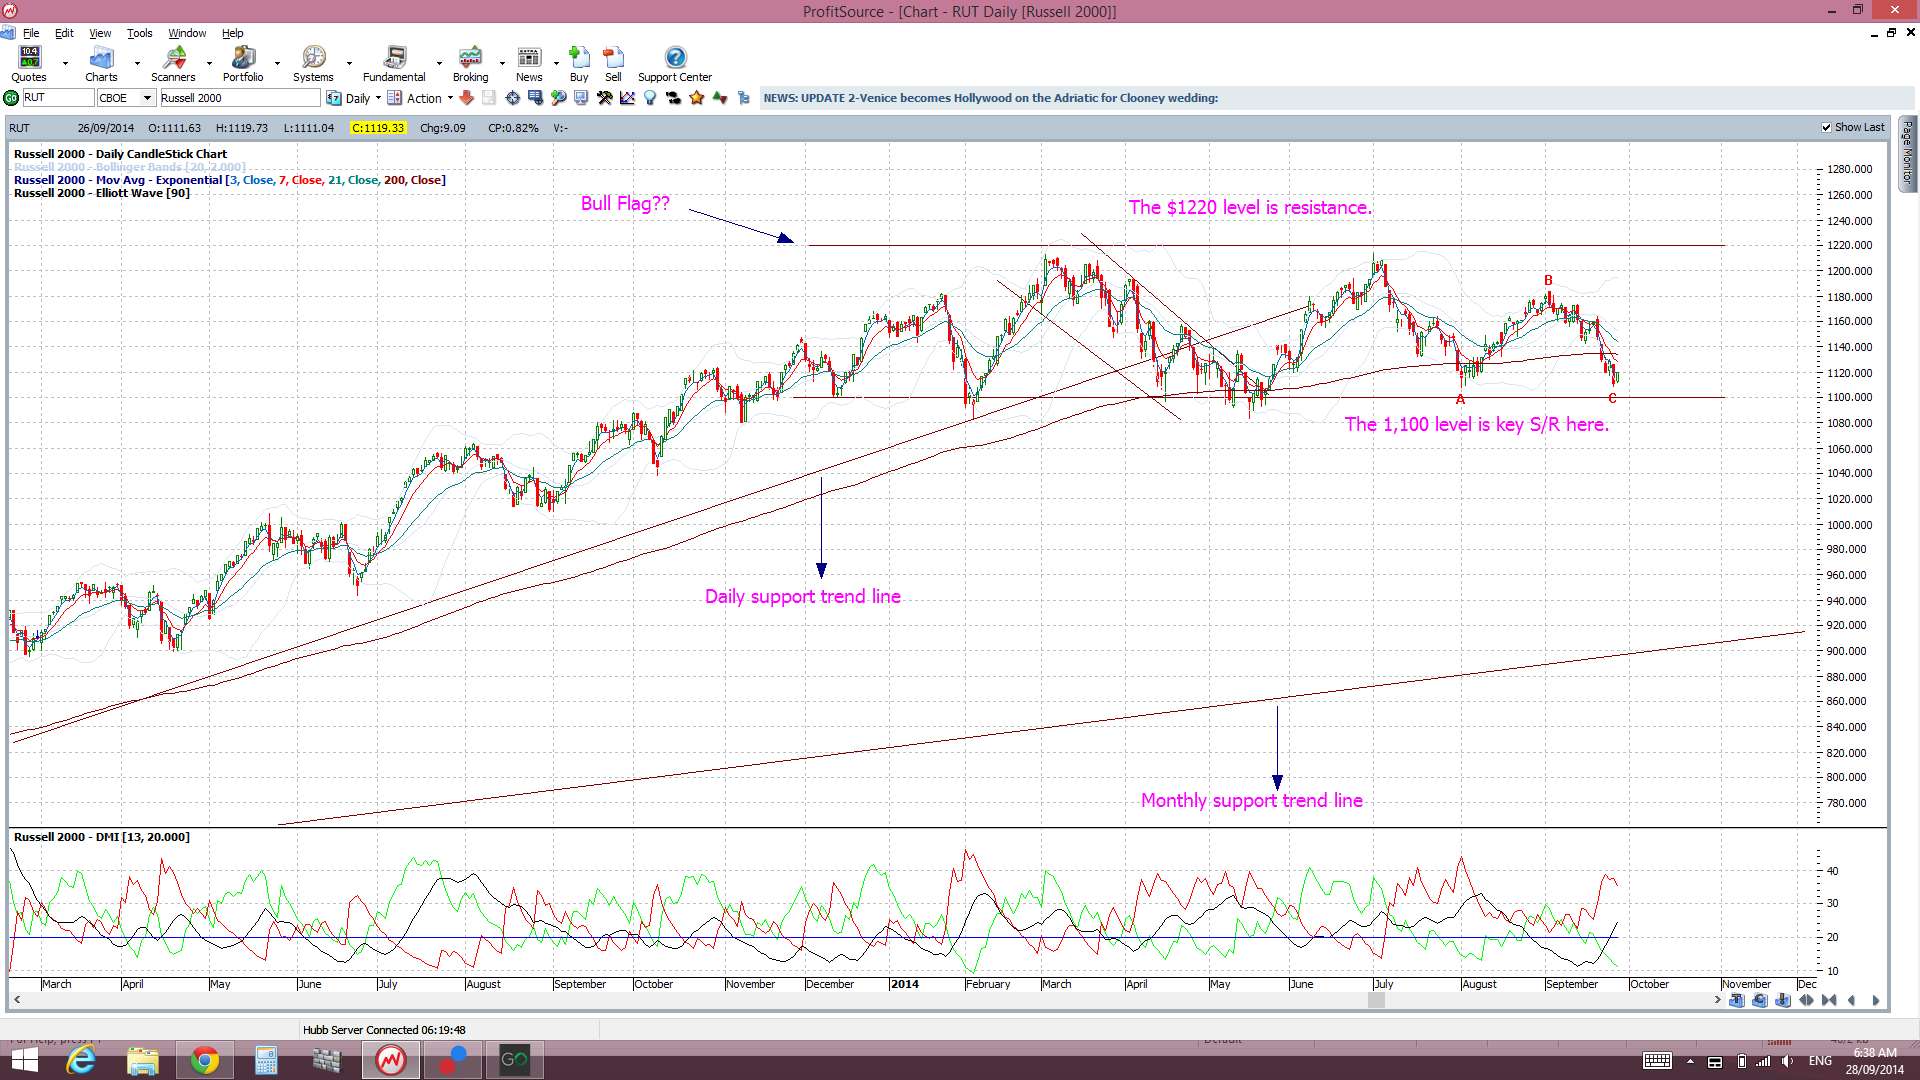
The S&P500 index has closed back below the key psychological level of 2,000. The S&P500, DJIA, NASDAQ and Russell 2000 have all printed bearish weekly candles but they still remian trading above daily support trend lines.
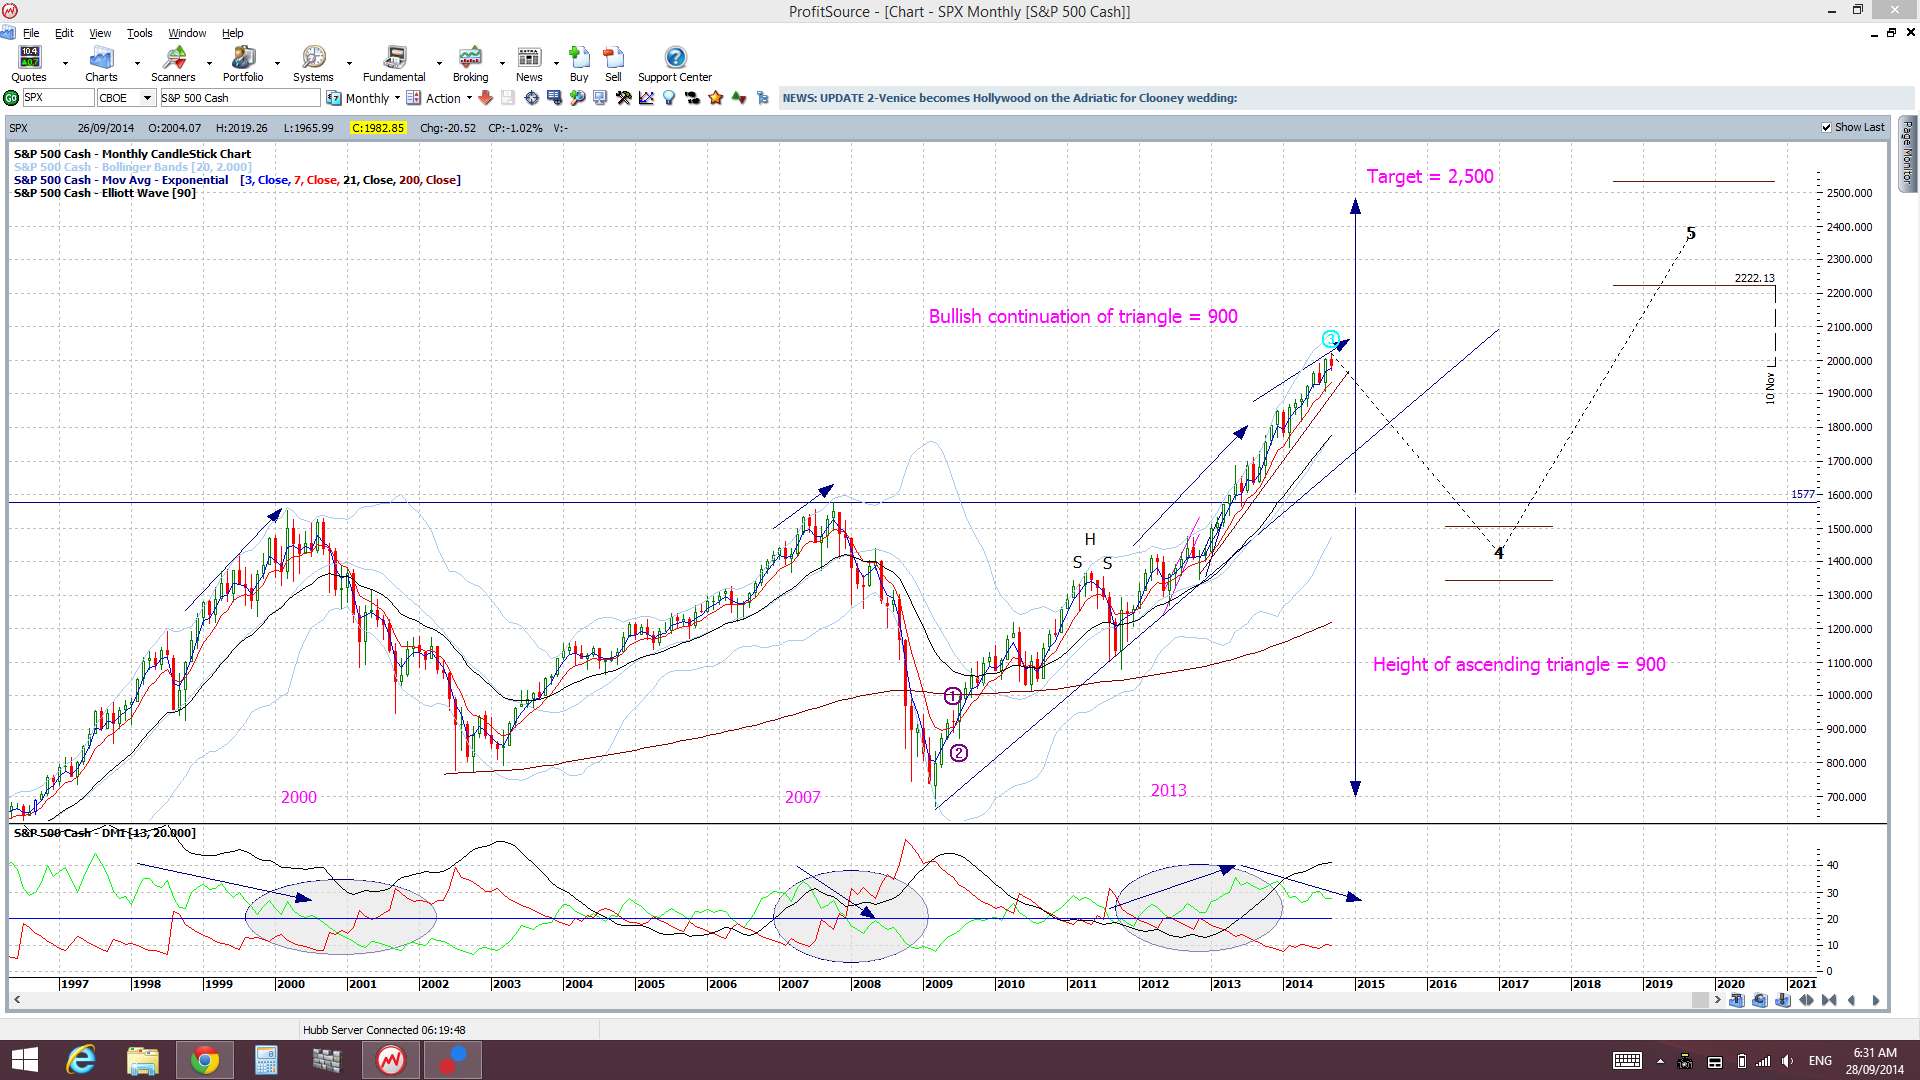
I am still seeing divergence on the monthly S&P500 monthly chart though and whilst this might just be warning of a pause, as the index navigates these new highs up at the 2000 region, the chance of a pullback cannot be ruled out either. There has not been any real deep pull back since the break up through the 1,577, 1,600, 1,700 and 1,800 levels and the major break of the 1,577 level was only tested once. Thus, I am still being cautious here now even though the daily support of the S&P500 has not been broken.Â
It is worth noting that a 61.8% fib pull back of the recent bull run (Nov 2012-present) would bring price down to near the 1,577 area. This remains significant as it is the breakout level of the previous highs from the 2000 and 2007 peaks. I would expect this region could be a target if there was any pullback on the S&P500.
Thus, with all of this, I continue to watch out for further clues as to any new momentum move, long or short though! In particular I’m looking out for:
S&P500 daily chart: I’m watching for any break of the daily trend line but price is holding above this for the time being. The index also continues to hold above the top trend line of the bullish ascending triangle (1,900).
Ichimoku S&P500 chart: a clear cross of the blue Tenkan-sen line below the pink Kijun-sen line. The Tenkan/Kijun lines have recently fused though and traders need to watch for the next cross to offer some direction here:
S&P500 monthly chart: a break of the monthly support trend line (see monthly chart). The monthly trend line remains intact. A break of this support level would suggest to me of a more severe pull back or correction.
Russell 2000 Index: this small caps index is a bit of a US market ‘bellwether’ and I see the 1,100 level as key support here. The index continues to hold above this support for the time being:
The post USDX still driving FX moves but a wall is looming: Trade Week Analysis 29/09/14 appeared first on www.forextell.com.