Last week: I’d mentioned last week that I was looking to the Yen pairs as potential candidates for trading opportunity and they did not disappoint. The USD/JPY gave a great TC LONG signal early in the week, posted in real time through this link, and it yielded up to 150 pips before stalling. It was a pretty messy week apart from that though but I have new technical patterns to monitor for potential breakout opportunity in the coming week with the Yen pairs still in prime focus. The correlation between Stocks and Bonds is worth considering at the moment as well given recent Bond weakness.

Trend line breakouts and TC signals: there were a few trend line breakout trades last week and these were updated on my site here, here and here:
- USD/JPY: a TC signal for 150 pips and 6 R.
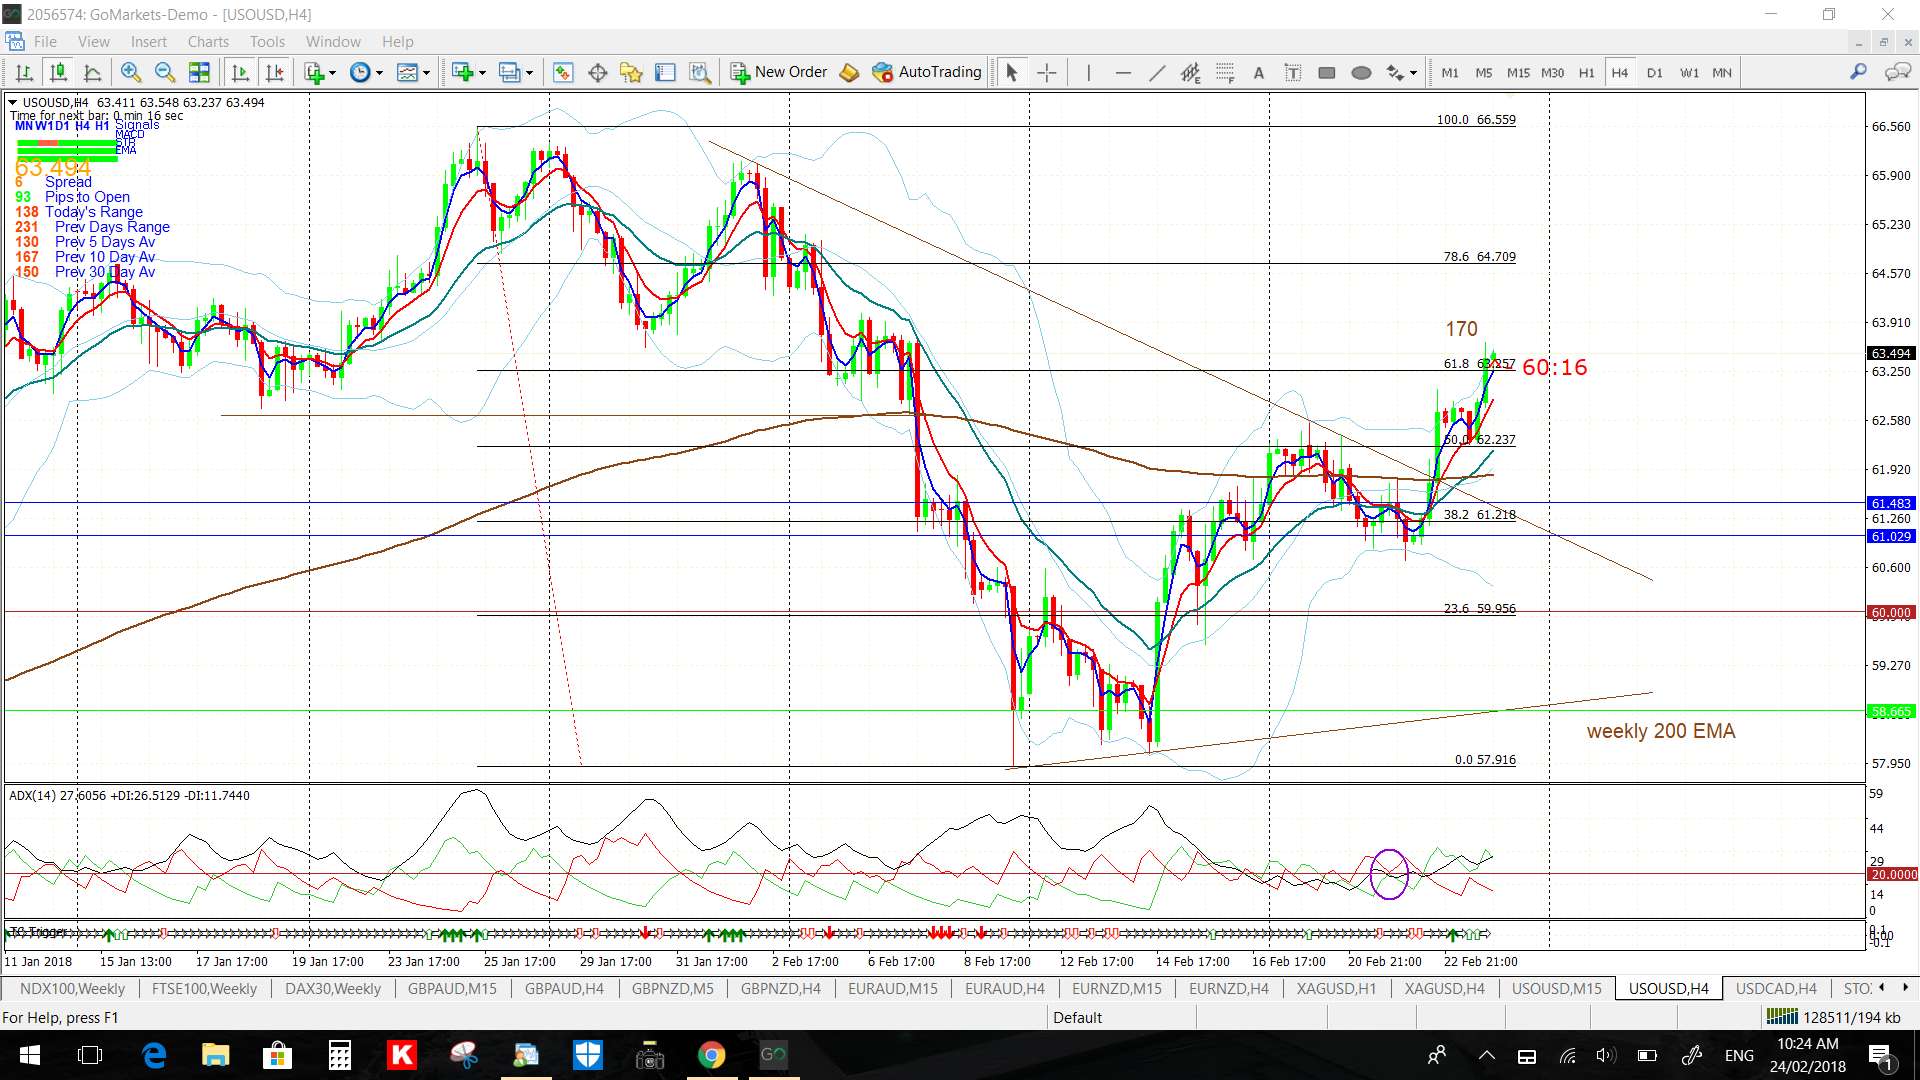
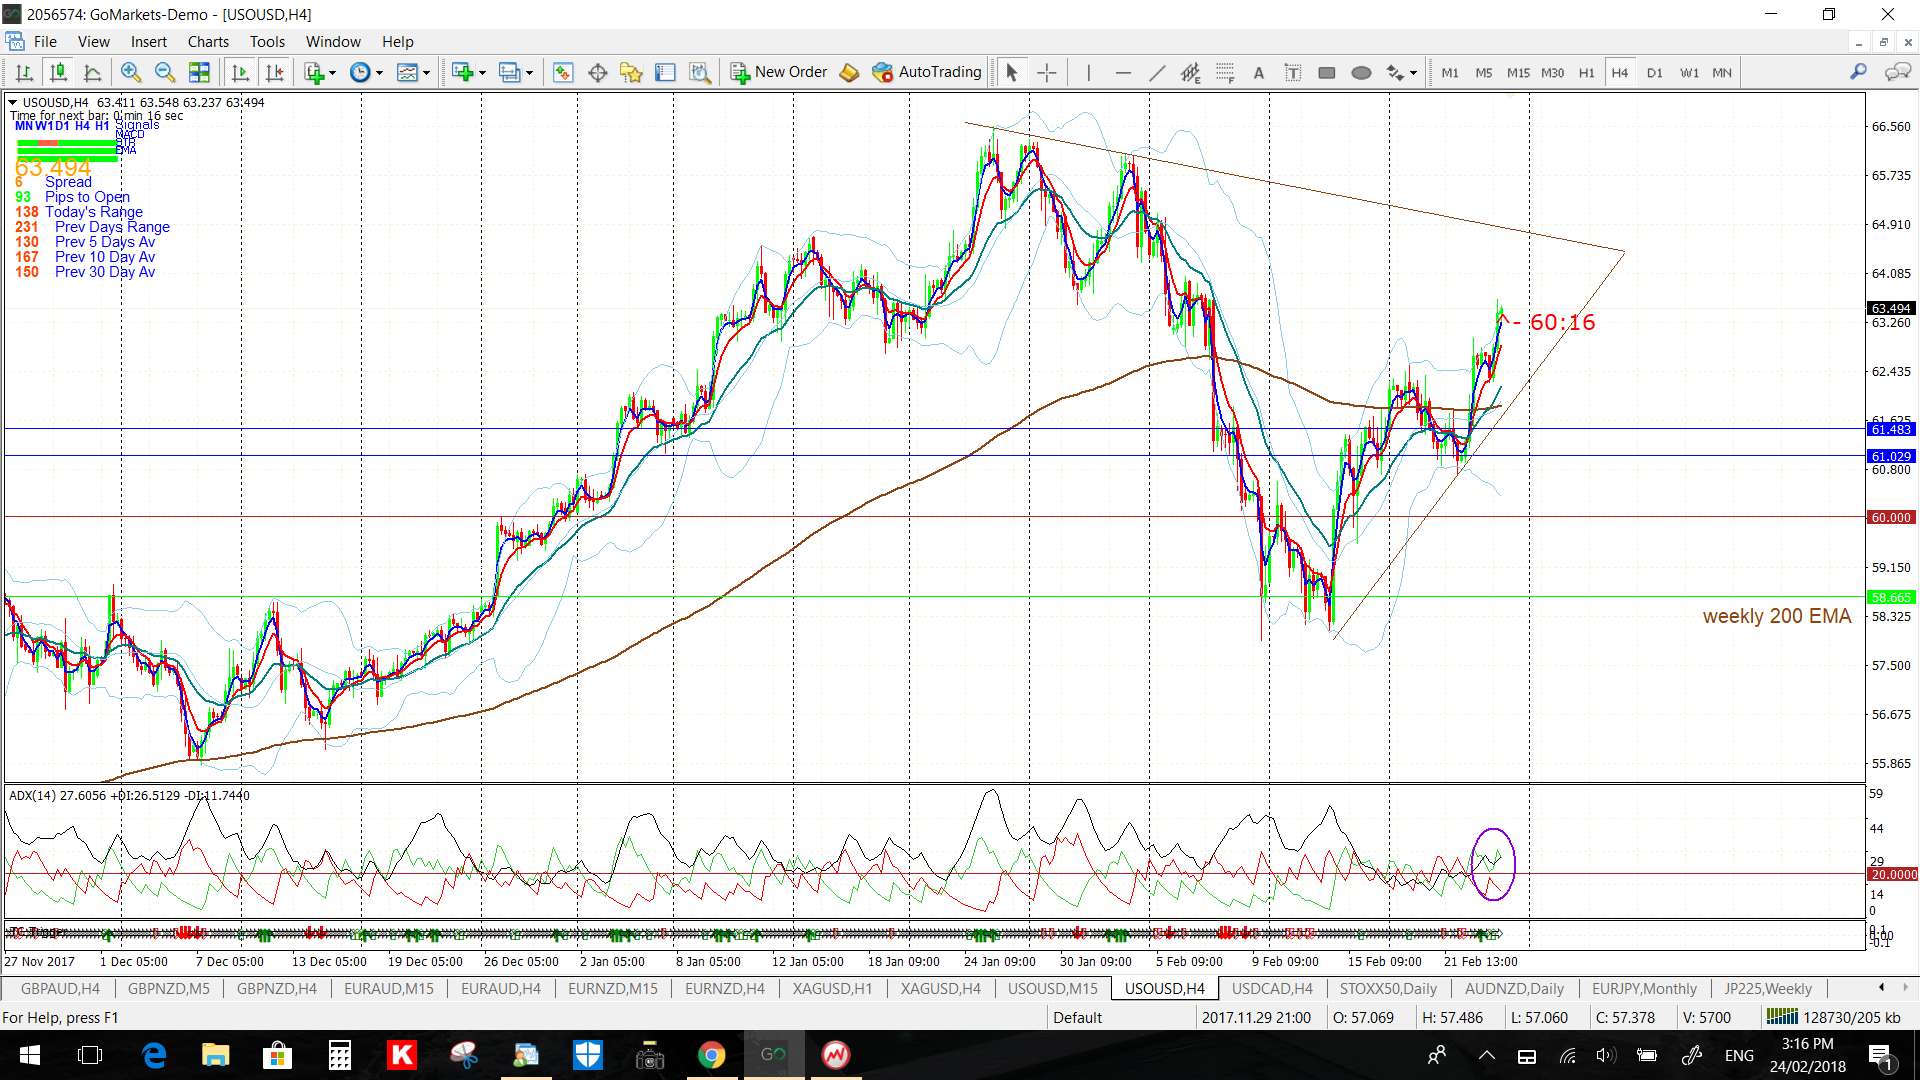
- Oil: 170 pips and 100 pips.
- EUR/USD: a TC signal for 4 R.
- GBP/JPY: 140 pips and a TC signal for 4 R.
- EUR/JPY: 50 pips and a TC signal for 4 R.
- EUR/AUD: 95 pips.
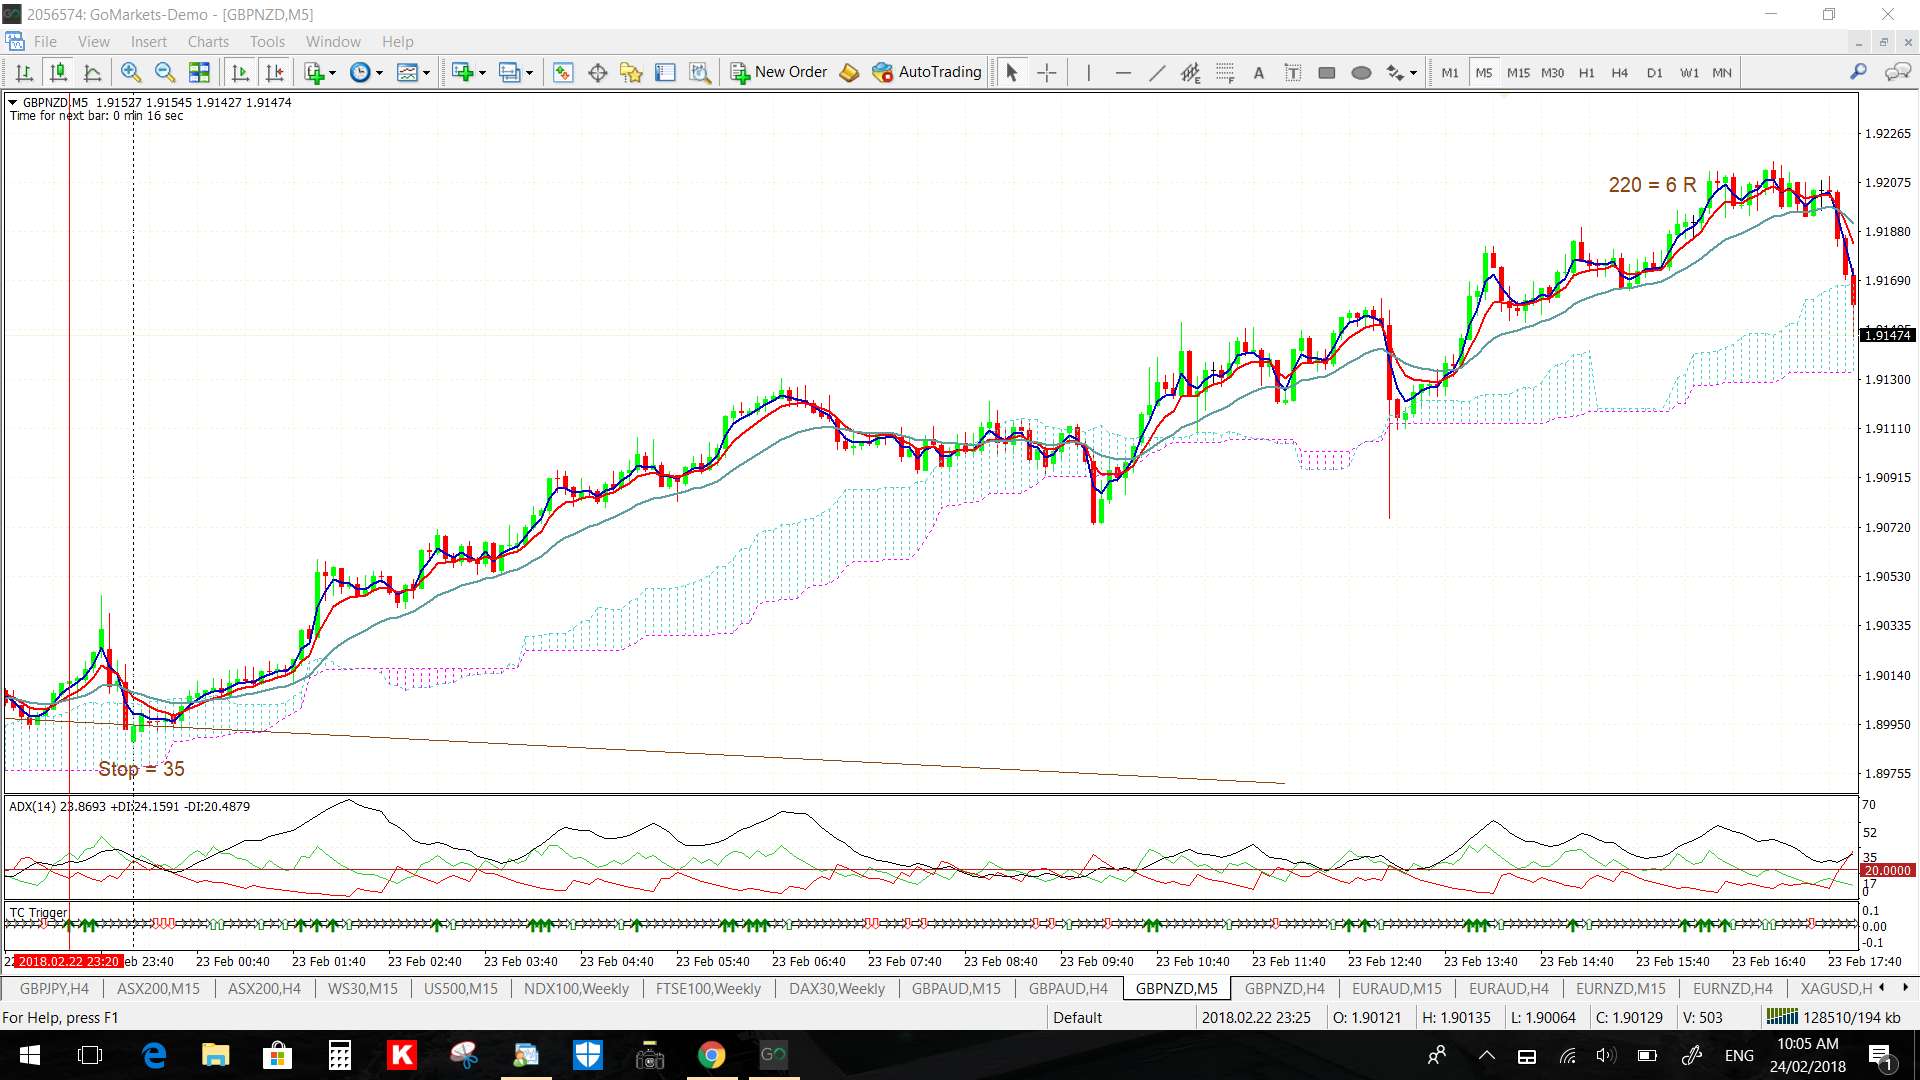
- GBP/NZD: 220 pips on Friday and a TC signal for 6 R.
- EUR/NZD: 100 pips on Friday.
Next week:
- FX Indices: The US$ index closed higher for the week and holds above major support but there is still some indecision being displayed. An update on the FX indices can be found through this link.
- Yen pairs: the Yen pairs are still in focus this week with the EUR/JPY, GBP/JPY, USD/JPY and AUD/JPY setting up in nice, well nice for me that is, triangle or descending wedge patterns.
- GBP/USD: will this be the week that the Cable shakes off the 1.40 level?
- End of Month: Next Wednesday marks the end of the month so watch for new monthly candles and new monthly pivots.
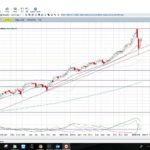
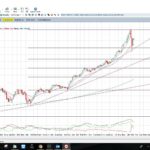
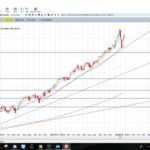
- Bonds: the iShares 20+ Year Treasury Bond ETF, TLT, looks set to break down through a monthly support trend line and the 10-year Treasury Note ETF, TNX, looks set to make a bullish breakout but watch to see where these close on Wednesday though. Any follow-through on these ETF breakouts would help to underpin the 20+ Year Treasury Bond 3x Bear ETF, TMV:
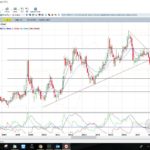
- TLT monthly
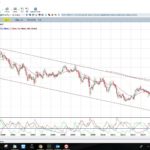
- TNX monthly
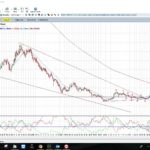
- TMV weekly
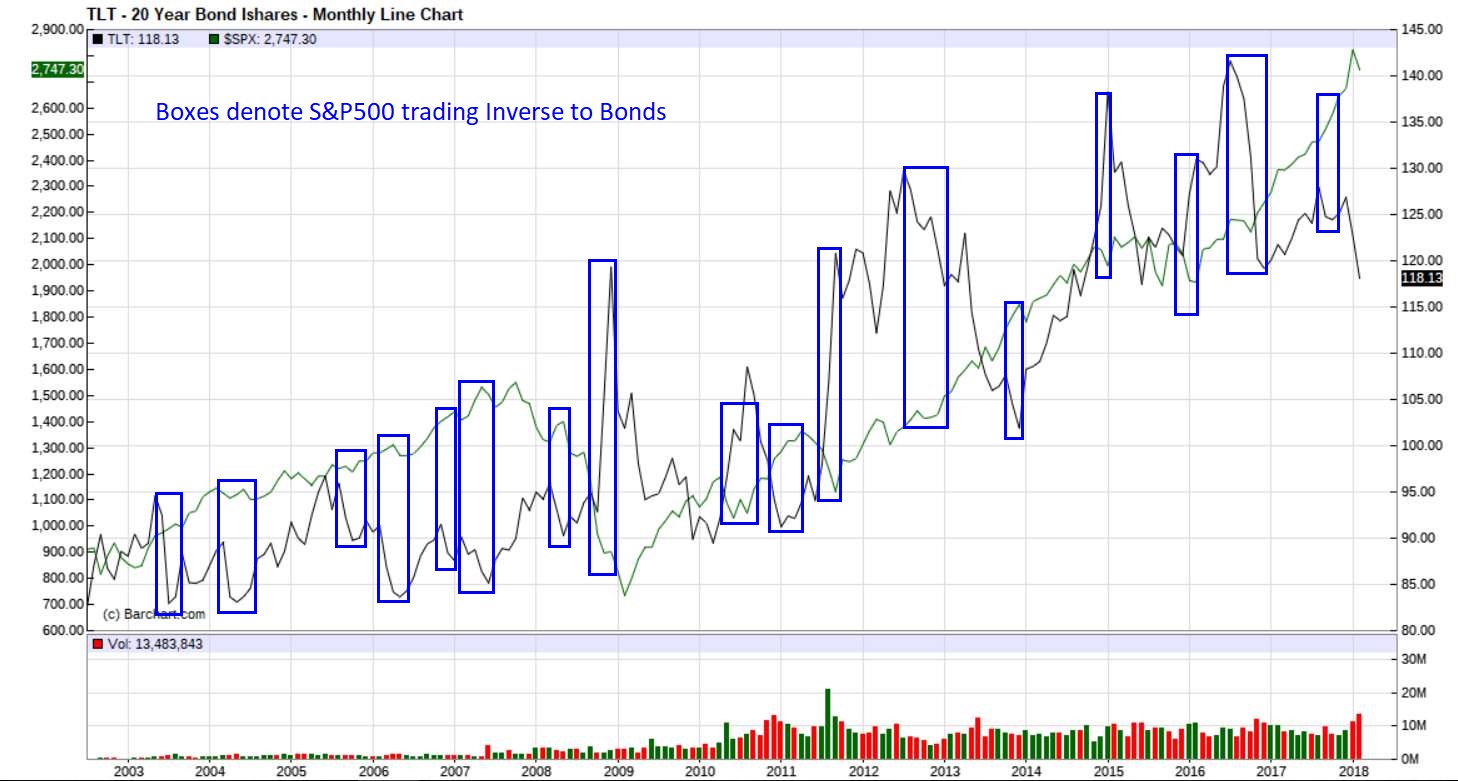
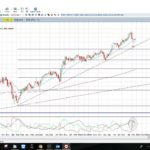
- Stocks: The combination of falling Bonds and rising interest rates is being quoted by some as a negative for stocks given that ‘borrowing’ and the ‘cost of business’ generally increase in a higher interest rate regime. However, reading across this topic suggests that the type of correlation between Bonds and Stocks, positive or negative, varies depending on the underlying market conditions and the overall interest rate environment. Articles on the topic of Bond / Stock correlation can be found through the links here, here, here, hereand here and the general take away seems to be that any direct extrapolation of a decline with Bonds to result in a decline with Stocks is not clear cut. In fact, my crude attempt to highlight periods where the S&P500 traded inverse to Bonds is shown below; as you can see there have many periods over the last 20 years where they have traded directly and inversely to each other:
- Stocks Cont’d: This is not an exhaustive reading list by any means but simply a few of the most recent articles I found. It is worth noting that despite the recent shift with Bonds and Rates, mirrored in the TLT and TNX charts above, the four major US stock indices continue to hold above long-term trend lines. Watch to see how the monthly candles close on Wednesday though; for all of these instruments:
- S&P500 weekly
- DJIA weekly
- NASDAQ weekly
- Russell-2000 weekly
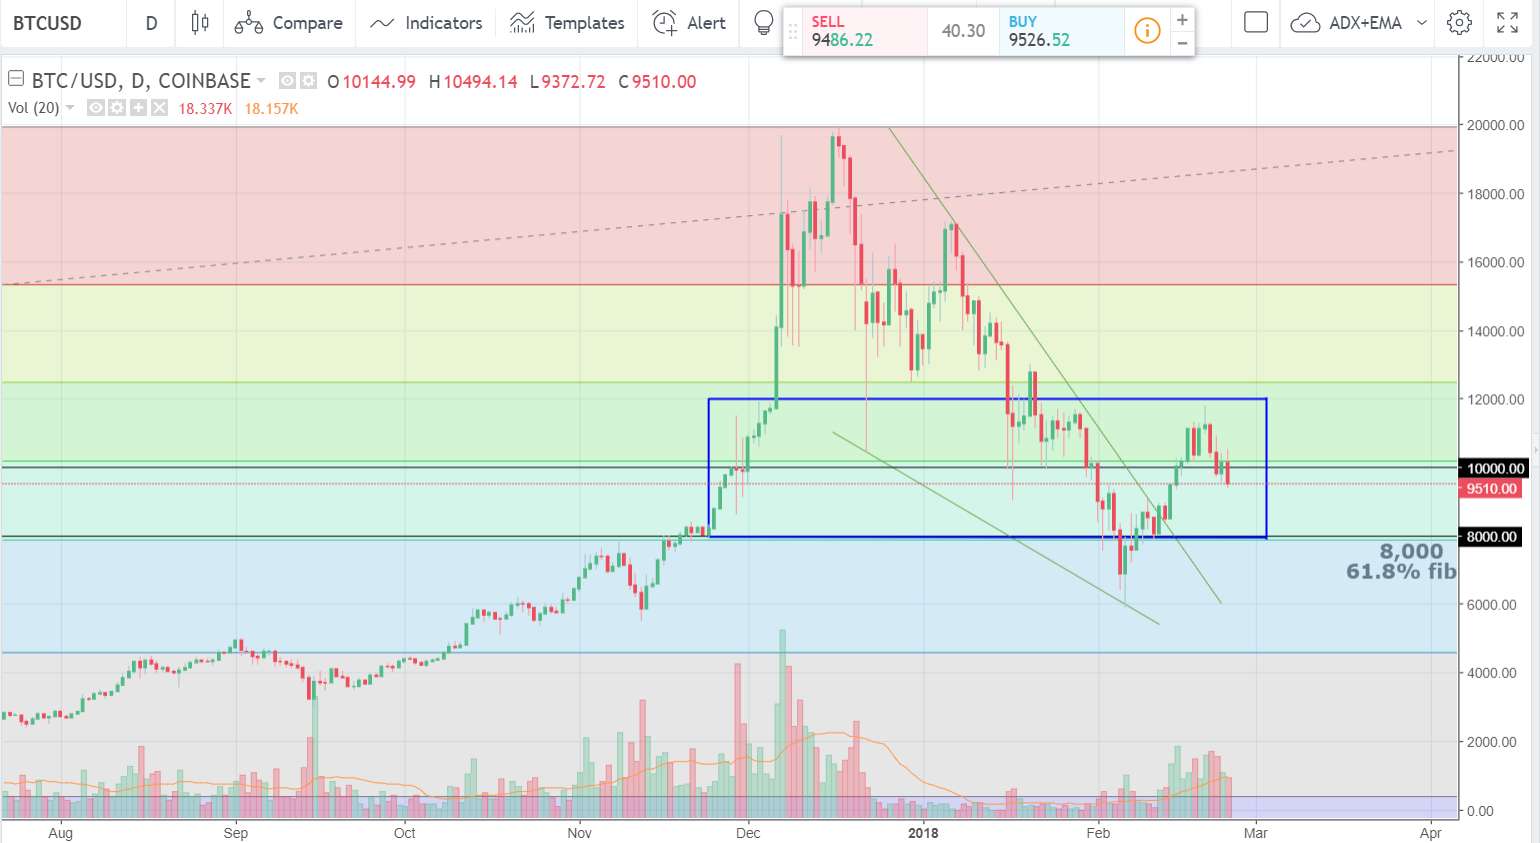
- Bitcoin: Bitcoin is still holding near the psychological $10,000 level. This is a major psychological zone for BTC/USD following the bounce up from the weekly 61.8% fib and $8,000 support level. Thus, I would not expect this region to be given up easily and would expect to see some extended choppiness around the zone from around $8,000 to $12,000 until either the Bulls or Bears triumph! Last week I listened to another good crypto podcast that I think is well worth listening to: This was from Futures Radio Show: Episode 183 Bridging the gap between Futures and Crypto with Michael Unetich from Trading Technologies (TT) (34 min). In March TT is launching what they call ‘a user friendly’ platform for the trading of both Spot and Futures Bitcoin.
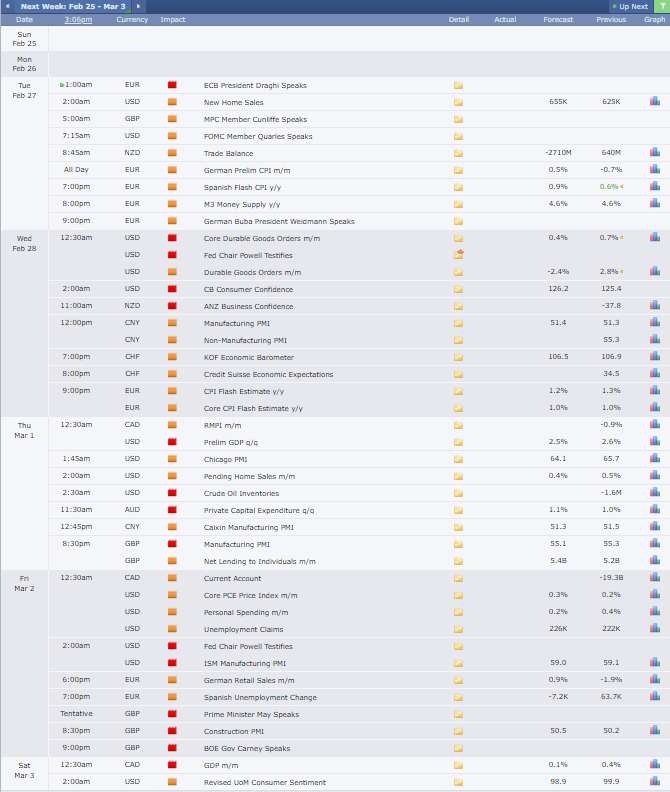
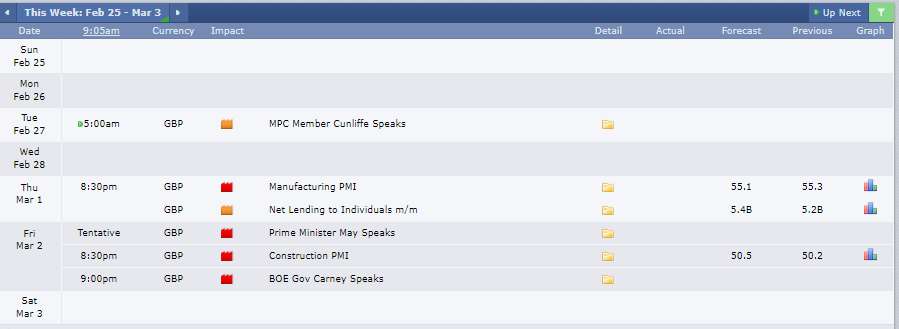
Calendar: Watch for any impact from the following items:
Forex:
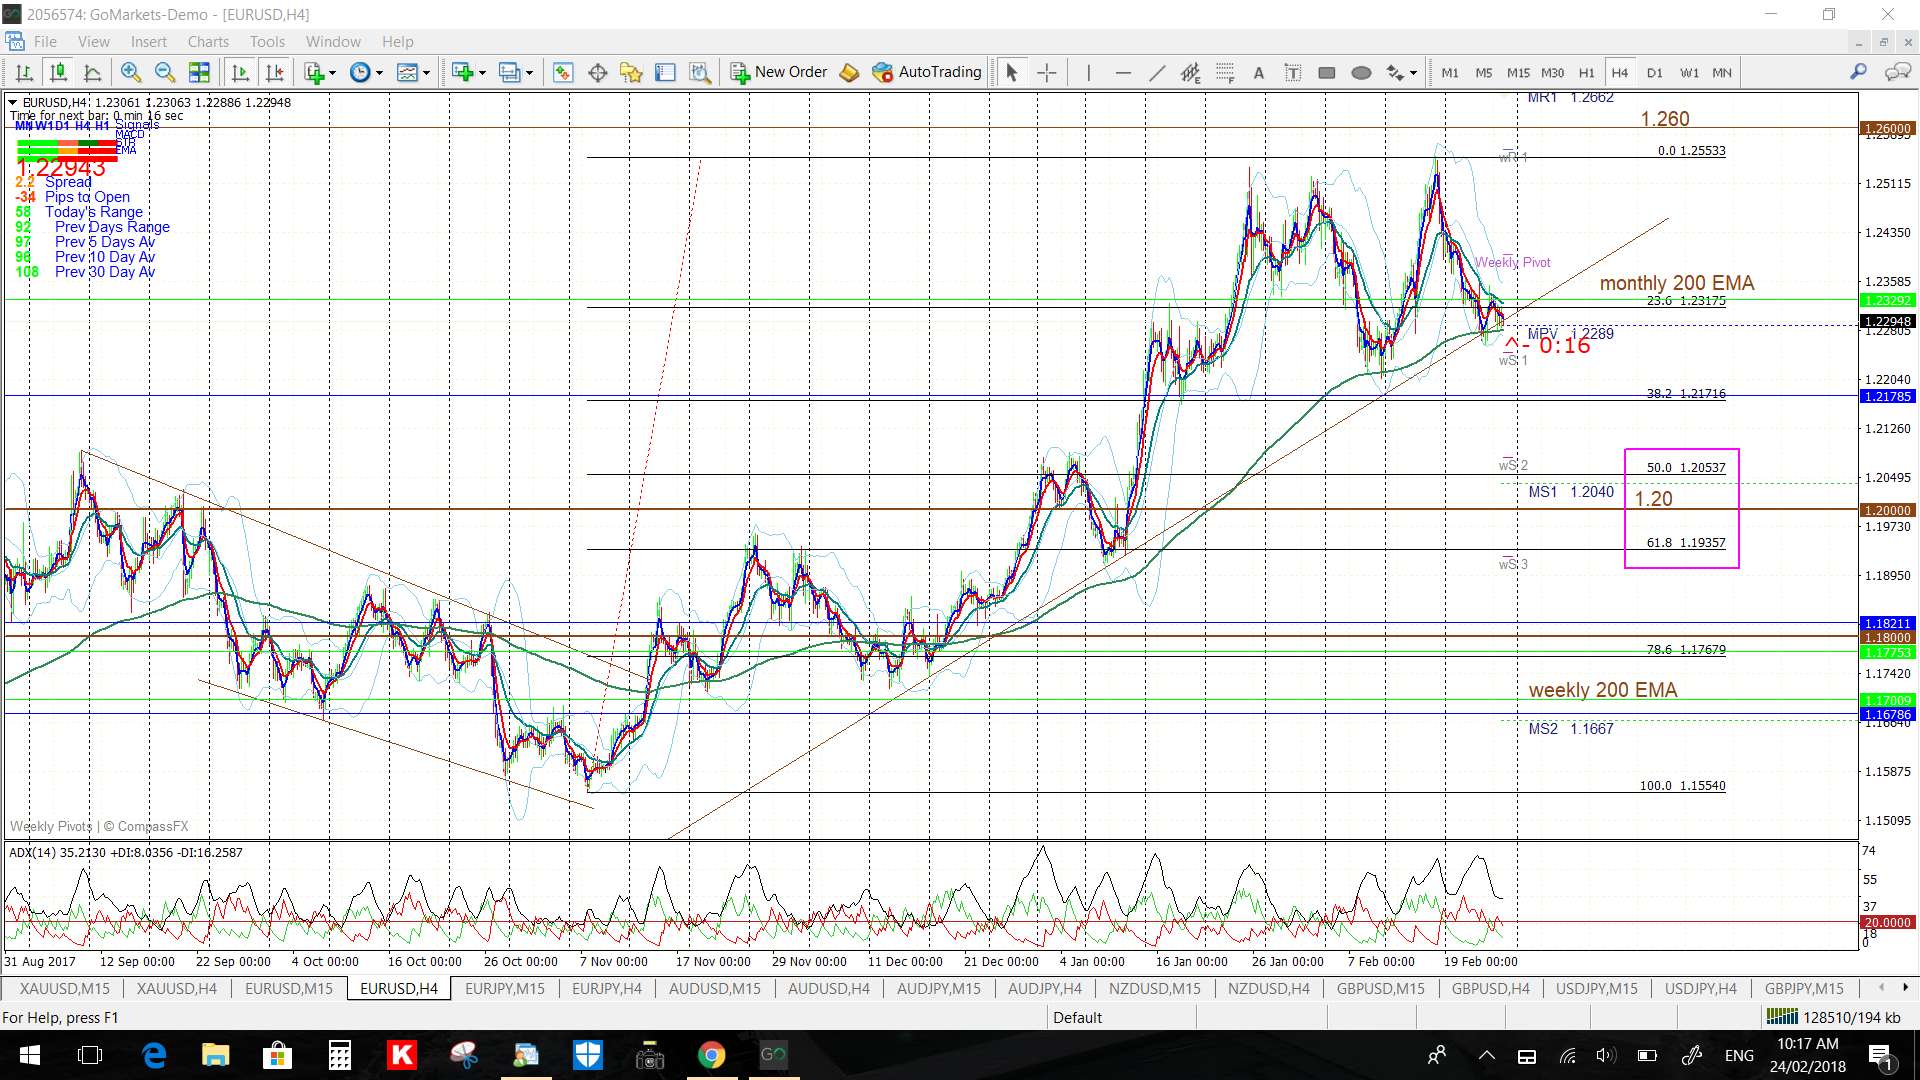
EUR/USD: Price retreated last week but held above a 16-week support trend line and the pair is, essentially, still consolidating below the key 1.260 level. This is a major level for this pair as the weekly chart’s 61.8% fib is near 1.26 and it also intersects with the monthly chart’s 10-year bear trend line. Thus, the 1.26 remains as the major level to monitor in coming sessions.
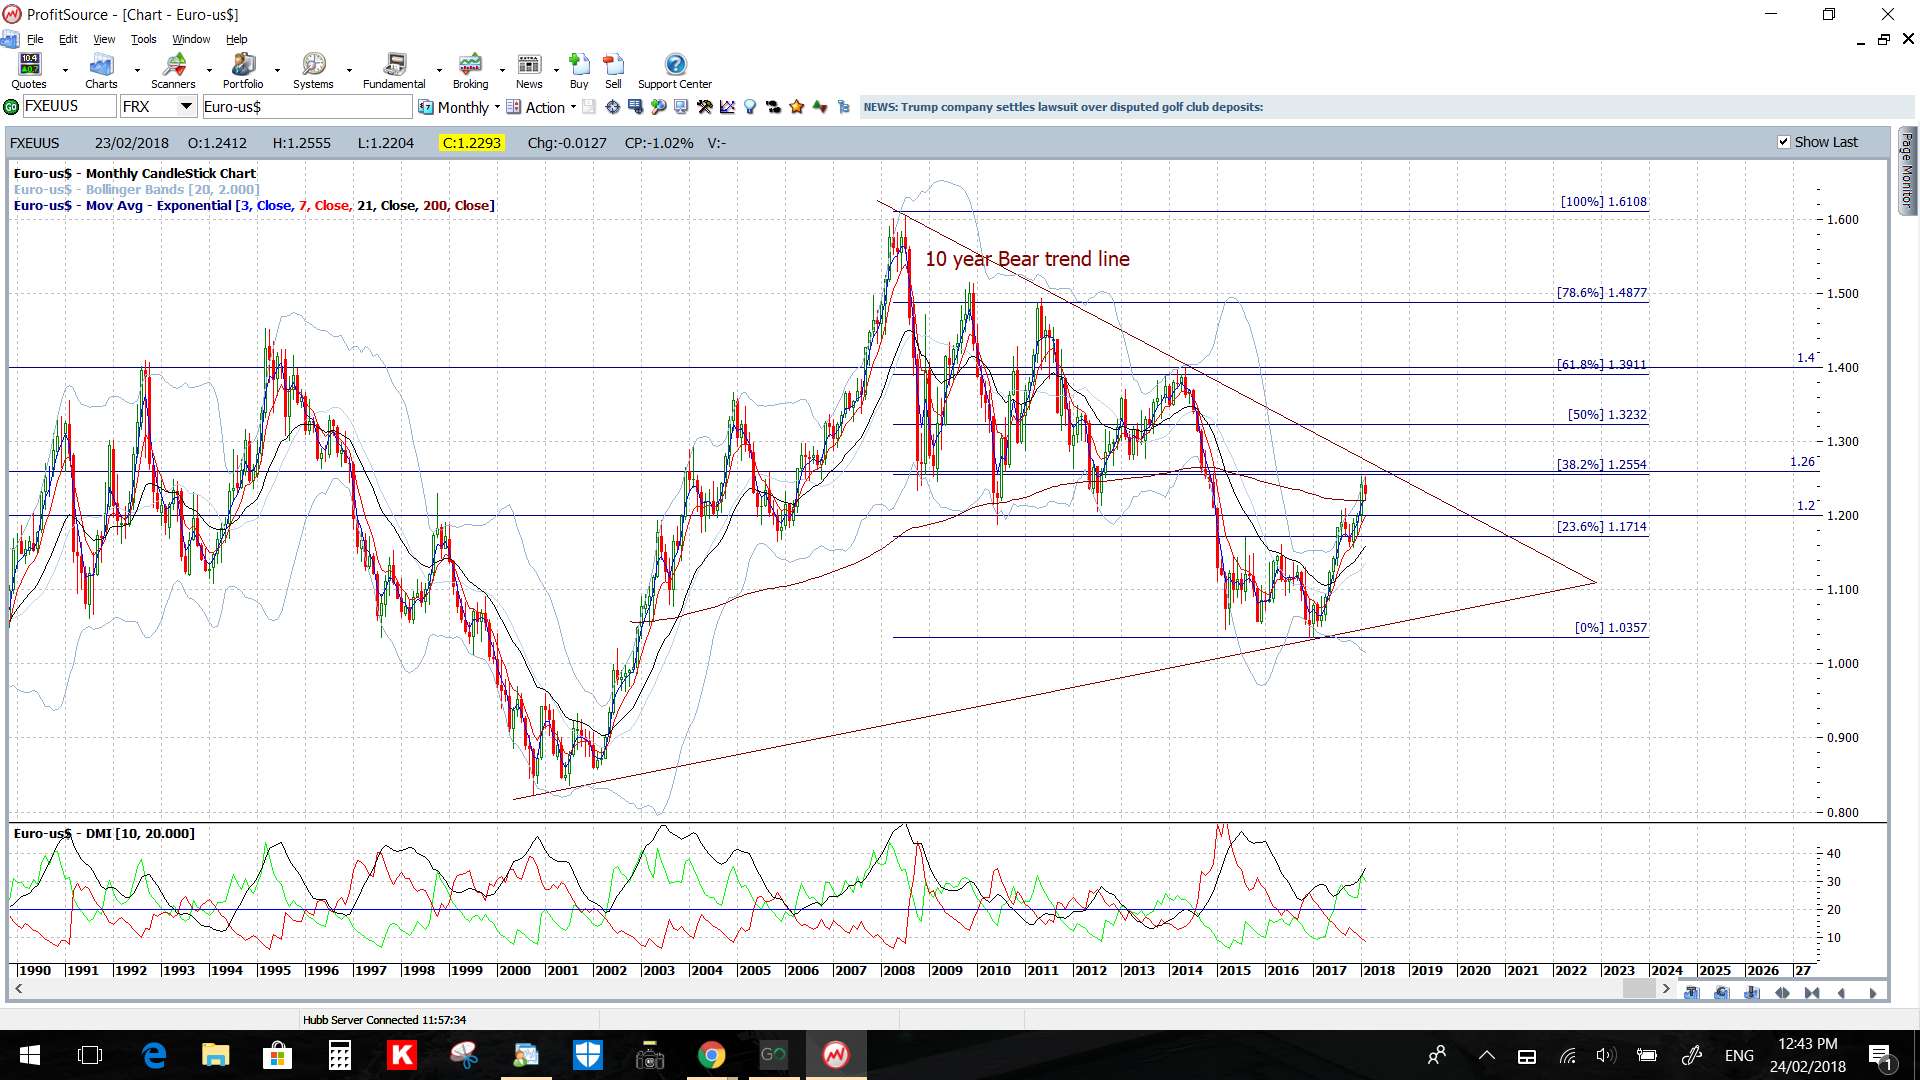
Note on the monthly chart below how the 61.8% fib of the swing low move is up near previous S/R at 1.40 so this would be the longer-term target on any break and hold above 1.26. This constitutes a move worth 1,400 pips so is well worth motioning on any breakout above 1.260.
Any deeper pullback and break of the support trend line would have me looking for a test of the key 1.20 level.
- Watch the 4hr chart trend lines for any new breakout; especially with this week’s ECB Draghi speech and the few second tier CPIs.

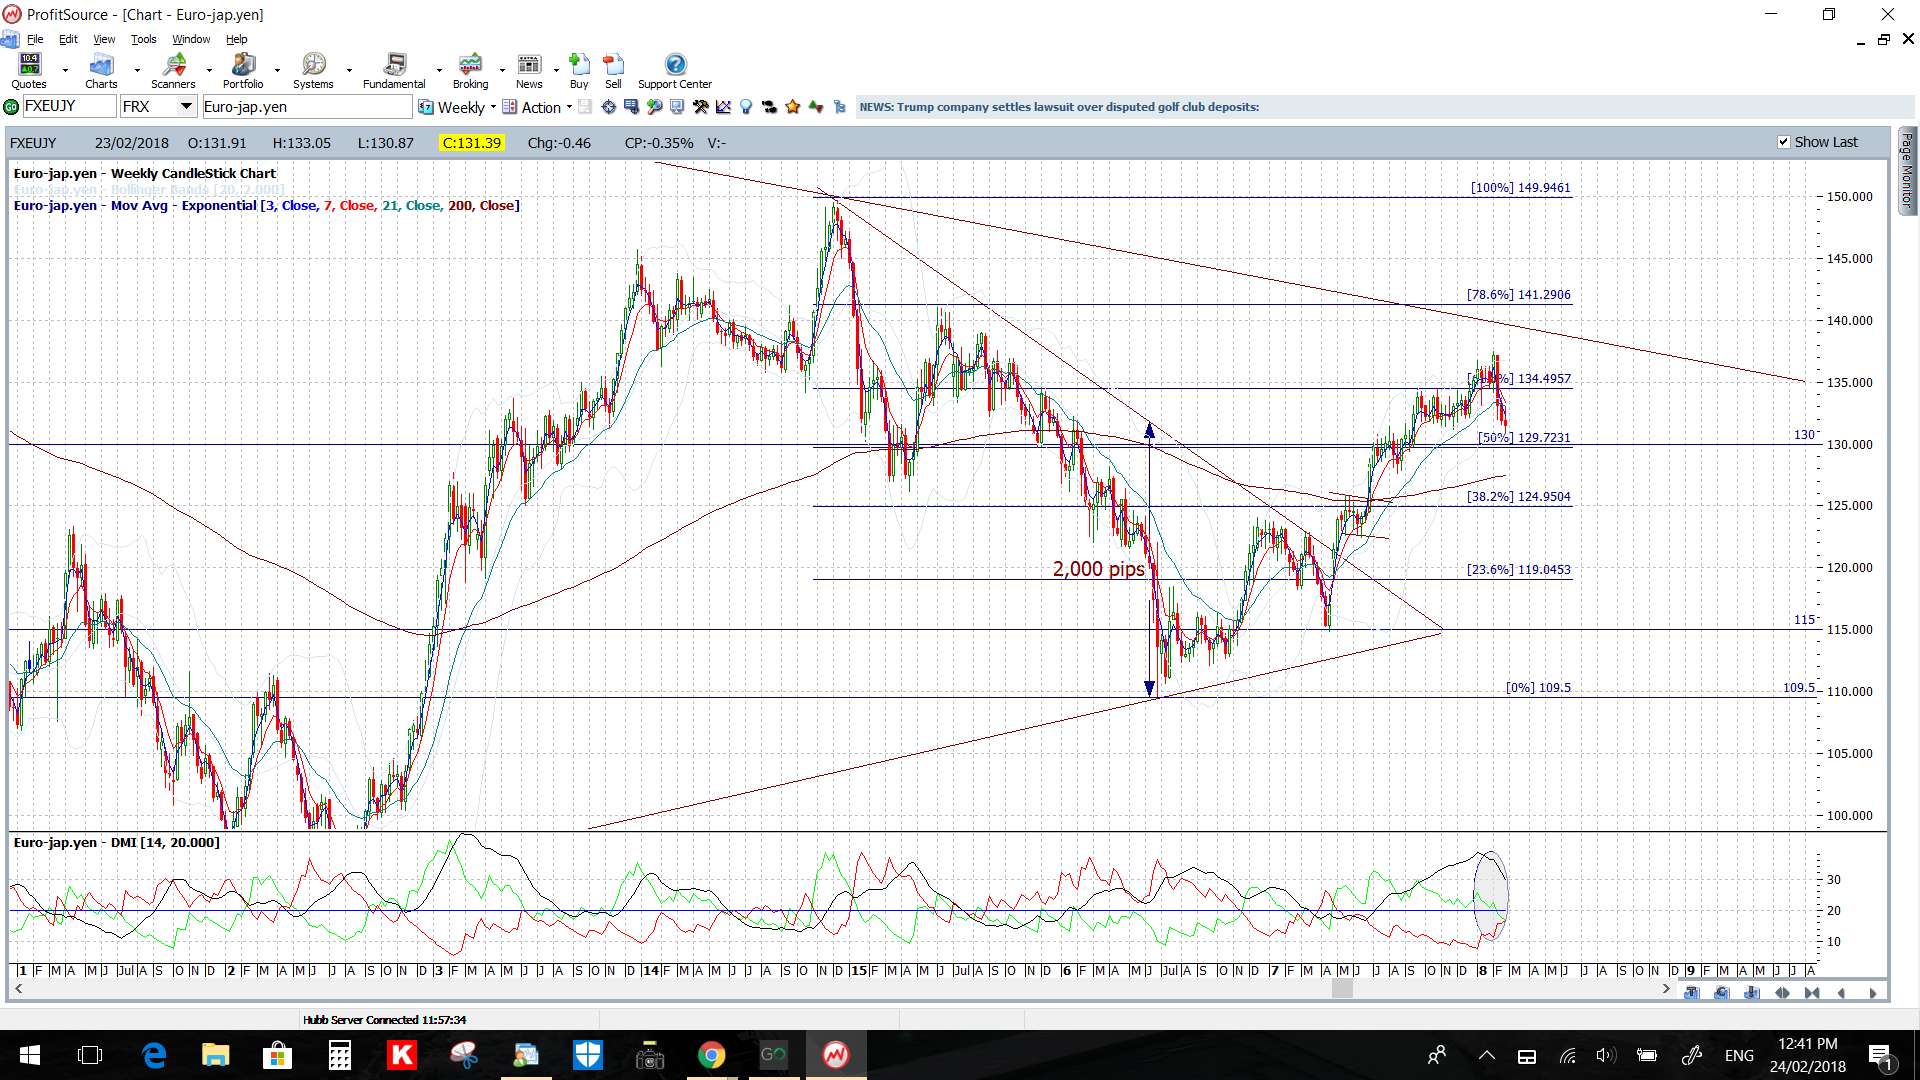
EUR/JPY: There has been a bit more weakness here in the last week but this has only helped to shape up a better 4hr chart pattern to monitor. That of a bullish-reversal descending wedge; one of my favorite patterns!
I’m still on the lookout for any test of the major 135 S/R level here as it is the 4hr chart’s 61.8% fib.
Any break lower would have me looking to the 130 S/R level as this is long-term S/R on the weekly chart.
- Watch the 4hr chart trend lines for any new breakout.

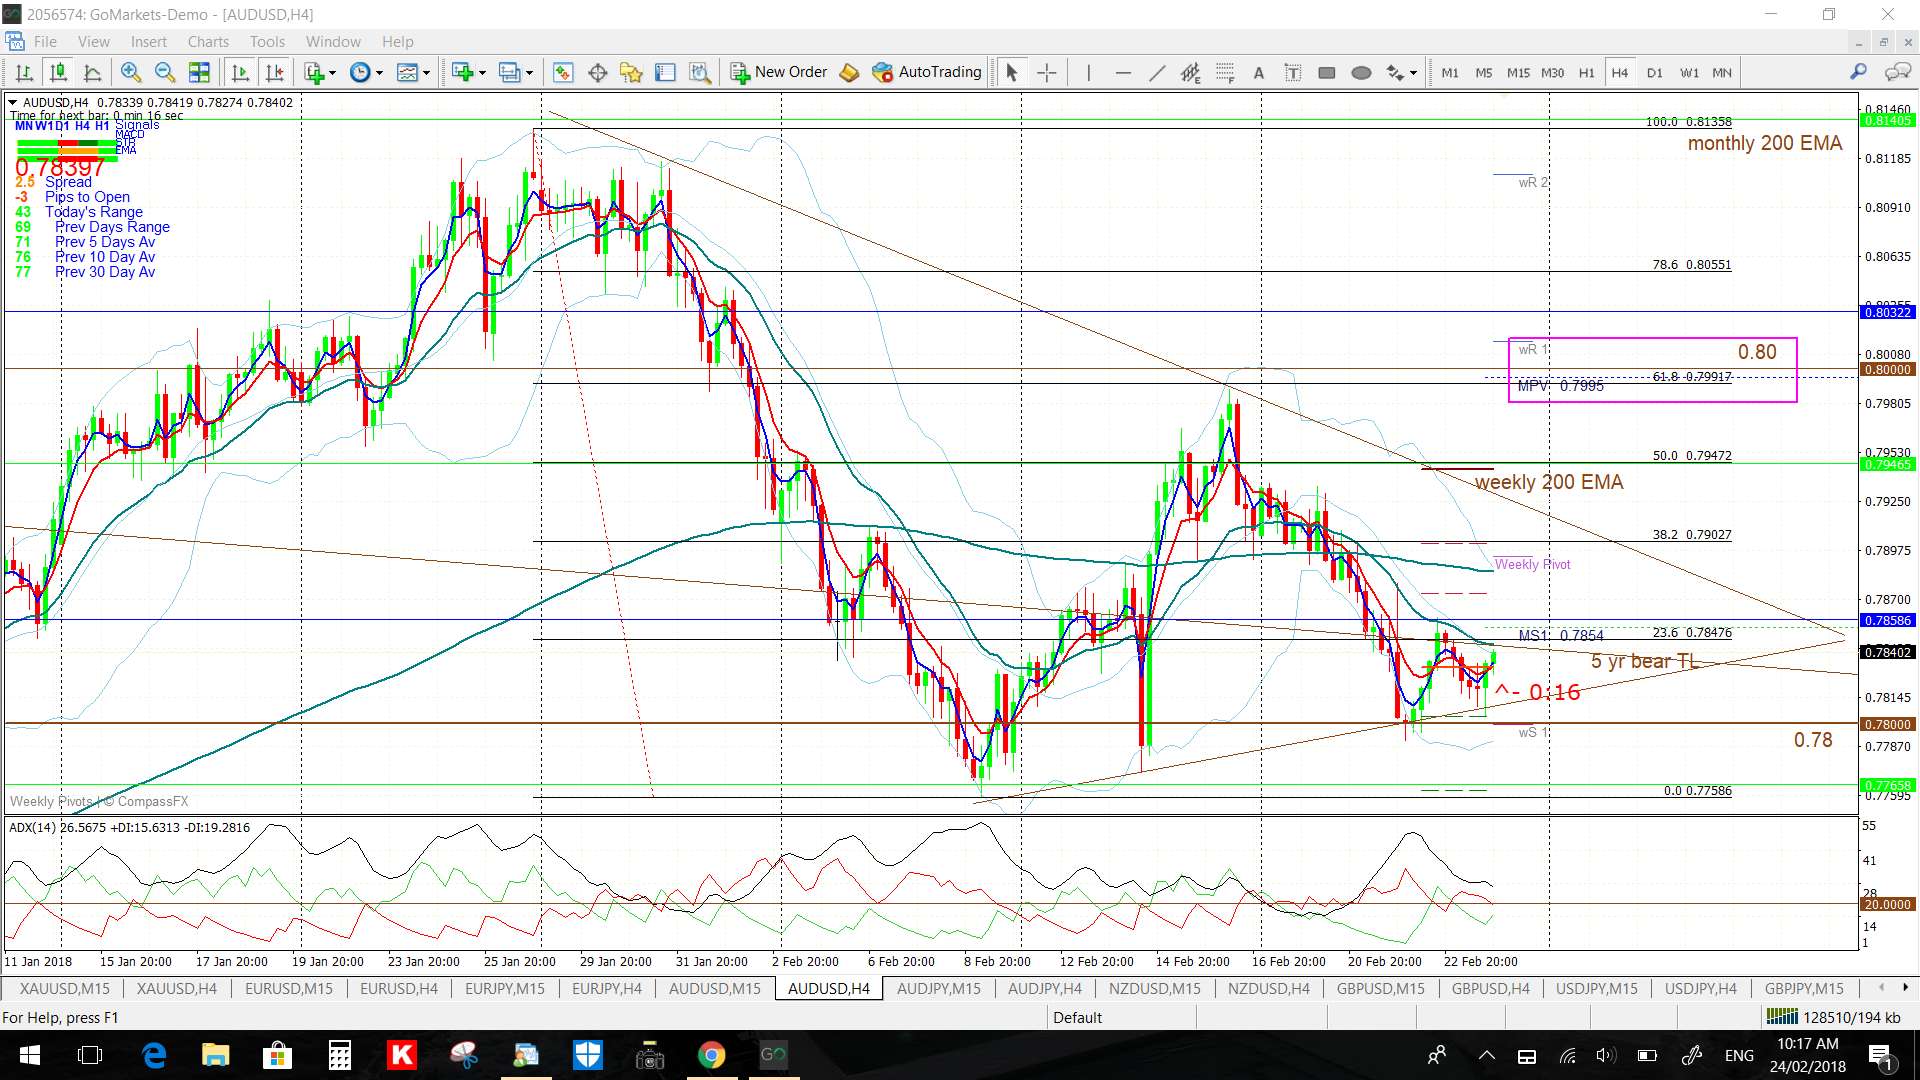
AUD/USD: Note how price action continues to hover near the previously broken 5-year bear trend line.
- Watch the triangle trend lines for any new breakout, especially with this week’s AUD Private Capital Expenditure data.

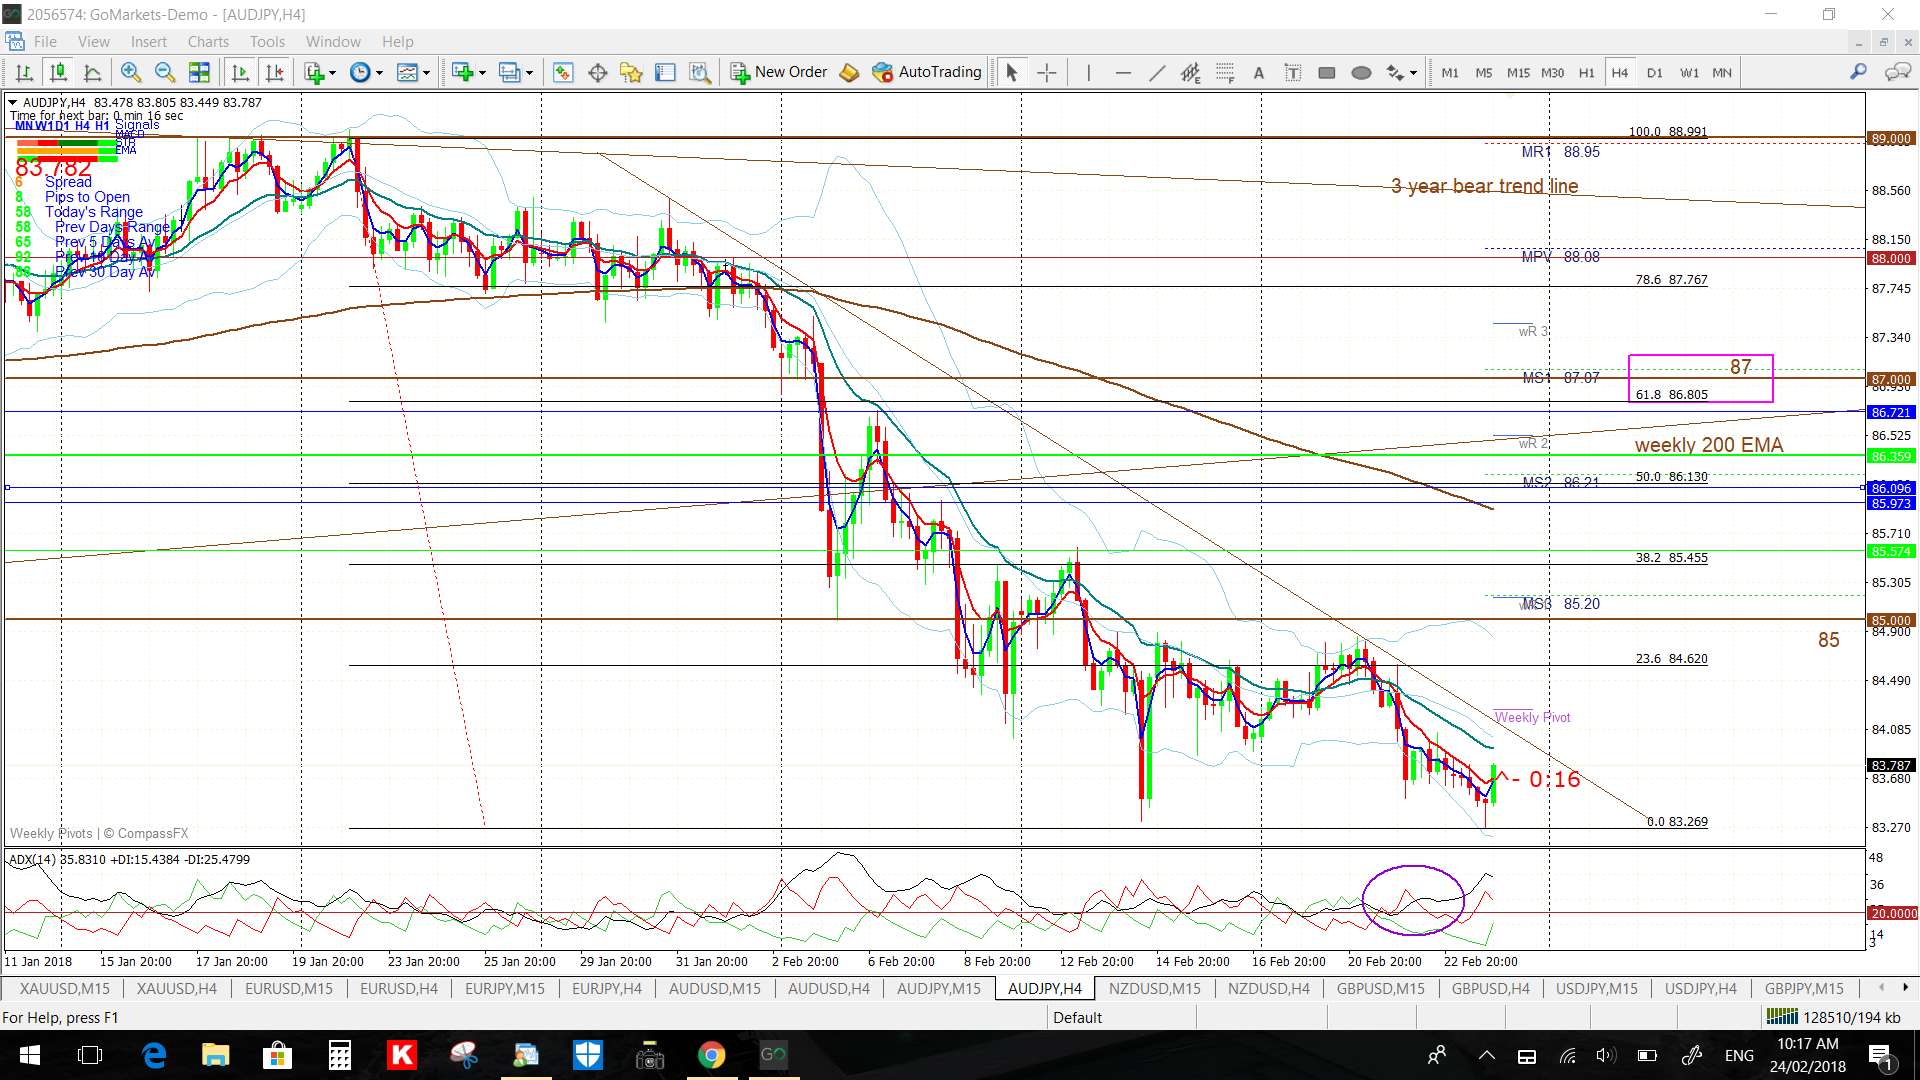
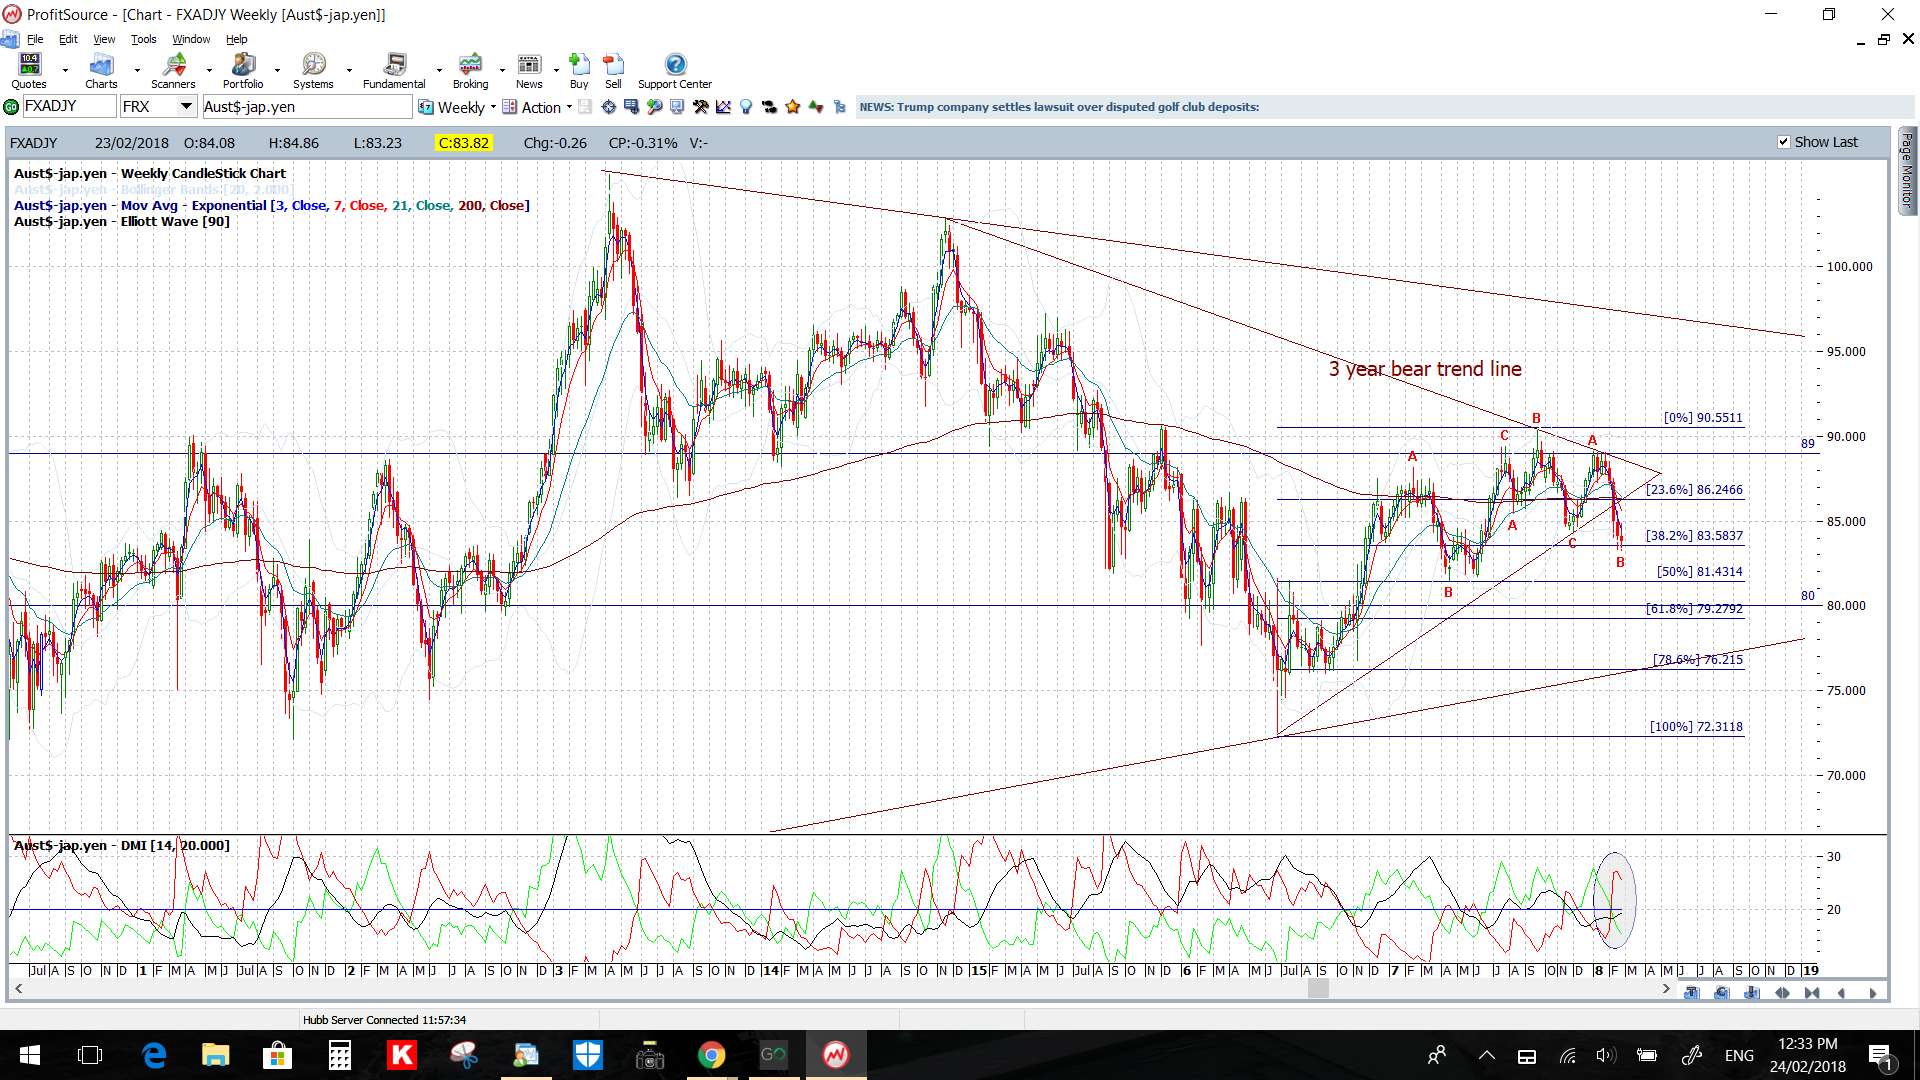
AUD/JPY: As per last week, I’m still watching for any test of the 87 S/R level here as this is the 4hr chart’s 61.8% fib.
Any break lower would have me looking to the weekly chart’s 61.8% fib; down near 80 S/R.
- Watch the 4hr chart trend lines for any new breakout.
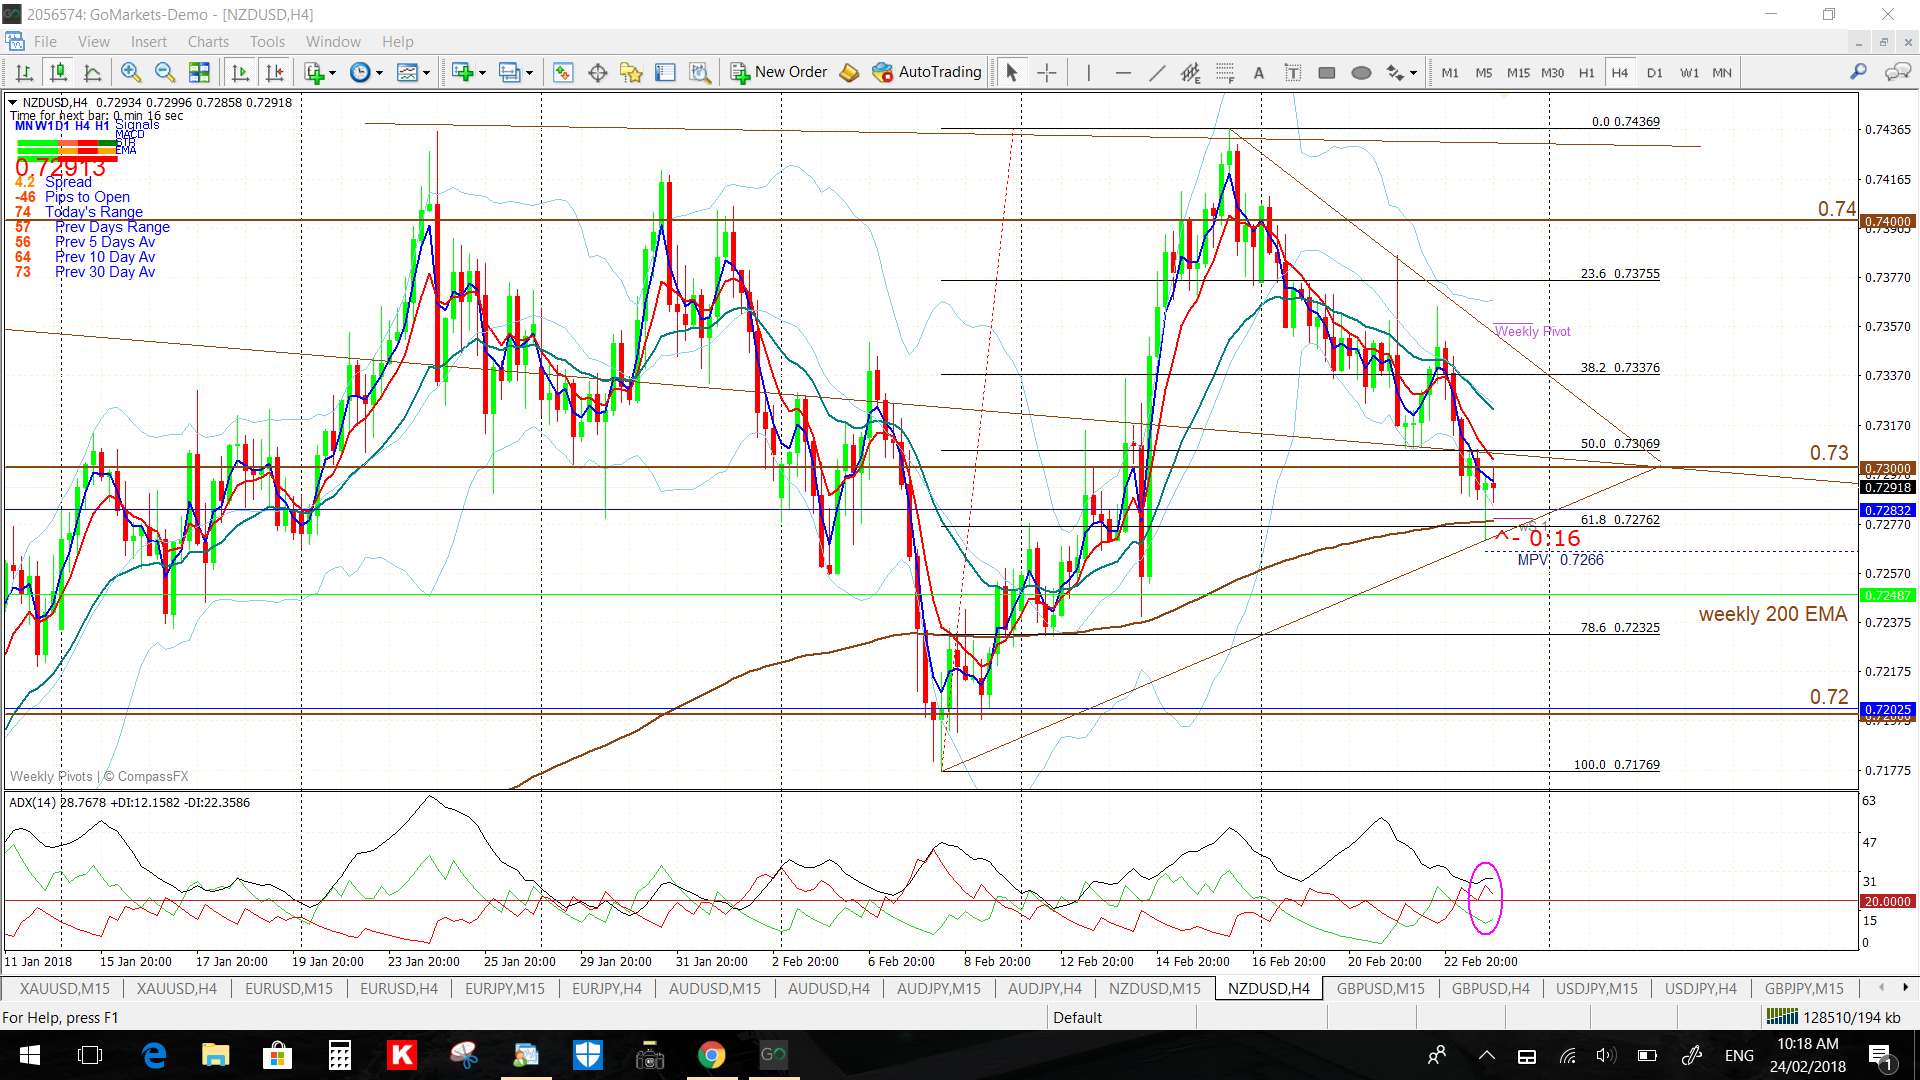
NZD/USD: The Kiwi was weaker last week and is now hovering near the 0.73 level and so this is the level to watch for any new make or break.
- Watch the 4hr chart trend lines for any new breakout; especially with this week’s NZD Business Confidence data:
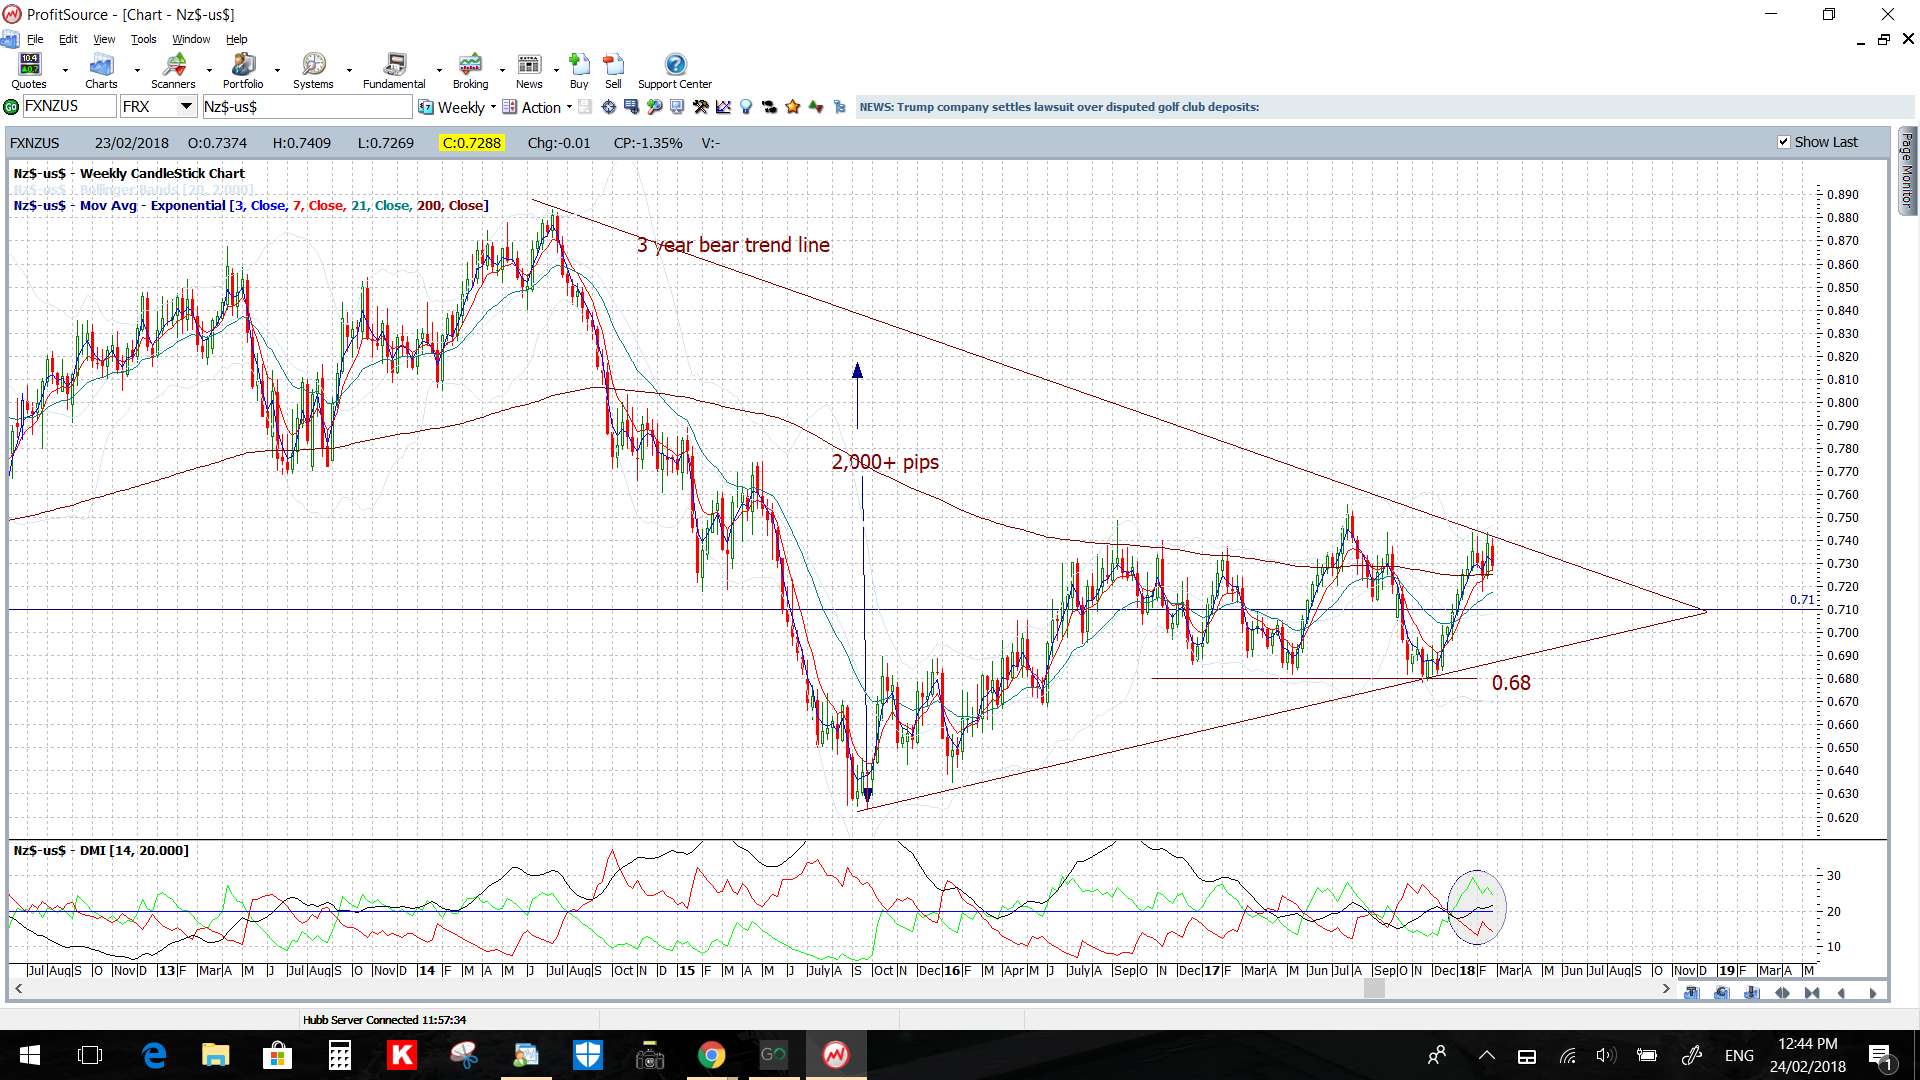
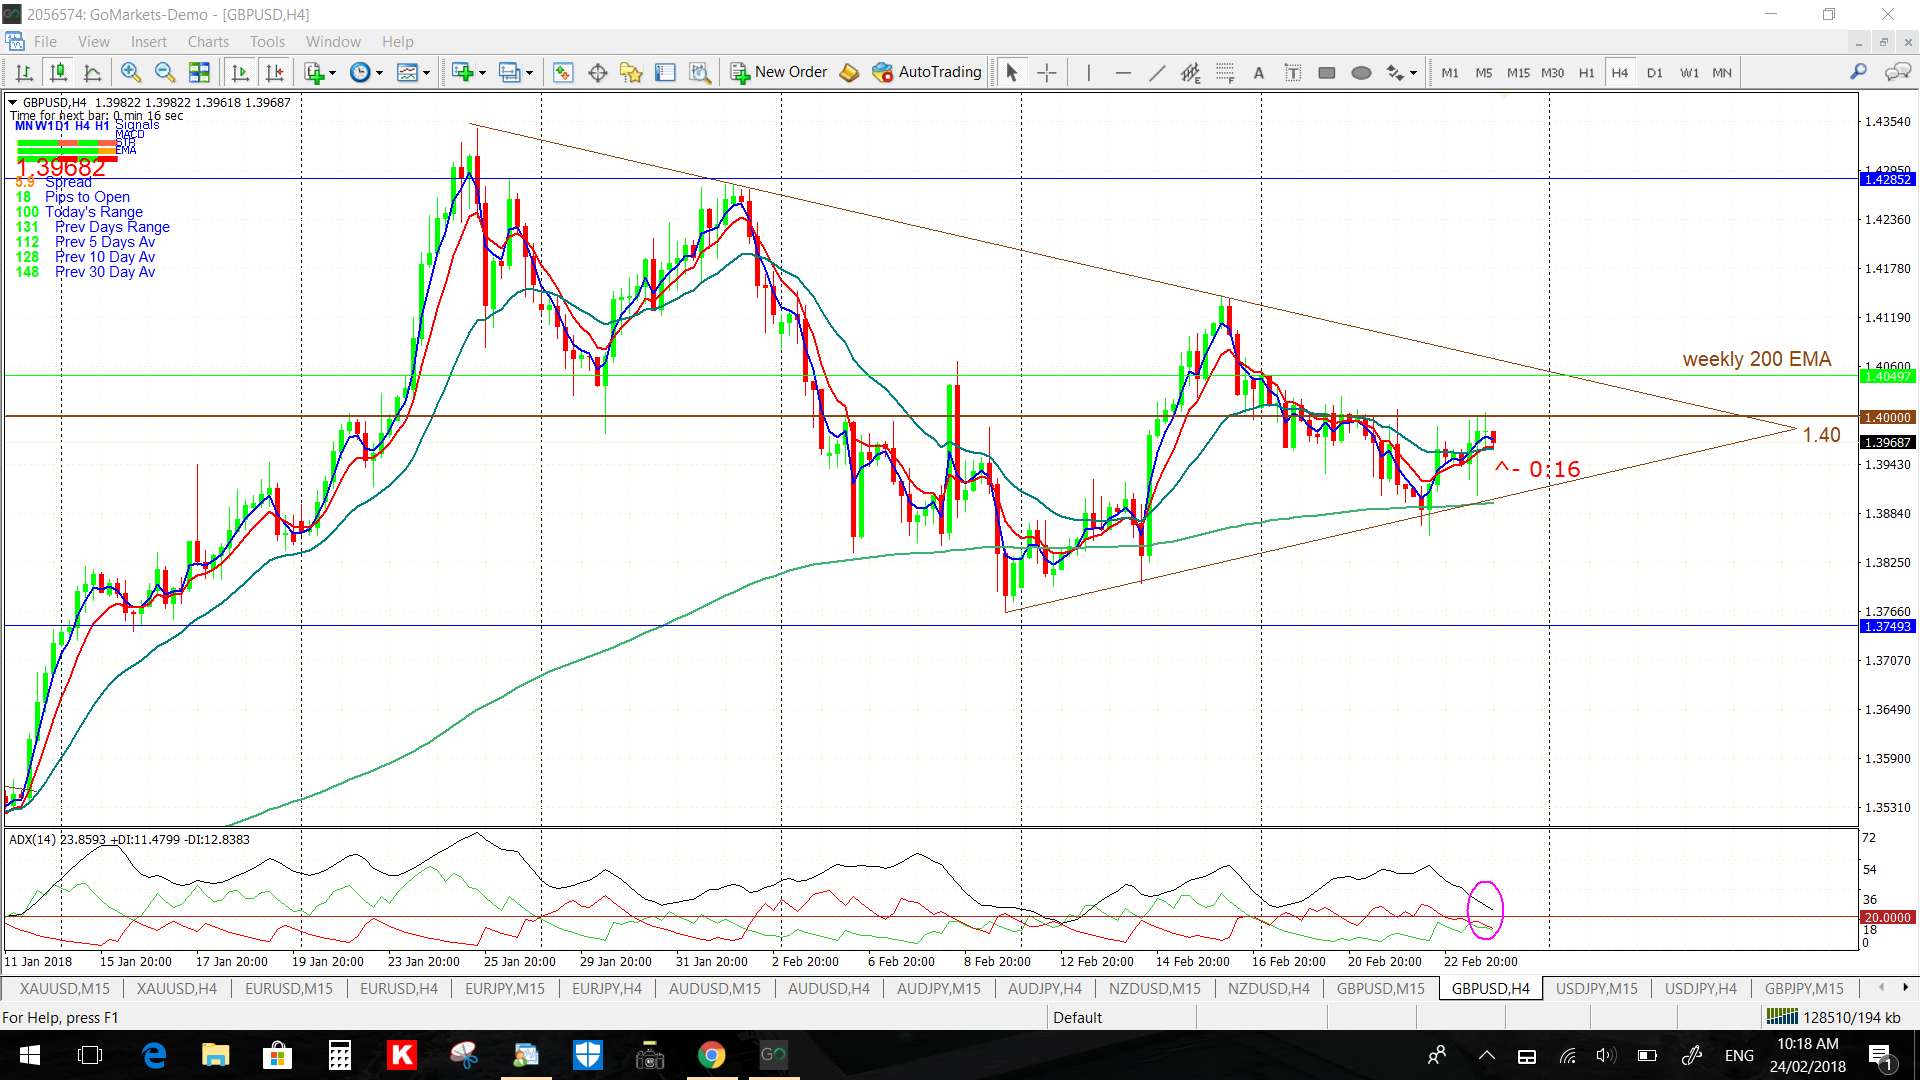
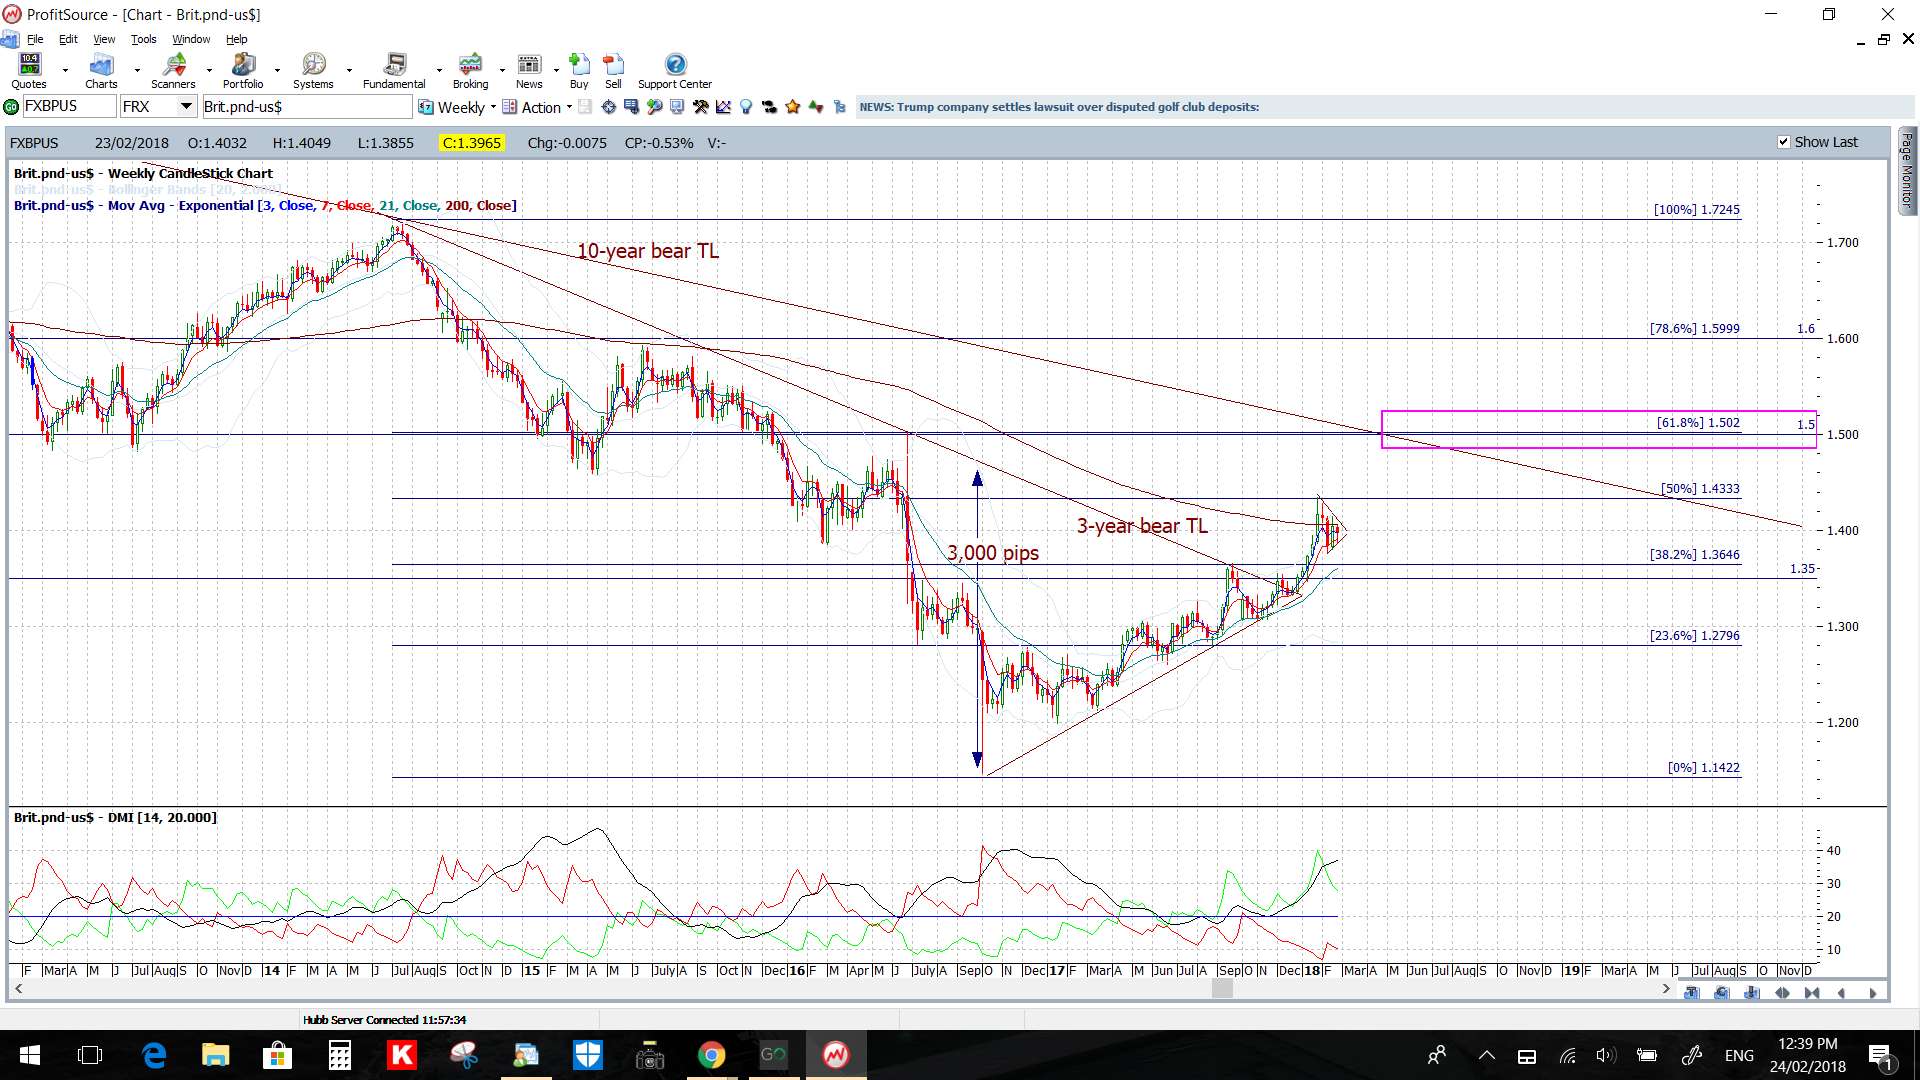
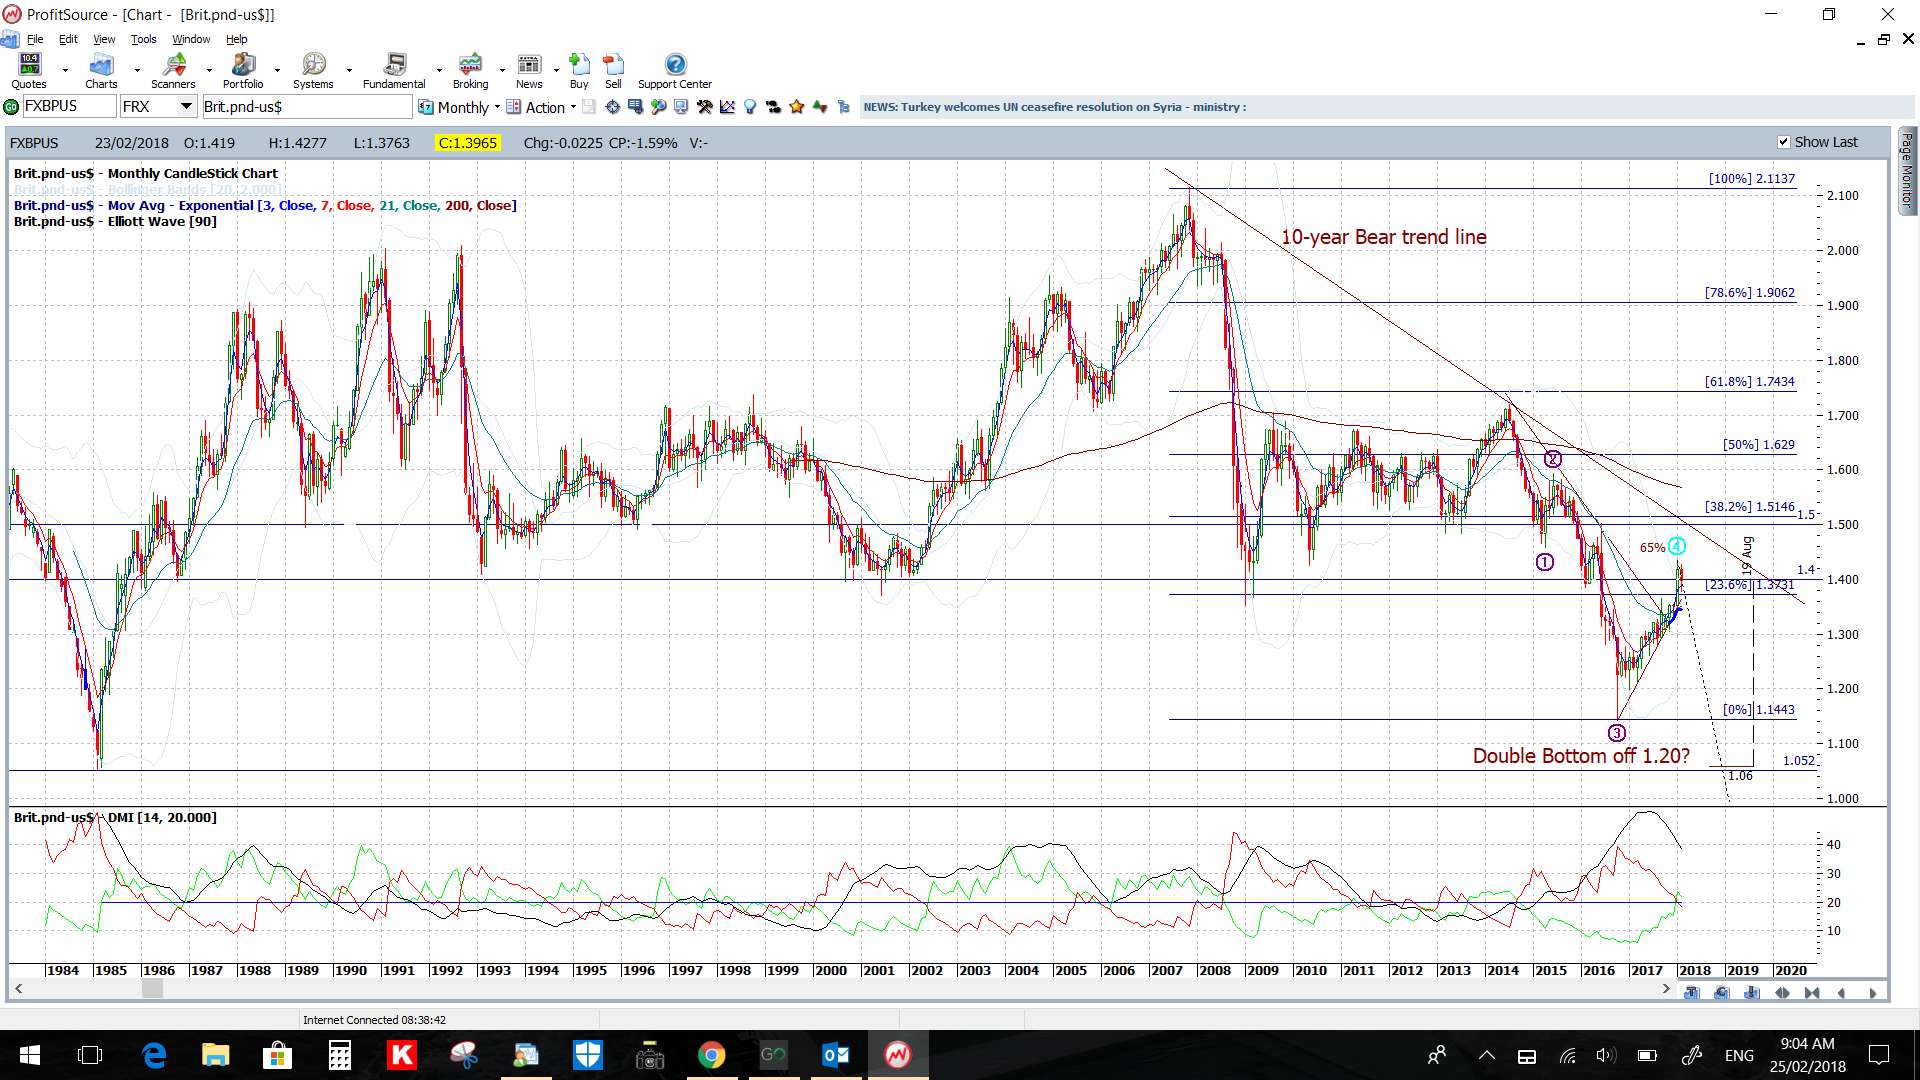
GBP/USD: As per last week, price action continues to consolidate in a triangle and near the 1.40 level and weekly 200 EMA. I’m wondering if one or other of this week’s batch of GBP data might be enough to trigger a break away from this major S/R zone.
Traders need to check the monthly chart below to see the impact of this 1.40 S/R zone on price action for the Cable!
- Watch the triangle trend lines and 1.40 level for any new breakout, especially with this week’s Manufacturing & Construction PMIs and speeches from the UK Prime Minister May and BoE Gov Carney:
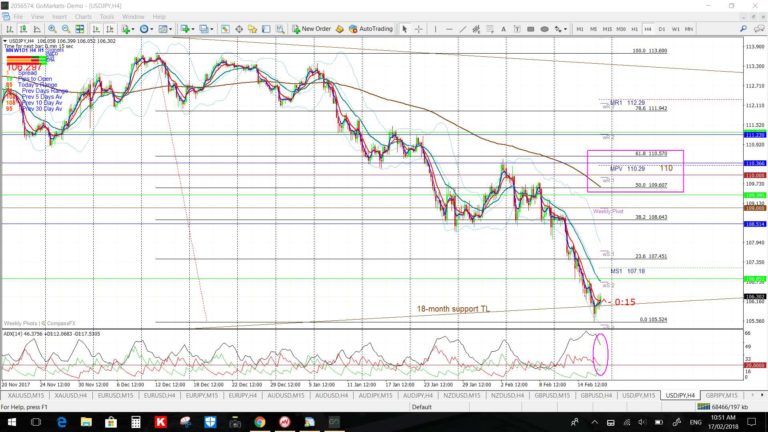
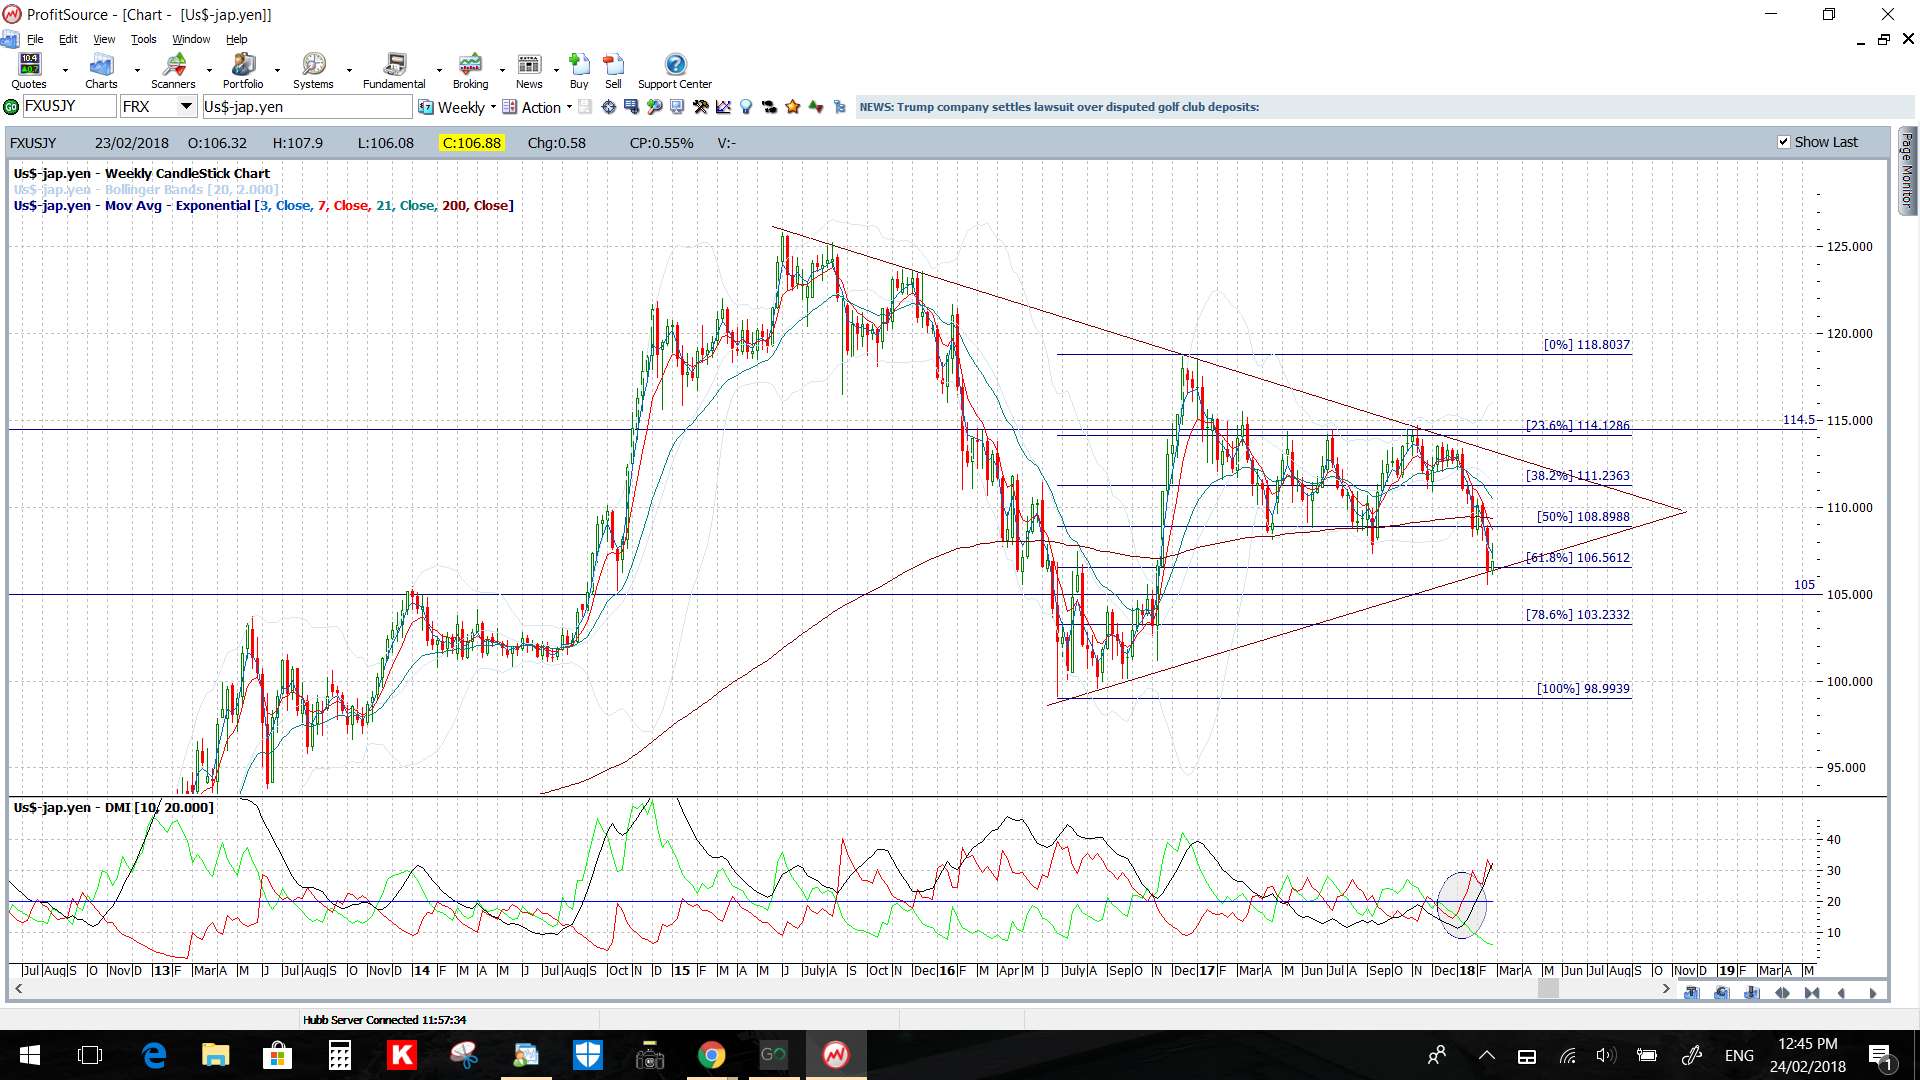
USD/JPY: This pair gave a great TC signal last week for up to 150 pips and I’ll be looking for more opportunities in the coming week. This was not a TC signal that came with a 4hr chart trend line break but, rather, what I call an ‘internal’ TC signal as price bounced up from a long-term weekly support trend line. The weekly chart from last week’s post is shown and this support trend line can be seen quite clearly:
U/J weekly from last week’s post:
U/J 15′ TC signal from bounce off support:

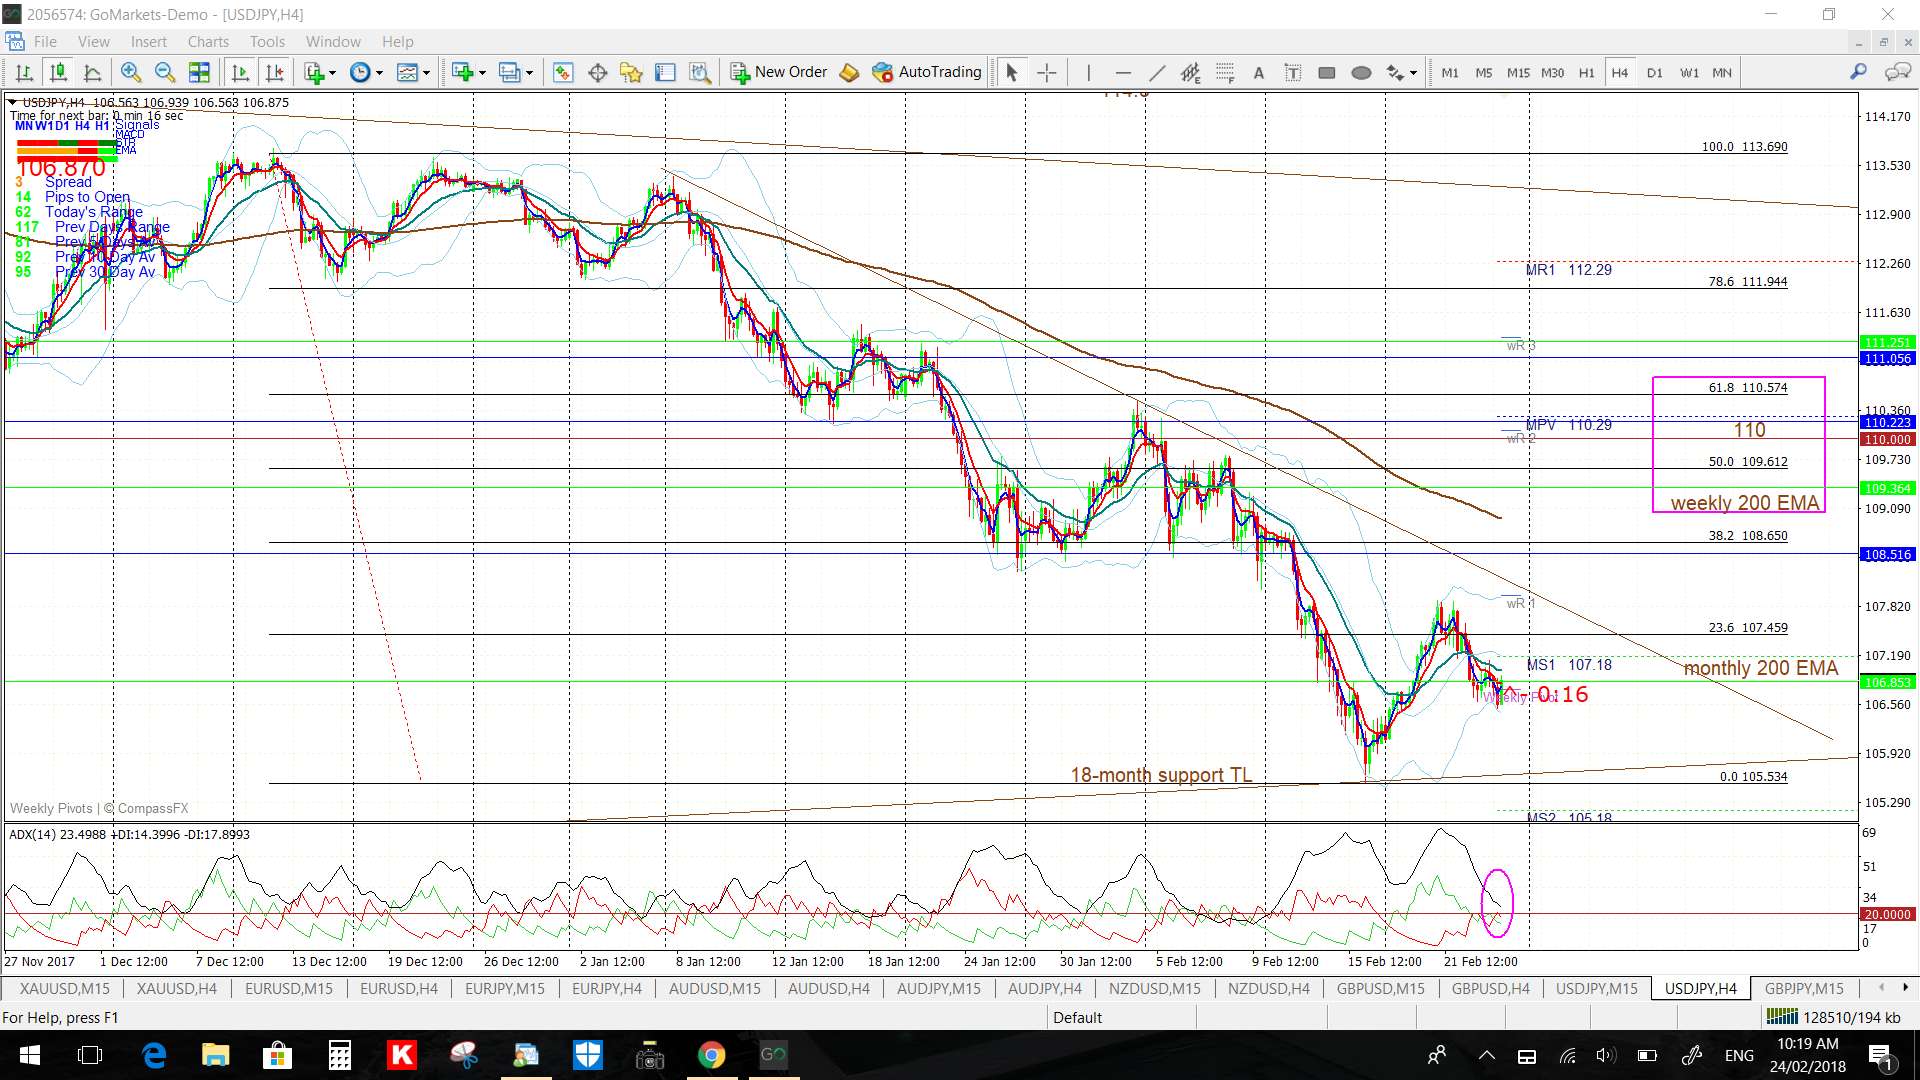
I’ve now added a new 4hr chart bear trend line so there is a new triangle to monitor for any potential breakout. I’m still on the lookout for any recovery move up to the 110 S/R level here as this is still the 4hr chart’s 61.8% fib.
- Watch the 4hr chart triangle trend lines for any new breakout:
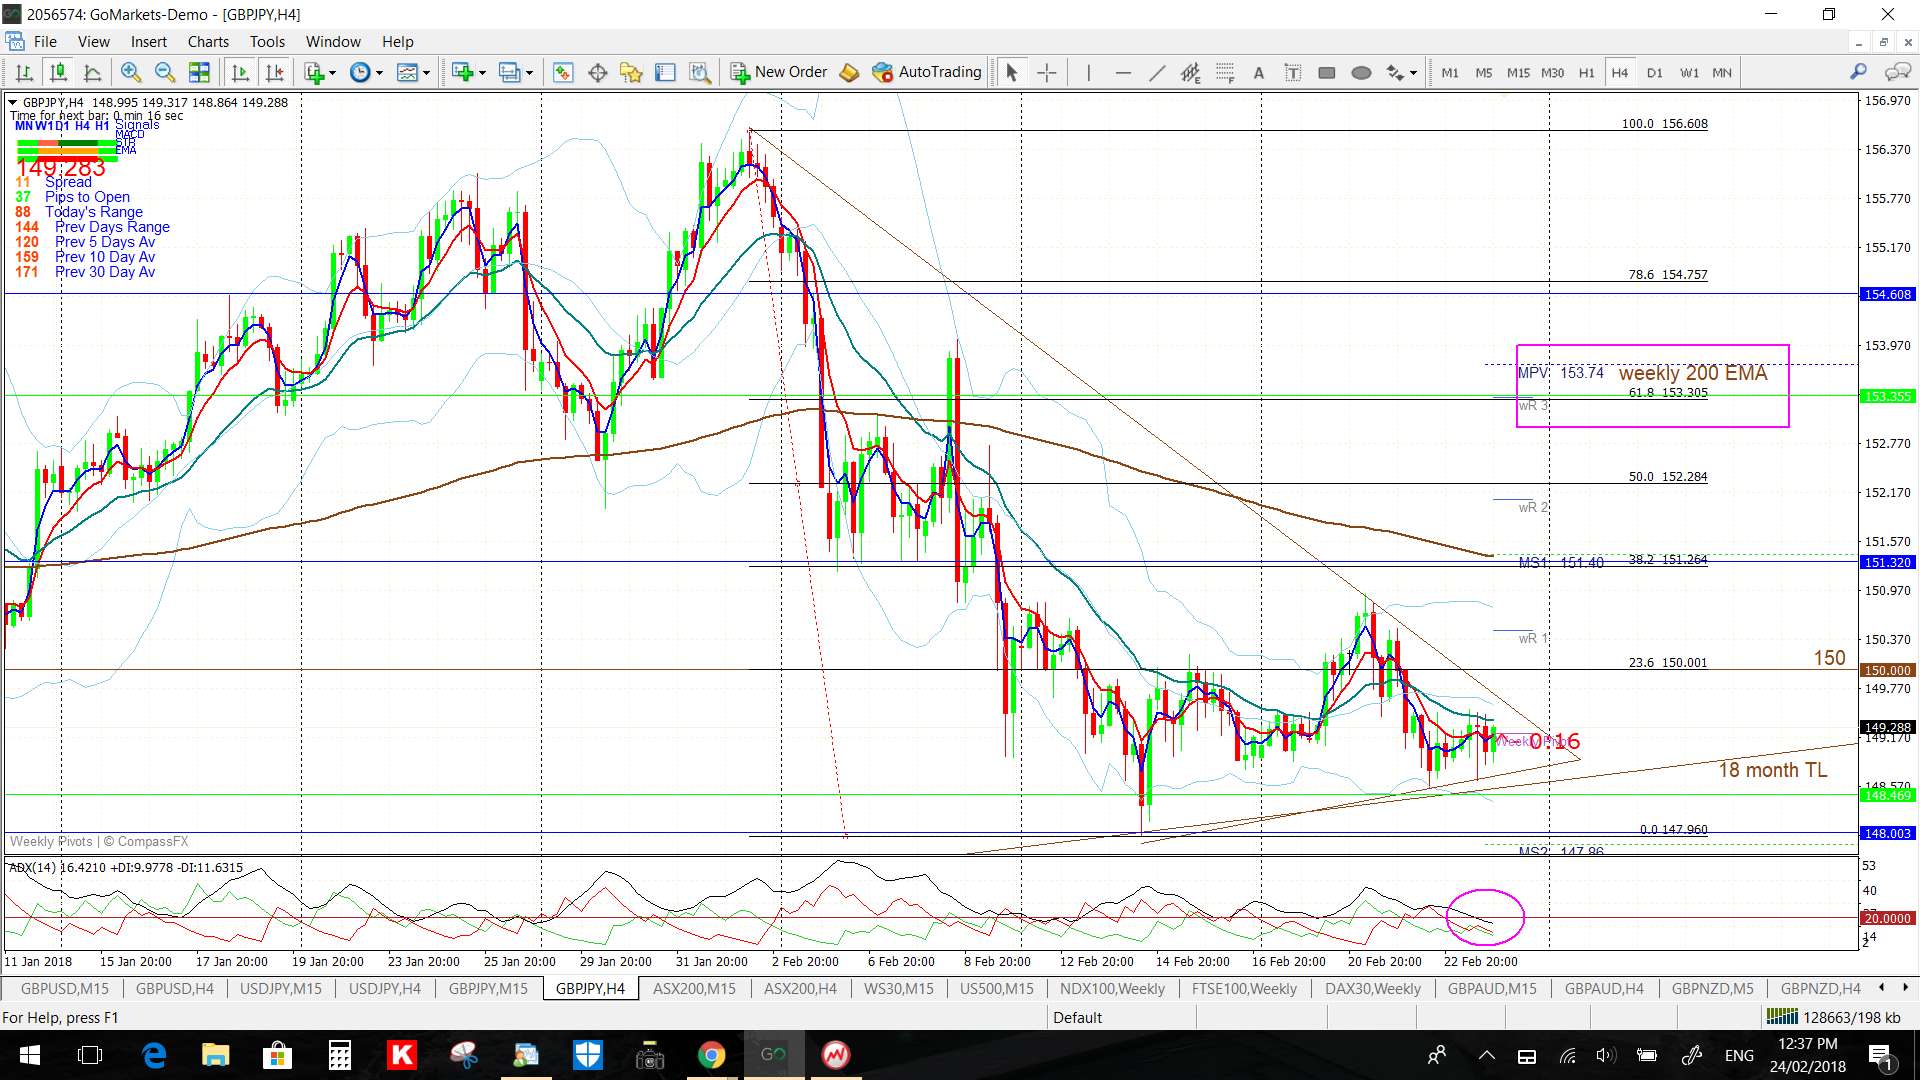
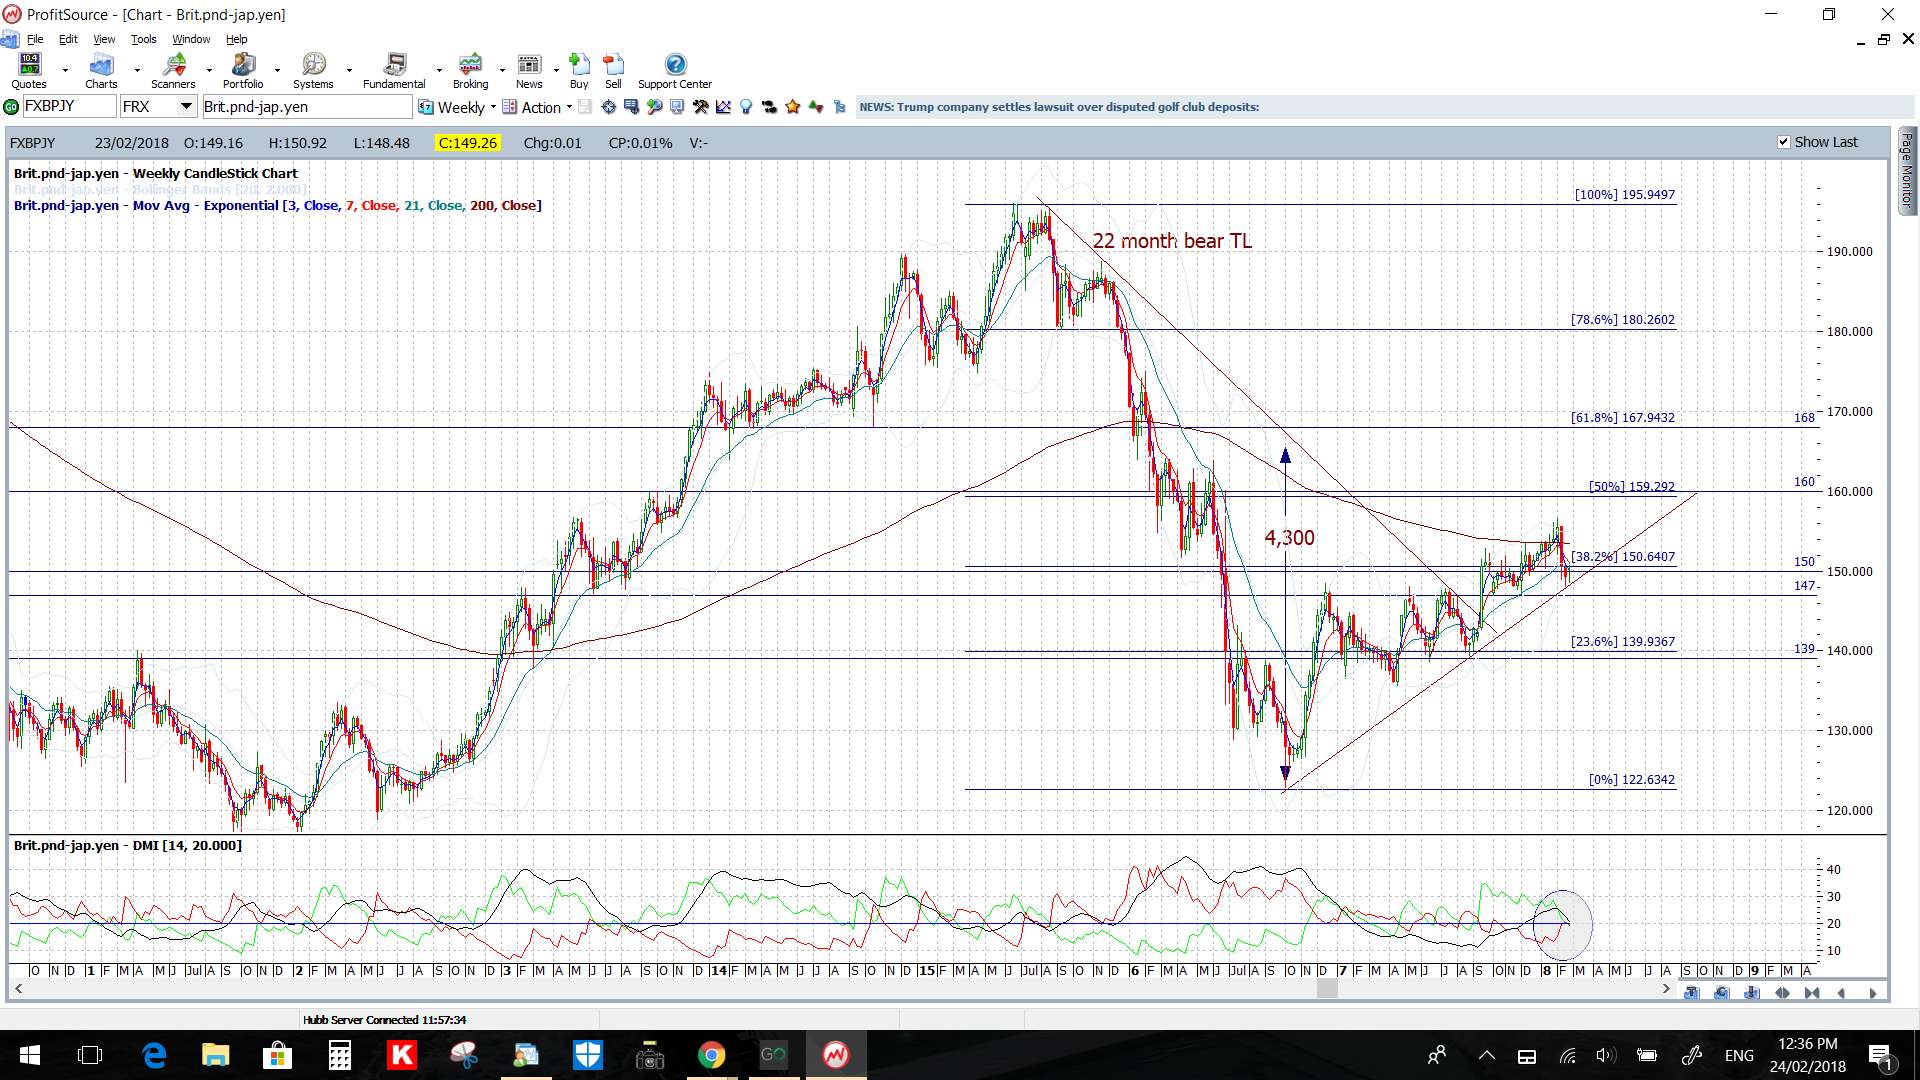
GBP/JPY: Like last week, I’m still watching for any relief rally to test the weekly 200 EMA level here as this is the 4hr chart’s 61.8% fib and there is long-term support under current price action.
Any break lower would have me looking to the 147 S/R level (see weekly chart).
- Watch the 4hr chart trend lines for any new breakout.
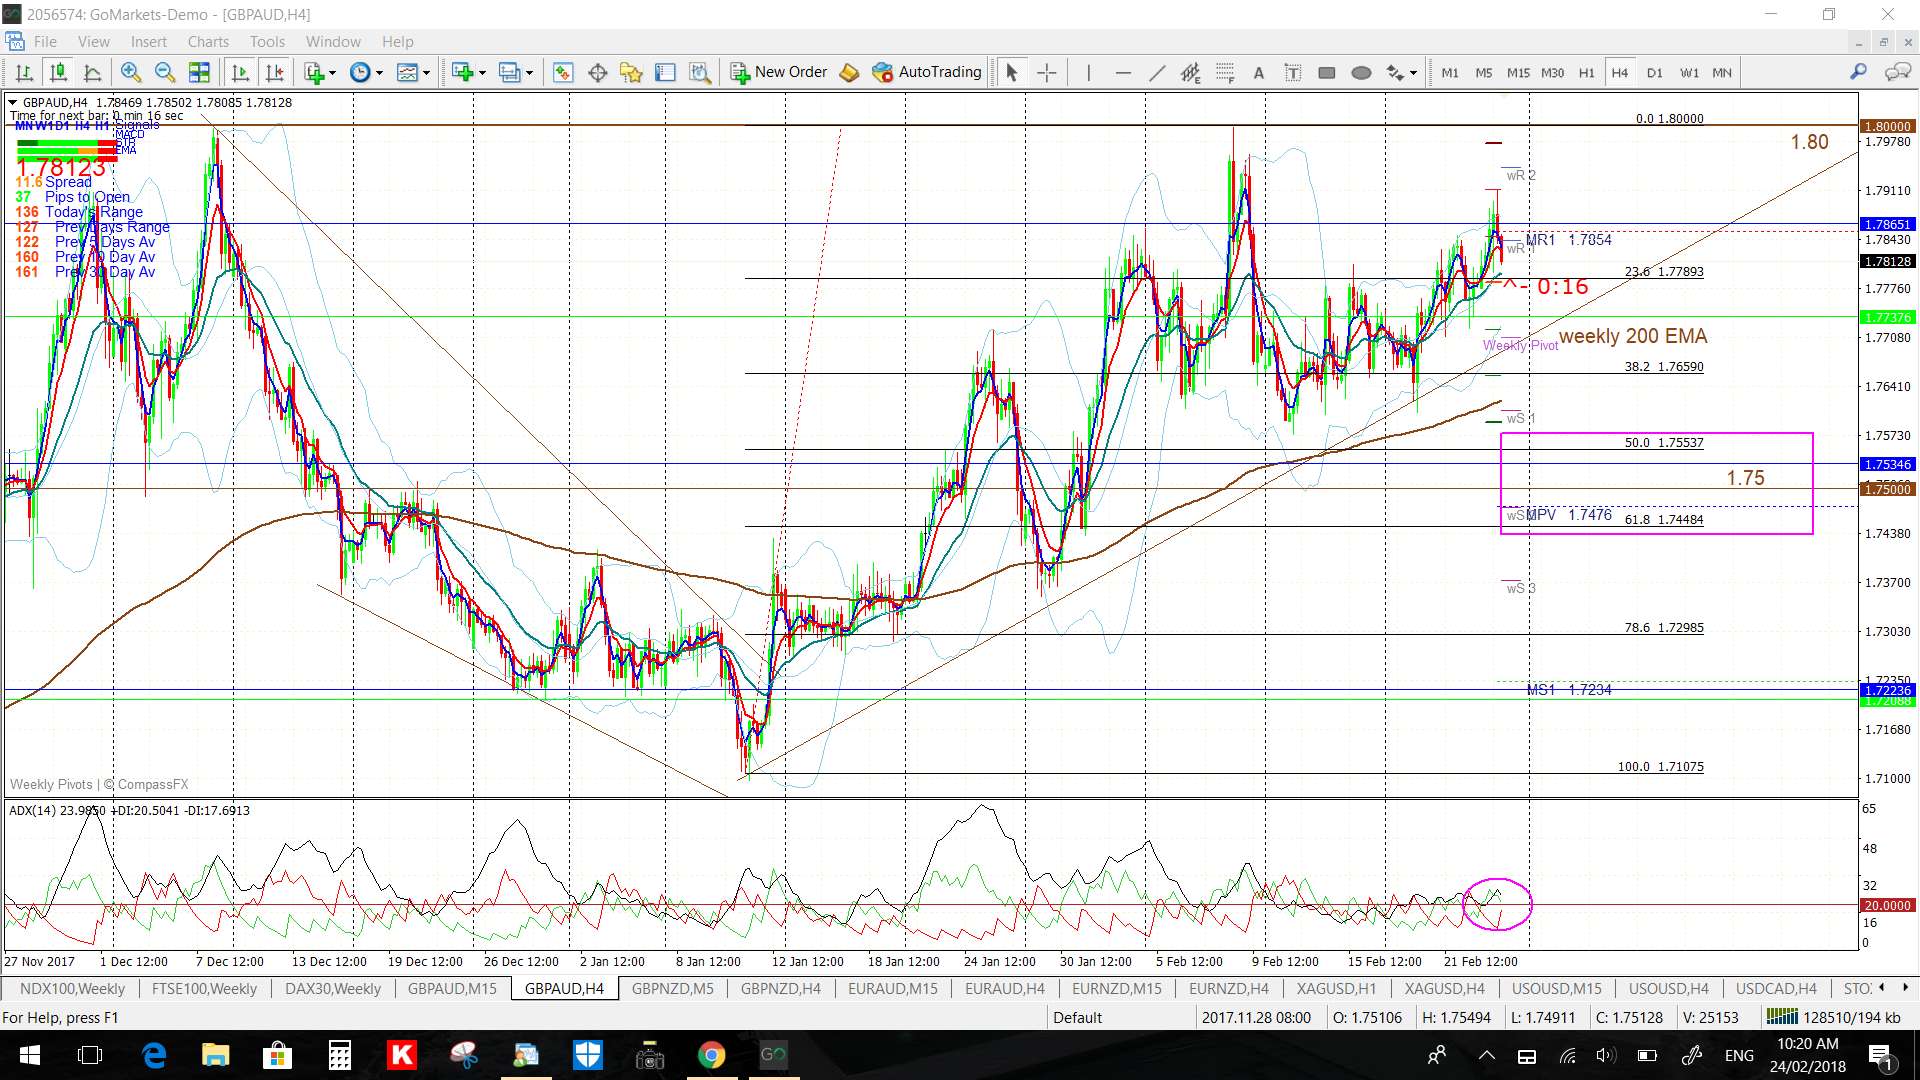
GBP/AUD: This is a little higher for the week but the 1.80 S/R level is still in focus.
- Watch the 4hr chart’s triangle trend lines, weekly 200 EMA and 1.80 for any new breakout:
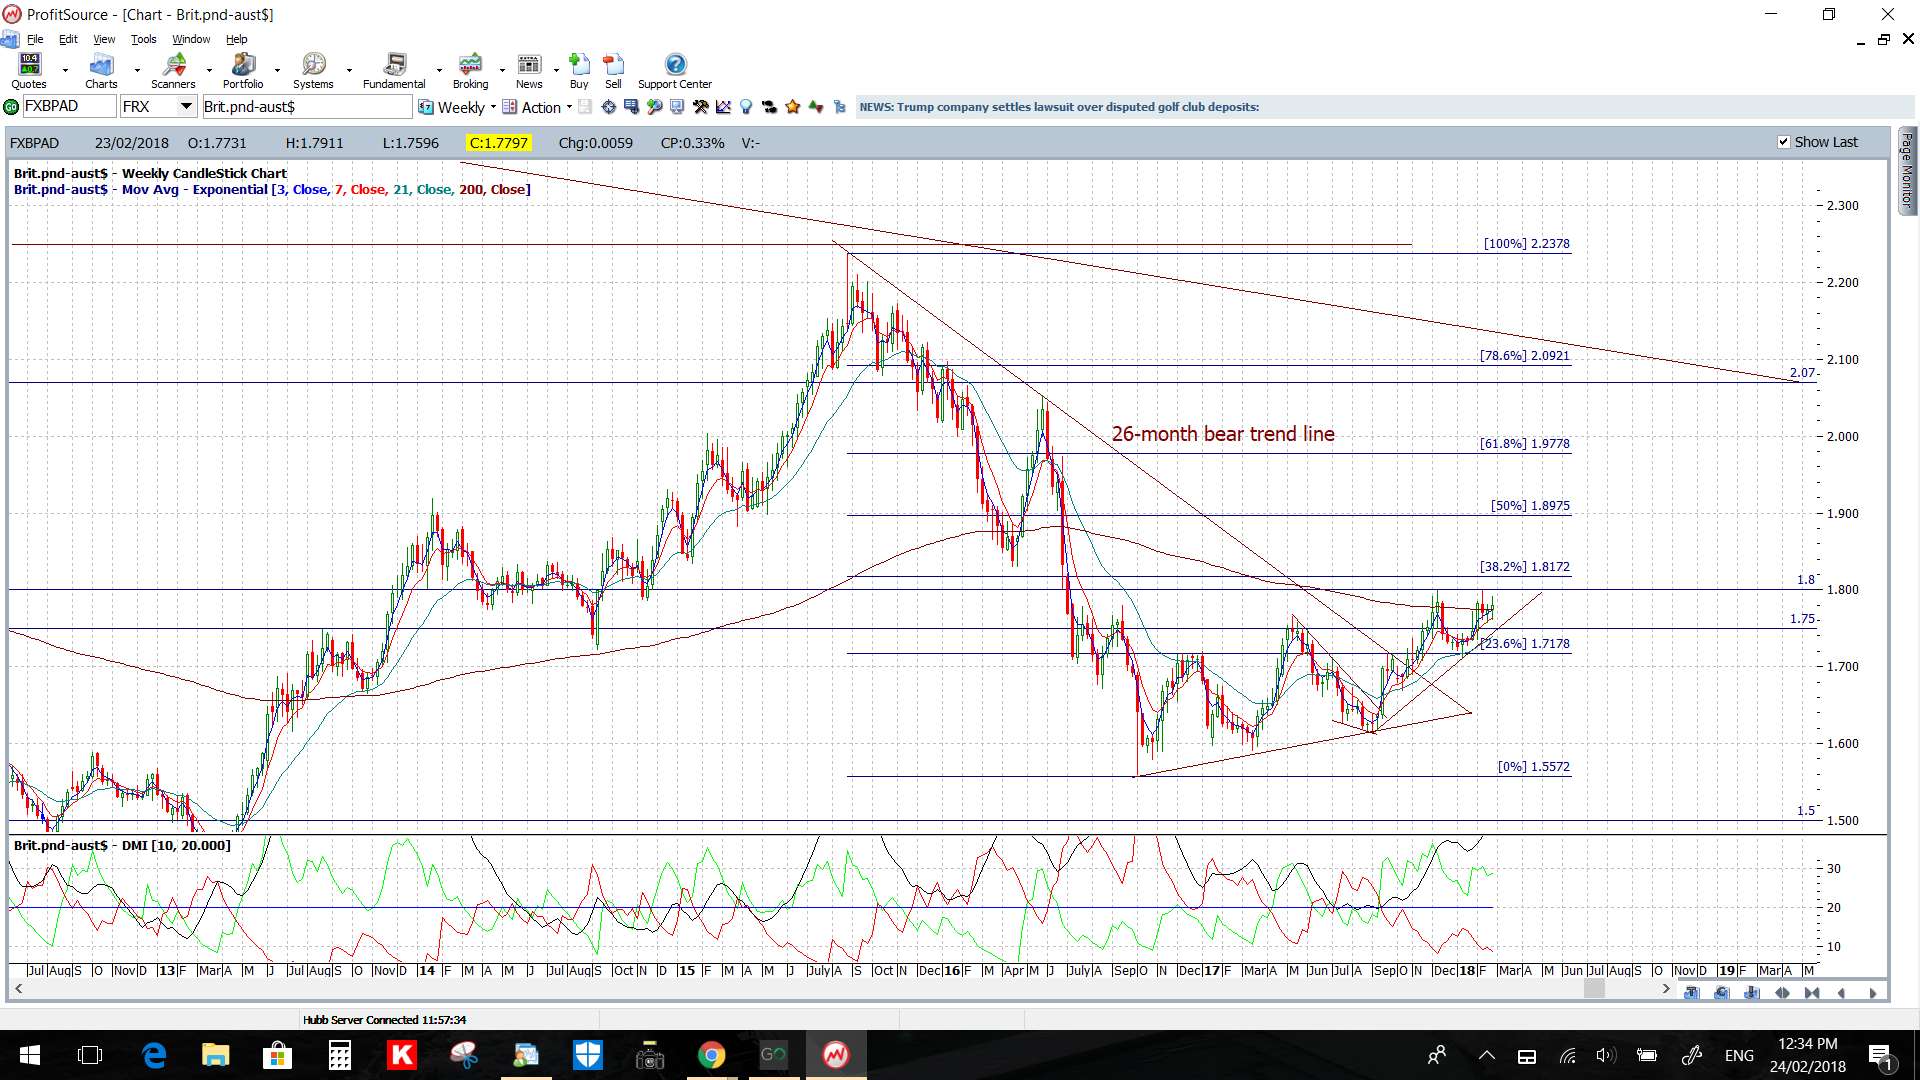
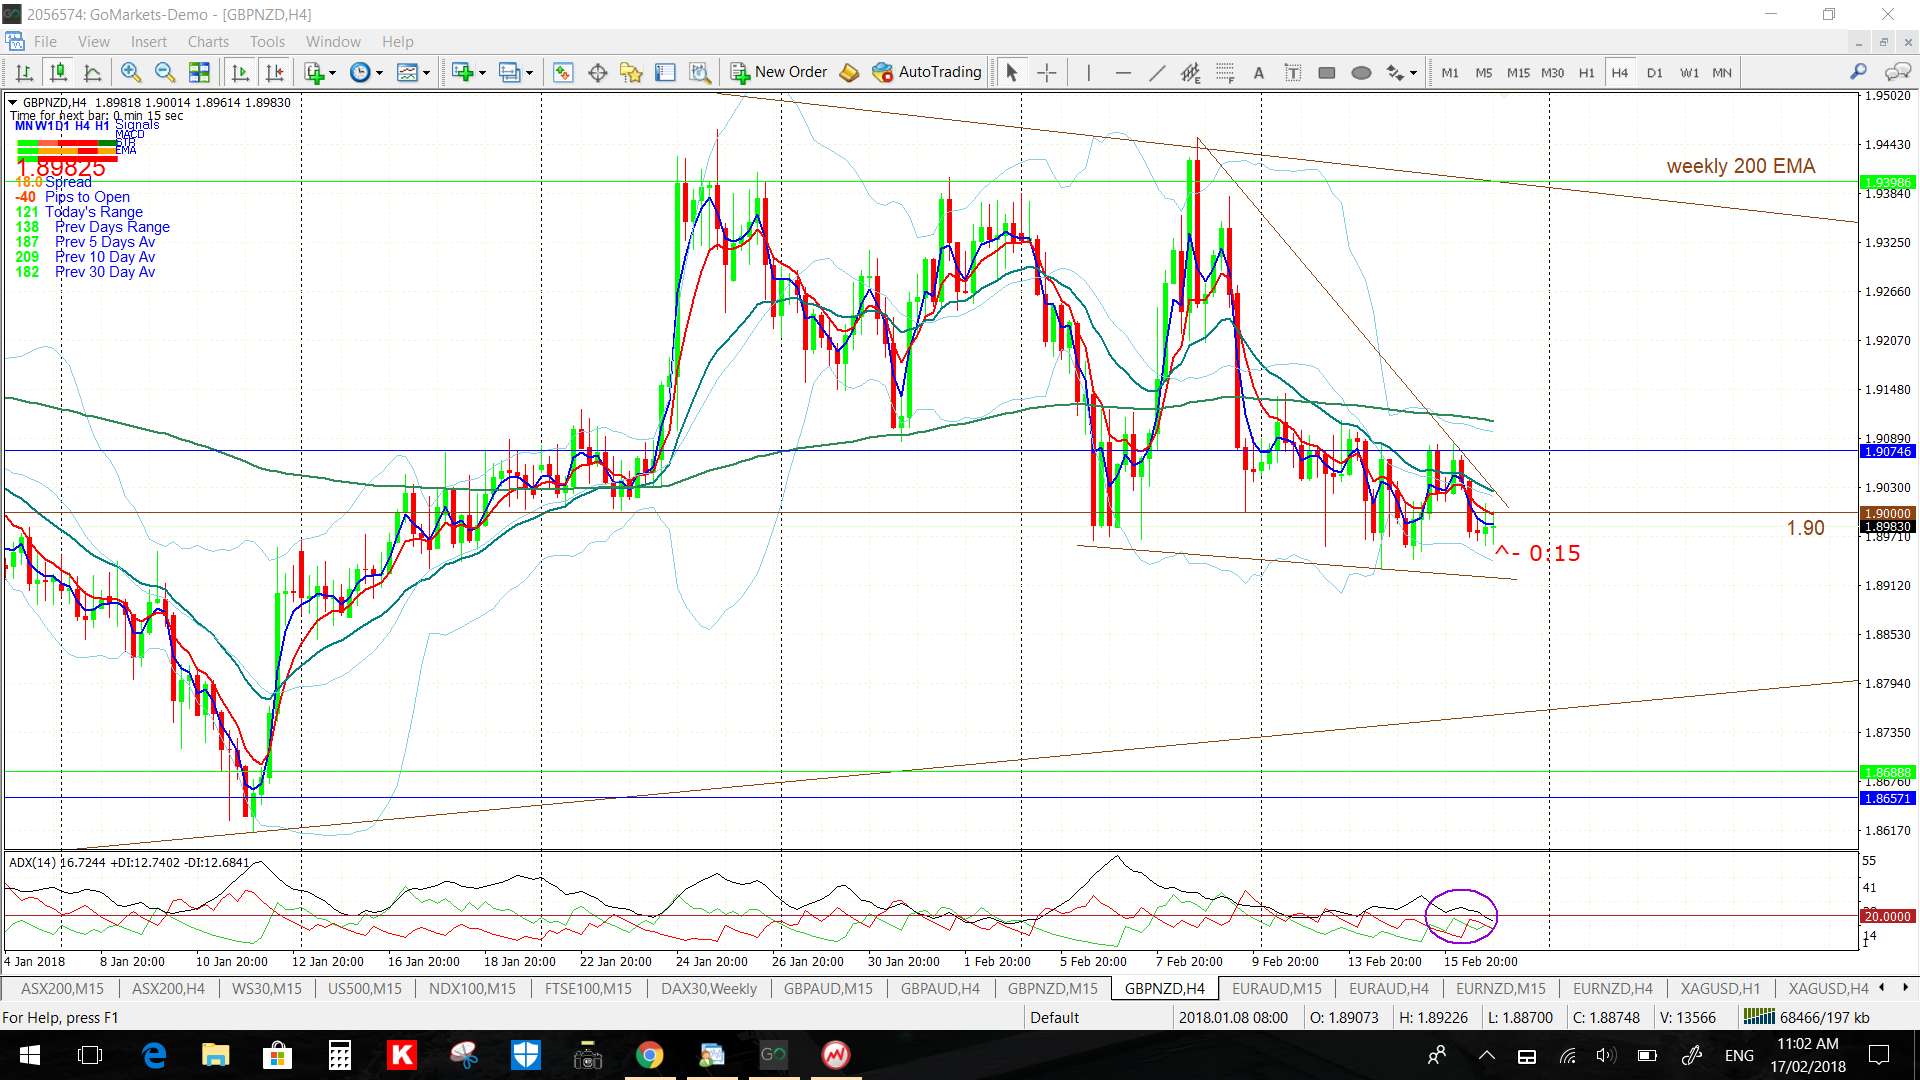
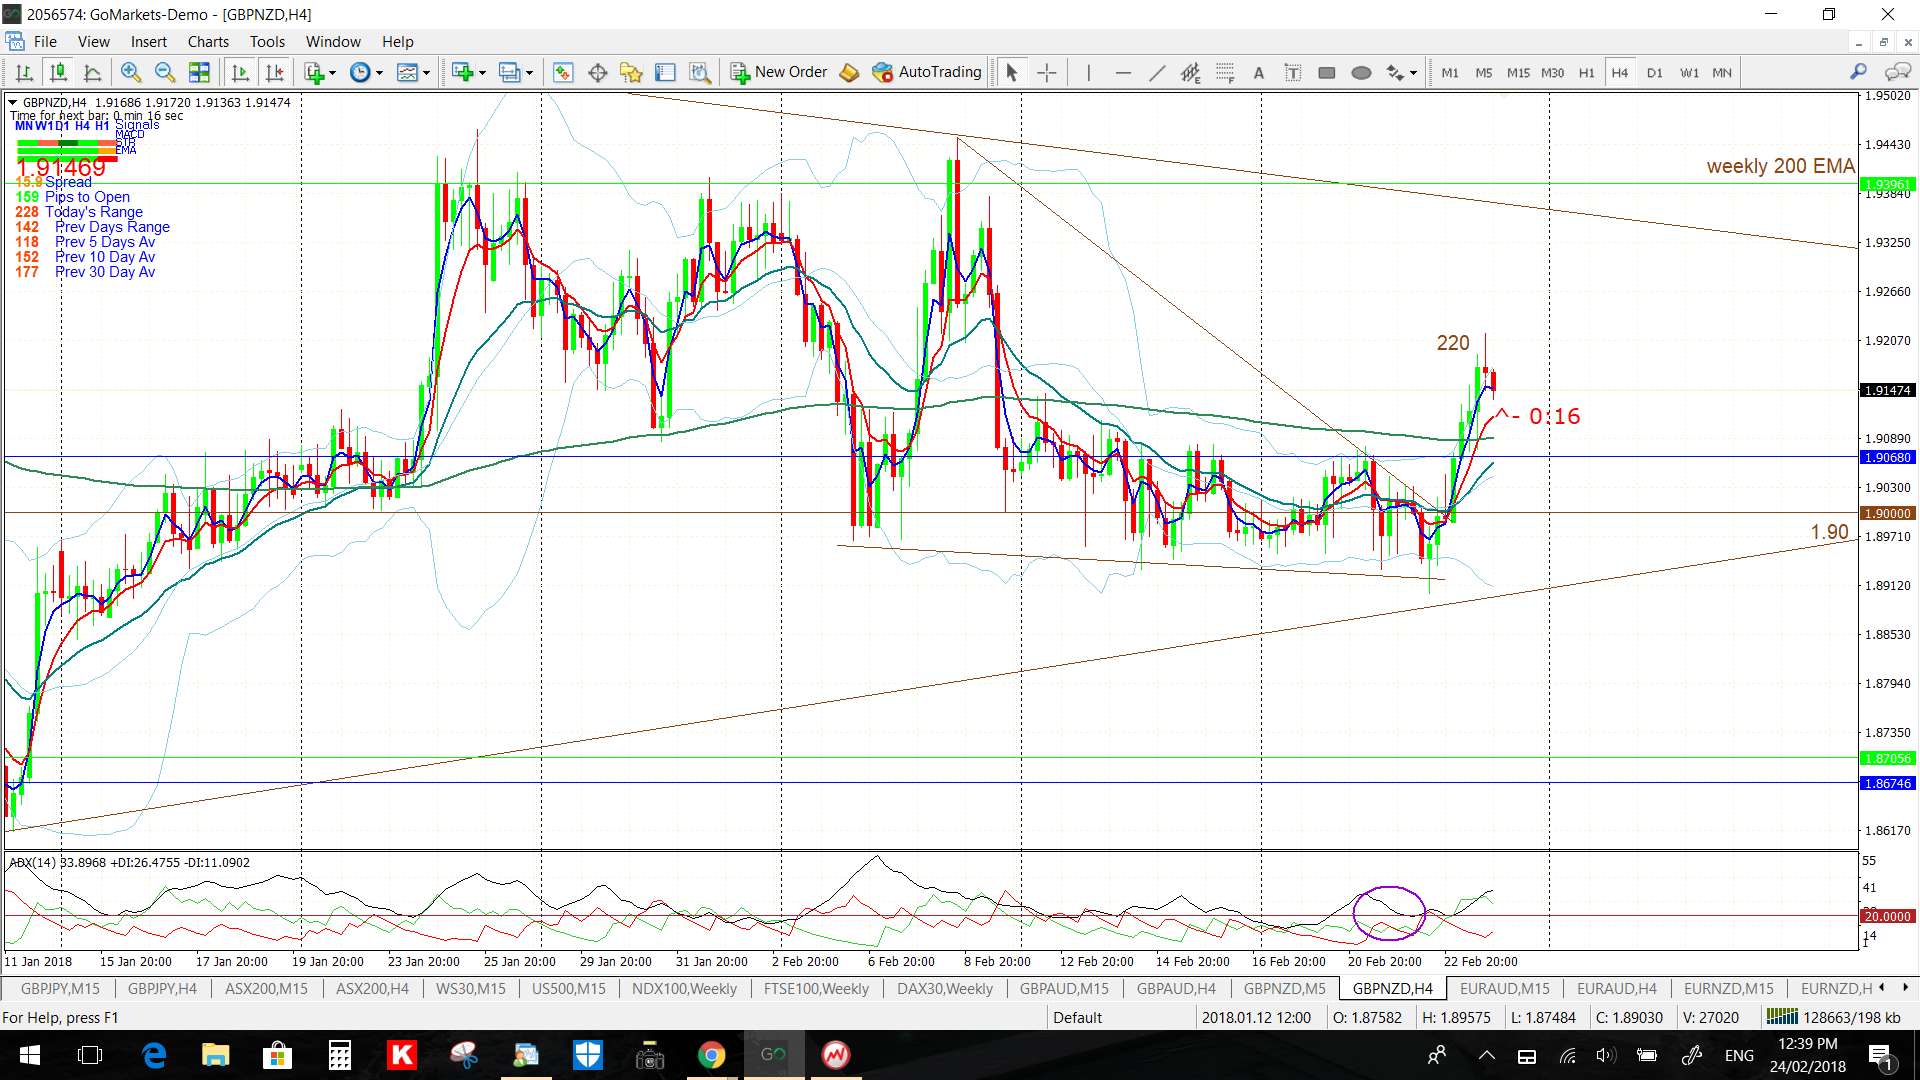
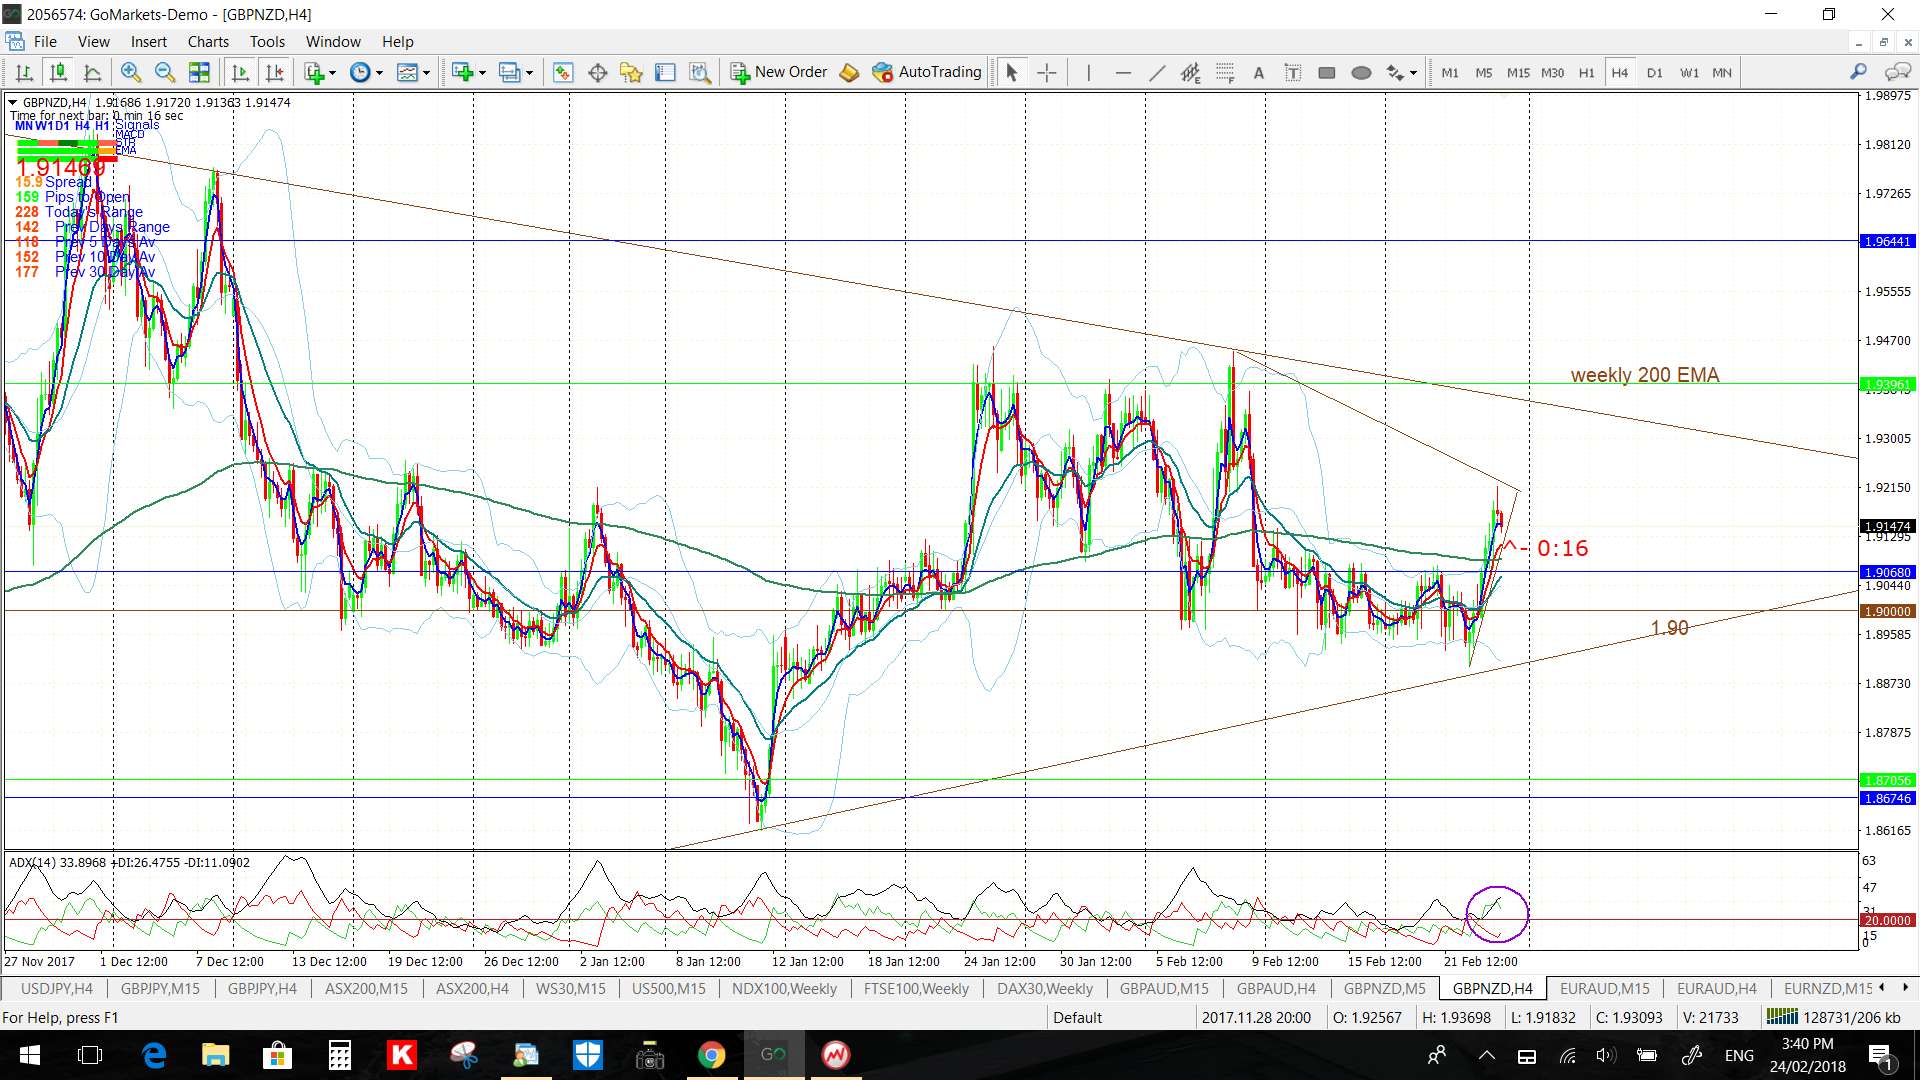
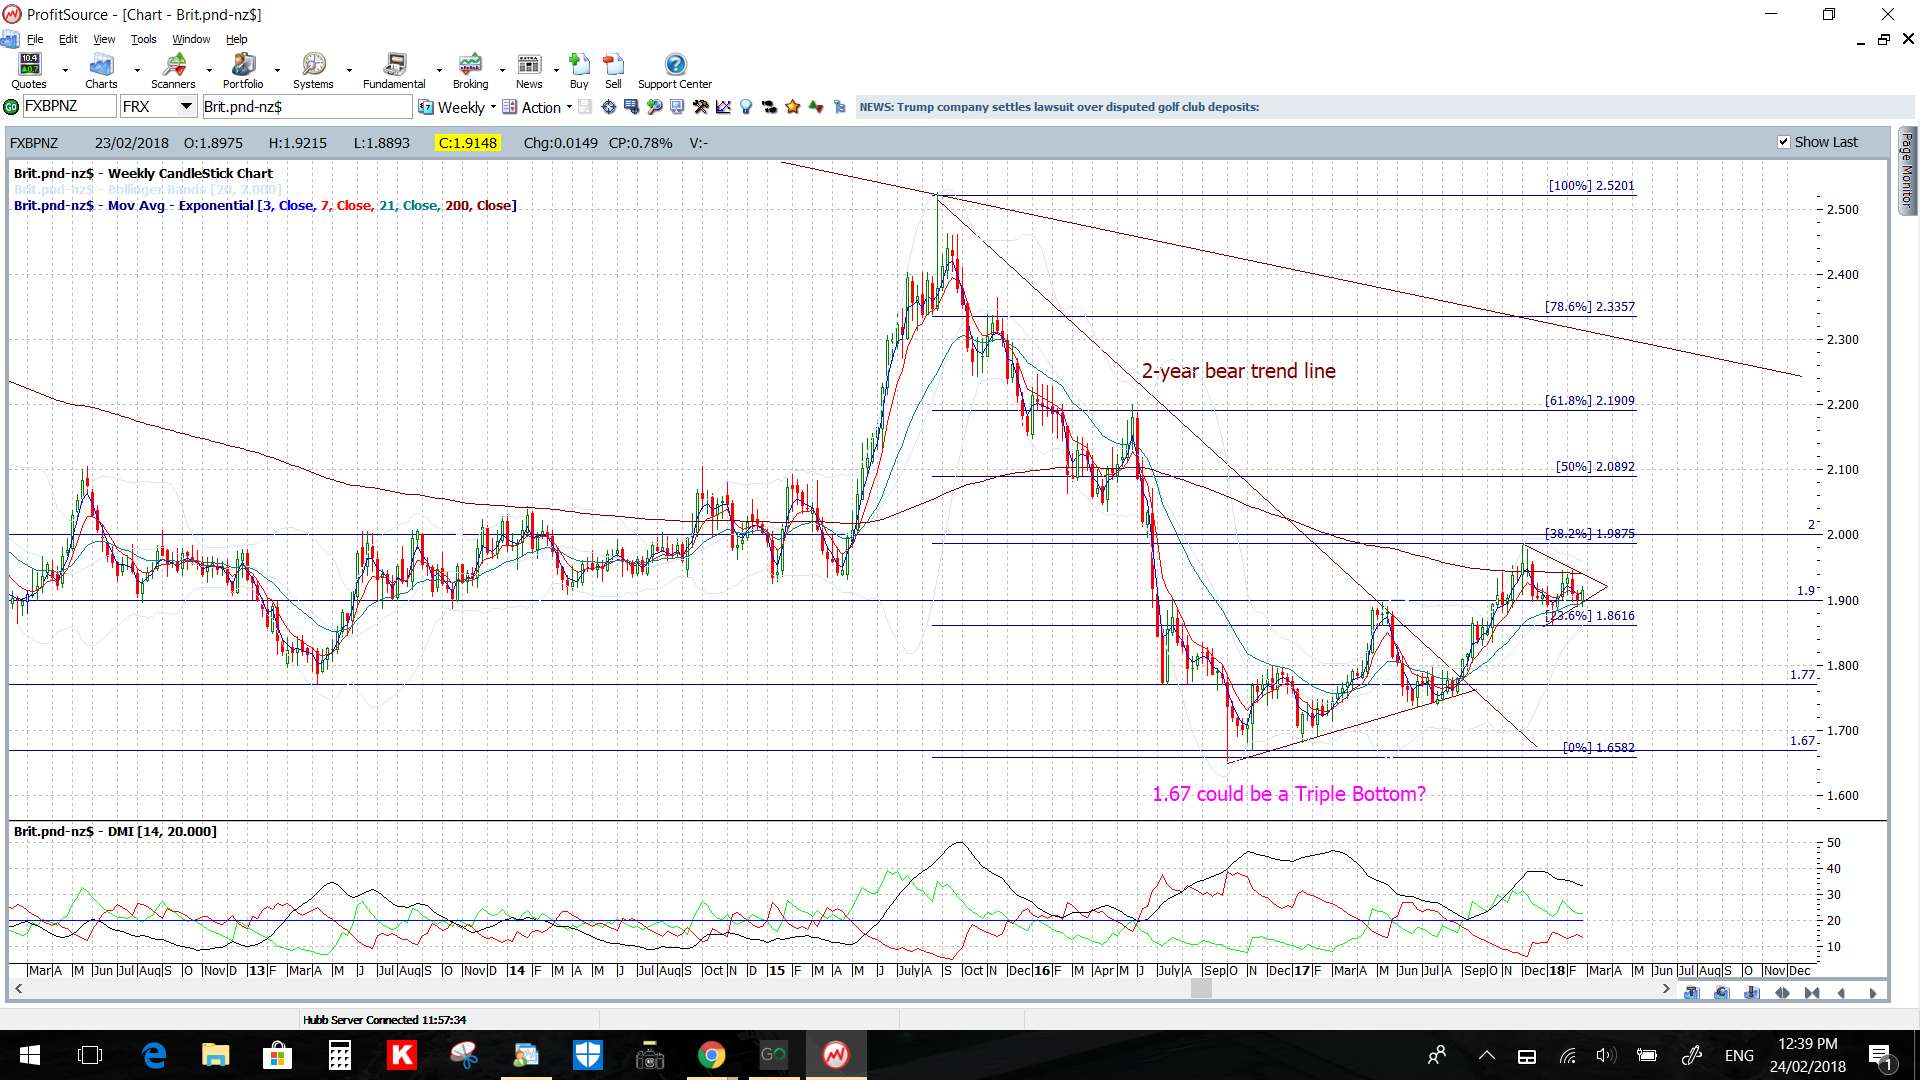
GBP/NZD: This pair gave a great trend line breakout late in the week for up to 220 pips and this move also came with a good TC signal on the 5′ chart.
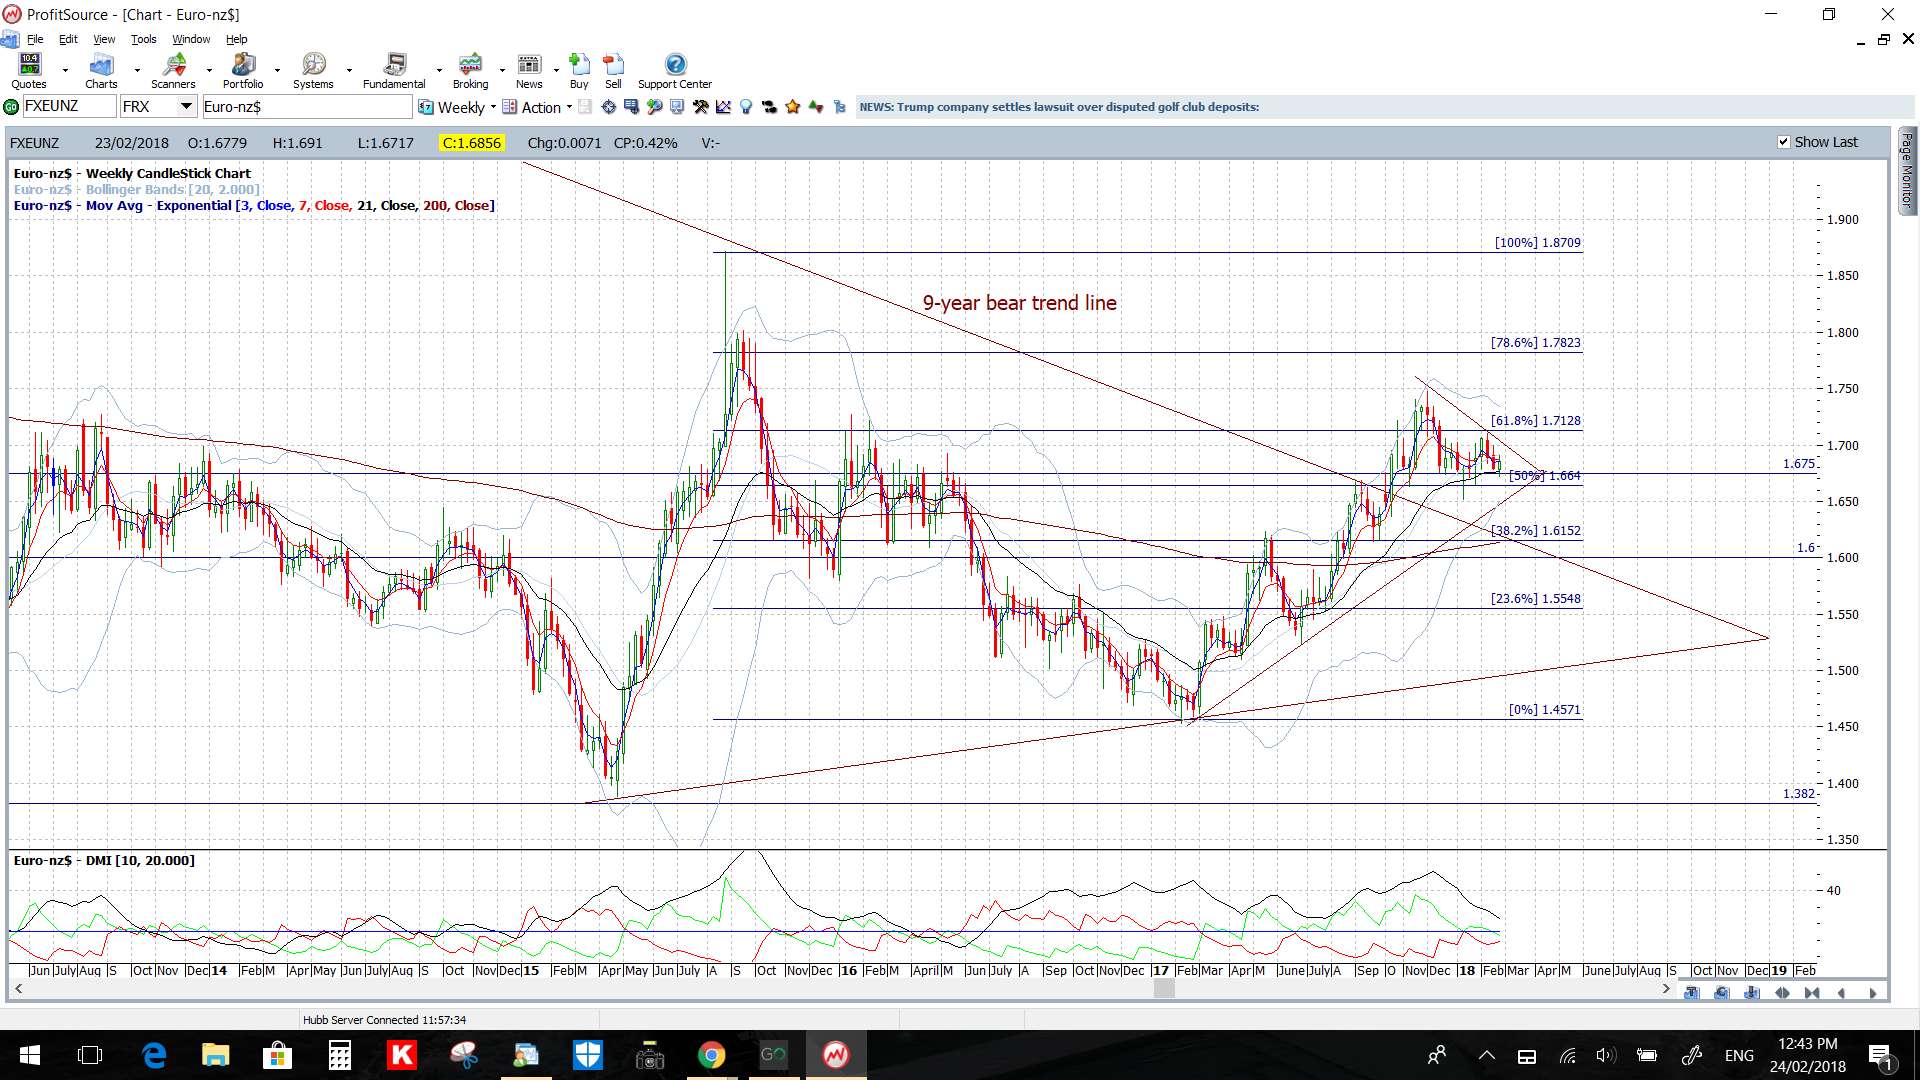
Note the larger triangle on the weekly chart.
- Watch the revised 4hr chart trend lines for any new breakout.
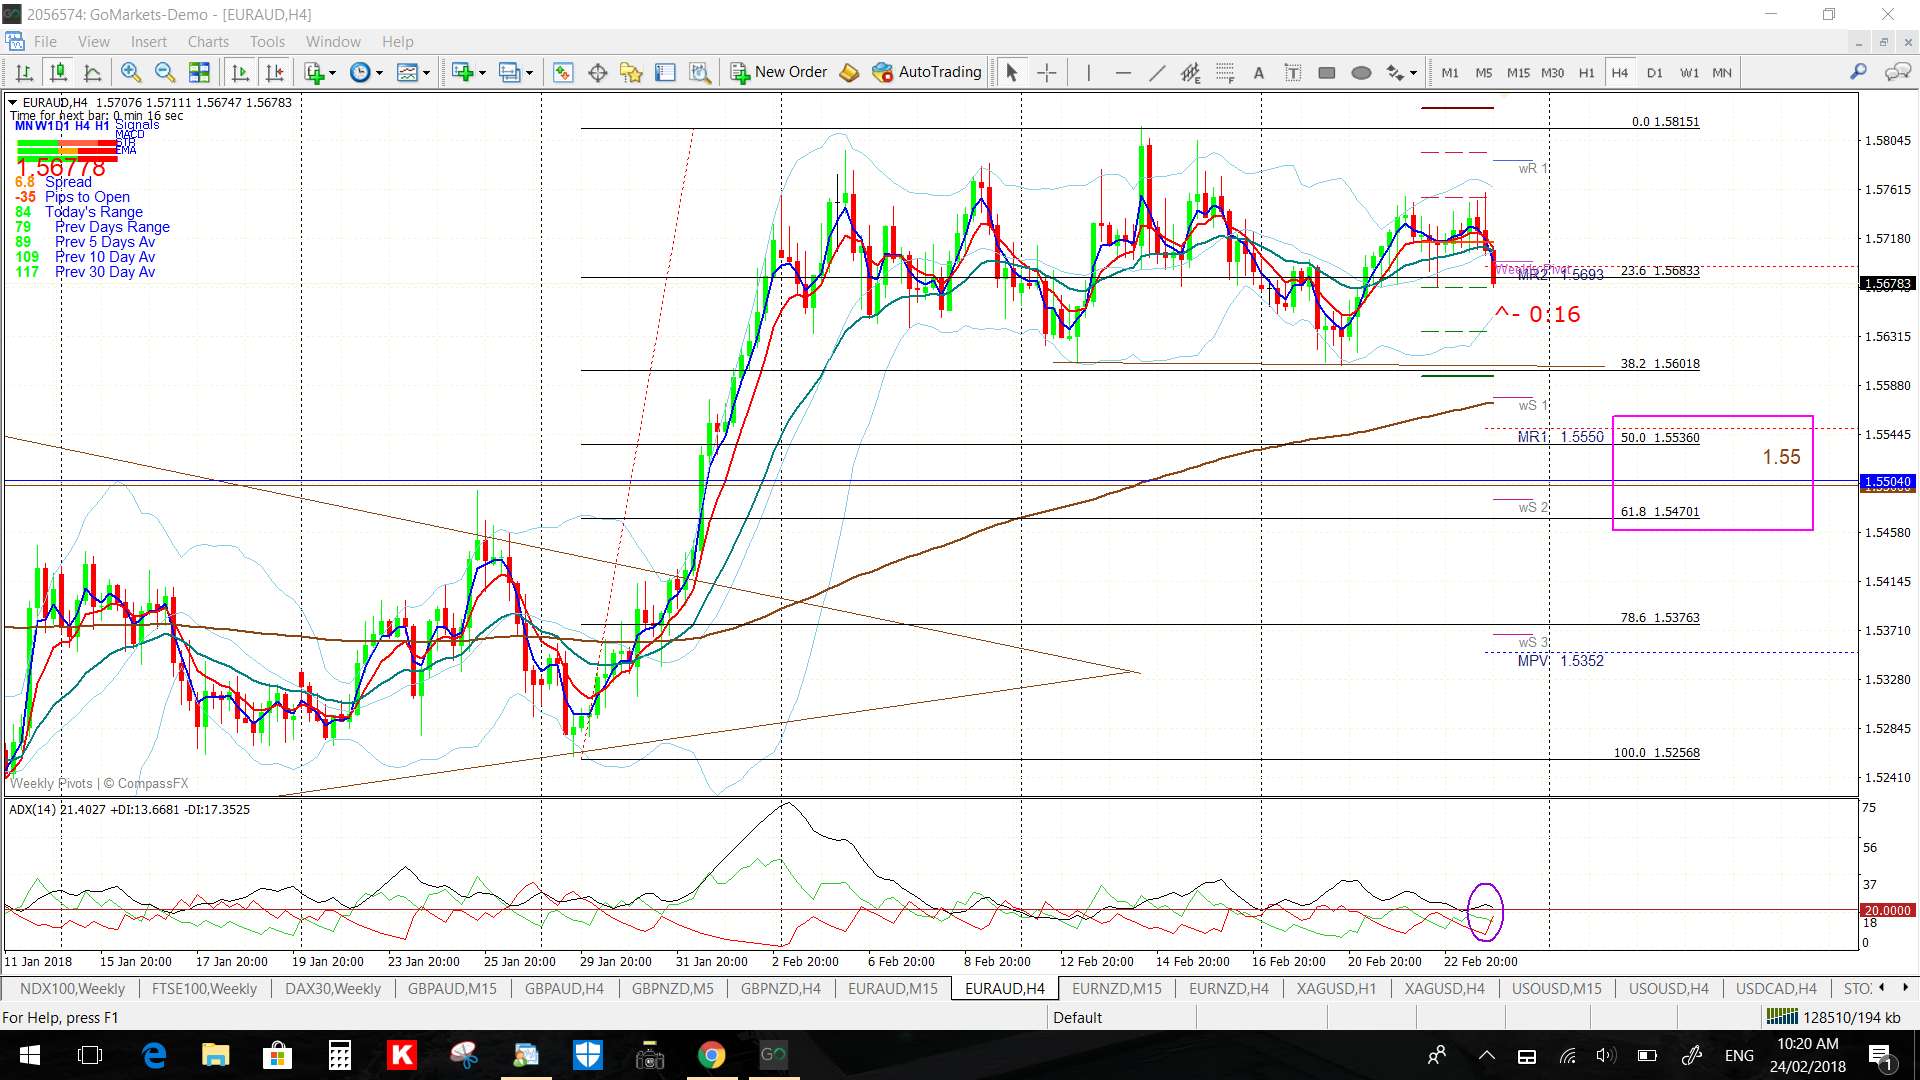
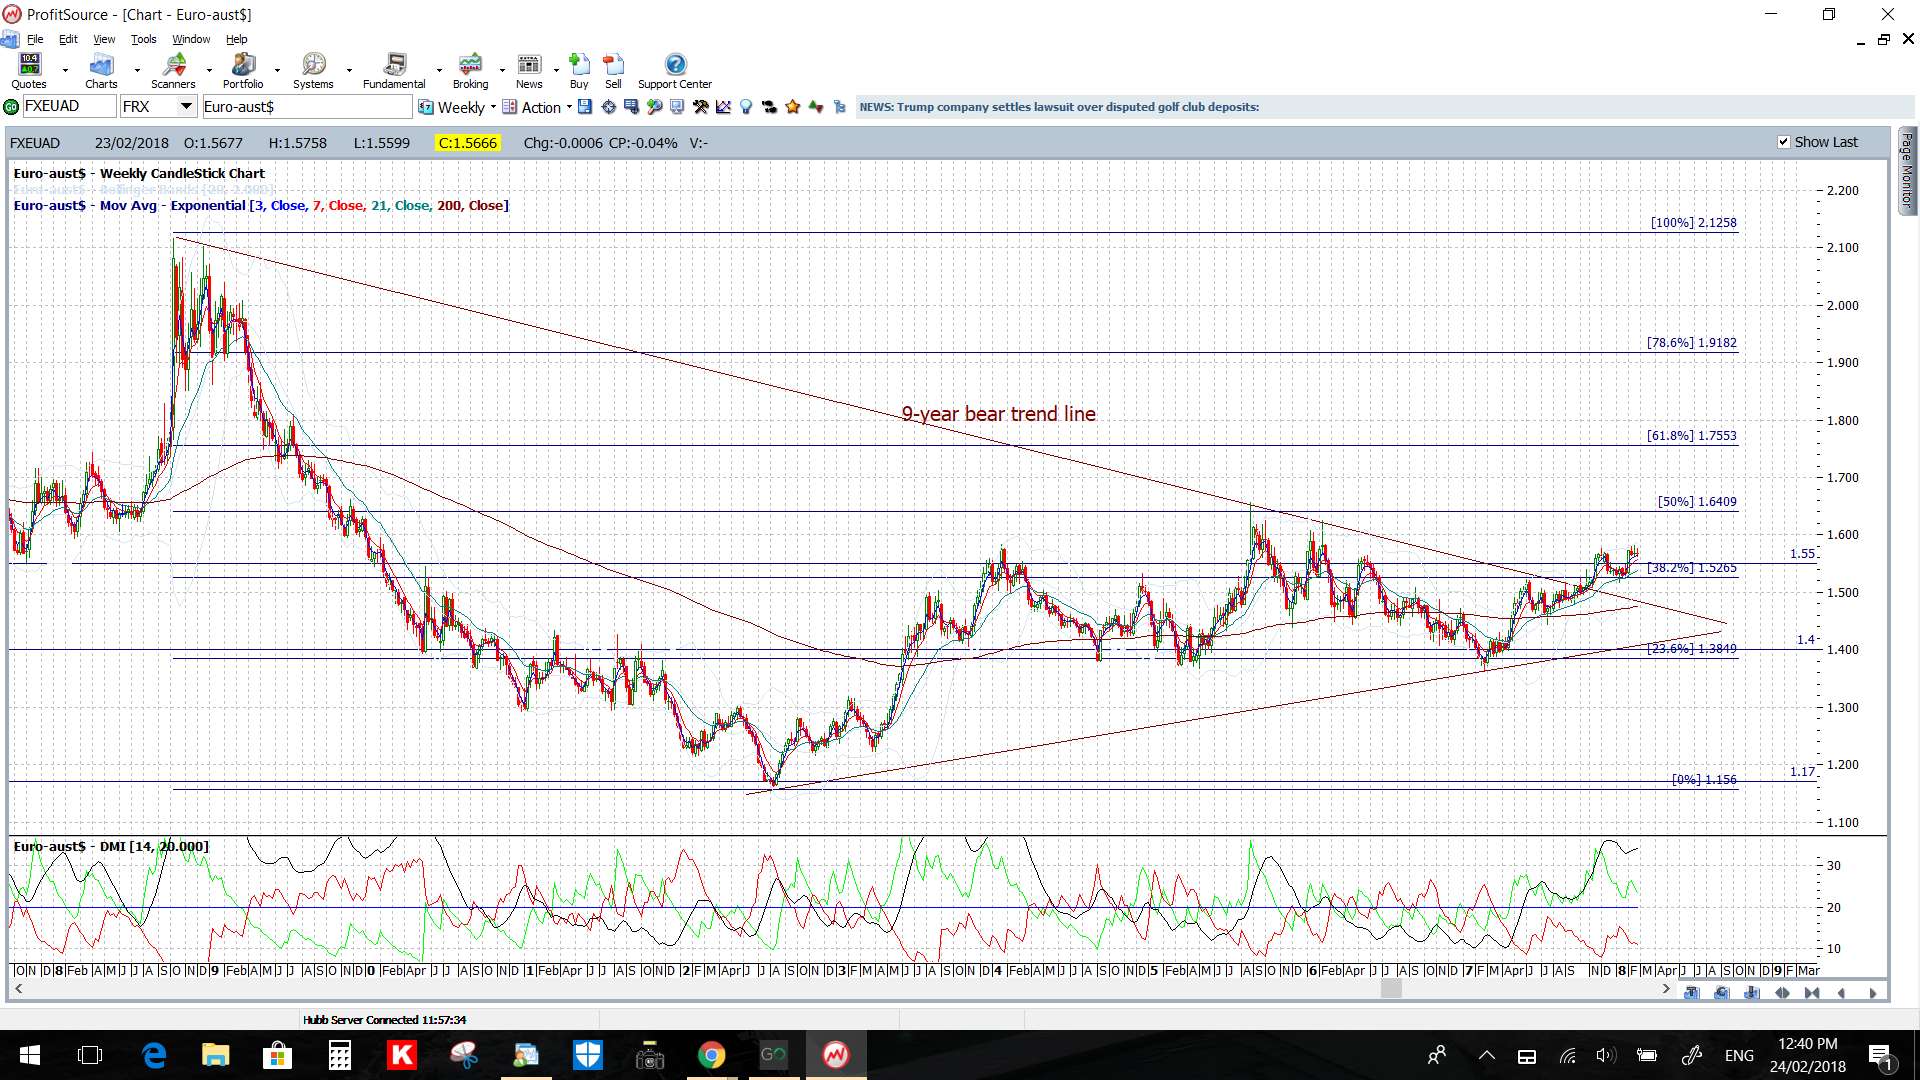
EUR/AUD: This is still ranging within a horizontal channel as price consolidates above the 1.55 level.
Any pullback would have me looking for a test of 1.55 S/R.
- Watch the 4hr chart’s channel trend lines for any new breakout:
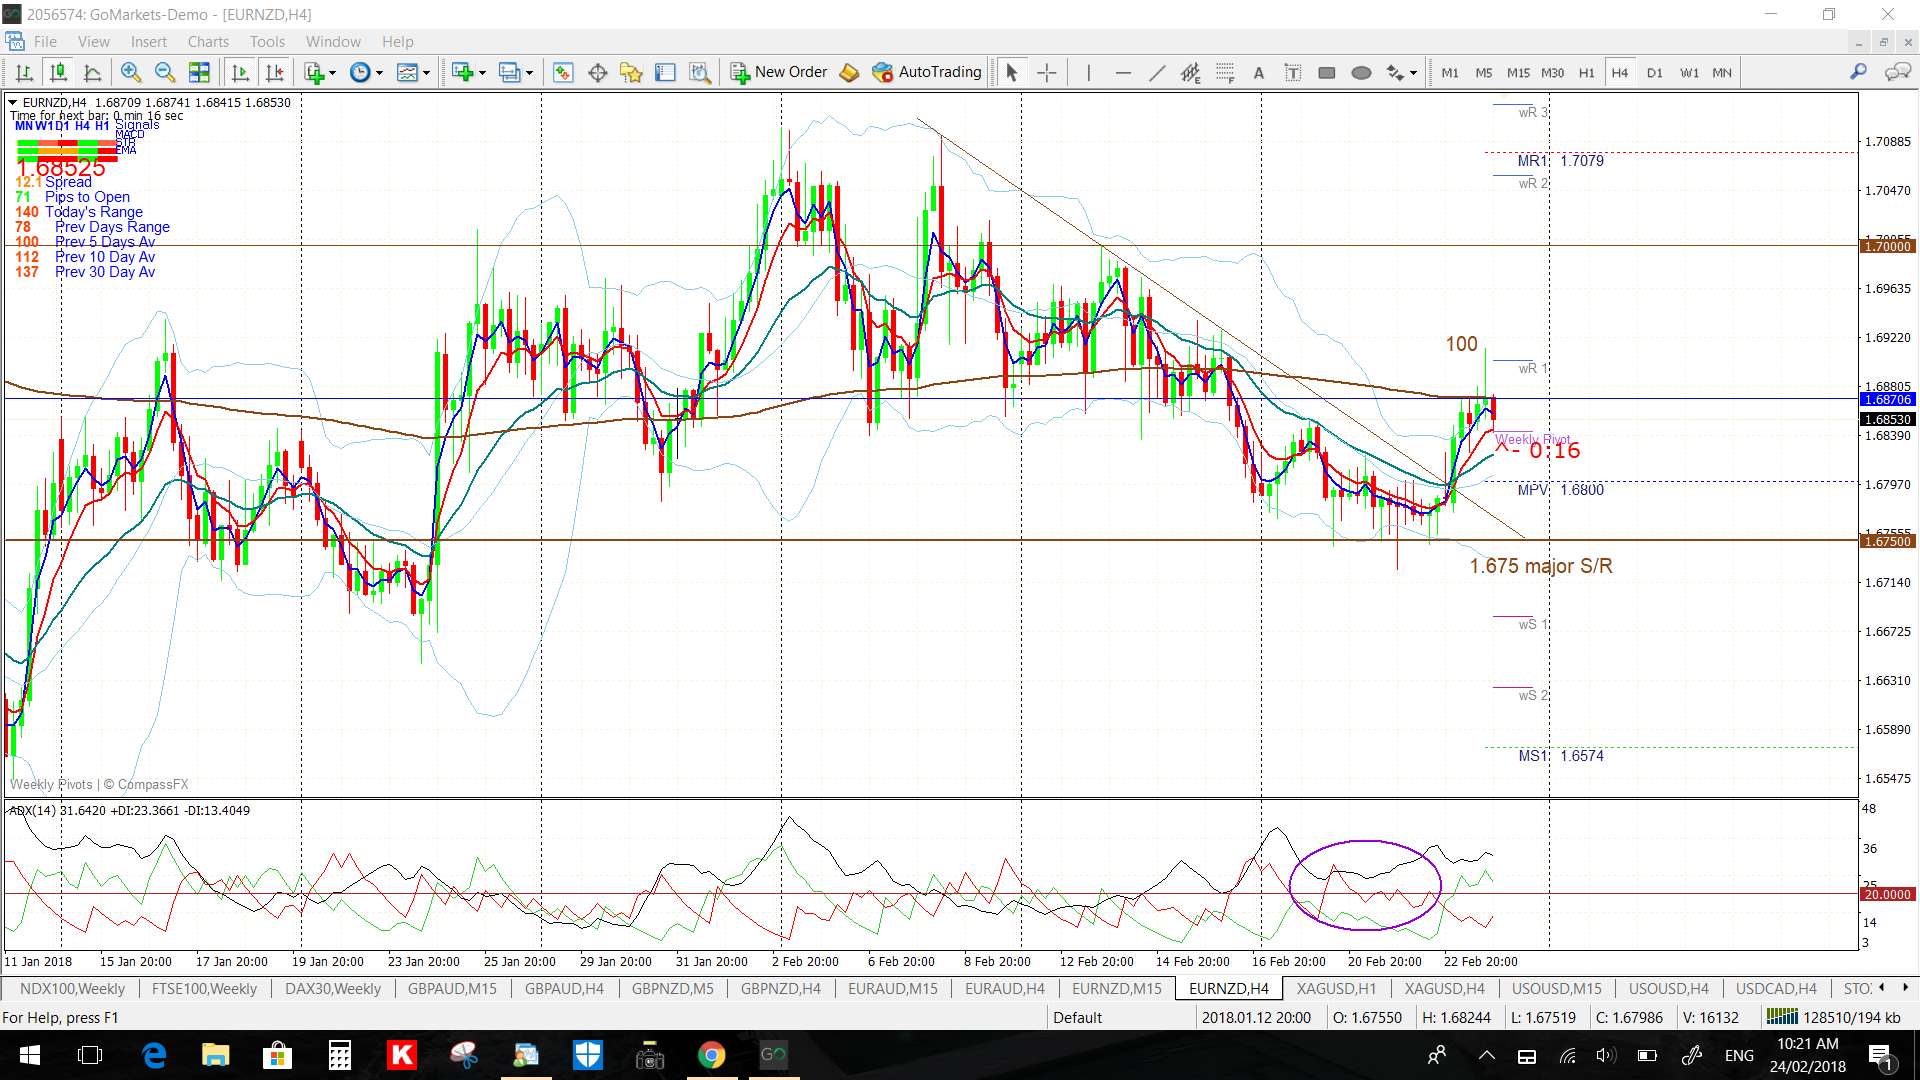
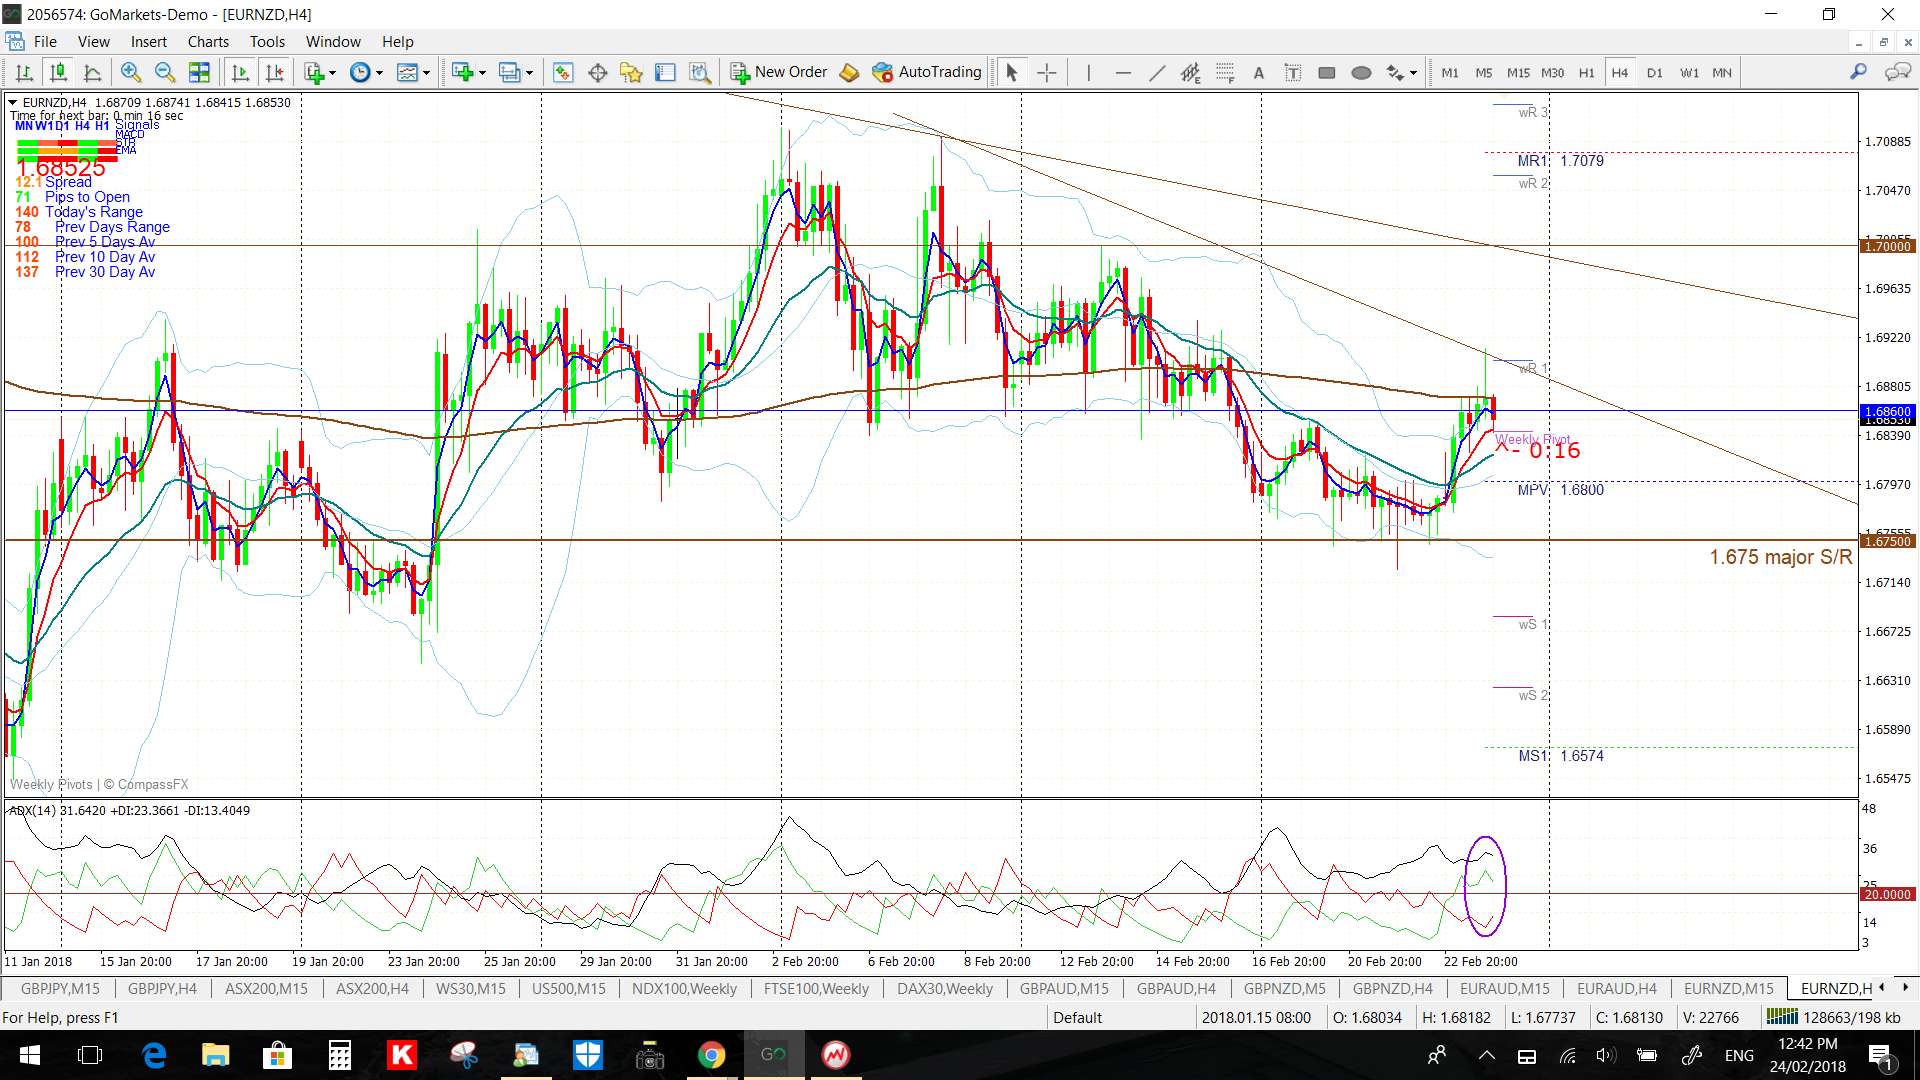
EUR/NZD: This gave a trend line breakout on Friday for 100 pips. Note the revised 4hr chart trend lines though.
- Watch the revised 4hr chart trend lines for any new breakout:
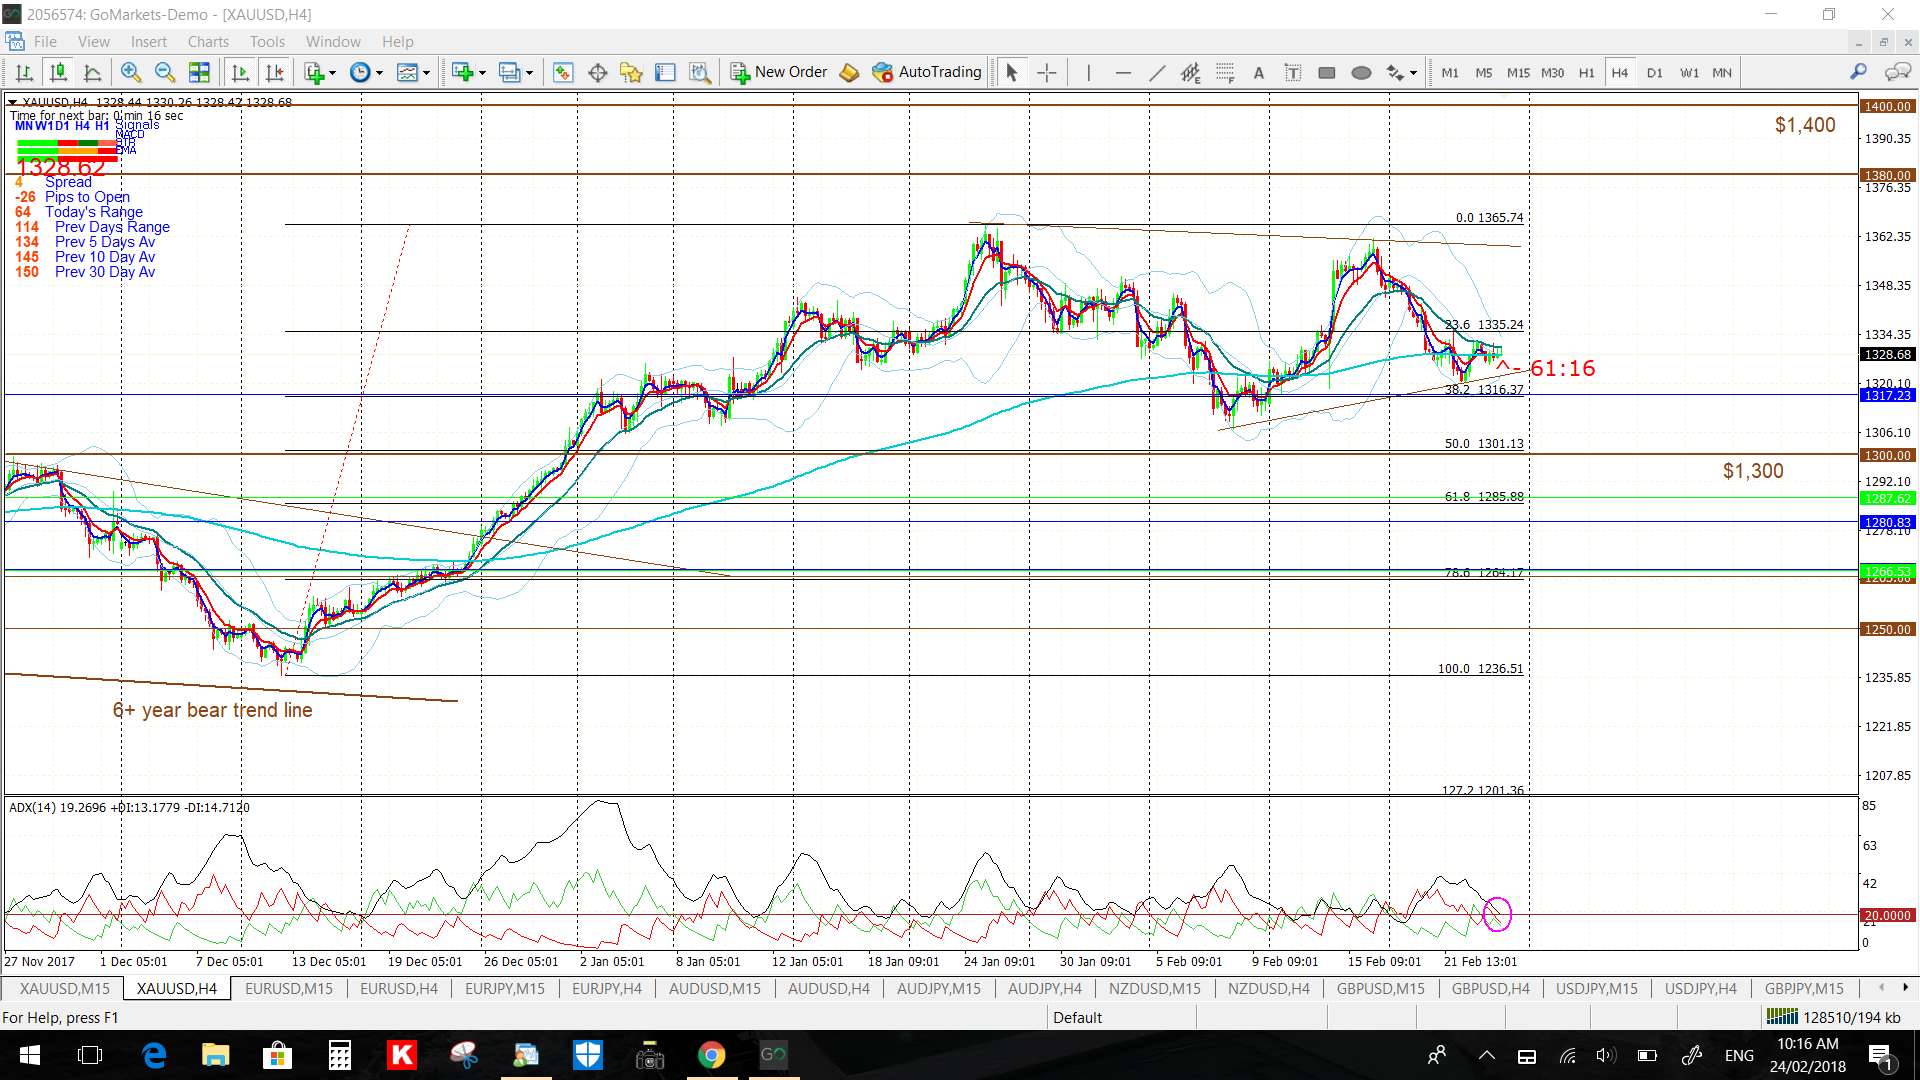
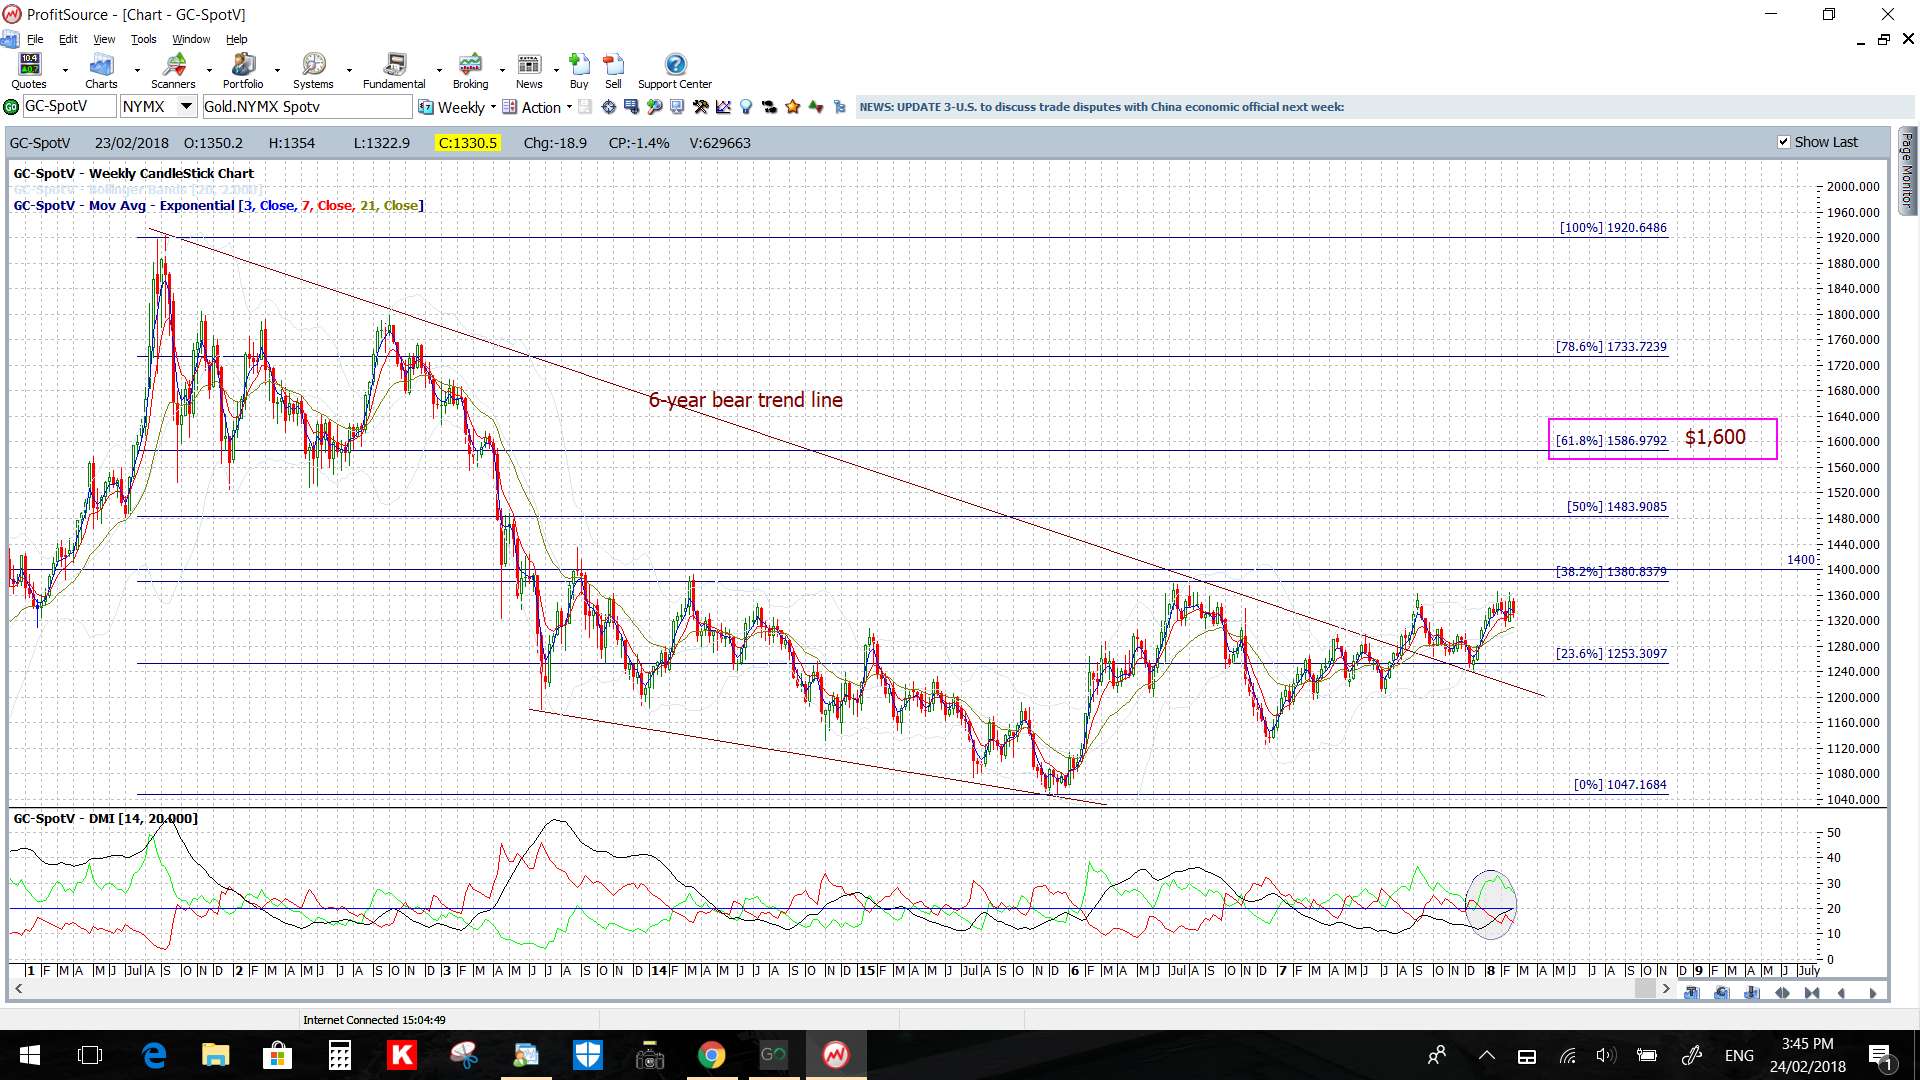
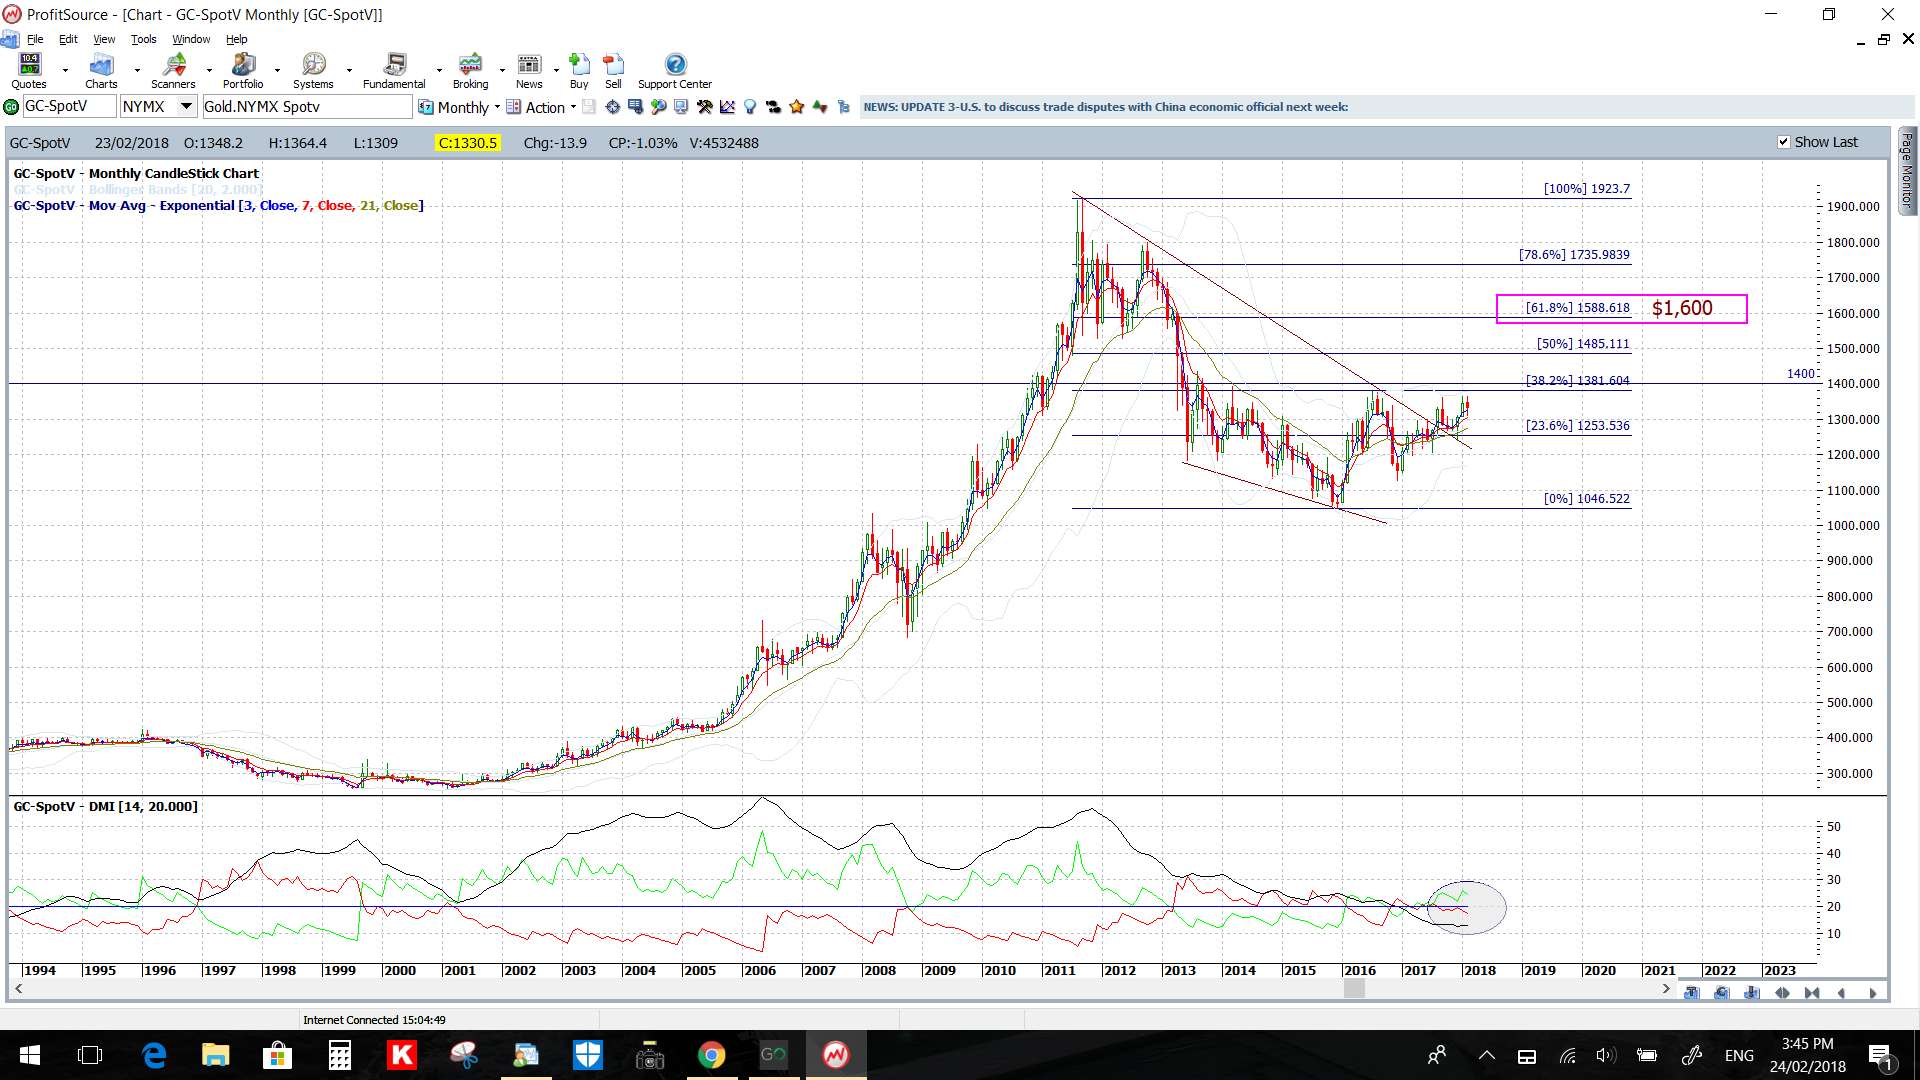
Gold: Gold continues to chop sideways above $1,300 but below $1,400 but it is the latter level that I am still stalking.
Any bearish retreat and break of support trend line though would have me looking for a test of $1,300 as this is near the 4hr chart’s 50% fib and then, after that, the 4hr chart’s 61.8% fib which is also near $1,285 and the daily 200 EMA.
- Watch the 4hr chart trend lines for any new breakout:
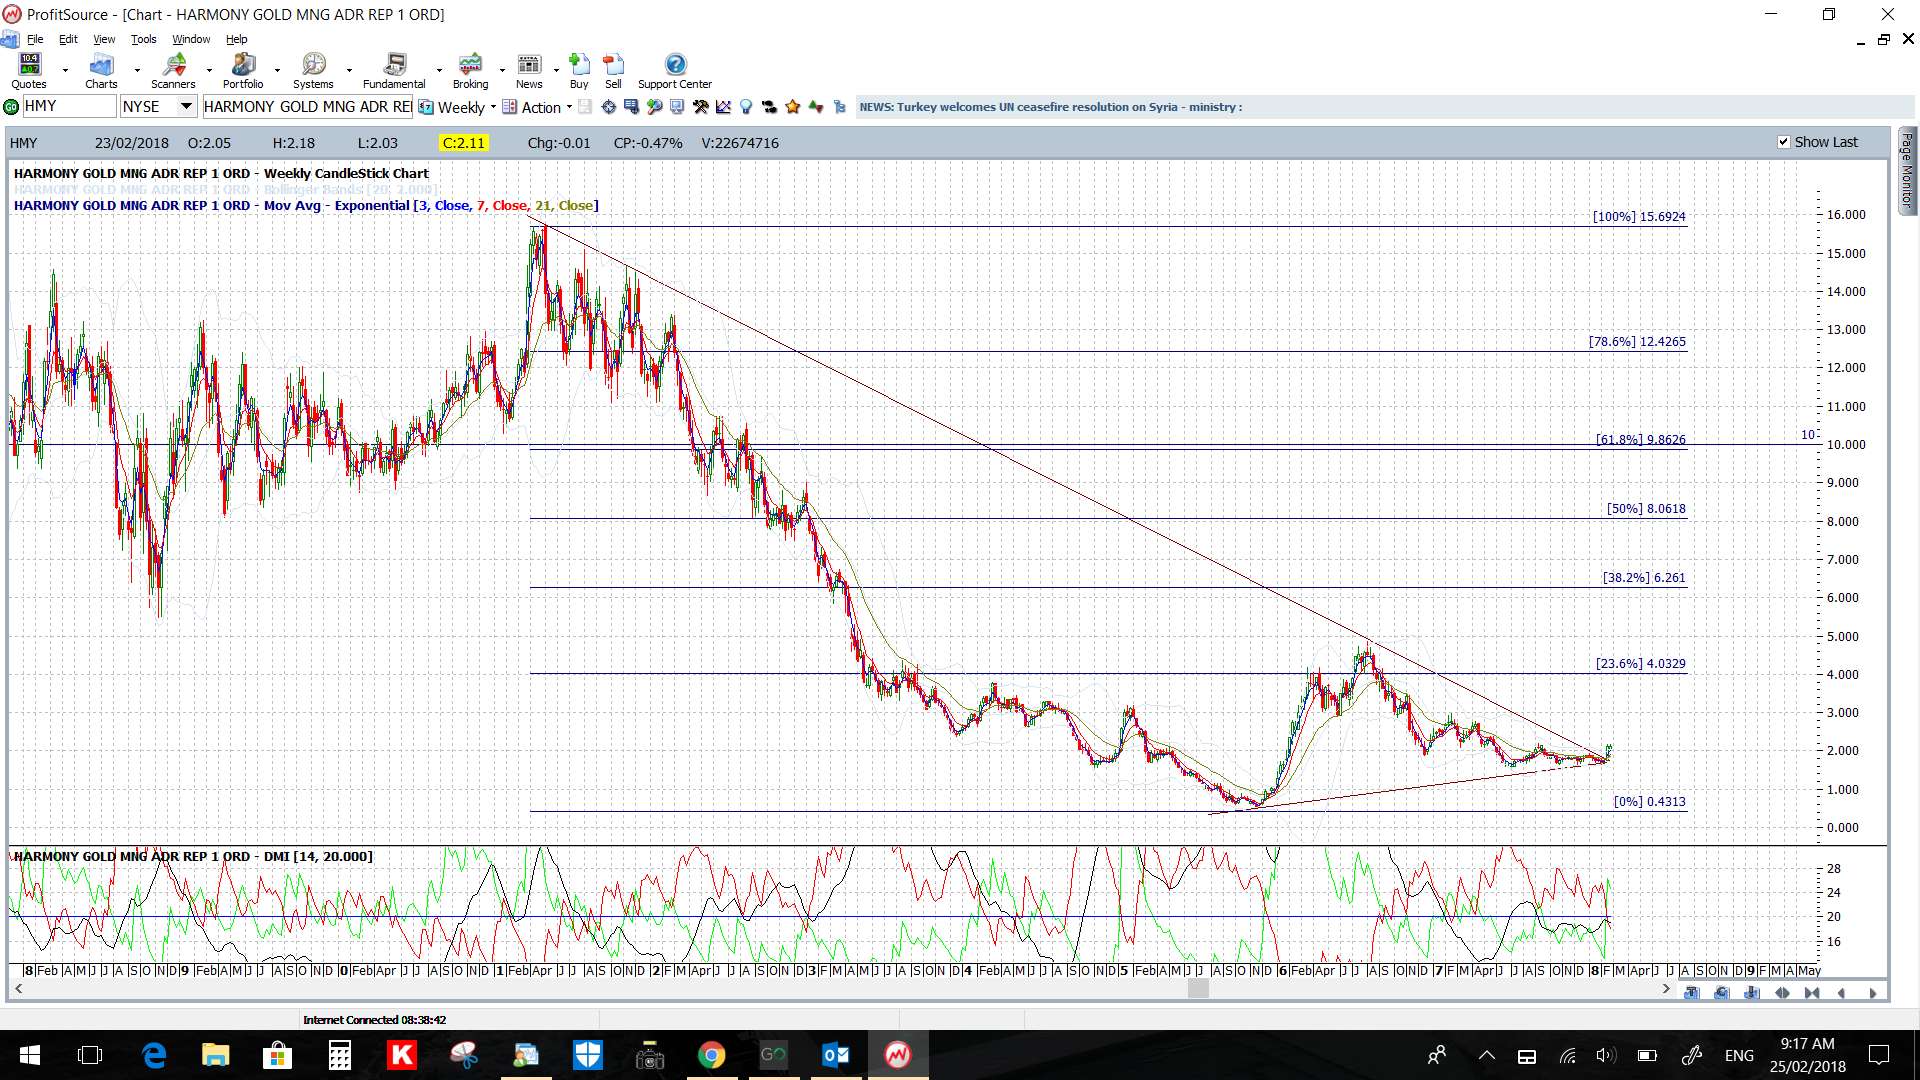
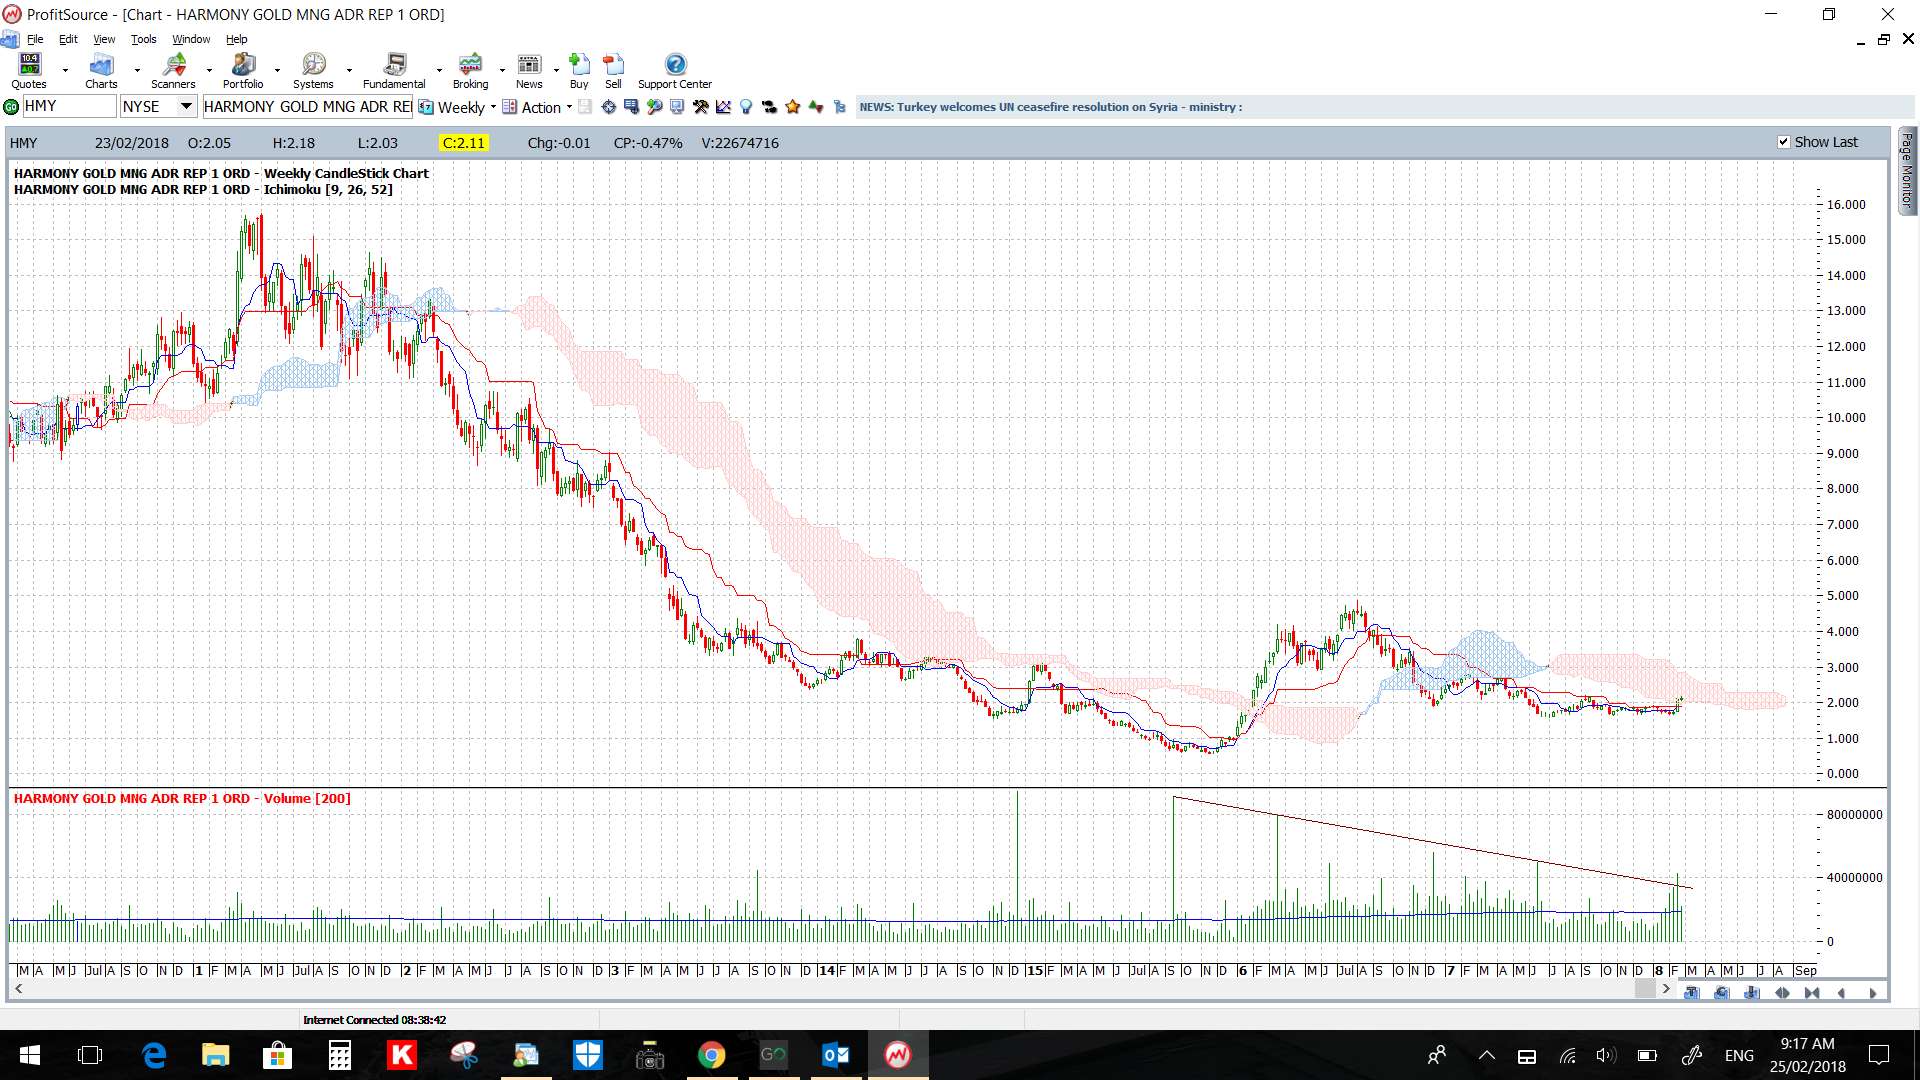
HMY: Harmony Gold: I scrolled through my Gold stocks and this stood out for two reasons. Fistly, the triangle trend line breakout and, secondly, for the uptick with Volume. I’d like to see increased momentum (ADX and +DMI) as well as a move above the weekly Cloud but, IMHO, this is worth watching (click on charts to enlarge):
Oil: Oil gave a great trend line breakout trade for 170 pips last week as it retraced up to the 4hr chart’s 61.8% fib.
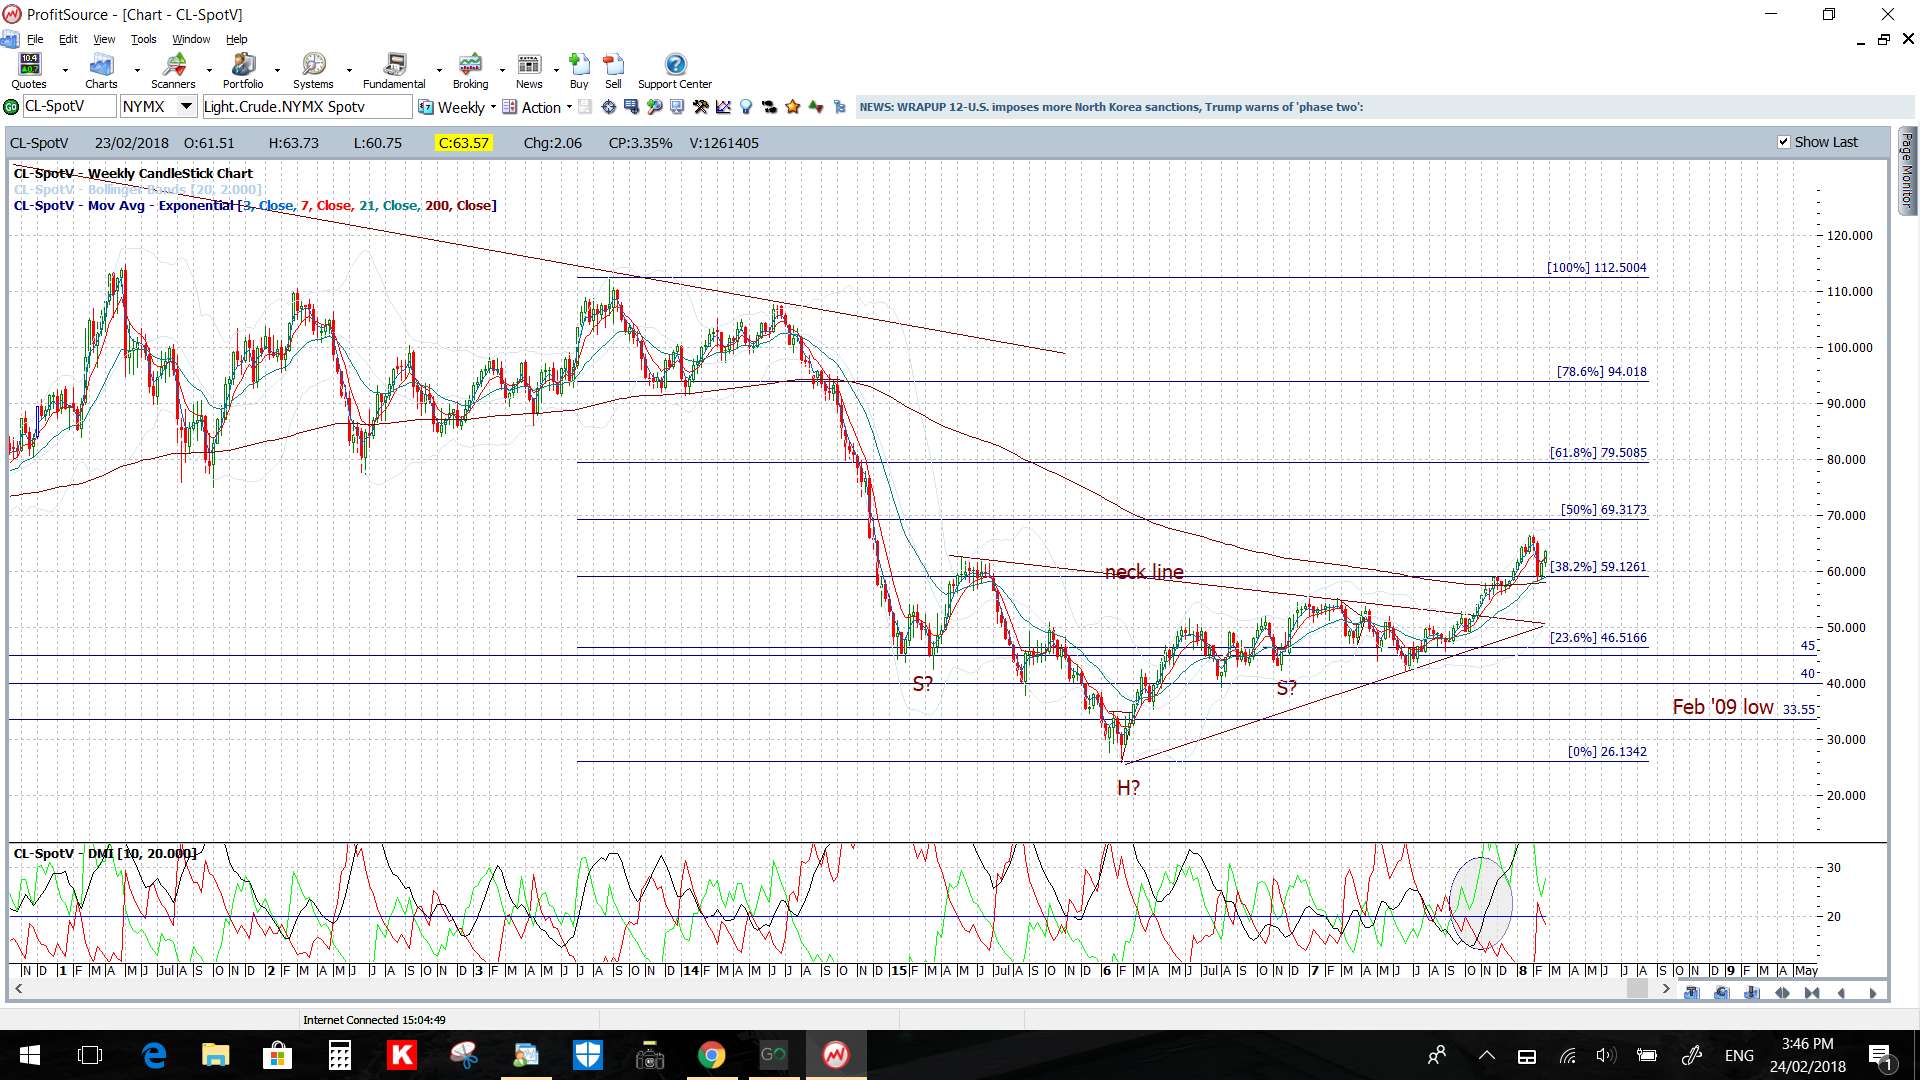
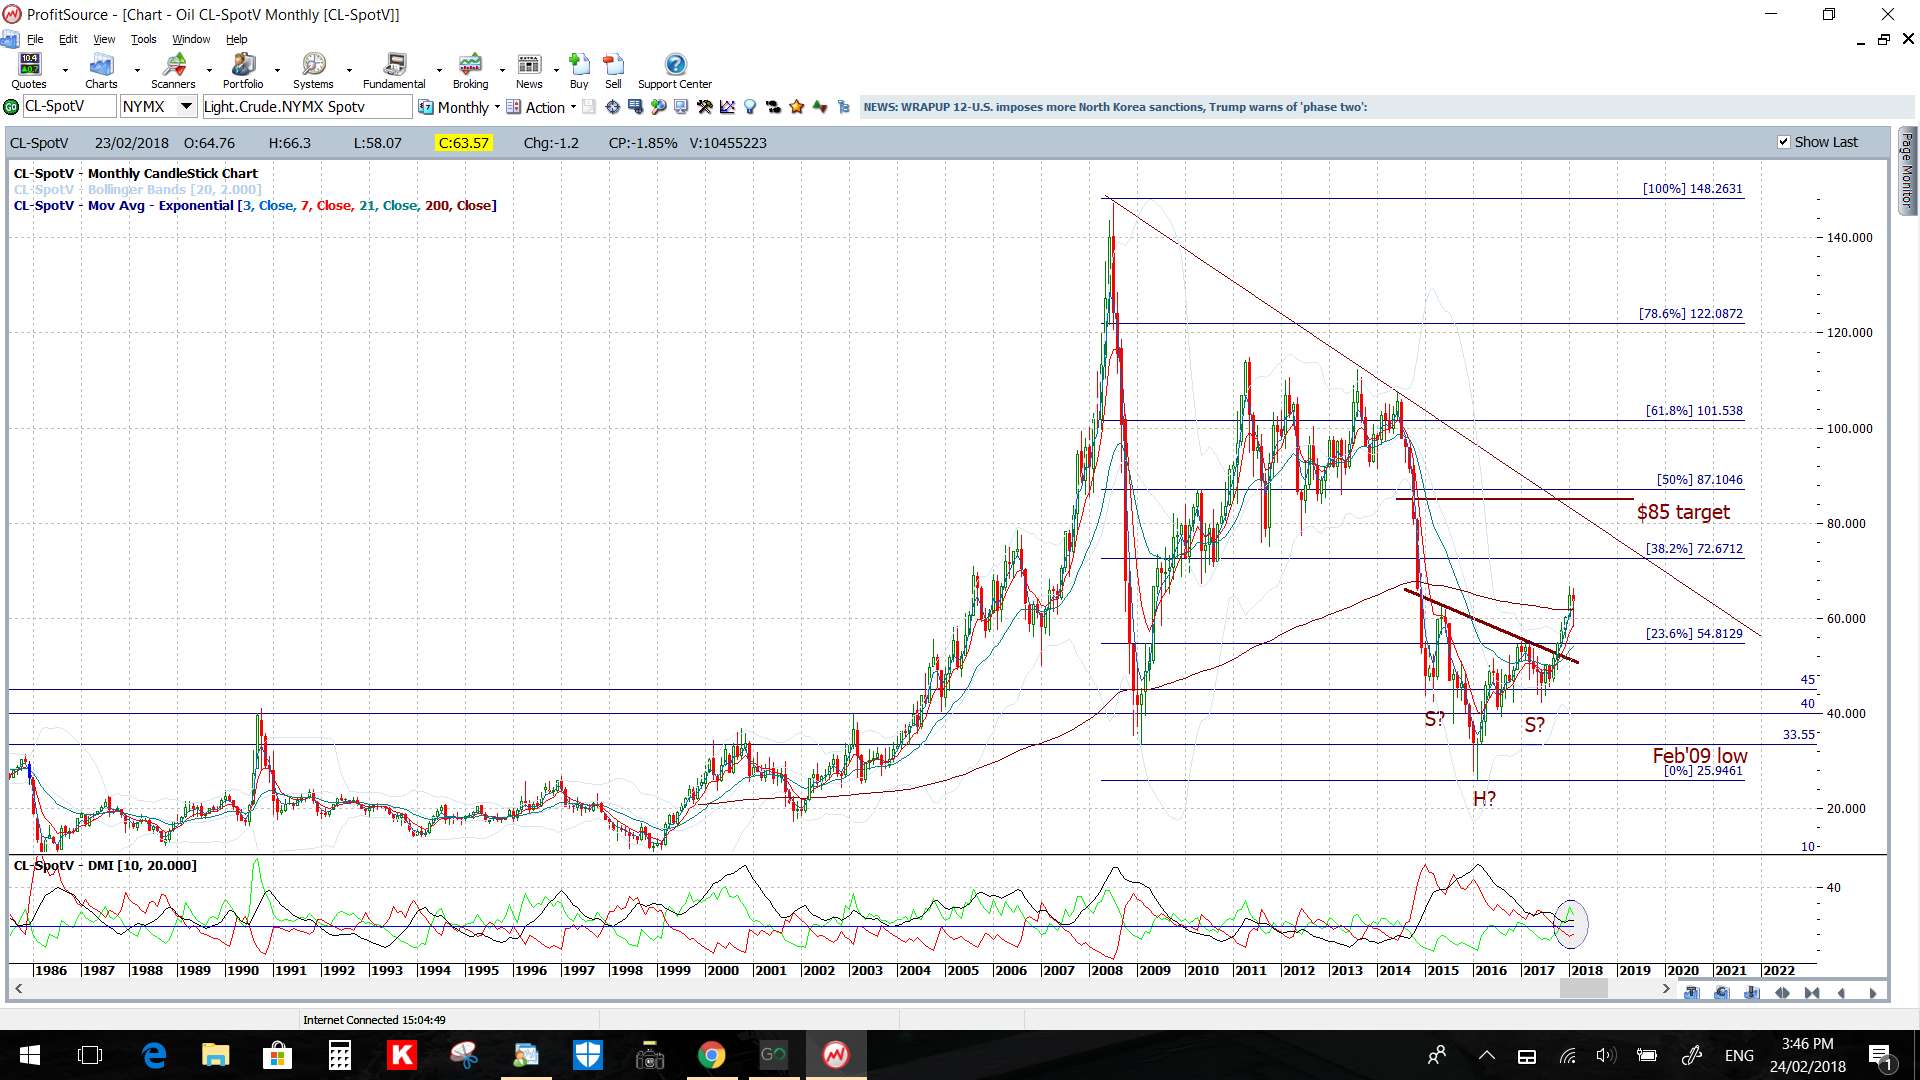
Keep the monthly chart’s bullish pattern in mind if trading here though.
- Watch the revised 4hr chart trend lines for any new breakout: