The last 24 hours of FX trading can best be described as choppy. For stocks, there were gains on one side of the Atlantic but losses on the other other. Oil has fallen further which has dragged US stocks lower but the $40 support level isn’t too far away.
The USDX seems to be waiting for some divine inspiration to decide whether to make or break 92.50 resistance and the EURX is still poised at a major 50% fib and might hang in the balance there until any QE decision comes from the ECB. Gold is marching higher on the back of US interest rate uncertainty though. I’m not seeing much FX momentum around and it’s no wonder why! The question is: will this phase of FX consolidation / choppiness continue until after next week’s ECB meeting? Remember though, the current lack of ADX momentum isn’t such a bad thing as it enable traders to see any new increase more clearly.
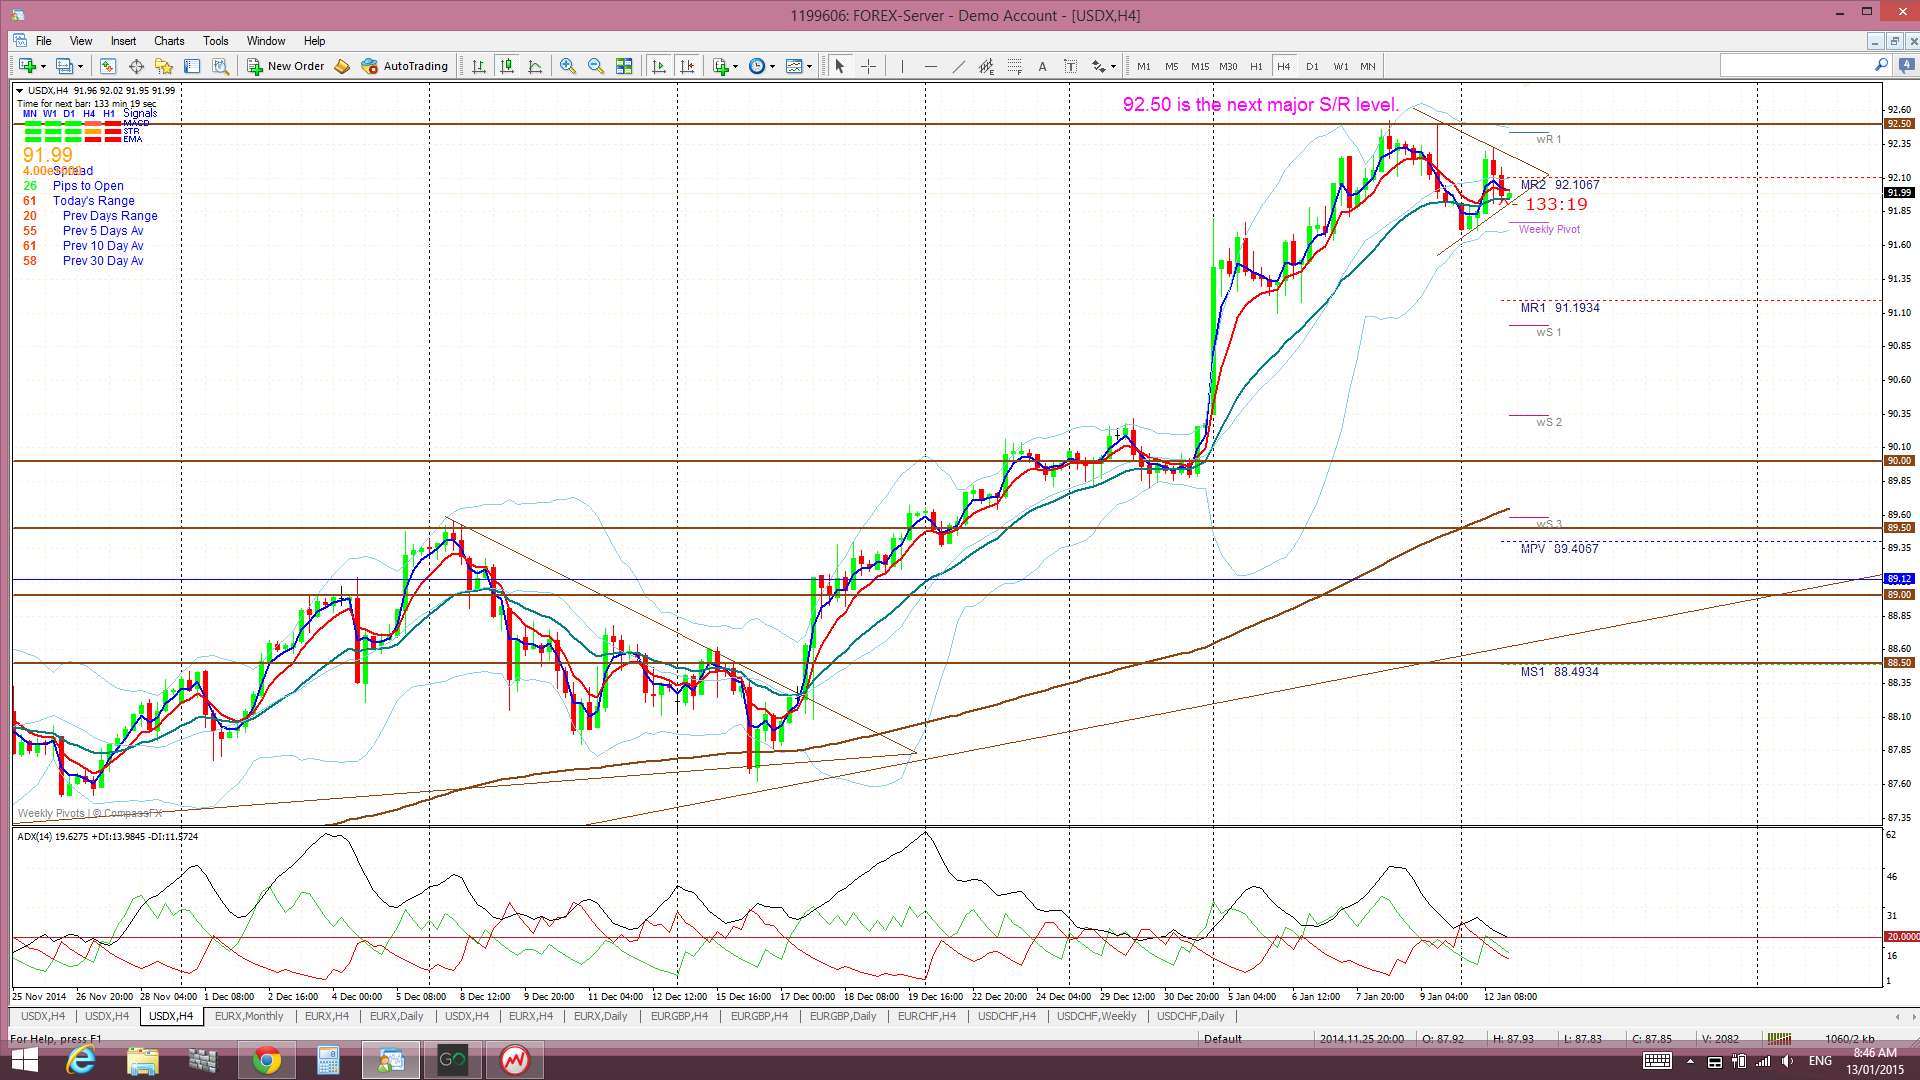
USDX: the previous flag pattern broke but there was little follow through. I’ve drawn in a new flag…. simply because I like order. The main level to watch remains the 92.50 level:
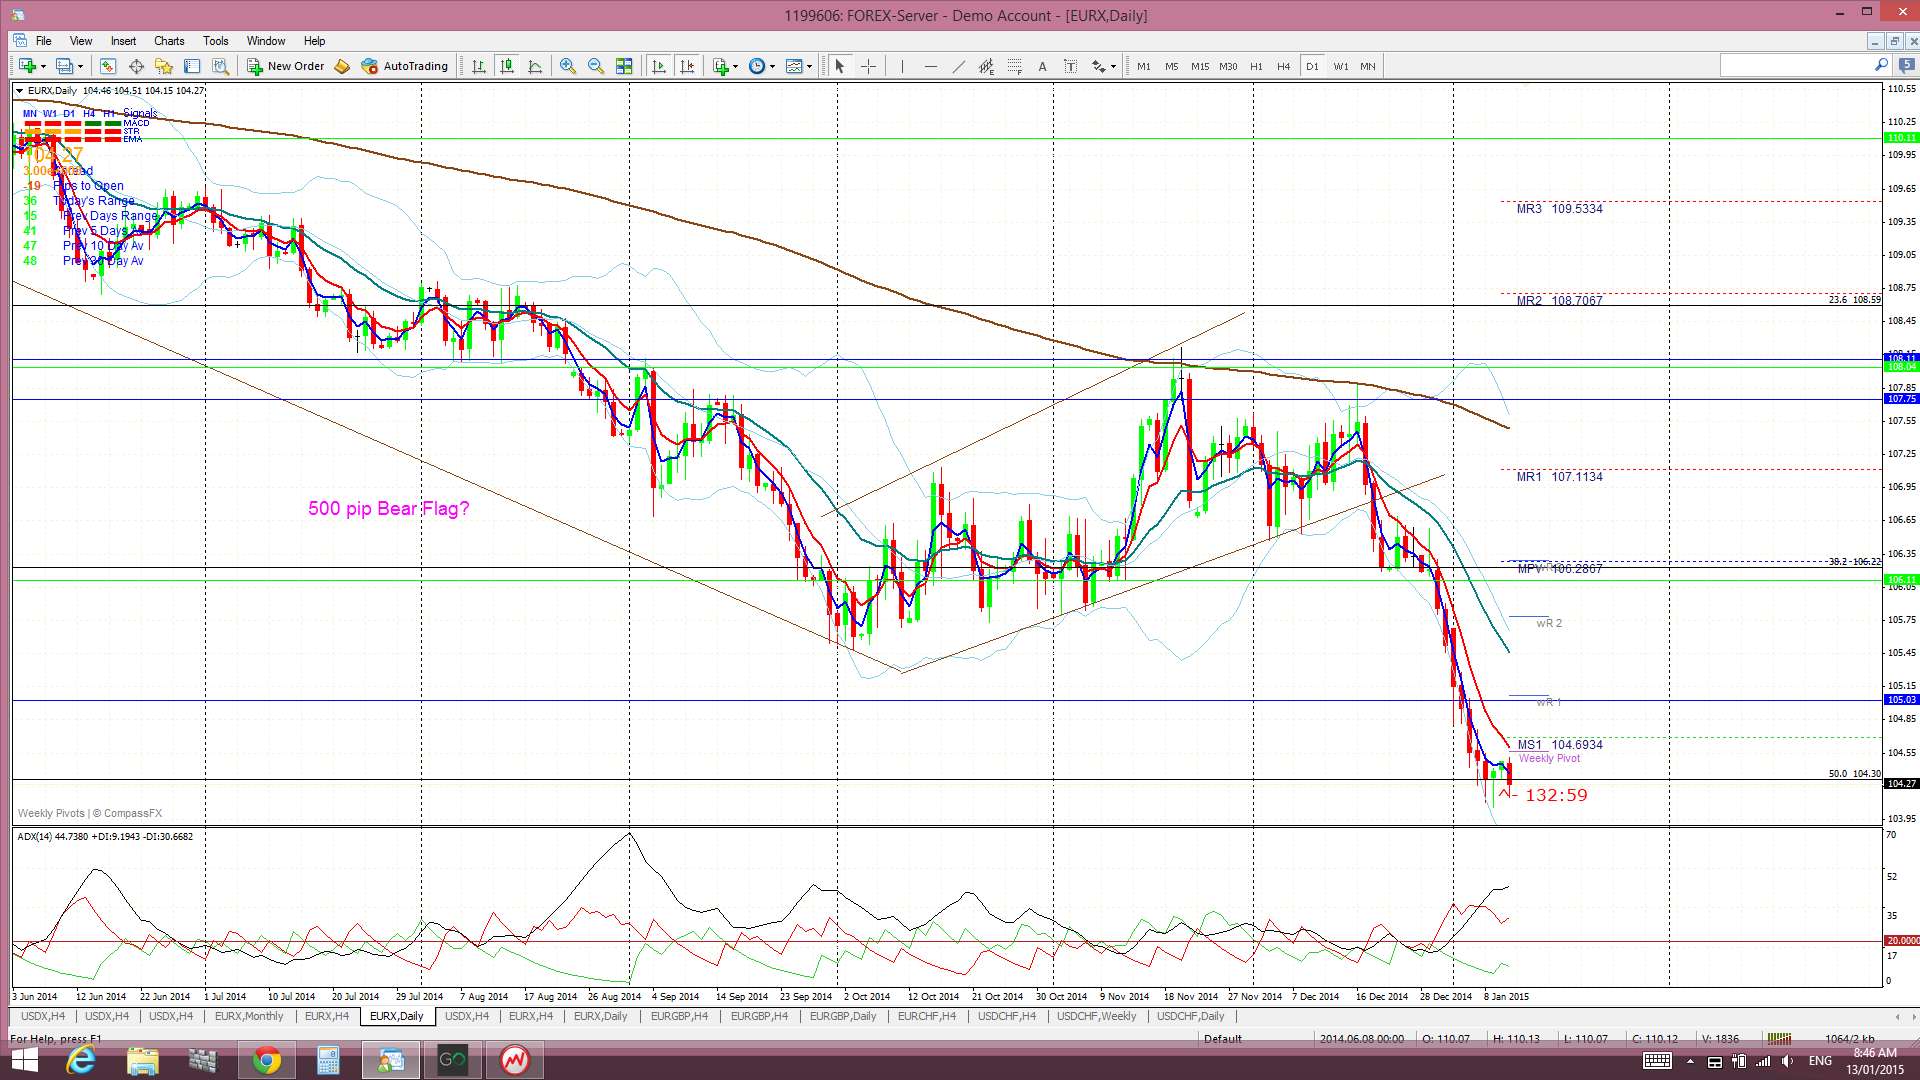
EURX daily: the EURX continues to chop around at the 50 % fib level. The weekly chart (below this one) shows the significance of this fib level:
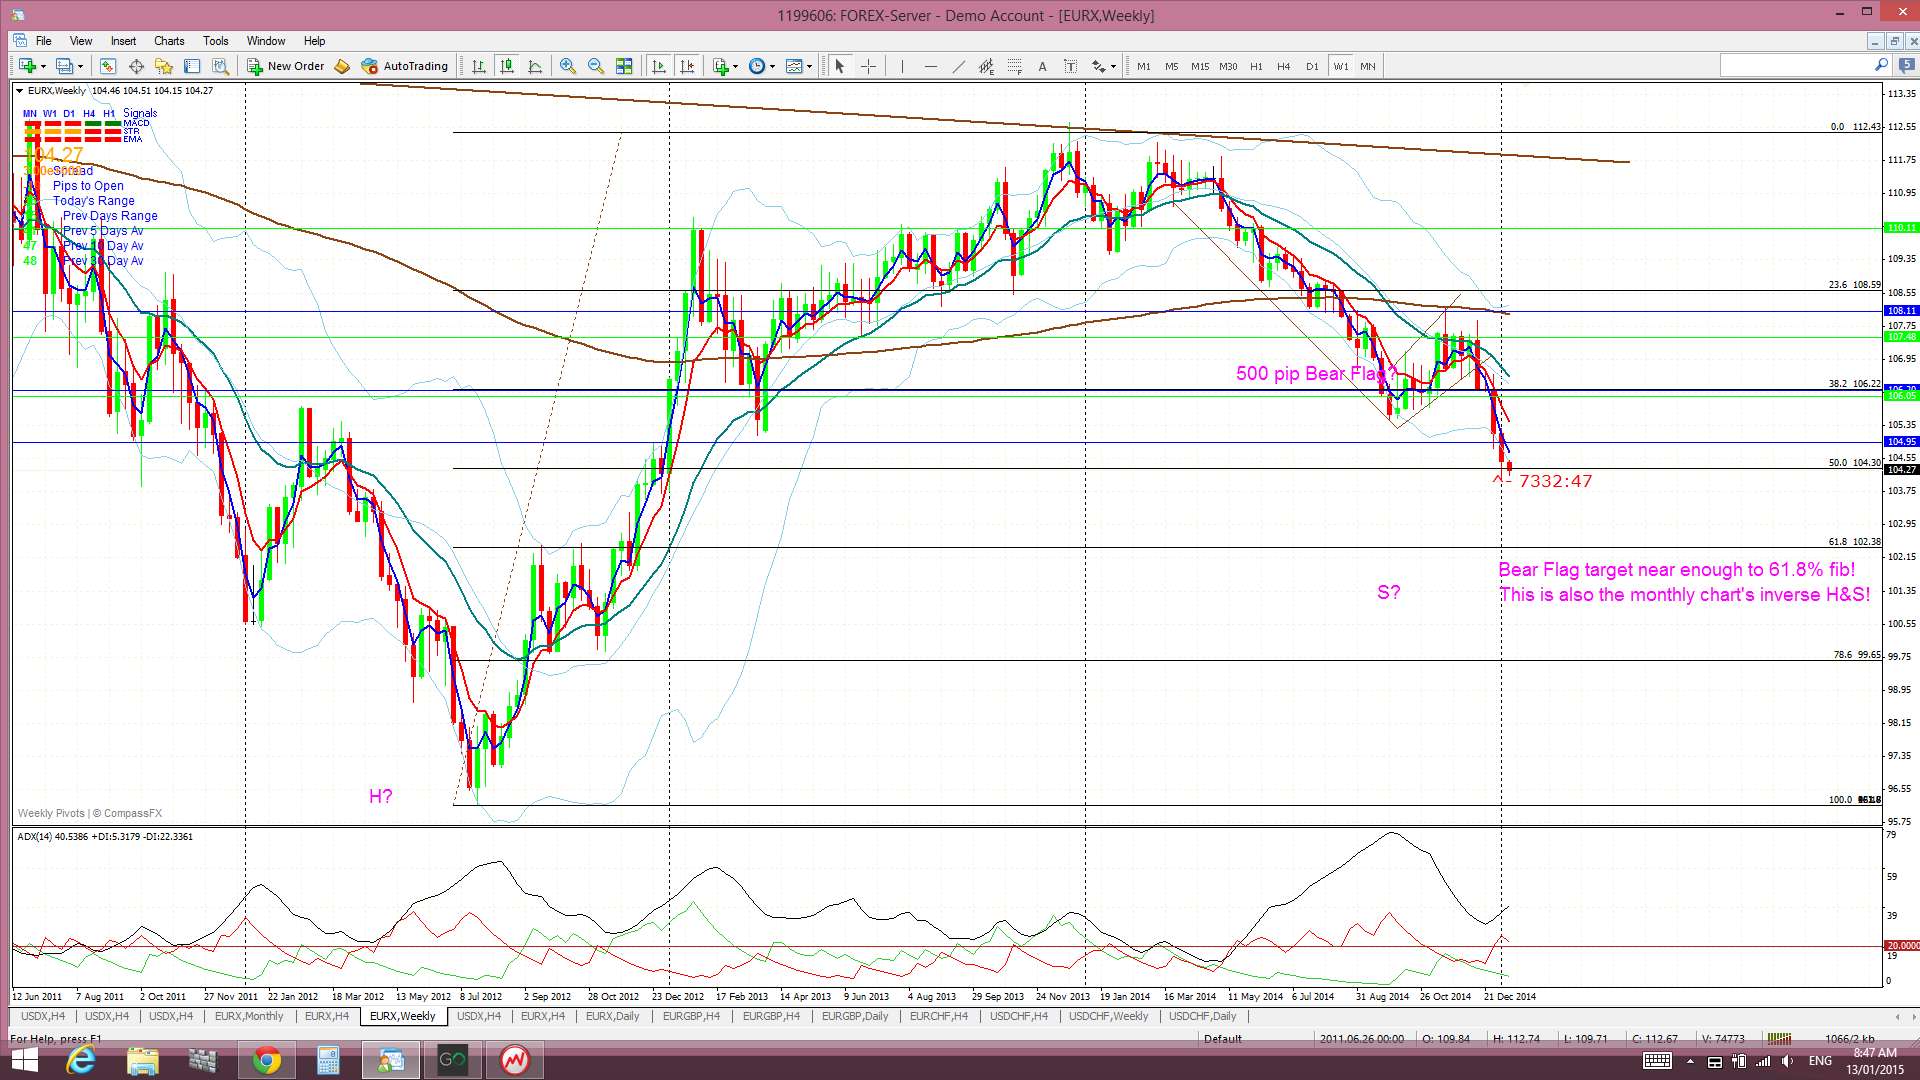
EURX weekly: the index is poised at the half way point of the 2012-2014 bull run:
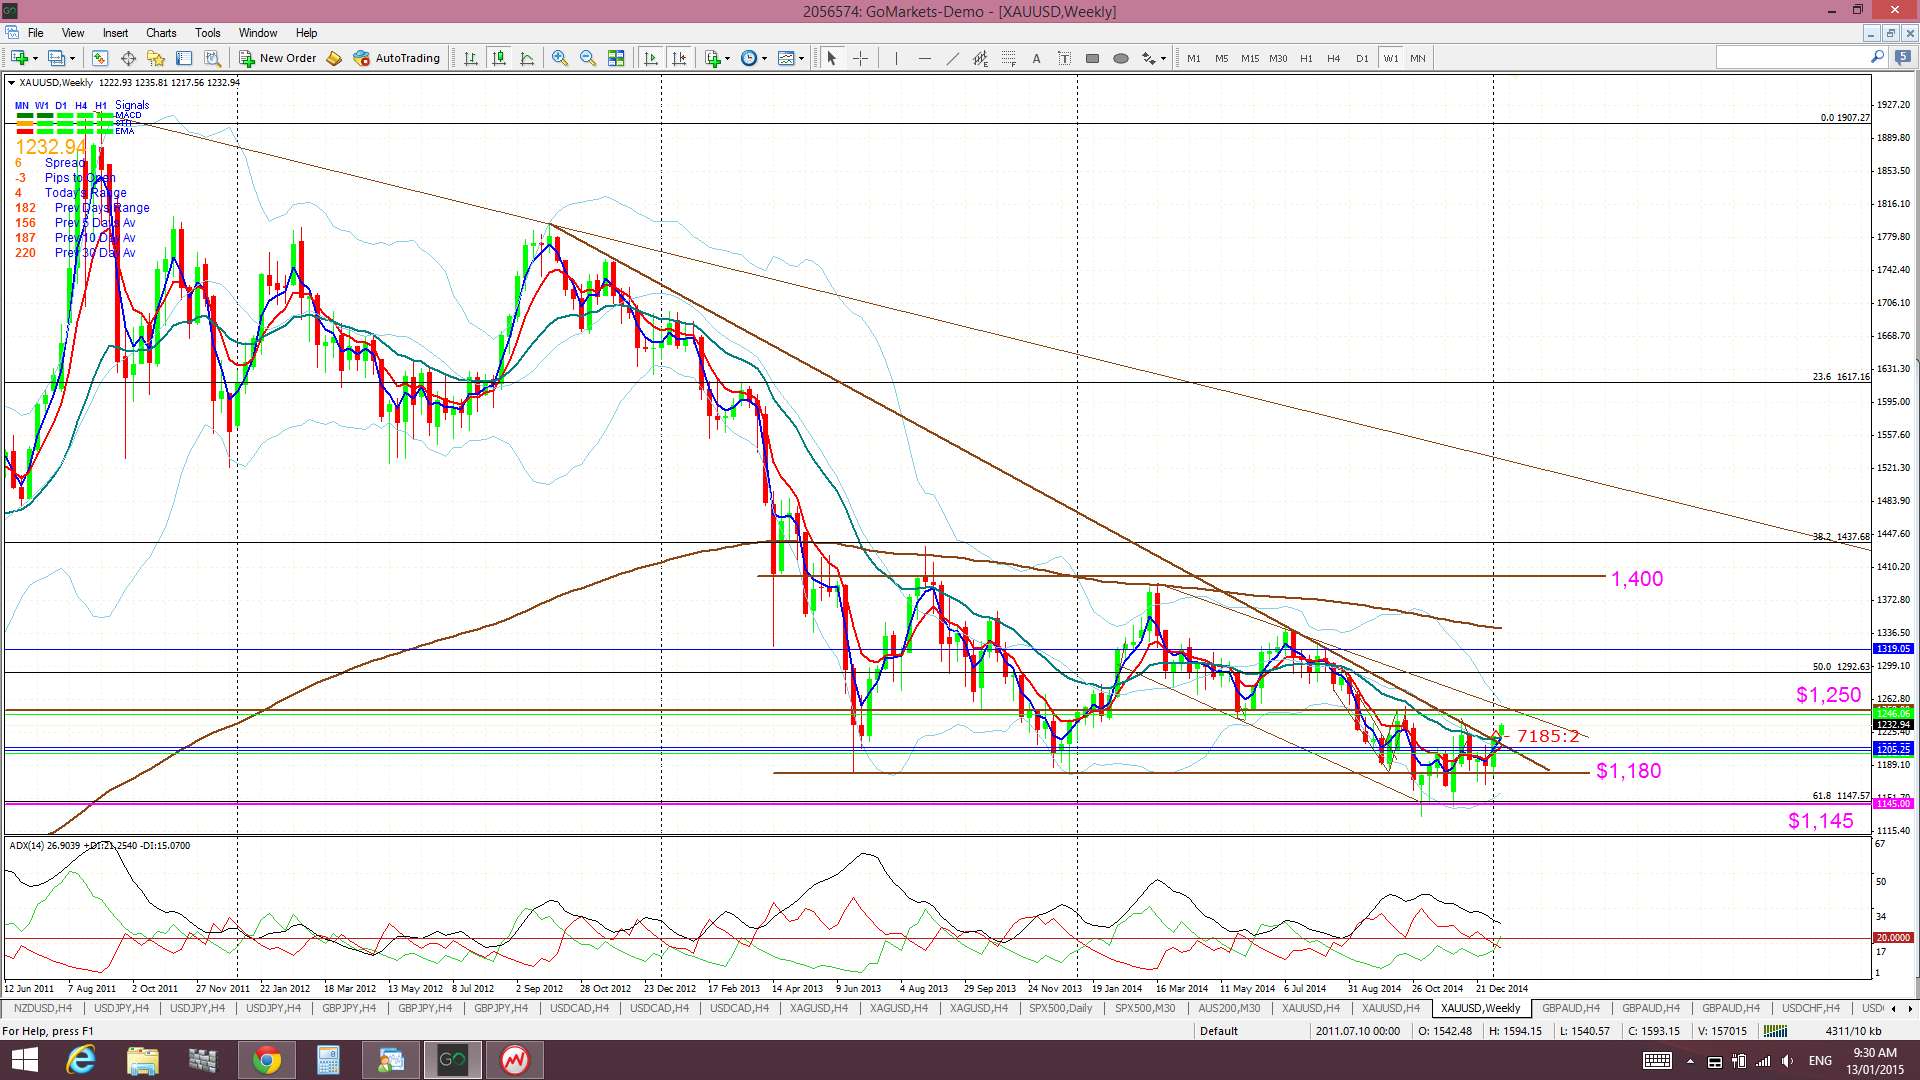
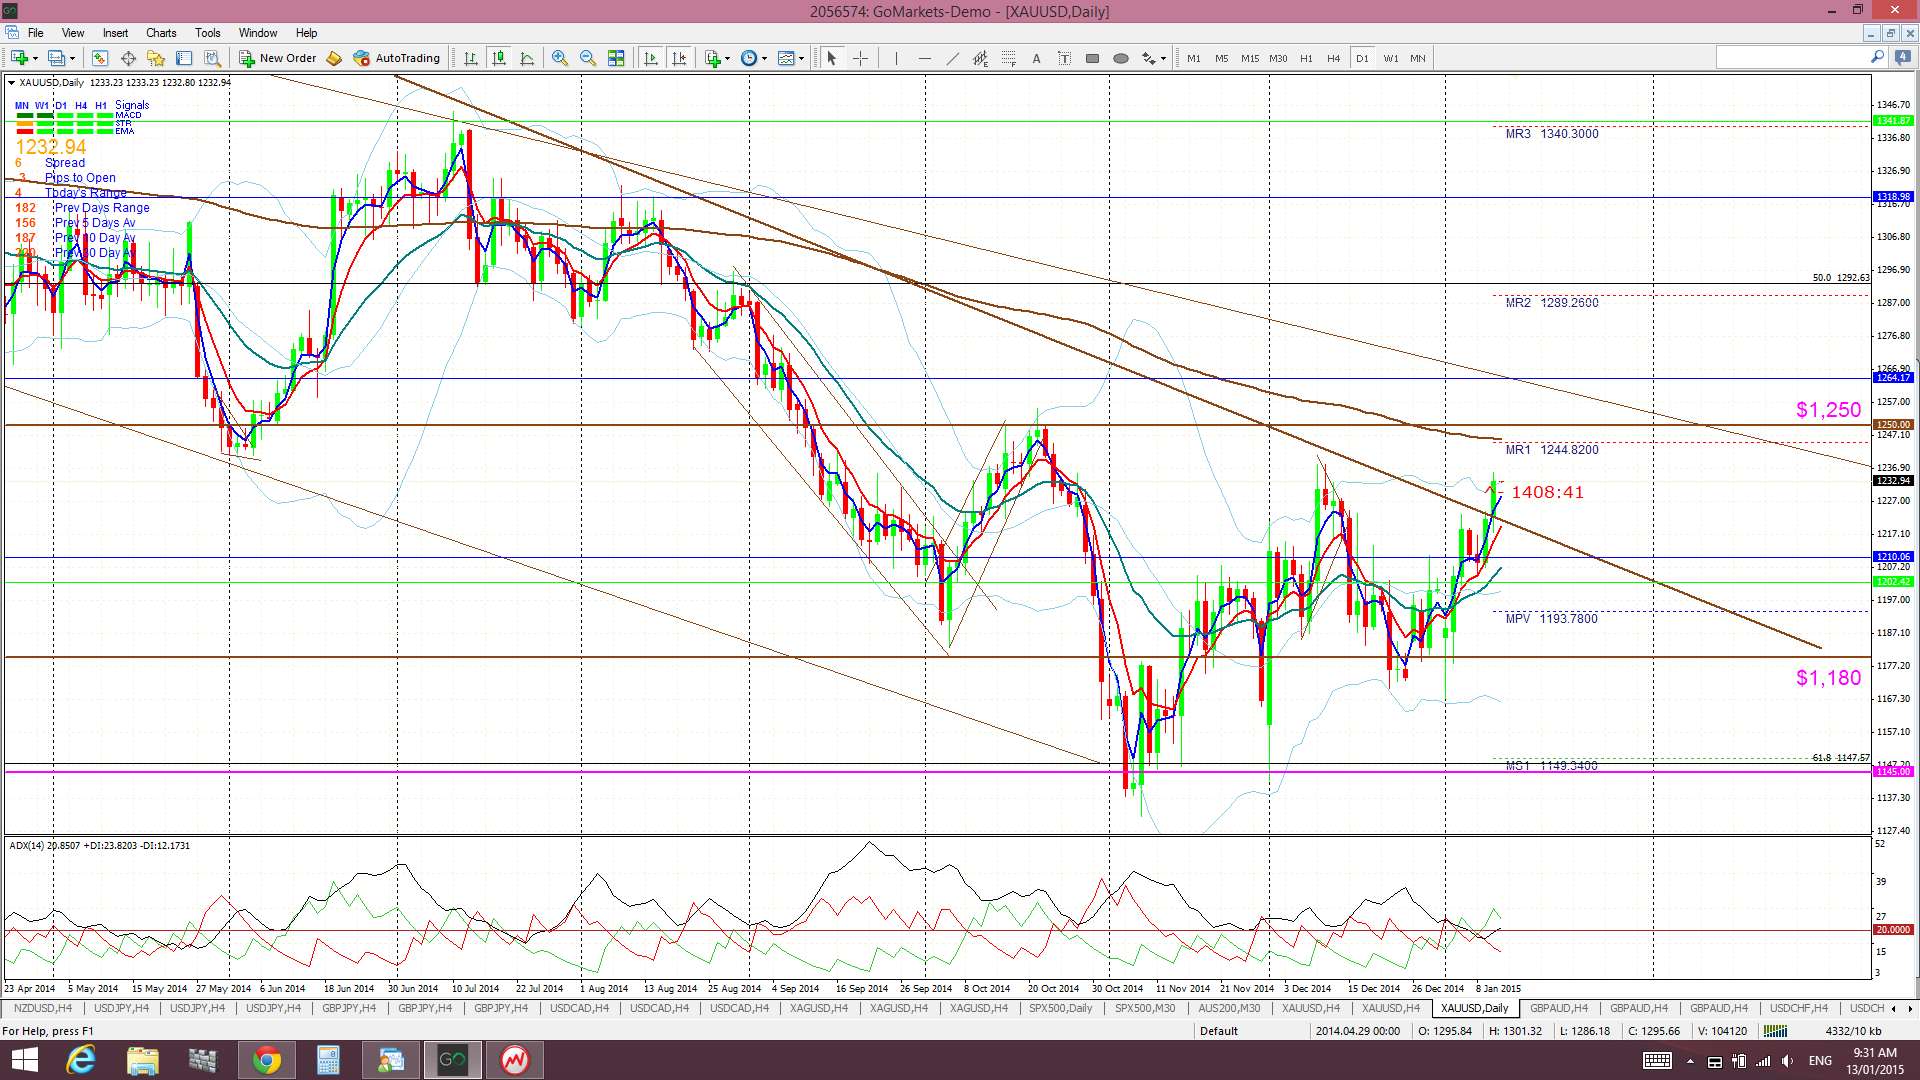
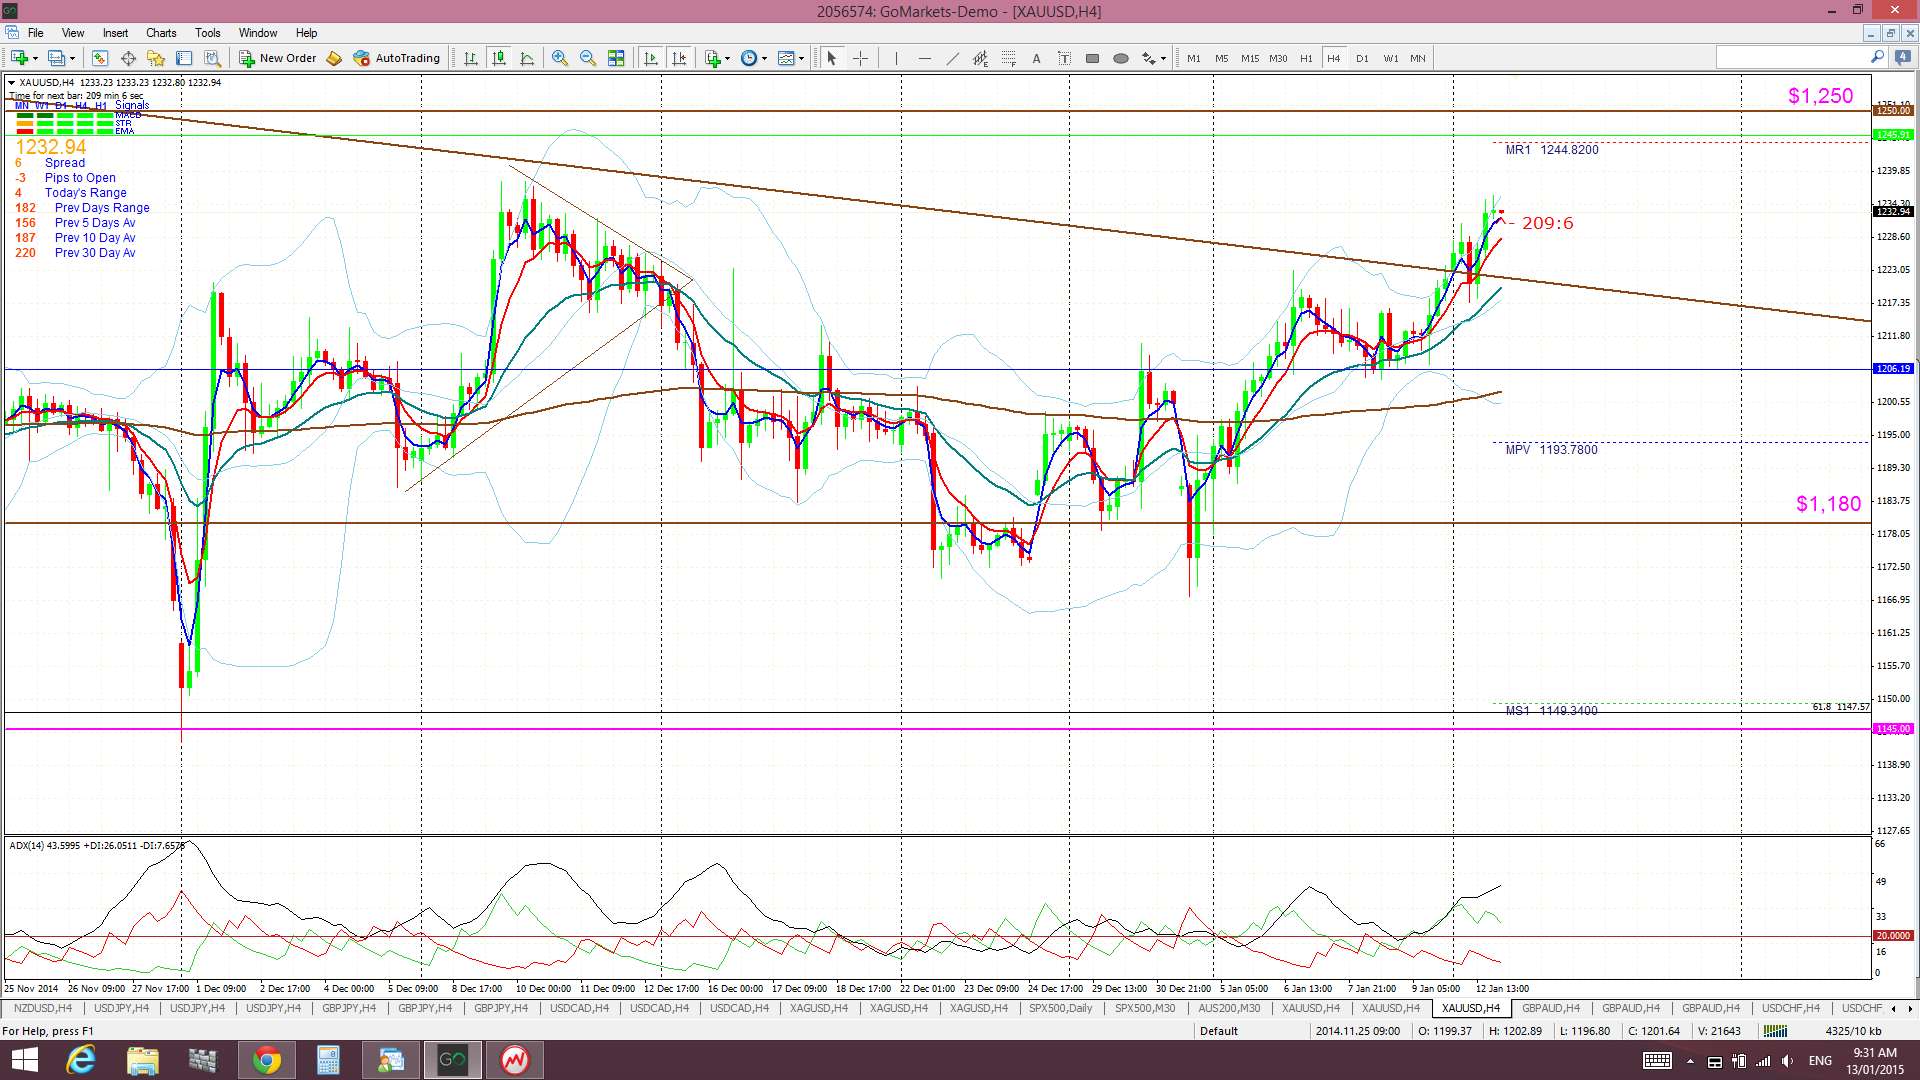
Gold: Gold has made solid gains so far this week and has broken above a weekly chart bear trend line. This breakout will need to be confirmed AFTER the weekly candle closes BUT, for now, this is a bullish signal:
Gold weekly: showing the break of a 2 year+ bear trend line. Note the 2014 bear trend line of the trading channel intersects with the key $1,250 level:
Gold daily: $1,250 will be the next level to watch here. This is previous S/R and near the daily 200 EMA and 2014 bear trend line:
Gold 4hr: watch for reaction near the $1,250 level. A break and hold above this would be bullish:
TC Signal:
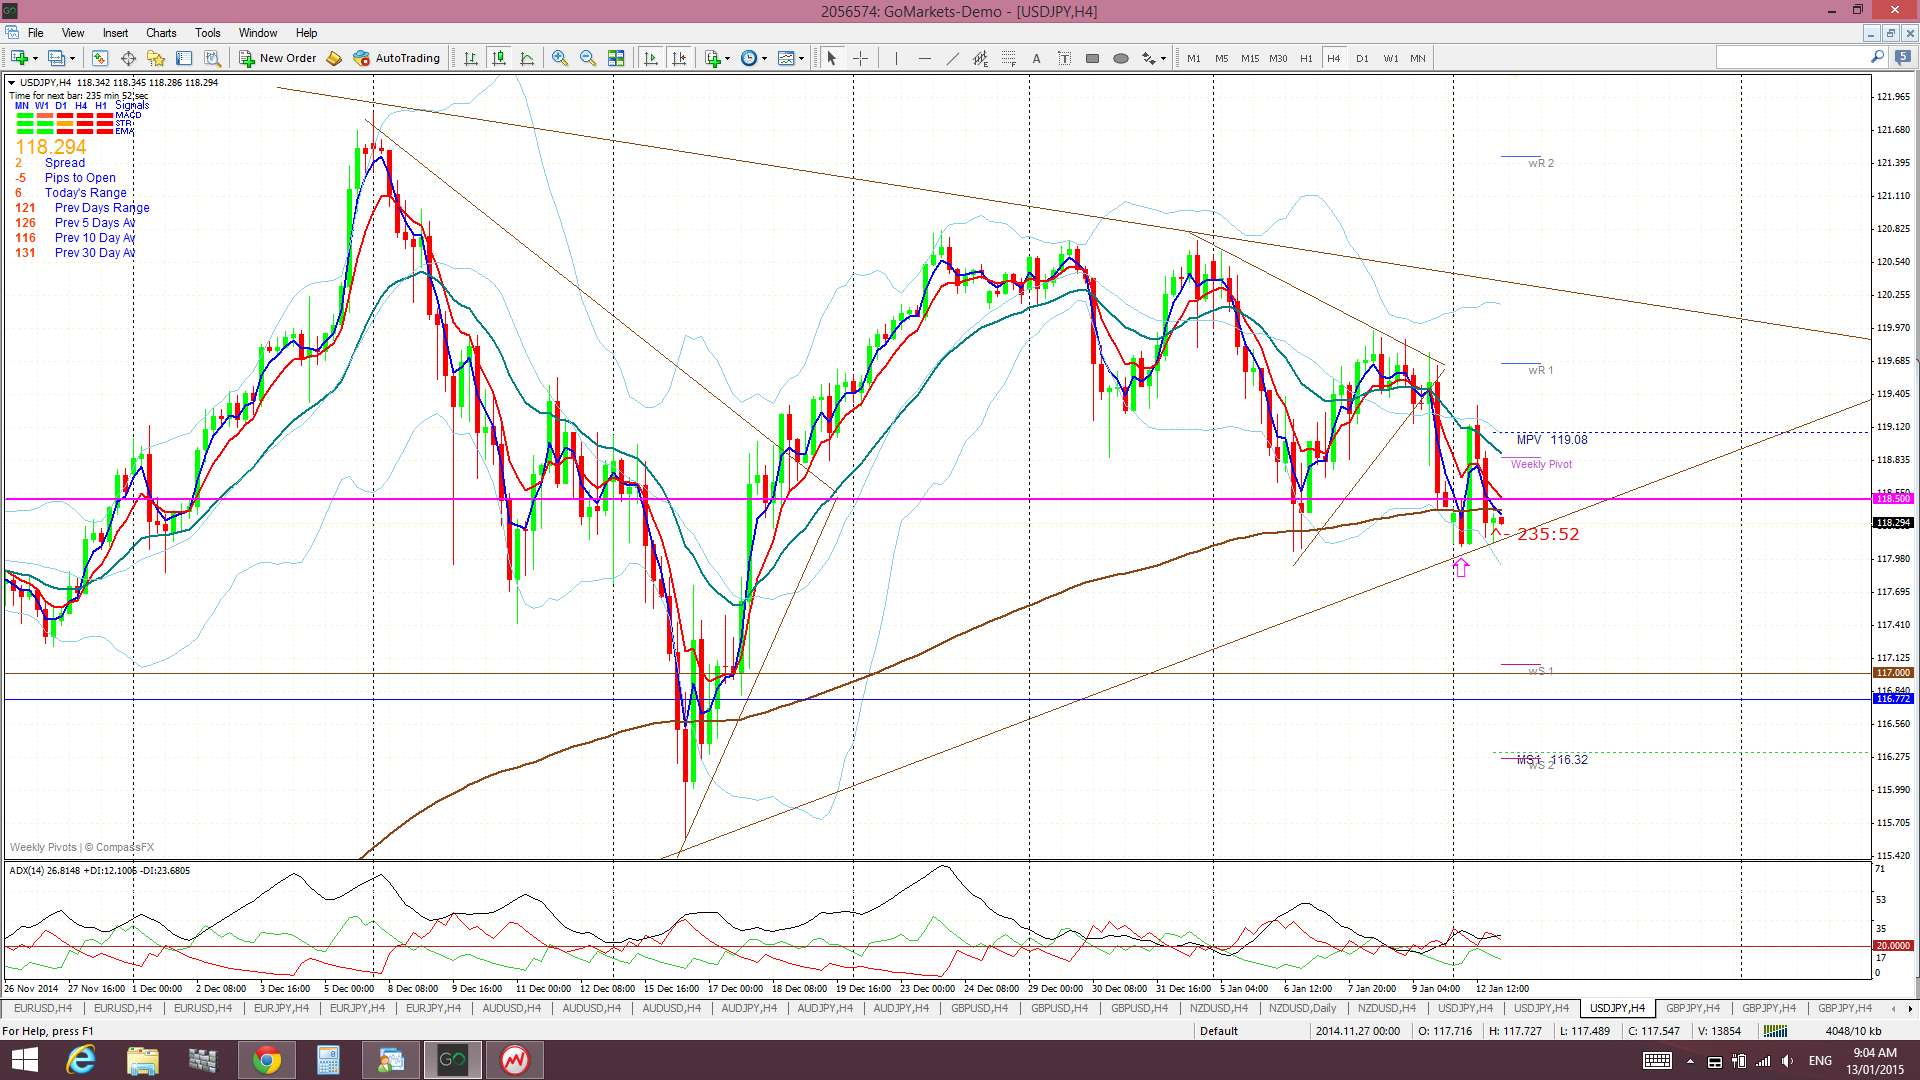
U/J: this signal is still open, surprisingly, but is in the red for now. I’ve adjusted the trend line following recent price action and this shows the pair within the new triangle. Whilst price has closed the day below the 118.5 level, momentum is fairly flat and so I will be waiting for a triangle breakout with increasing momentum before taking any U/J trade:
Other FX:
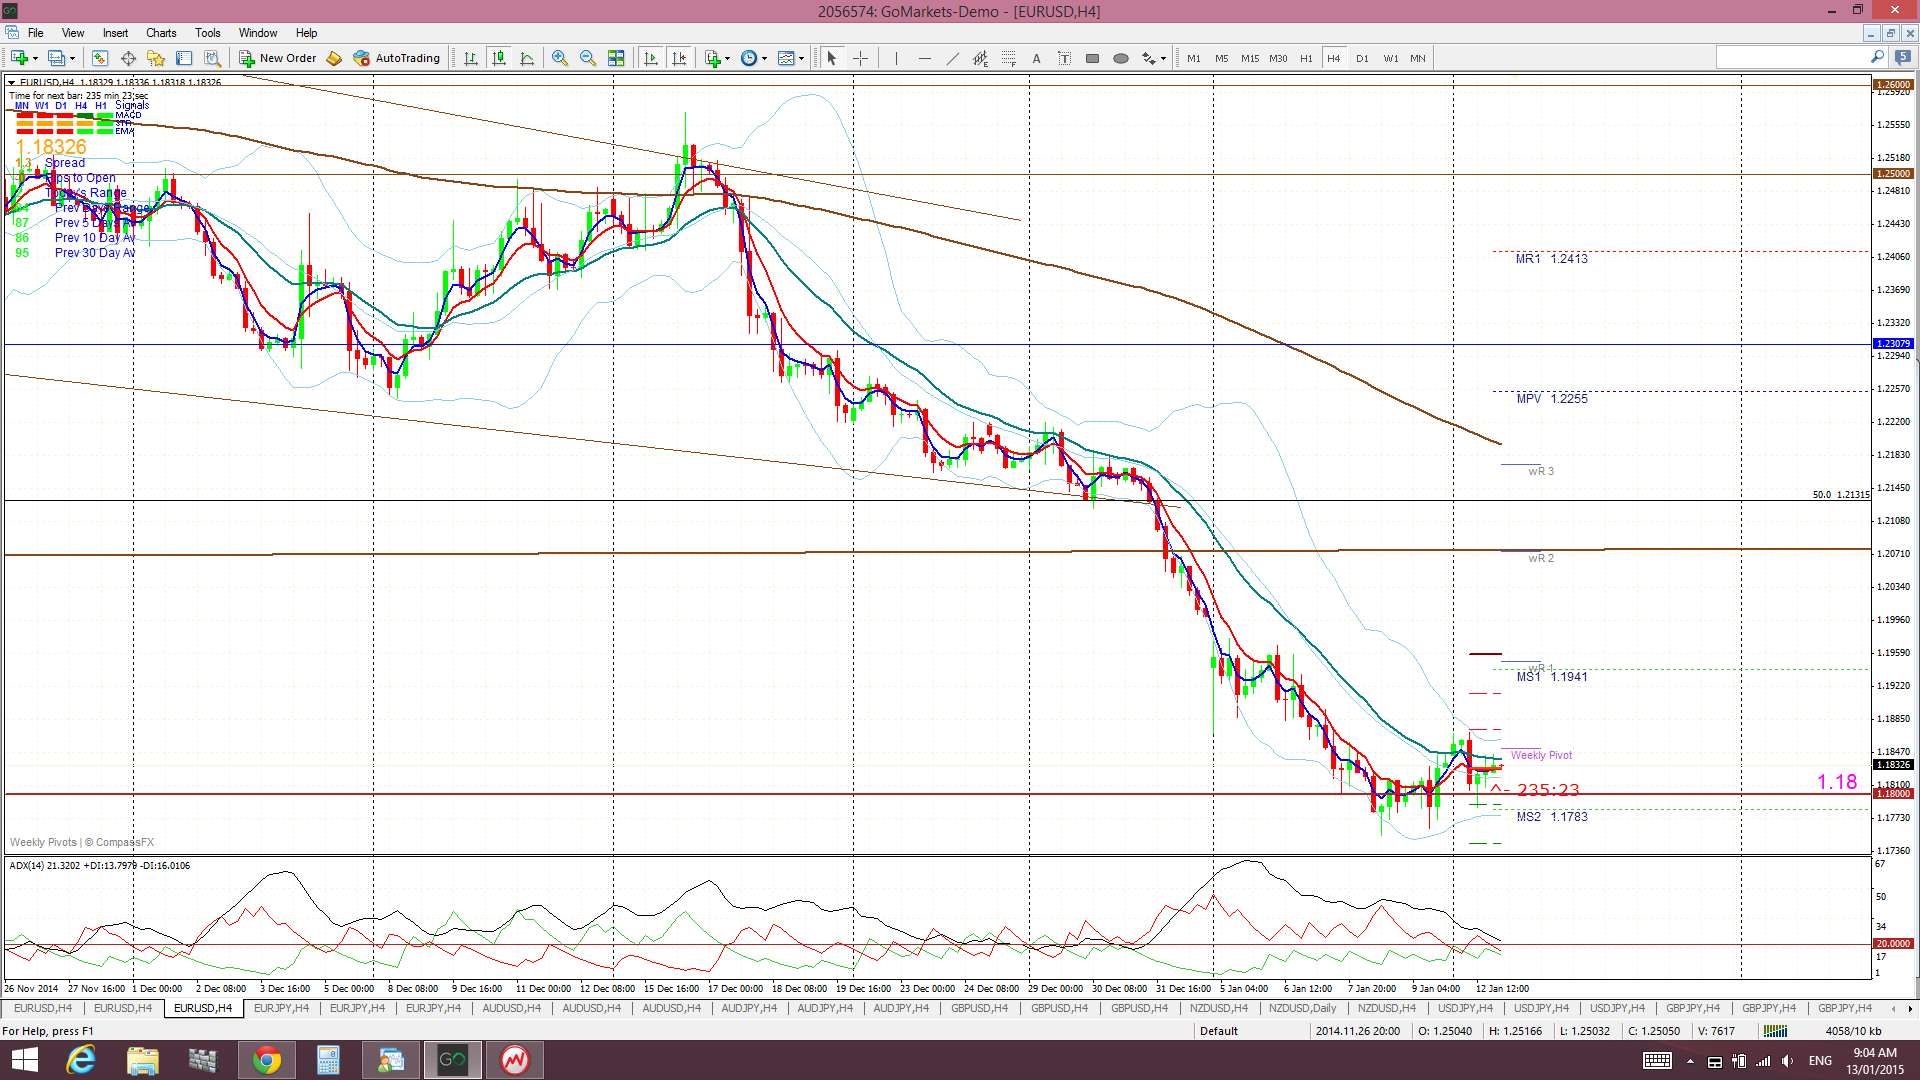
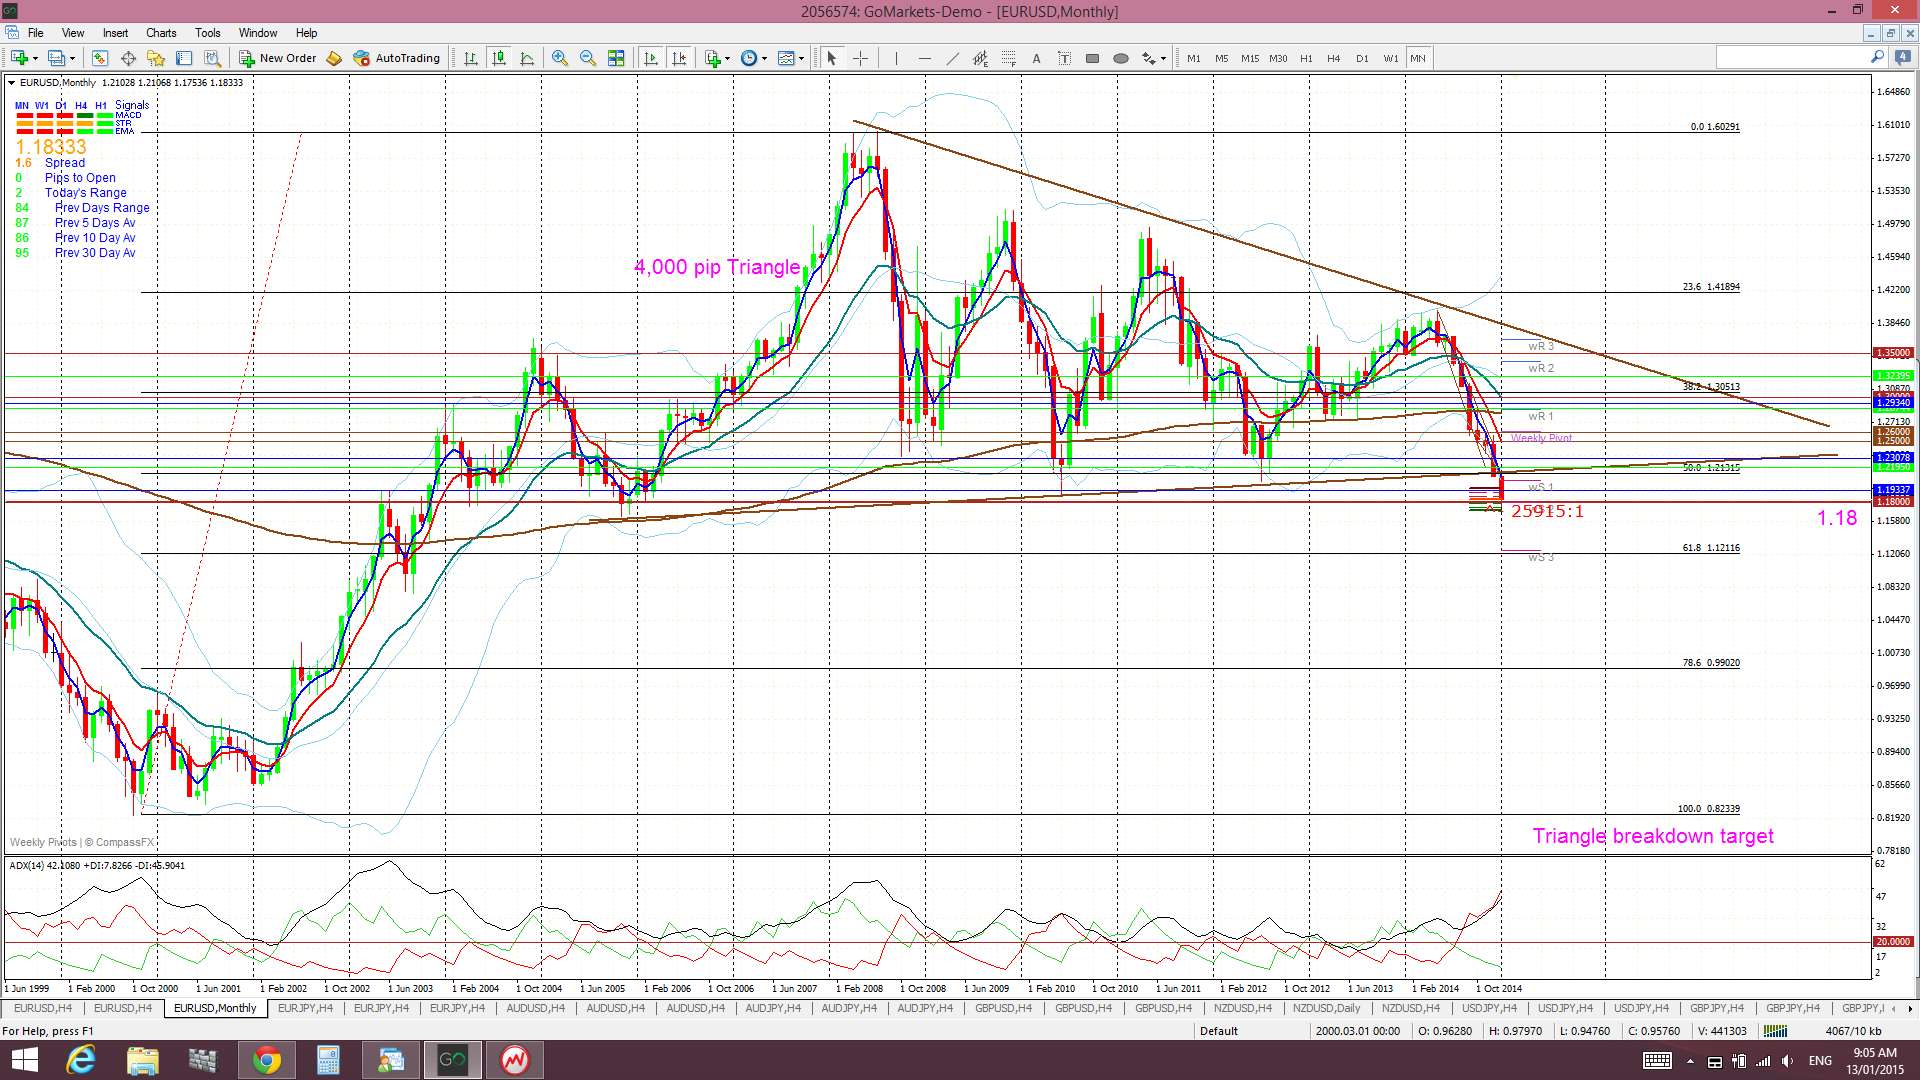
E/U 4hr: this pair is hovering above the major 1.18 S/R level. Price action here quite clearly indicates that this pair is waiting for ECB news about if and when any easing may start. The ECB meet next week and so this choppiness may continue until then. The monthly chart shows this 1.18 level as the base of a major descending triangle and any break and hold below this level may signal the start of a 4,000 pip triangle breakout. Of course, if this pair is going to bounce though then this will be the place to do it. Note the absence of any momentum though:
E/U monthly: 1.18 is a major S/R level:
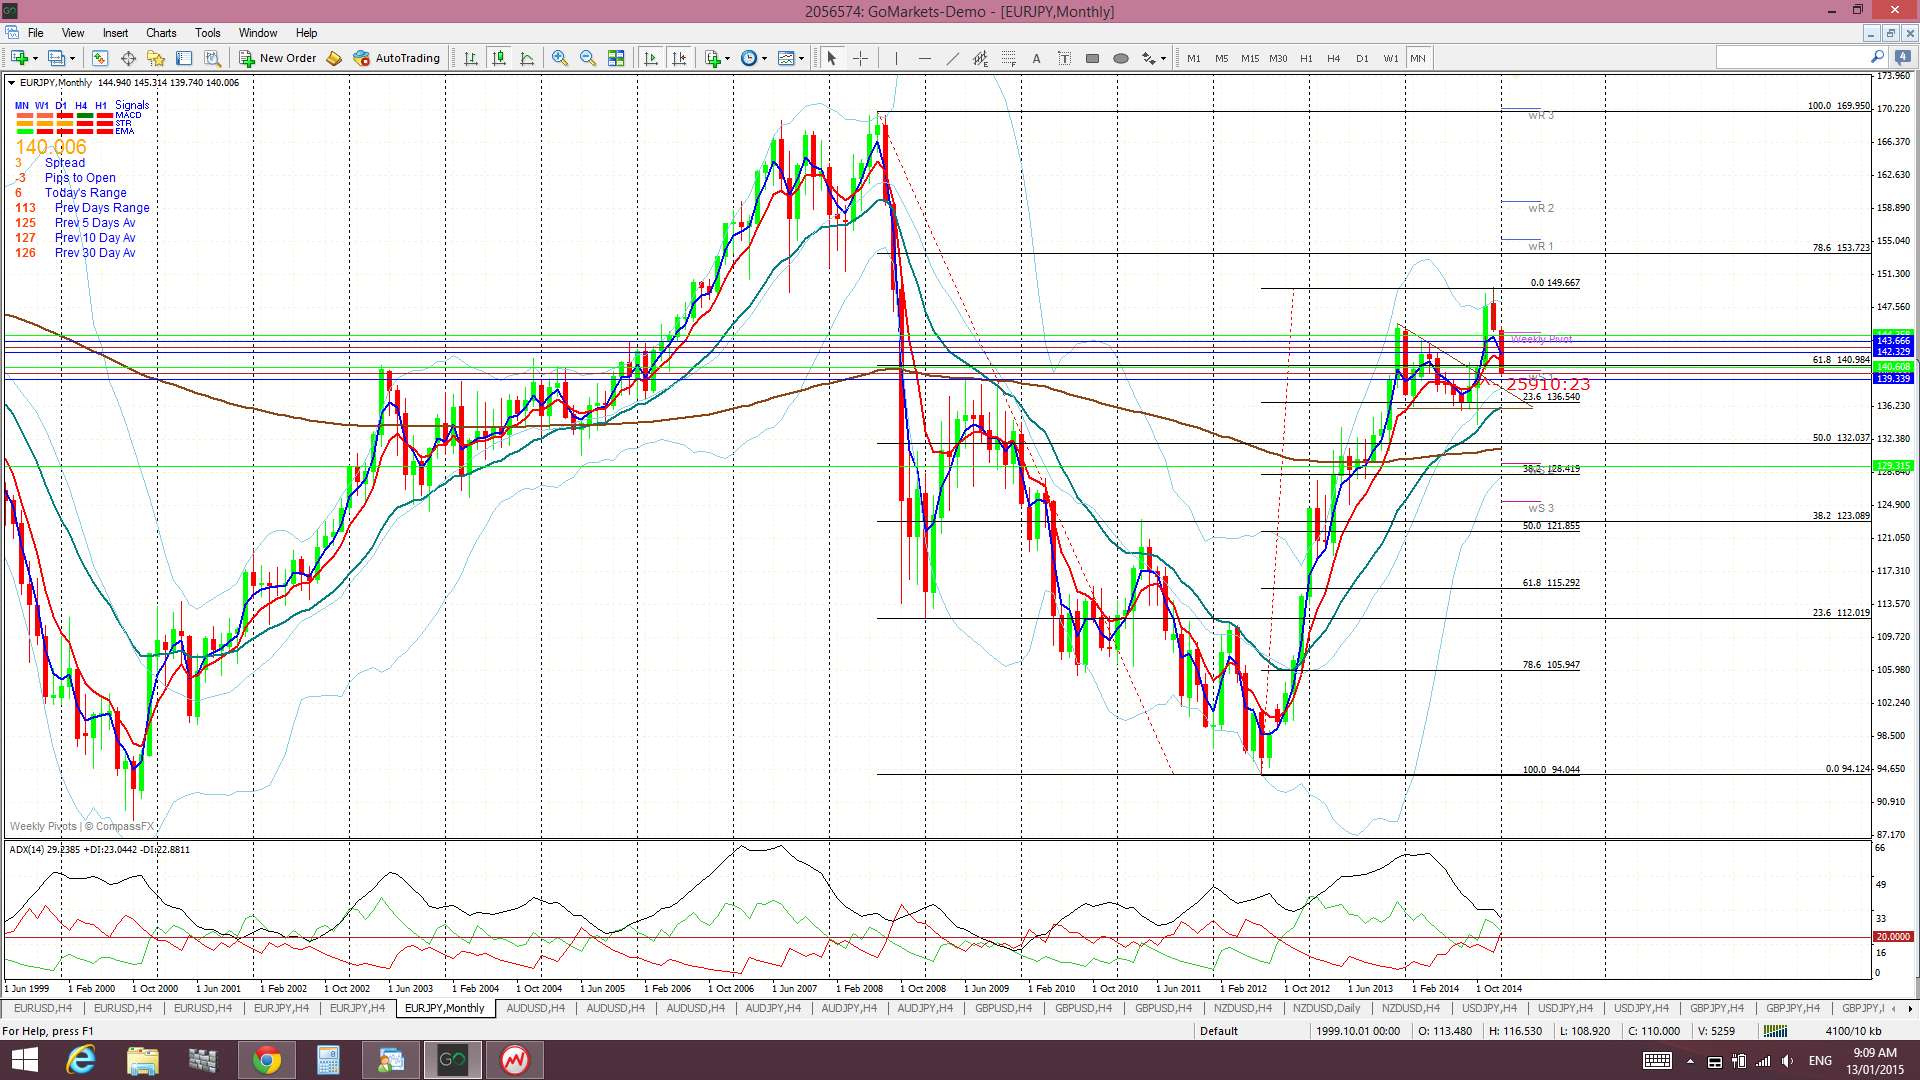
E/J: this pair is parked at a major level too, as seen on the monthly chart:
E/J 4 hr:
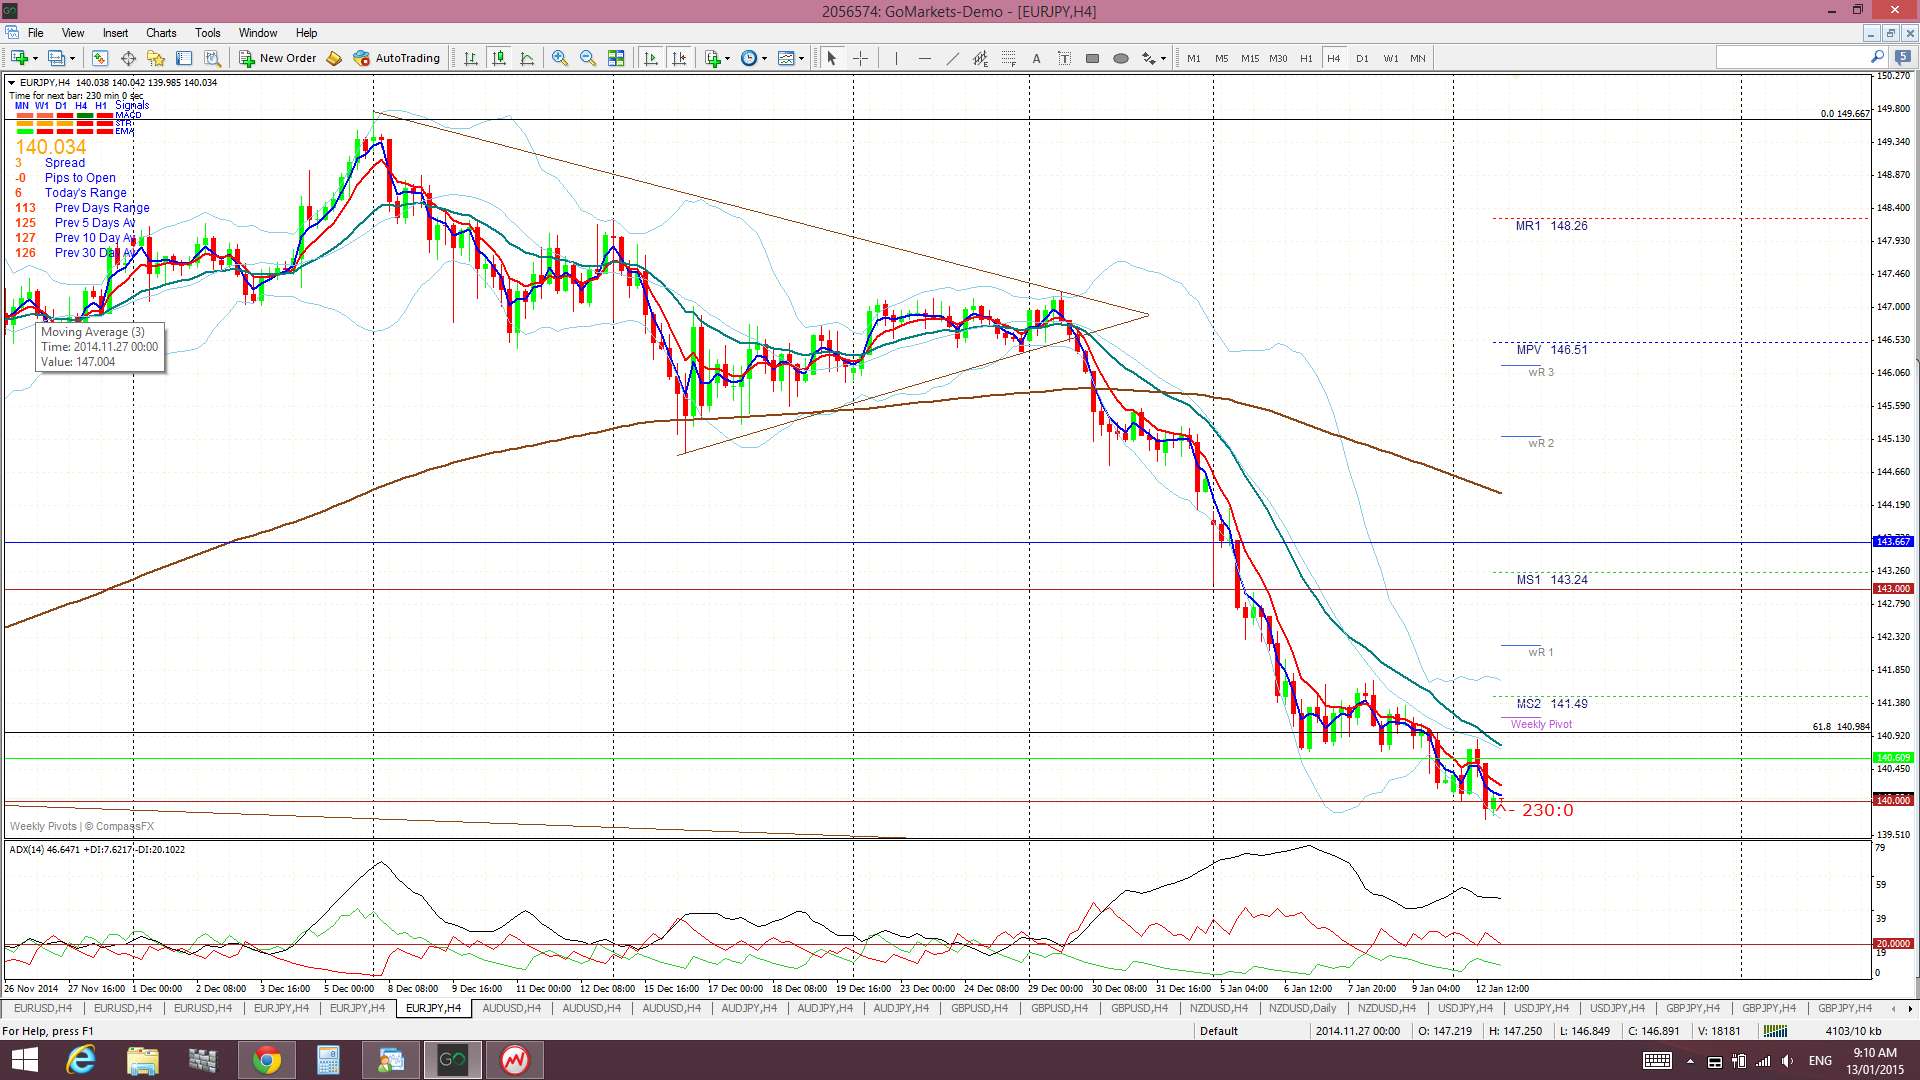
E/J monthly: check out how 140 is a major S/R level on the monthly chart:
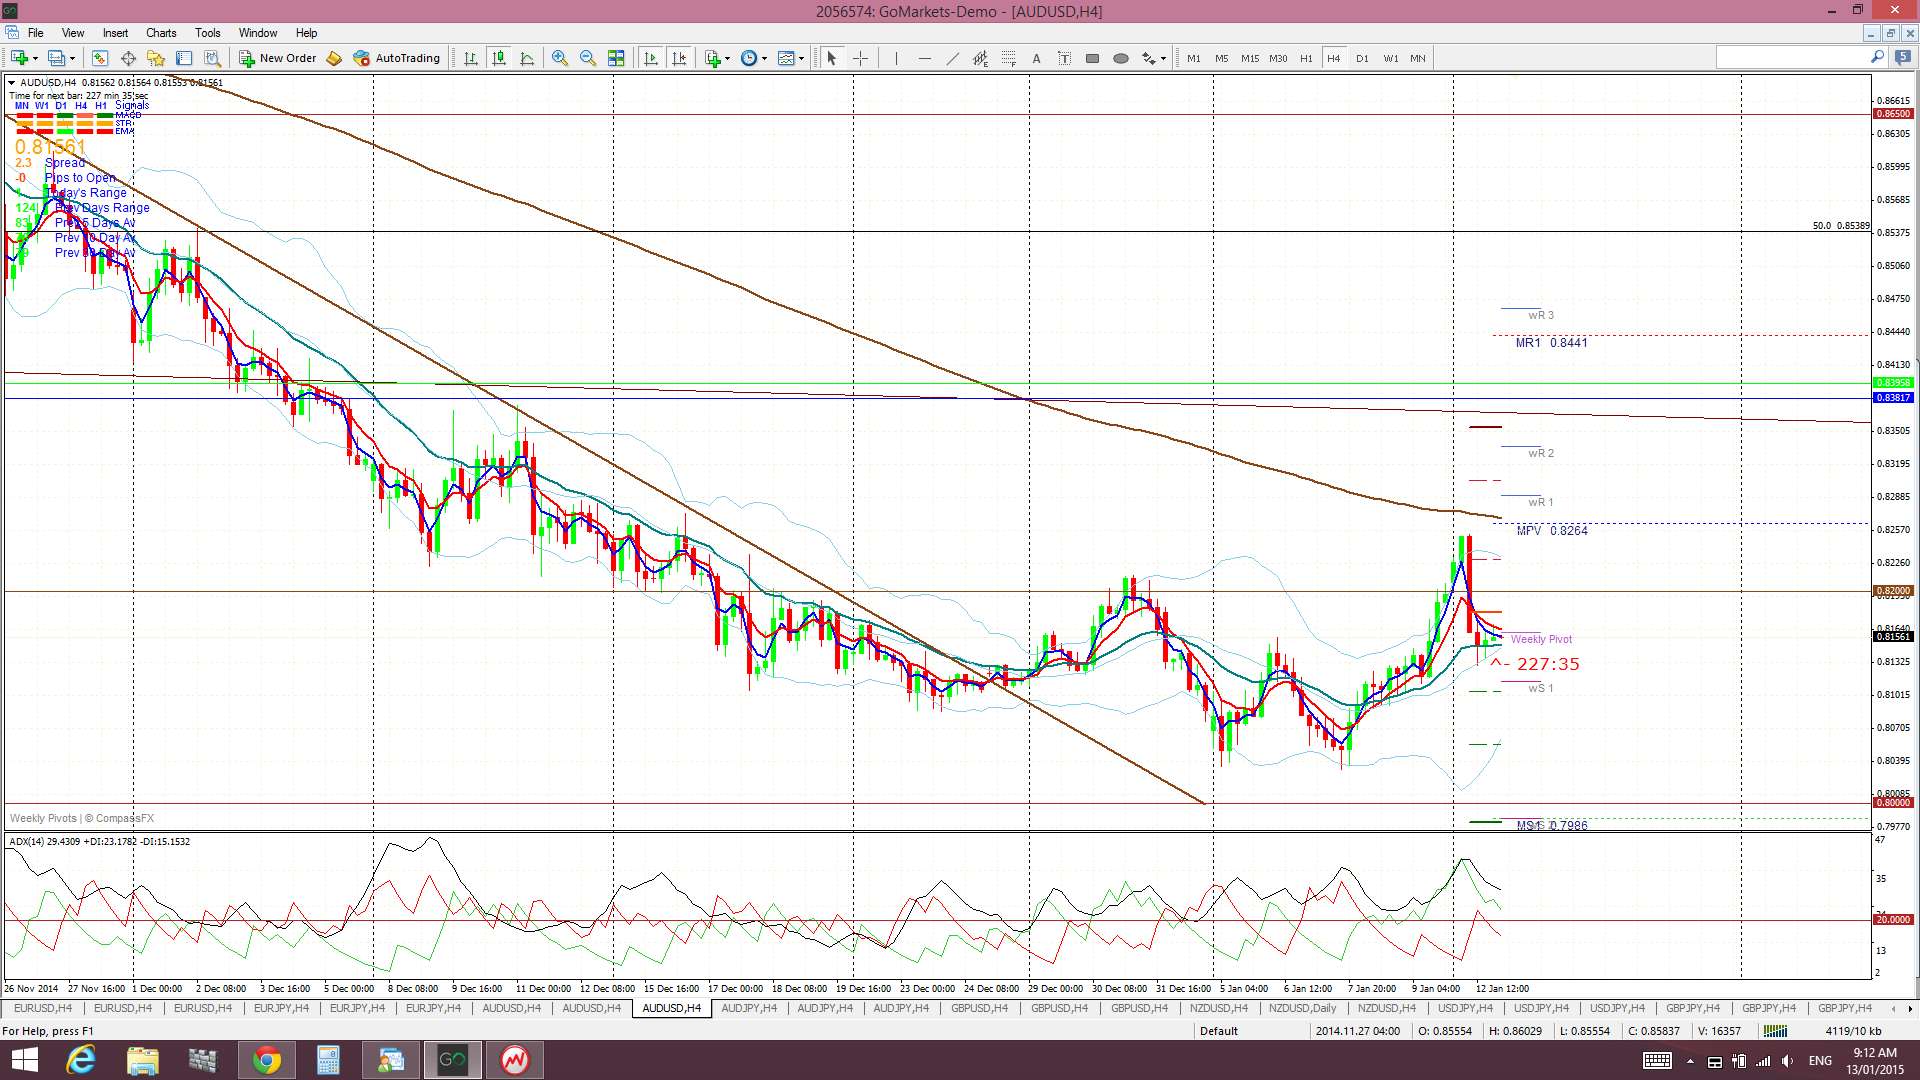
A/U: is back in the 0.80 and 0.82 channel after a brief excursion north. This choppiness isn’t too surprising as A/U looks for guidance from stocks (down), Oil (down) but Gold (up)! Watch out for reaction to Chinese Trade Balance data later today:
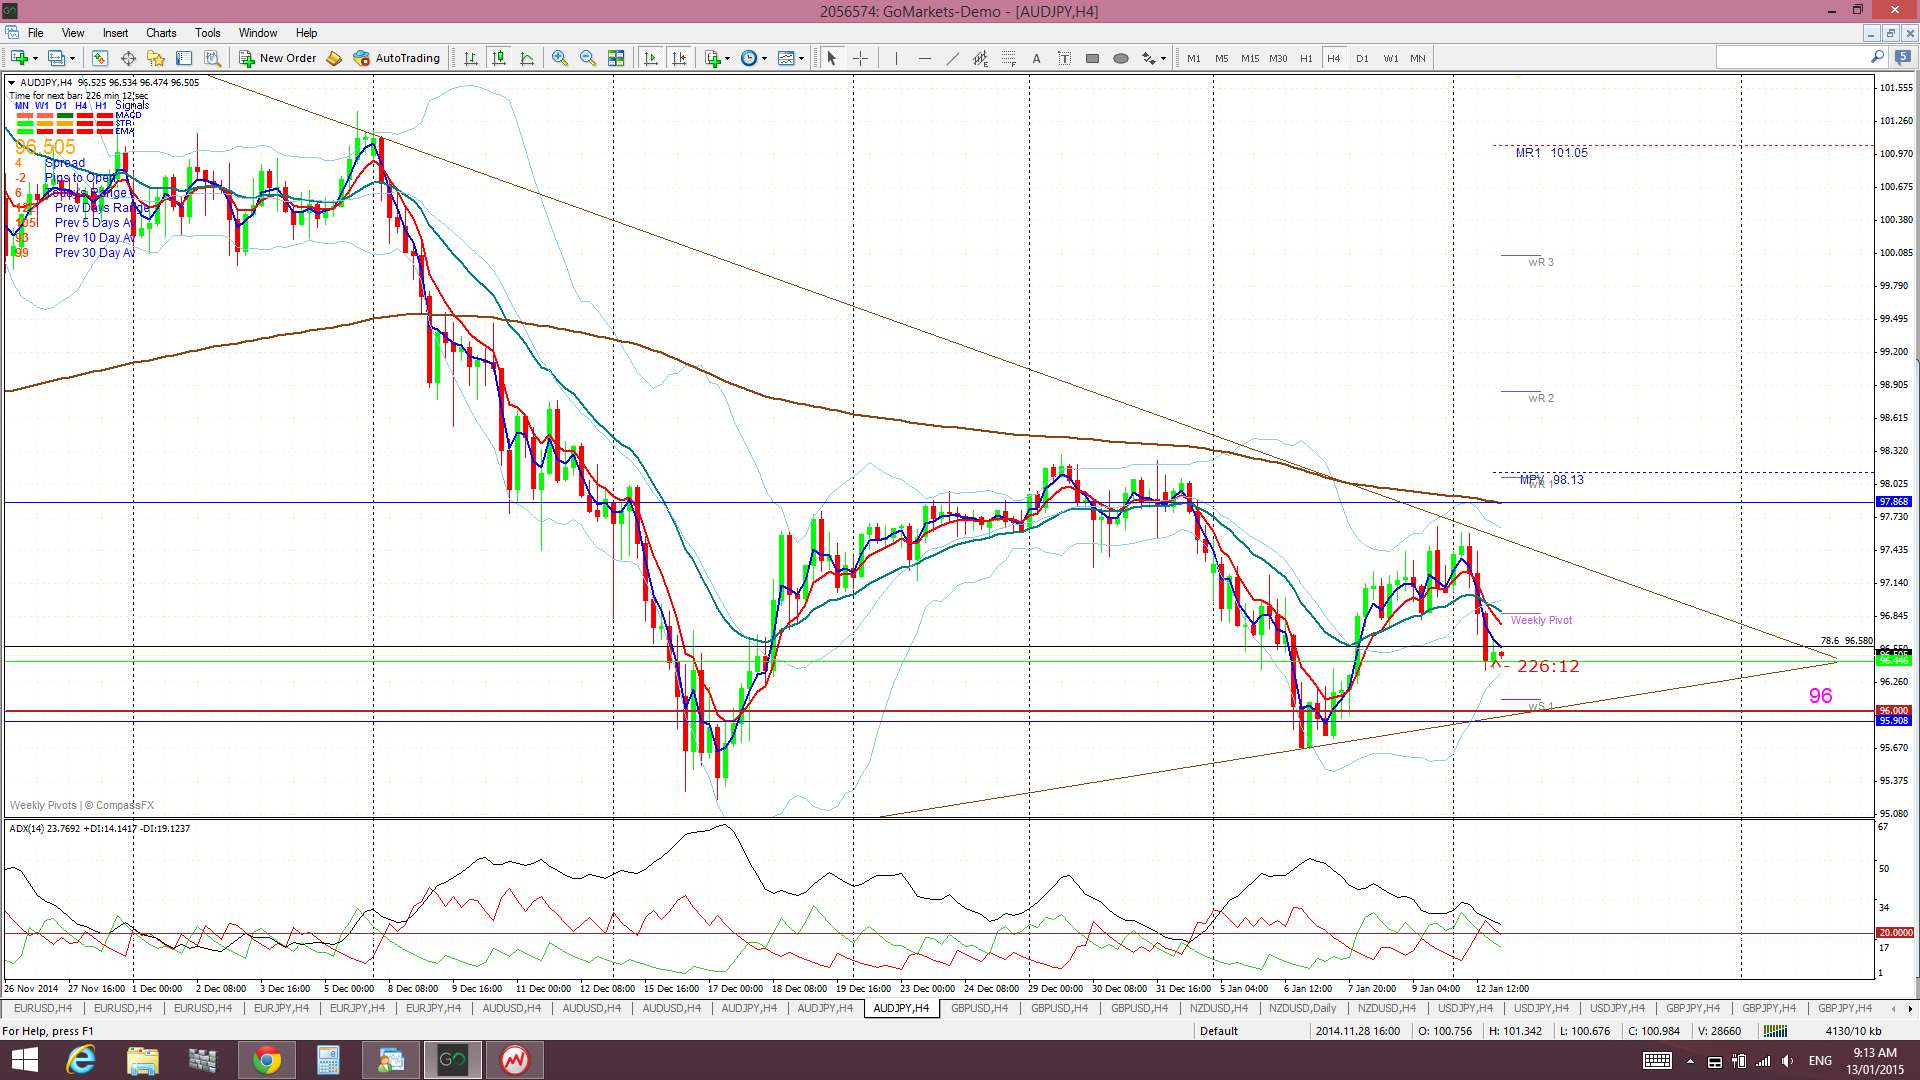
A/J: I swear this pair must know about my triangle pattern! Look how price action has conformed to the trend lines. Mean reversion towards 96?
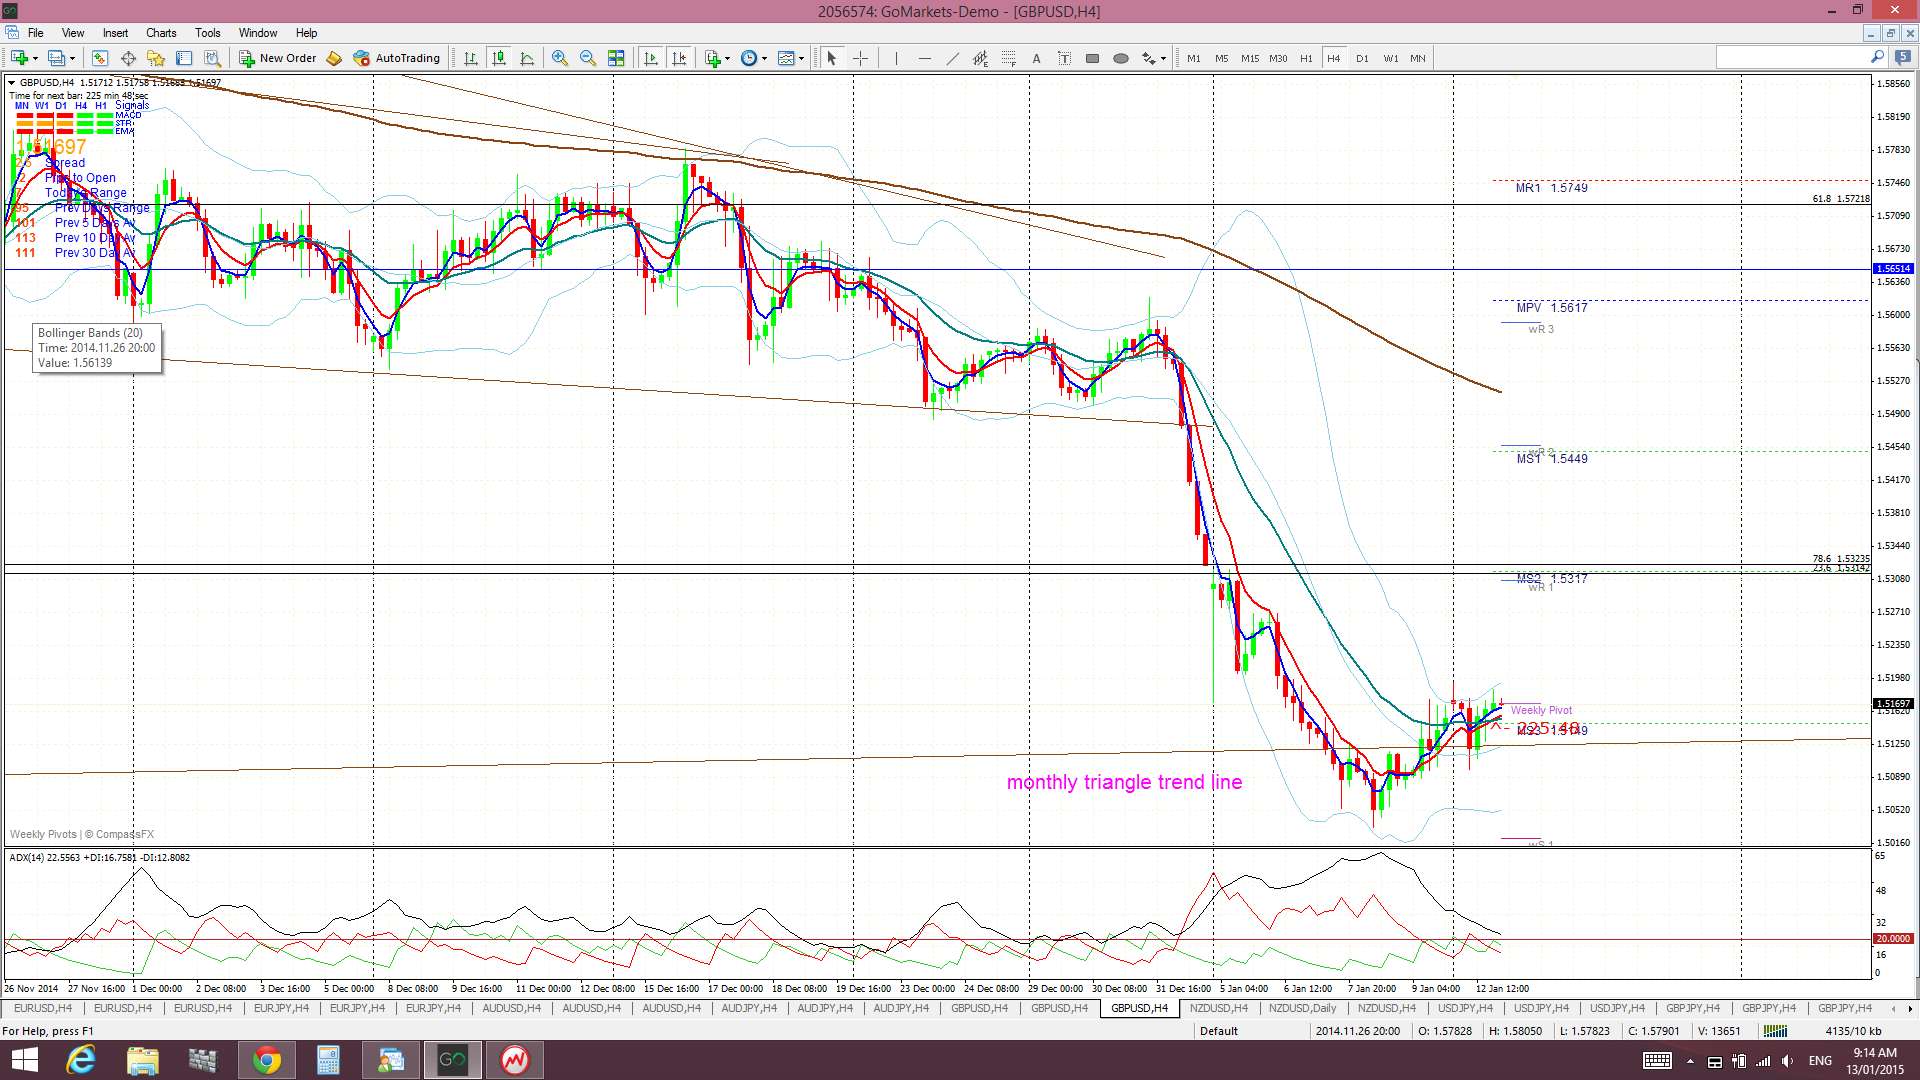
GBP/USD: trying to hold above the major monthly triangle support trend line:
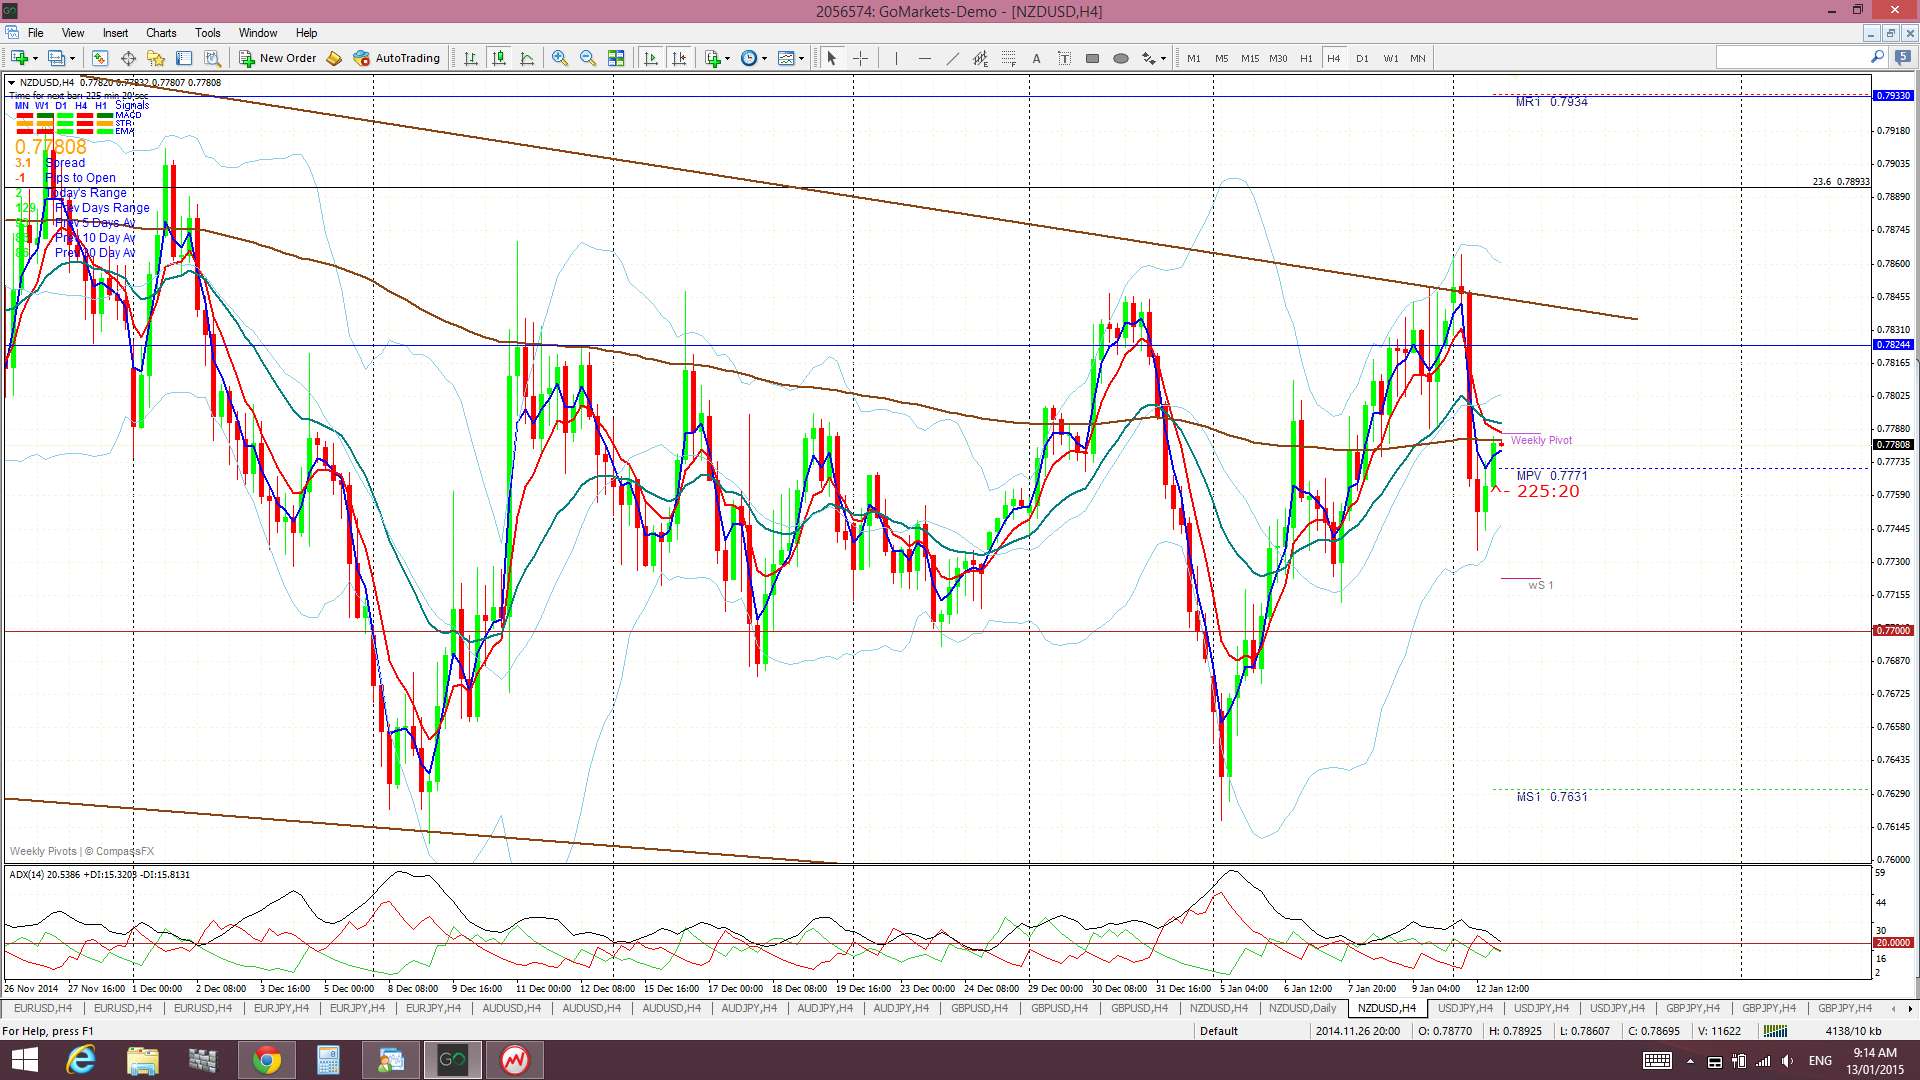
Kiwi: another pair that must know about my trend lines! Note the absence of momentum here too:
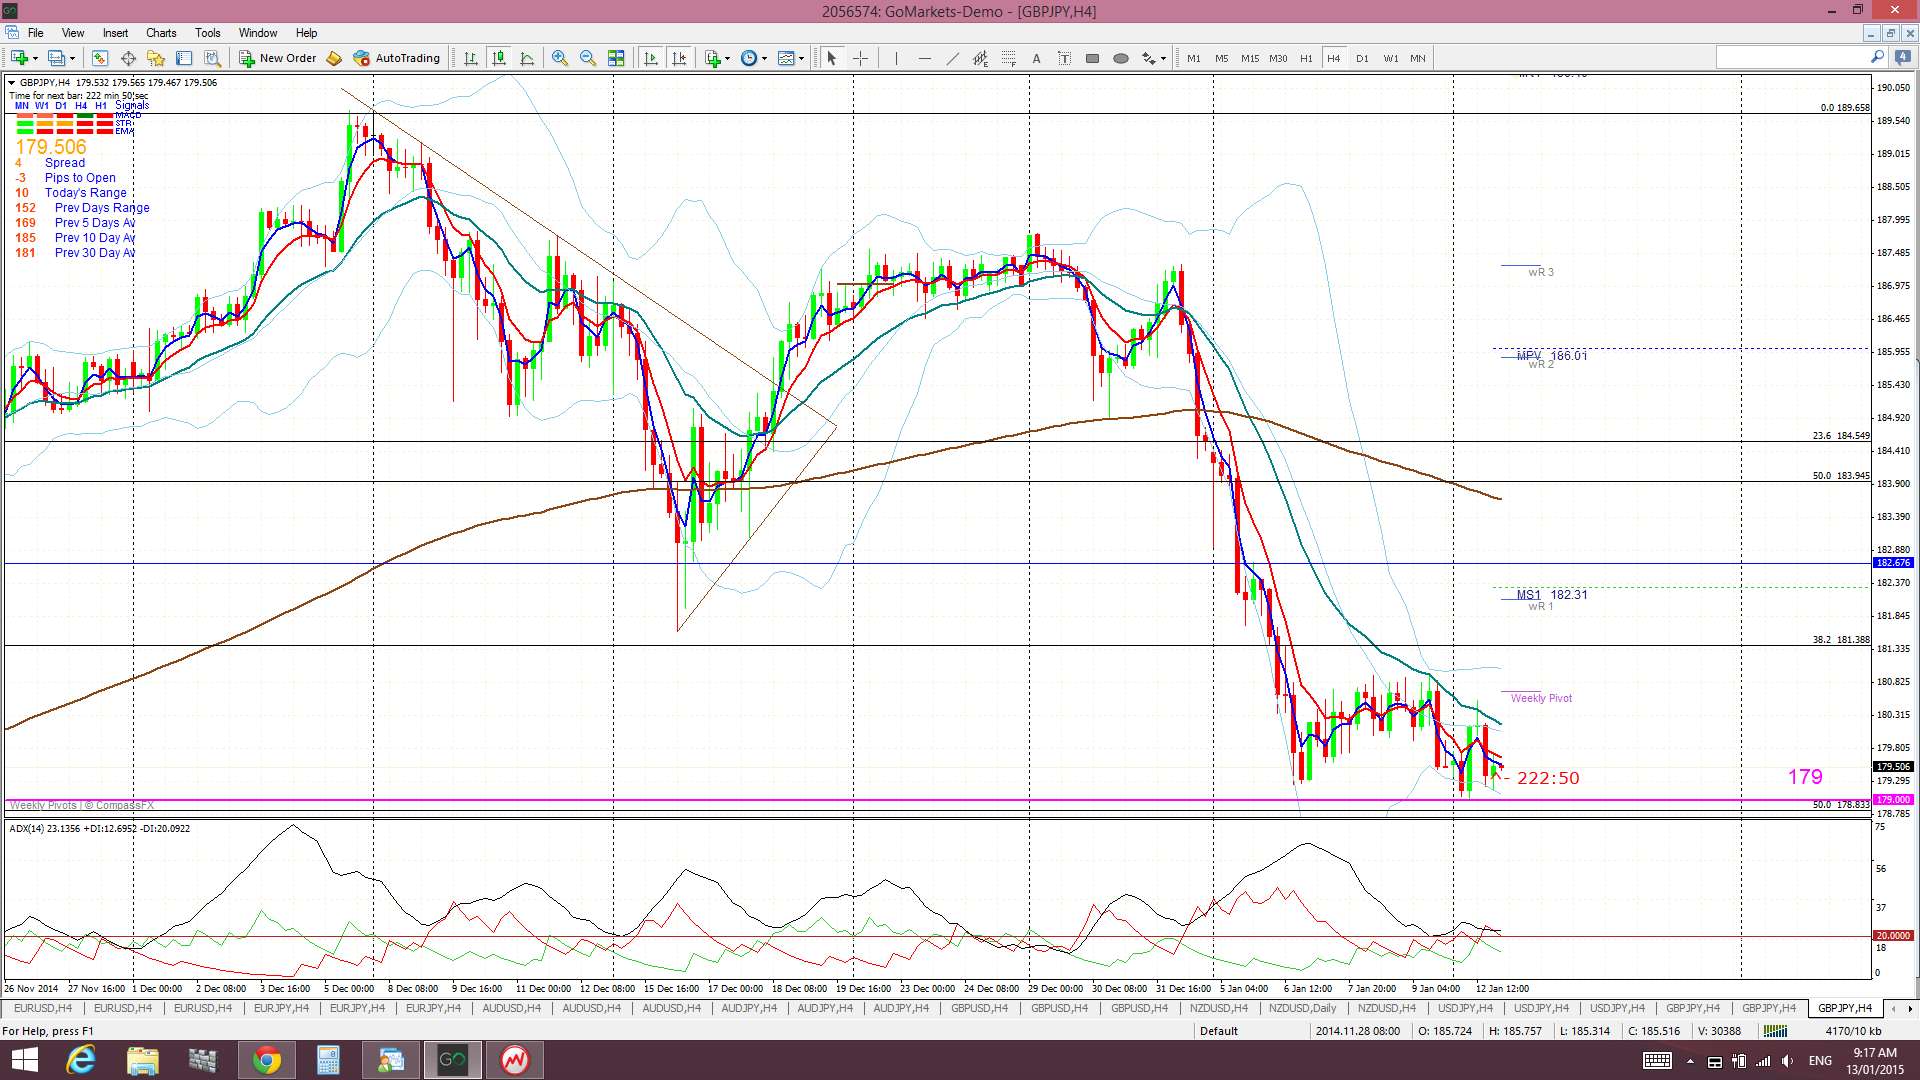
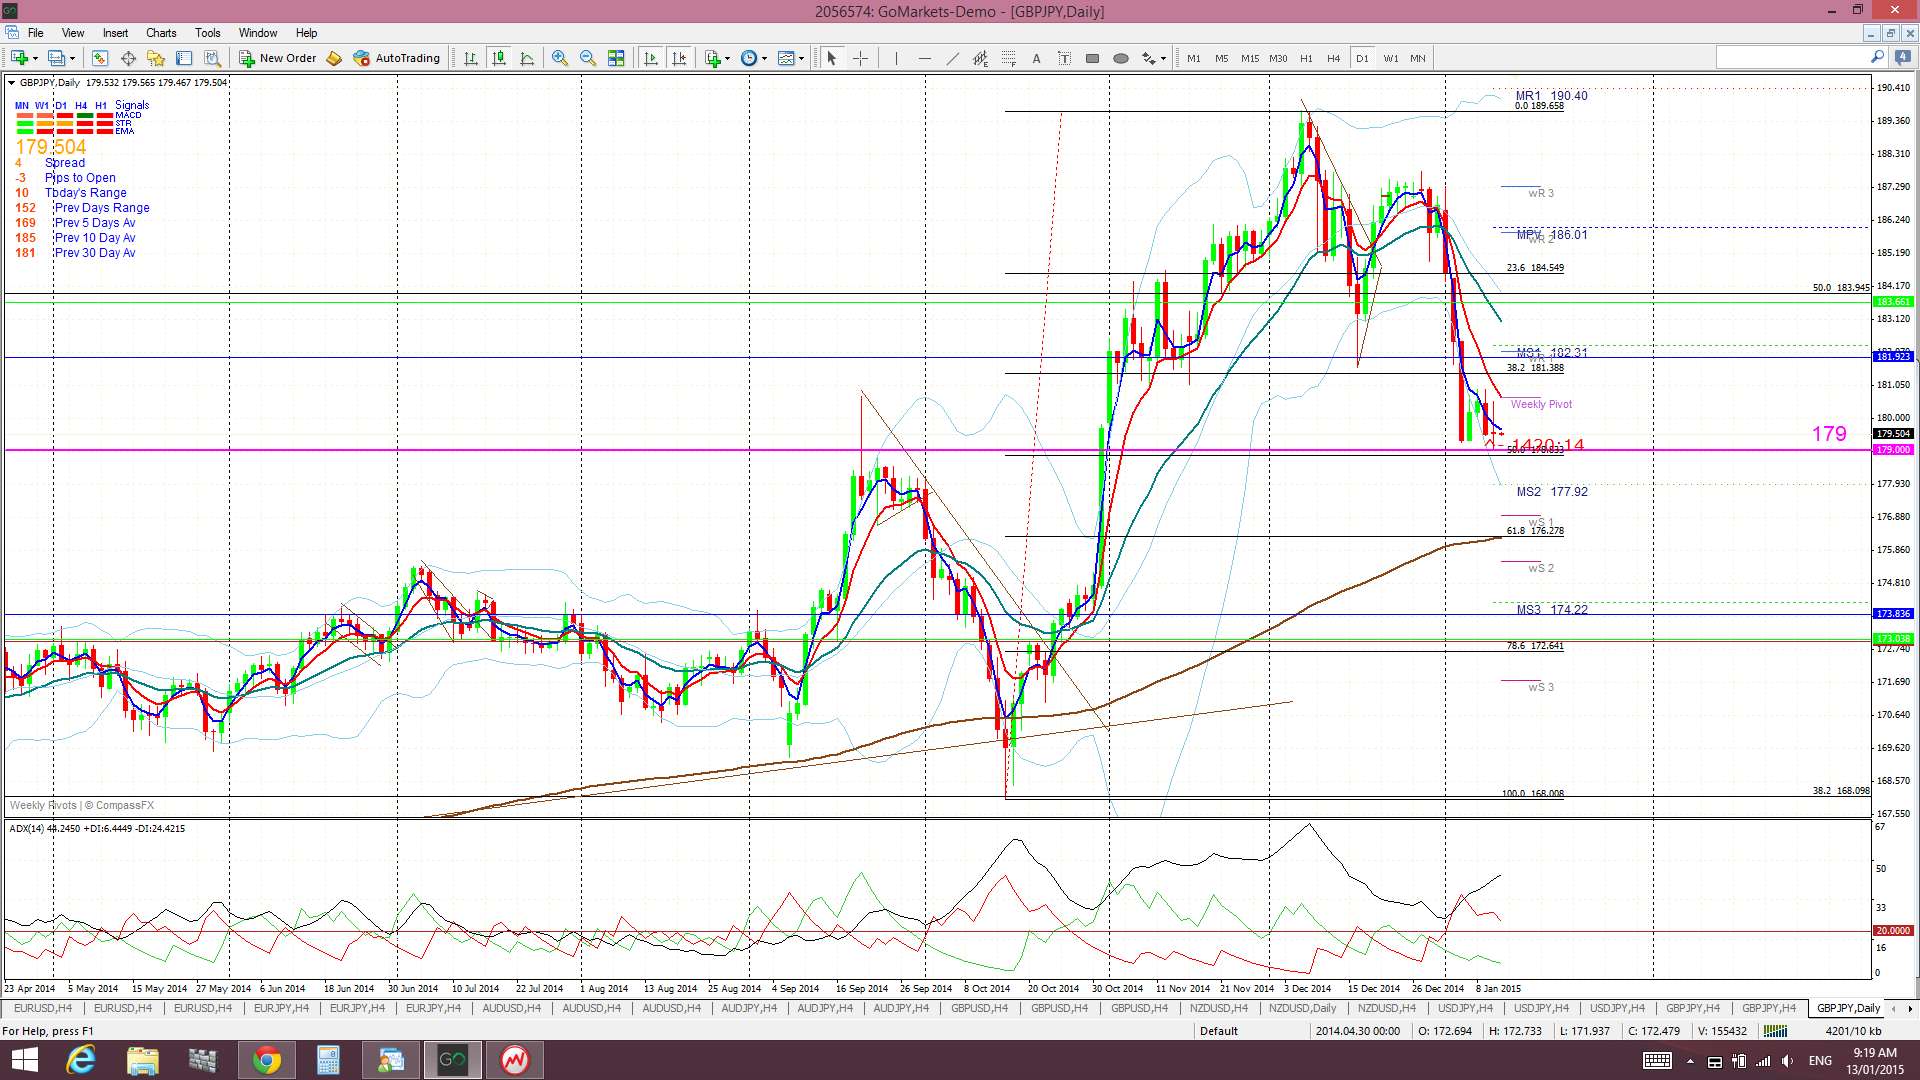
GBP/JPY: another Yen pair parked at a major S/R level and giving no momentum clues just yet:
G/J 4hr: parked at 179:
G/J daily: this 179 level is also the 50% fib of the recent bull run:
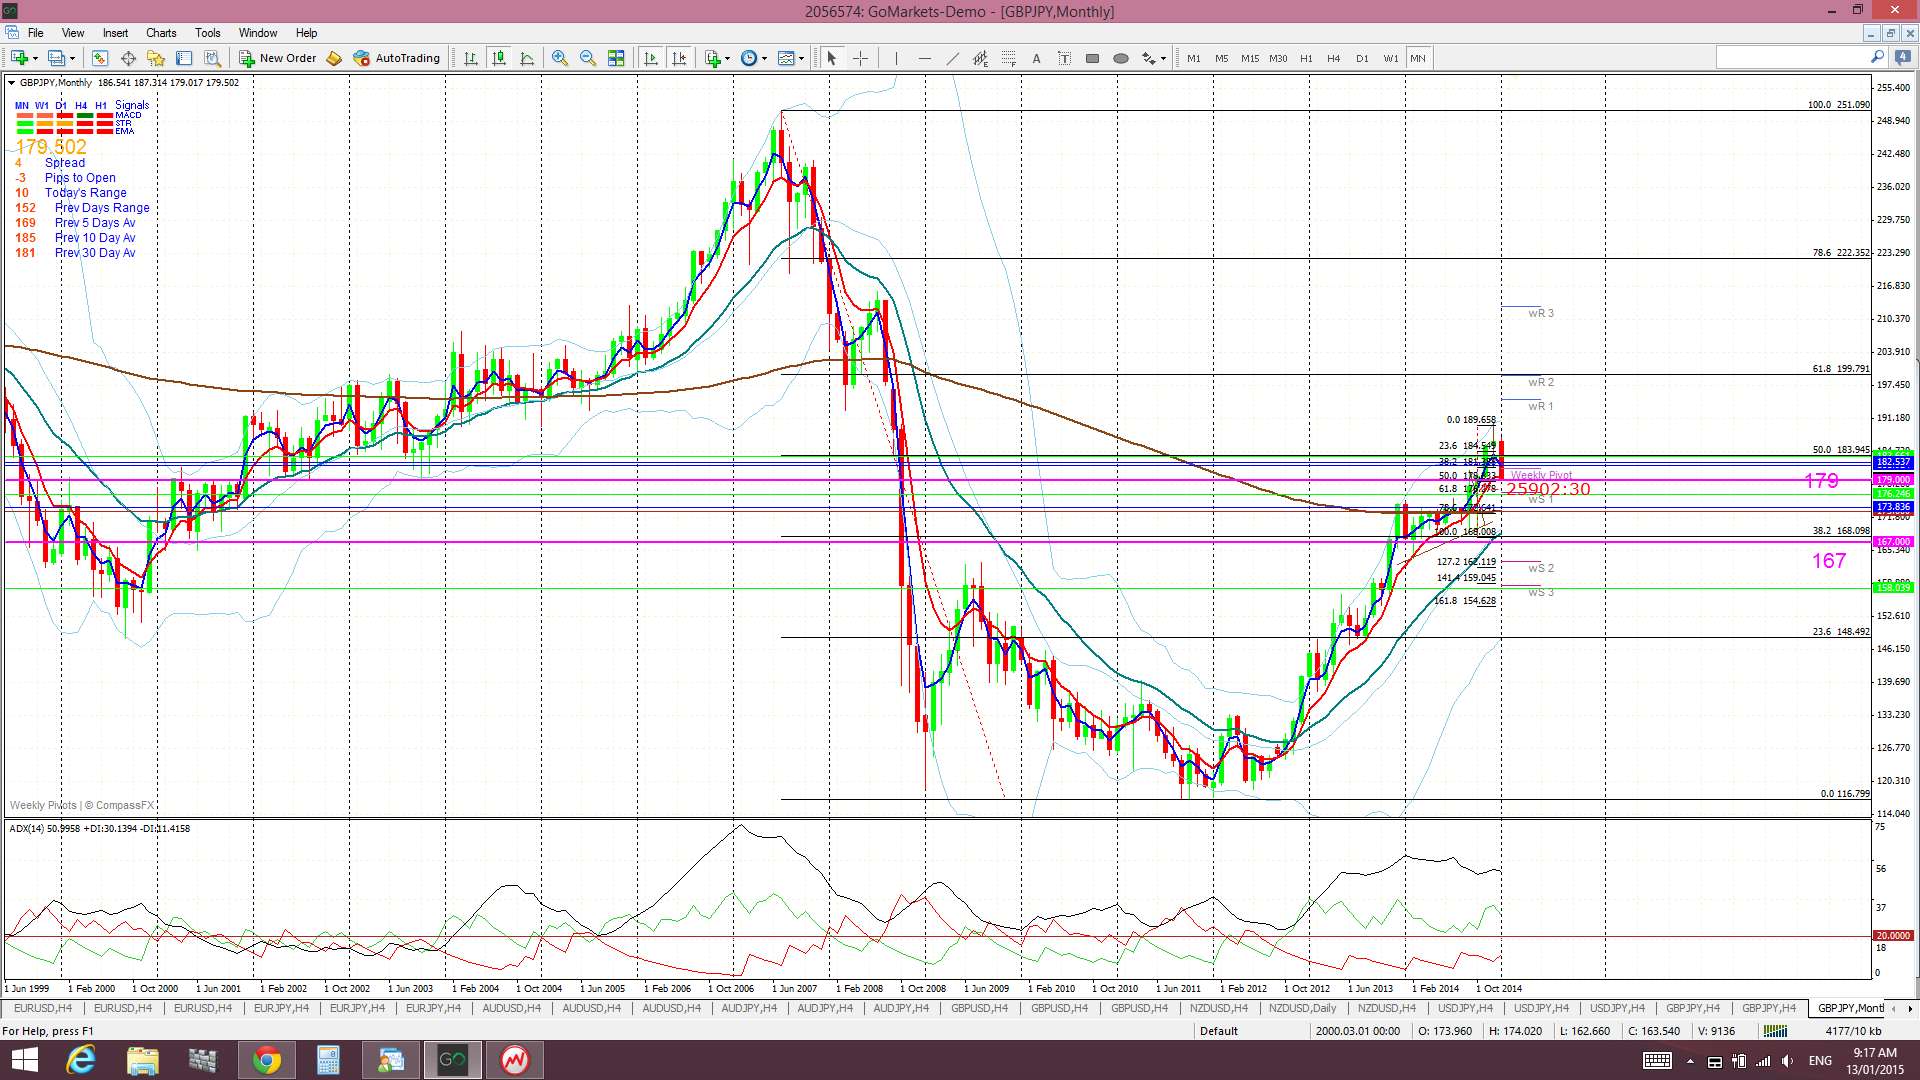
G/J monthly: check how 179 has been a major S/R level for the GBP/JPY:
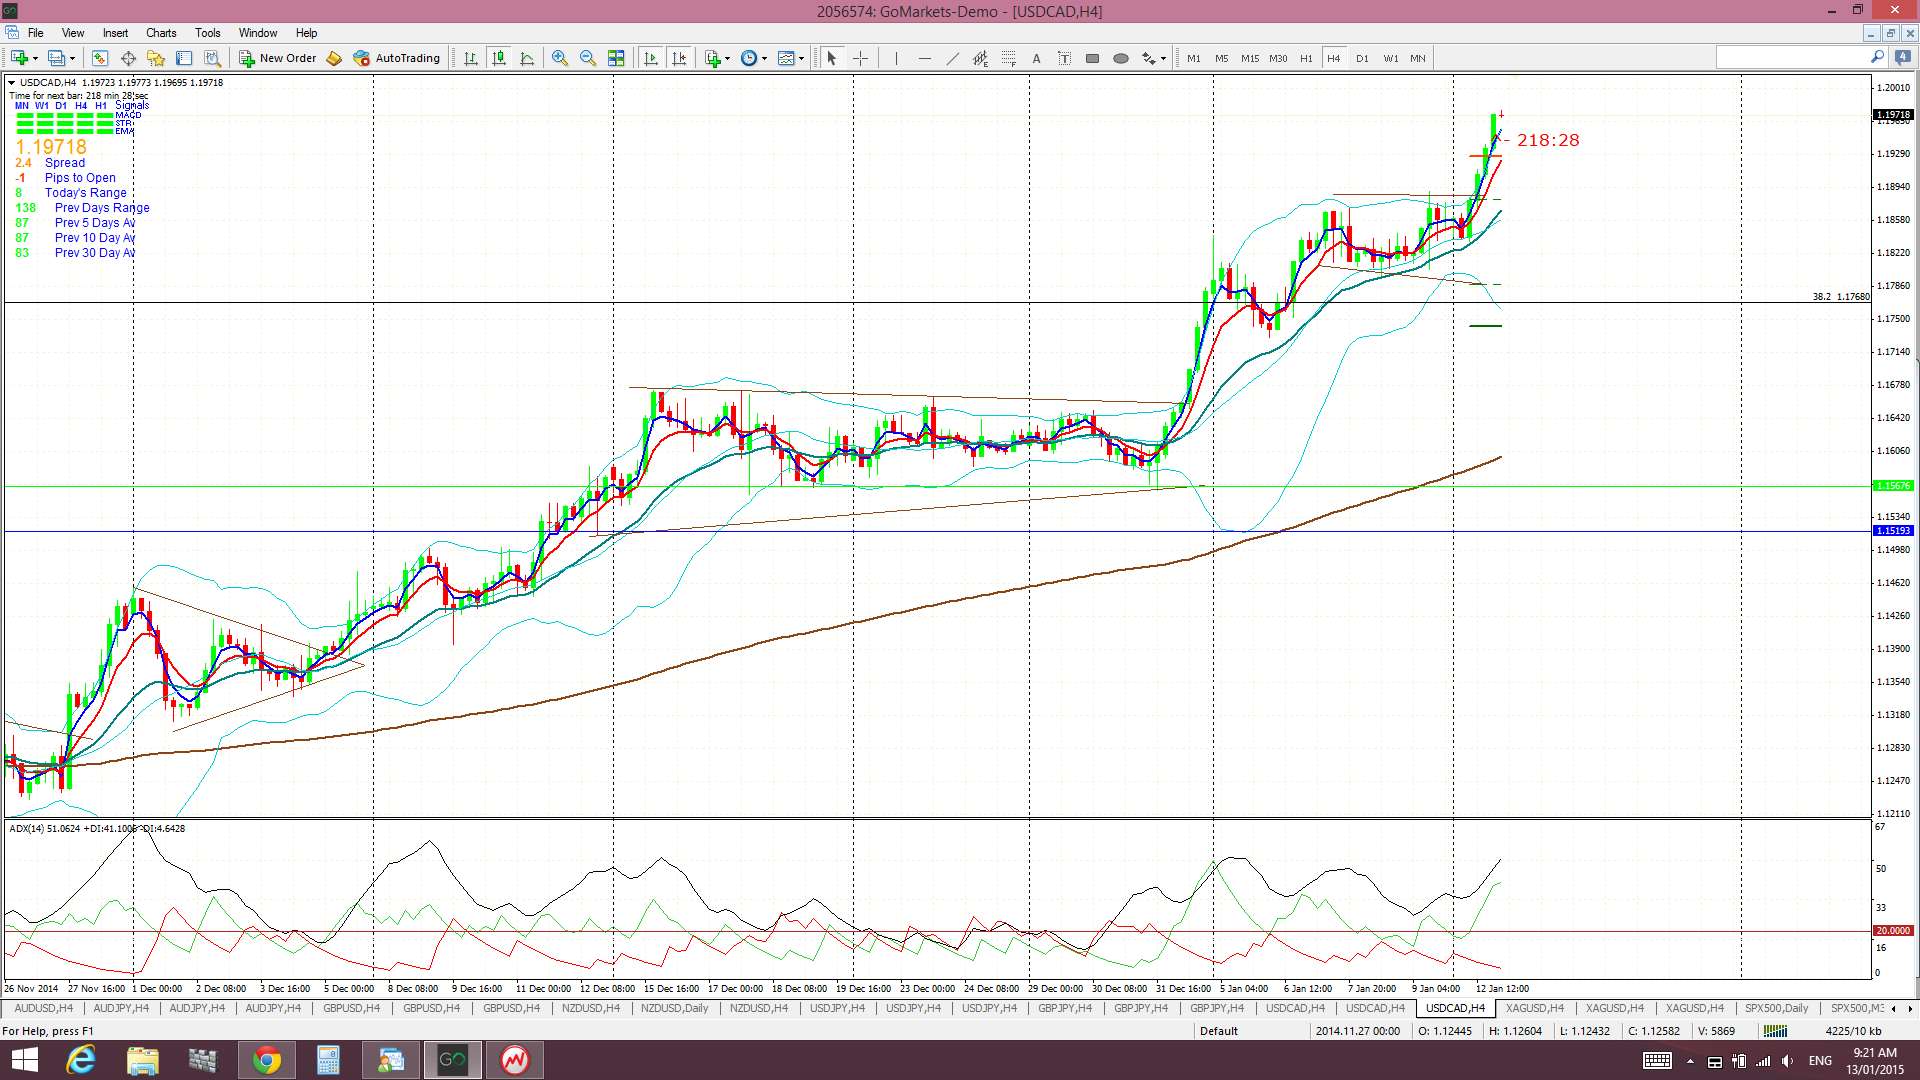
Loonie: this pair continues higher and has broken up and out from the recent flag pattern. The Oil story keeps this pair bid:
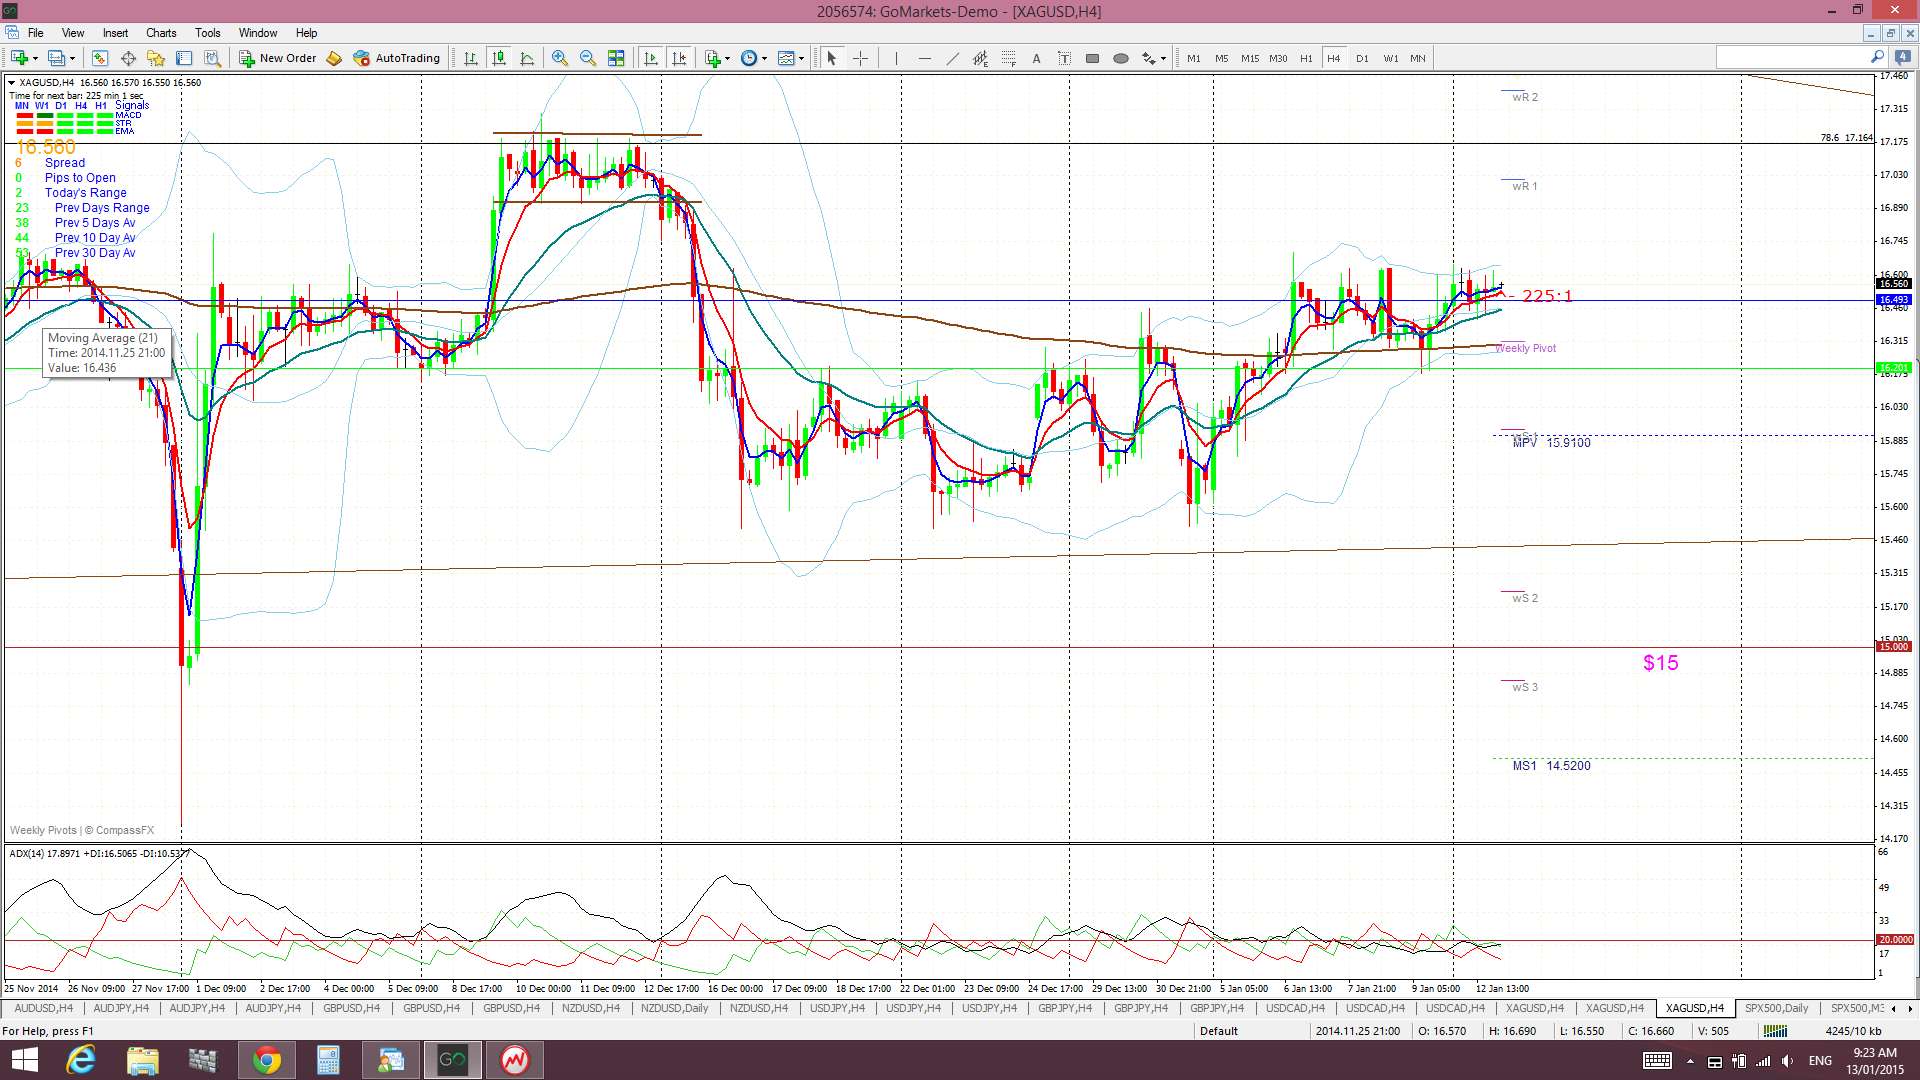
Silver: no new TC signal here yet. It had looked like it was trying but the choppy USD seems to have undermined that. Note the absence of momentum here too:
The post FX pairs consolidate: will this continue until ECB? Gold shines. appeared first on www.forextell.com.