Gold has been desperately trying to hold above major support for the last three months. A stronger USD has been just part of the metals’s problem and this has seen Gold trading down near the 61.8% fib level of the 2008-2011 bull move. This support has managed to hold for now but there are some other bullish signals starting to filter through here now as well. This makes me wonder if Gold might be starting to get some of its glitter back?
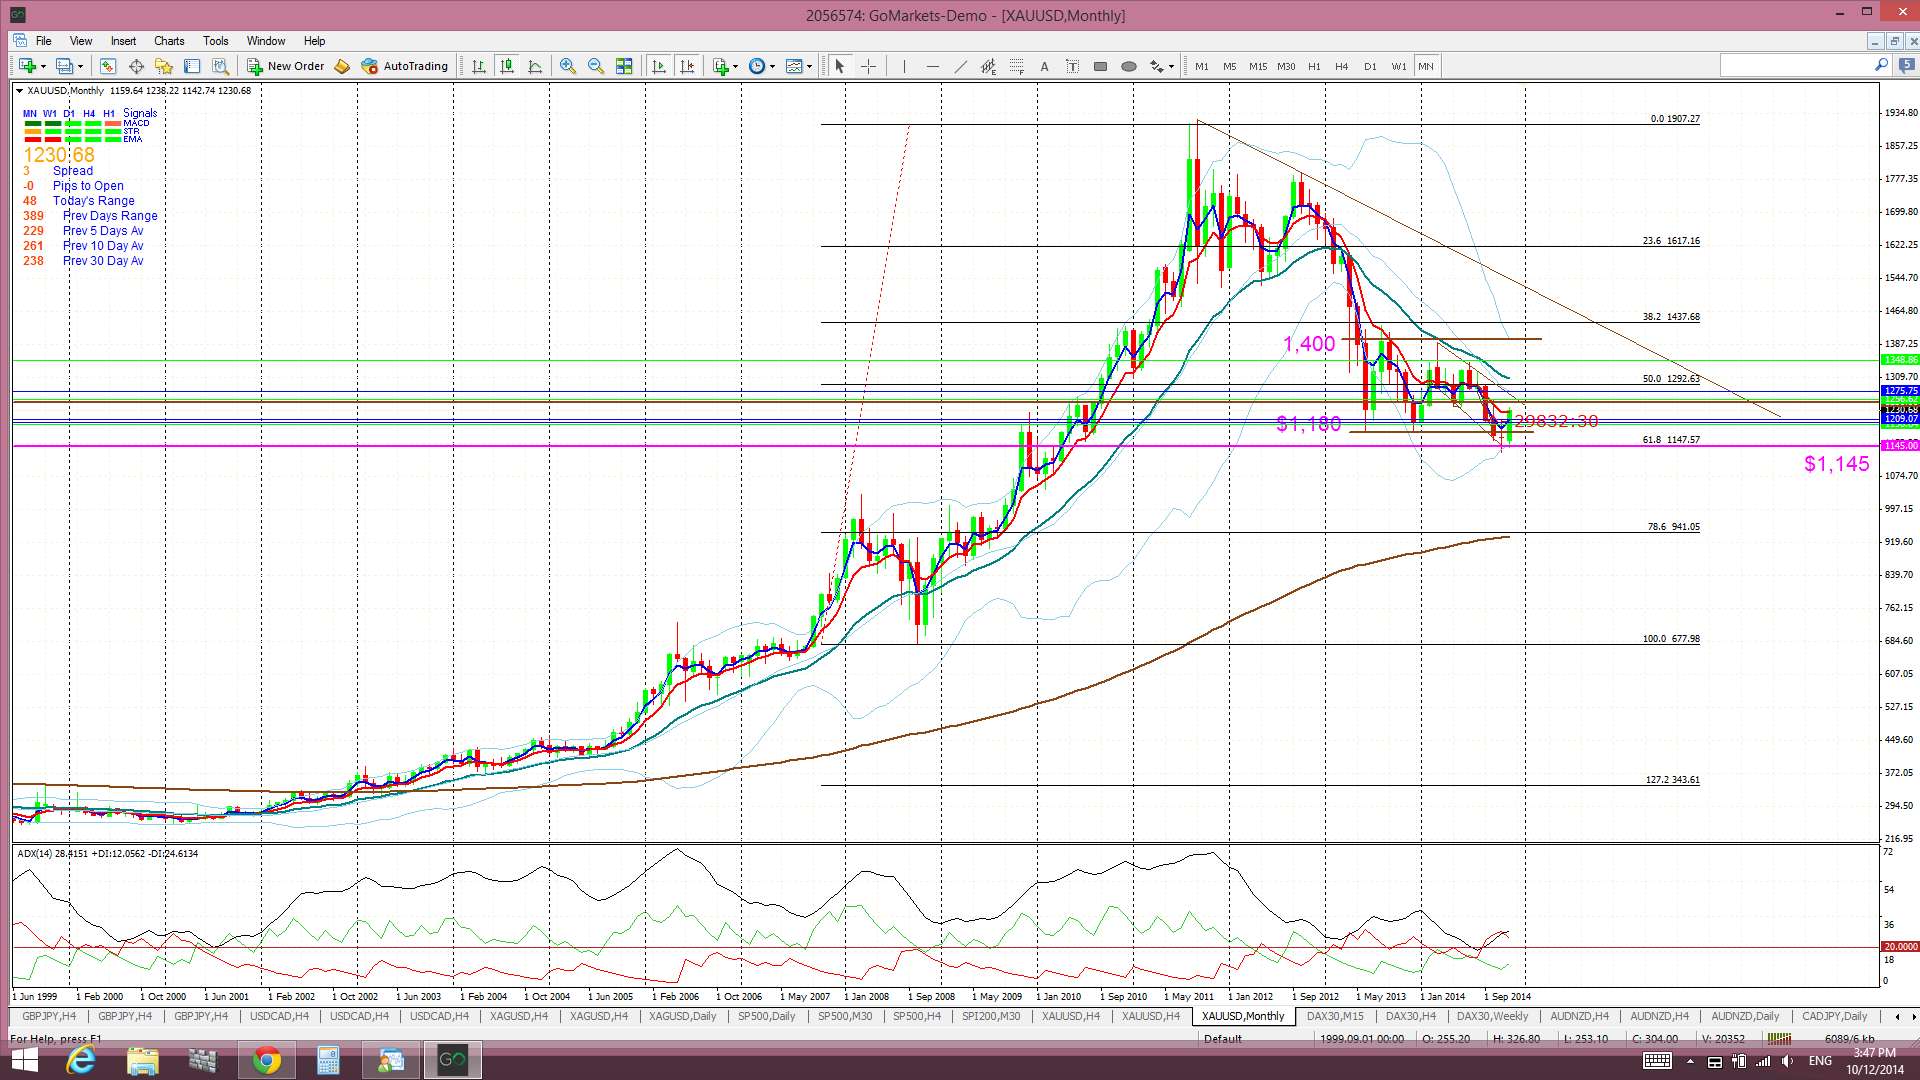
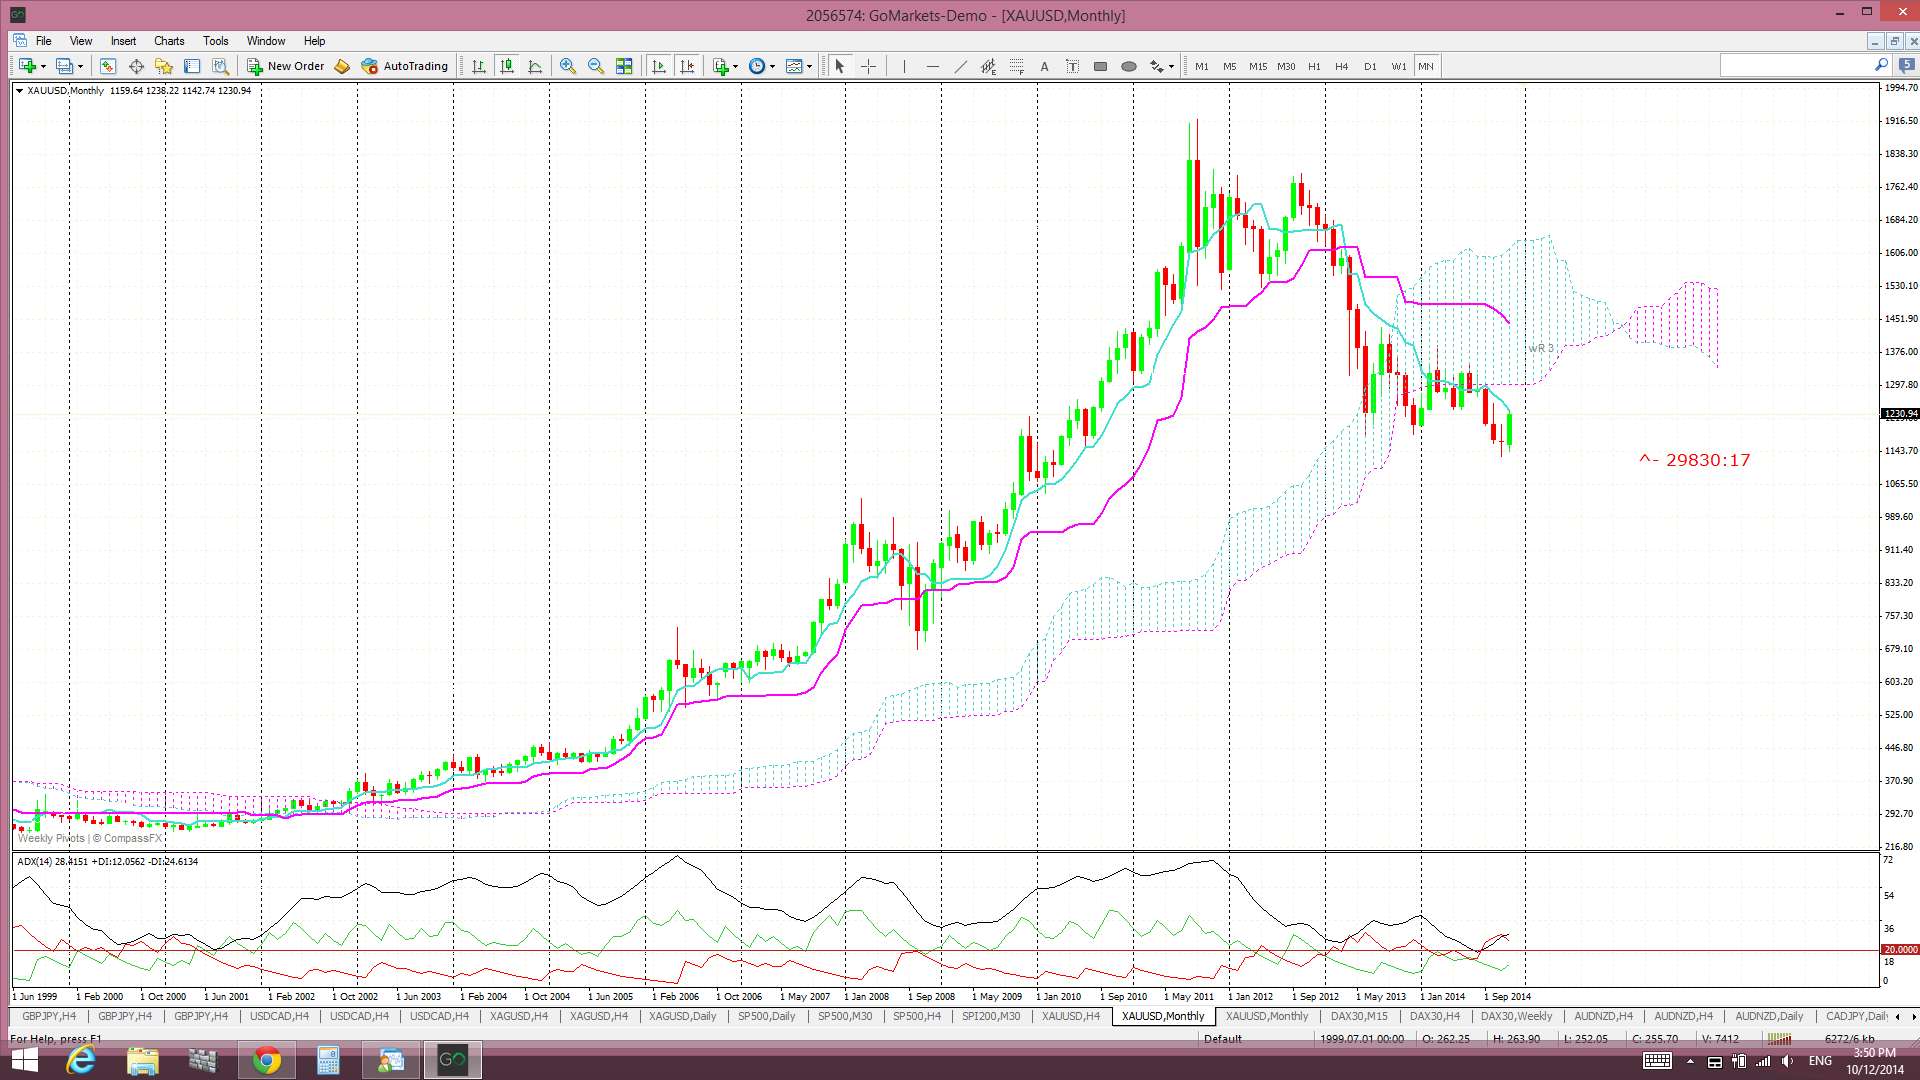
Gold monthly: the 61.8% fib is a major Fibonacci level and this has managed to support Gold for the last few months. The month has a way to go just yet BUT note the bullish December candle that is currently forming up.
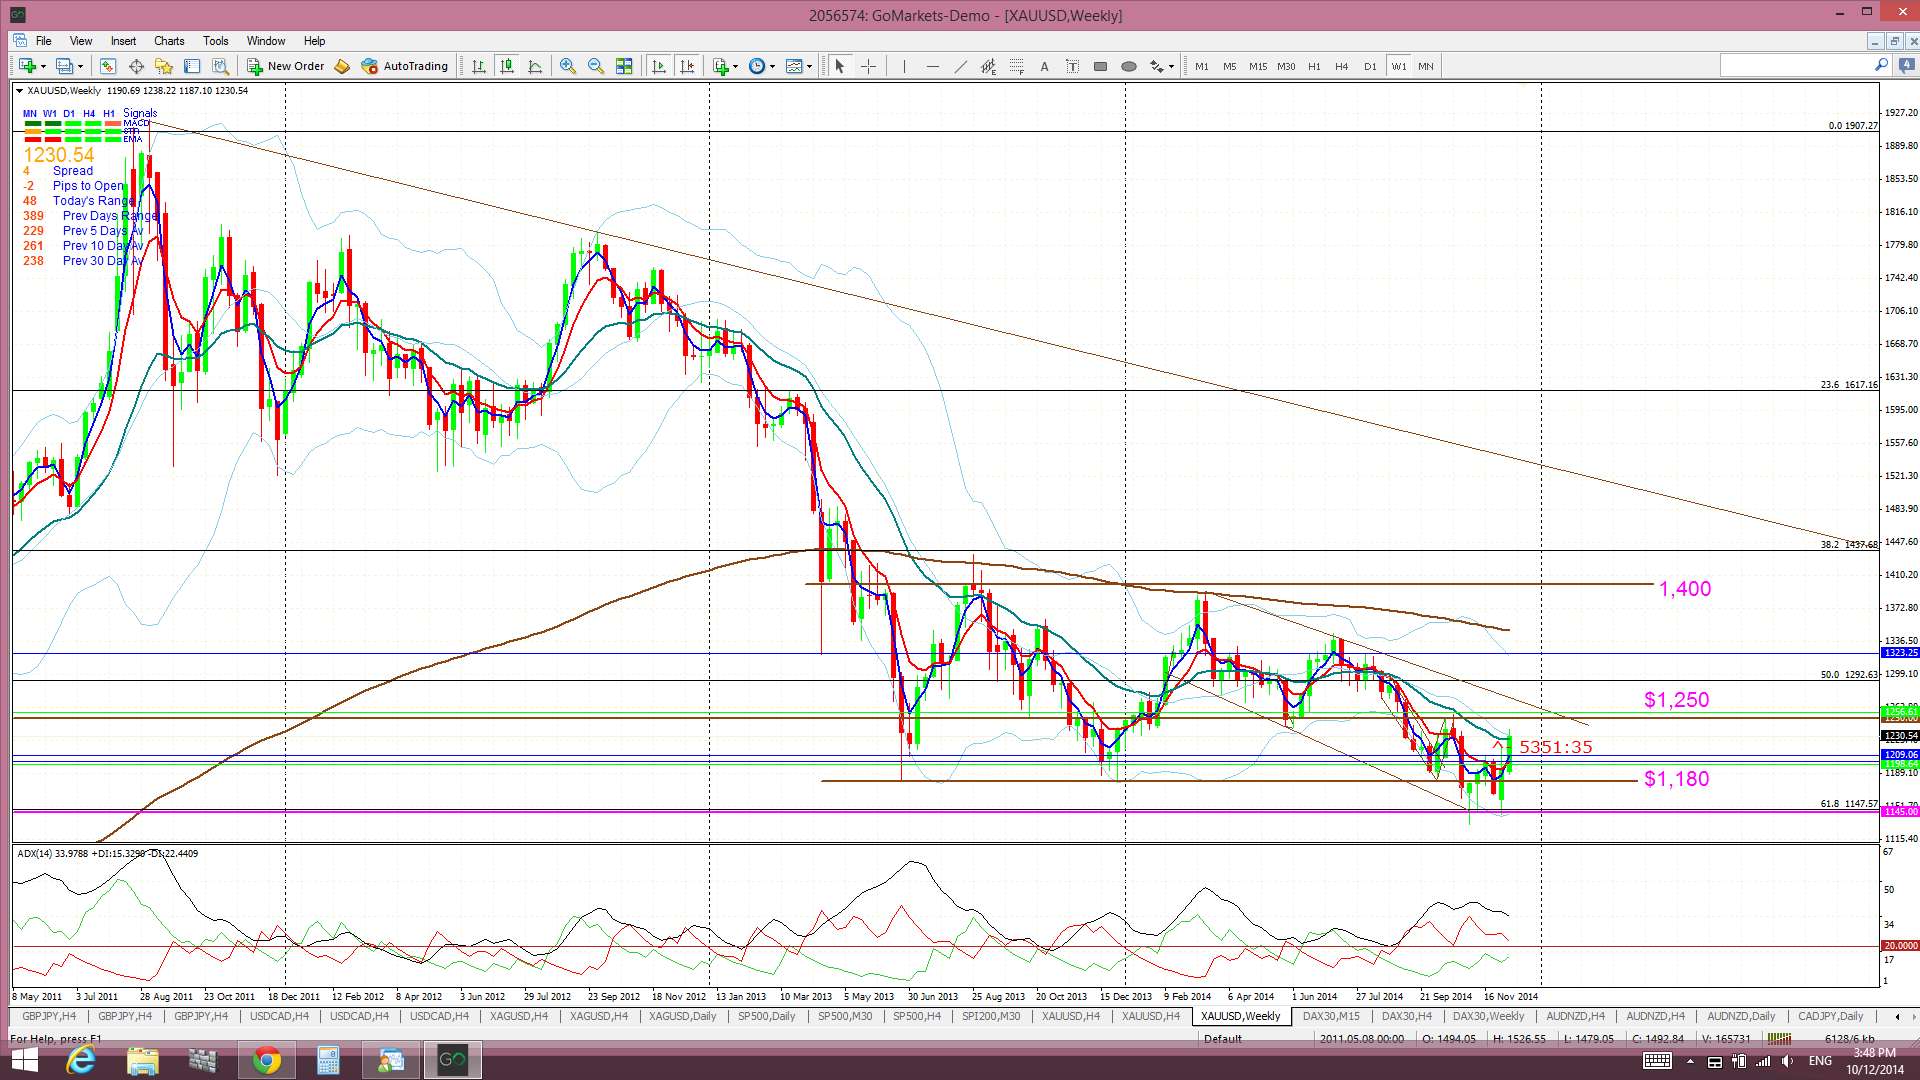
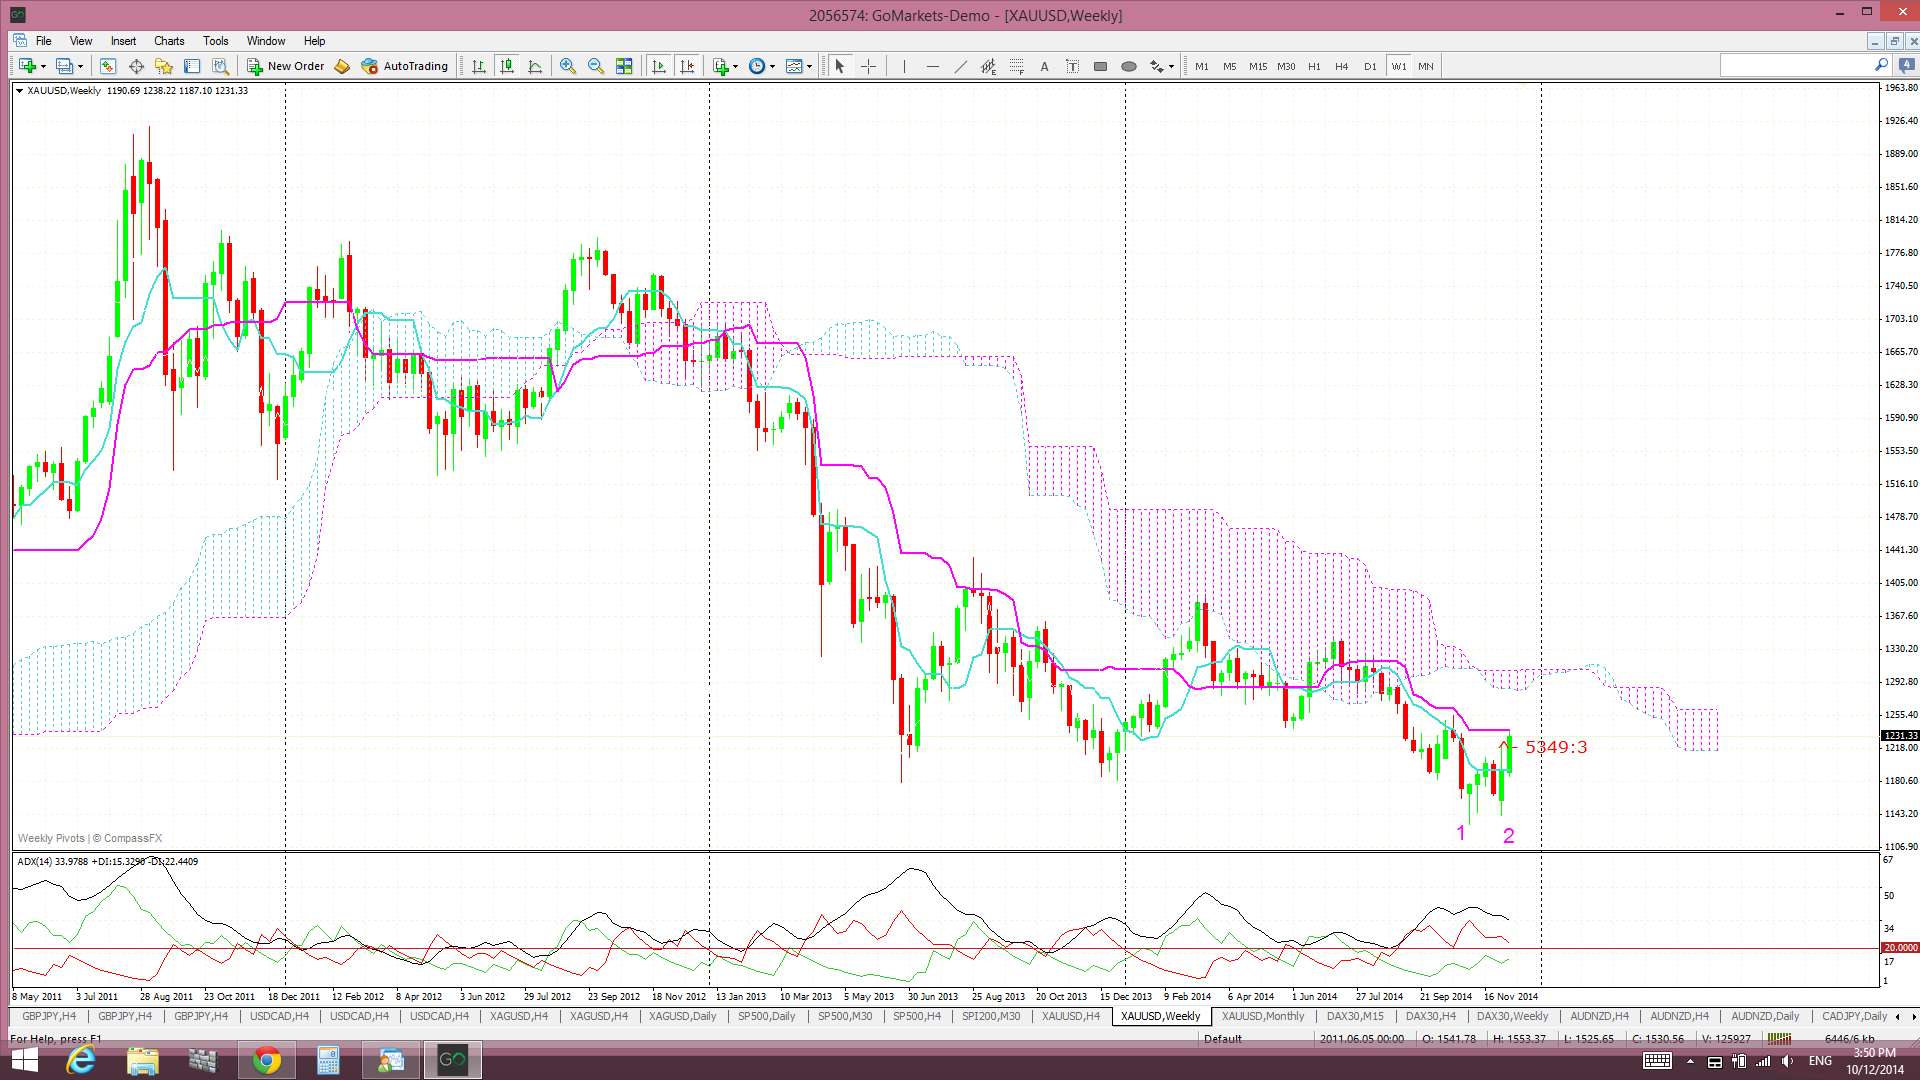
Gold weekly: the weekly chart shows a few interesting features. Firstly, the support from the 61.8% fib near $1,145. Secondly, that price action has been trading within a descending trading channel set within a larger horizontal channel. Thirdly, that the $1,250 is another key S/R level just above price and that any new close and hold above this would be bullish.
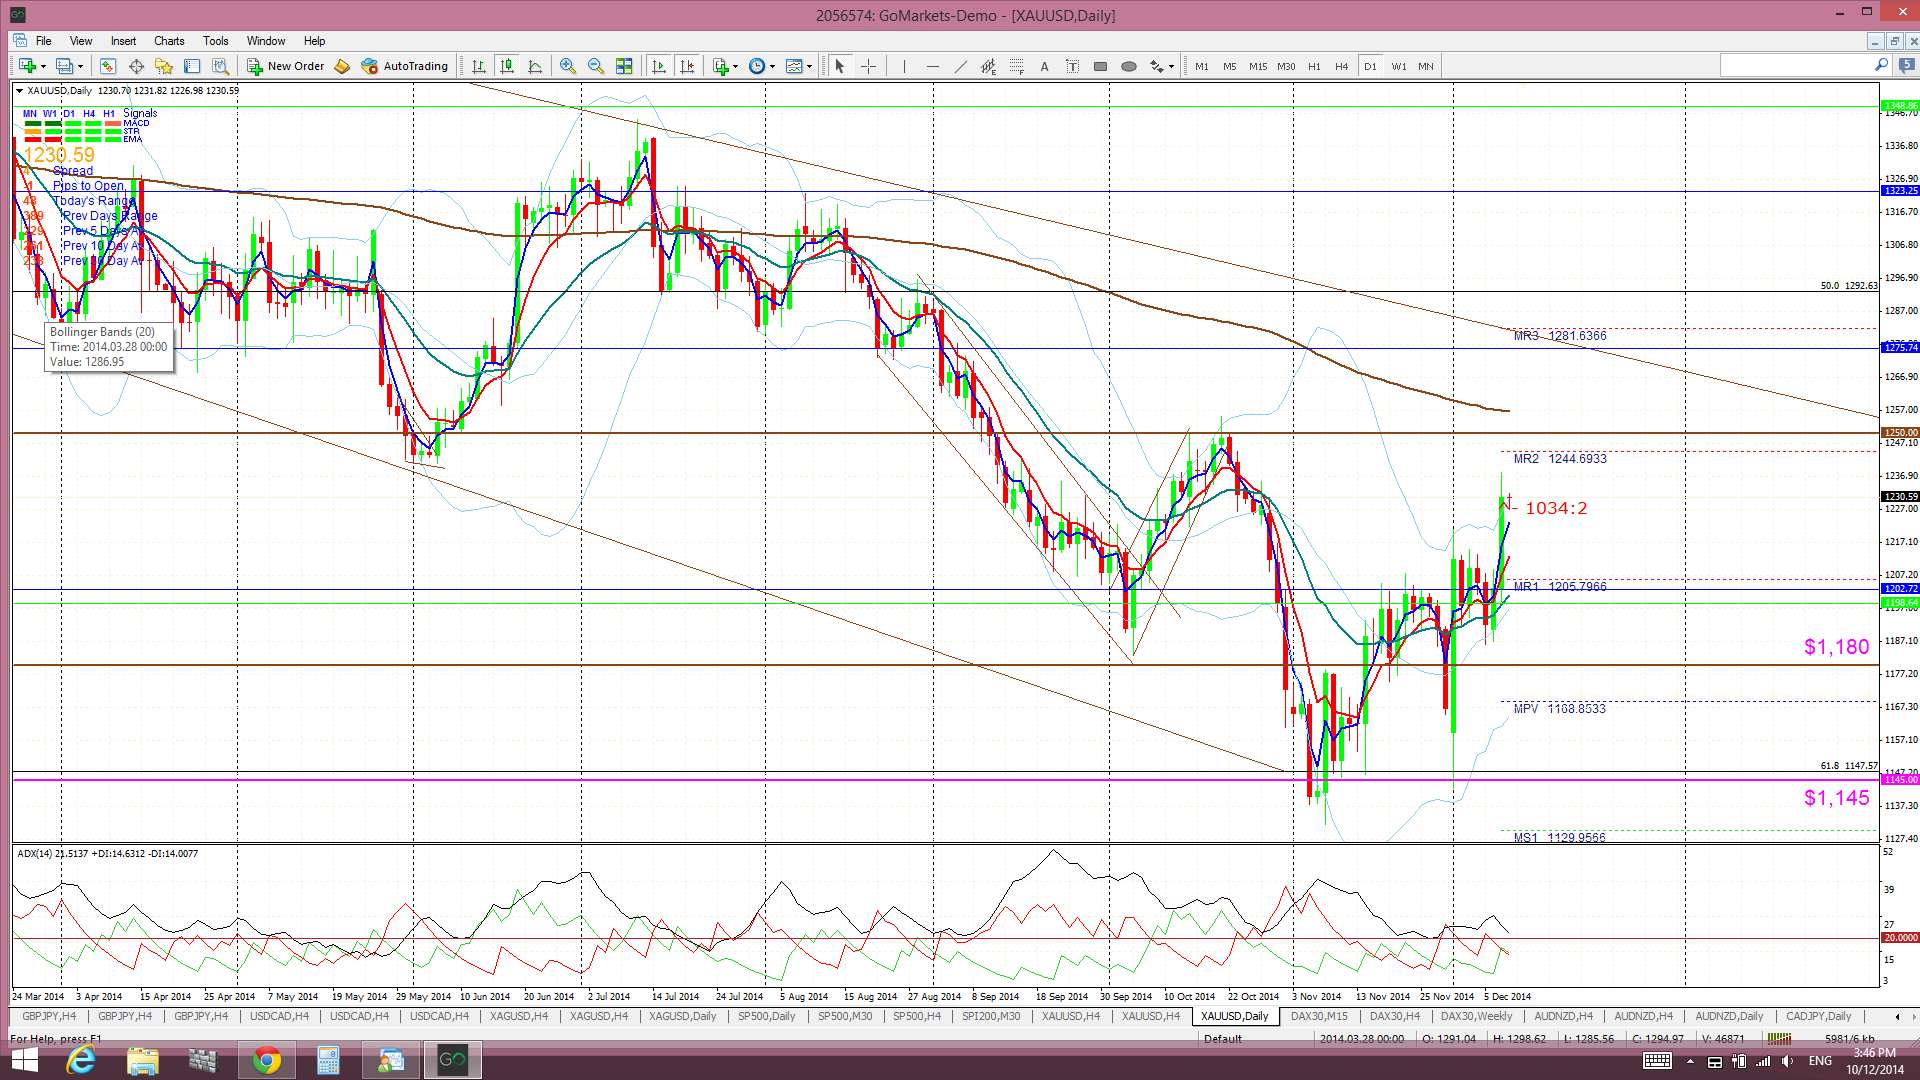
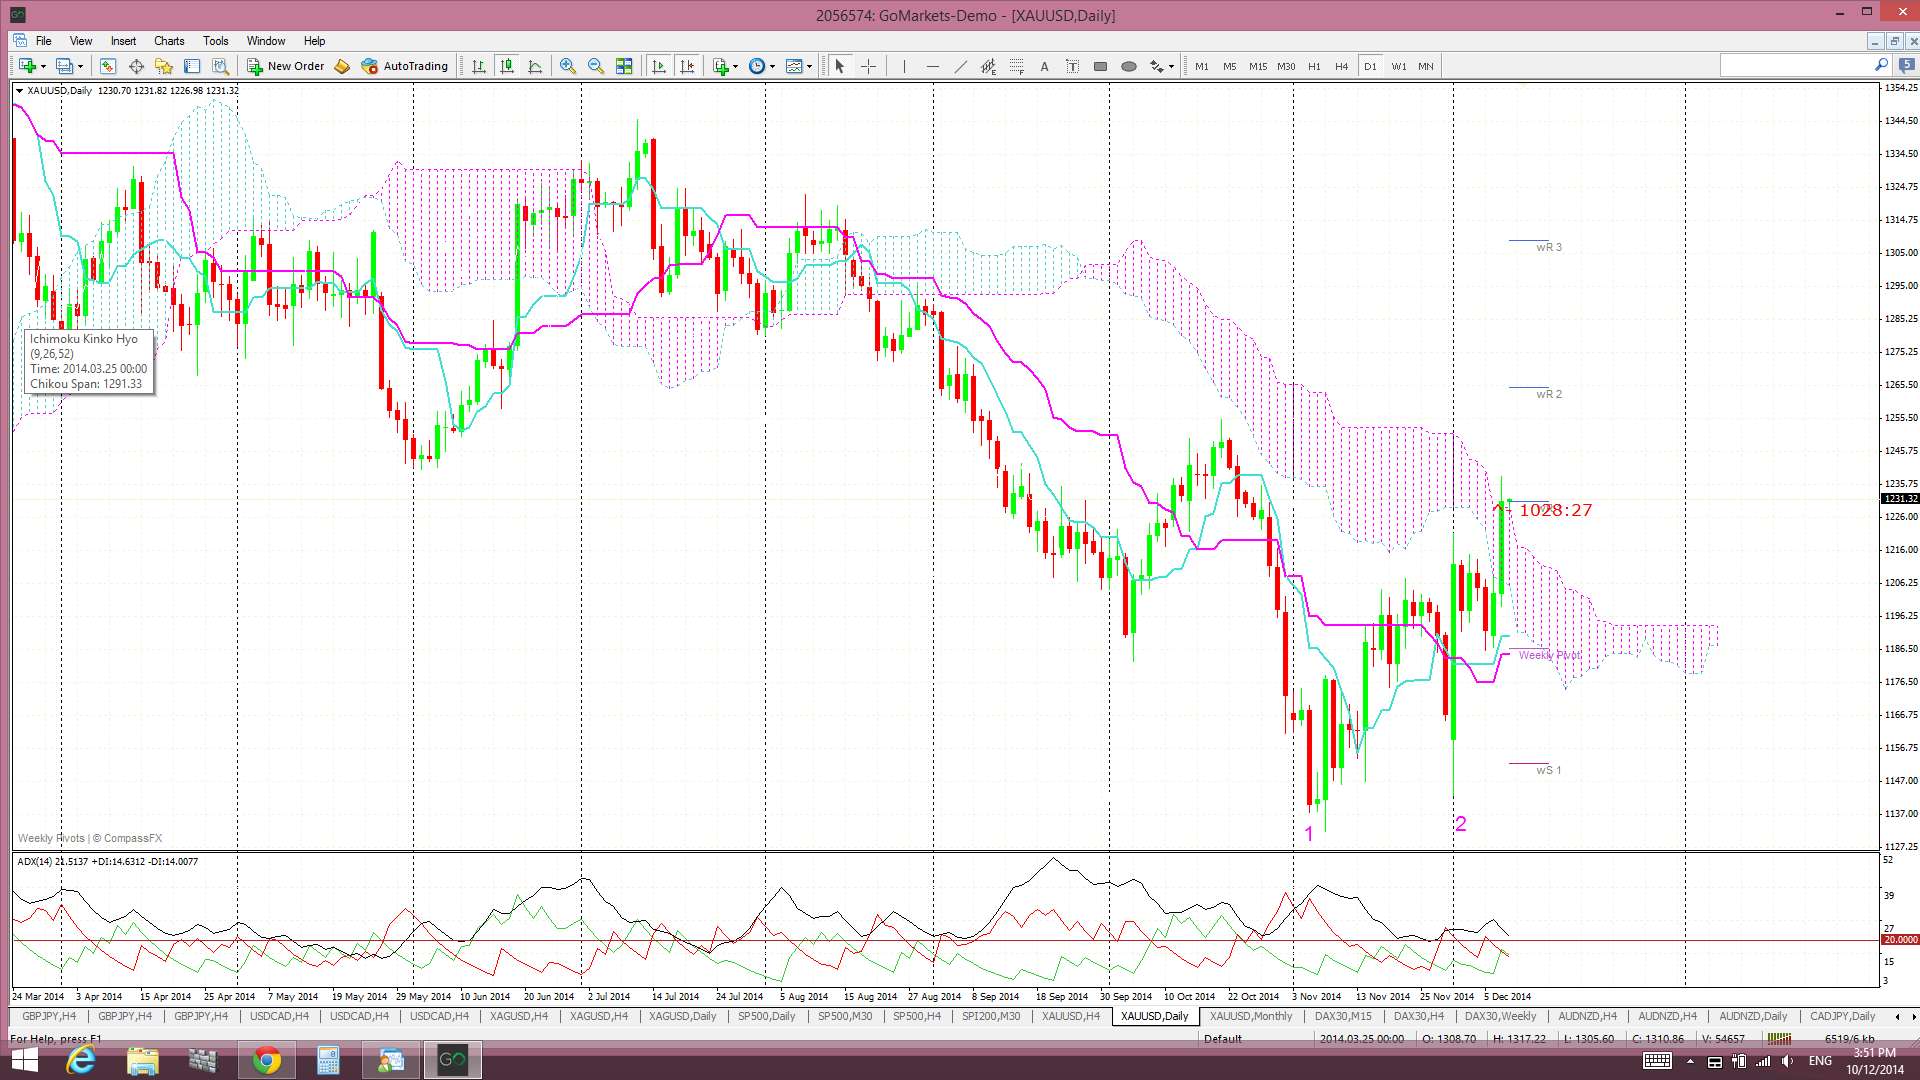
Gold daily: the $1,250 is the next S/R level to navigate here and, after that, there is the trading channel trend line:
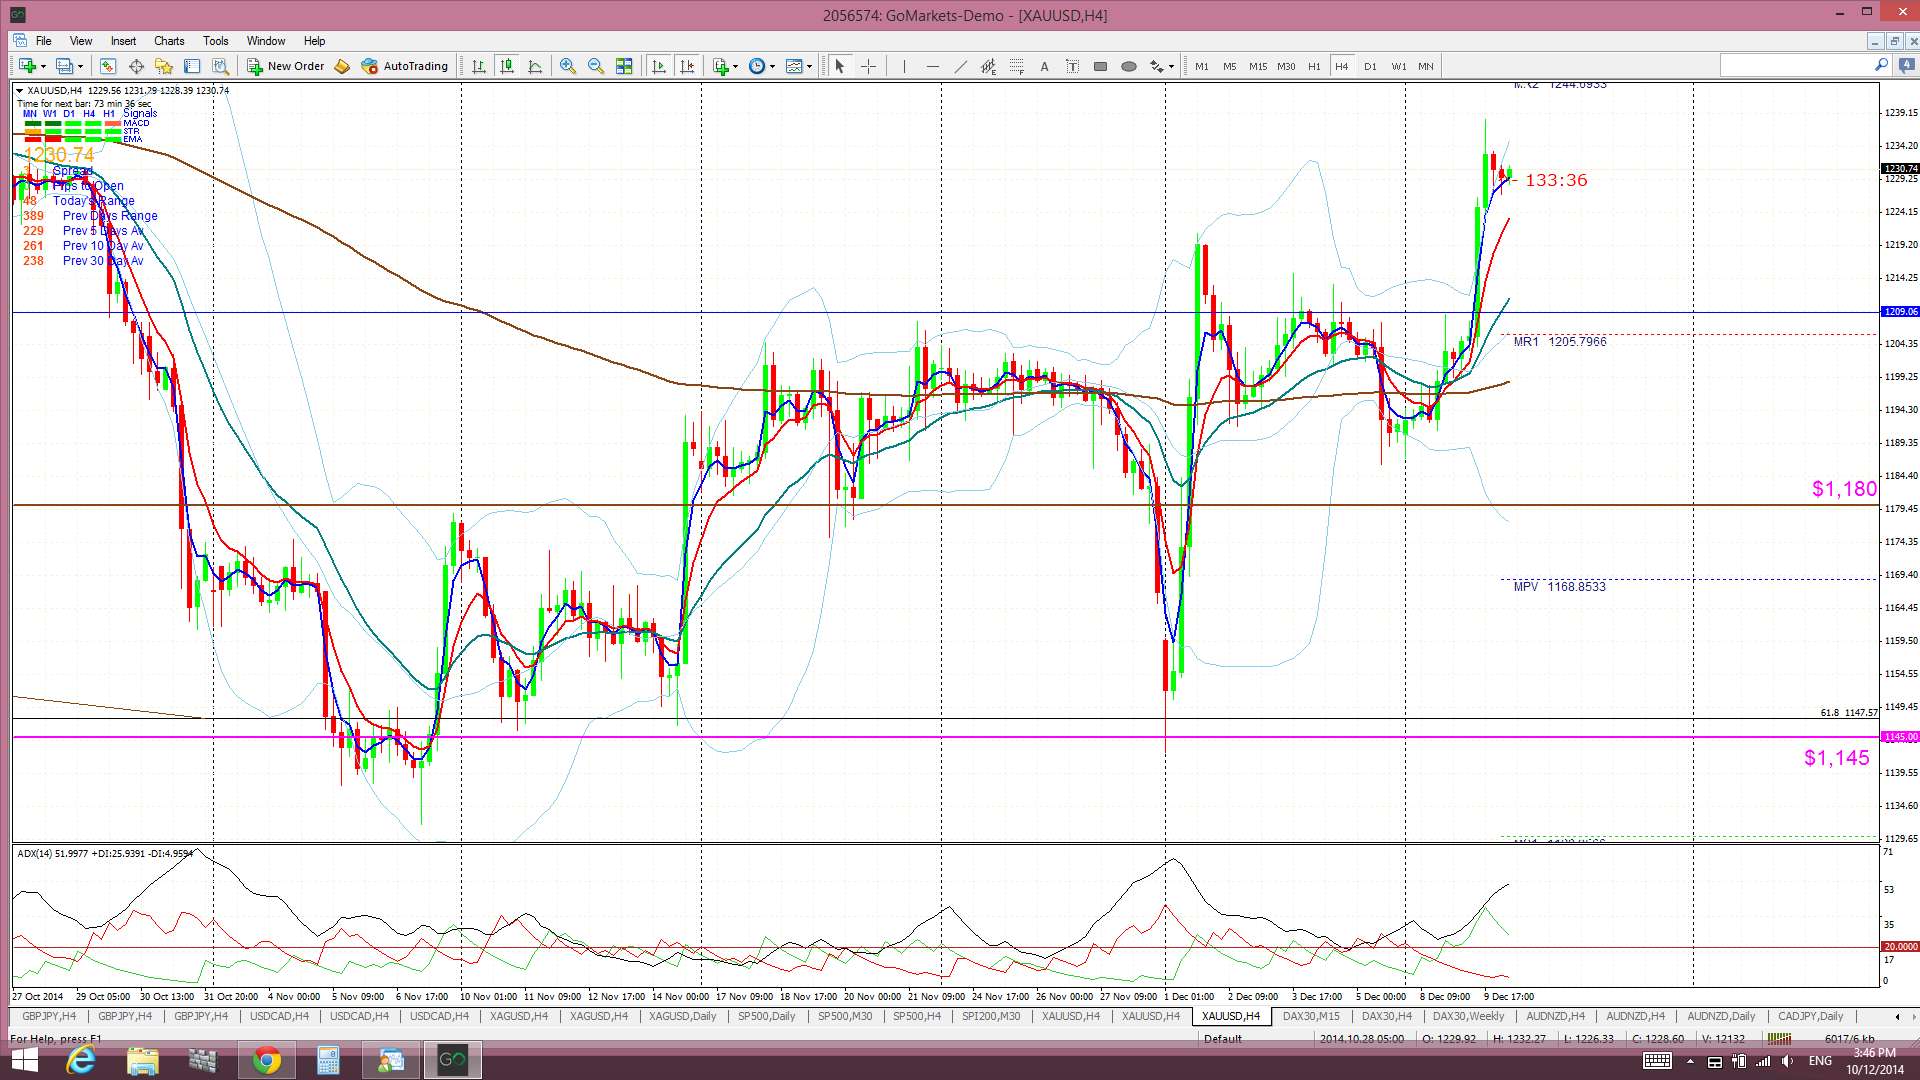
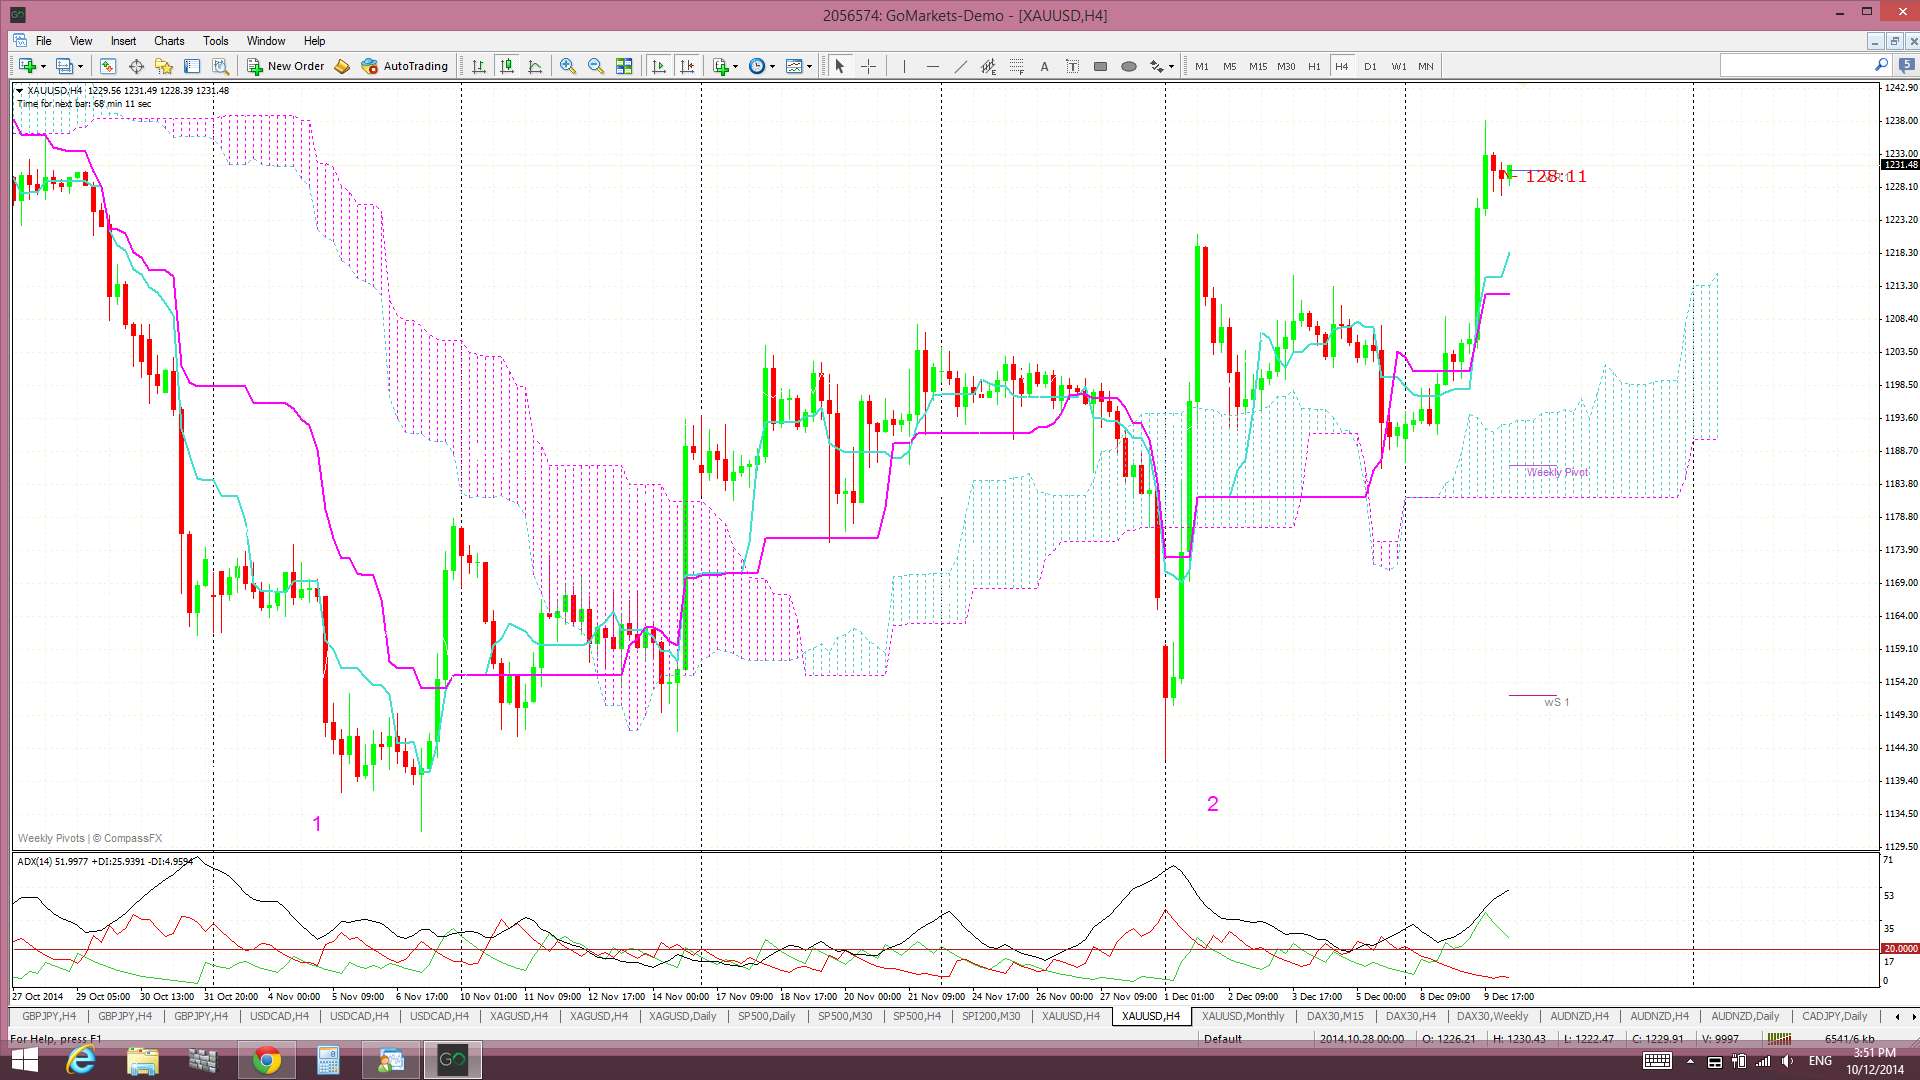
Gold 4 hr: Gold has made a big move this week:
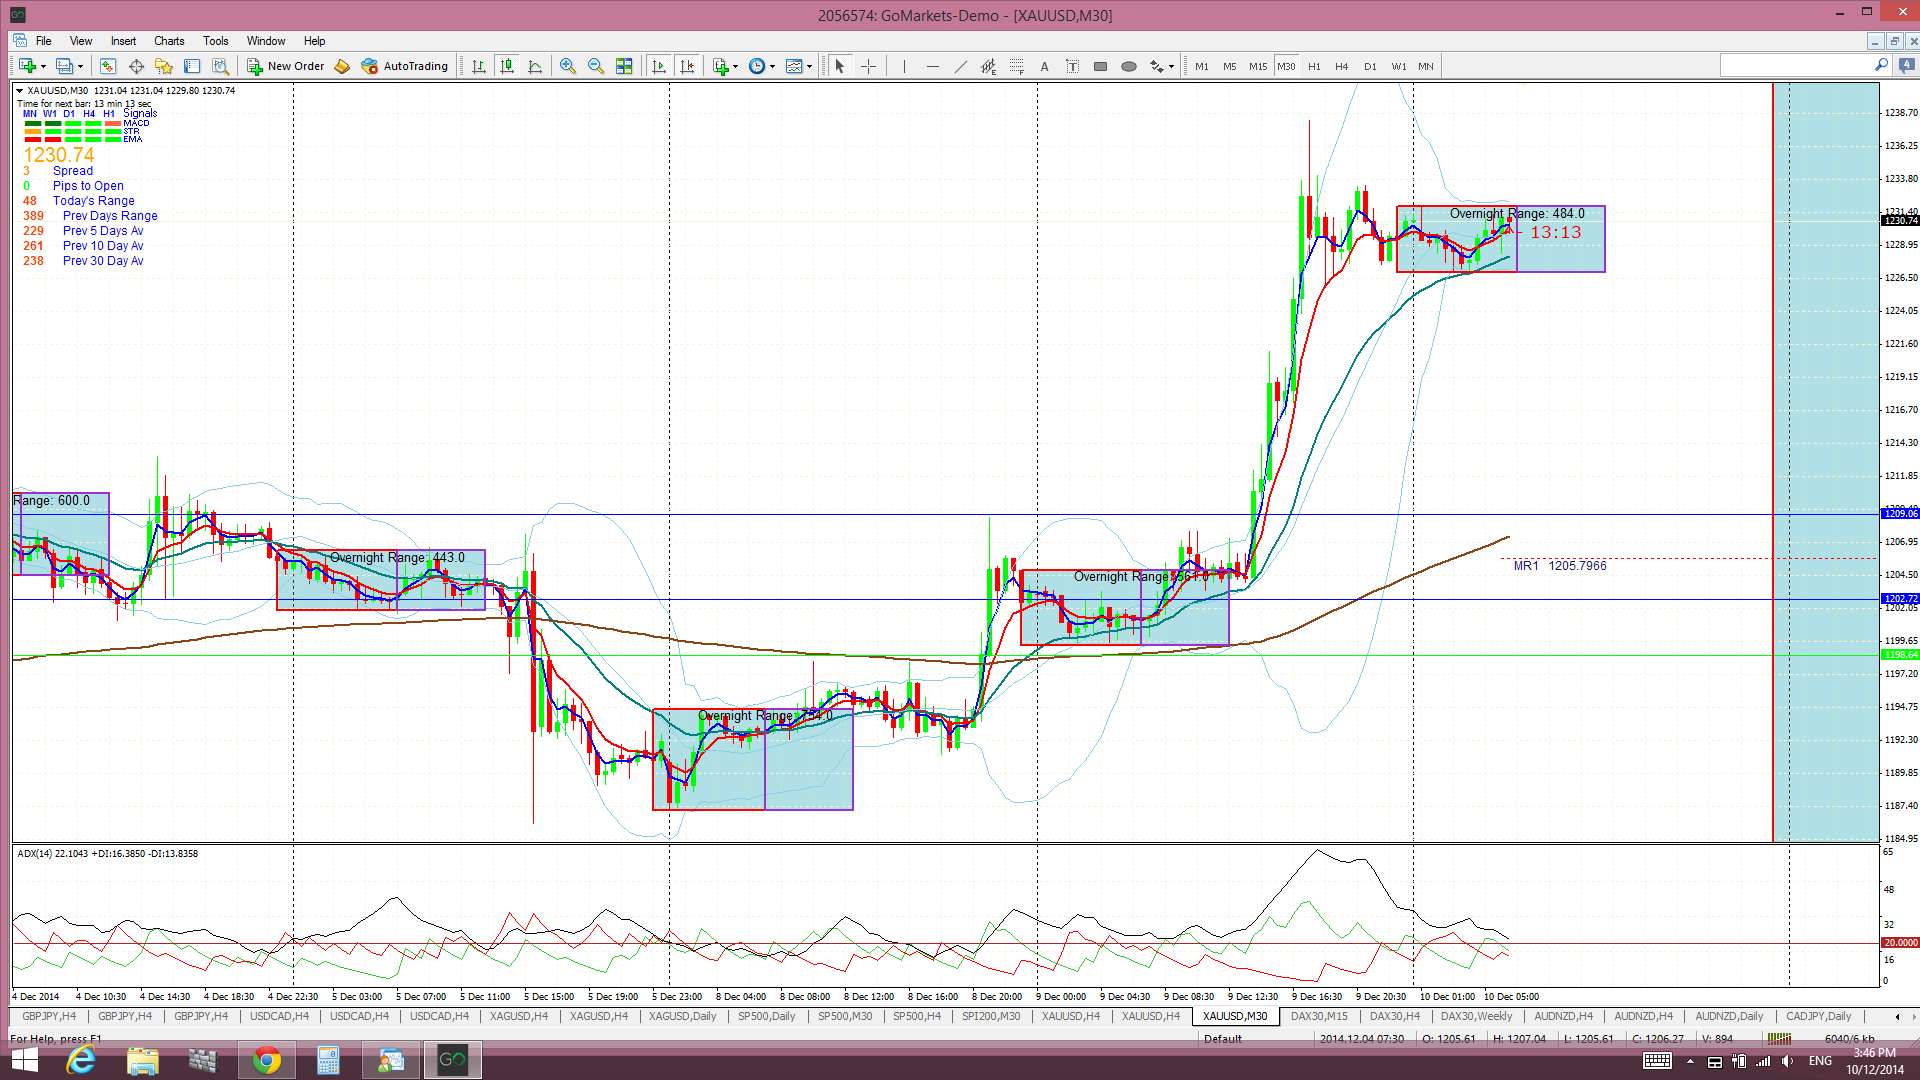
Gold 30 min: the 30 min chart continues to show how trading this metal is safest off shorter time frame charts during the US session:
The Ichimoku charts are worth considering as well.
Gold Monthly Cloud: this chart shows the bullish print of the December candle…. as it sits currently:
Gold weekly Cloud: this chart shows the possible bullish ‘Double Bottom’ view more clearly:
Gold daily Cloud: Gold has moved back above the daily Cloud which would be bullish. Note, also, how the daily Cloud is starting to flatten out:
Gold 4hr Cloud: Gold is above the 4hr Cloud and the 4hr Cloud is now bullish:
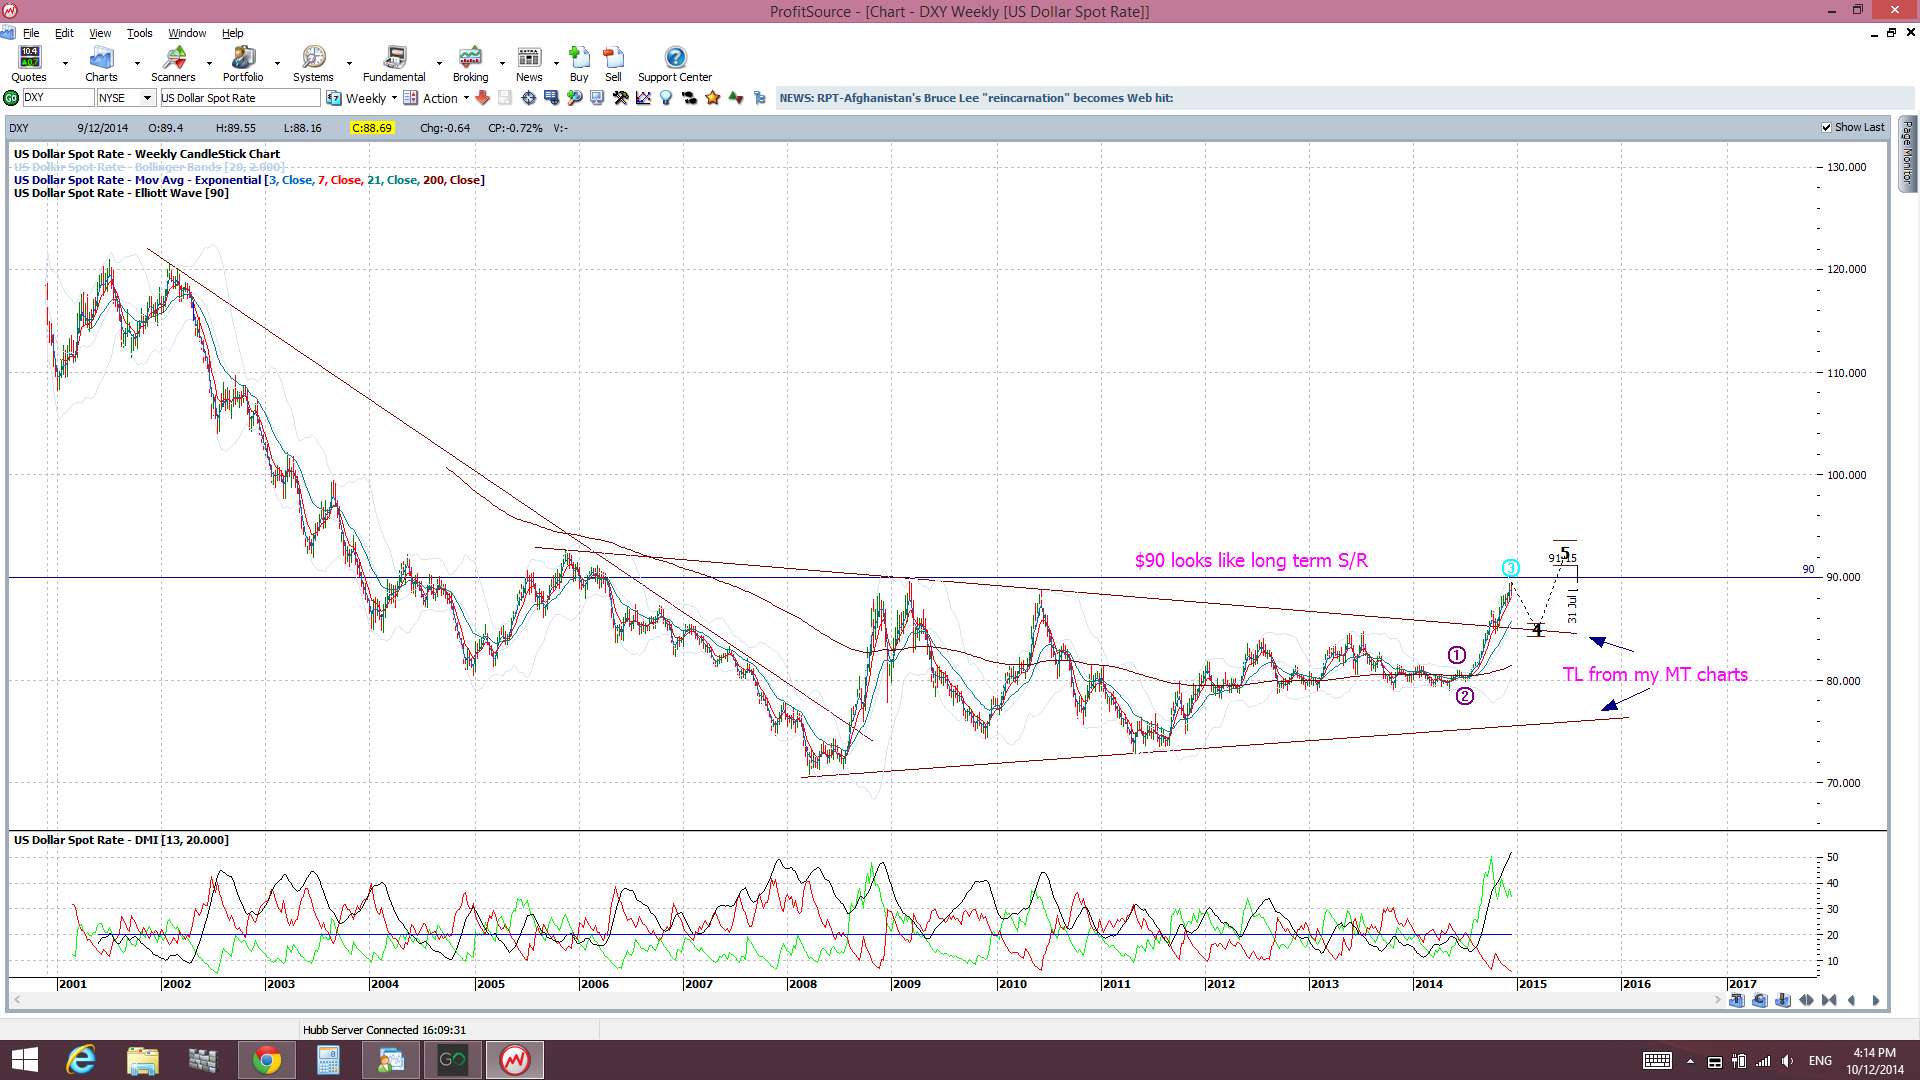
USD Index: The USD index plays a key role in determining the moves with Gold. The USD has been bullish for many weeks and this has put pressure on Gold and other commodities. The USD index is currently struggling under the weight of resistance from the key 90 level. A failure to move above that would help Gold and commodites. Any breakout move above the 90 level, though, would be bearish for Gold and may see the 61.8% fib, near $1,145, come under pressure and possibly give way:
Summary: Gold has managed to hold above the support offered by the 61.8% fib of the last major swing high move. There are other bullish signals starting to filter through though as well and these include:
- a bullish December candle (although this has yet to close).
- a bullish ‘Double Bottom’ view on the weekly chart.
- Gold has closed back above the daily Ichimoku Cloud.
- Gold is above the 4hr Cloud and the 4hr Cloud has turned bullish.
Watch Gold for any new close and hold above the $1,250 level and, after that, the descending trading channel trend line. The USD index will play a key role here too so watch the 90 level.
The post Gold: starting to glitter again? appeared first on www.forextell.com.