Monday September 1st was a holiday for the US and thus today marks the first real trading day for the S&P500 for this new month. I’ve noted on numerous other occasions how the first trading day of the month is often bullish for stocks. Often, but not always, yet this is something to be on the lookout for at US market open tonight.
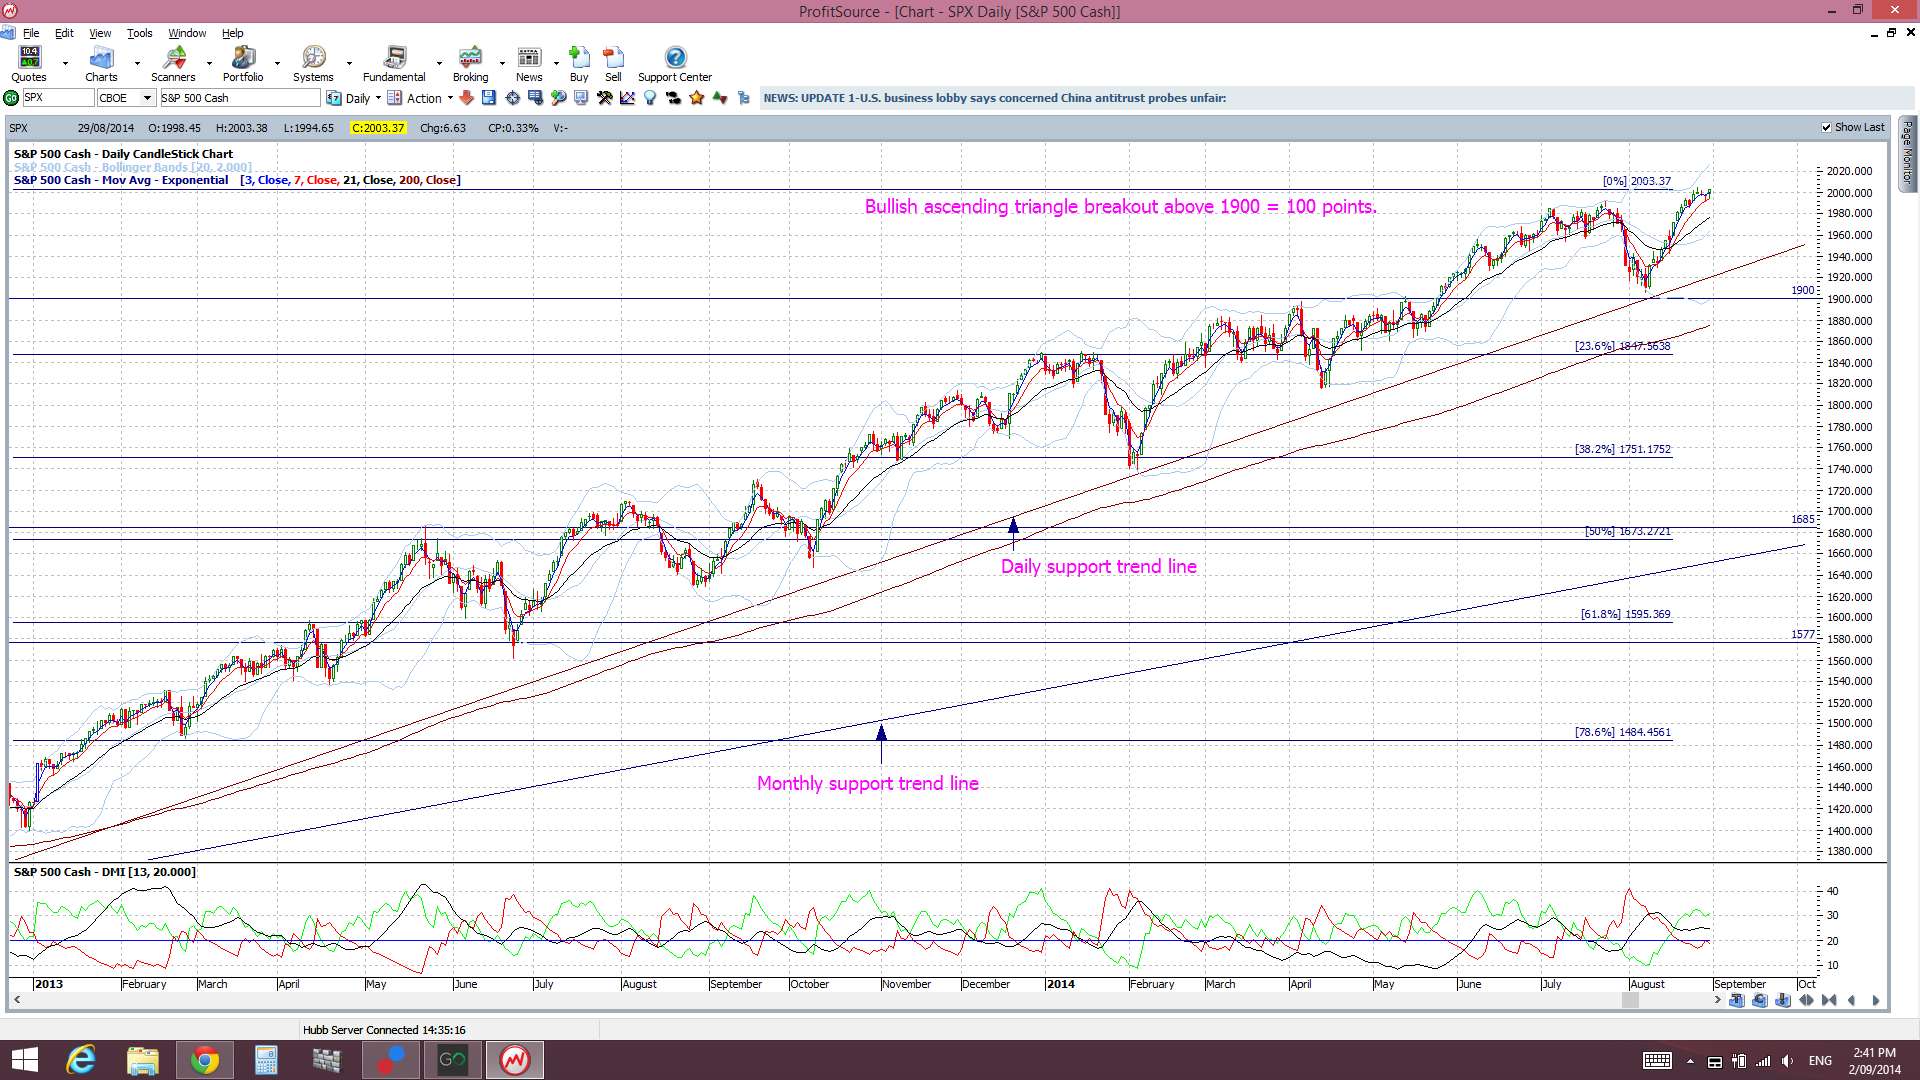
S&P500 daily chart: closed last week and for August above the key 2,000 level:
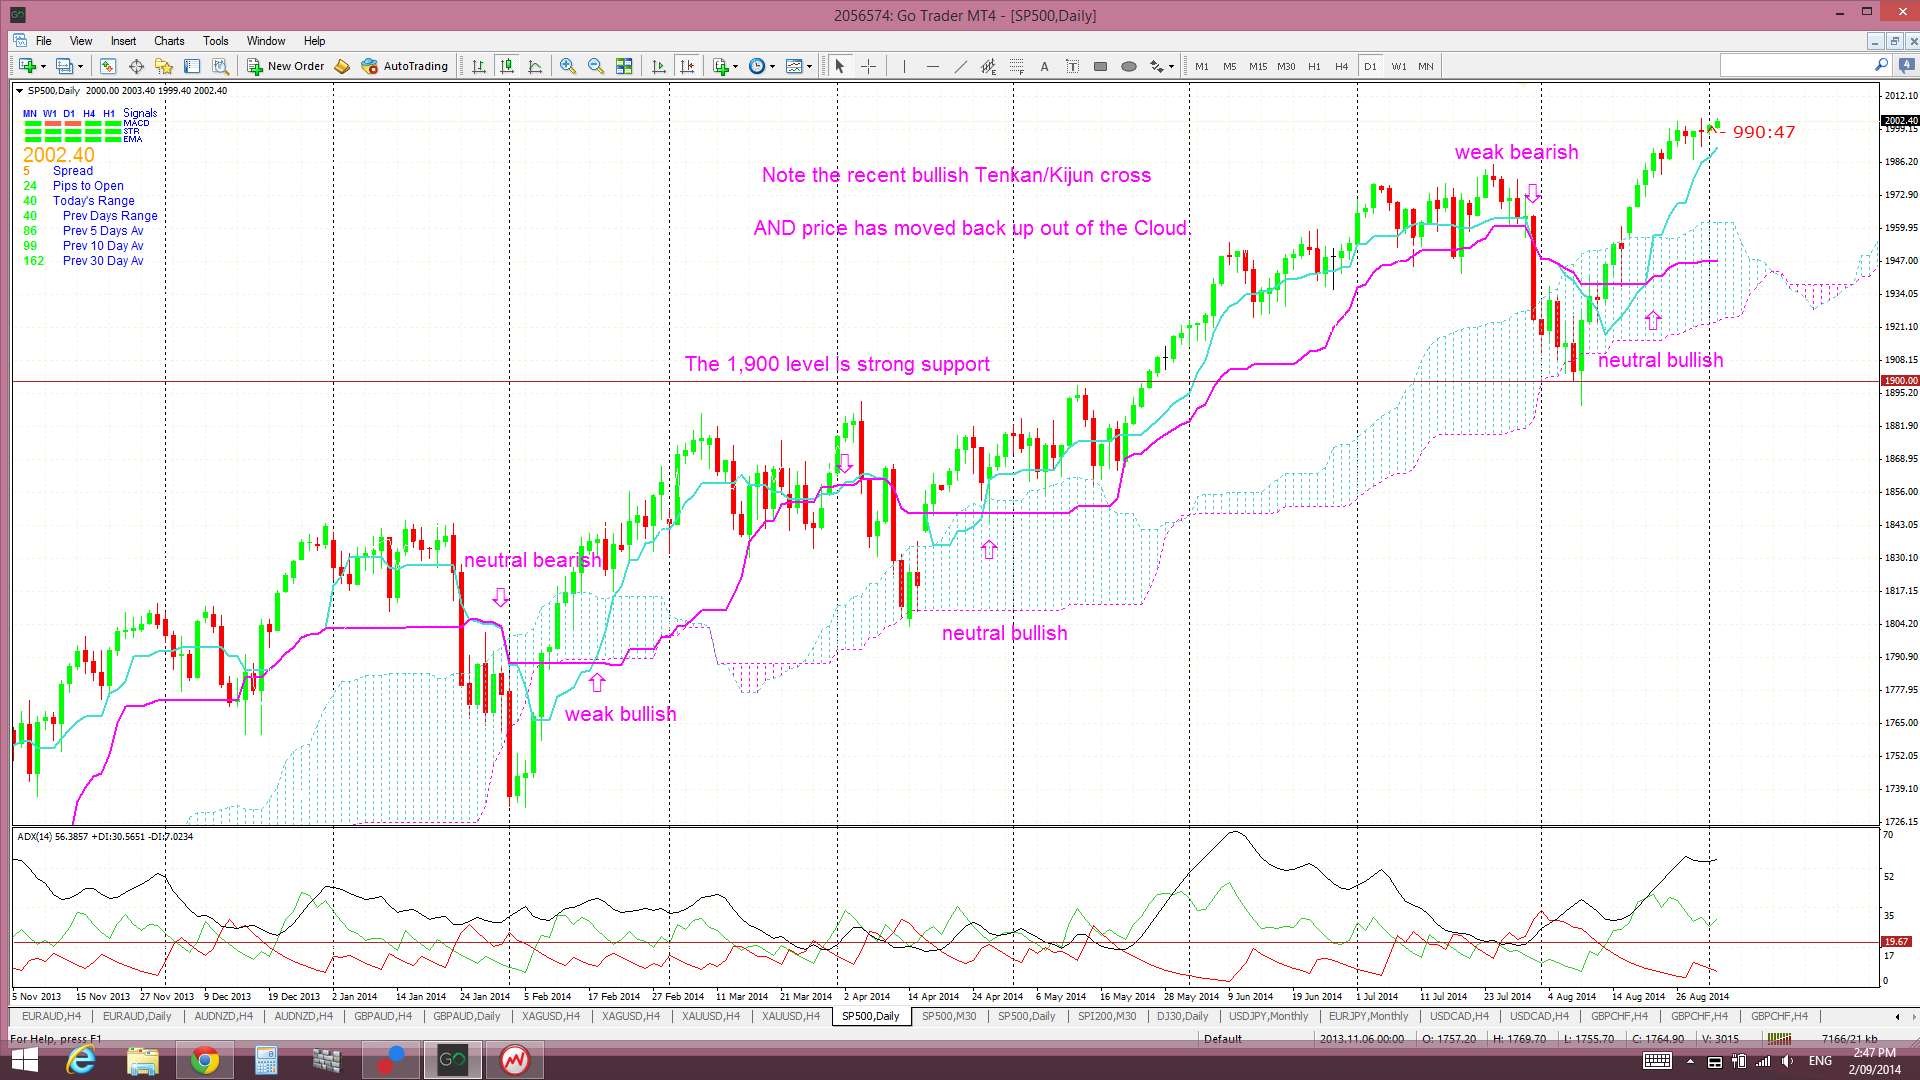
S&P500 daily Cloud: the index is still trading above the daily Ichimoku Cloud after giving a recent bullish Tenkan/Kijun cross:
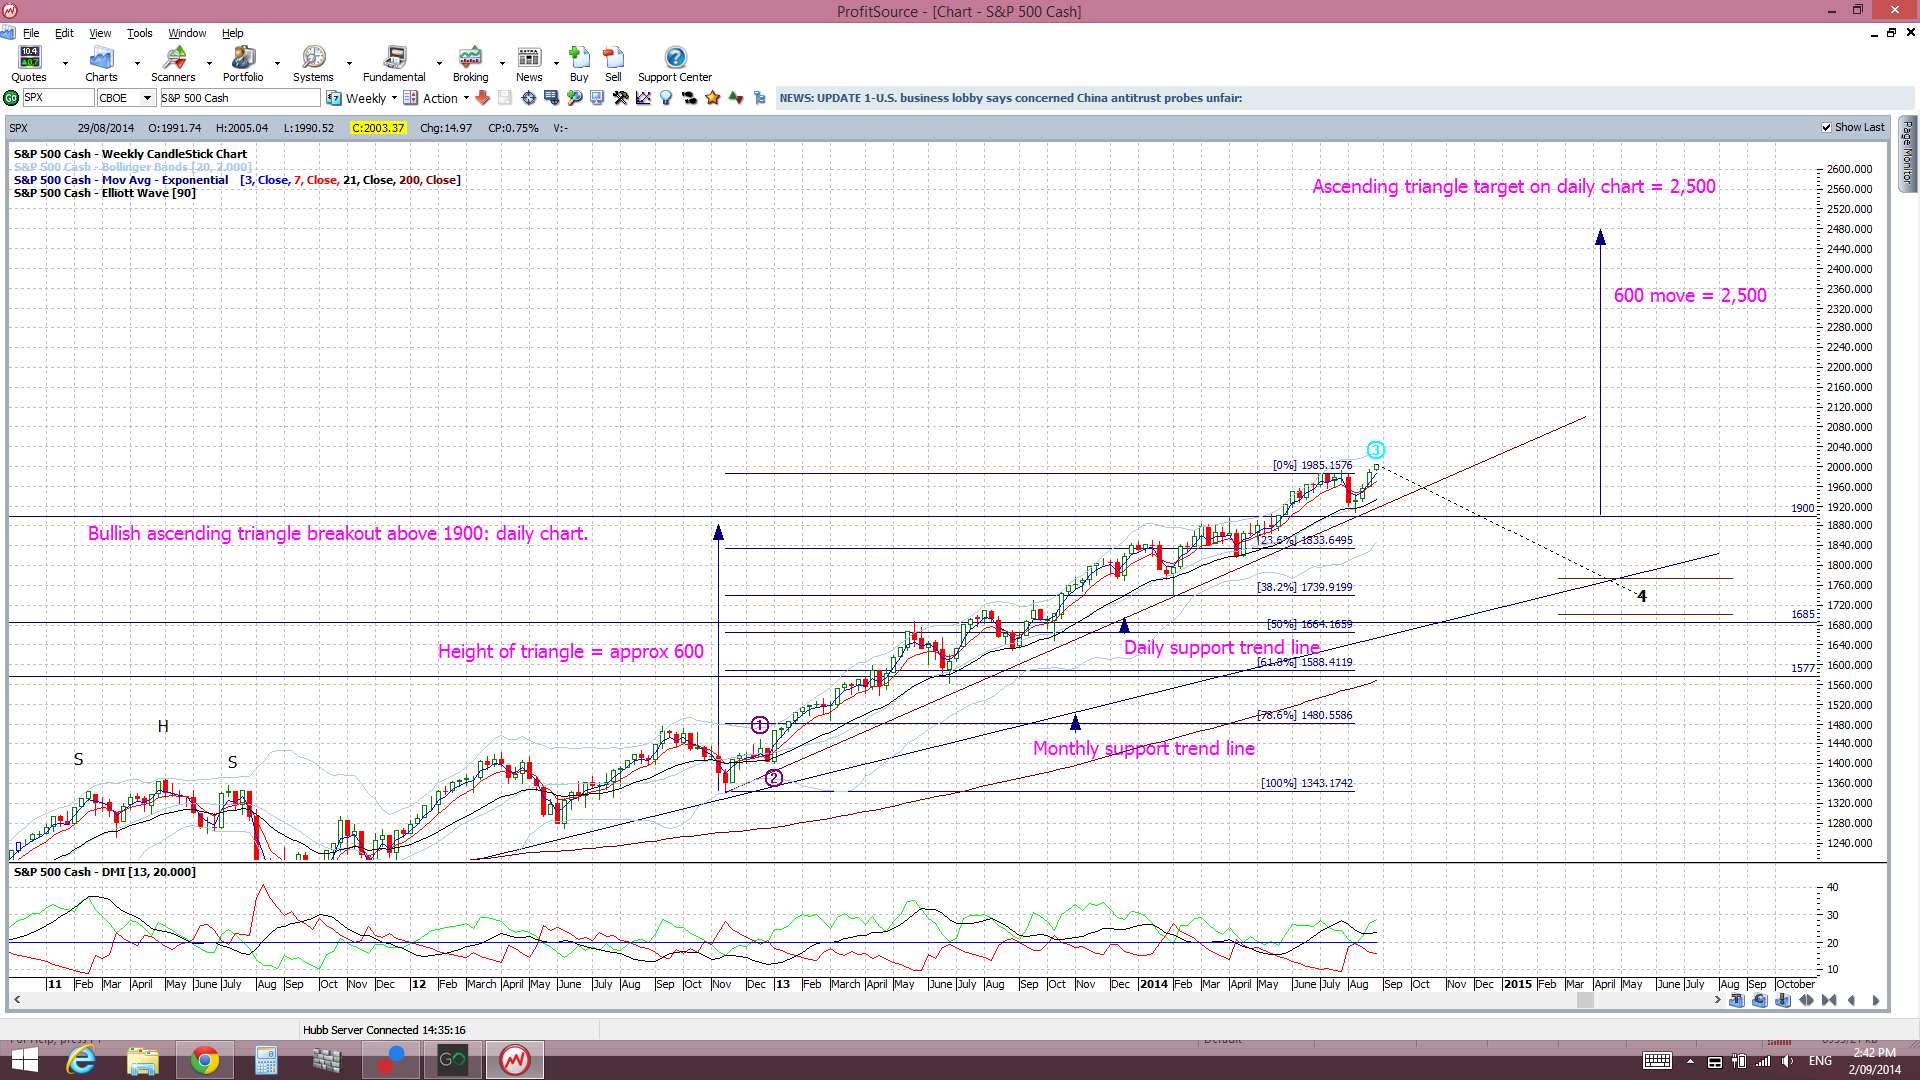
S&P500 weekly: is holding above the 1,900 bullish ‘ascending triangle’ breakout level:
S&P500 monthly chart: August was a ‘bullish engulfing’ candle for the S&P500:

Thus, with this continuing bullish sentiment I am still keen on the following stocks. I have been stalking these for some time now!
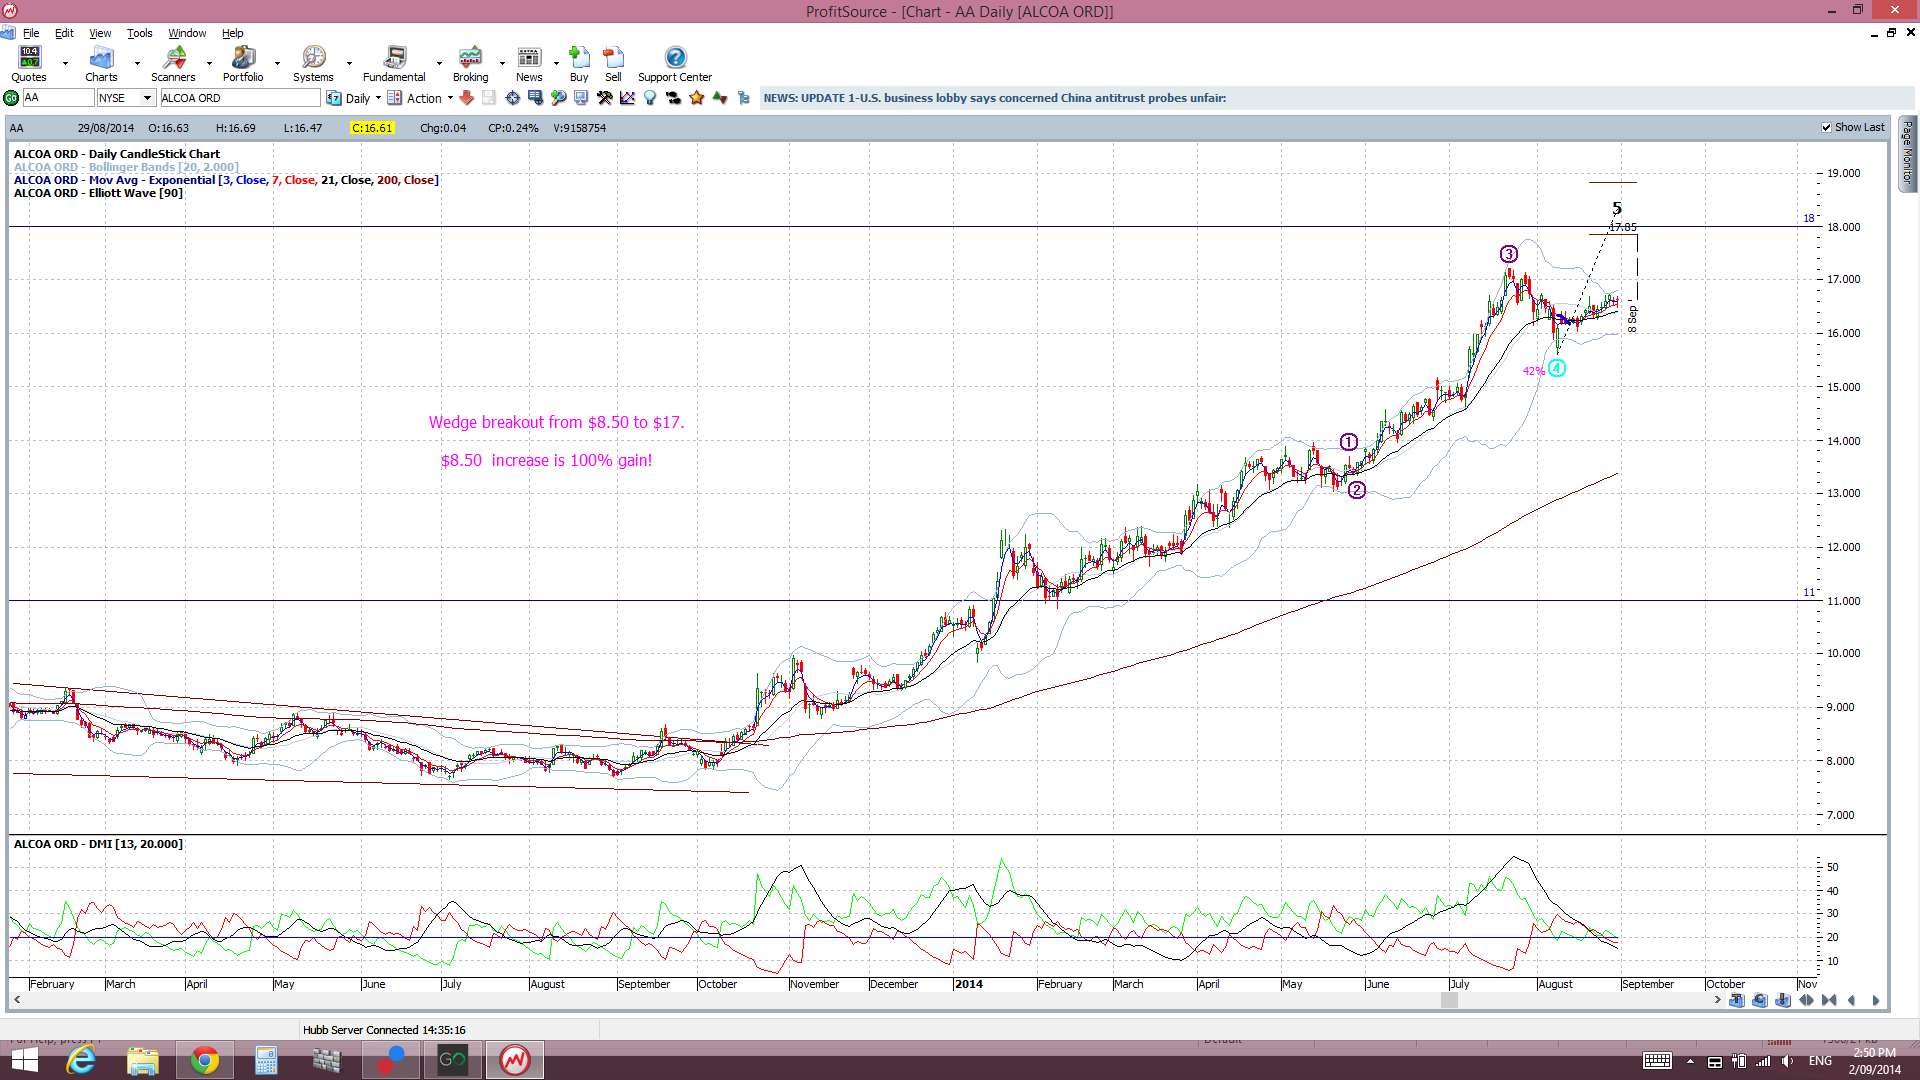
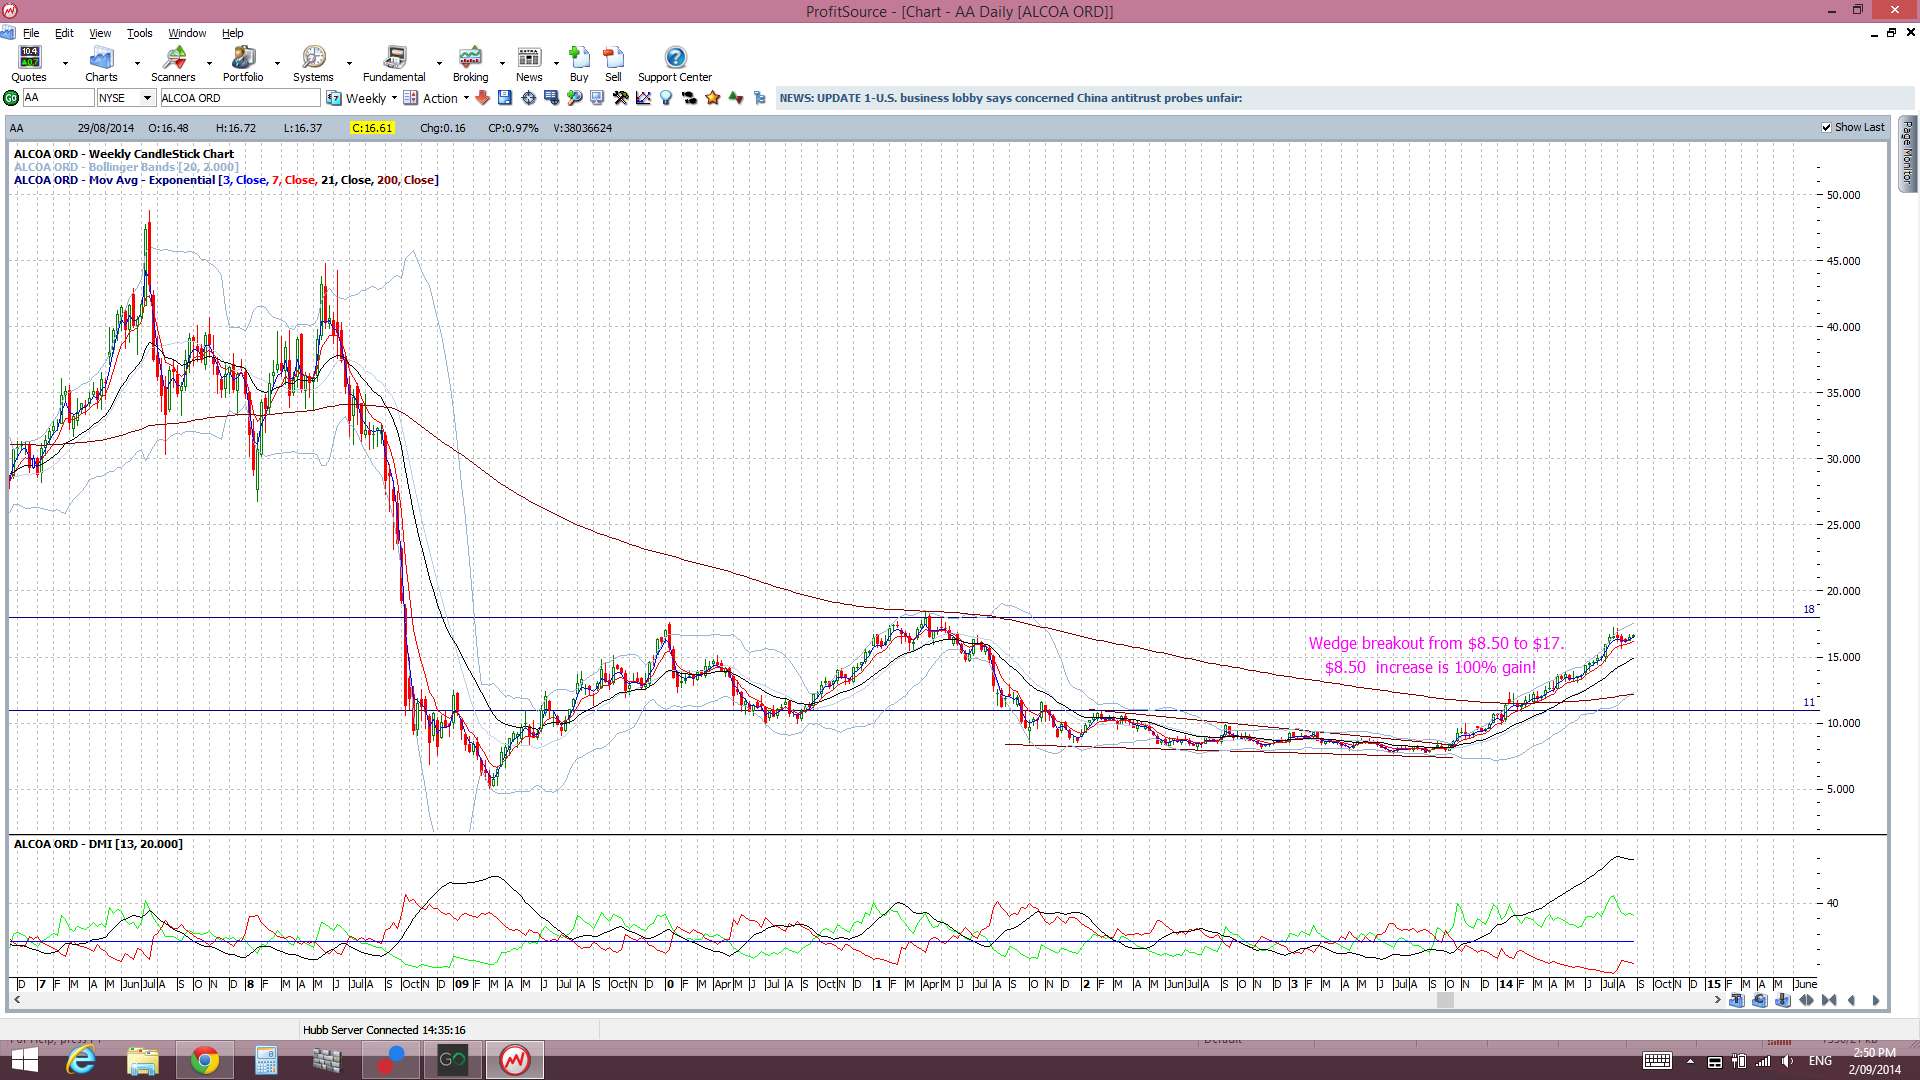
AA: Alcoa has already returned 100% since the bullish descending wedge breakout. I see this at least testing $18 still though:
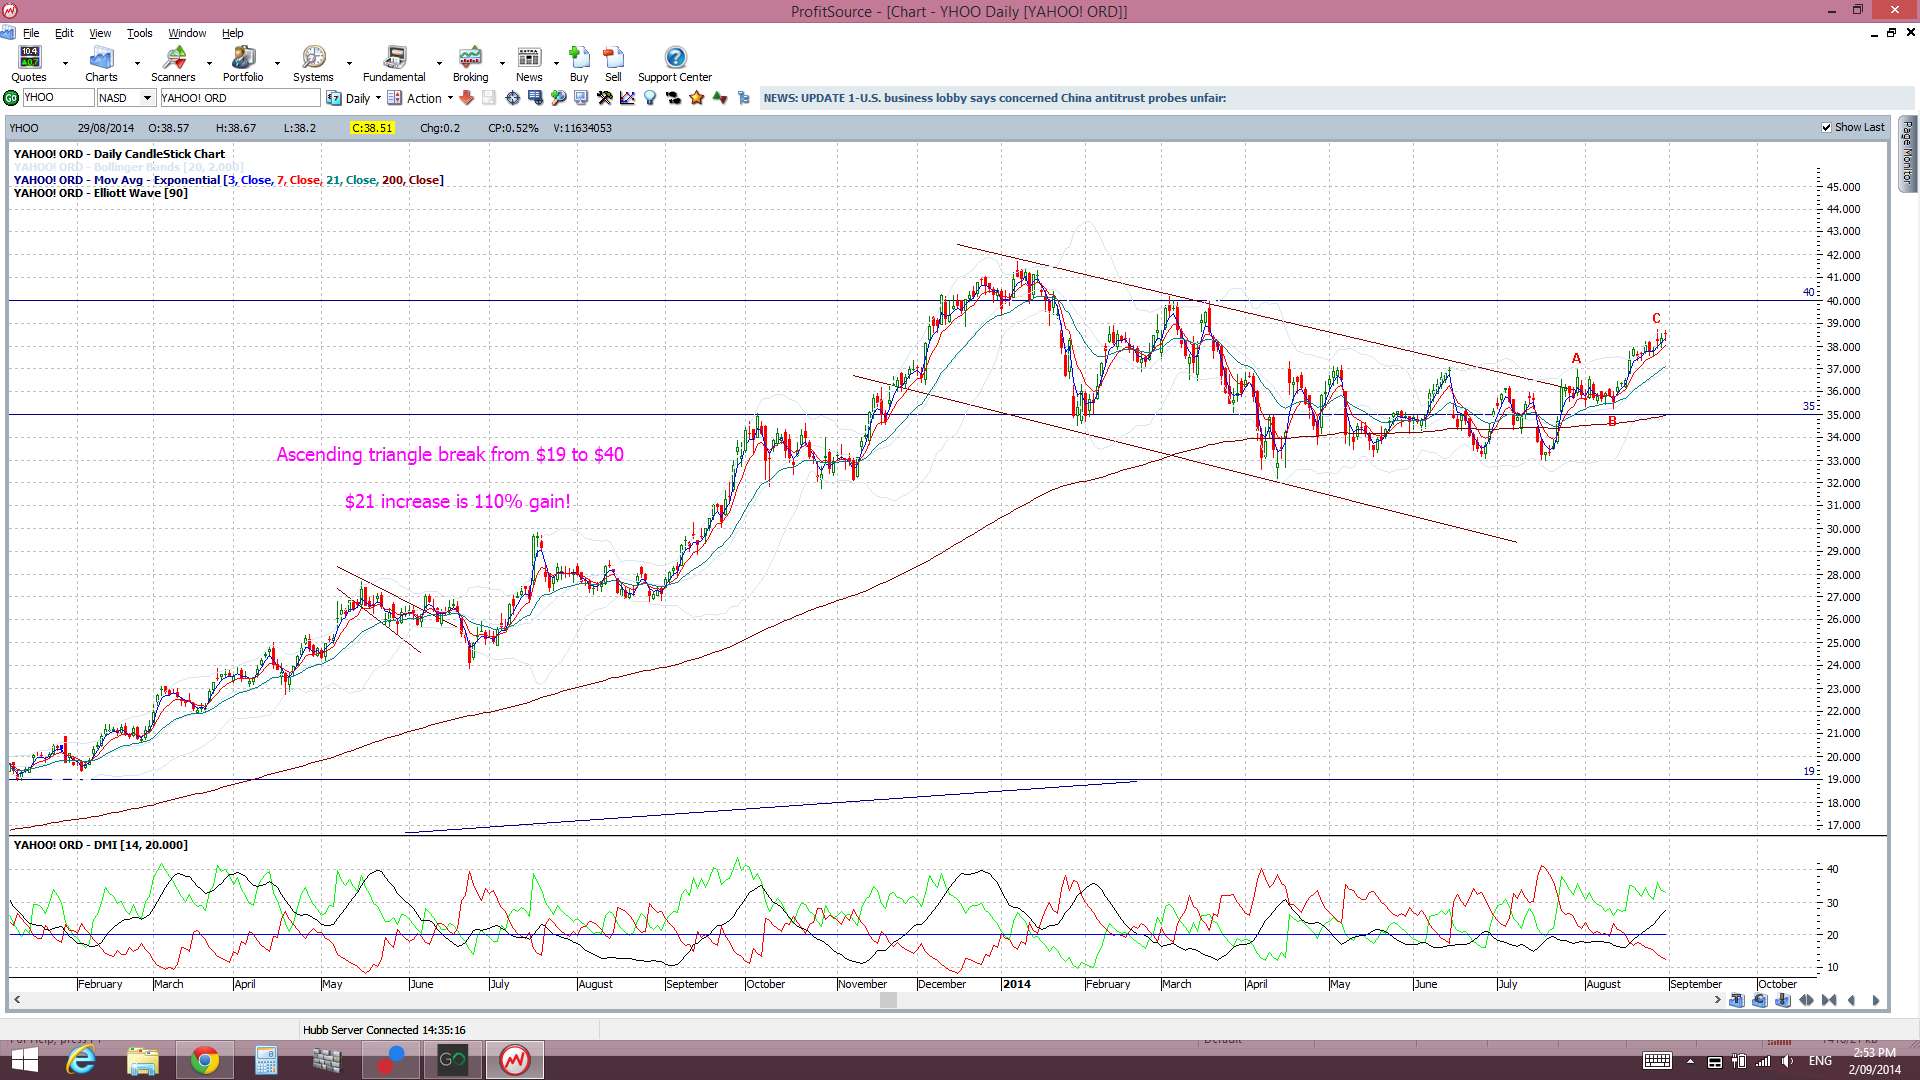
YHOO: this too has already given 100%, and then some, but keep an eye on the $40 level. I think this will be at least tested AND any close and hold above the $40 would be very bullish:

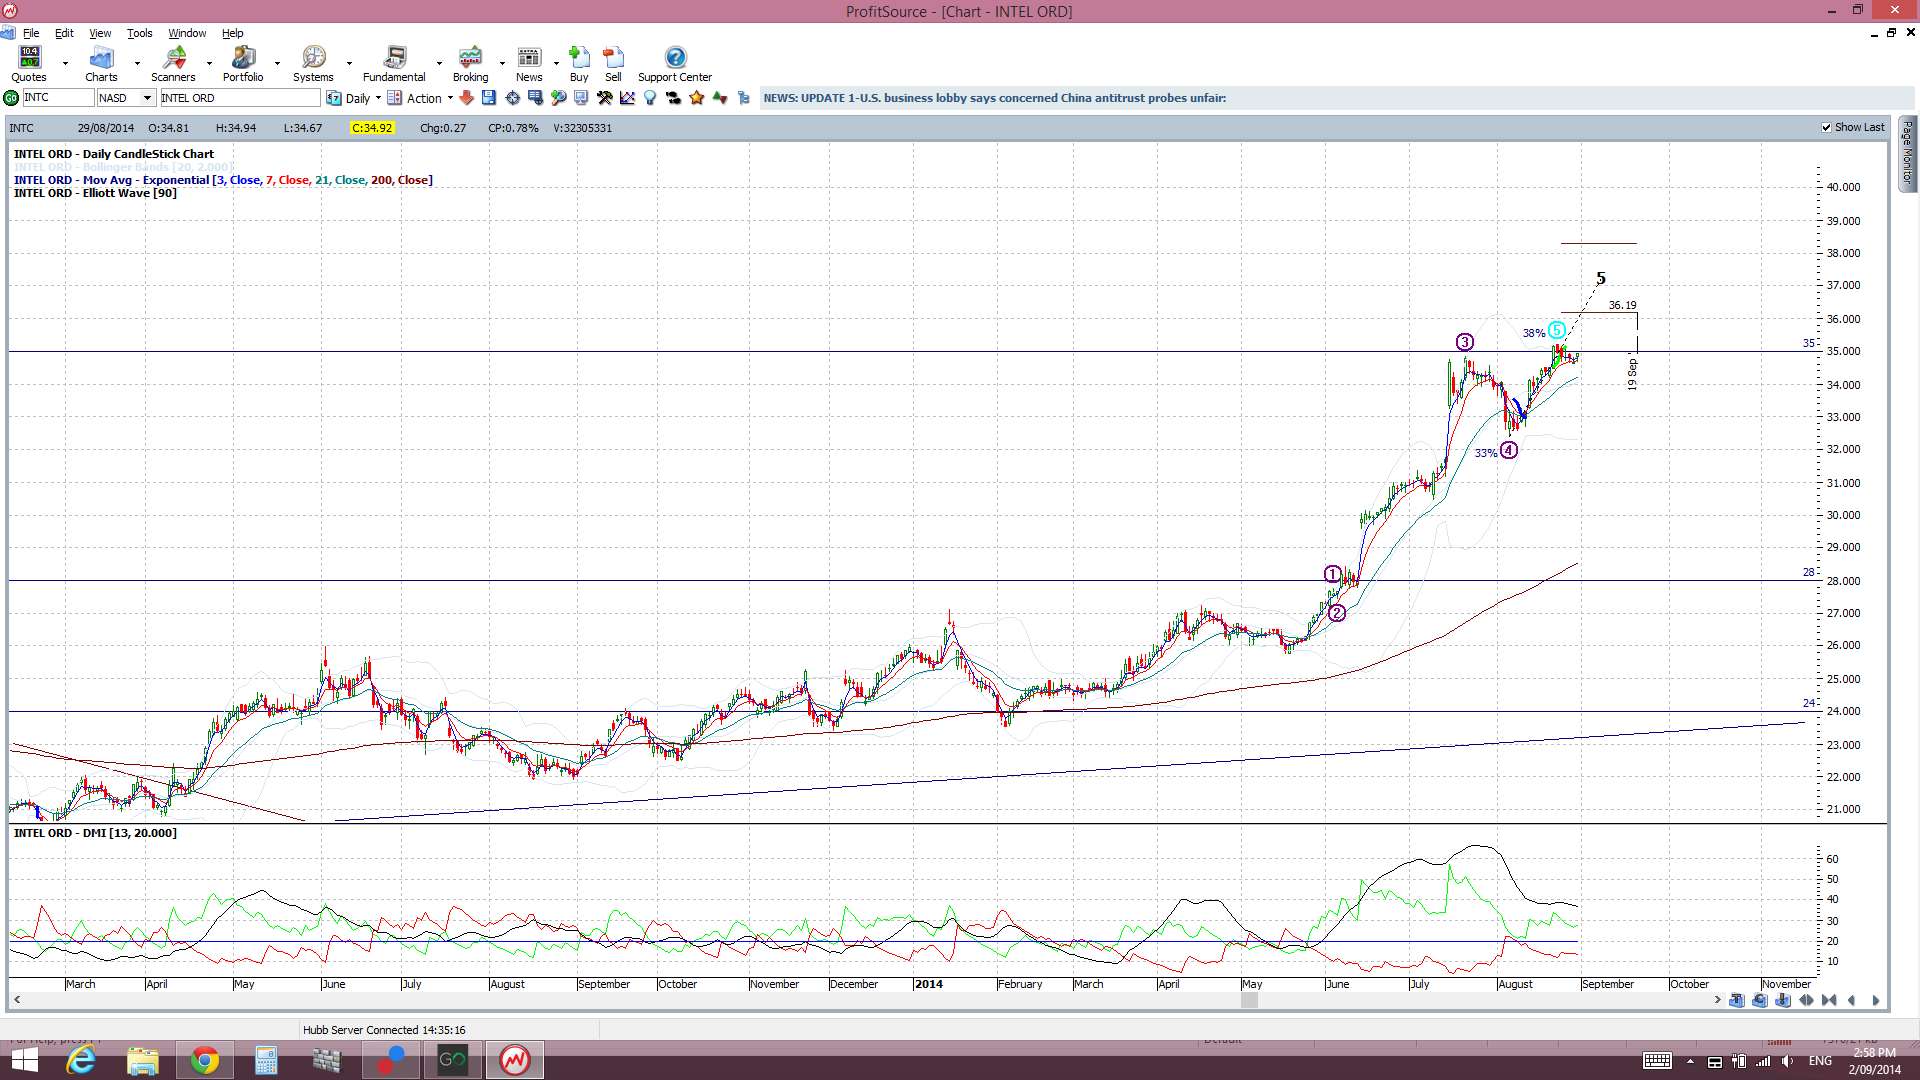
INTC: Intel is currently negotiating its next major resistance level at $35. Any close and hold above this would be very bullish. Declaration: I am long here from $26.

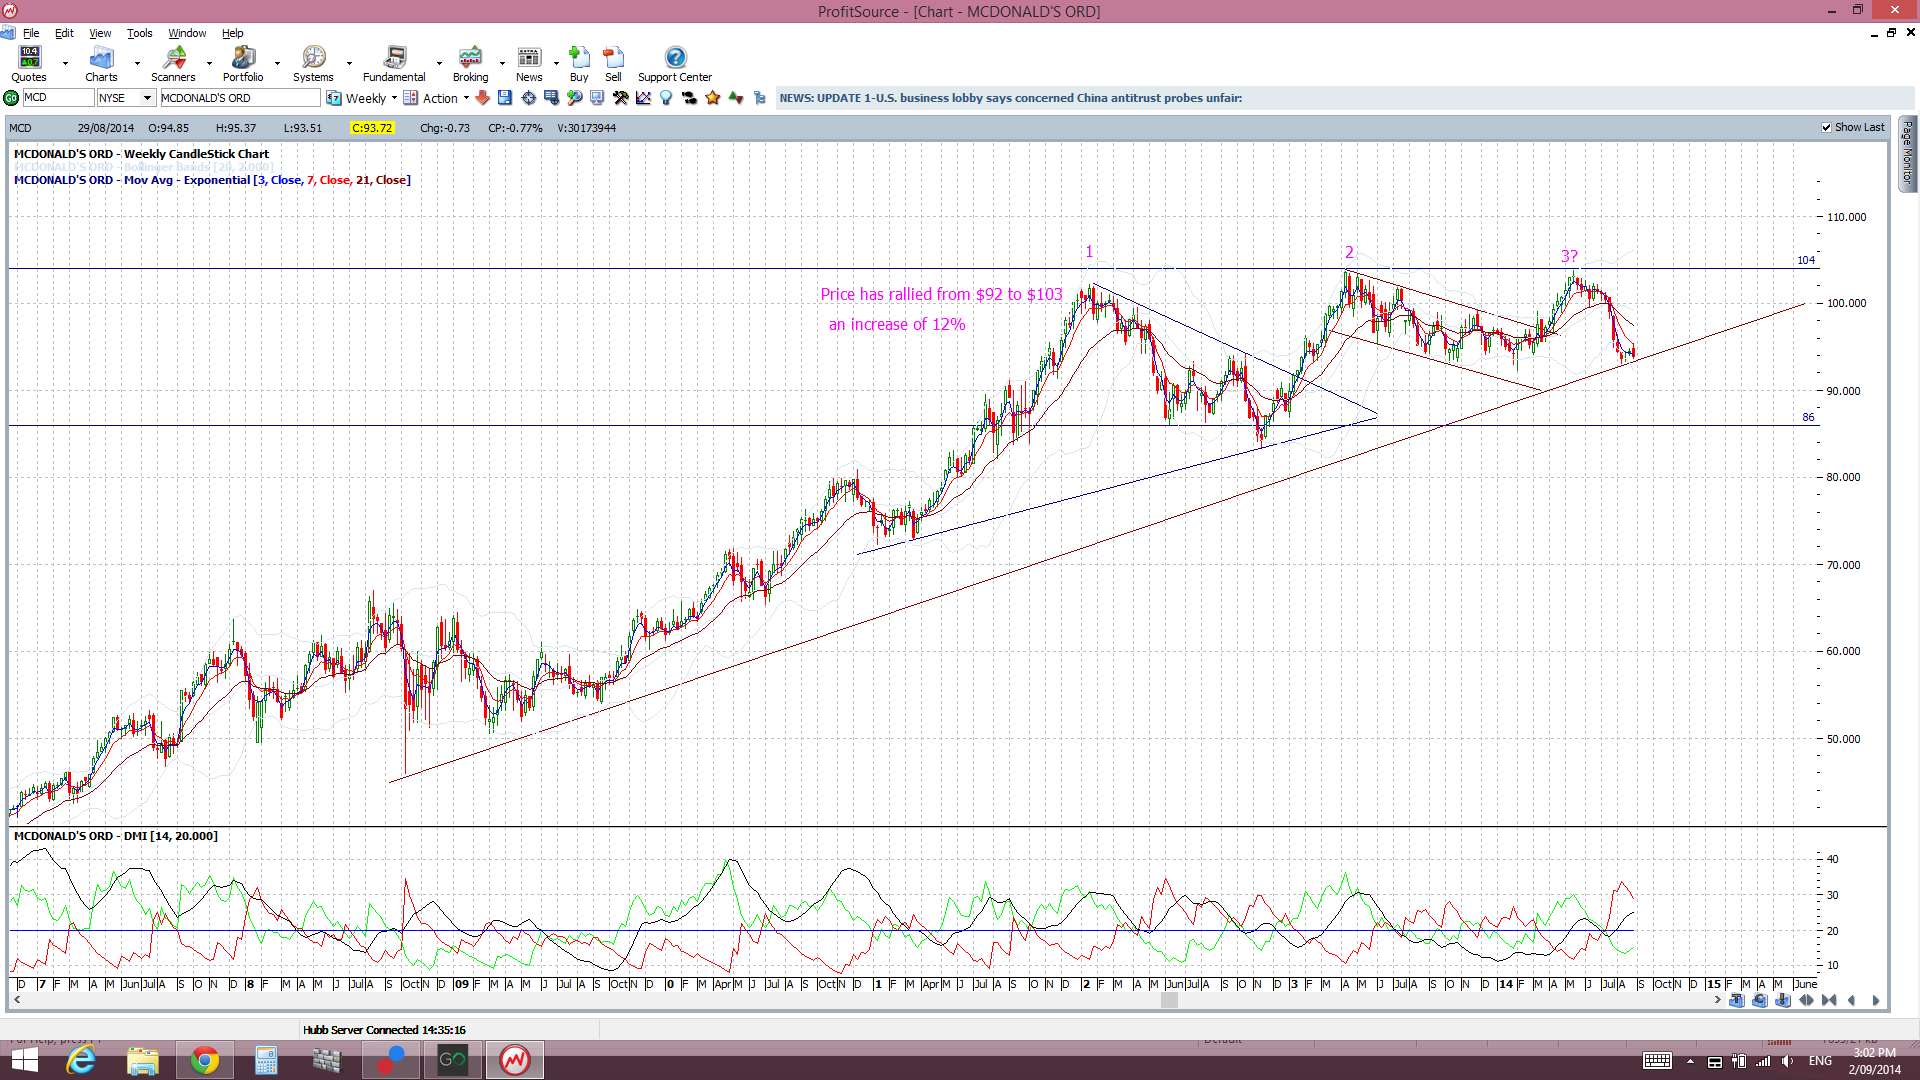
MCD: McDonald’s looks quite bullish despite the recent pull back and ‘Triple Top’ appearance. It is holding above a weekly support trend line and trading in a bullish ascending triangle.
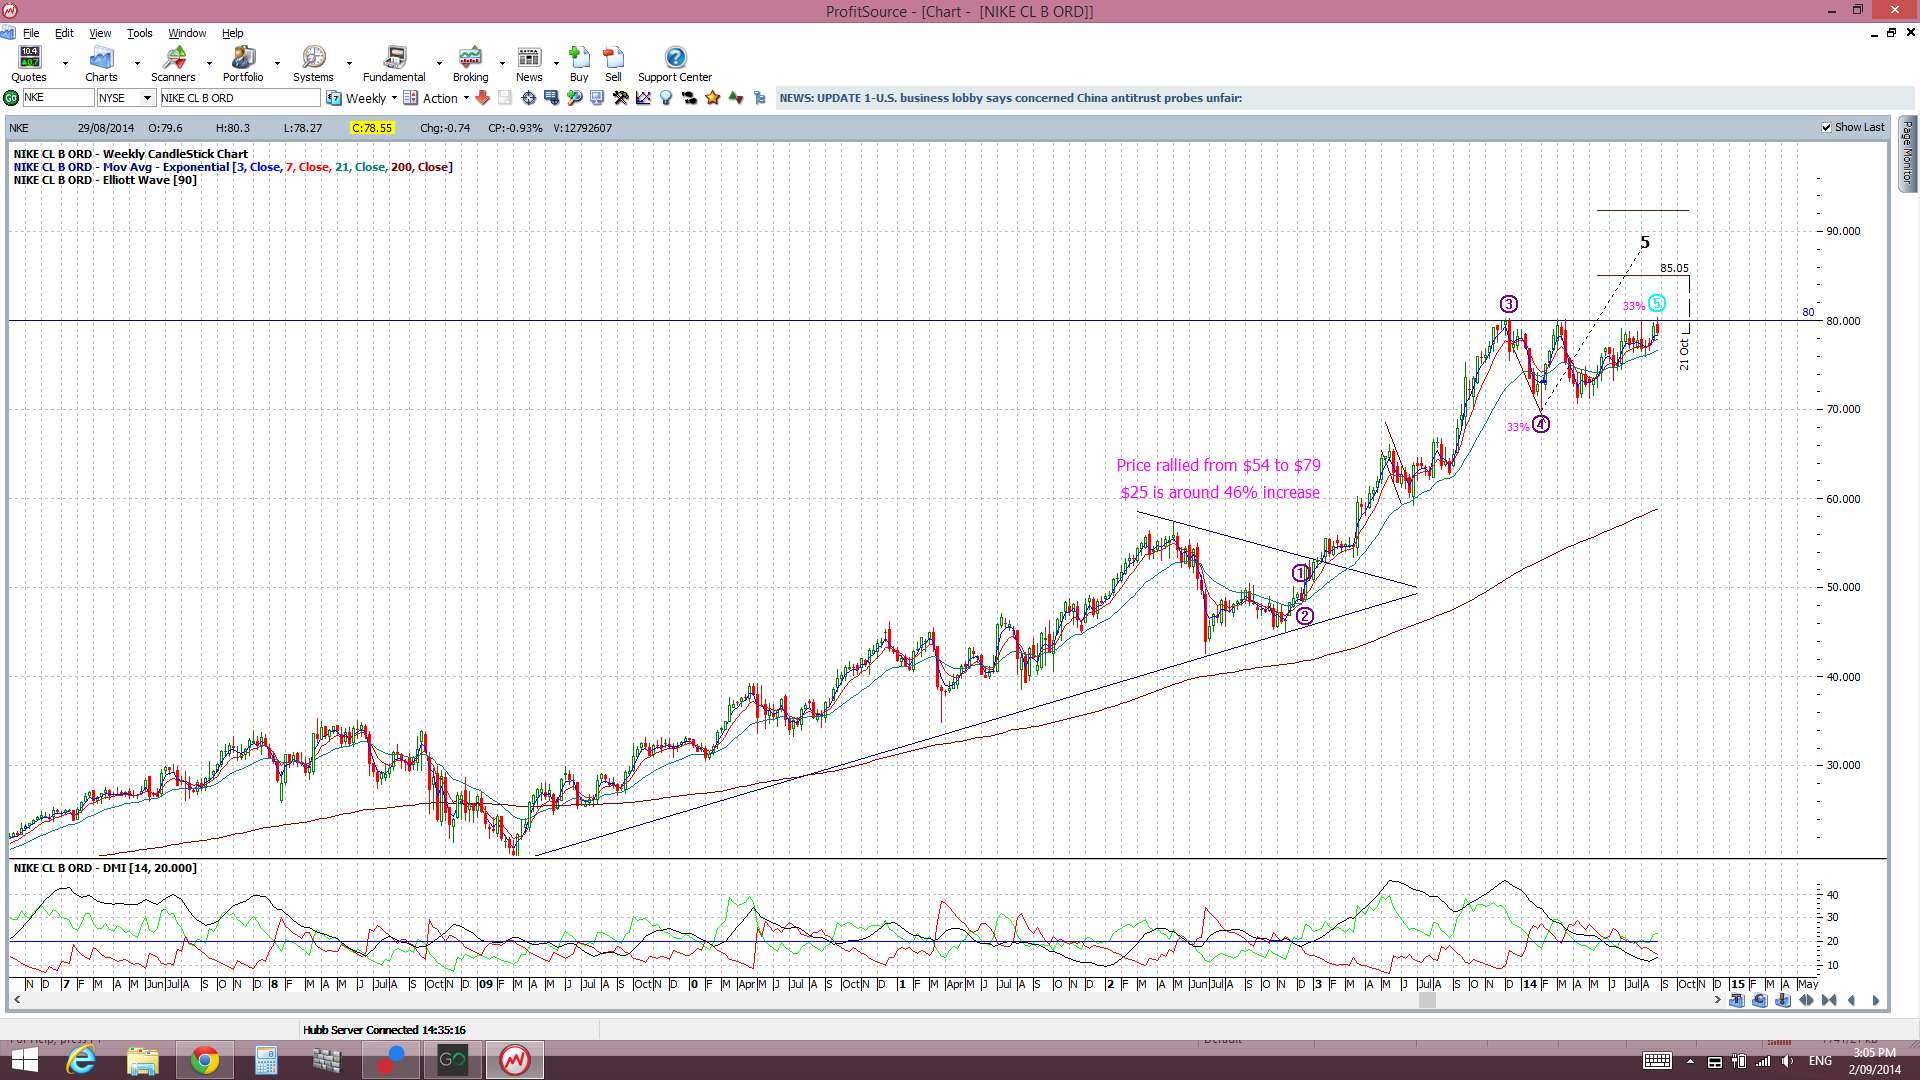
NKE: Nike looks like it’s getting ready to attack the $80 level again. A close and hold above would be bullish:

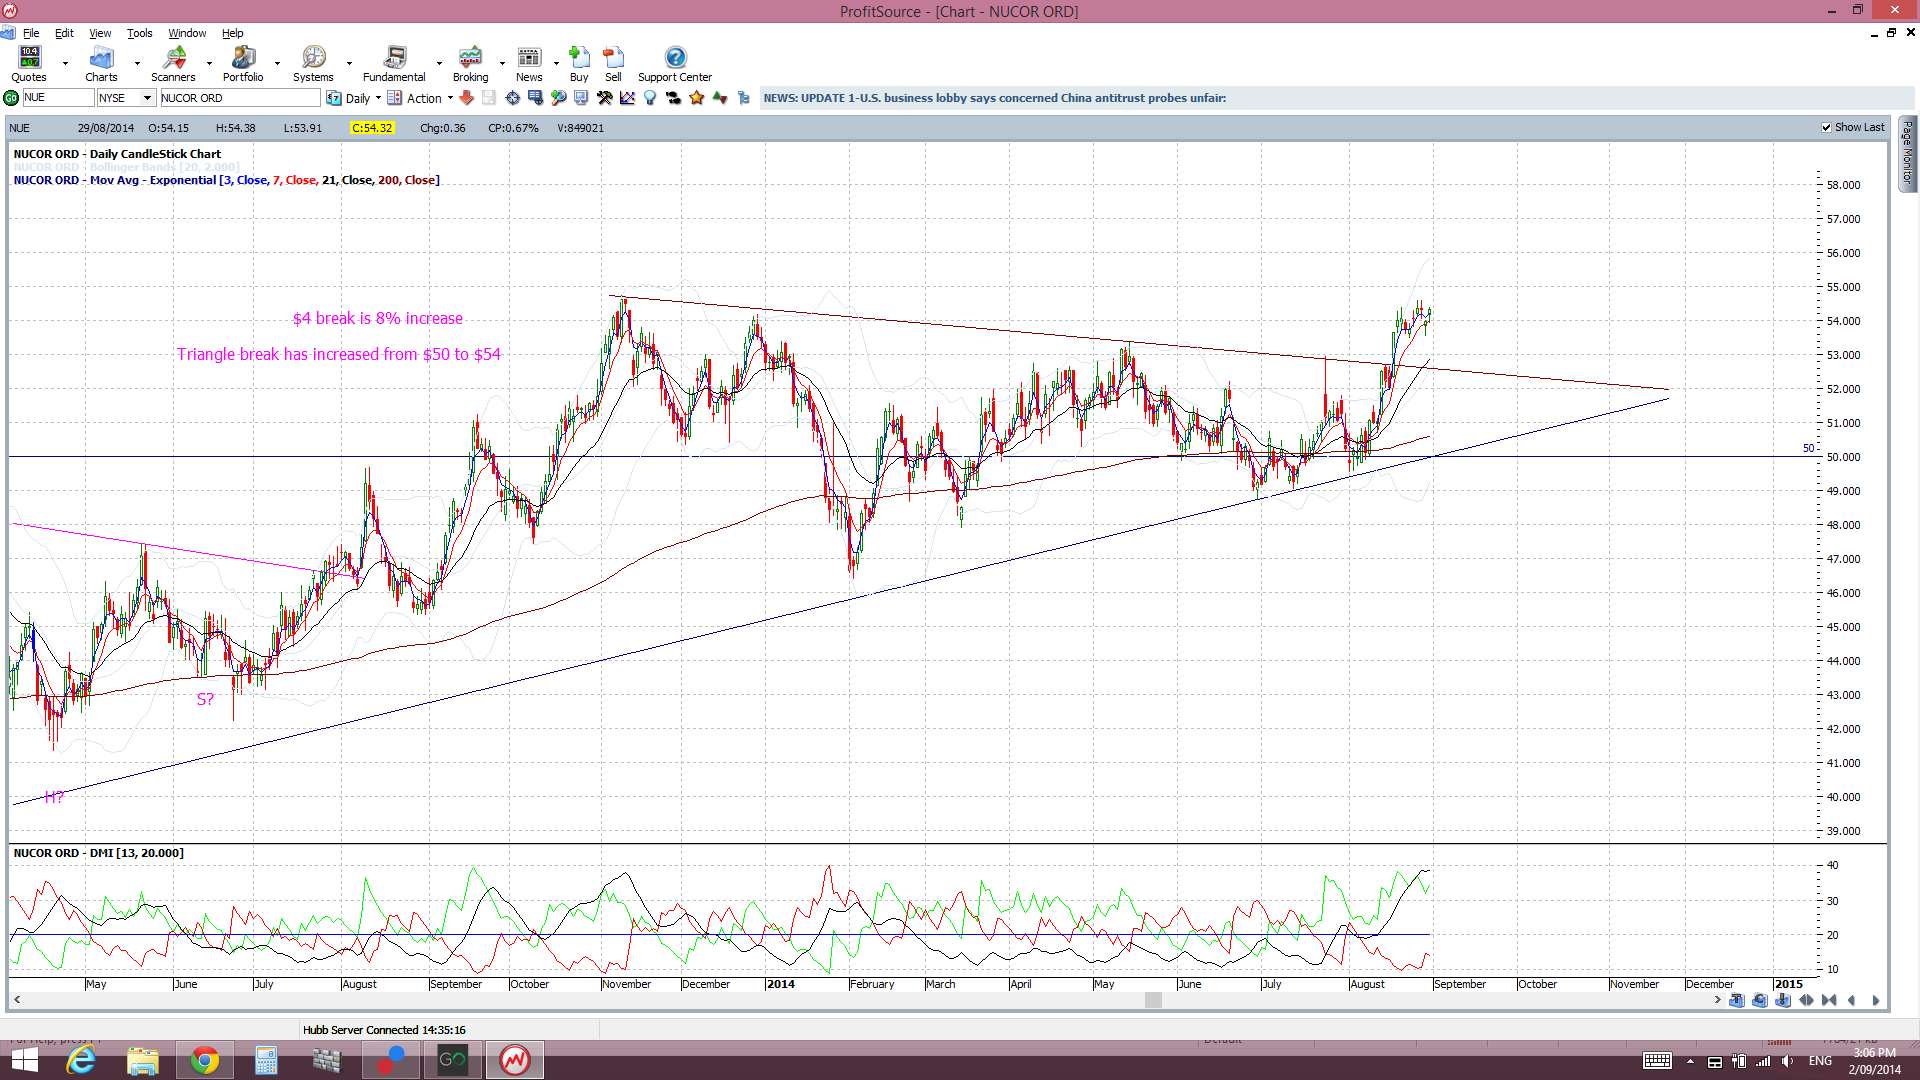
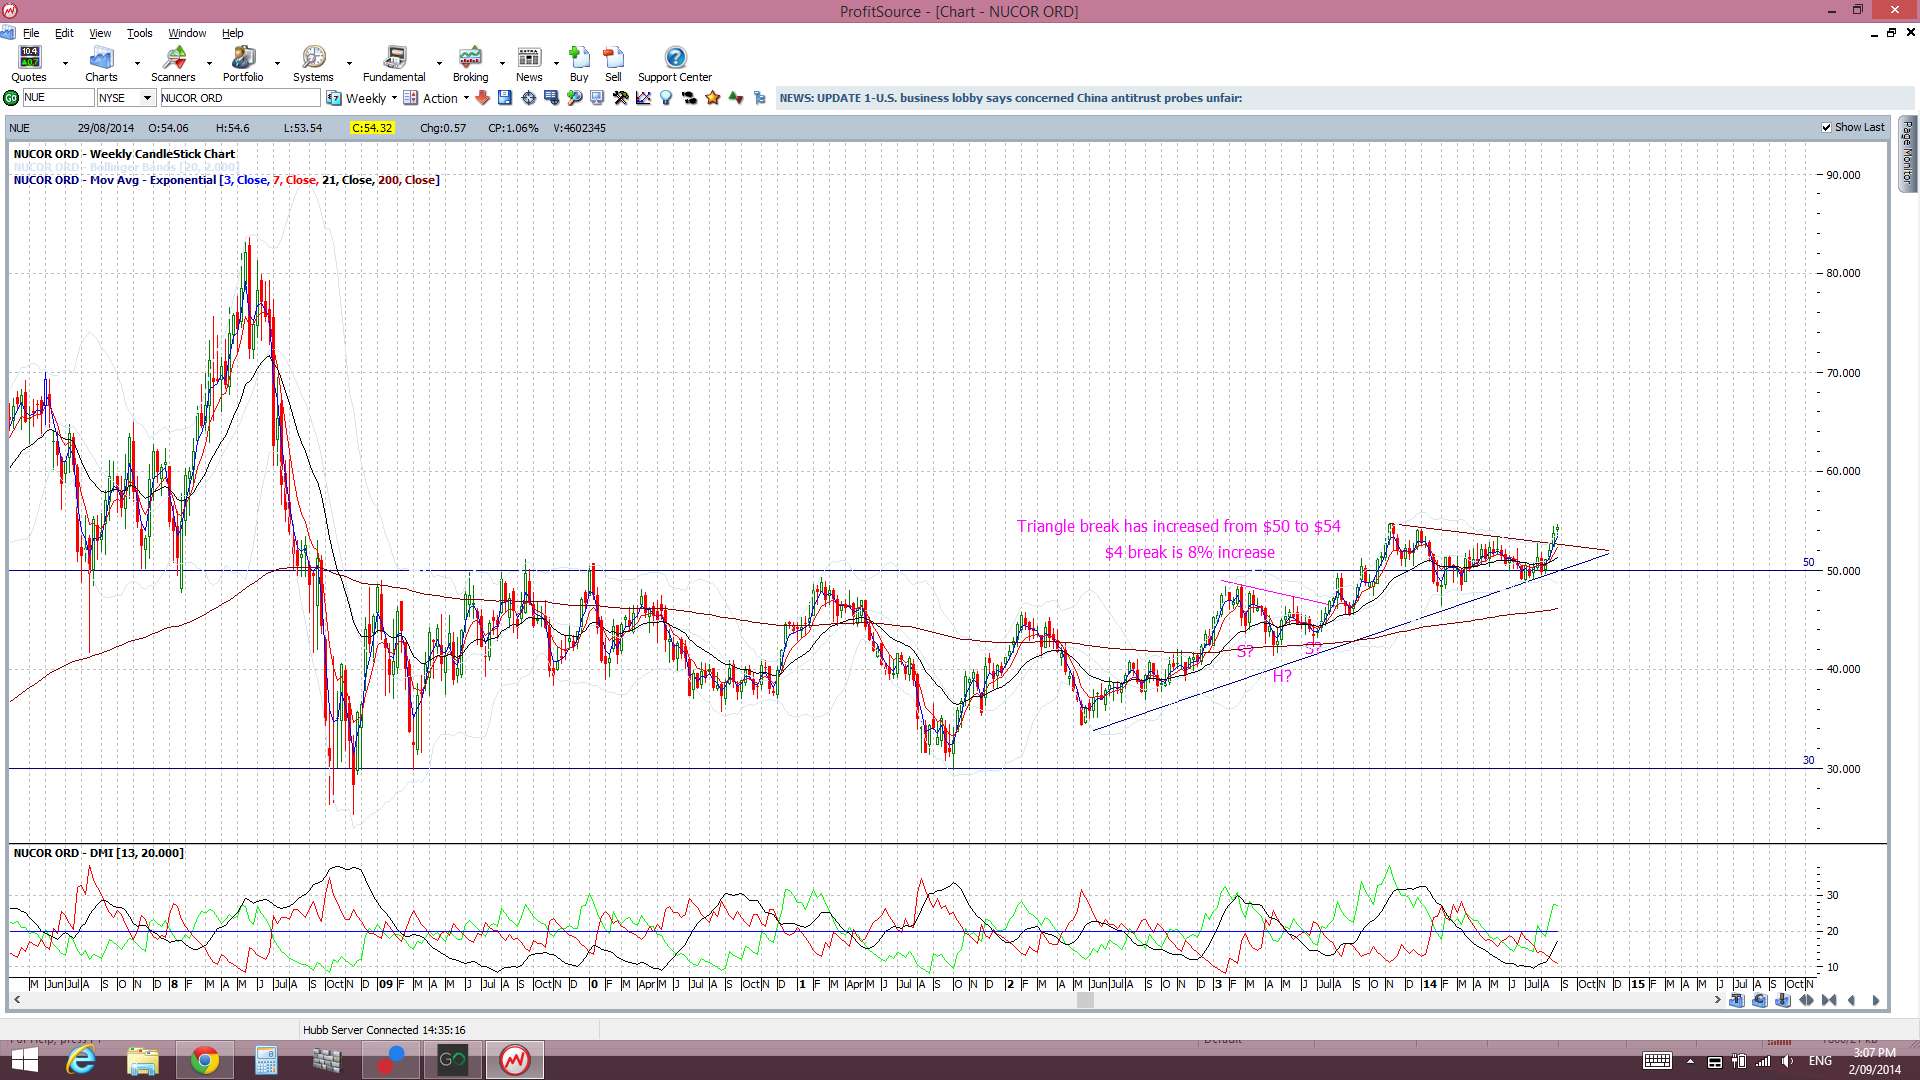
NUE: Nucor looks set to continue from its bullish triangle breakout:
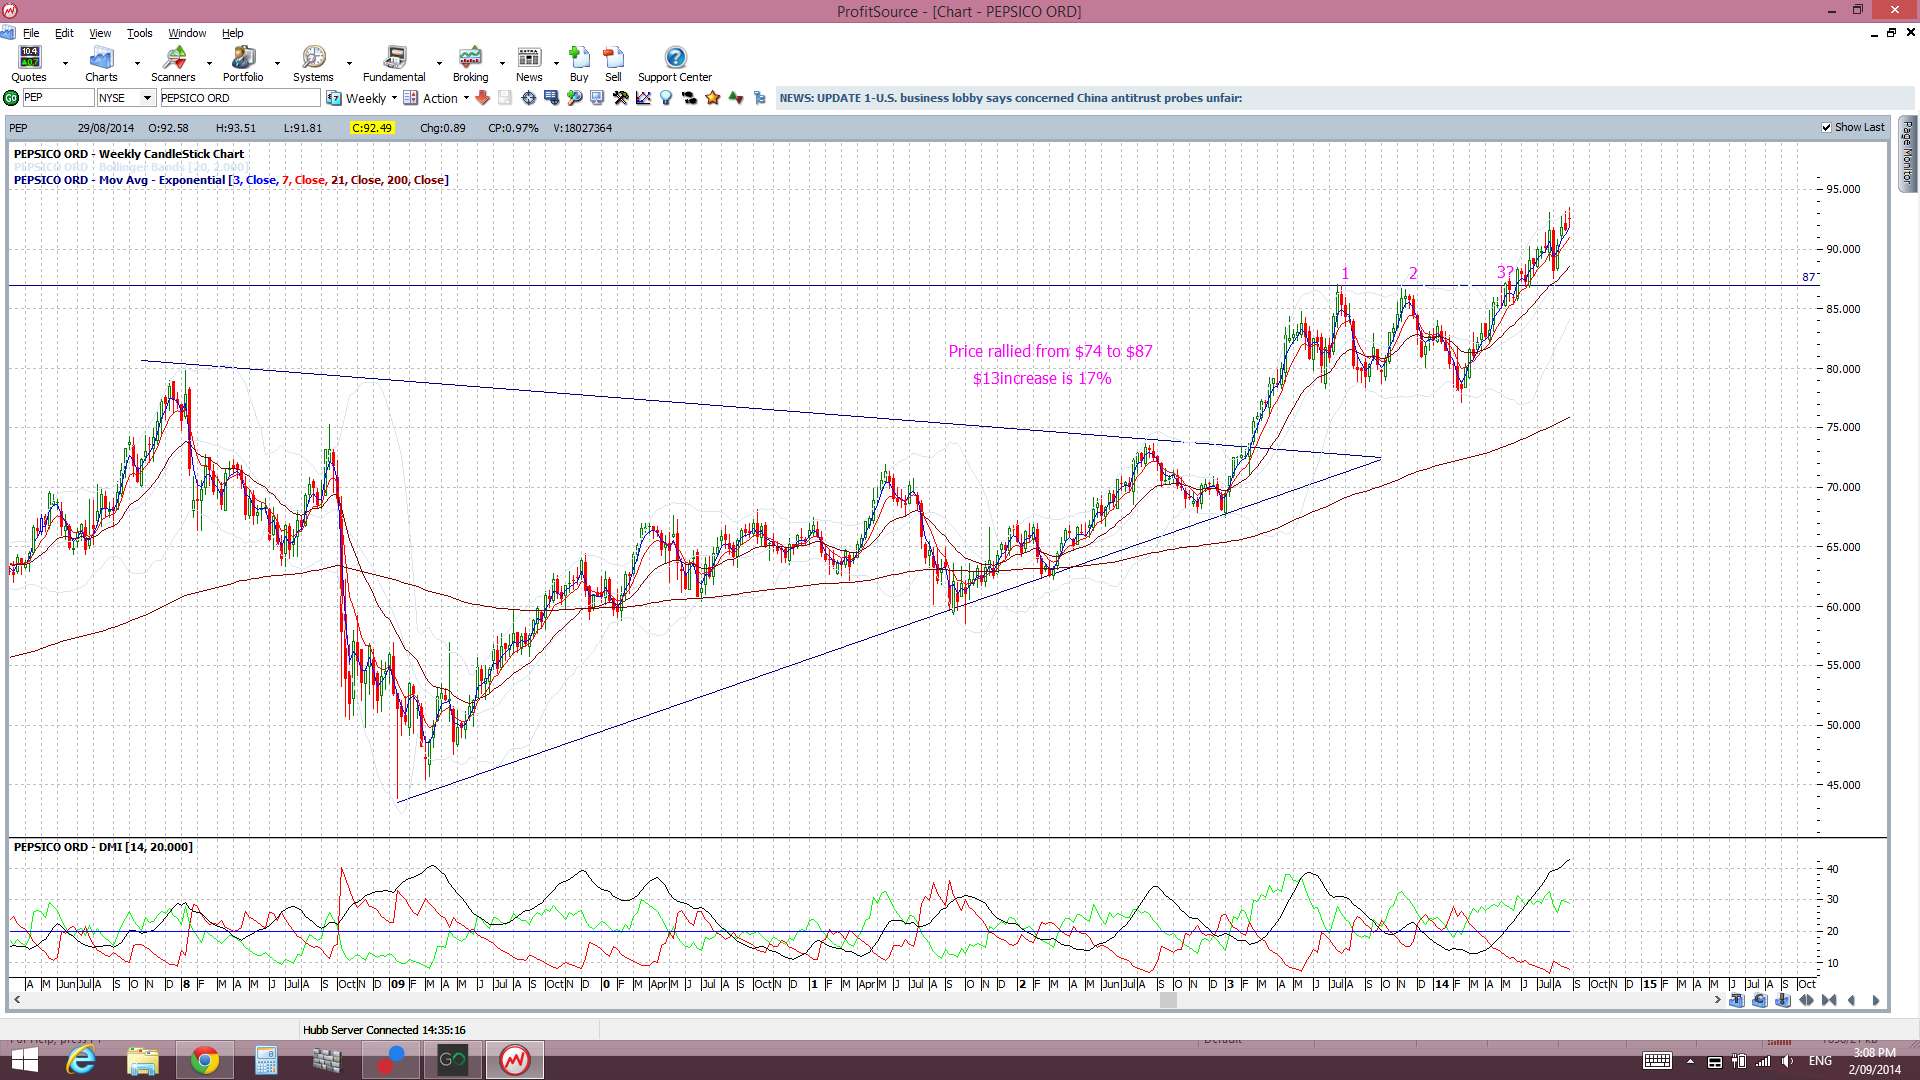
PEP: I had emphasised that the $87 was the key level to watch here. There was a bullish break and hold above this level at the close of August:
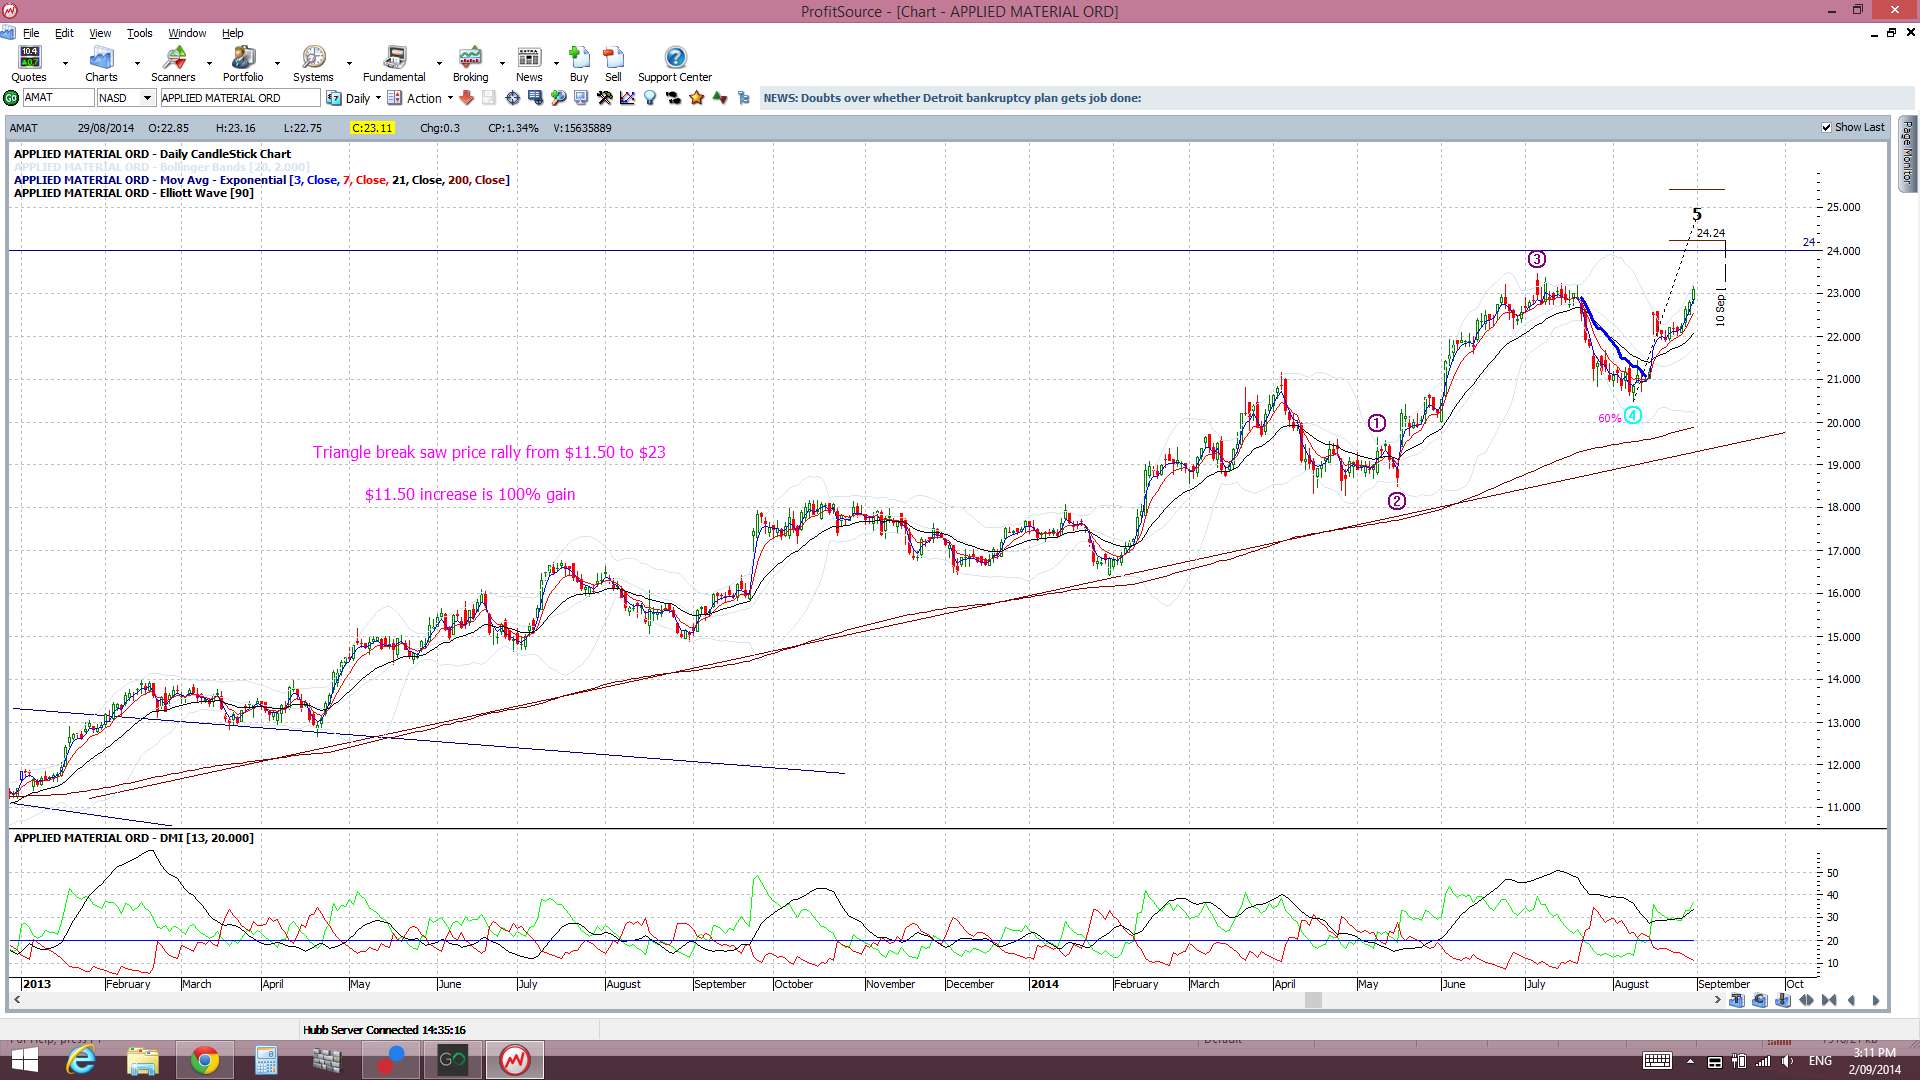
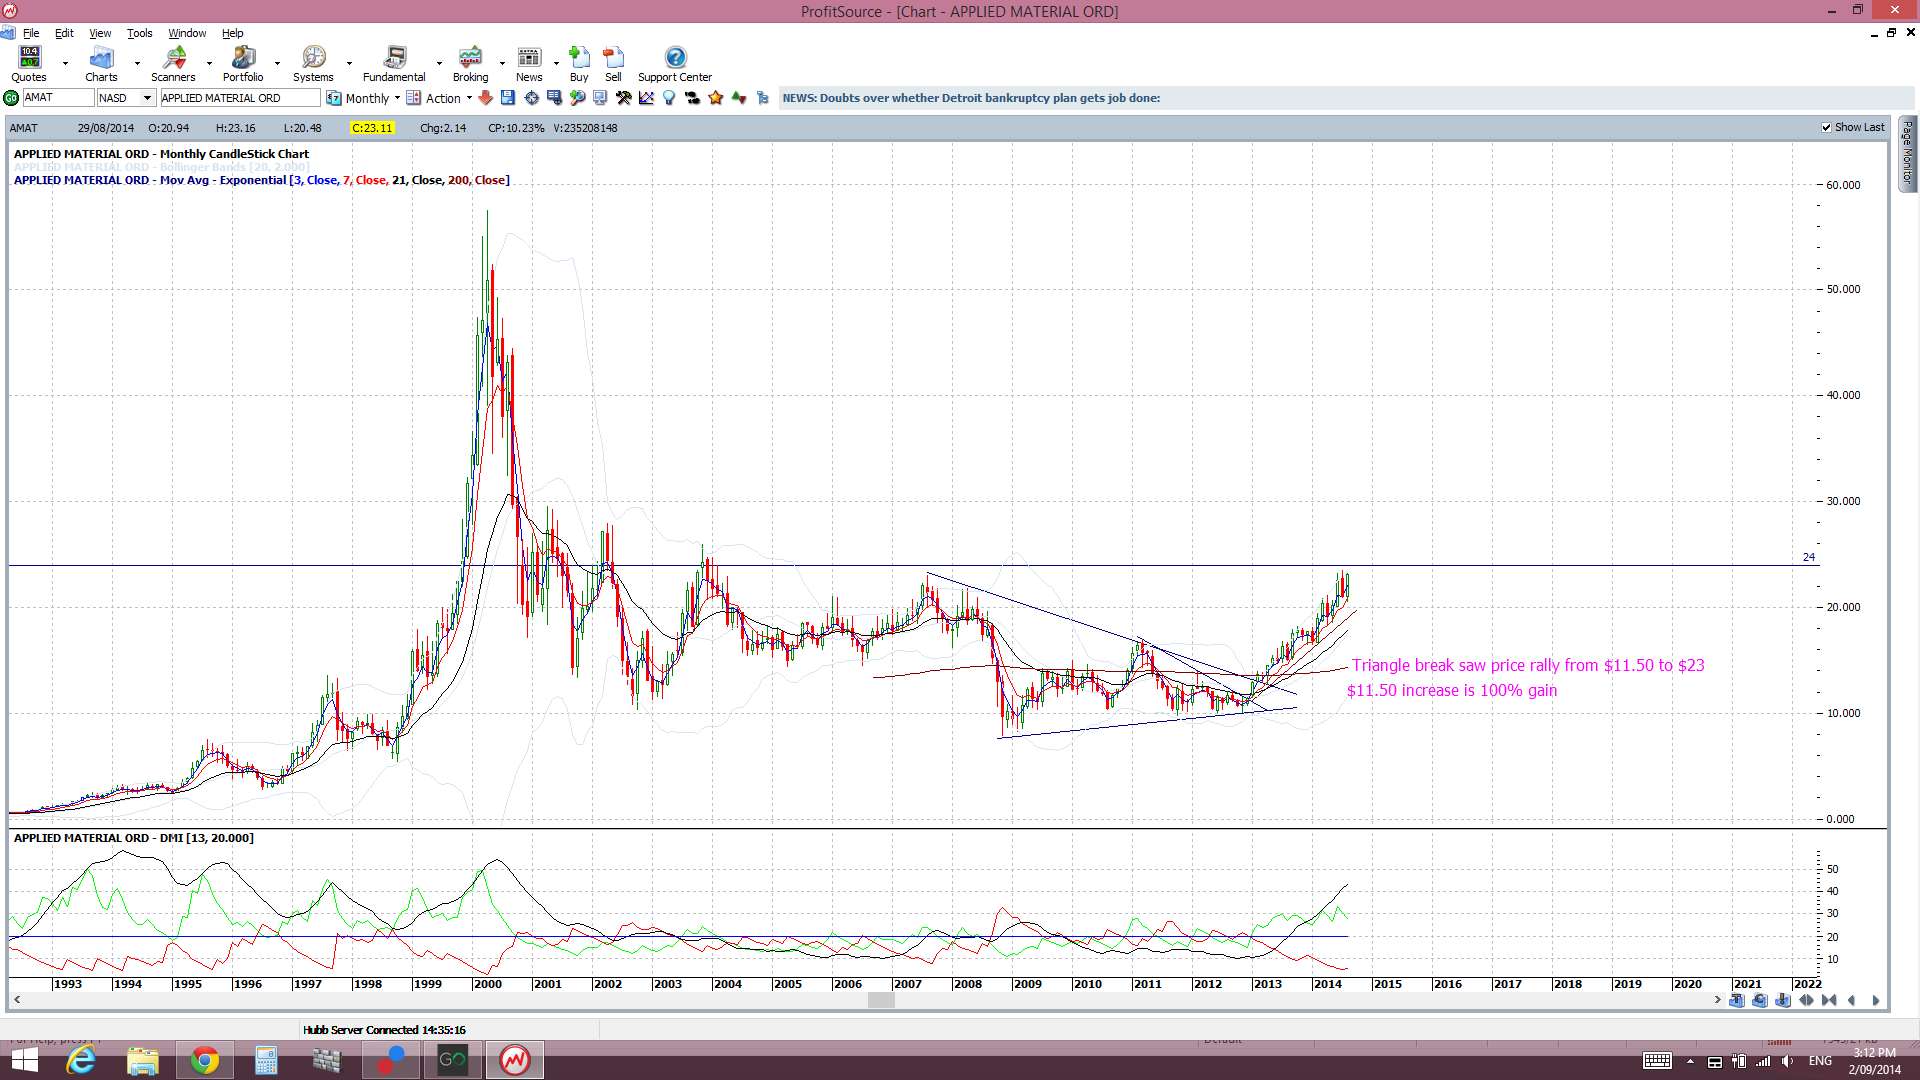
AMAT: the $24 level is the one to watch here:

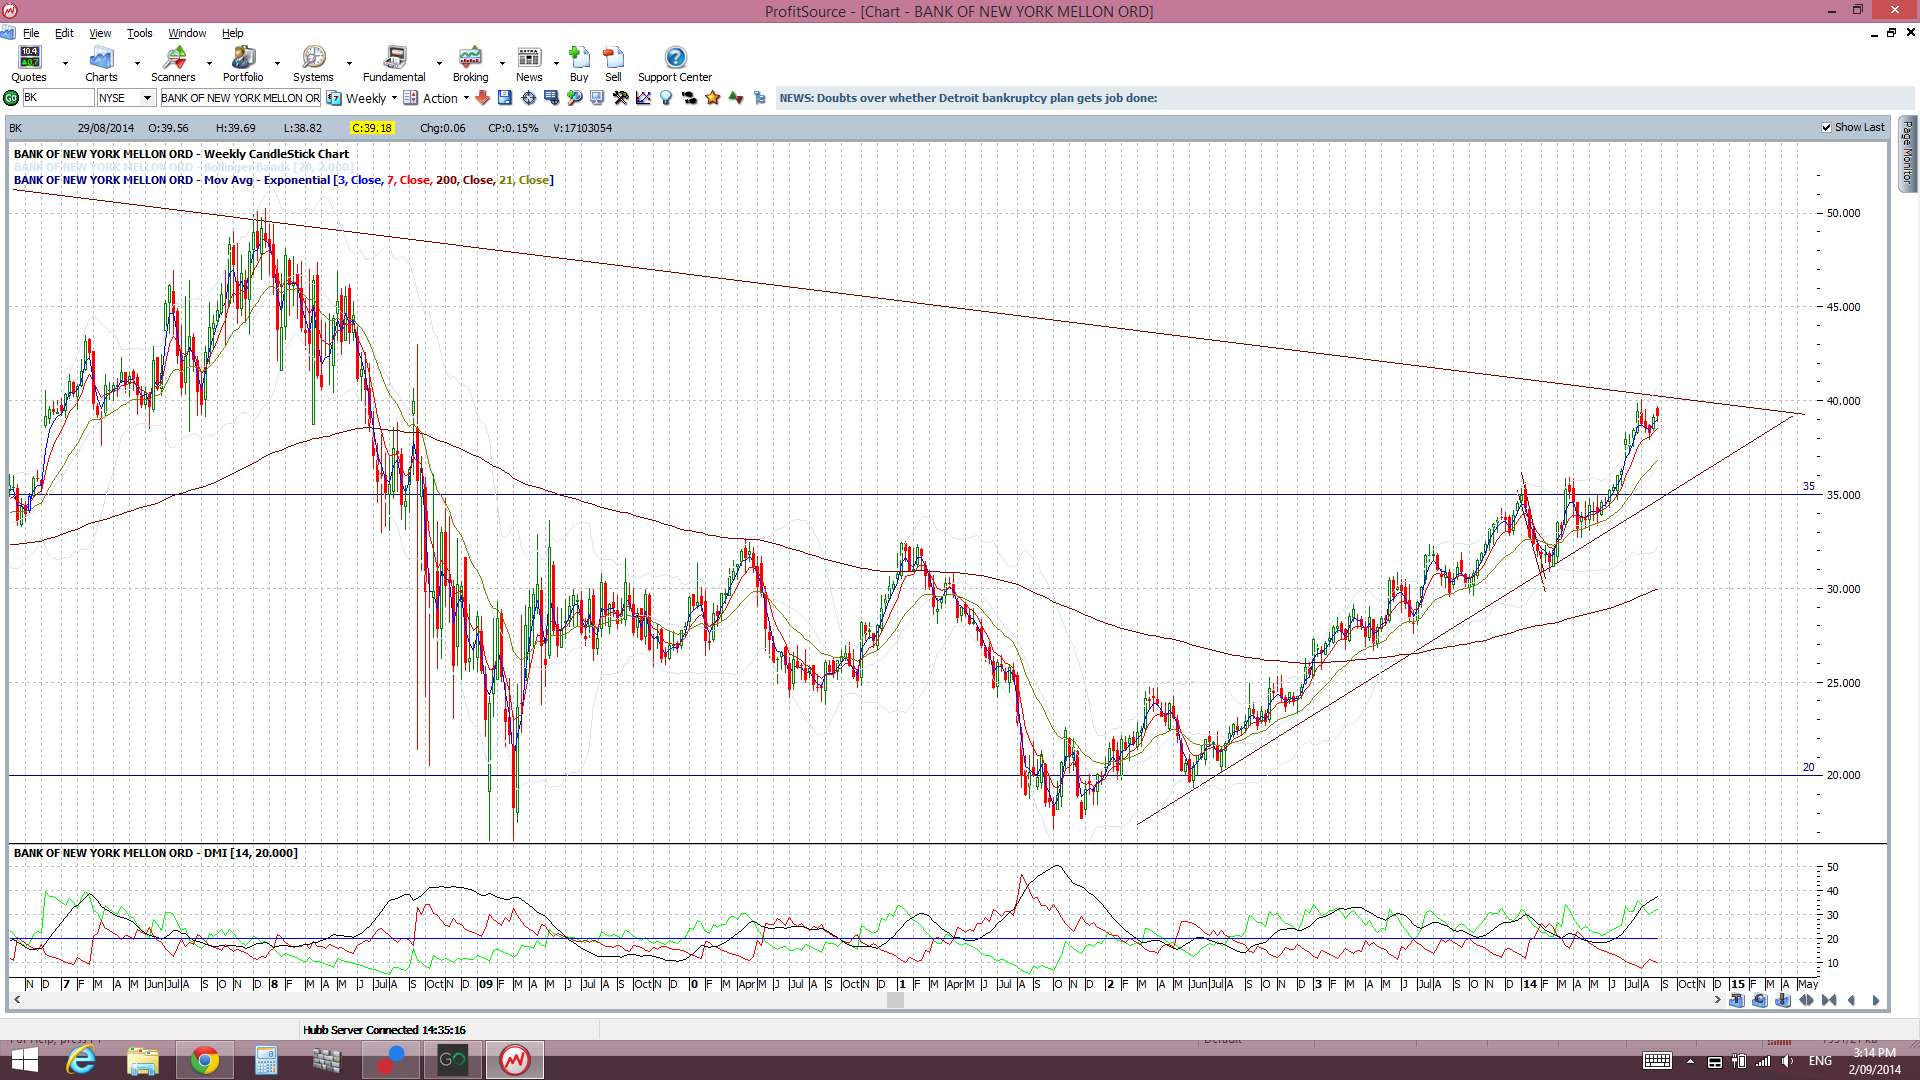
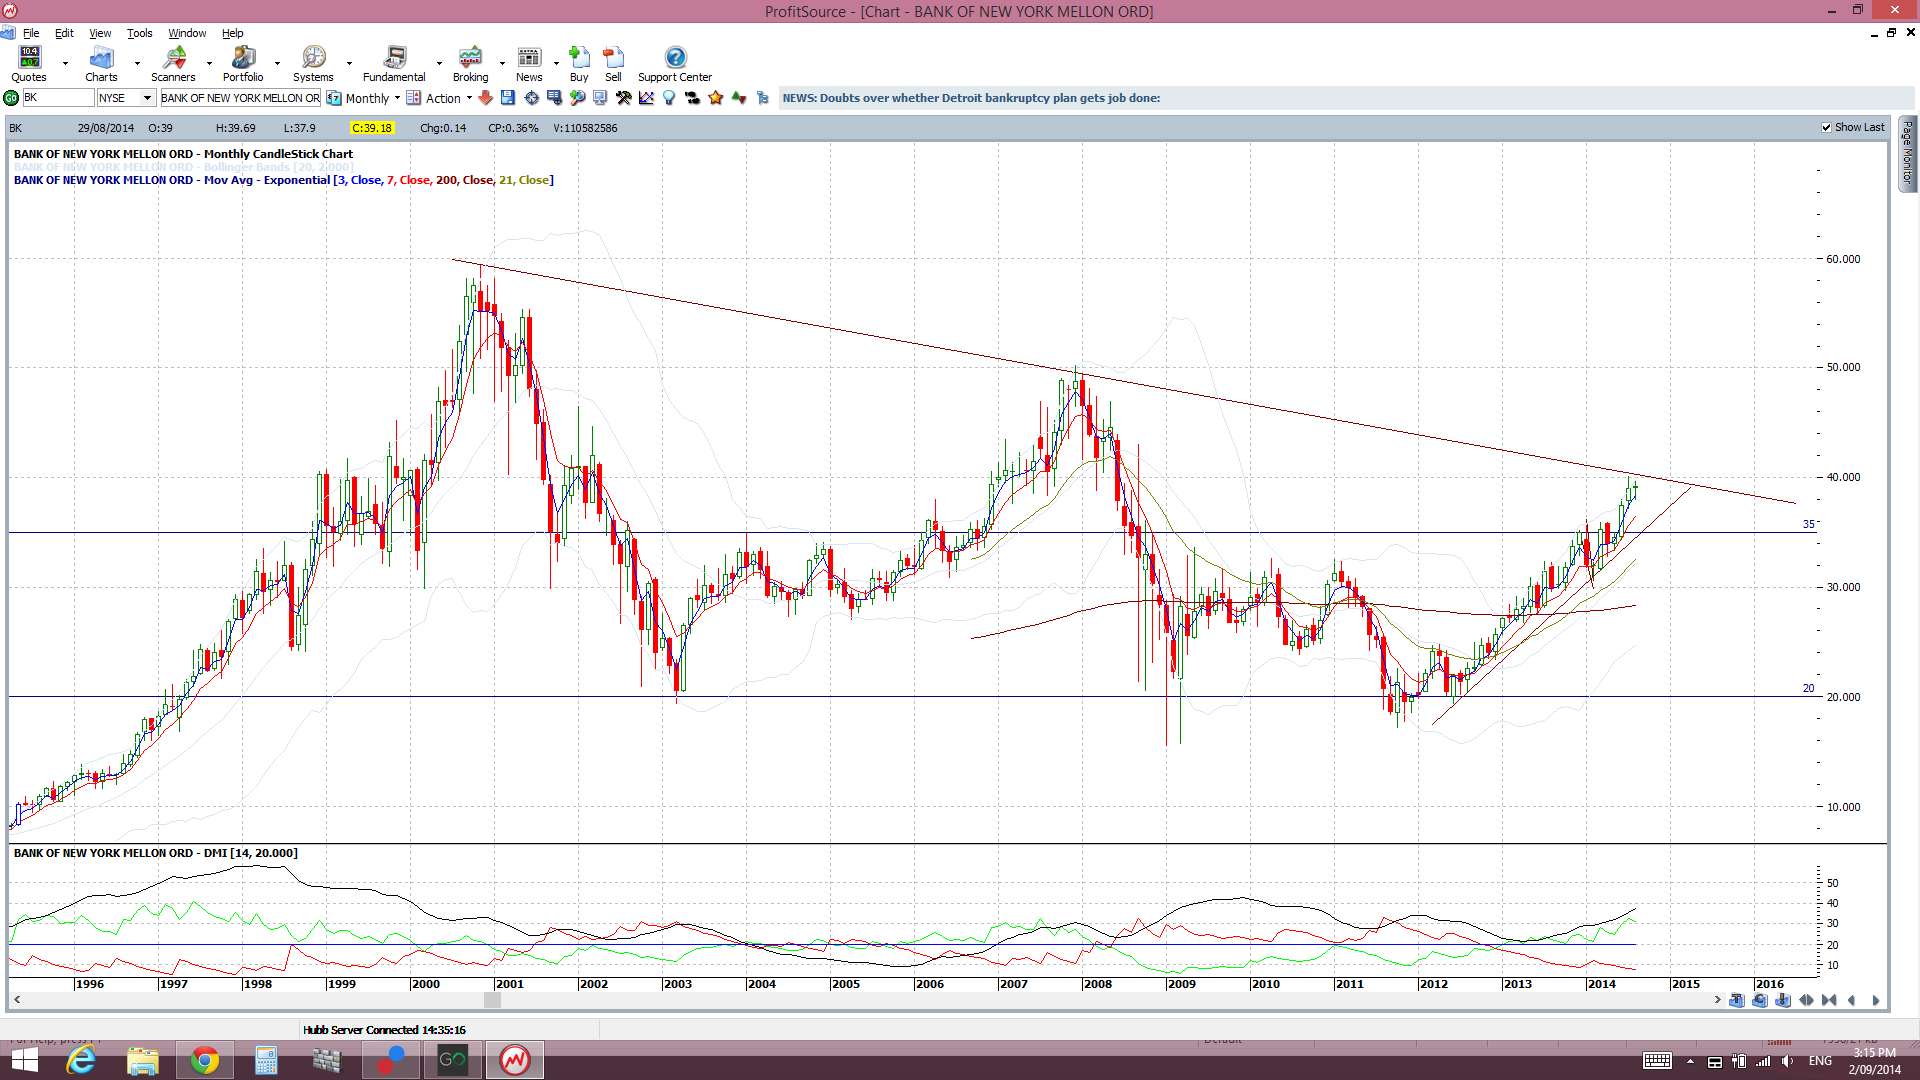
BK: Watch for any bullish triangle breakout here:

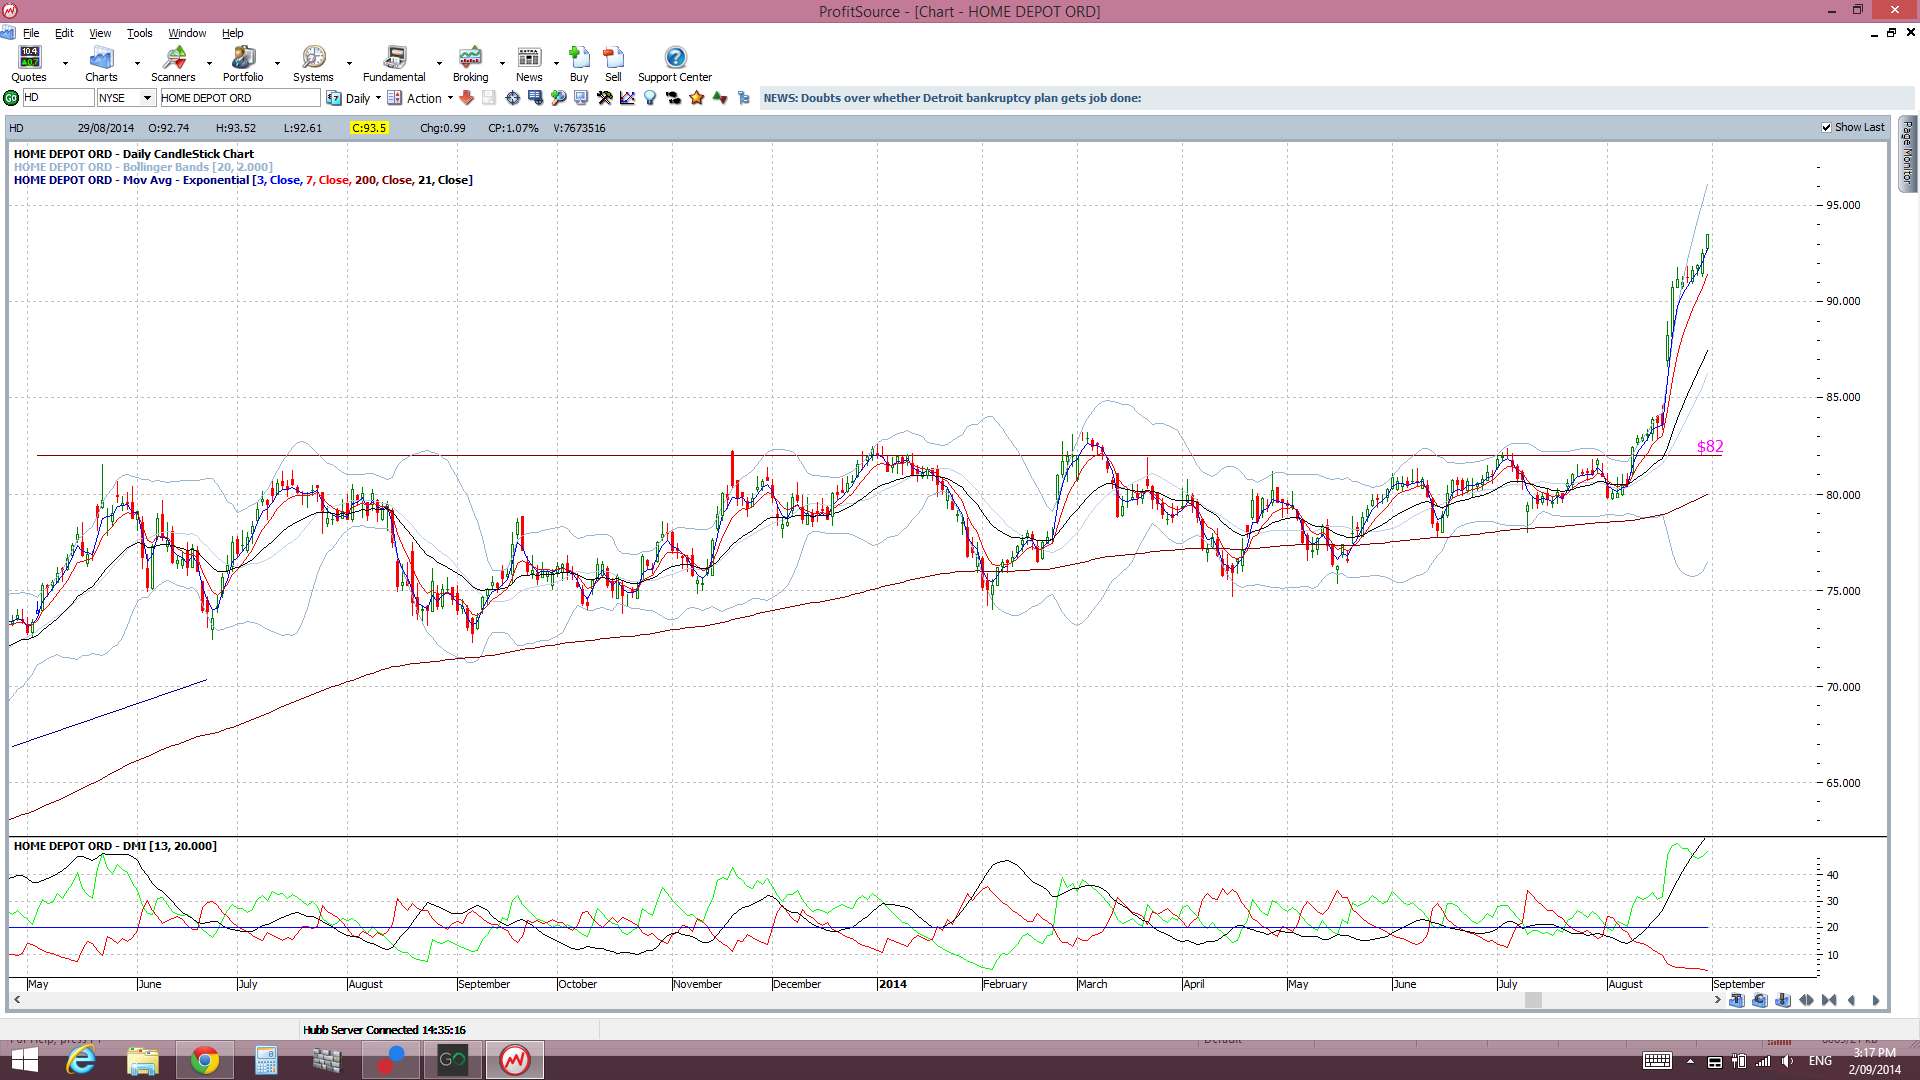
HD: This was the chart of Home Depot that I posted last time whilst stressing to watch for bullish continuation after the break of $82:

This is the current chart and price has moved on about $10 since my last post. That’s only about 12%!!
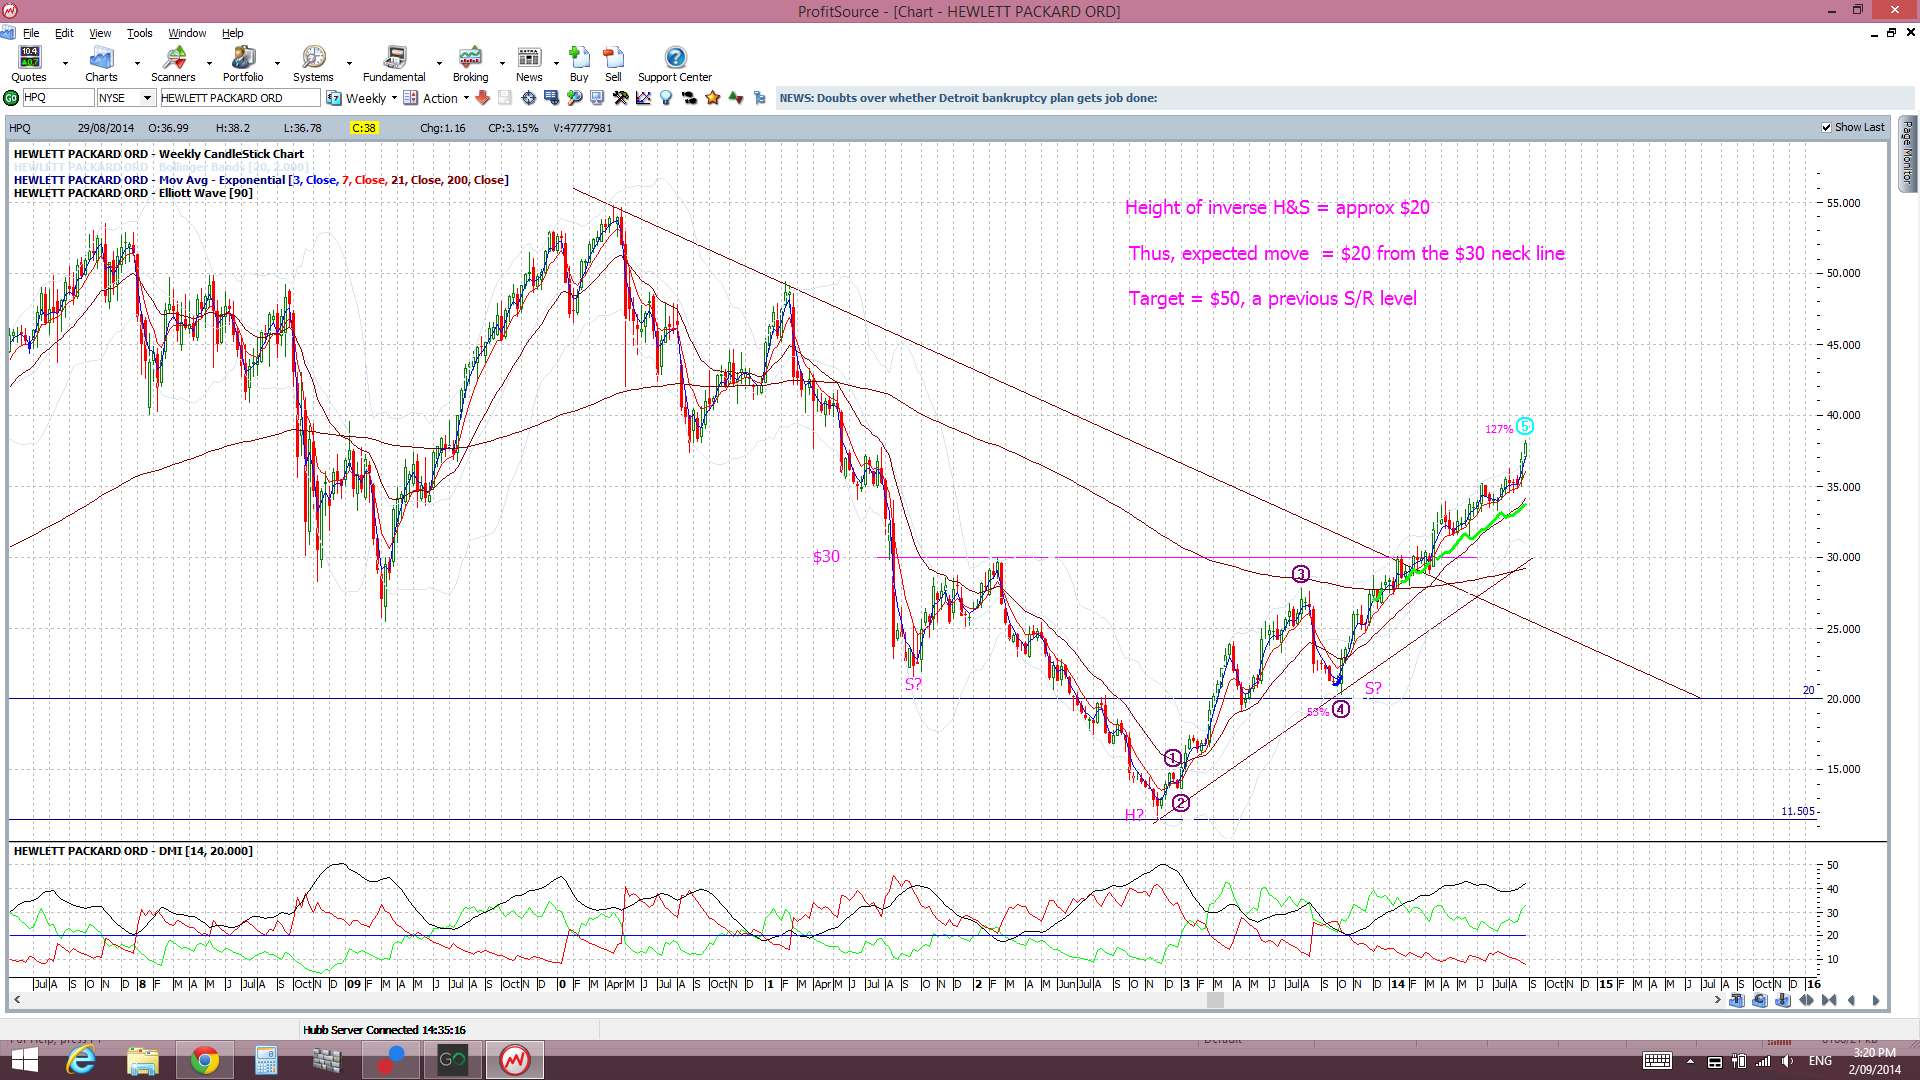
HPQ: this bullish inverse H&S continues. It is up $8 of a possible $20 move:
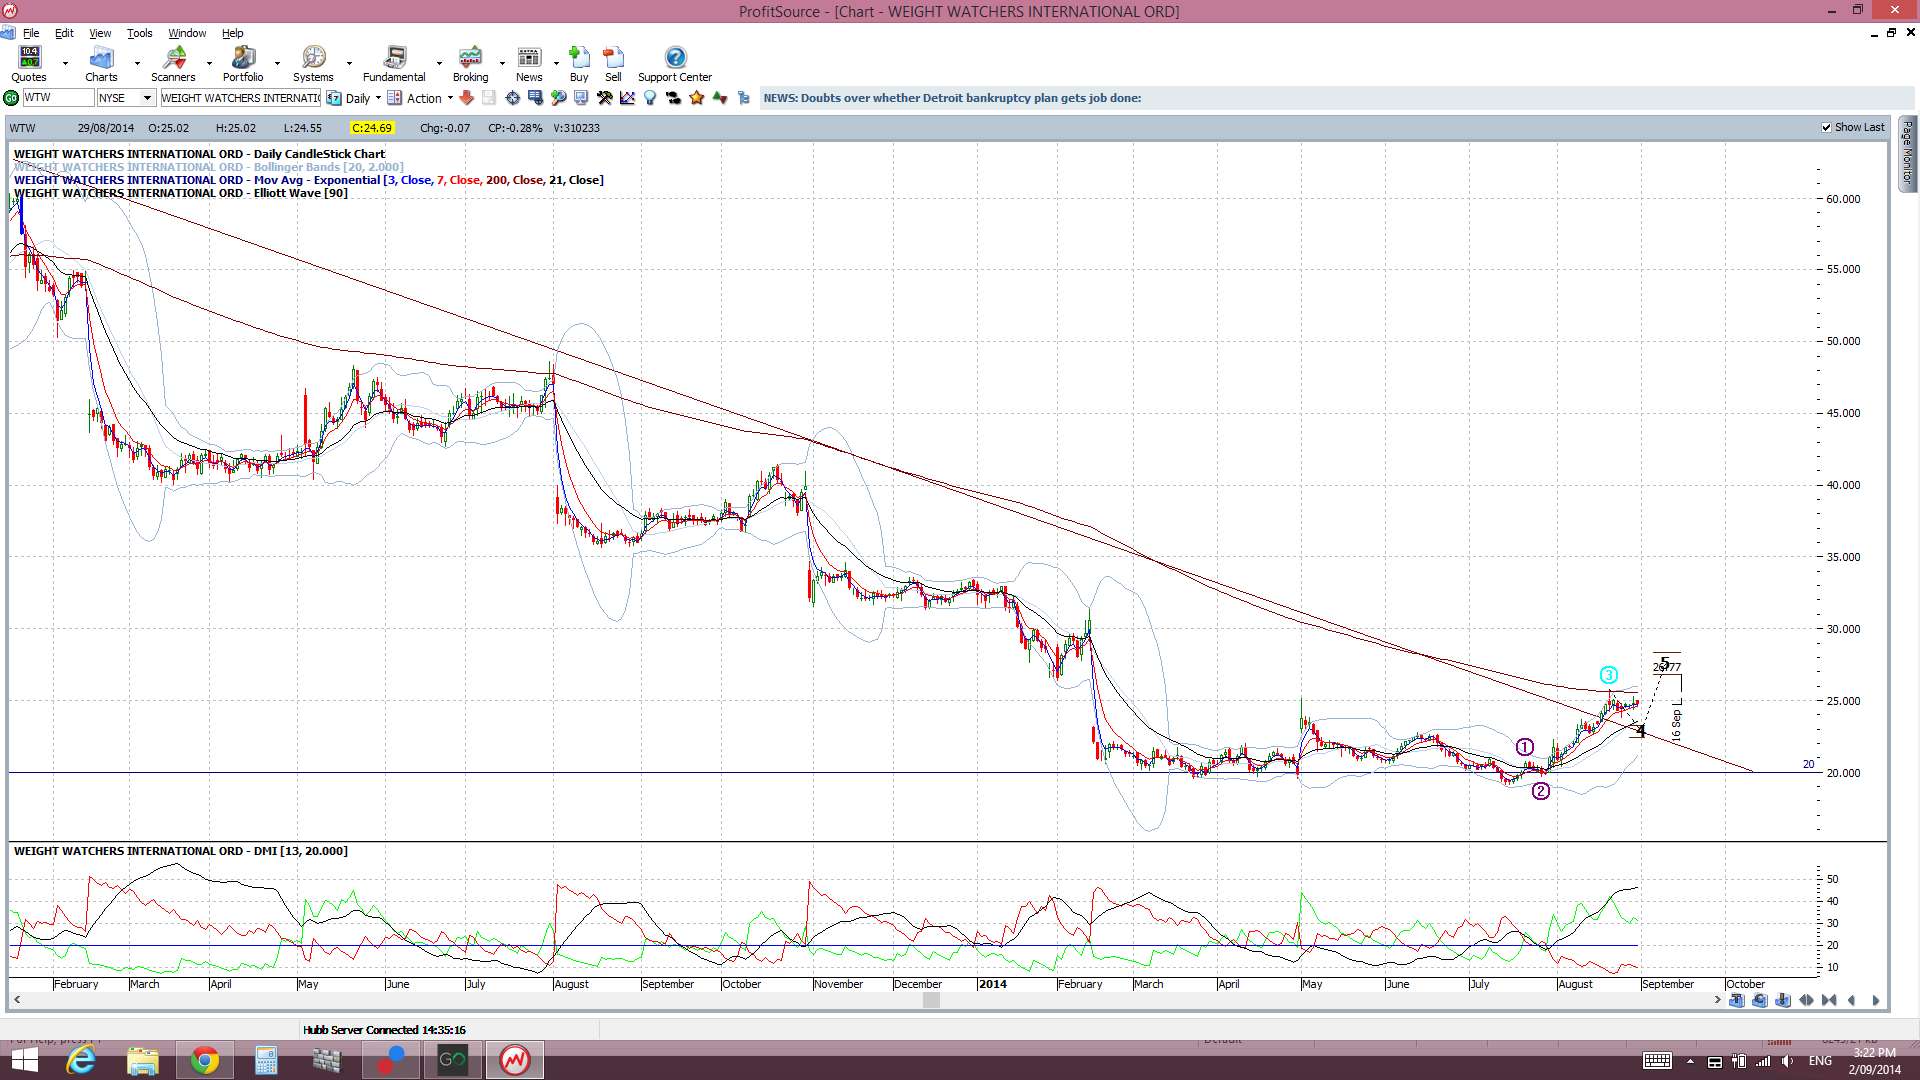
WTW: looks to have bottomed. A close and hold above the $25 level would be bullish:
The post S&P500 & 1st trading day of the month: what to watch. appeared first on www.forextell.com.