Yesterday I Tweeted with suggested technical patterns on the major stock index charts as possibly being useful to gauge any potential breakout move however Monday’s last session was rather choppy and so no breakouts were triggered. I have noticed this morning though that there are larger patterns on the 4hr charts for these indices and so I will use these as guides for future sessions.
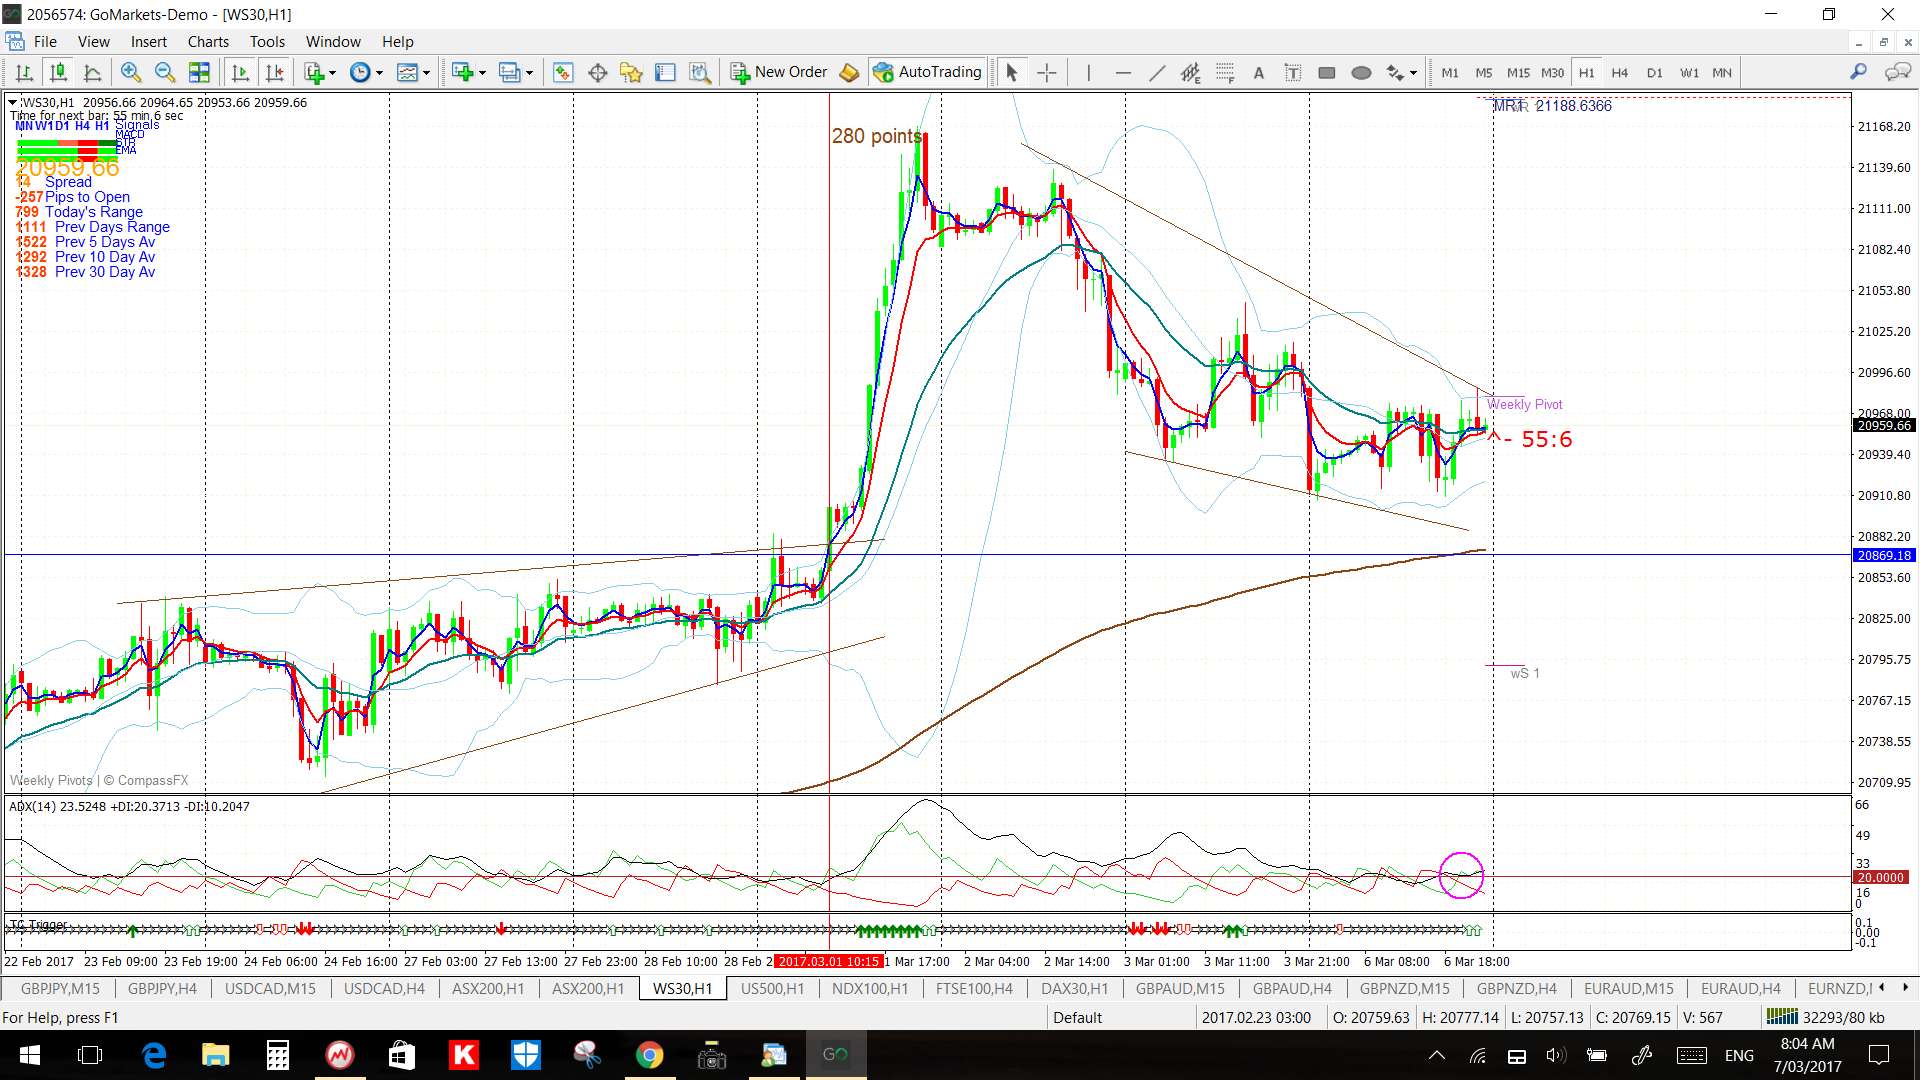
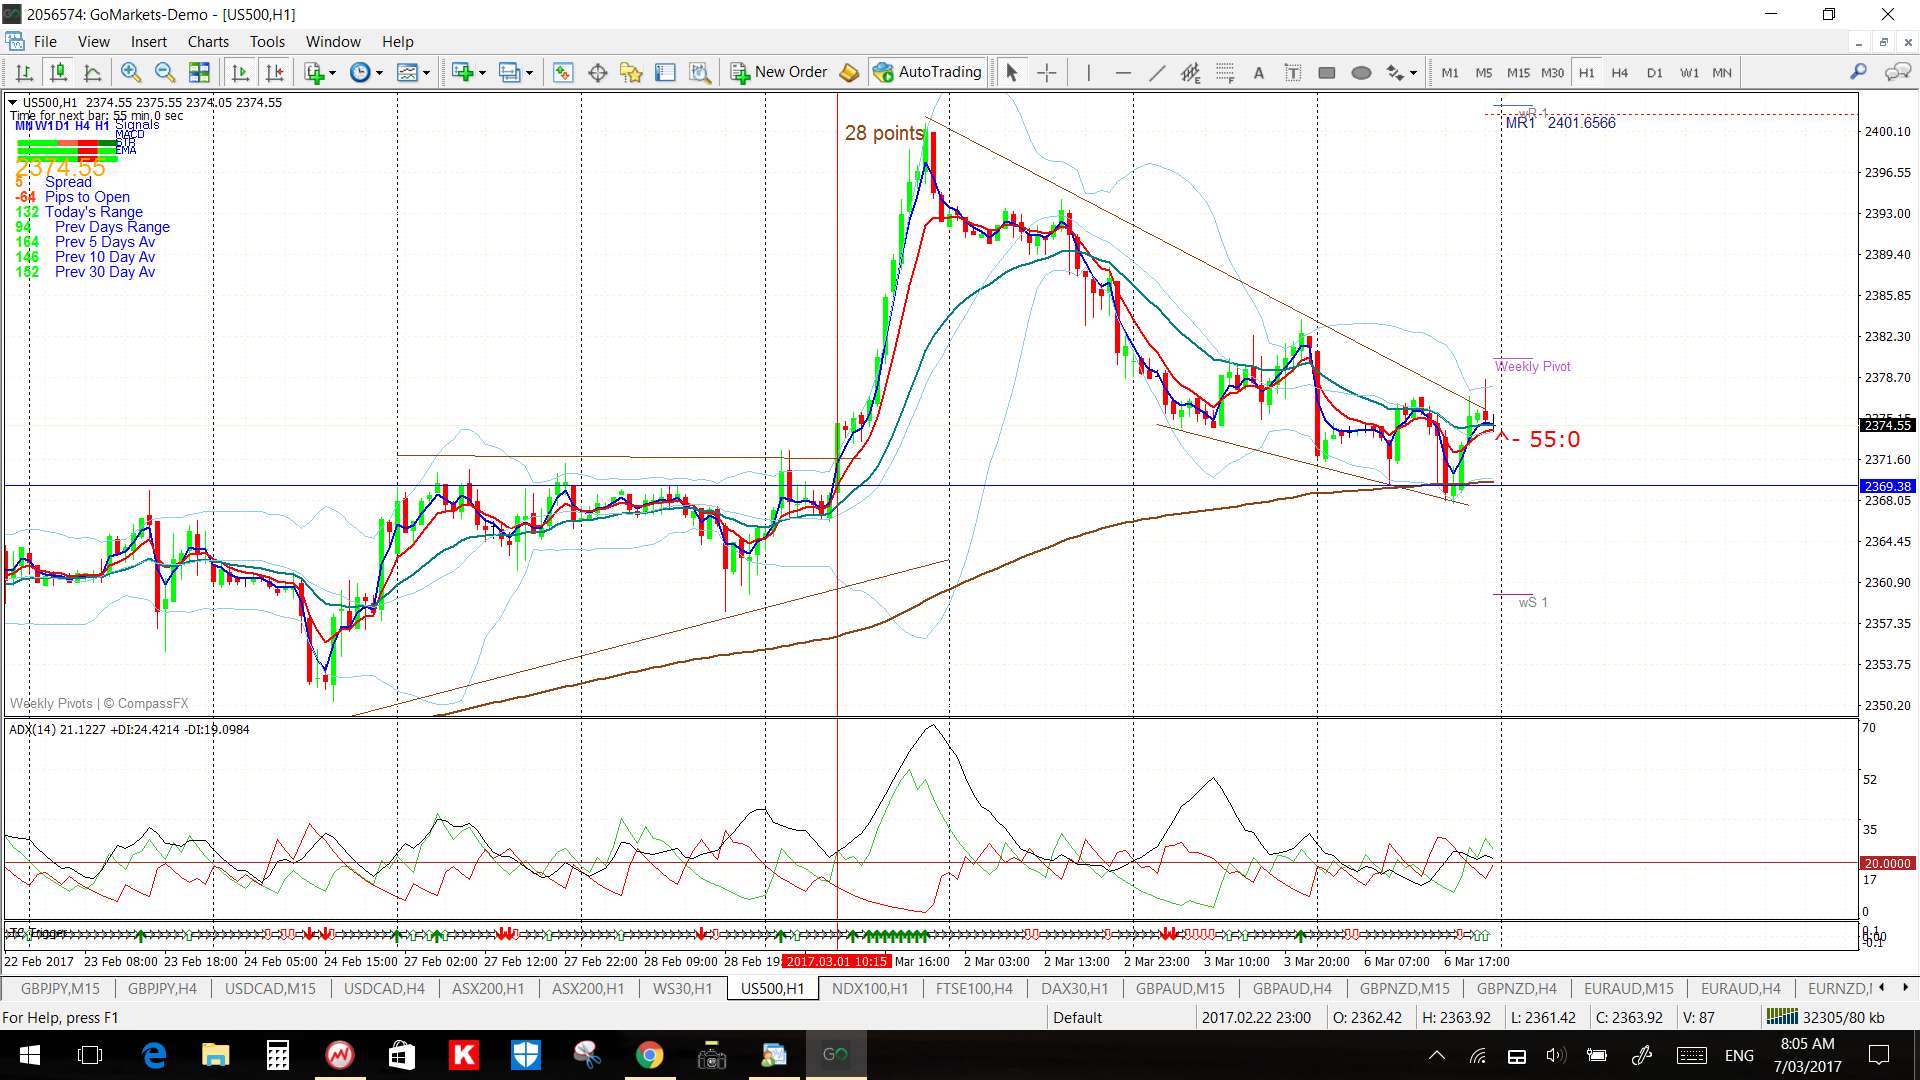
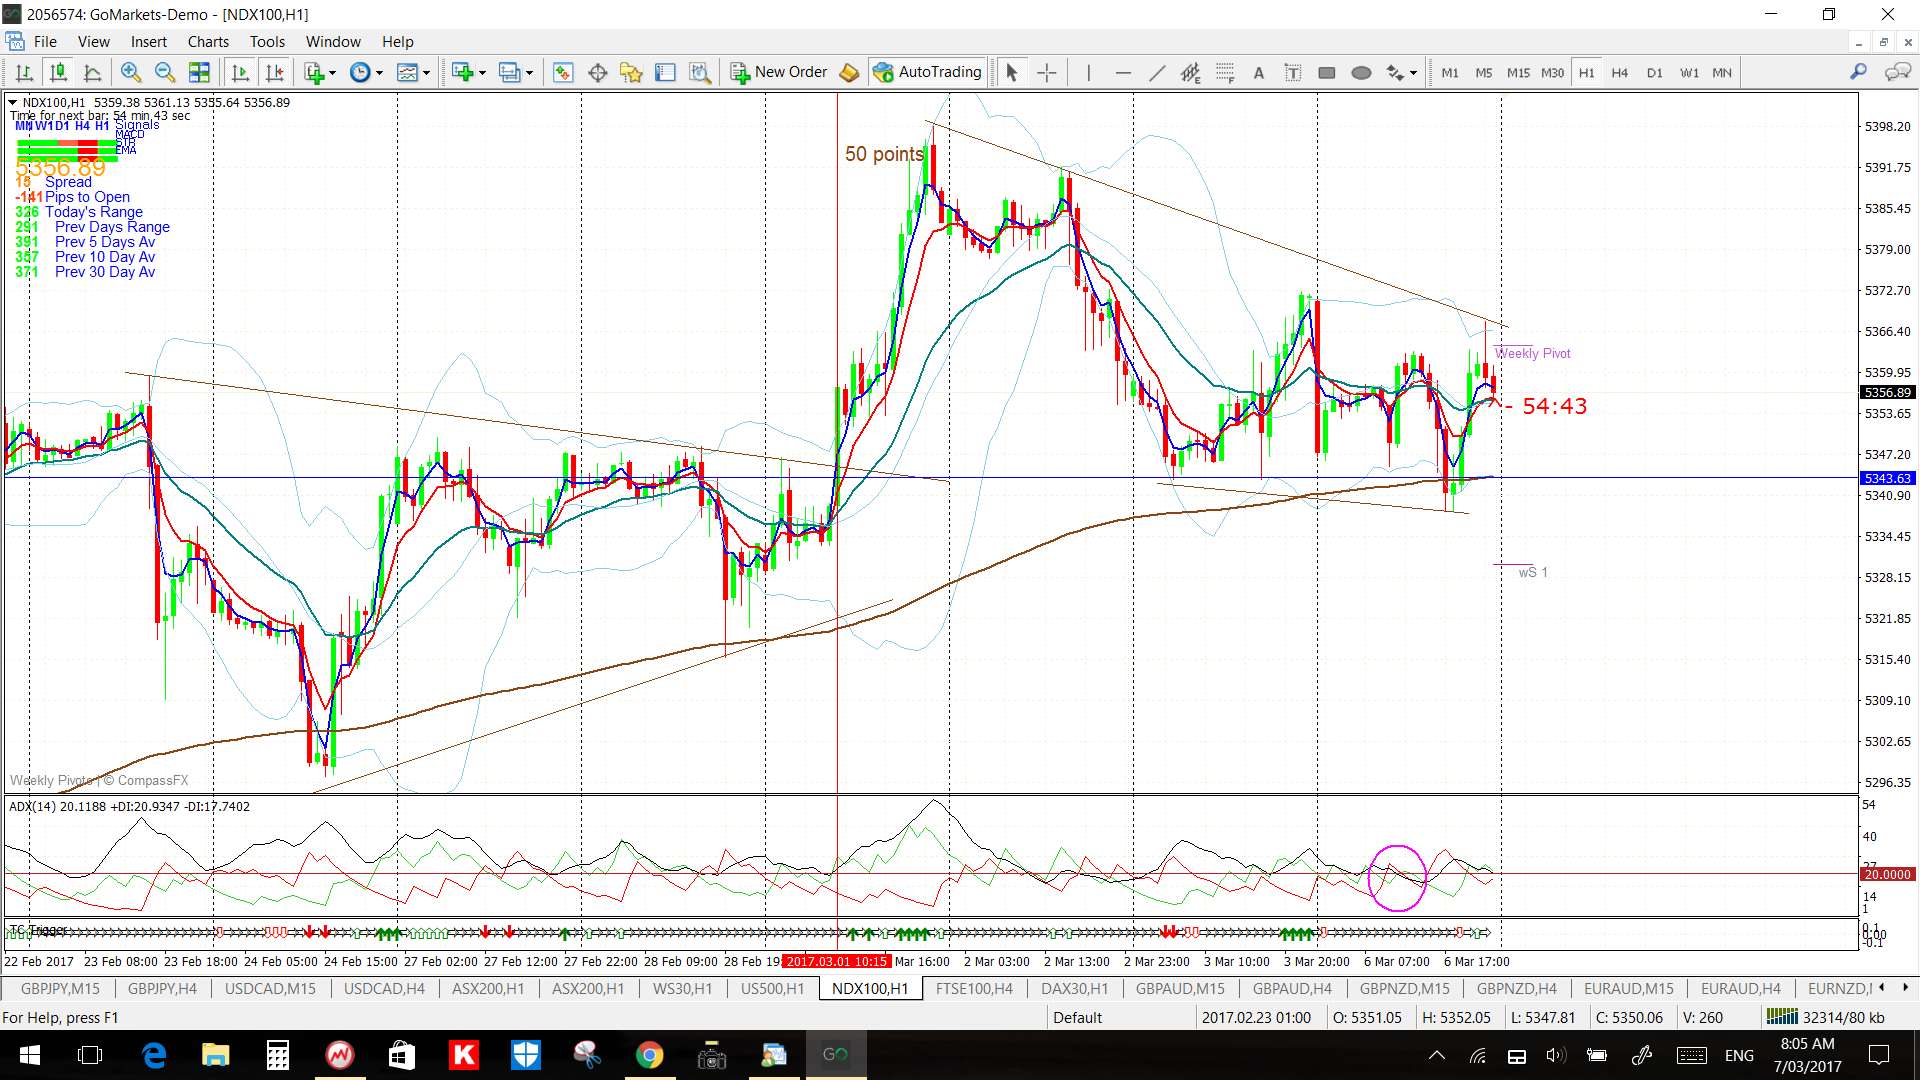
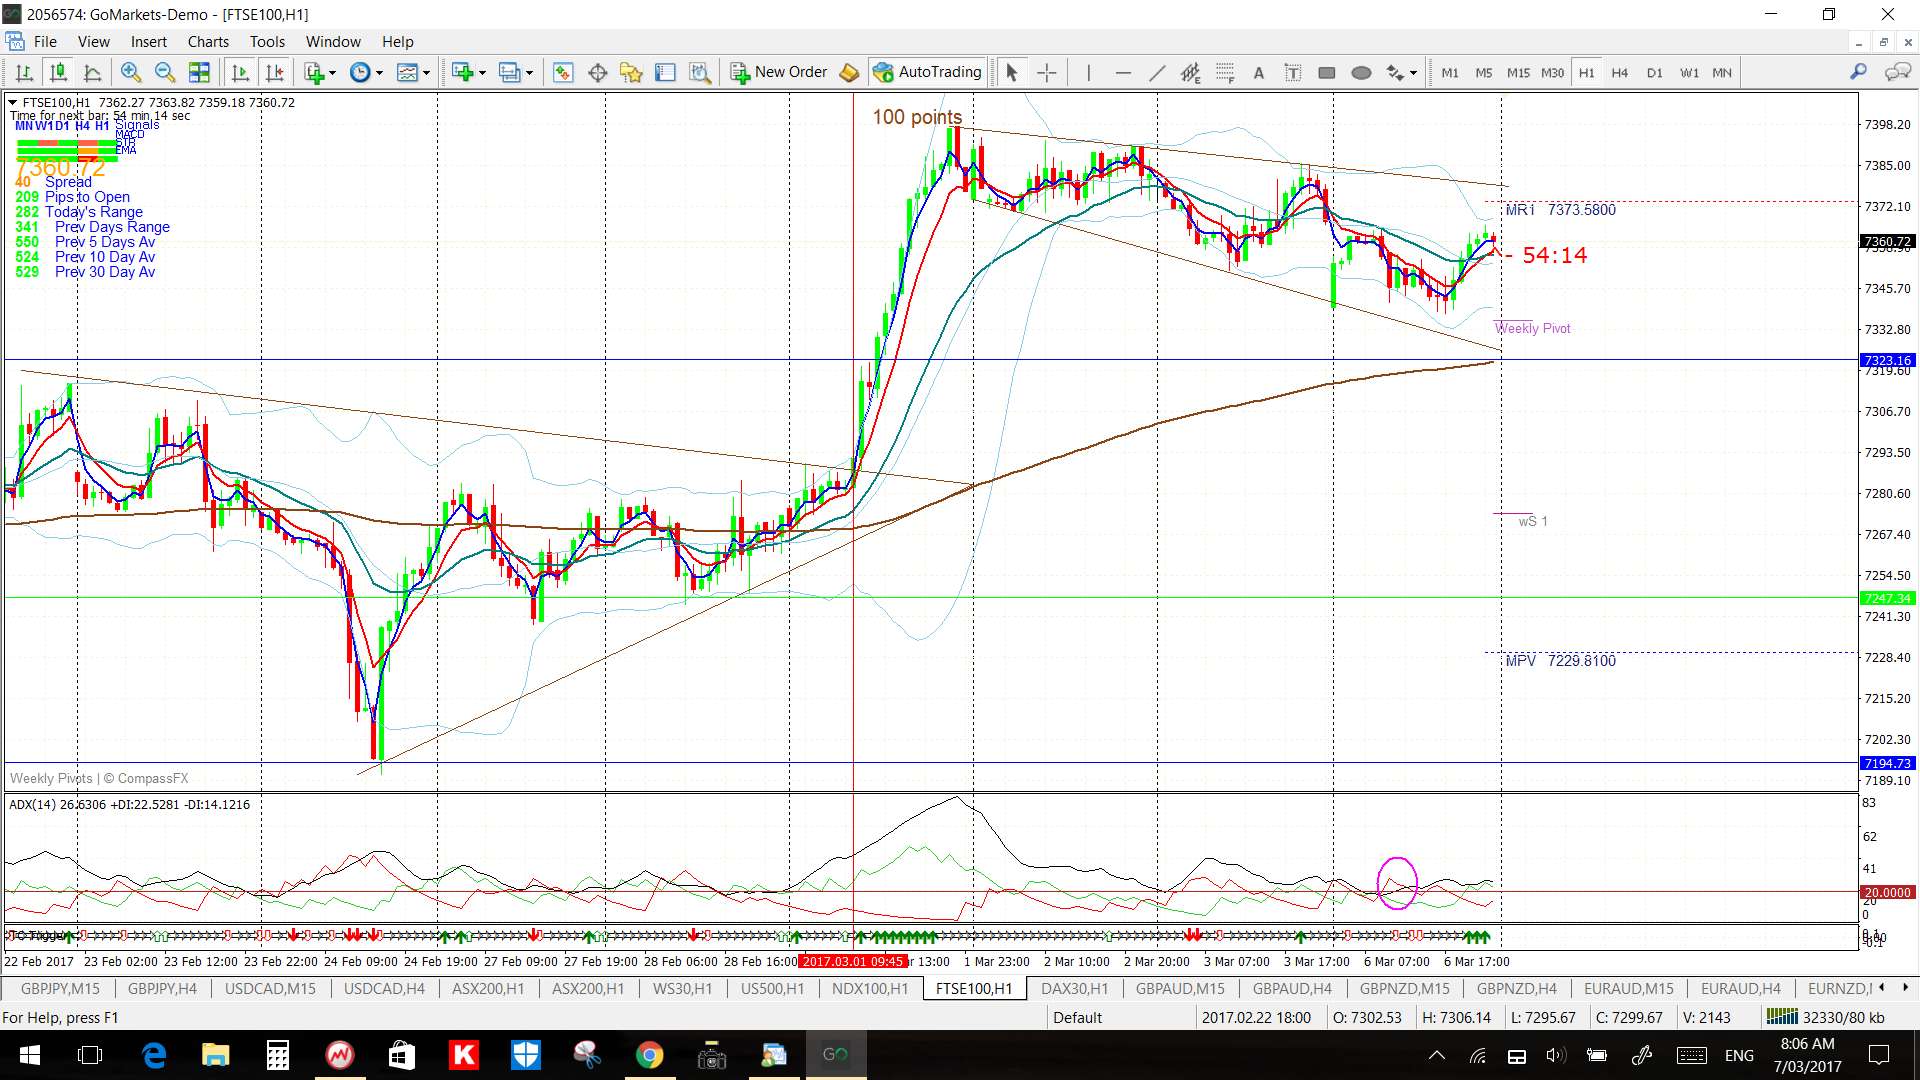
The 60 min charts: no breakouts were triggered during Monday’s session:
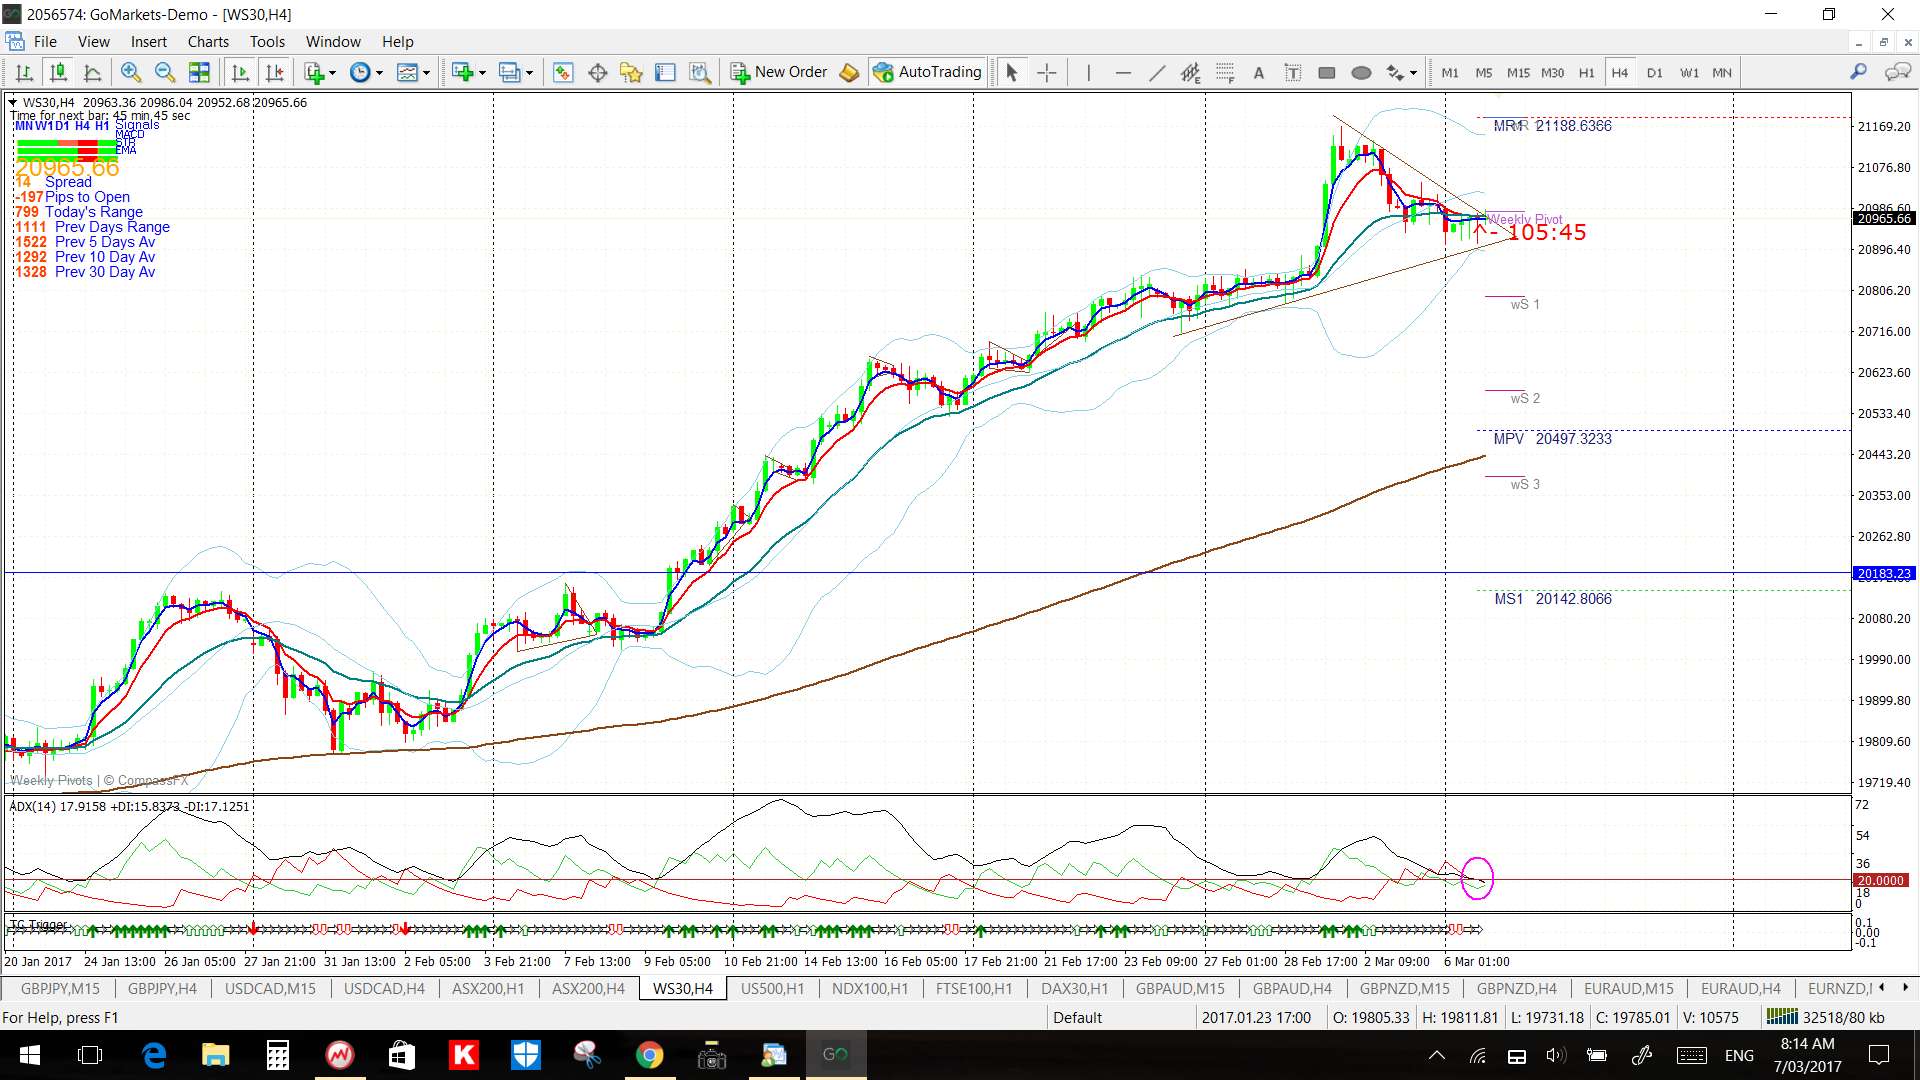
DJIA 60 min:
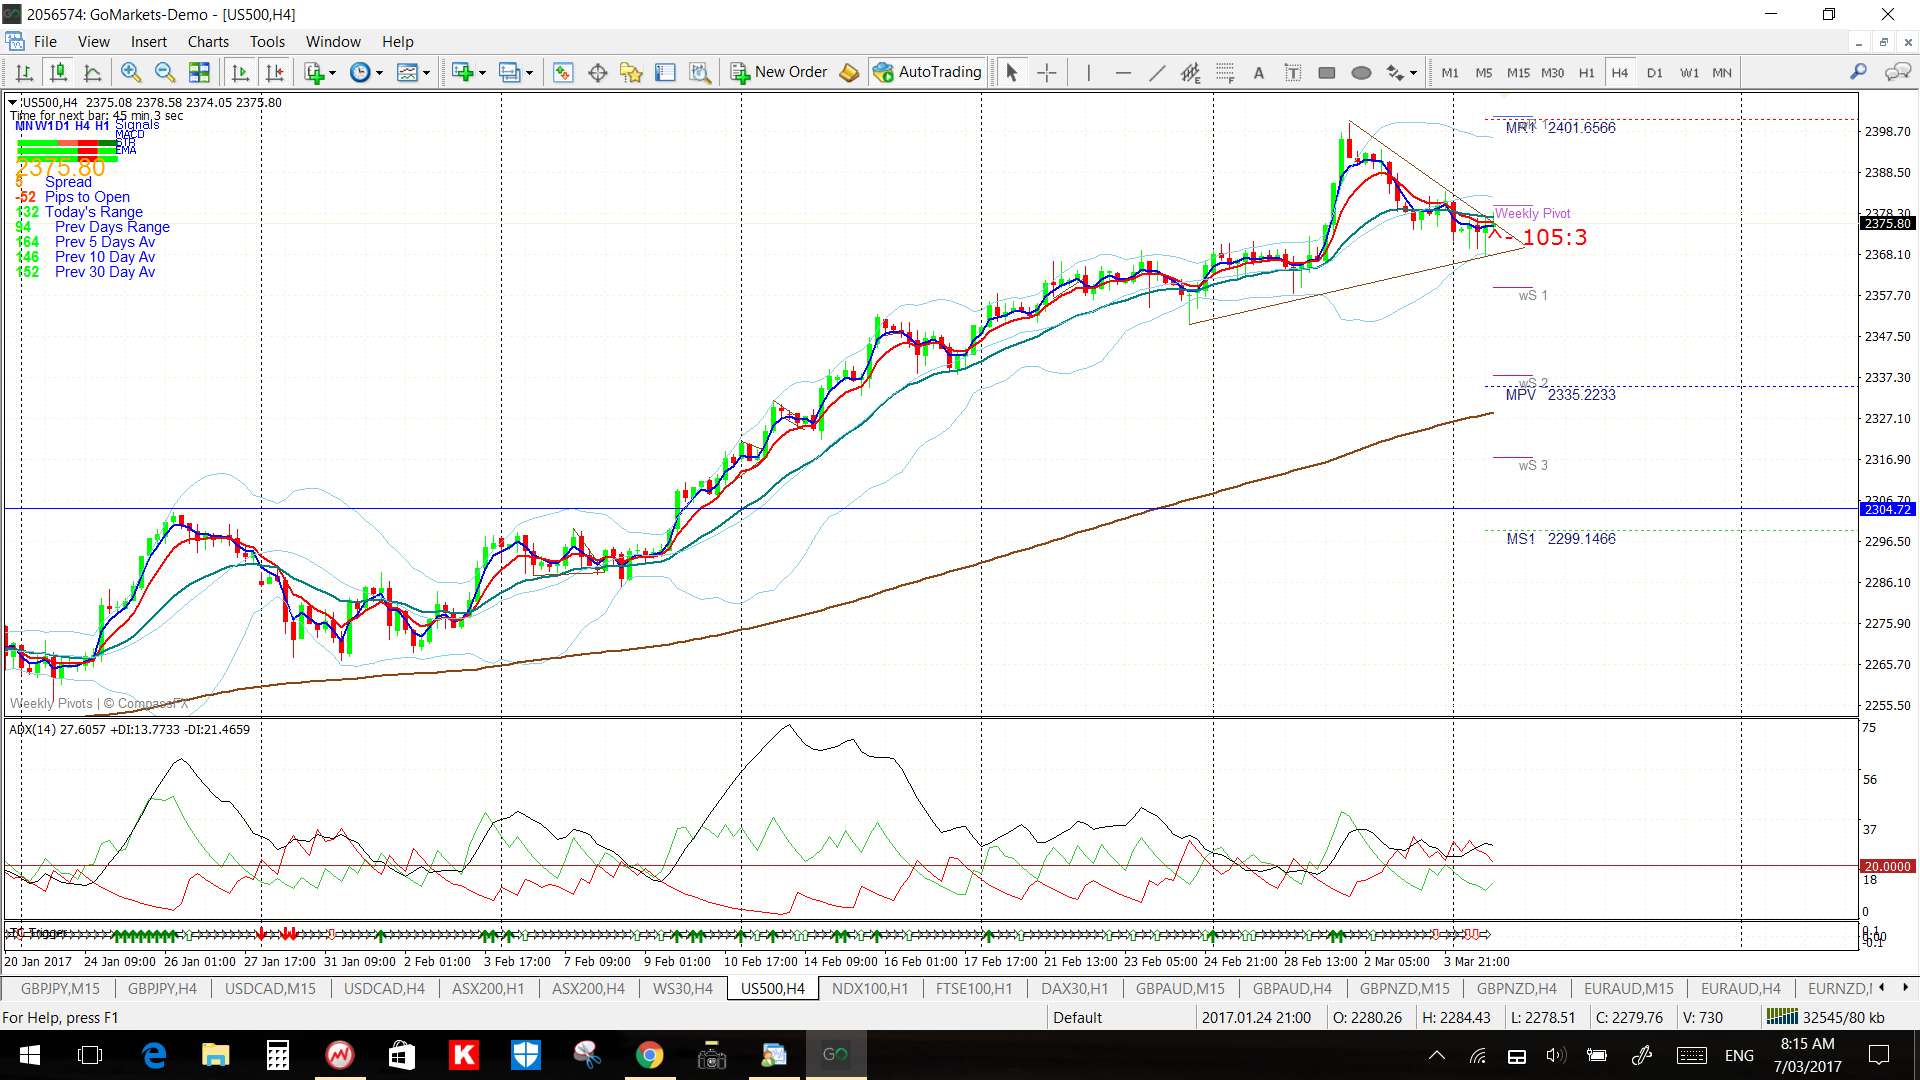
S&P500 60 min:
NASDAQ-100 60 min:
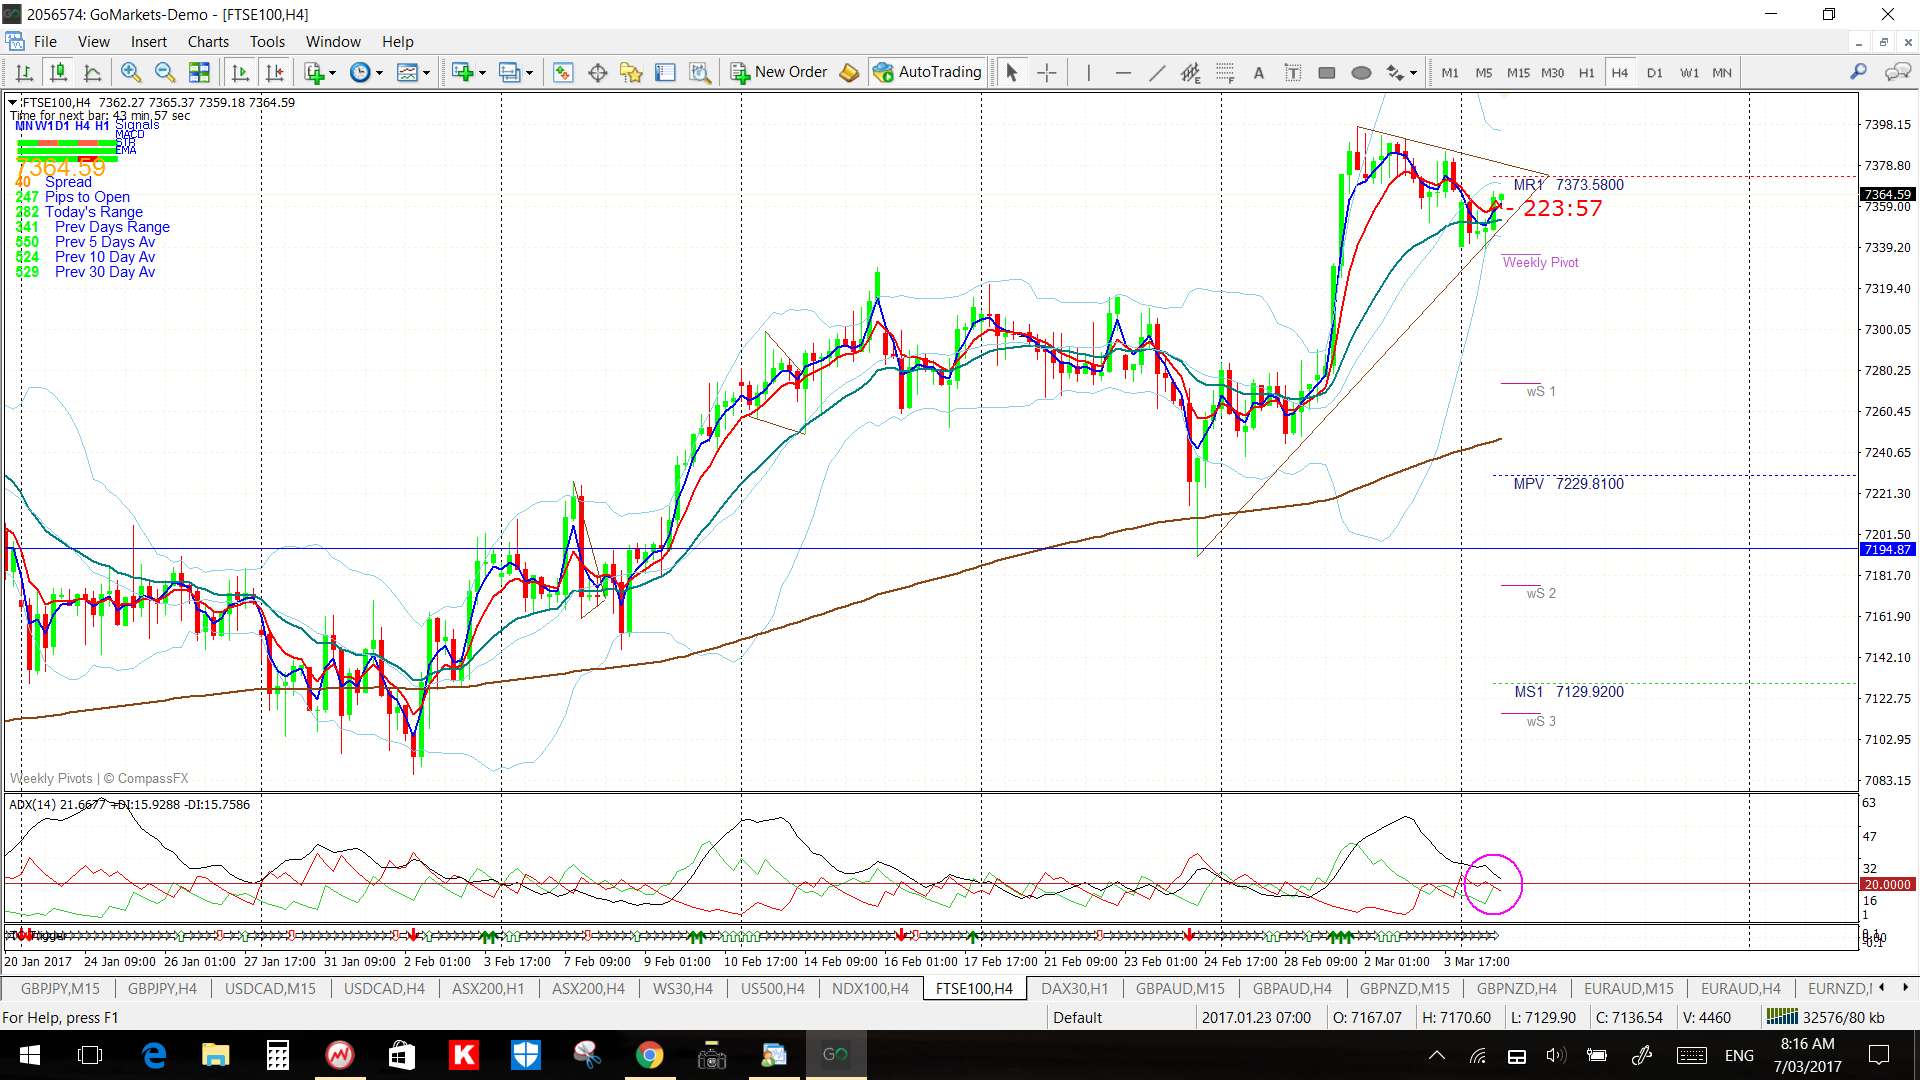
FTSE-100 60 min:
DAX-30 60 min:

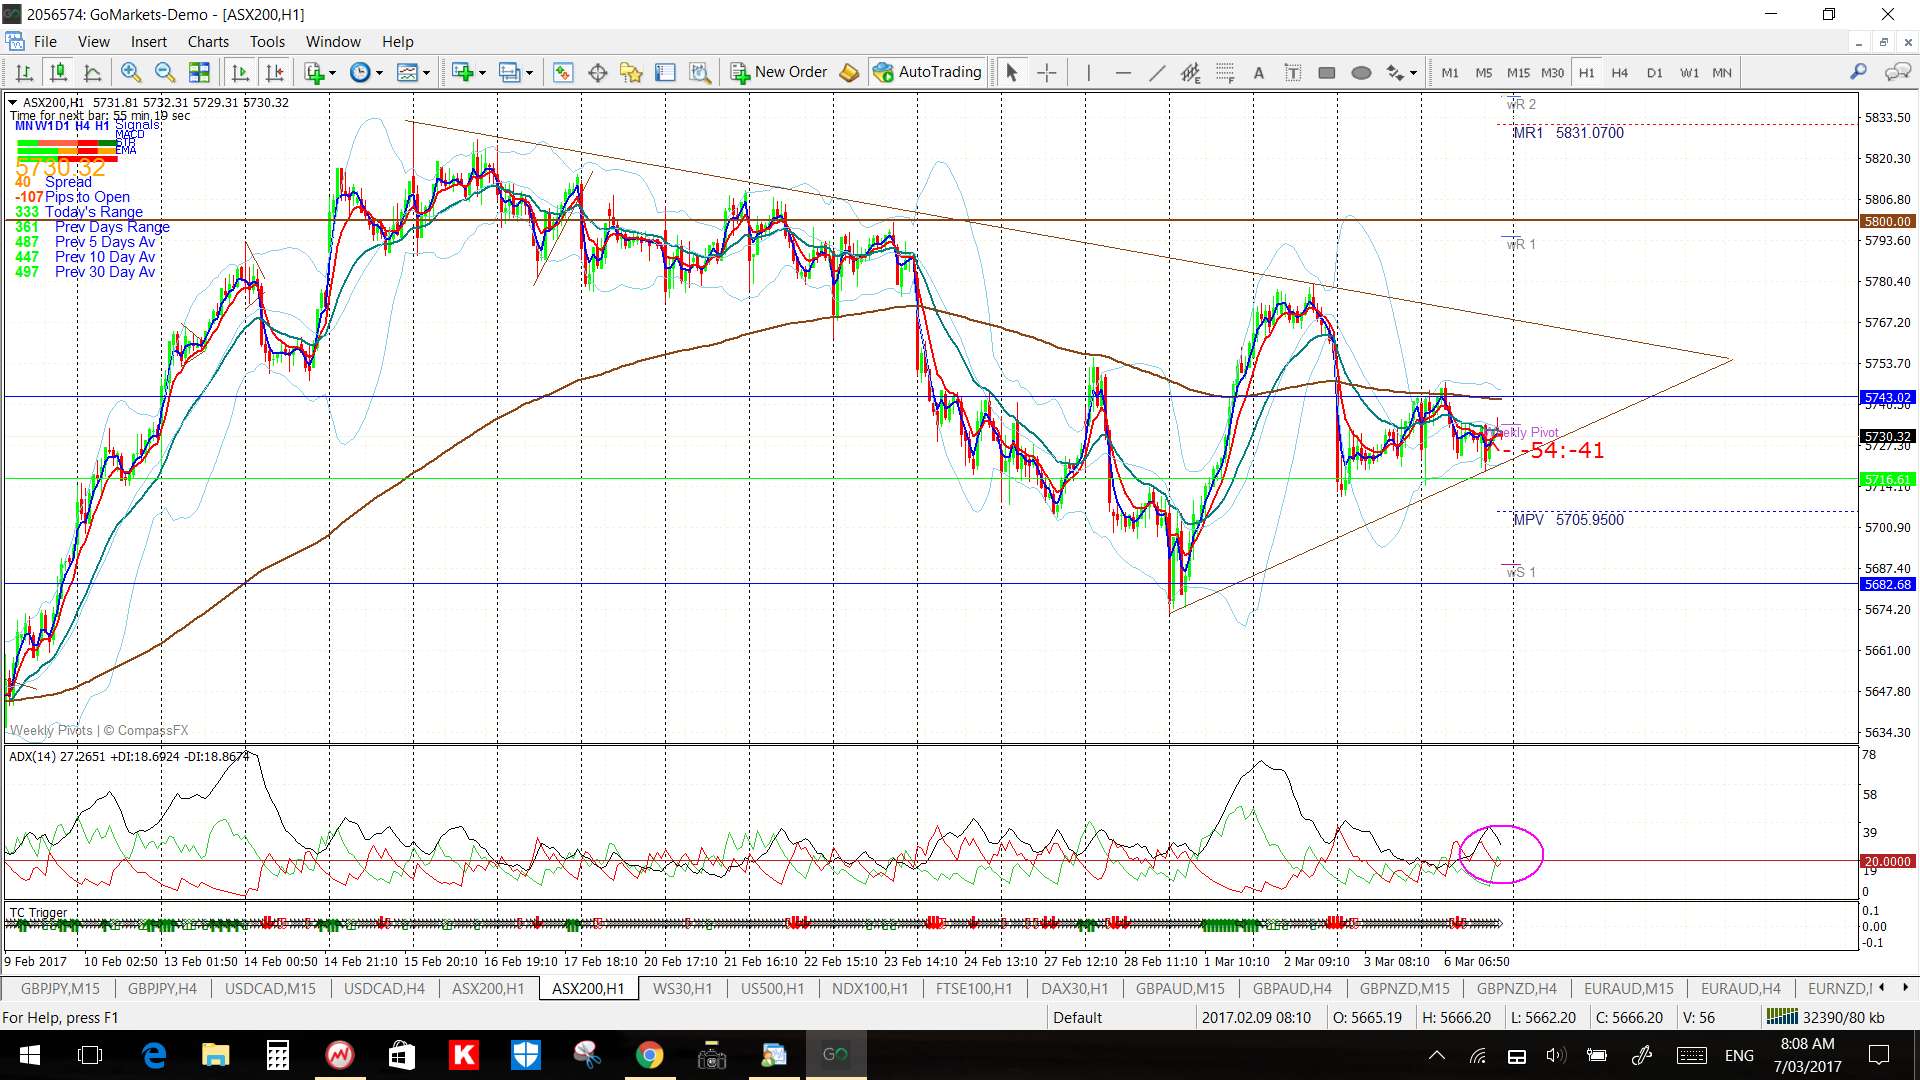
ASX-200 60 min:
The revised 4hr charts: showing new triangle consolidation patterns. The trend lines will be adjusted to accommodate price action, primarily during the Asian session, until such time as a momentum-based breakout is noted. Watch for any momentum-based trend line breakout:
DJIA 4hr:
S&P500 4hr:
NASDAQ-100 4hr:

FTSE-100 4hr:
DAX-30 4hr:

ASX-200 4hr:

The post Stock Indices & new triangles. appeared first on Trade Charting.
The post Stock Indices & new triangles. appeared first on www.forextell.com.