USDX
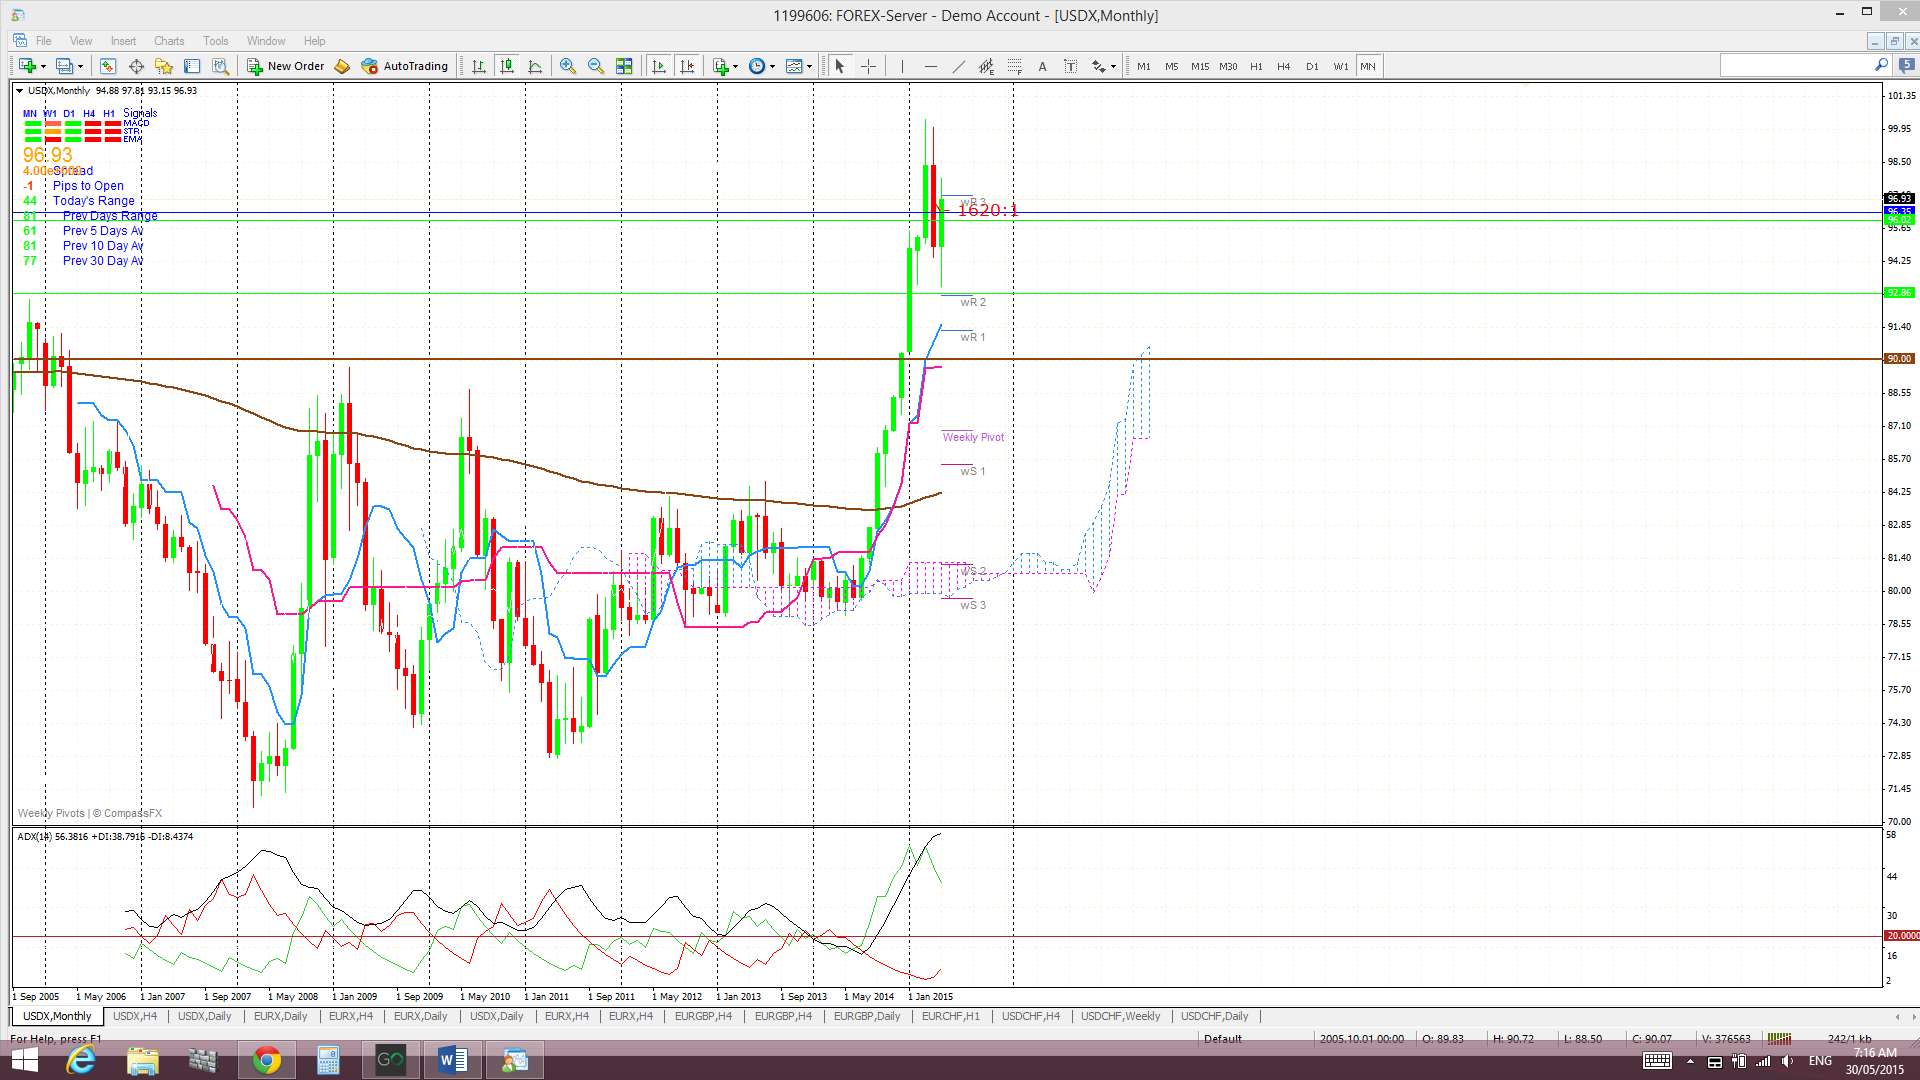
Monthly: The May candle closed as a bullish coloured ‘inside’ candle. This recovery isn’t too surprising however given the size of the large bearish candle from April.
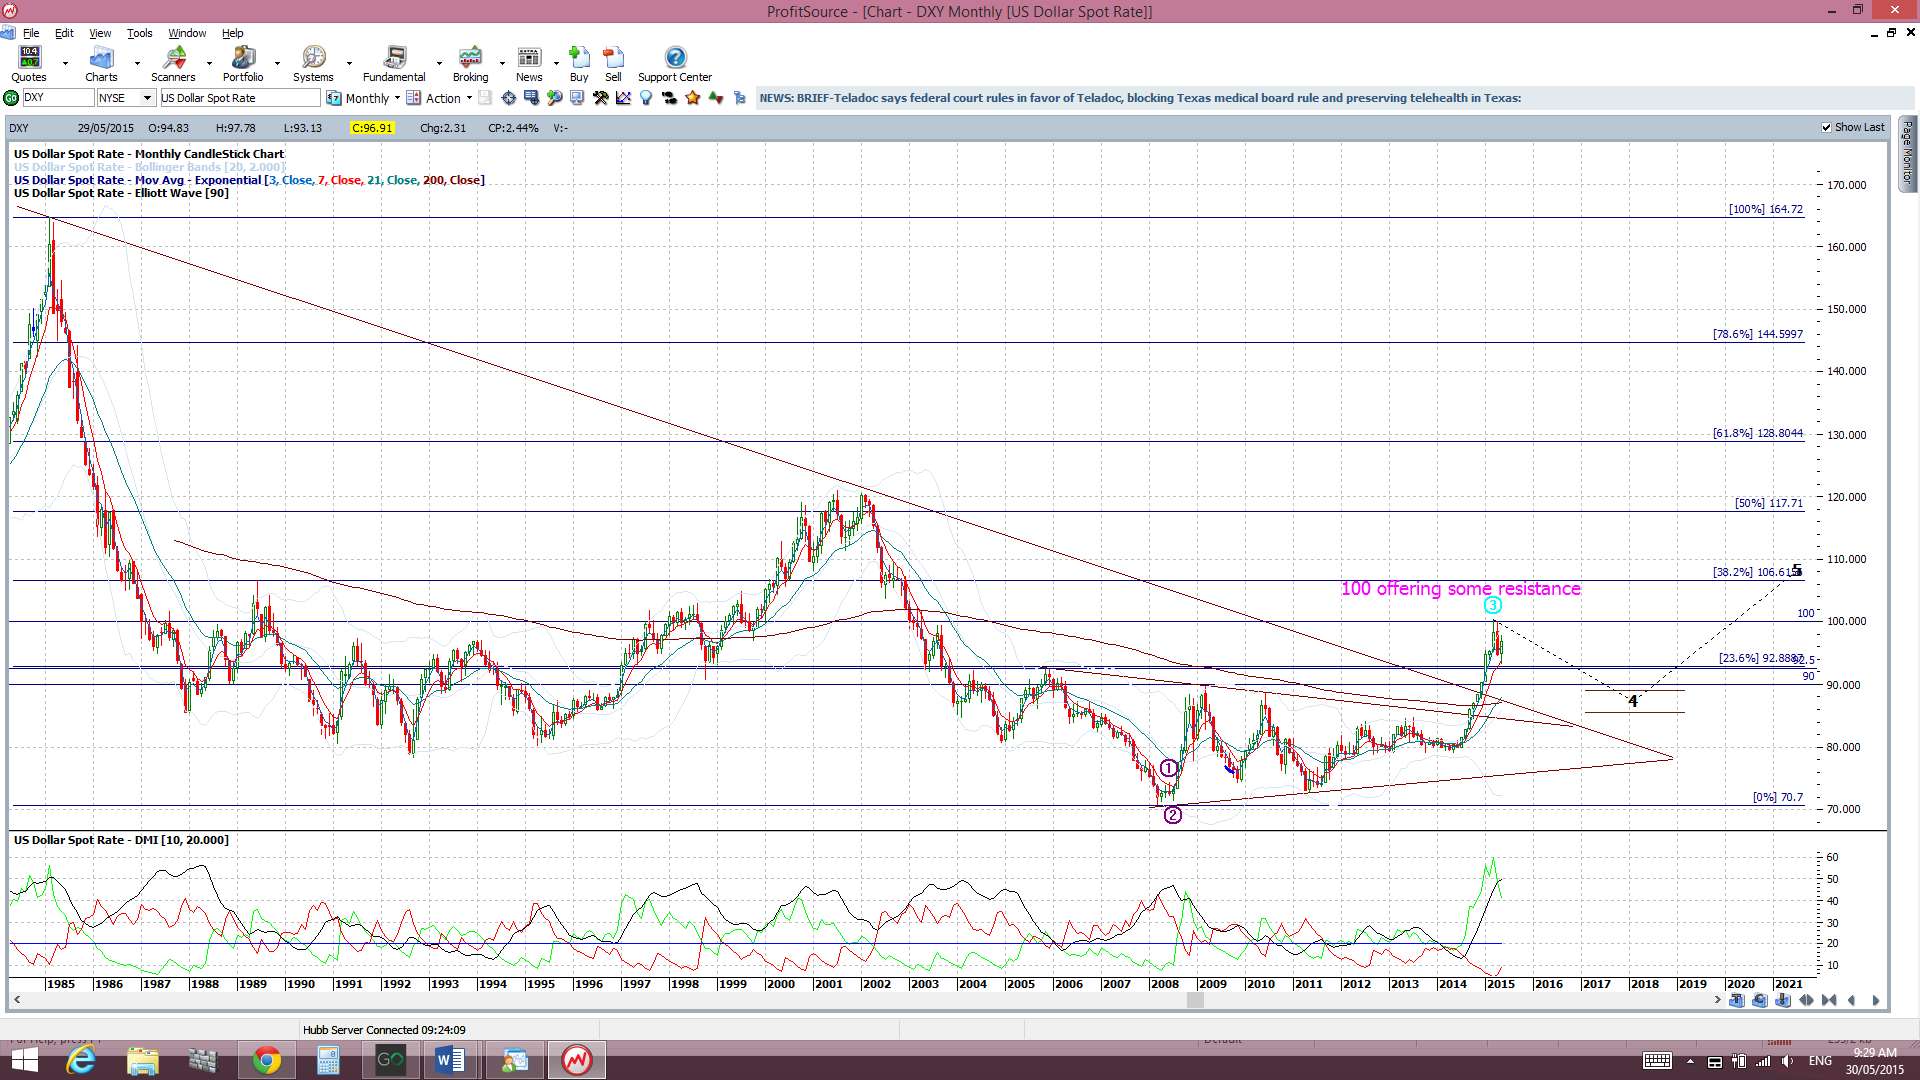
Monthly Ichimoku: The May candle closed above the Cloud.
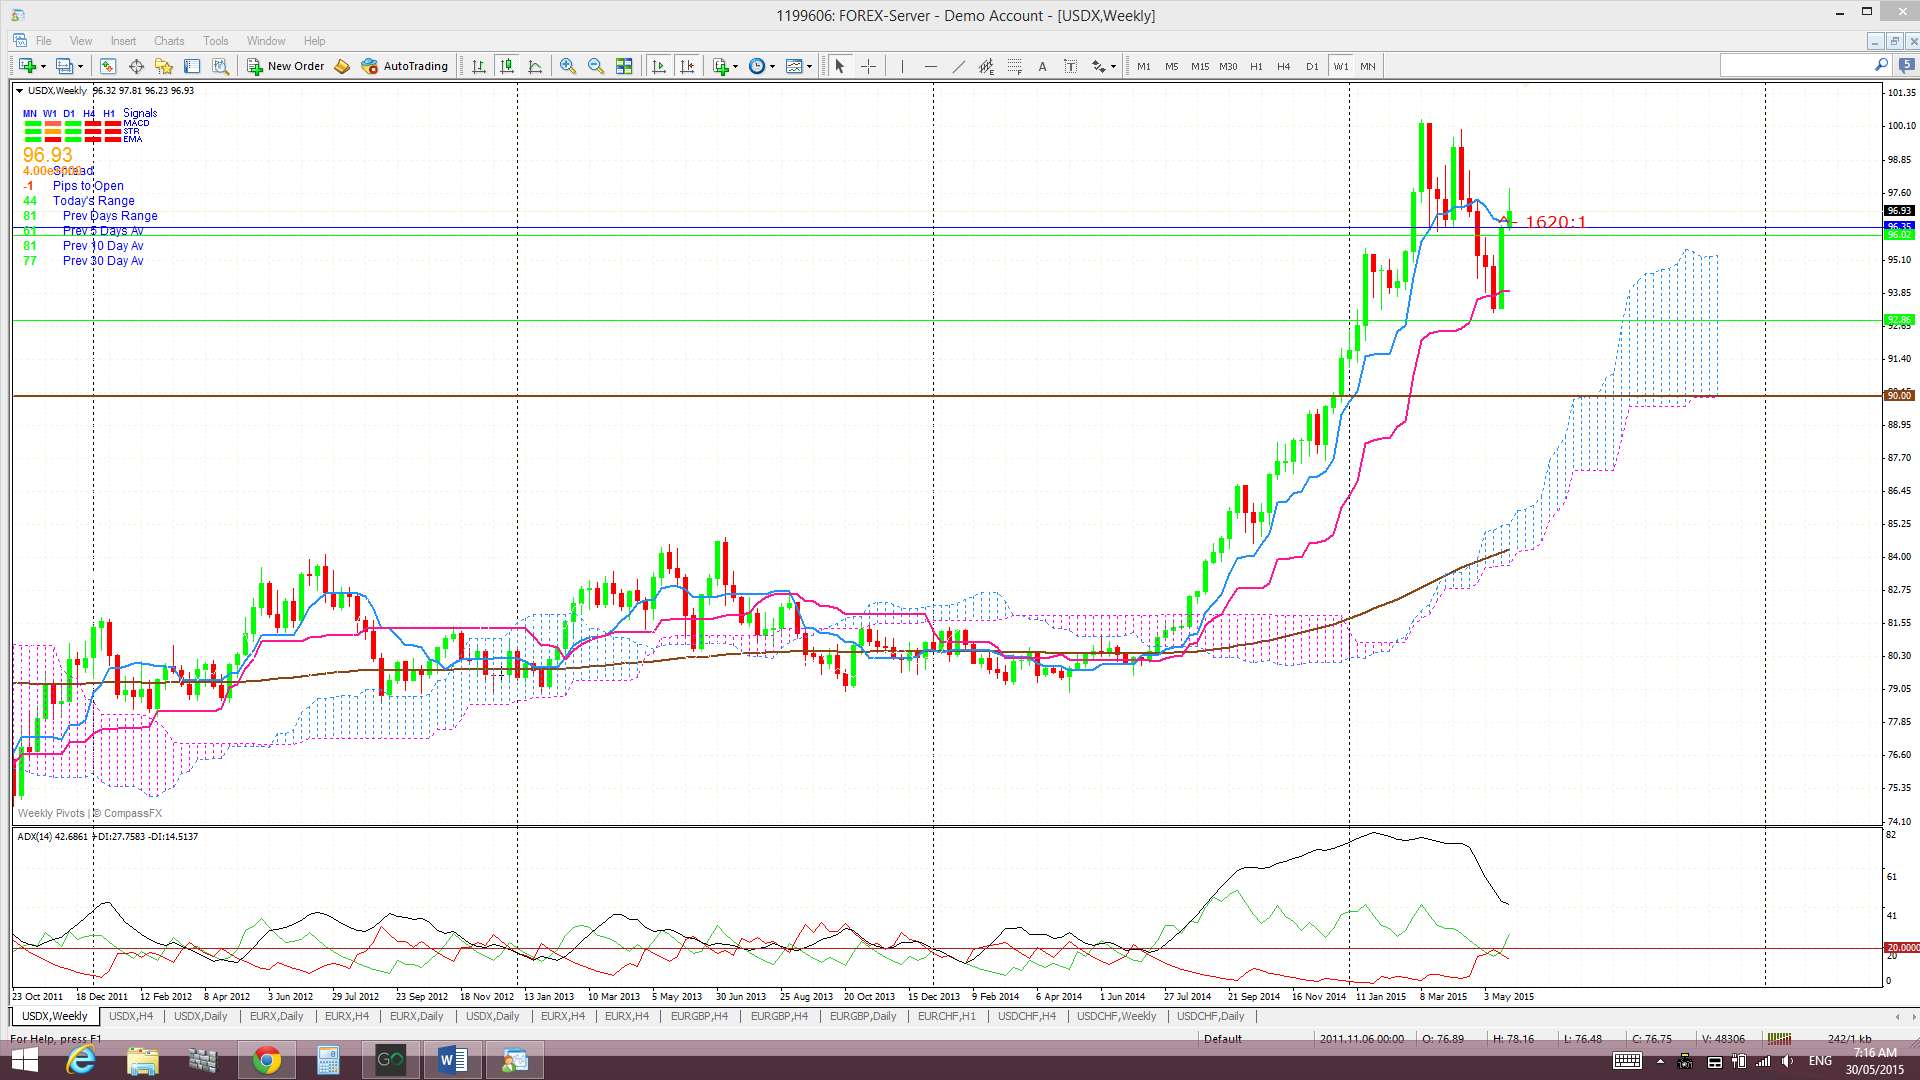
Weekly: Last week’s candle closed as a small bullish candle following on from the previous weeks large, essentially, bullish engulfing candle. It closed above the Double Top ‘neck line’ of 96.50 but below the 61.8% fib of the recent swing low move. It is worth remembering that a 61.8% fib pull back of this lengthy US$ rally would bring price down to near the previous monthly triangle breakout region.
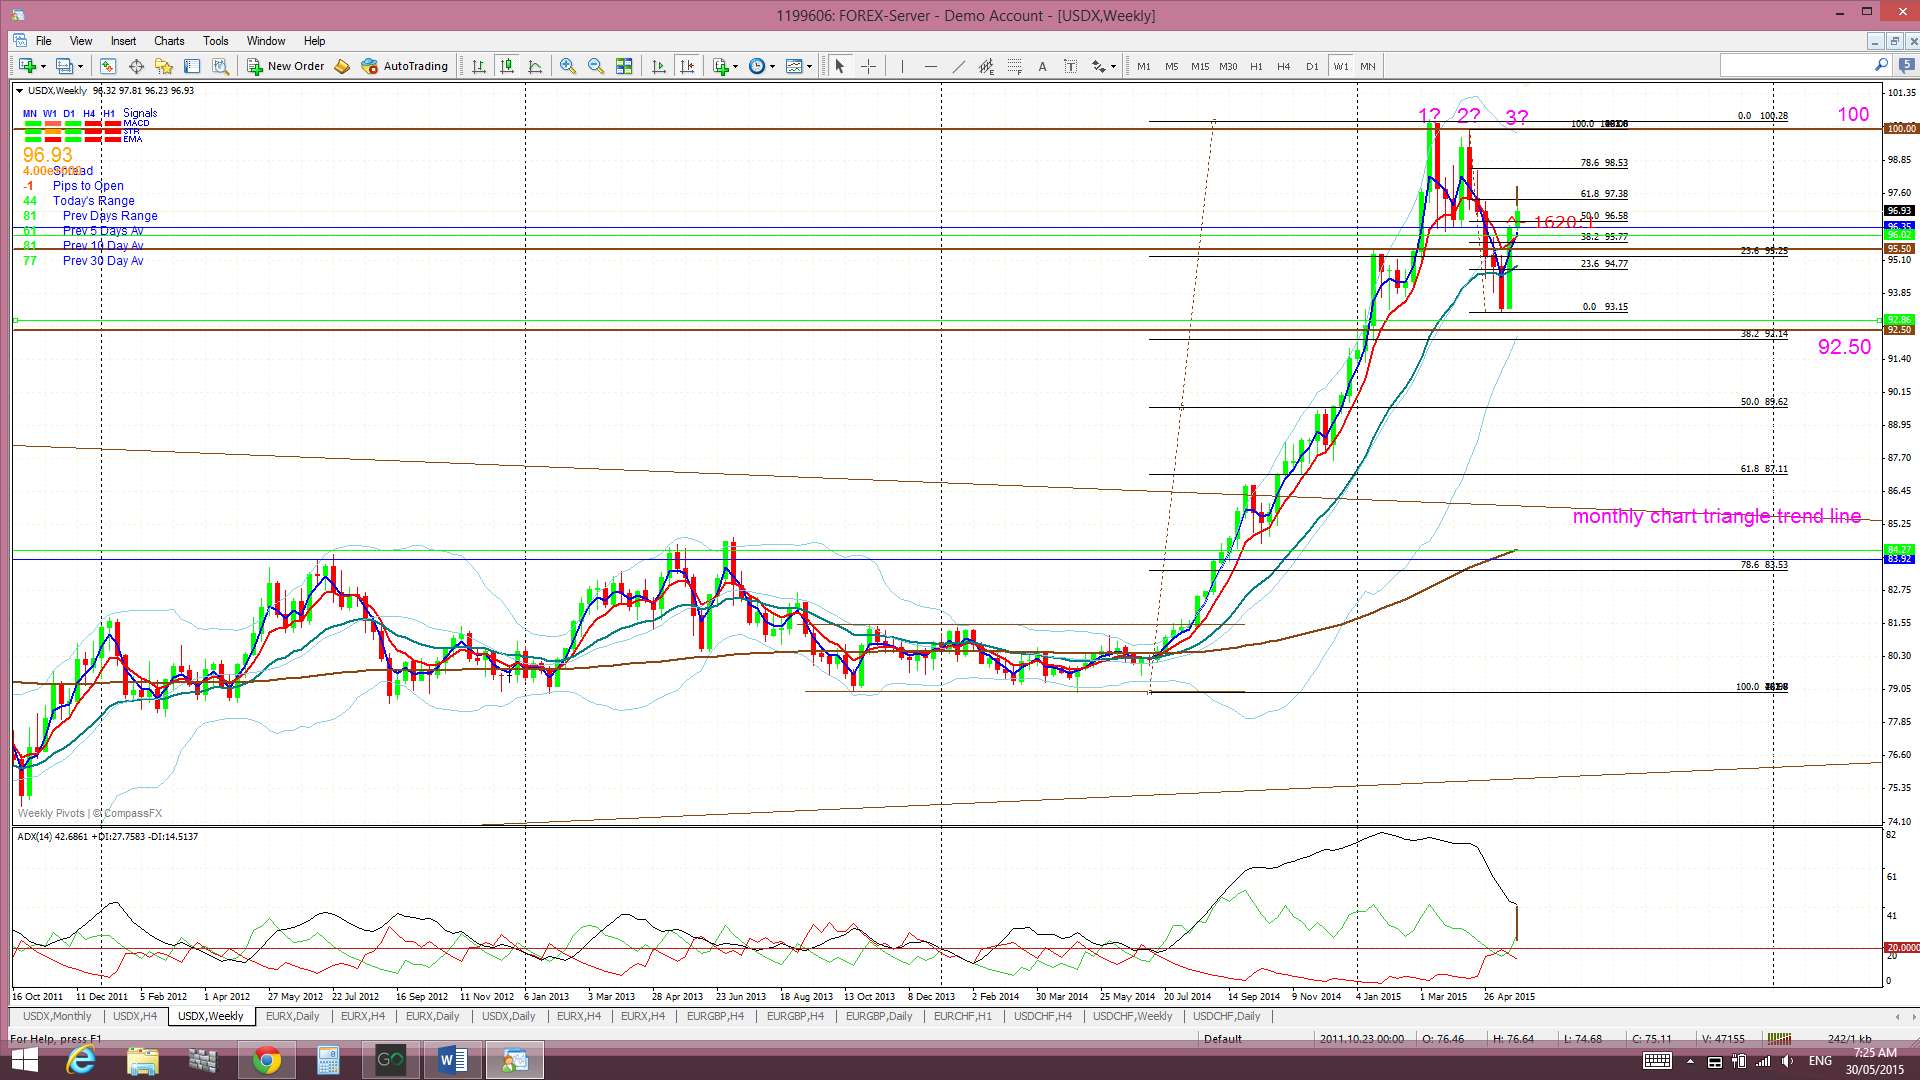
Weekly Ichimoku: The weekly candle closed ABOVE the weekly Cloud.
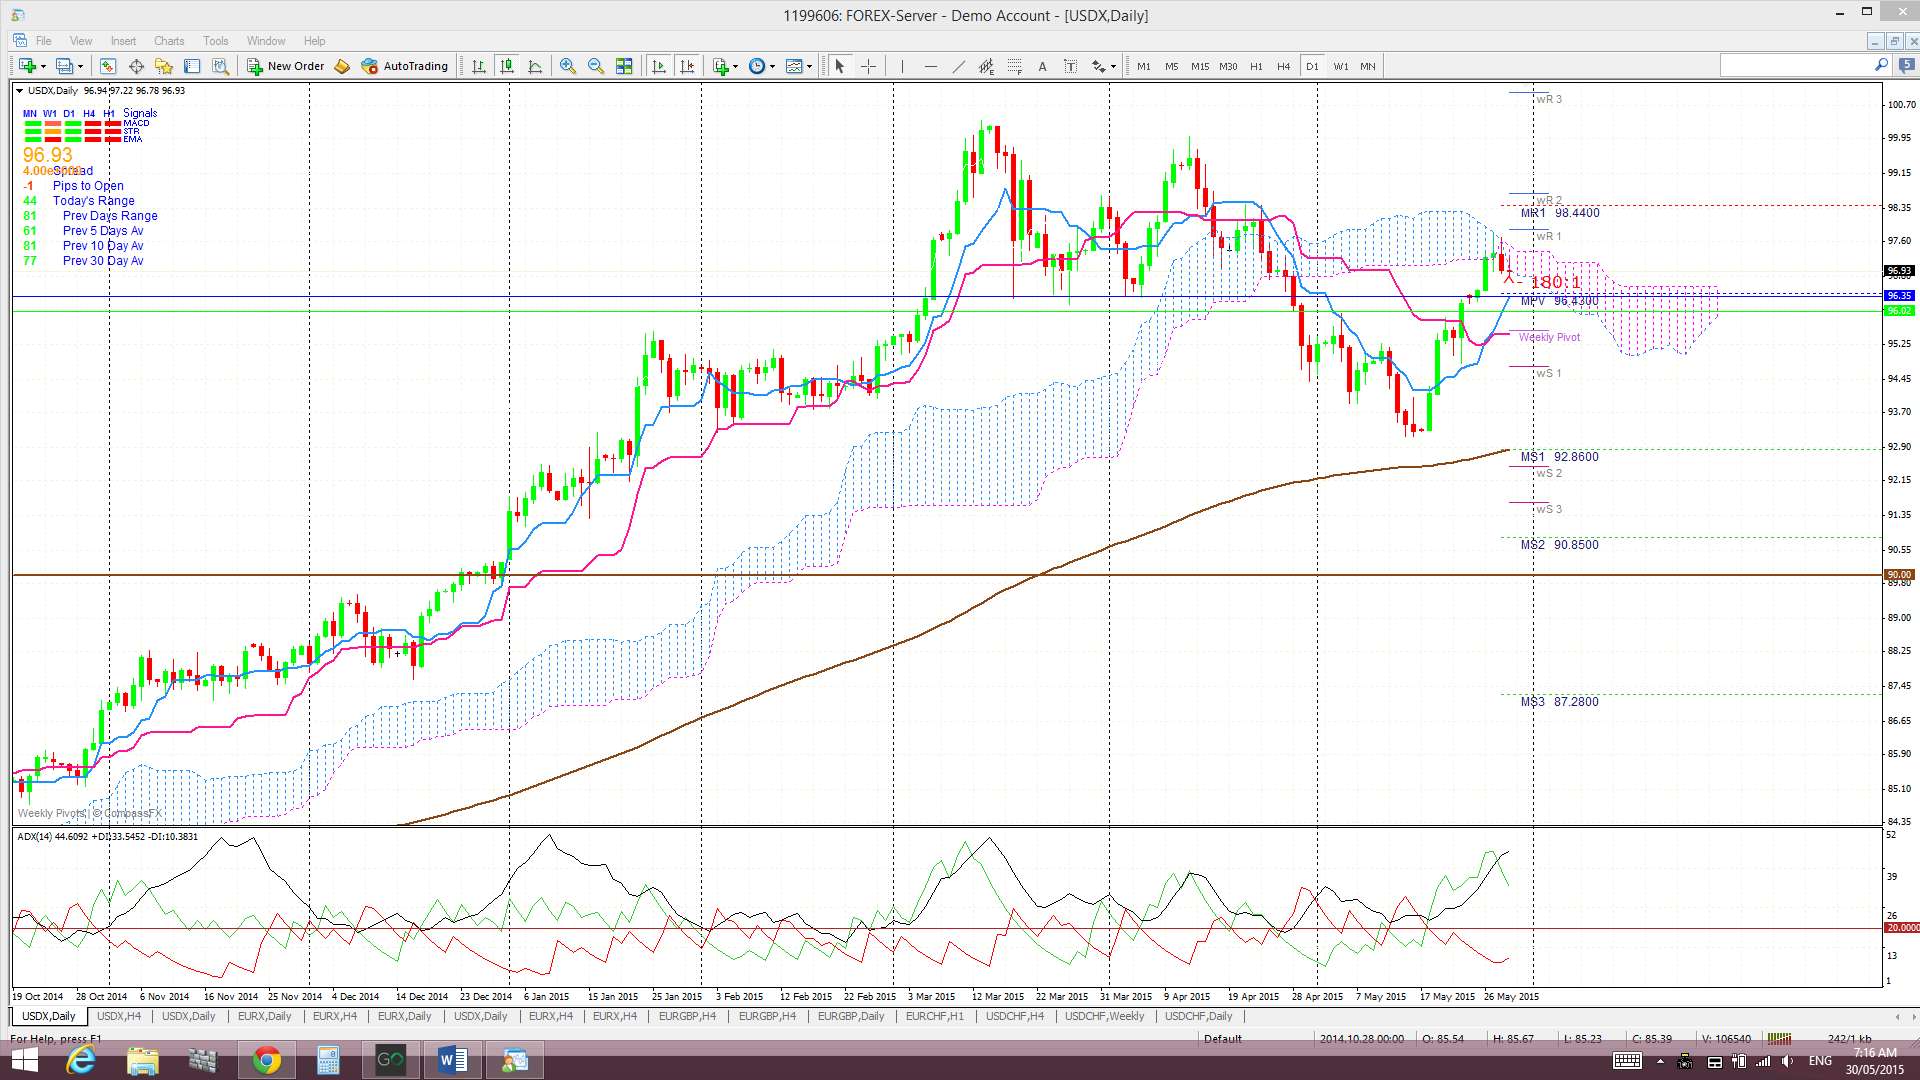
Daily: Price chopped higher last week but the 100 level remains as resistance above current price. Price has been stuck in a range above 92.50 and below 100 now for over 4 months and this ‘no-man’s land’ region really needs to be broken to free up the US$. This could be protracted though as the 100 level above now looms with a possible ‘Triple Top’ mantle!

Daily Ichimoku Cloud chart: Price tried to break up through the daily Cloud last week BUT was unsuccessful and remains just under this resistance. Note that there has been a recent bullish Tenkan/Kijun cross though.
4hr: Price chopped higher last week but struggled to break up through the 61.8% fib resistance level. The index closed above the other S/R regions of 96.50 and the monthly pivot though. Chart divergence had pointed to the possible slow-down here but this condensed chart does now have a bit of a ‘Bull Flag’ look to it! A close and hold above the 61.8% fib would support this bullish pattern and suggest continuation on up to the 78.6% fib and, then, the key 100 level:
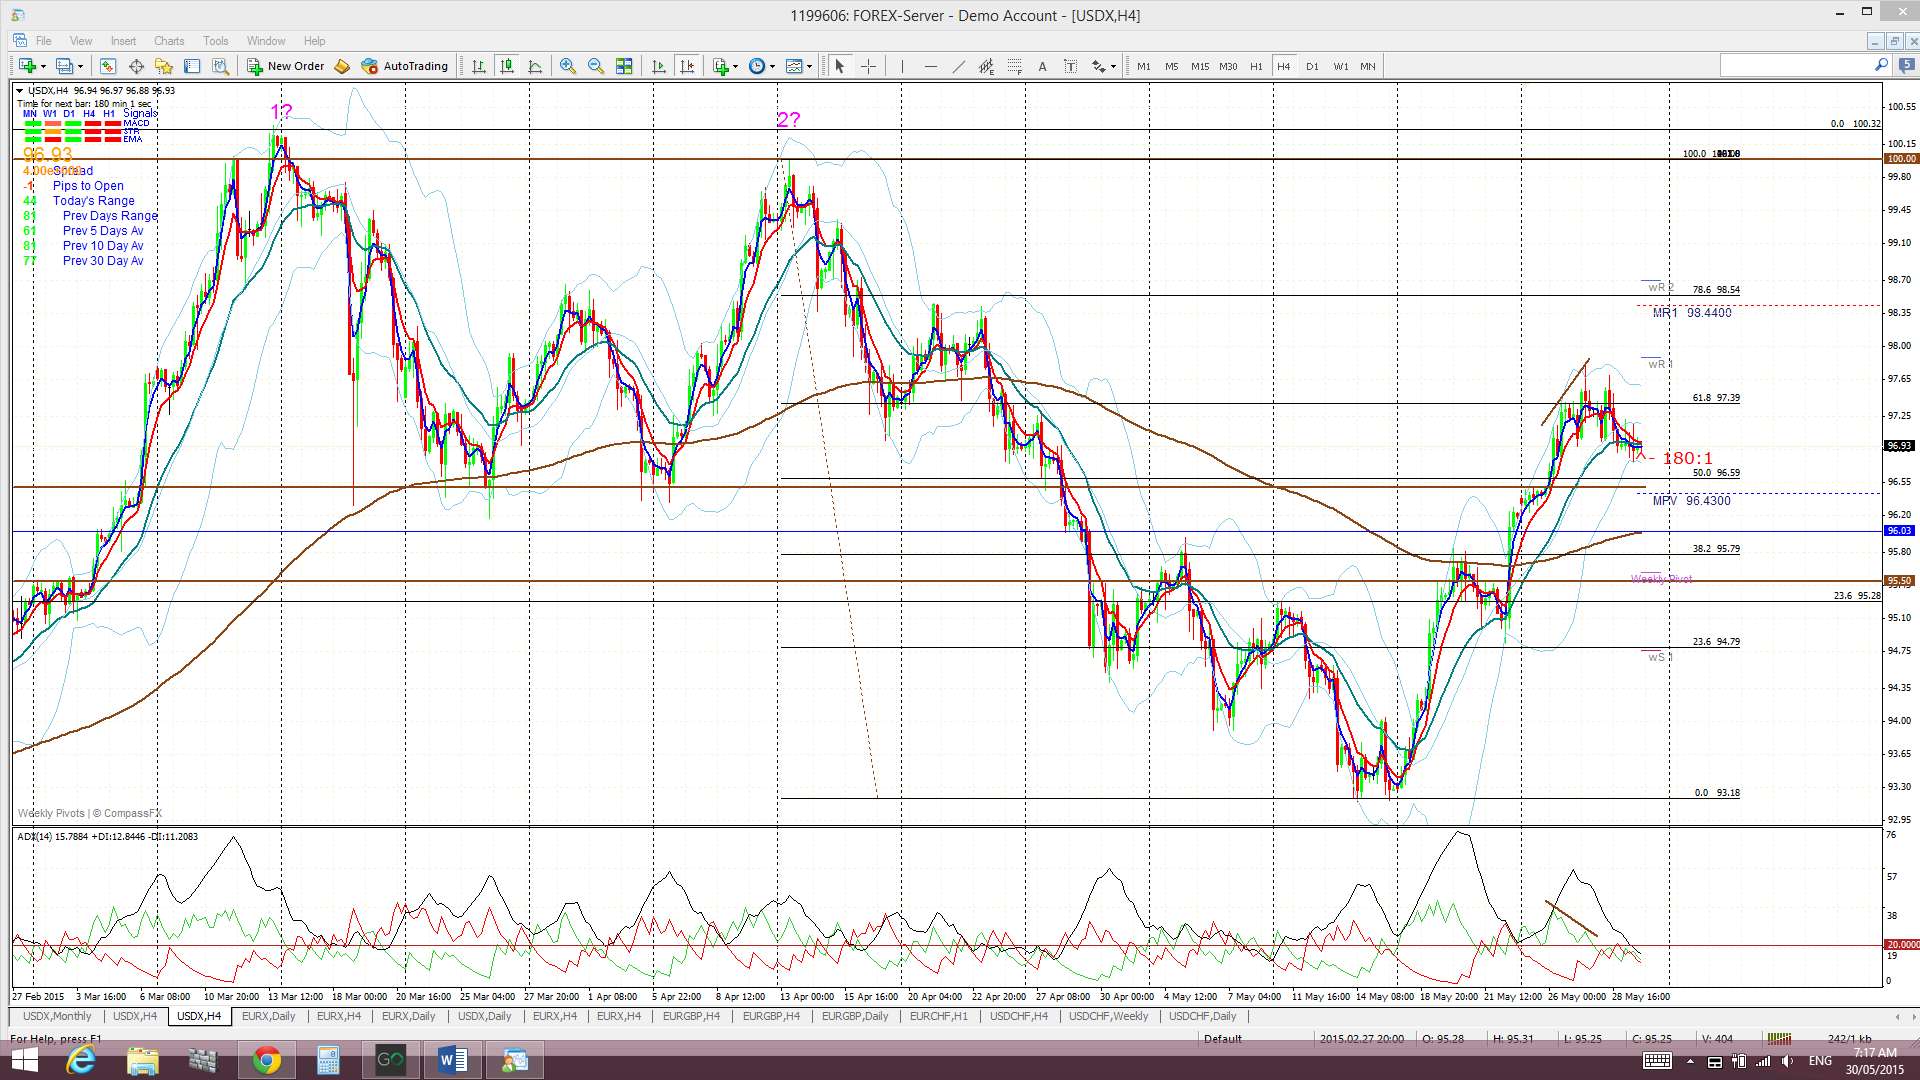
4hr Ichimoku Cloud chart: Price traded above the 4 hr Cloud last week. This chart is divergent from the daily chart and suggests choppiness.
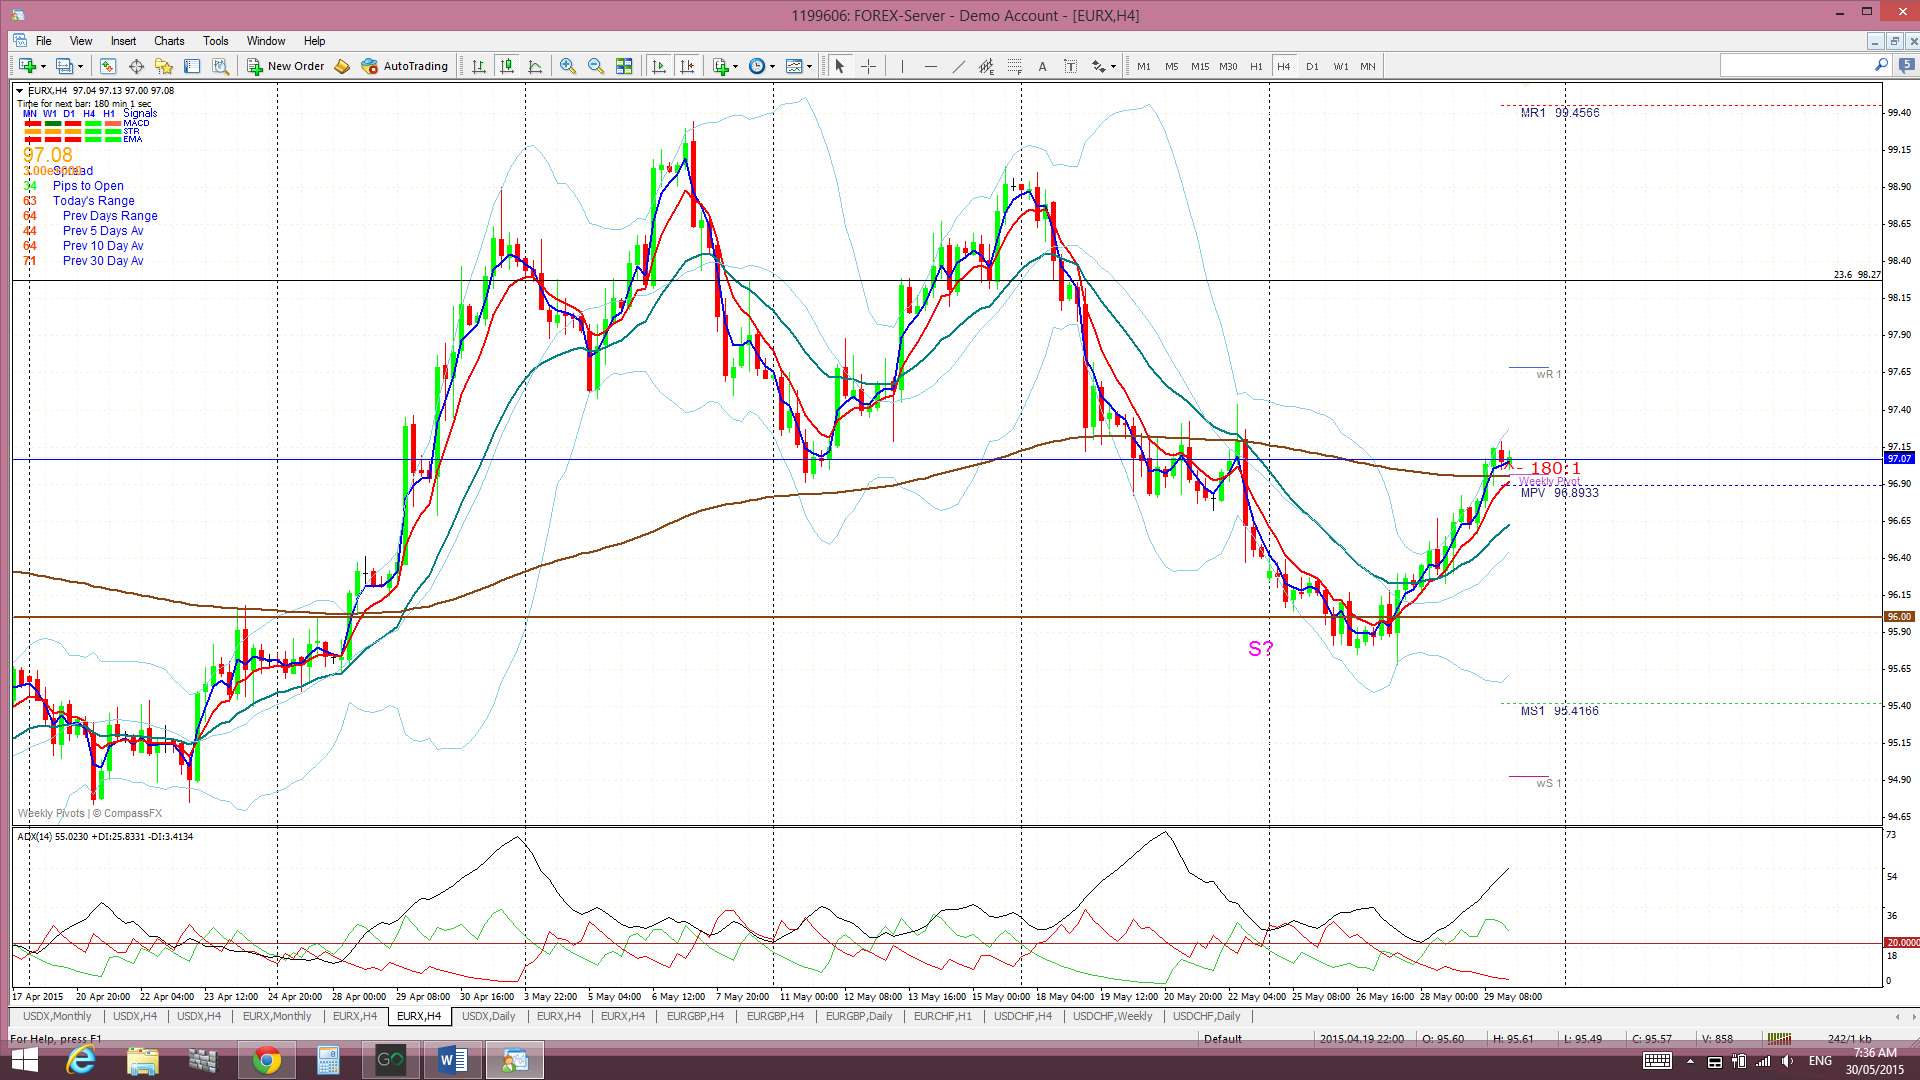
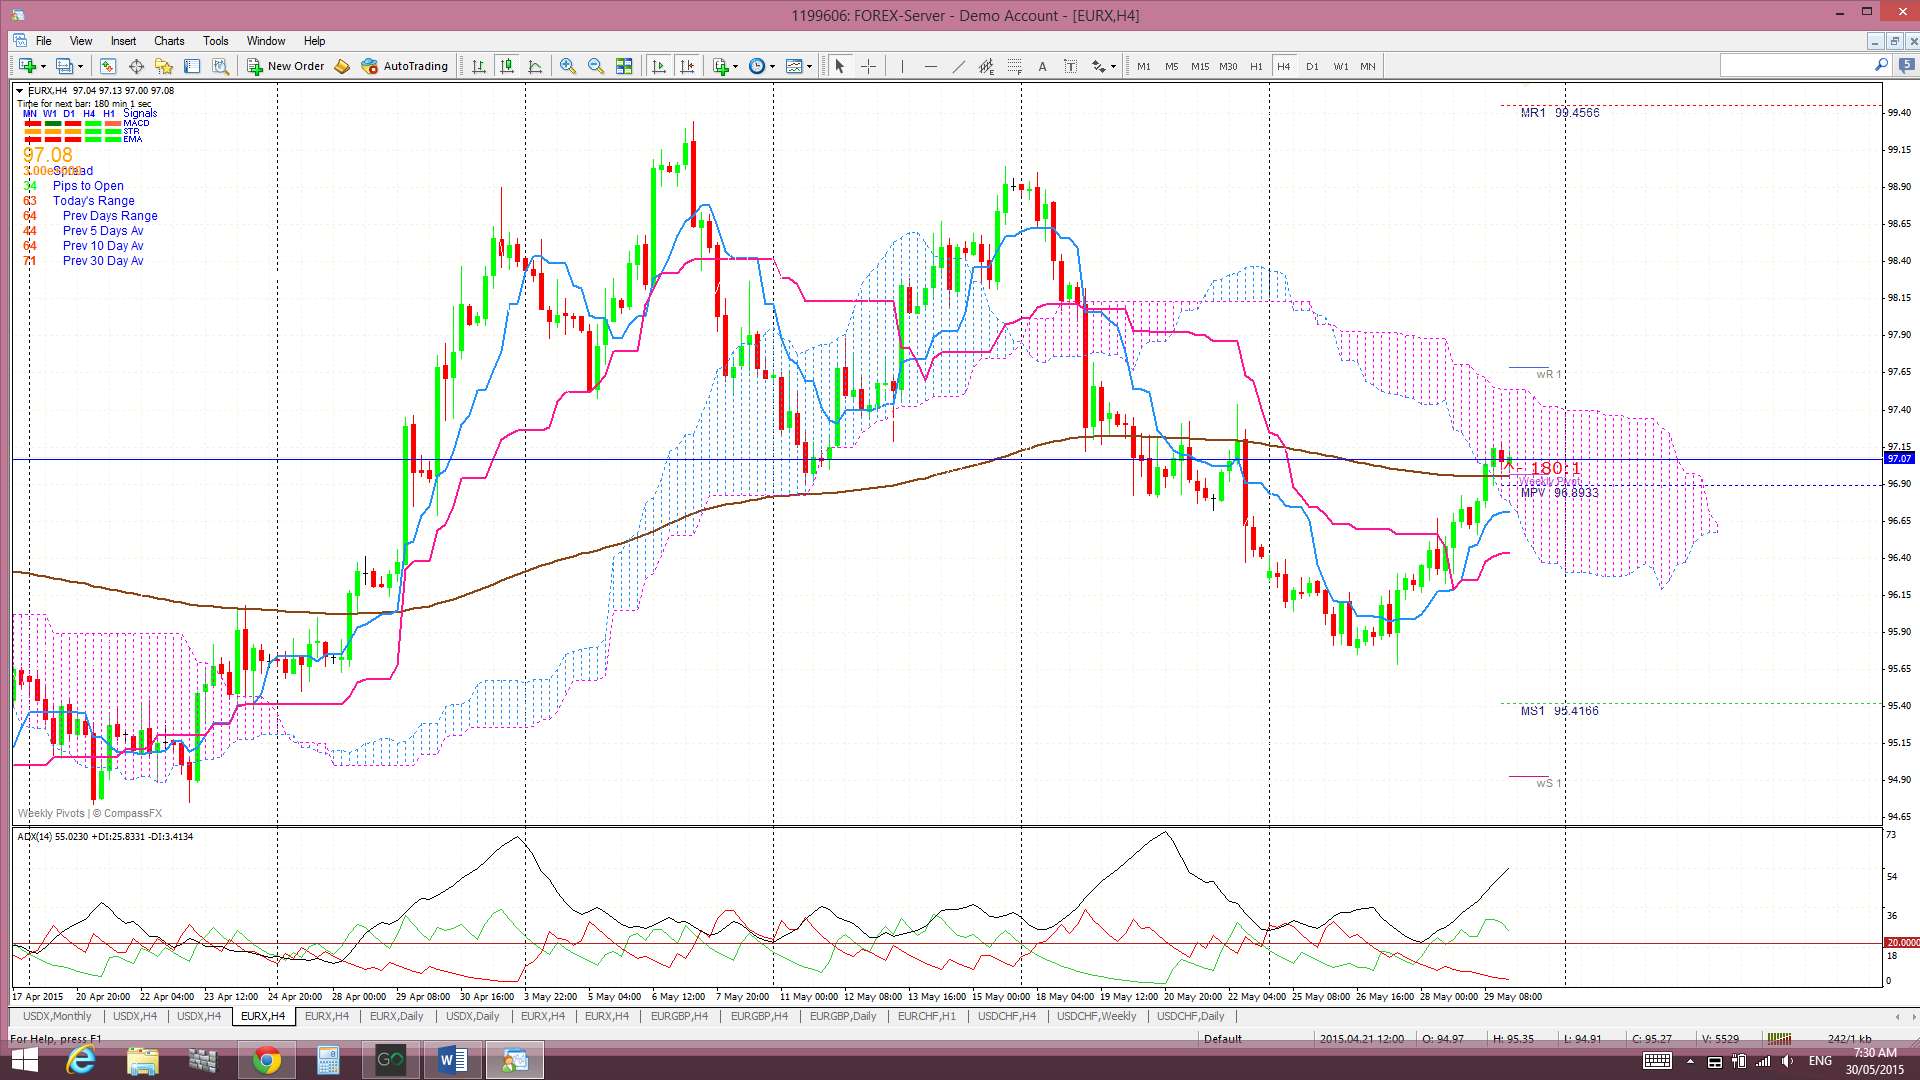
EURX
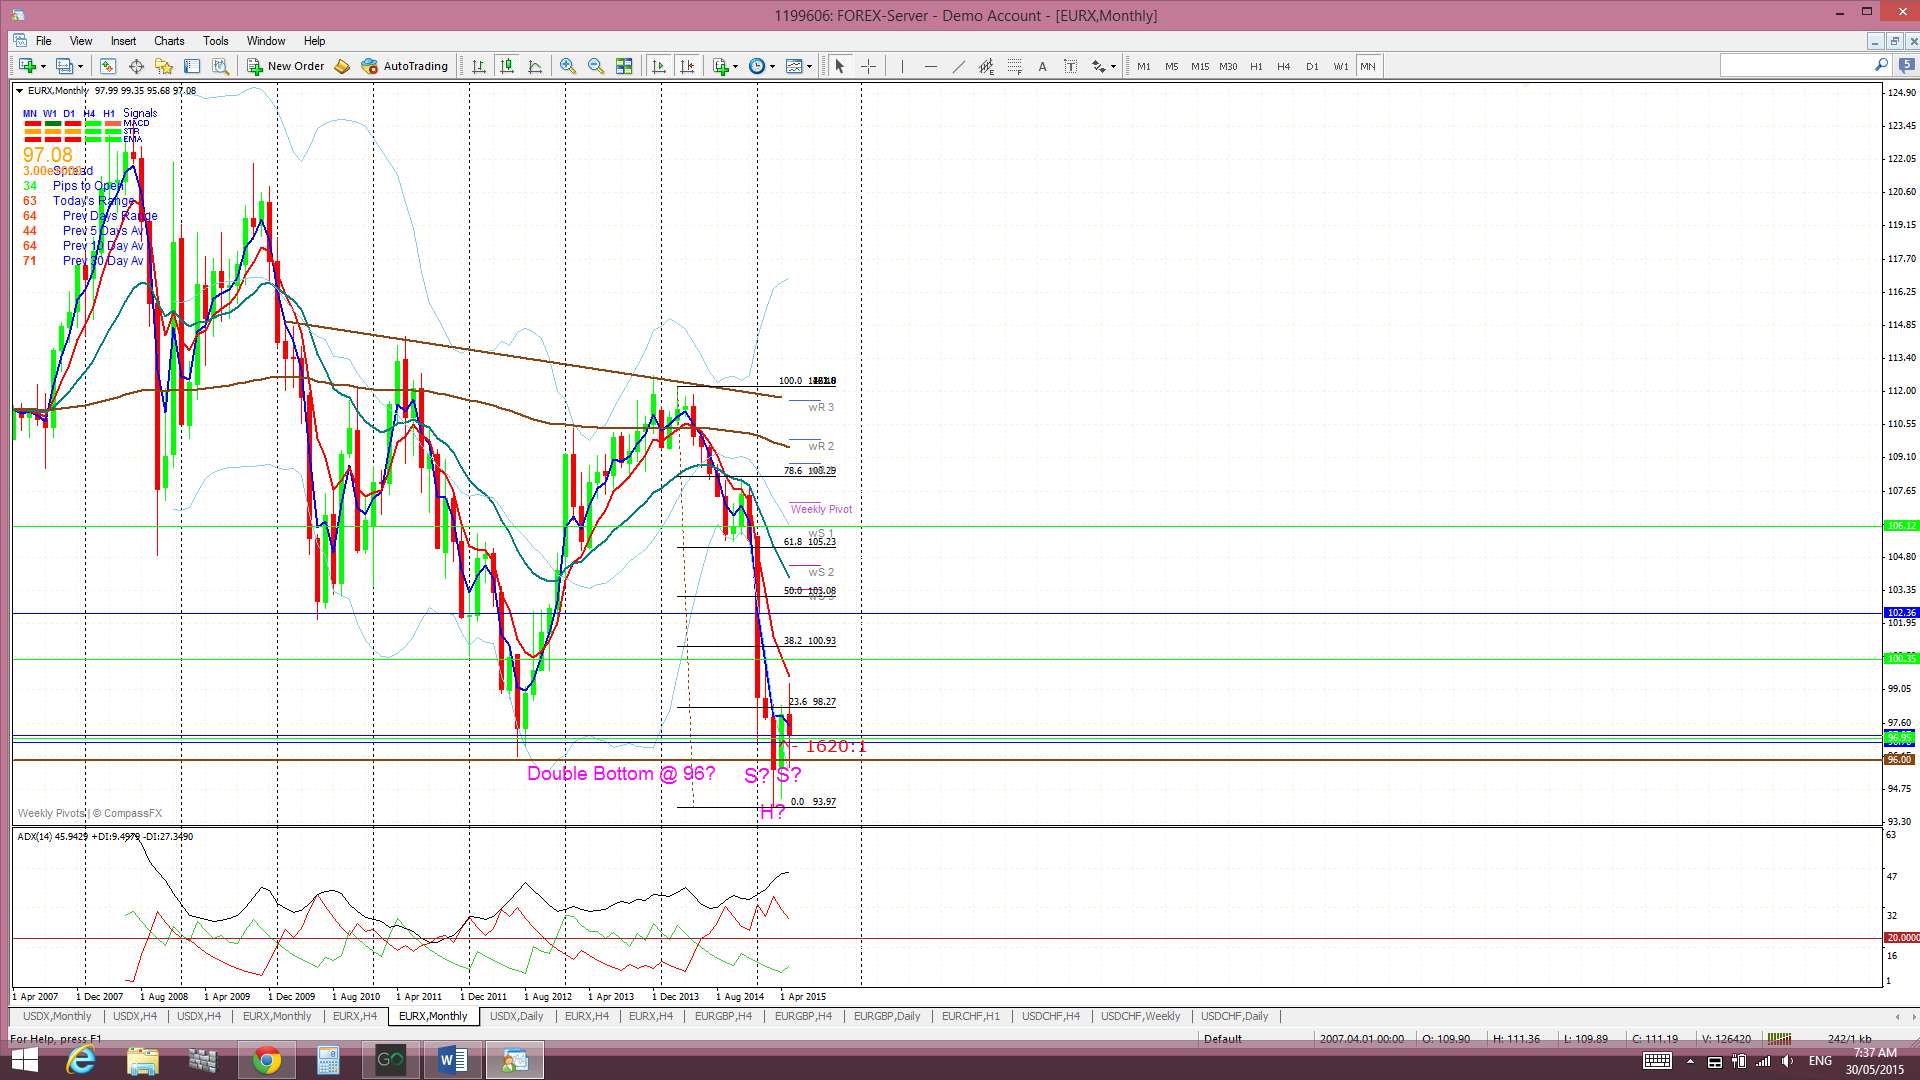
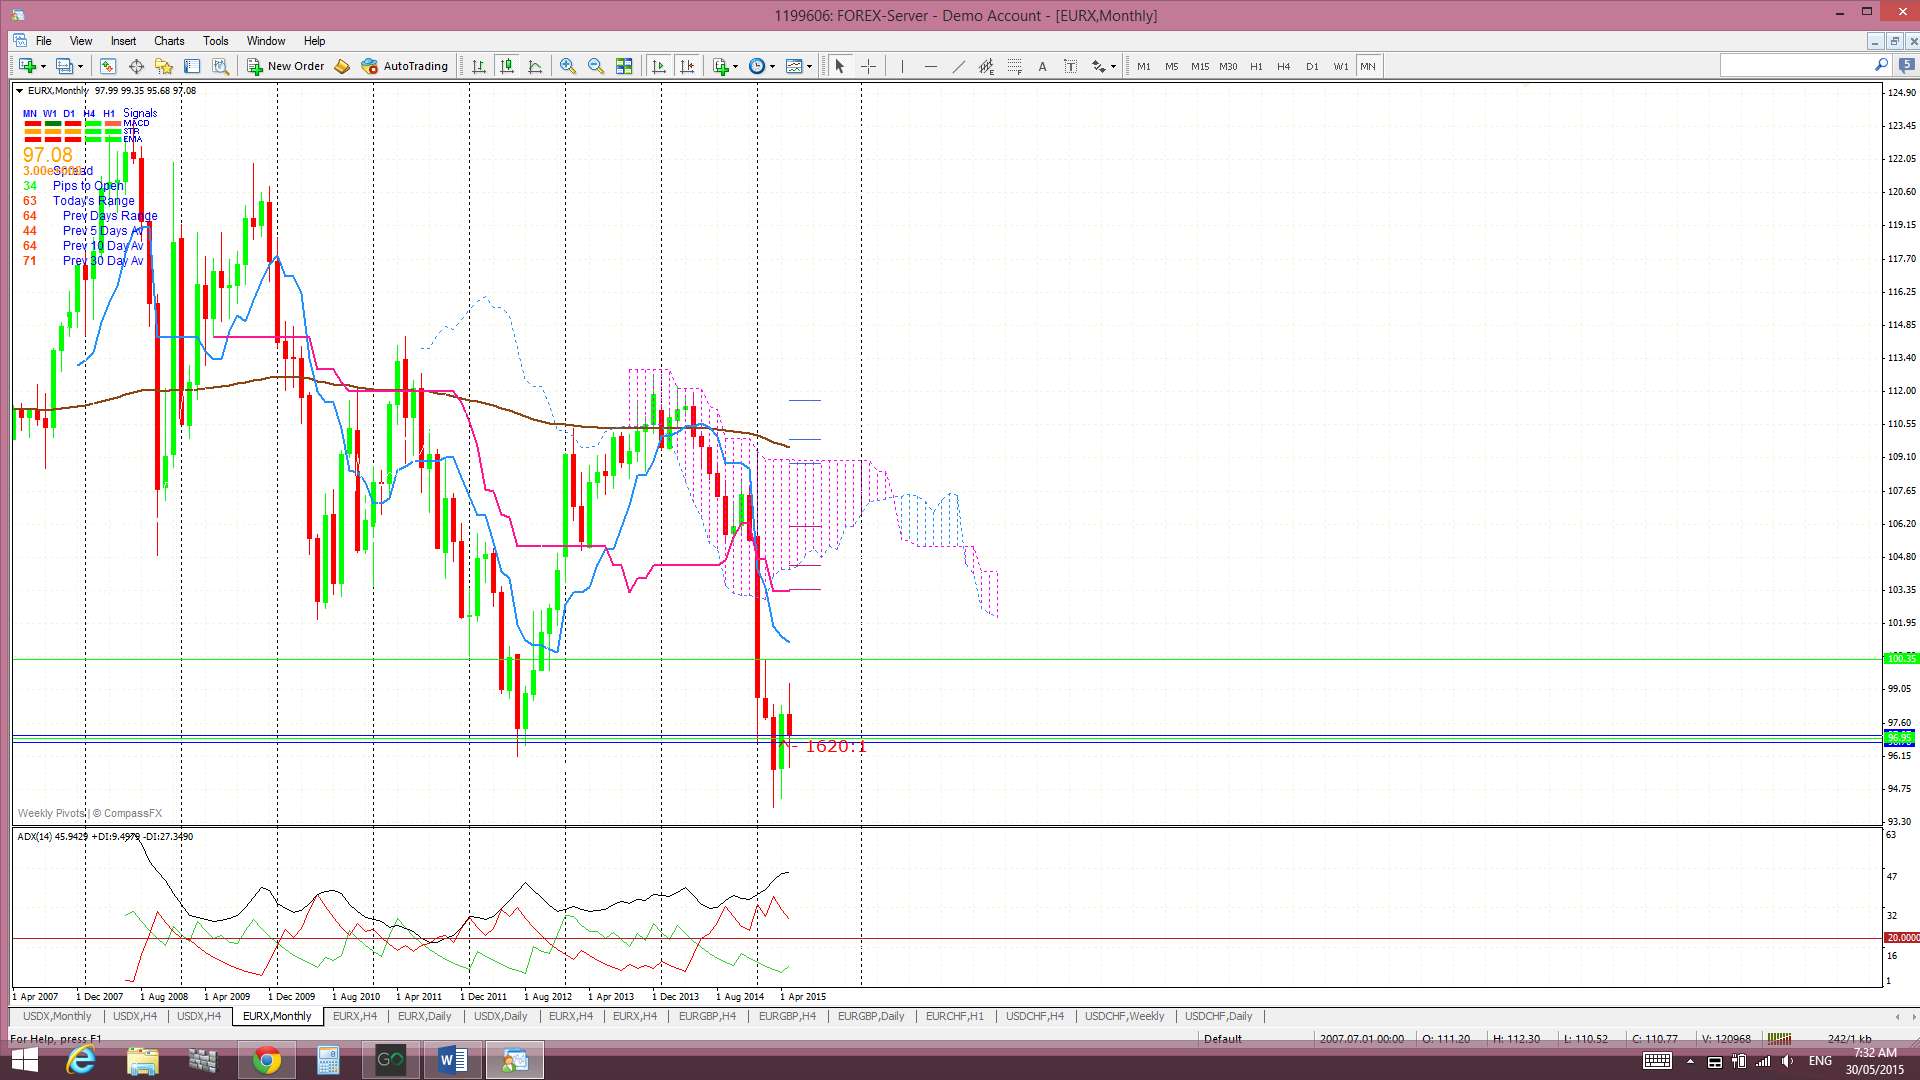
Monthly: The May candle closed as a bearish coloured, almost ‘inside’, candle BUTabove the key 96 level. There is still a bit of a bullish ‘inverse H&S’ look to the monthly and weekly charts.
Monthly Ichimoku: The May candle closed below the Cloud.
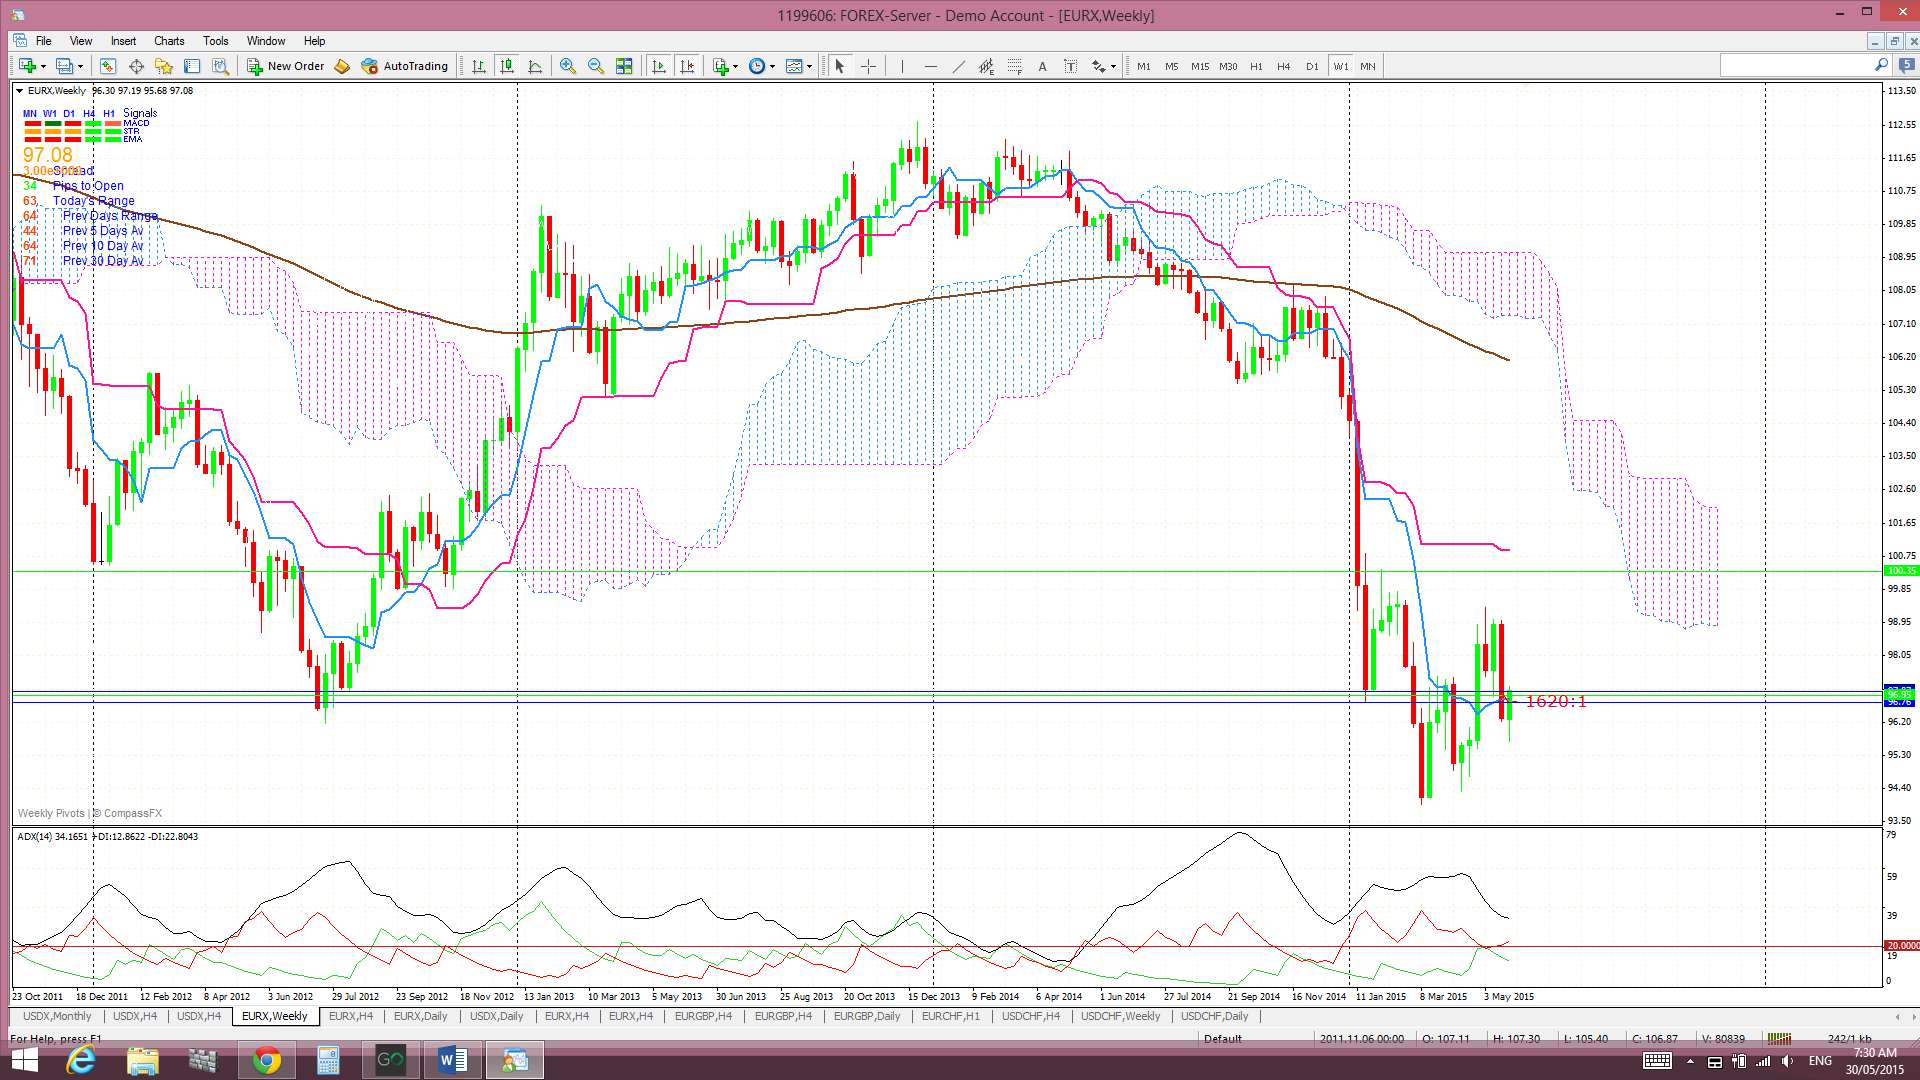
Weekly: The weekly candle closed as a small bullish coloured ‘inside’ candle and still above the key 96 level. The weekly chart shows that a 61.8% fib retracement of the recent lengthy bear move is back up near the 105.50 level and weekly 200 EMA. Any hold above 96 and continued recovery effort might see the index target this region.
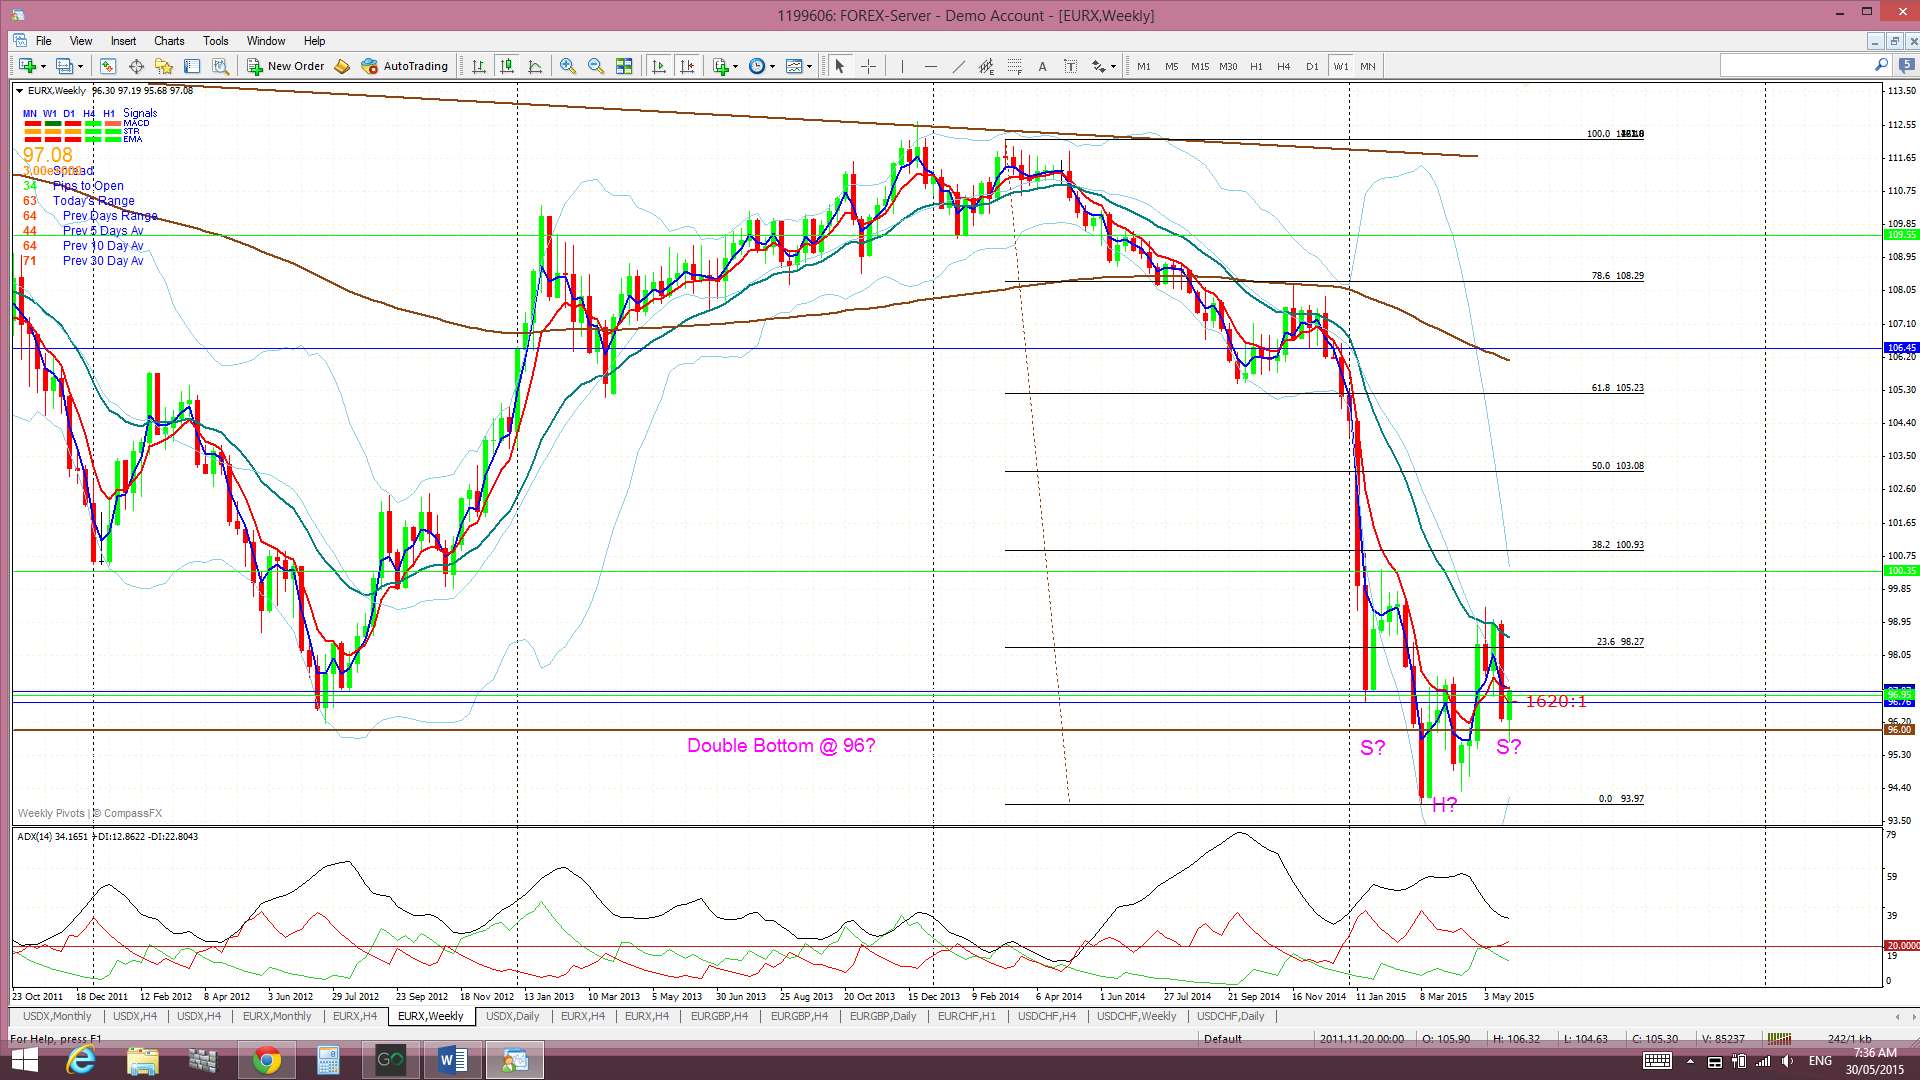
Weekly Ichimoku: Price is still trading well below the weekly Cloud.
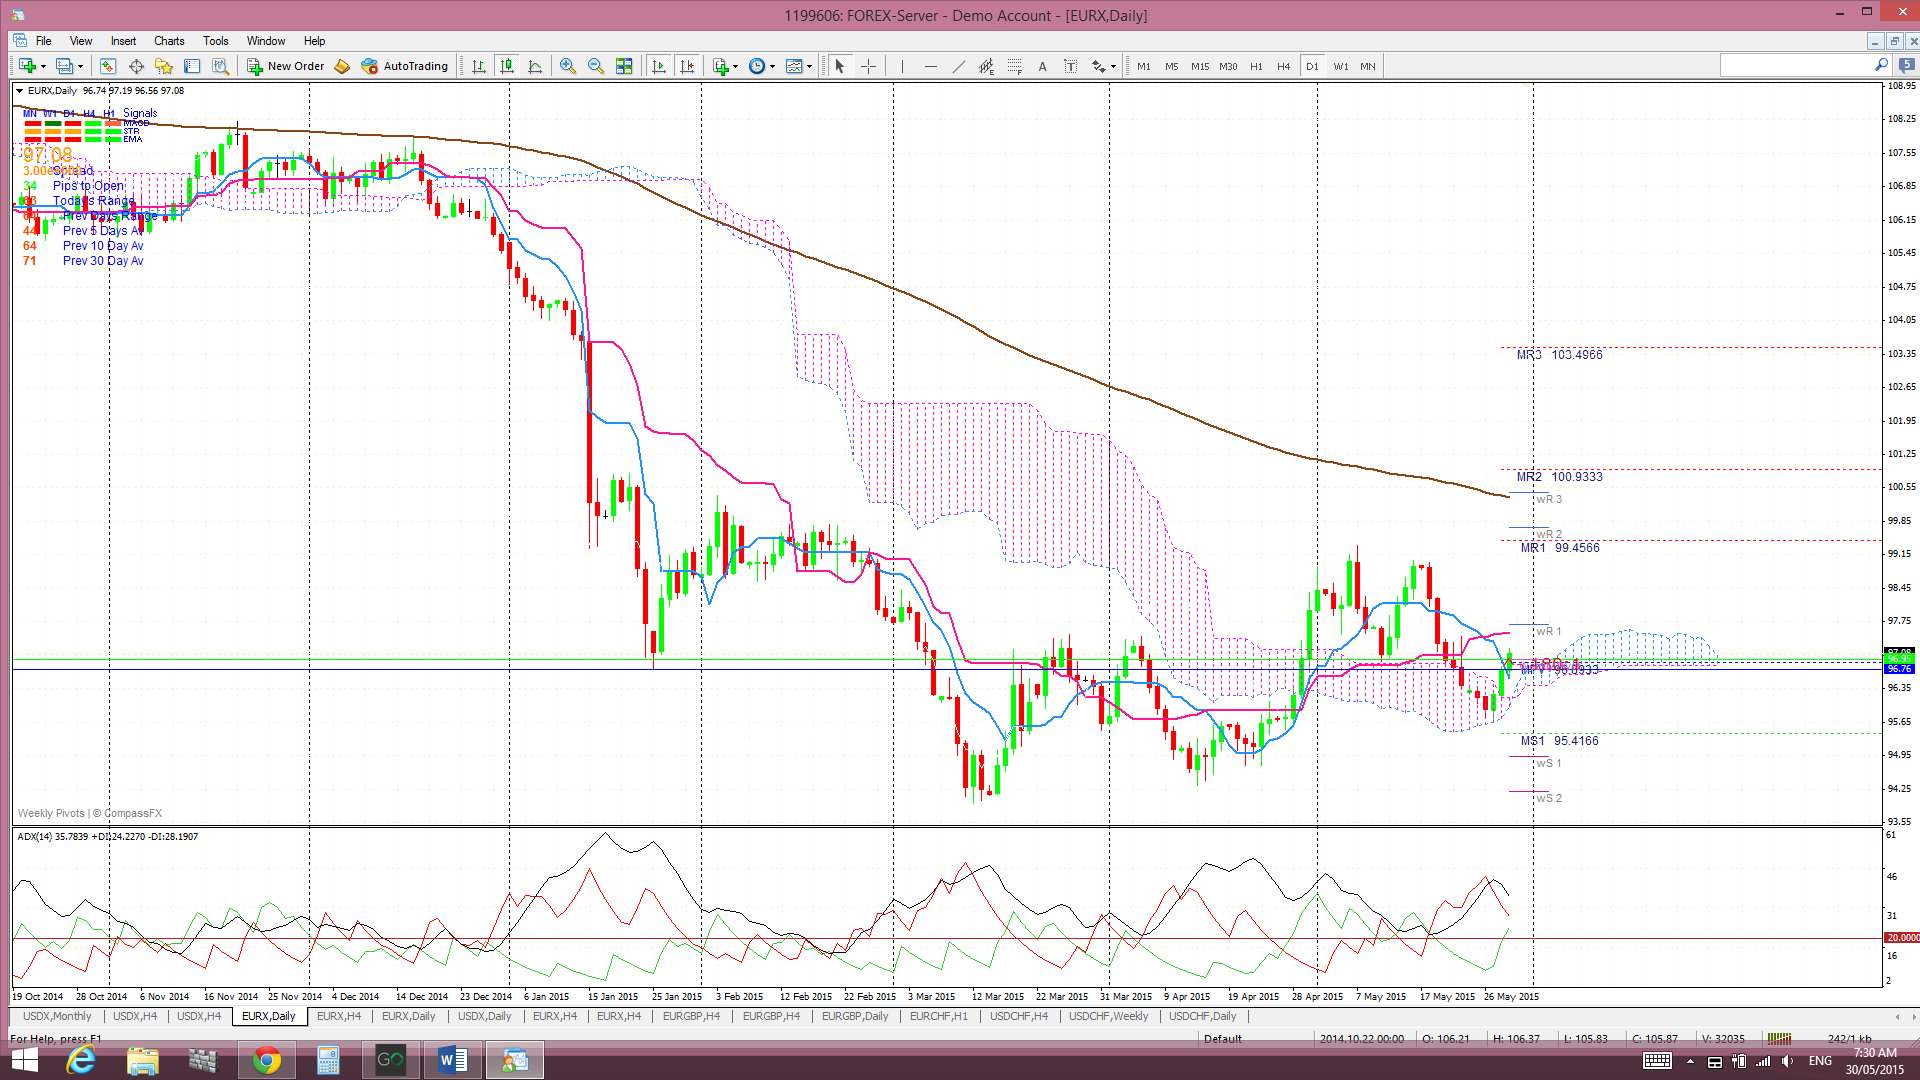
Daily: Price chopped higher last week. Mon and Tue were bearish but the final three days of the week were bullish.

Daily Ichimoku Cloud chart: Price moved up out of the daily Cloud last week, however, there has been a recent bearish Tenkan/Kijun cross.
4 hr: Price chopped lower then higher last week. The index has managed to close above the key 96 level and the monthly and weekly pivots.
4 hr Ichimoku Cloud chart: The EURX traded below the 4hr Cloud for most of last week but finished up in the bottom of the Cloud on Friday. This chart is divergent from the daily chart and suggests choppiness.
Comments:
Overall: We have the fairly unusual situation where both indices closed higher last week. There is no FX index alignment just yet as the EURX is in the 4hr Cloud and the USDX is in the daily Cloud.
USDX: the USDX closed higher last week and moved back above the Double Top ‘neck line of 96.50. It couldn’t manage to break above the 61.8% fib of the recent swing low move however as US GDP, although slightly better than expected, still showed contraction.
The US$ is back in no-man’s land being above 92.50 but below the 100 level and we really need (read: want) to see a decisive breakout from this region. The choppy price action under the 100 level has gone on for over four months now and is impacting many FX pairs making trend trading off certain time frames much more challenging.
The 61.8% and 78.6% fib levels remain the levels to watch above current price and will need to be negotiated for the index to attempt its march back up to the major psychological 100 level. Although, when and if it does, a possible ‘Triple Top’ awaits it.
EURX: The EURX closed slightly higher last week due to the pause with the US$ rally. The index has managed to hold out the week and the month above key 96 support which is noteworthy. This support level would need to be broken to be confident of failure with this recent EURX recovery attempt but, for now, the hold above 96 is helping to shape a monthly-chart bullish ‘Double Bottom’ pattern and there is also a possible bullish ‘inverse H&S’ pattern forming. The reality is, though, that divergence between the EZ and US economies continues to be a dominant theme with the Eurozone entering a monetary easing cycle and the US trying to emerge from one. Whilst the fundamental situation for the Euro appears challenging to say the least, given ECB Monetary Policy and the Greek-debt situation, the monthly and weekly EURX charts do look defensively bullish with the ‘inverse H&S’ and hold above 96.
The levels to watch on the EURX remain as:
- 105.5: The weekly chart reveals that a 61.8% fib retracement of the recent lengthy bear move is back up near the 105.50 level and weekly 200 EMA. Any continued hold above 96 and continued recovery effort might see the index target this region.
- 96: This is a major support level for the EURX and is helping to form up a possible bullish ‘Double Bottom’. Price closed the week just above this key support region.
- 94: Any break and hold back below 96 might suggest bearish continuation as it represents a break of a monthly chart ‘Double Bottom. If so, the recent low printed near 94 will come back into focus.
Note: The analysis provided above is based purely on technical analysis of the current chart set ups. As always, Fundamental-style events, by way of any Ukraine, Ebola, Eurozone or Middle East events and/or news announcements, continue to be unpredictable triggers for price movement on the indices. These events always have the potential to undermine any technical analysis.
The post US$: still stuck in no-man’s land. appeared first on www.forextell.com.