Here are some quick thoughts on the four major US Indices: S&P500, DJIA, NASDAQ and Russell-2000. All are currently forming up with bearish monthly candles but rounding, or topping, action is more developed on the S&P500, DJIA and Russell 2000 than on the NASDAQ. The NASDAQ may follow suite here of course but, given its the only index to have not completed its ascending triangle breakout, it might pay to keep an open mind with this one.
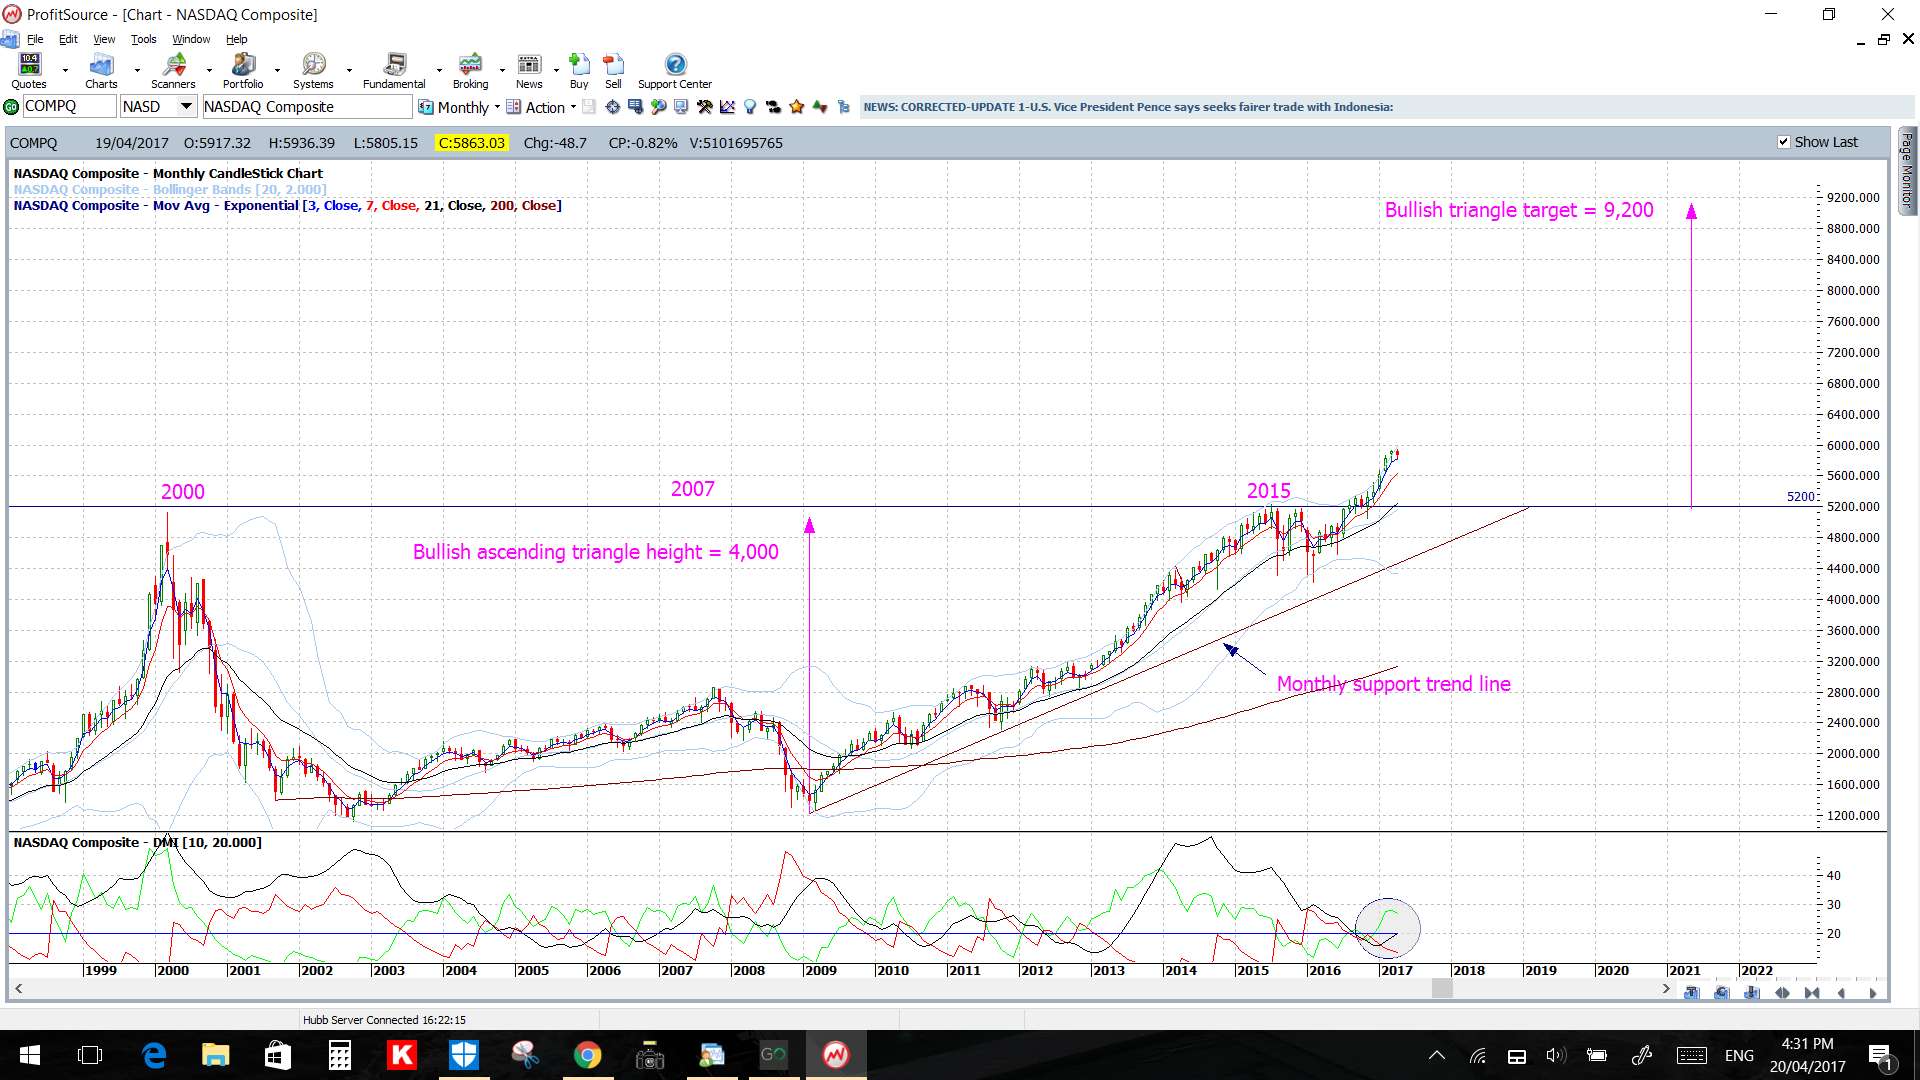
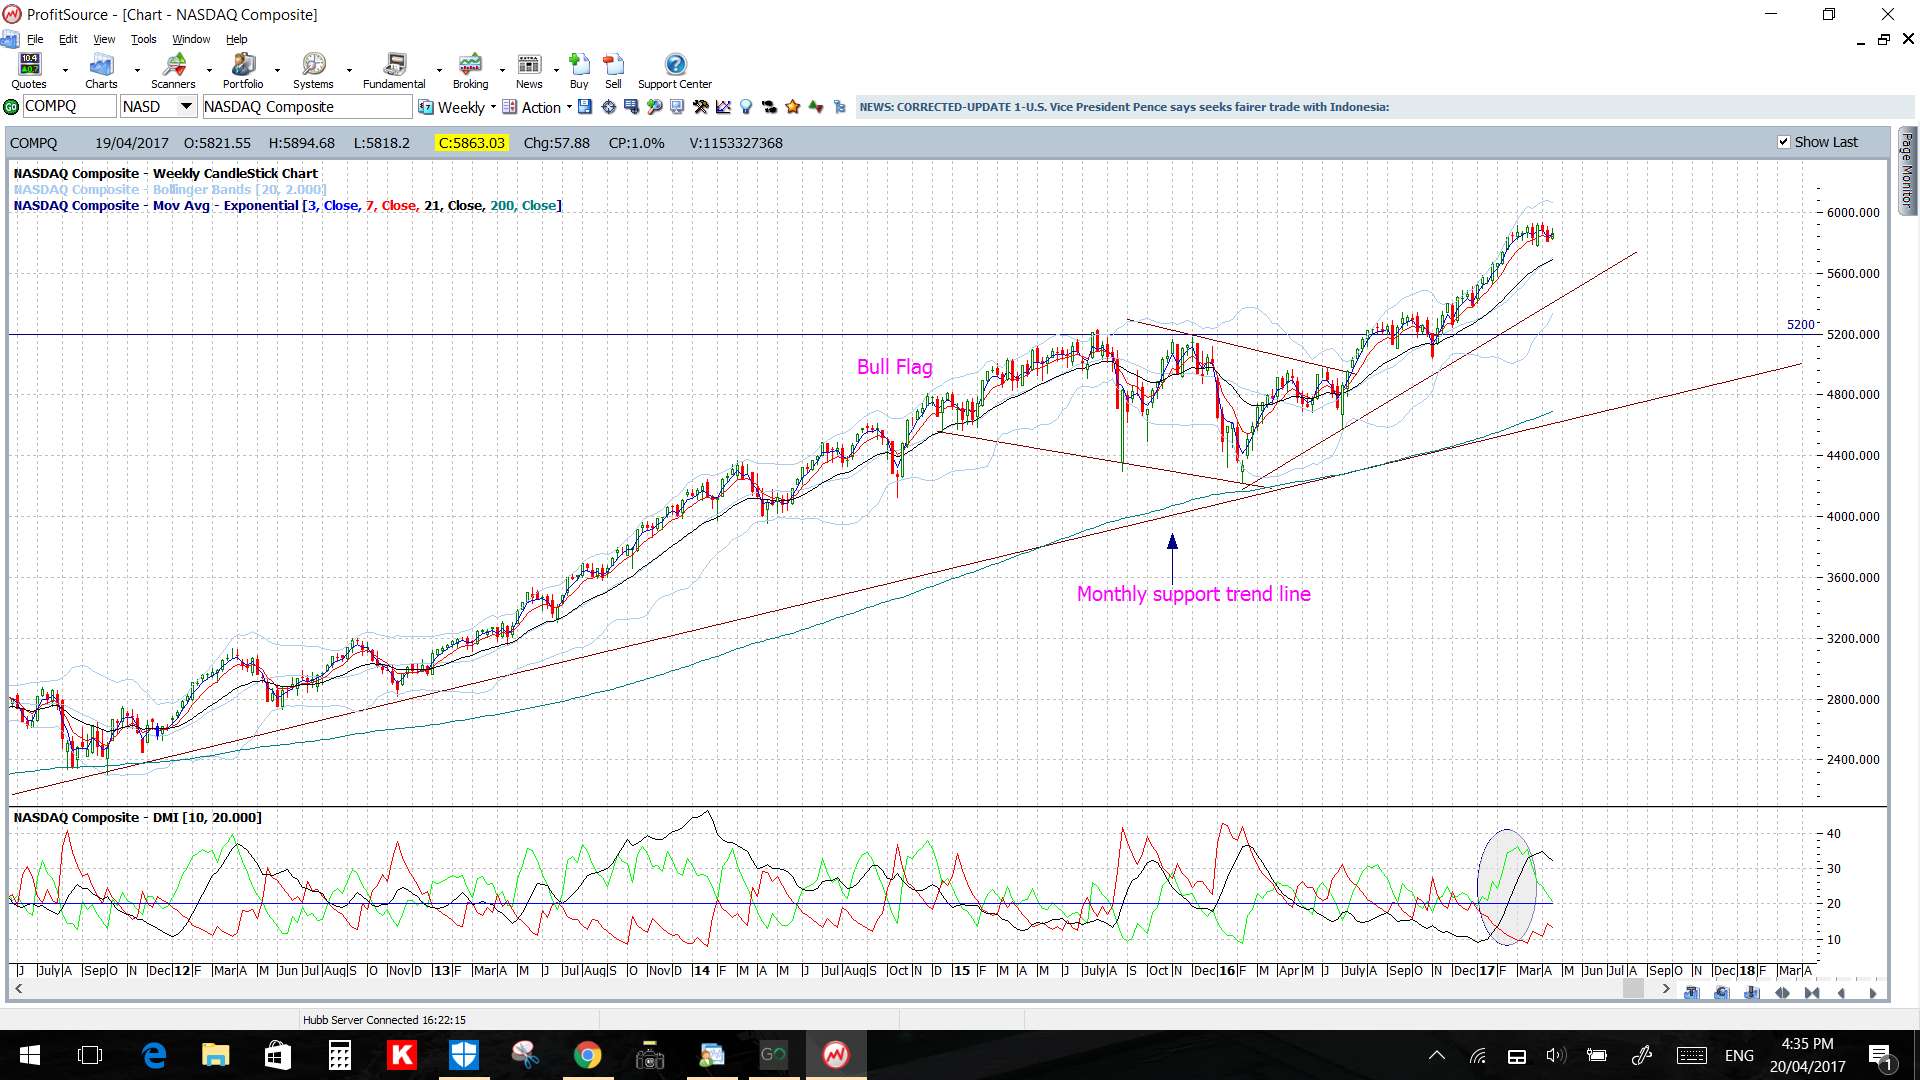
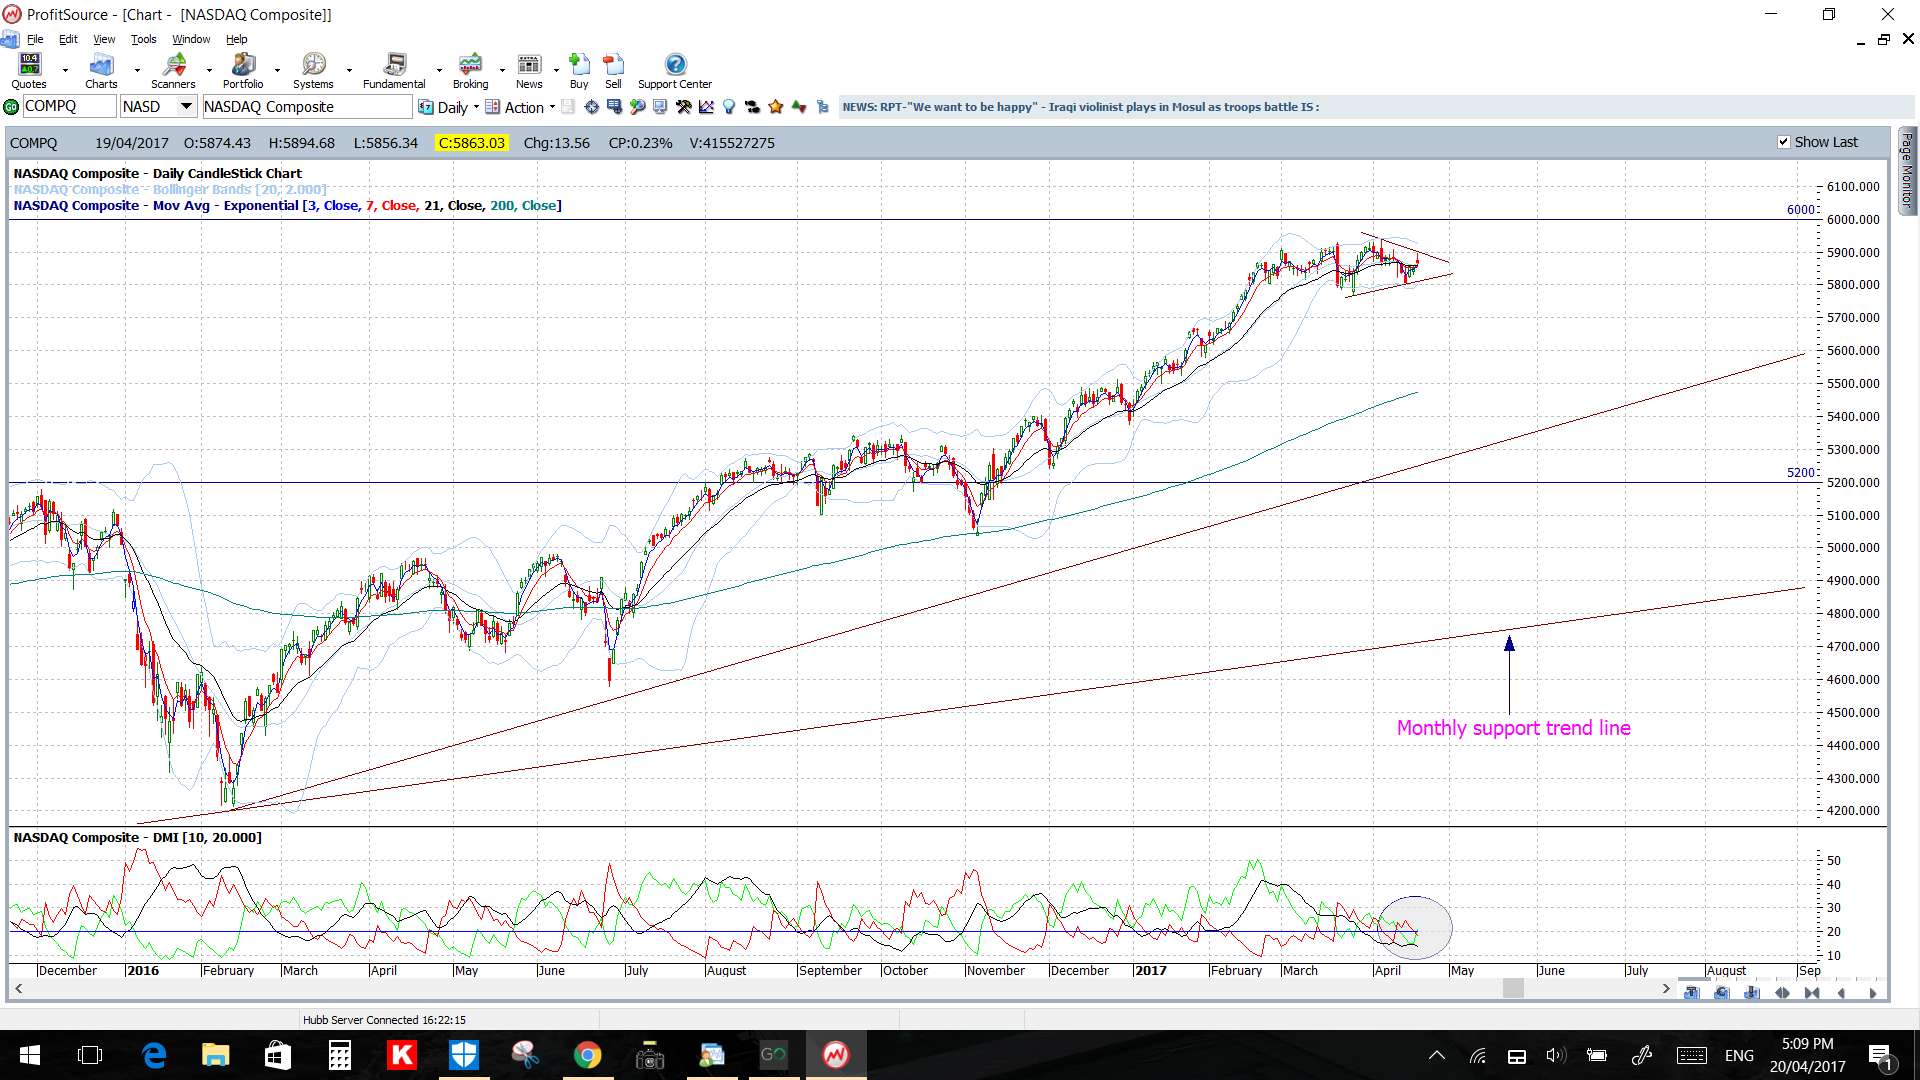
NASDAQ: the NASDAQ index looks to be consolidating under the key 6,000 level as it progresses on its ascending triangle breakout pathway. The current monthly candle is bearish and this could develop into a topping pattern at this major S/R zone so watch the daily chart’s Flag trend lines and the weekly chart’s support trend line for clues here. Note that any 61.8% fib pullback of the recent swing high move would bring price back to test the very significant 5,200 ascending triangle breakout level:
NASDAQ monthly:
NASDAQ weekly:

NASDAQ daily:
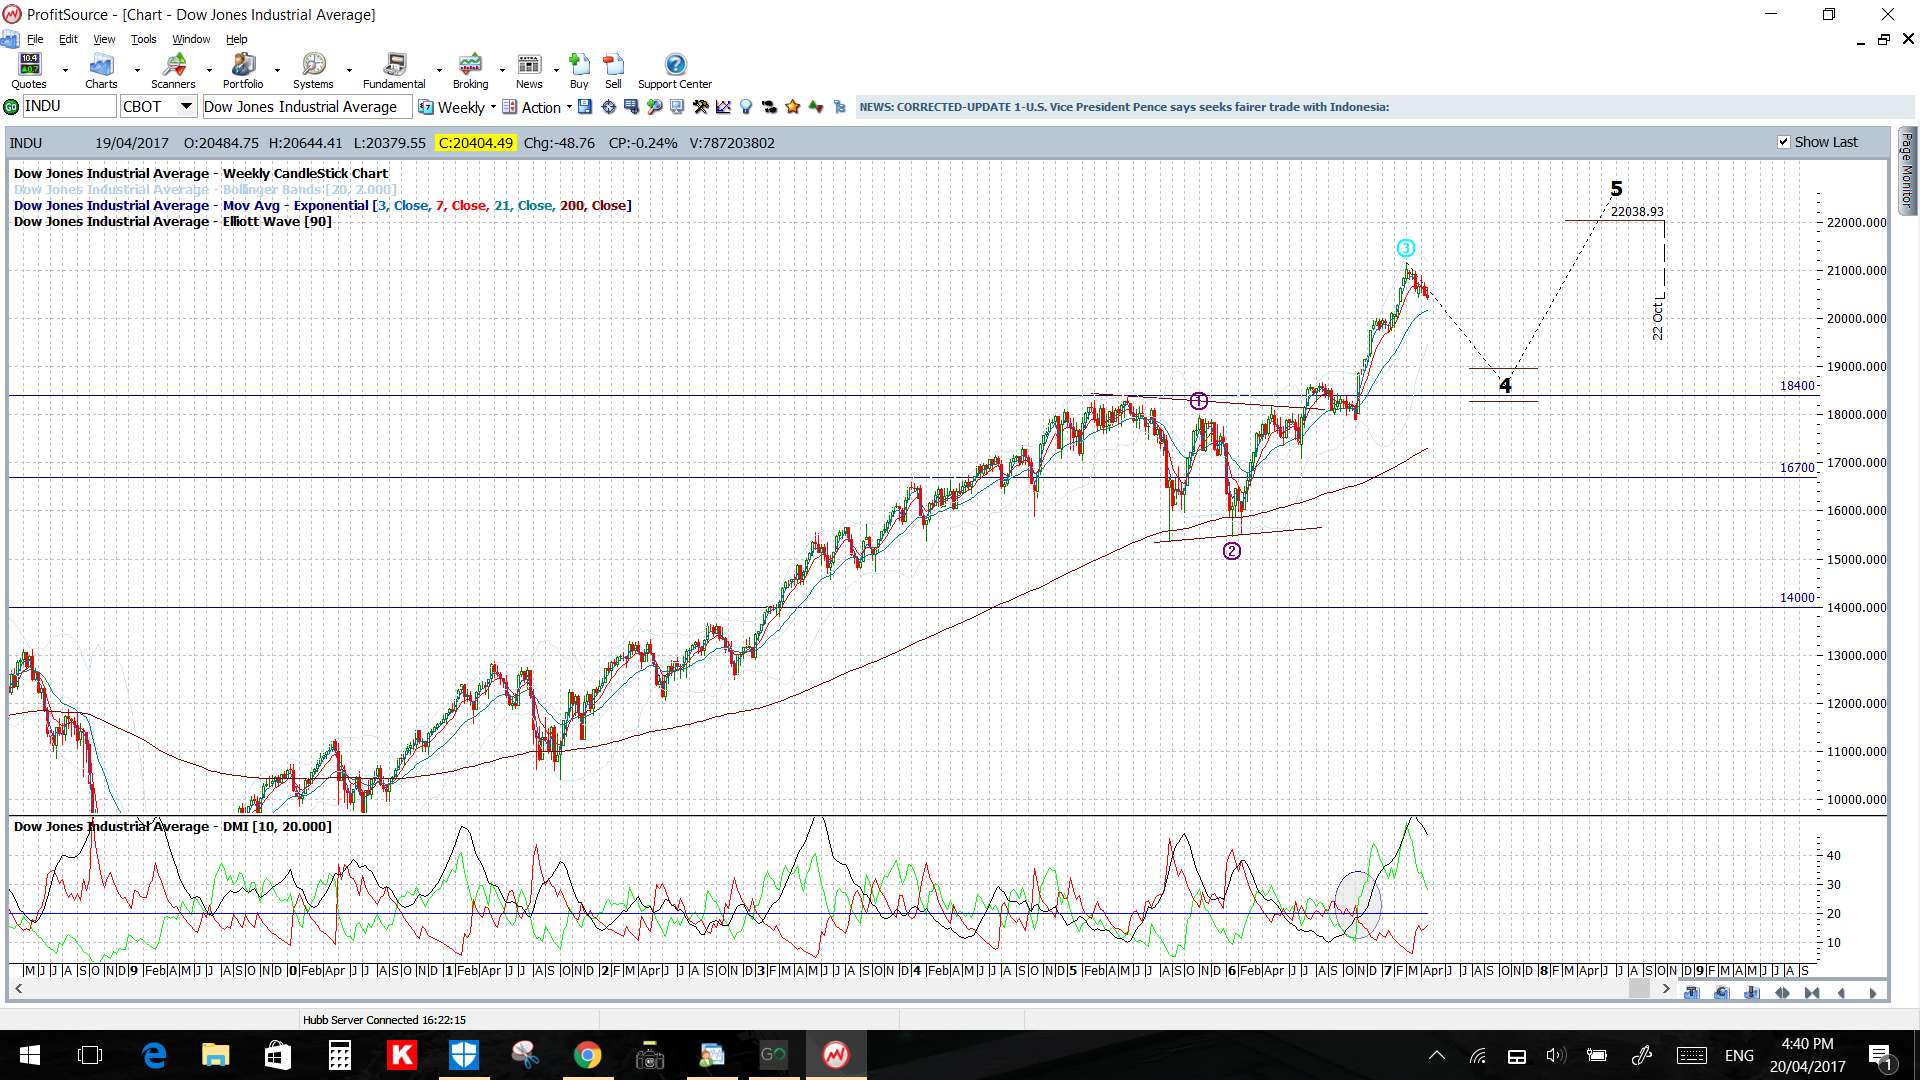
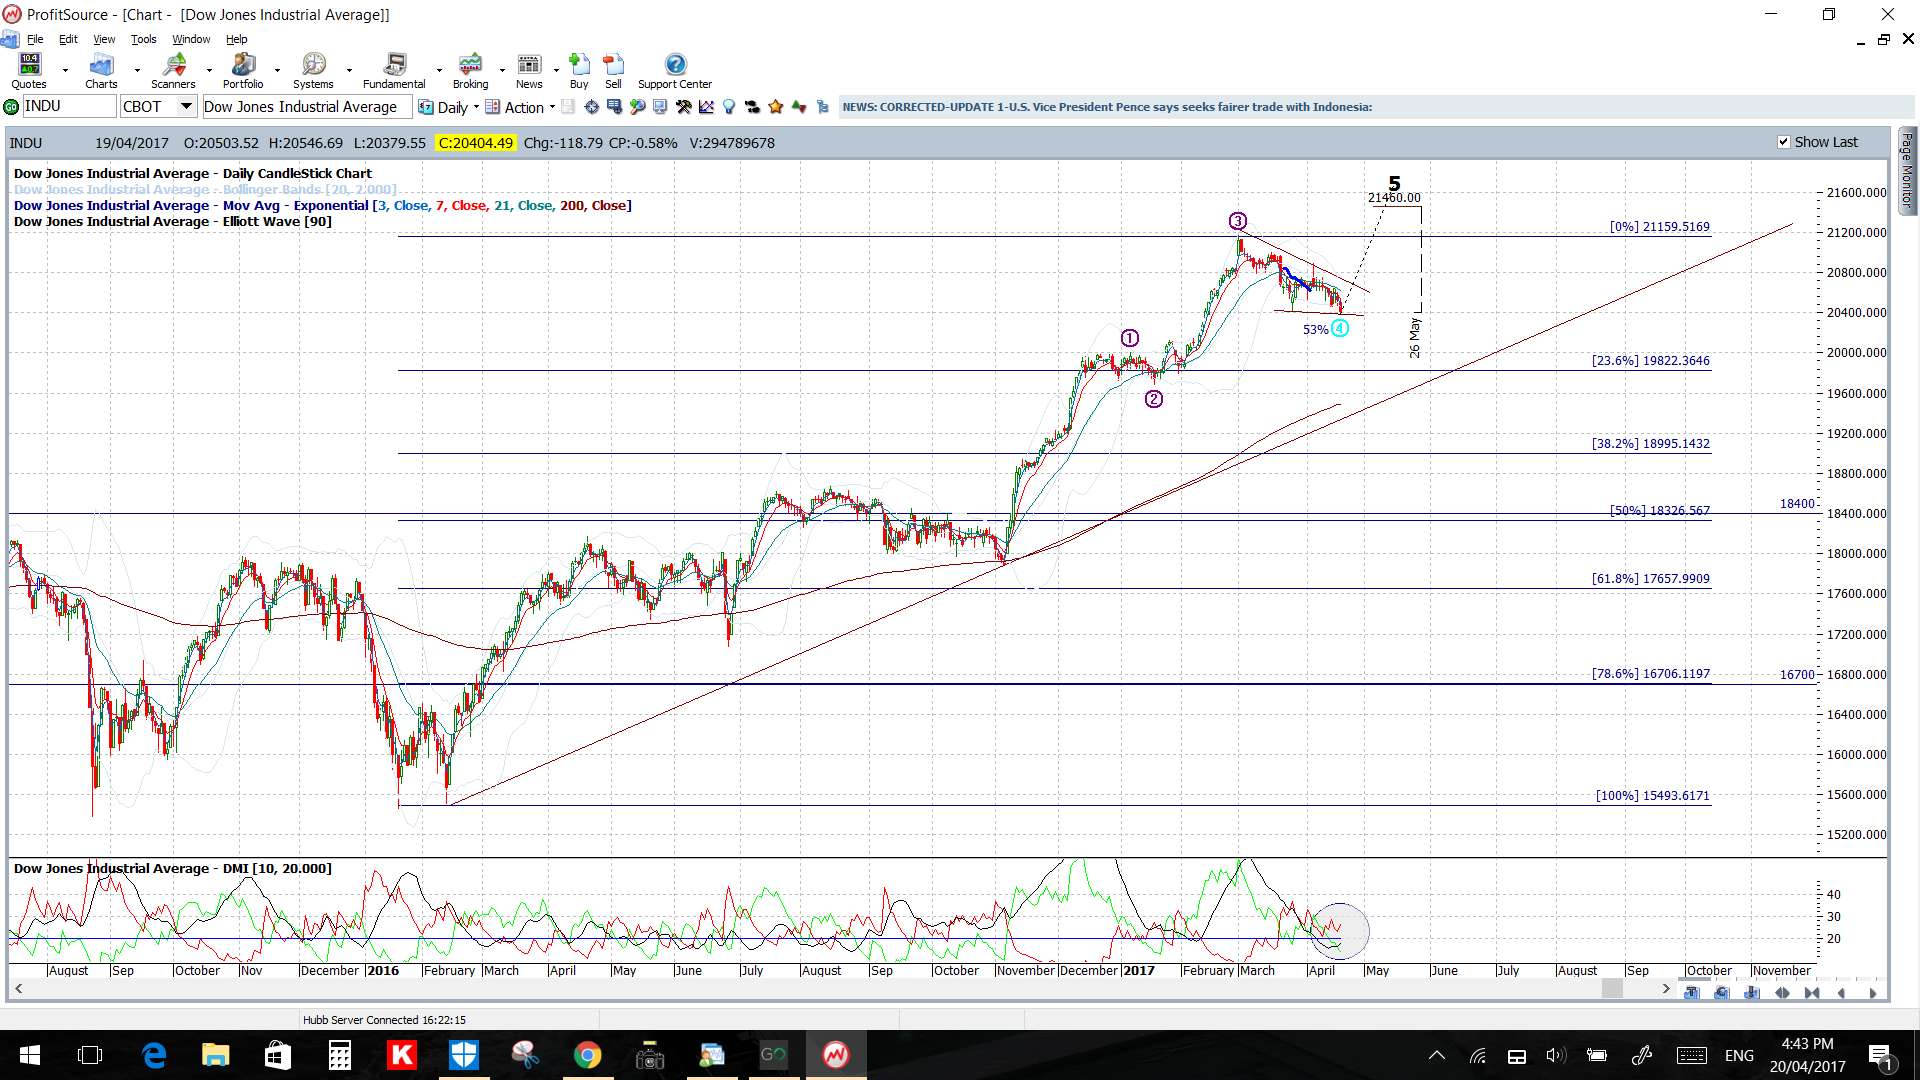
DJIA: the DJIA looks to be forming a topping pattern on its monthly chart which isn’t too surprising given the completion of the ascending triangle breakout. Watch for any break of the Flag trend lines and recent support trend line (drawn in on daily chart). Note that any 50% fib pullback of the recent swing high move would bring price back to the 18,400 level which was a recent S/R zone for the index:
DJIA monthly:

DJIA weekly:
DJIA daily:

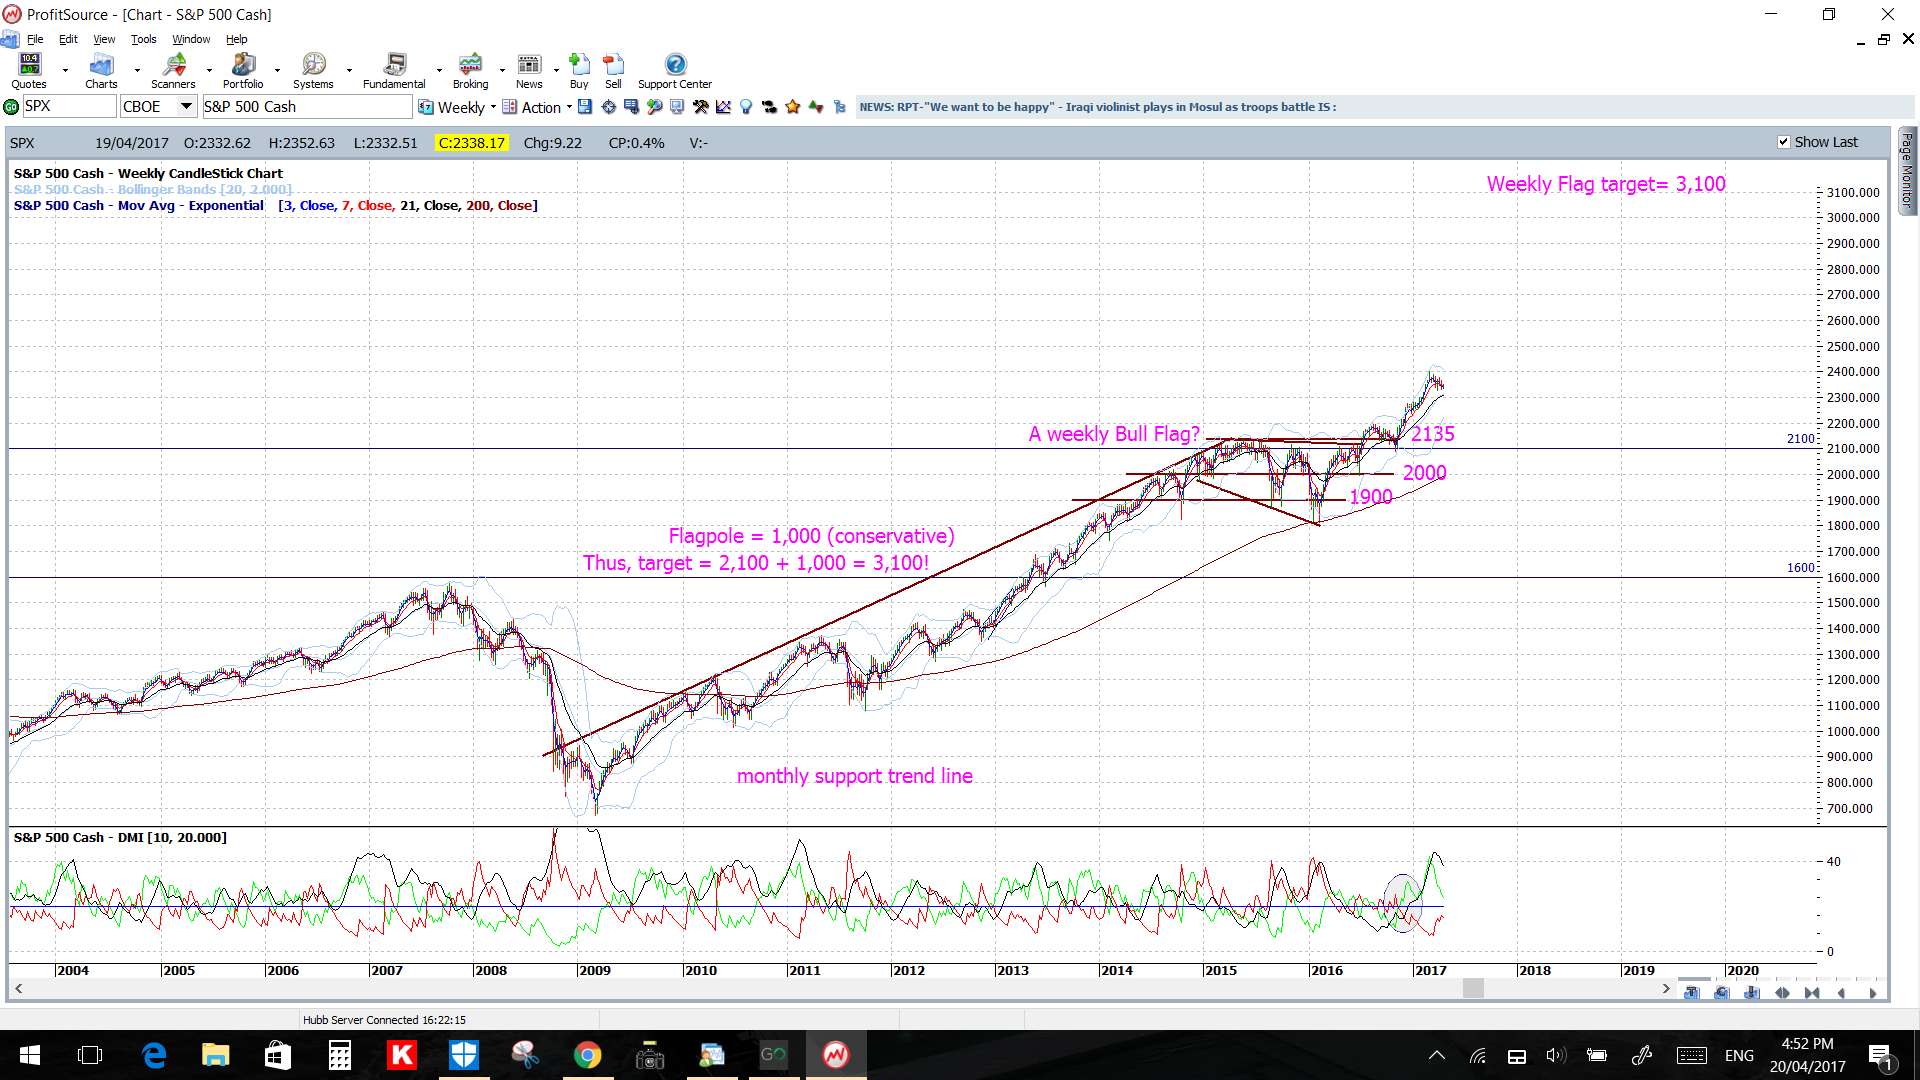
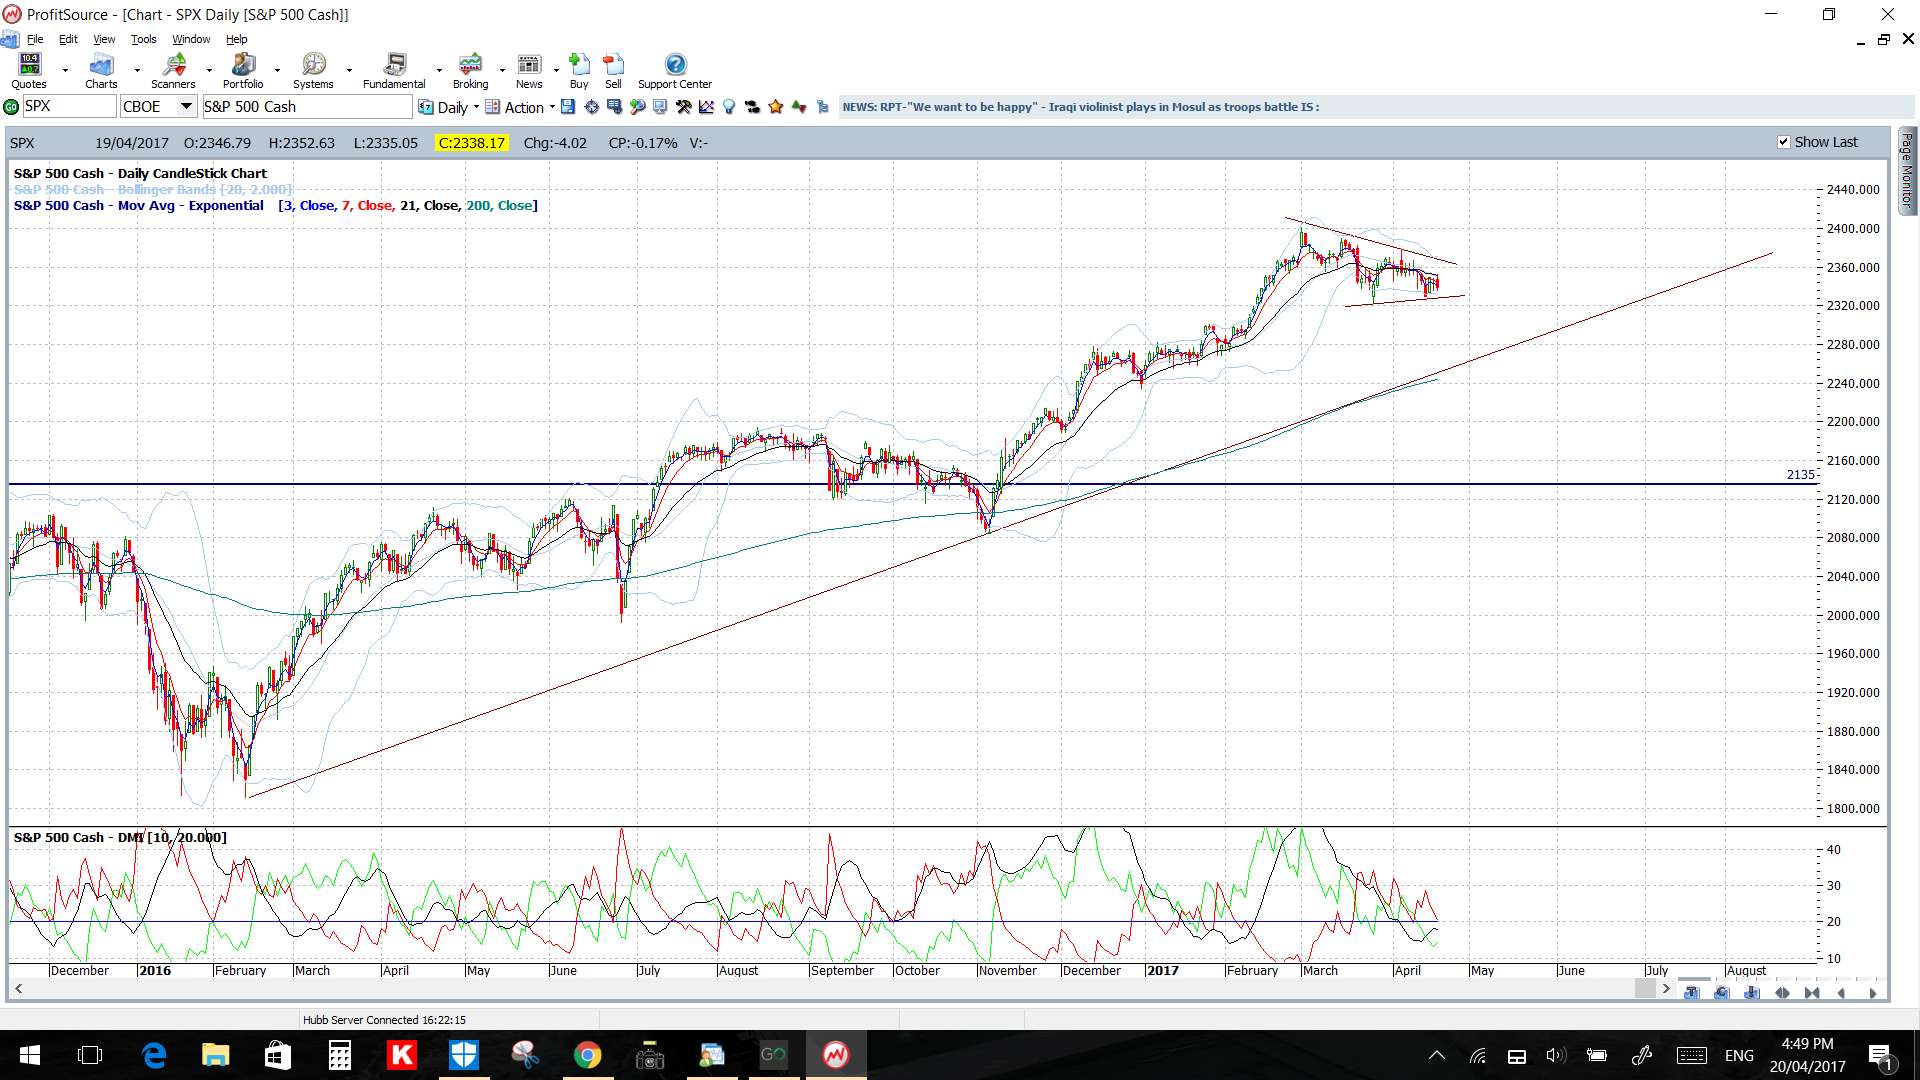
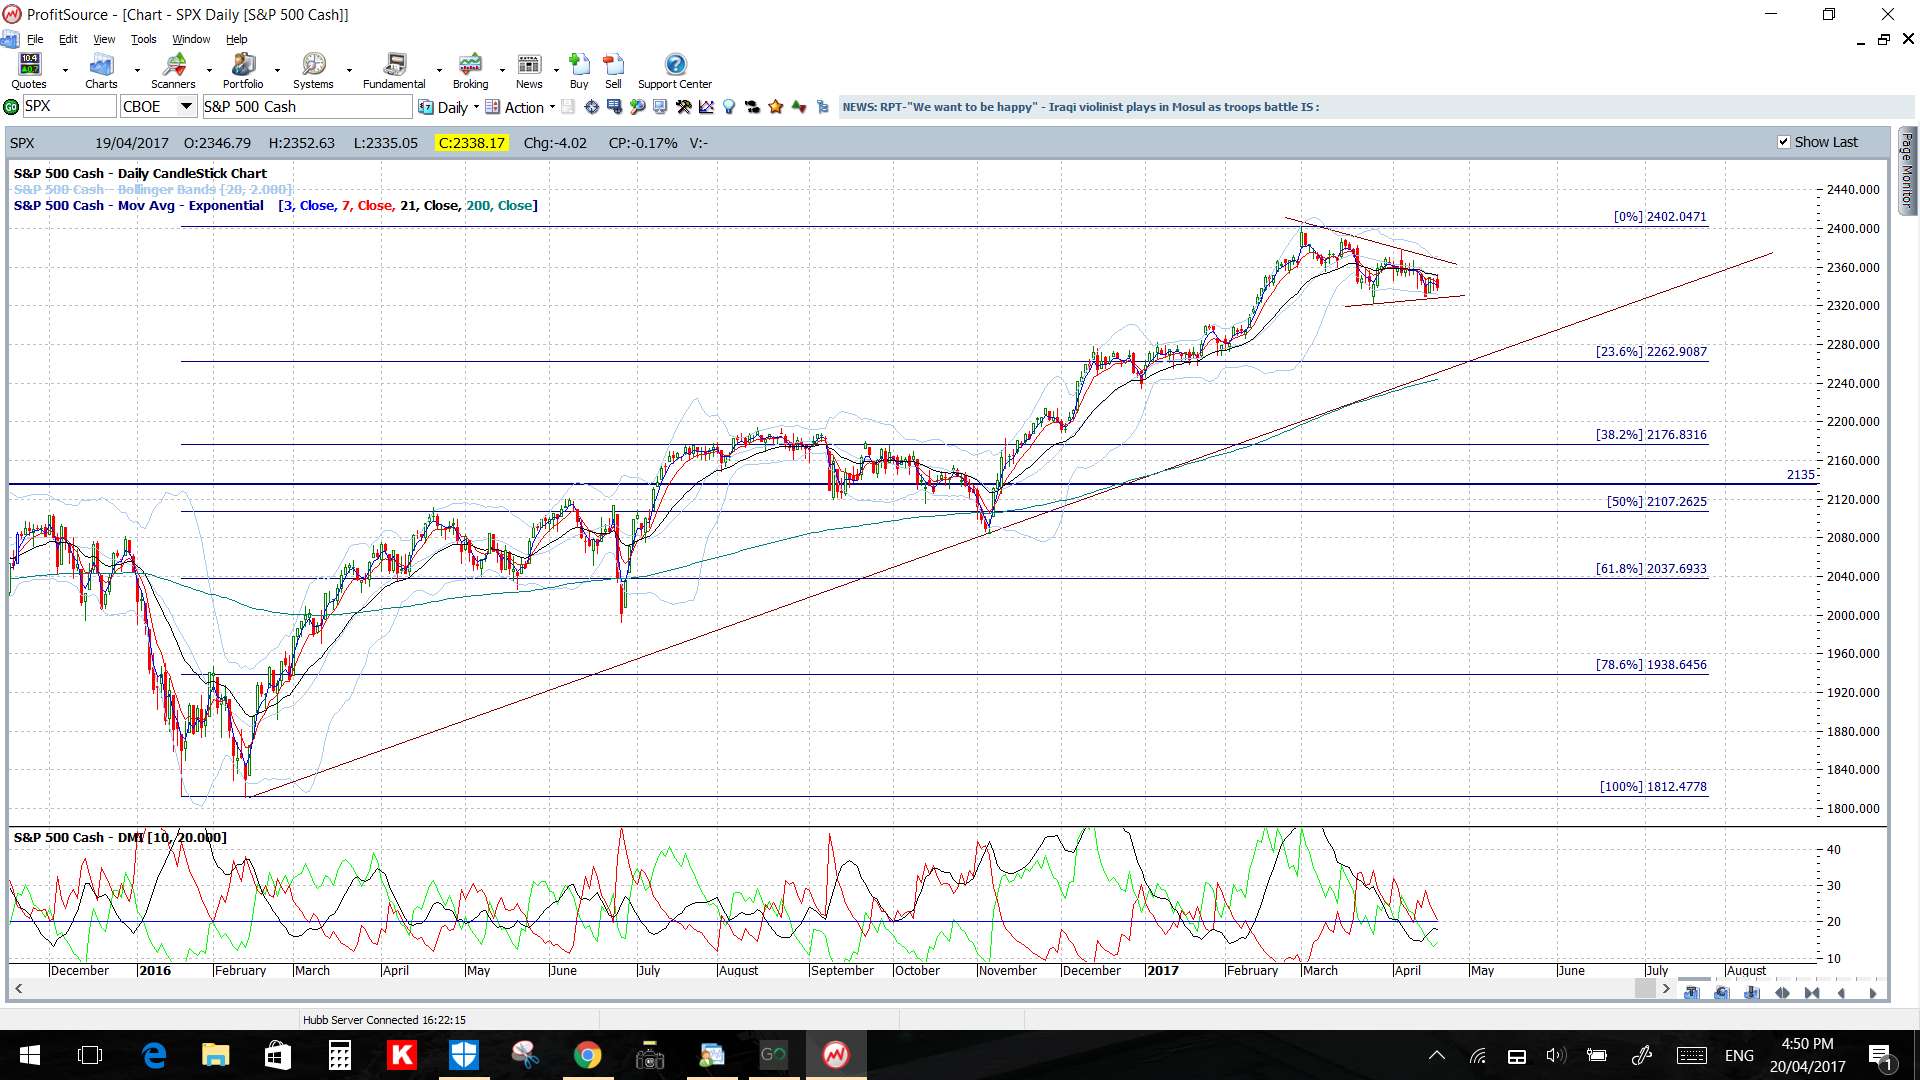
S&P500: the picture on the S&P500 is rather similar to that on the DJIA. This index also looks to be forming a topping pattern on its monthly chart following the completion of an ascending triangle breakout. However, the weekly chart shows this could just be consolidation as part of a larger Bull Flag move. Thus, like with the DJIA, watch the daily chart for any break of the Flag trend lines and of the recent support trend line (drawn in on daily chart). Note that any 50% fib pullback of the recent swing high move would bring price back to the 2,135 level which was a recent S/R zone for the index:
S&P500 monthly:

S&P500 weekly:
S&P500 daily:
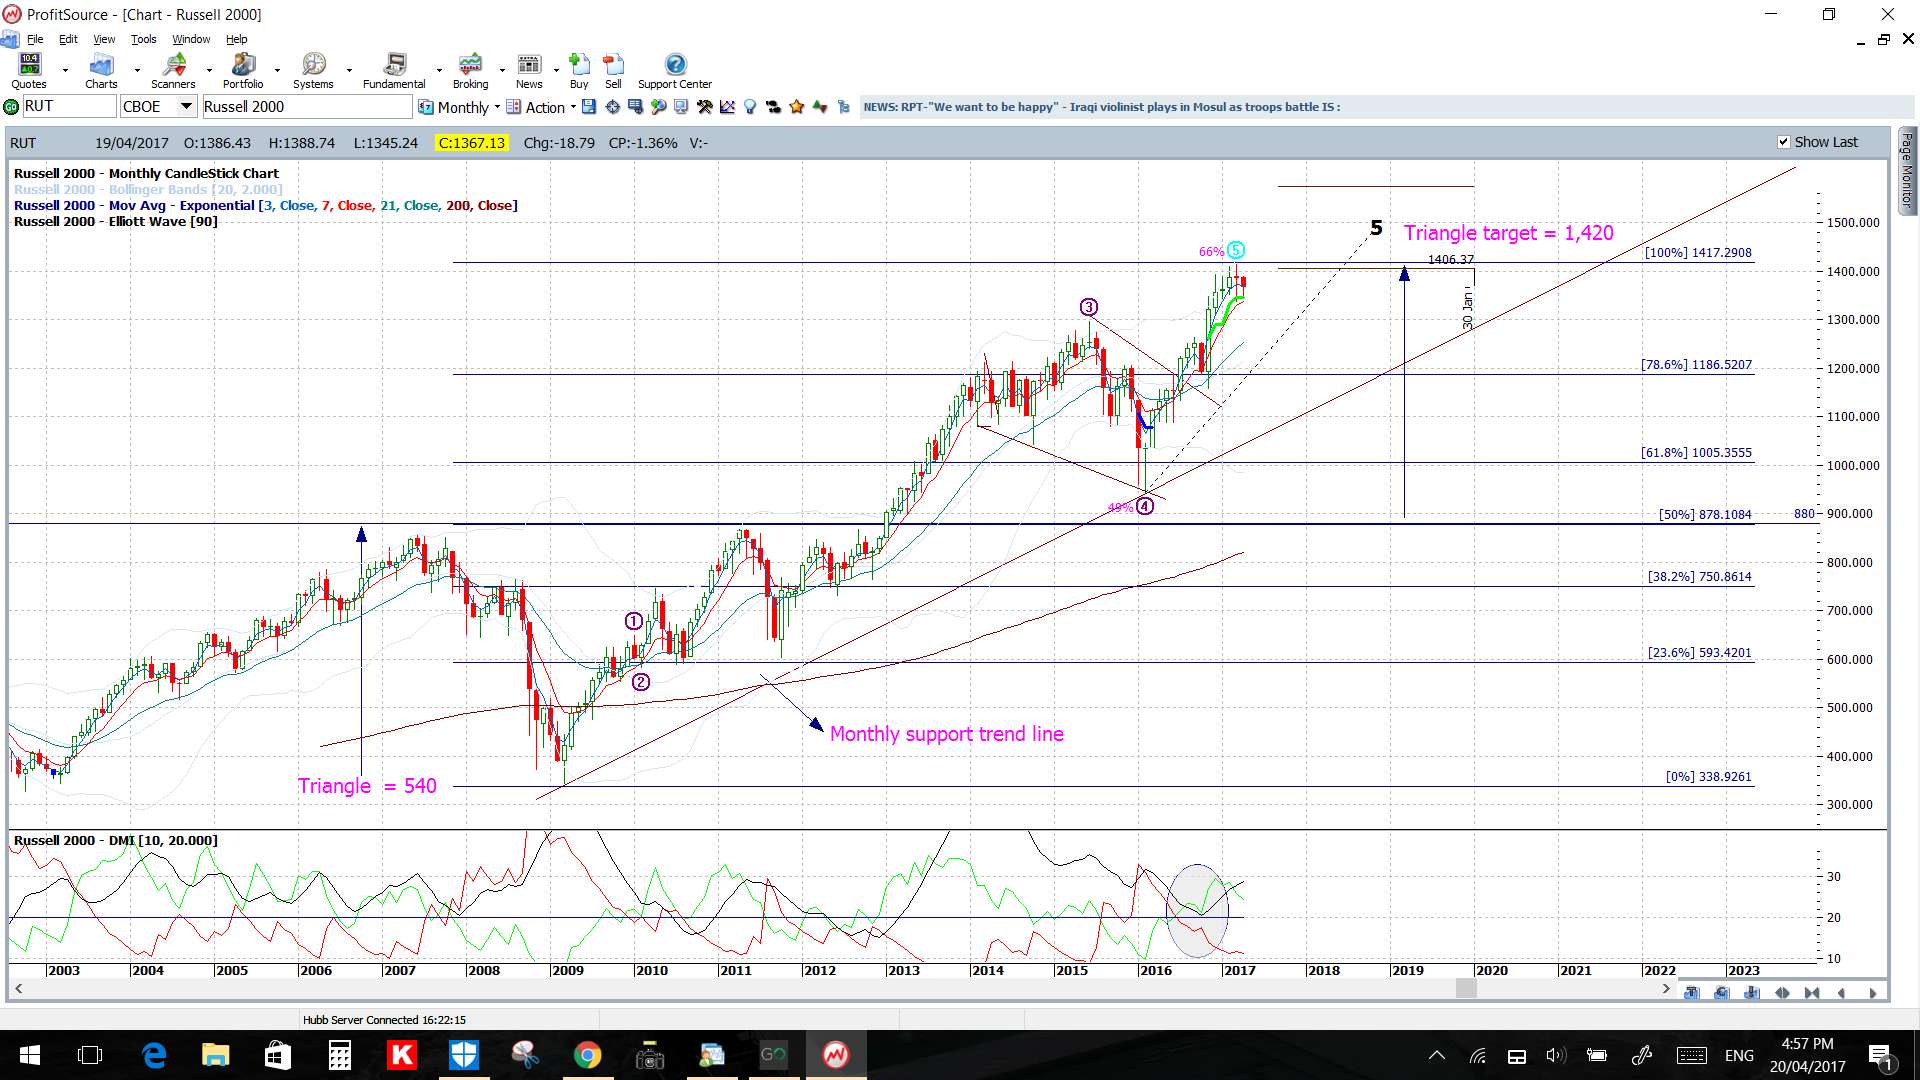
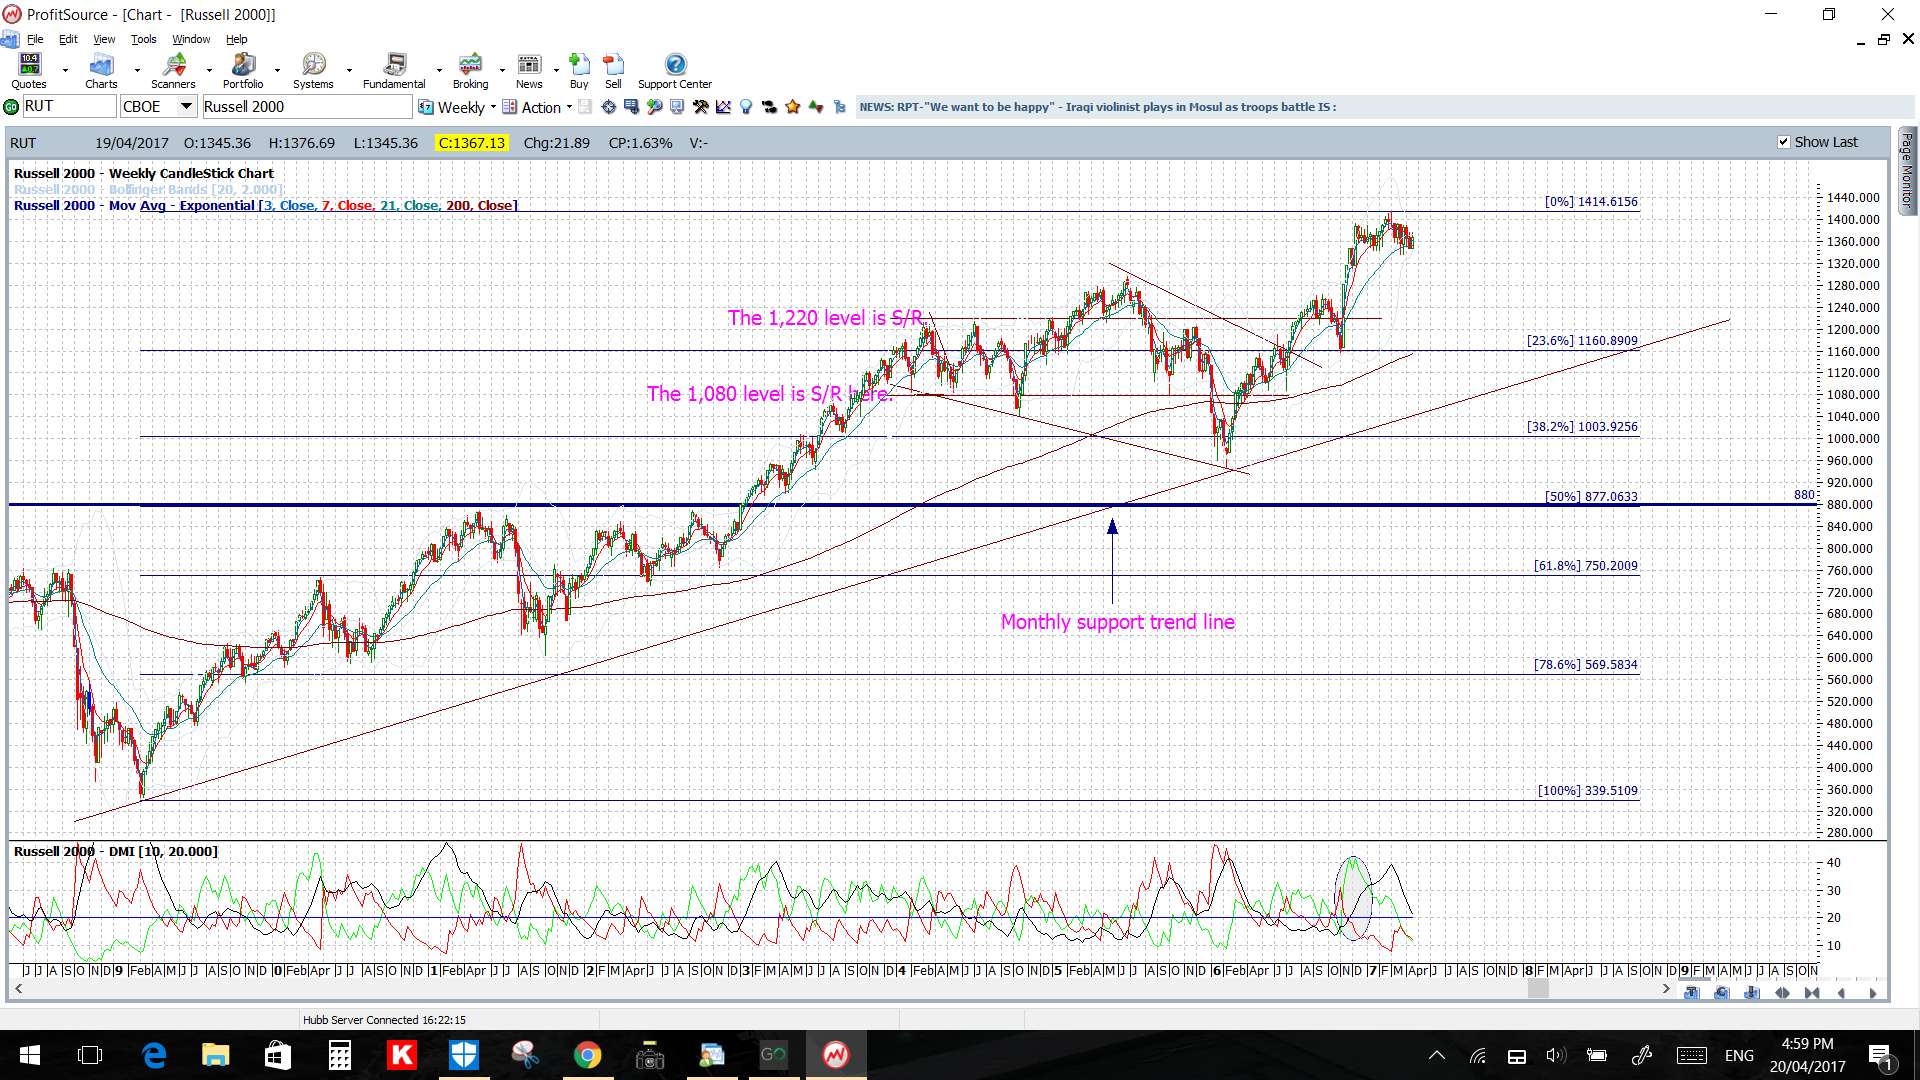
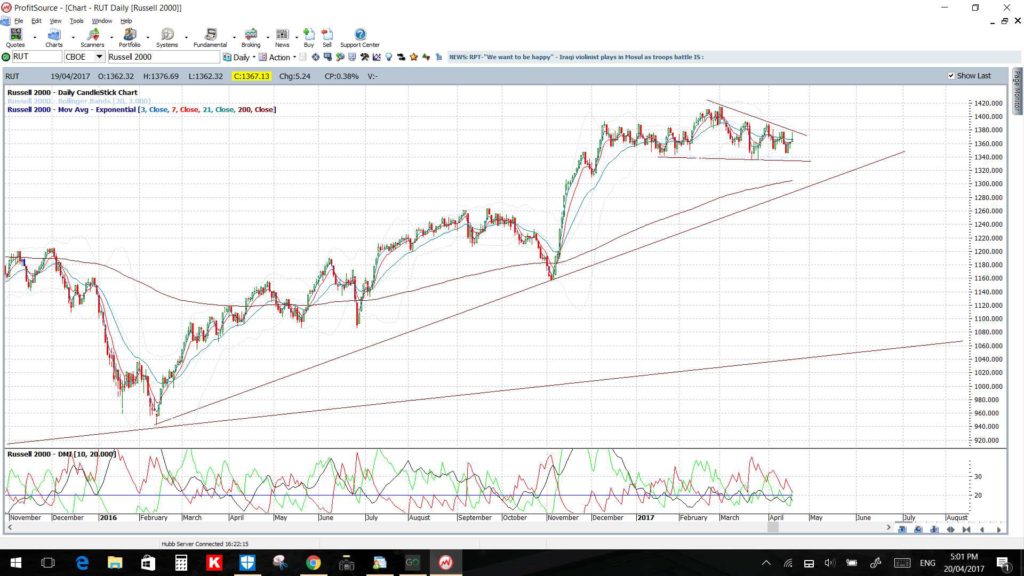
Russell 2000: The Russell 2000 is shaping up much like the bigger S&P500 and DJIA indices. The small caps index also looks to be forming a topping pattern on its monthly chart following the completion of an ascending triangle breakout. Thus, like with the DJIA and S&P500, watch the daily chart for any break of the Flag and of the recent support trend line. Note that any 50% fib pullback of the full swing high move, post GFC, would bring price back to the 880 level which was the triangle breakout zone for the index and, as such, major S/R:
Russell 2000 monthly:
Russell 2000 weekly:
Russell 2000 daily:

Source: tradecharting.com