USDX
Monthly: The August candle closed as a large bullish candle and above the resistance of the 61.8% fib of the last major swing bear move 2010-2011. This is the first bullish monthly candle close up and out of the 79 – 81.50 trading channel in 11 months.

Monthly Ichimoku: The Aug candle closed above the monthly Cloud. The Cloud band has flipped to bullish and is starting to trend higher now. The monthly Cloud chart shows that, whilst the index had spent much of the last 6 months within the monthly Ichimoku Cloud, it has now broken back above the Cloud. Decent tending markets might return if this index can remain free of the monthly Cloud.
Weekly: The weekly candle closed as a small bullish candle BUT ABOVE the key resistance of 81.50 and the 61.8% fib of the 2010-2011 bear move. The weekly close above the 61.8% fib level is a major bullish development. A hold above this level would suggest a major reversal of trend and bullish continuation.
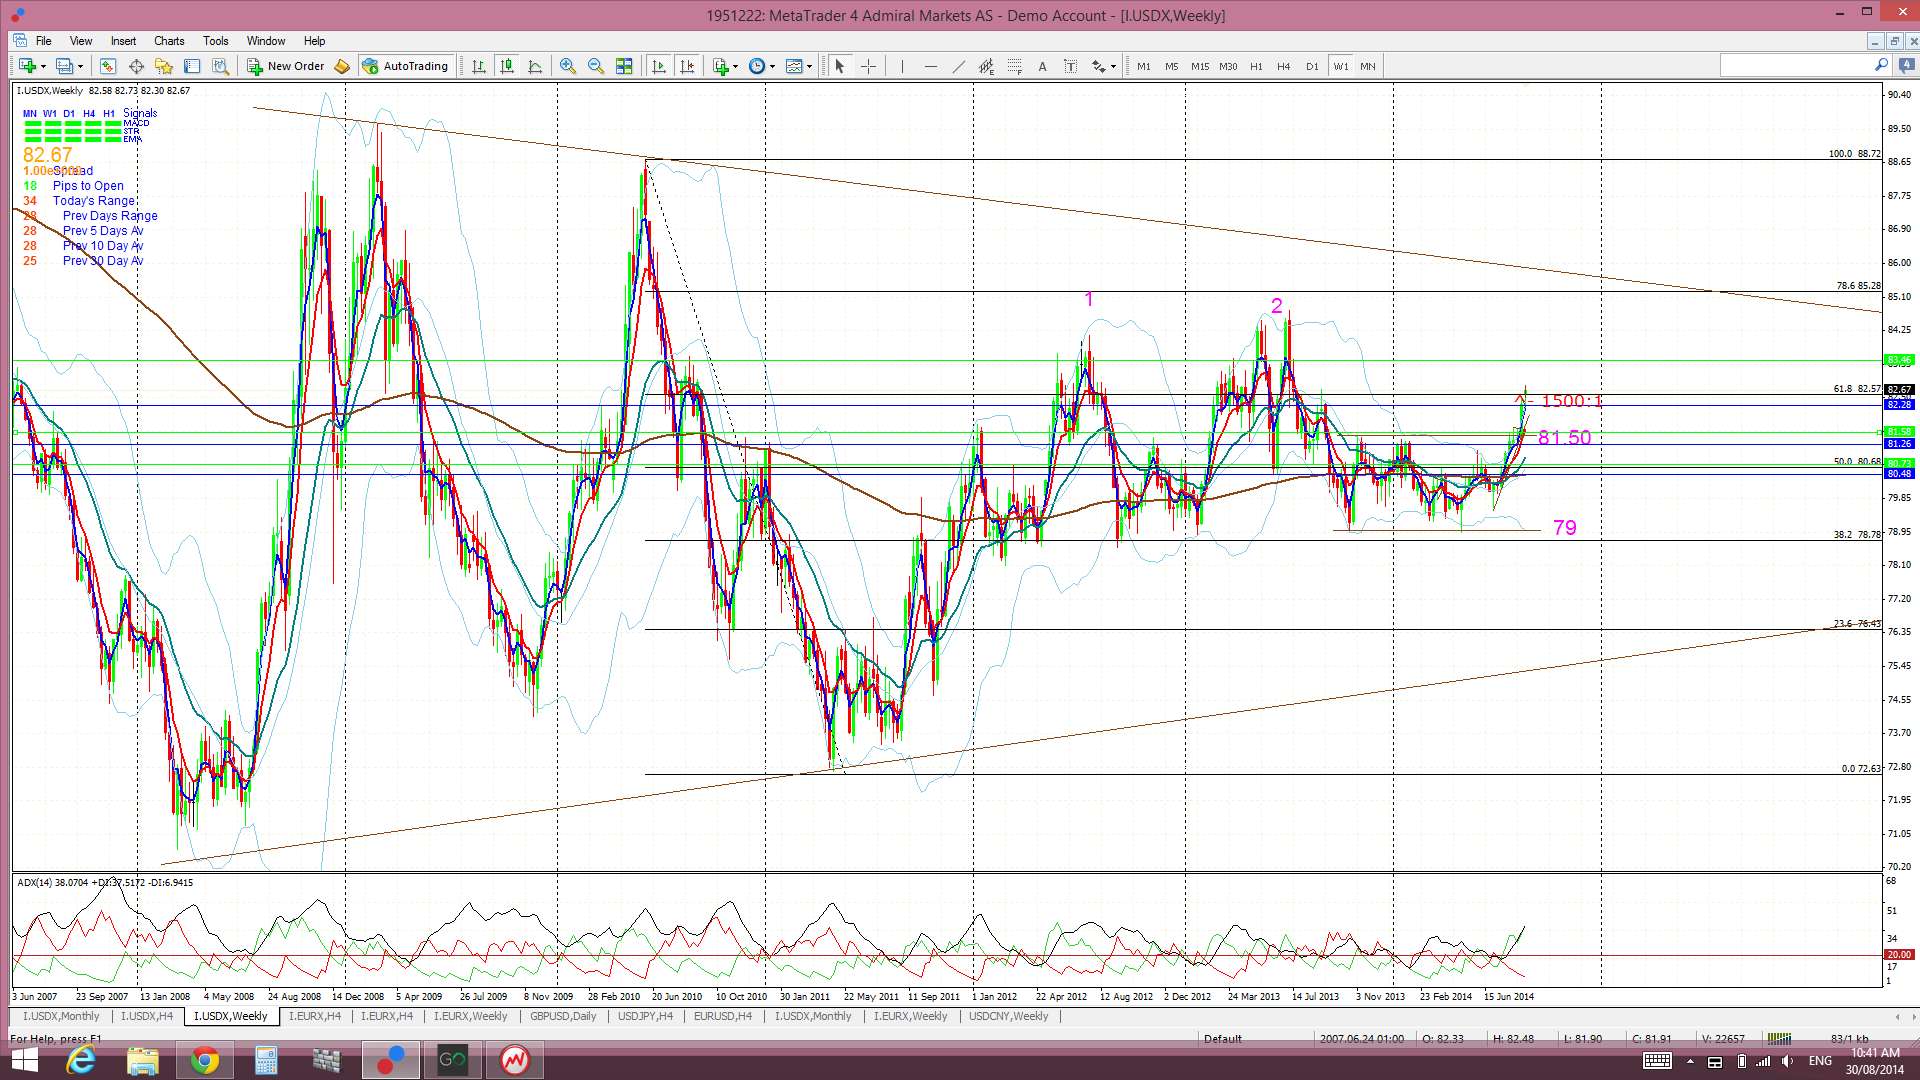
Weekly Ichimoku: Price is still trading ABOVE the weekly Cloud.
Daily: Price consolidated in another ‘Bull Flag’ pattern last week as it negotiated the next resistance level in its pathway. This was the 61.8% fib level of the 2010-2011 bear move located at the 82.50 region. Friday’s bullish close resulted in a ‘Bull Flag’ breakout and a close above this key resistance at 82.50.
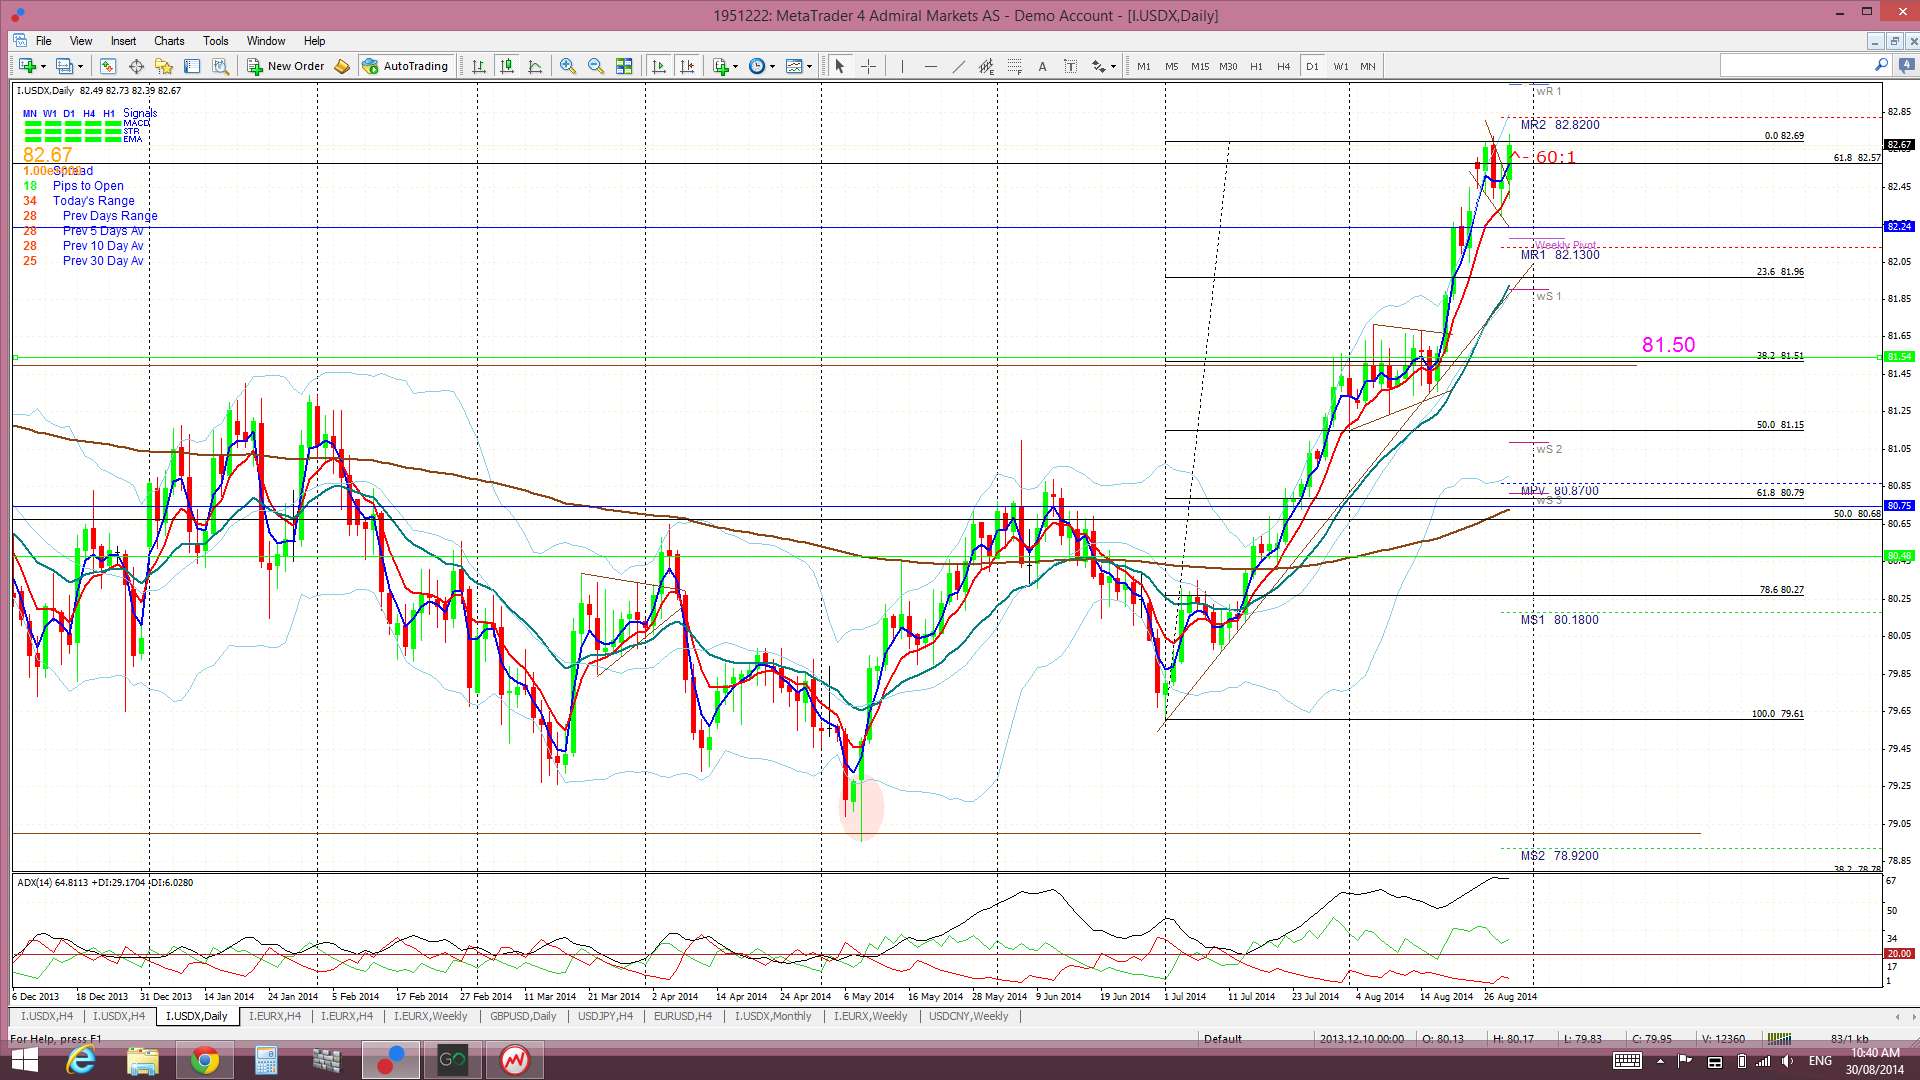
Daily Ichimoku Cloud chart: Price traded above the Cloud all week.
4hr: Price spent most of the week consolidating in a ‘Flag’ pattern near the 82.50 level which is the 61.8% fib of the 2010-2011 bear move. The index broke up and out of this ‘Flag’ pattern on Friday and also closed above 82.50.
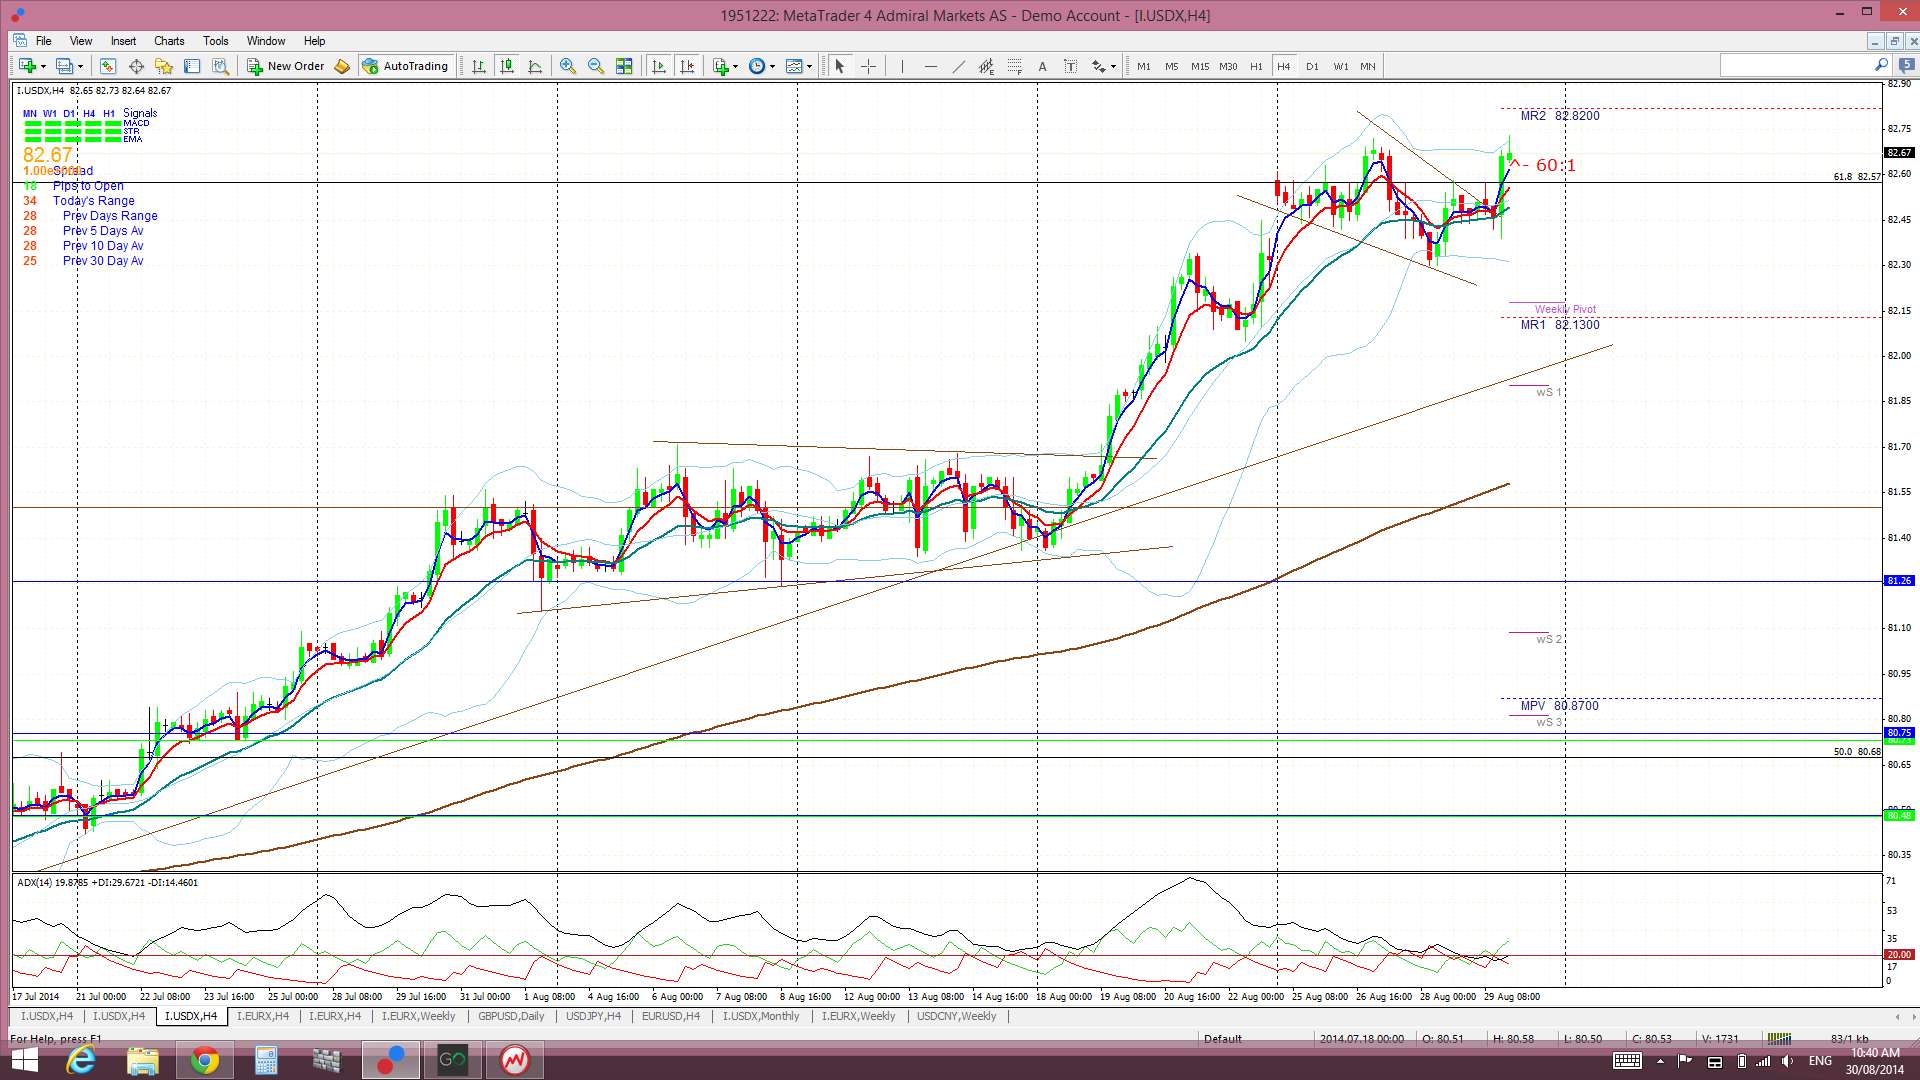
4hr Ichimoku Cloud chart: Price traded above the Cloud all week. This chart is still aligned with the daily chart and supports long USD trades.
EURX
Monthly: The August candle closed as a large bearish candle.
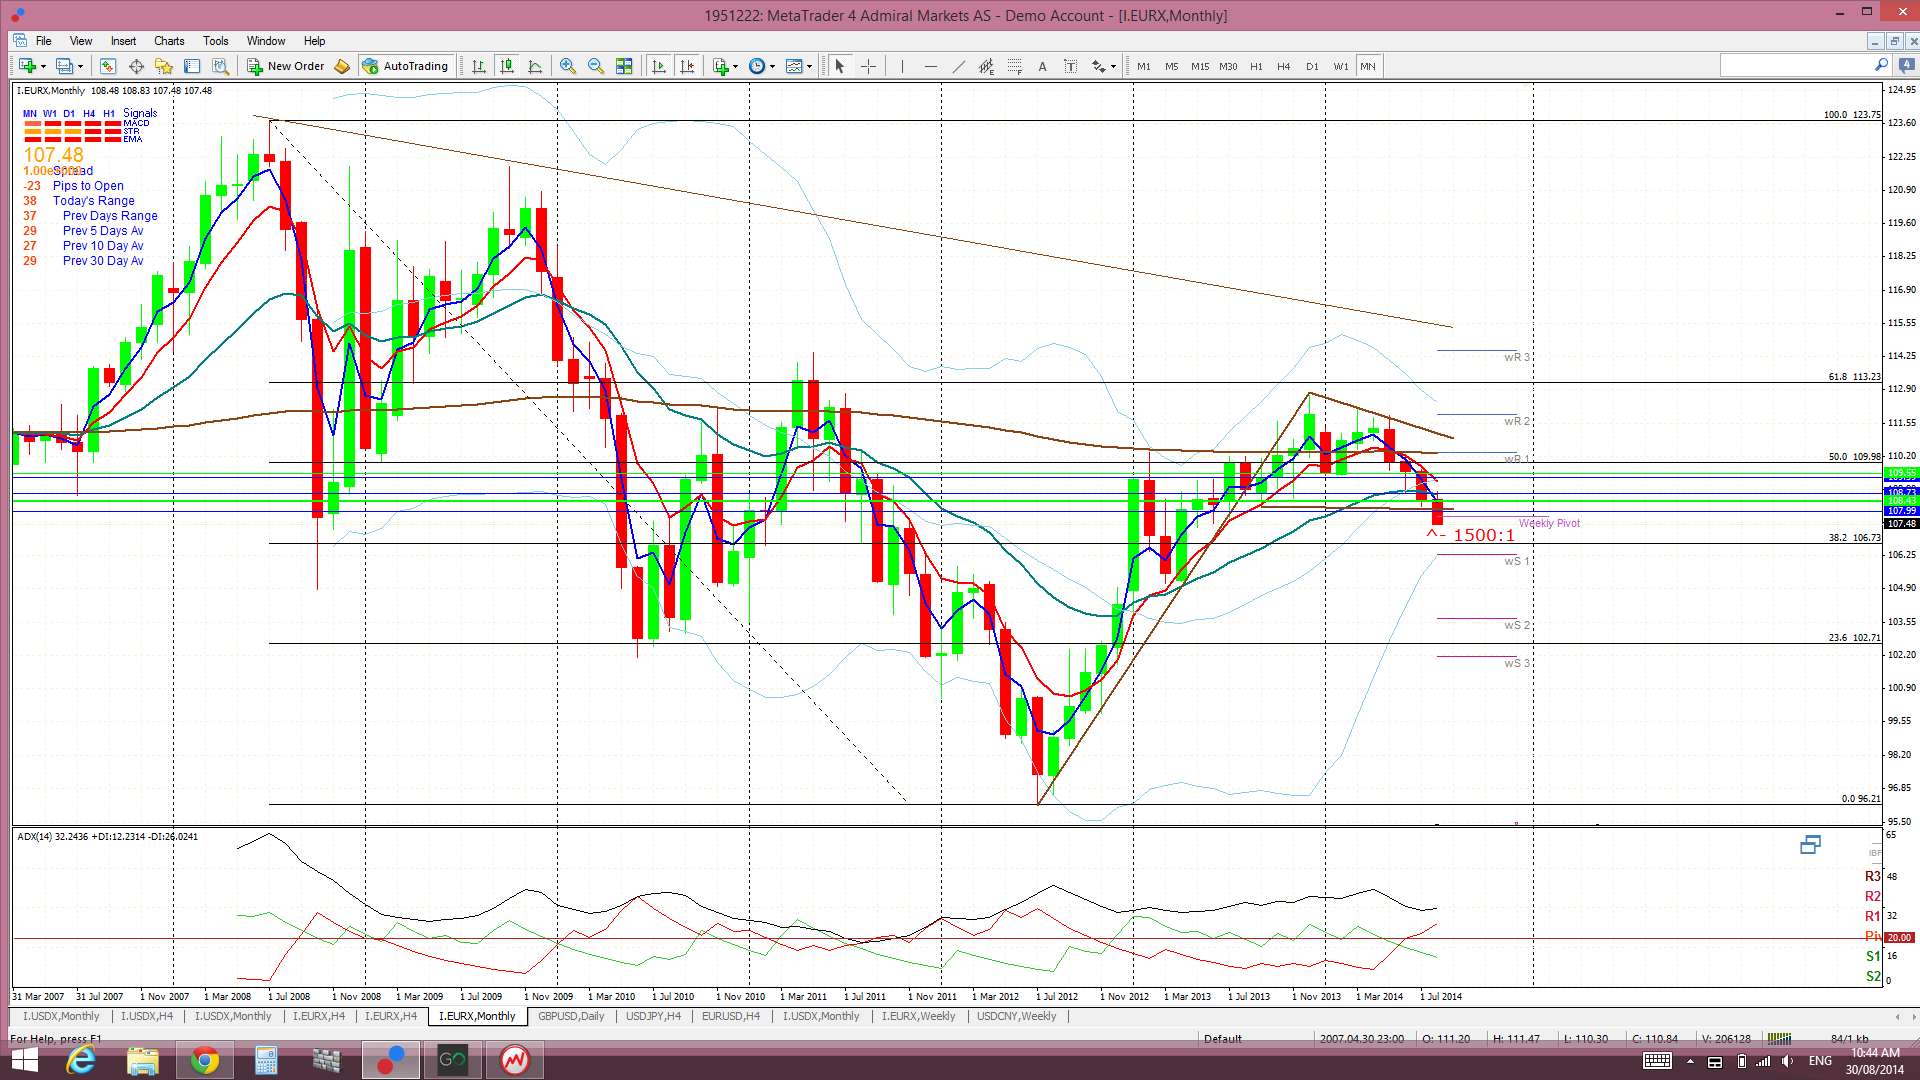
Monthly Ichimoku: The August candle closed within the monthly Cloud. This index has spent much of the last 9 months within the monthly Cloud. There may need to be a clear breakout here before decent trending markets return.
Weekly: The weekly candle closed as a bearish candle. It is trading below the weekly 200 EMA, the 108.5 level and now also below the revised support trend line.

Weekly Ichimoku: Price is still trading below the weekly Cloud.
Daily: Price gapped lower on market open and this open was below the weekly support trend line. This gap did not fill and the index continued to chop lower all week.
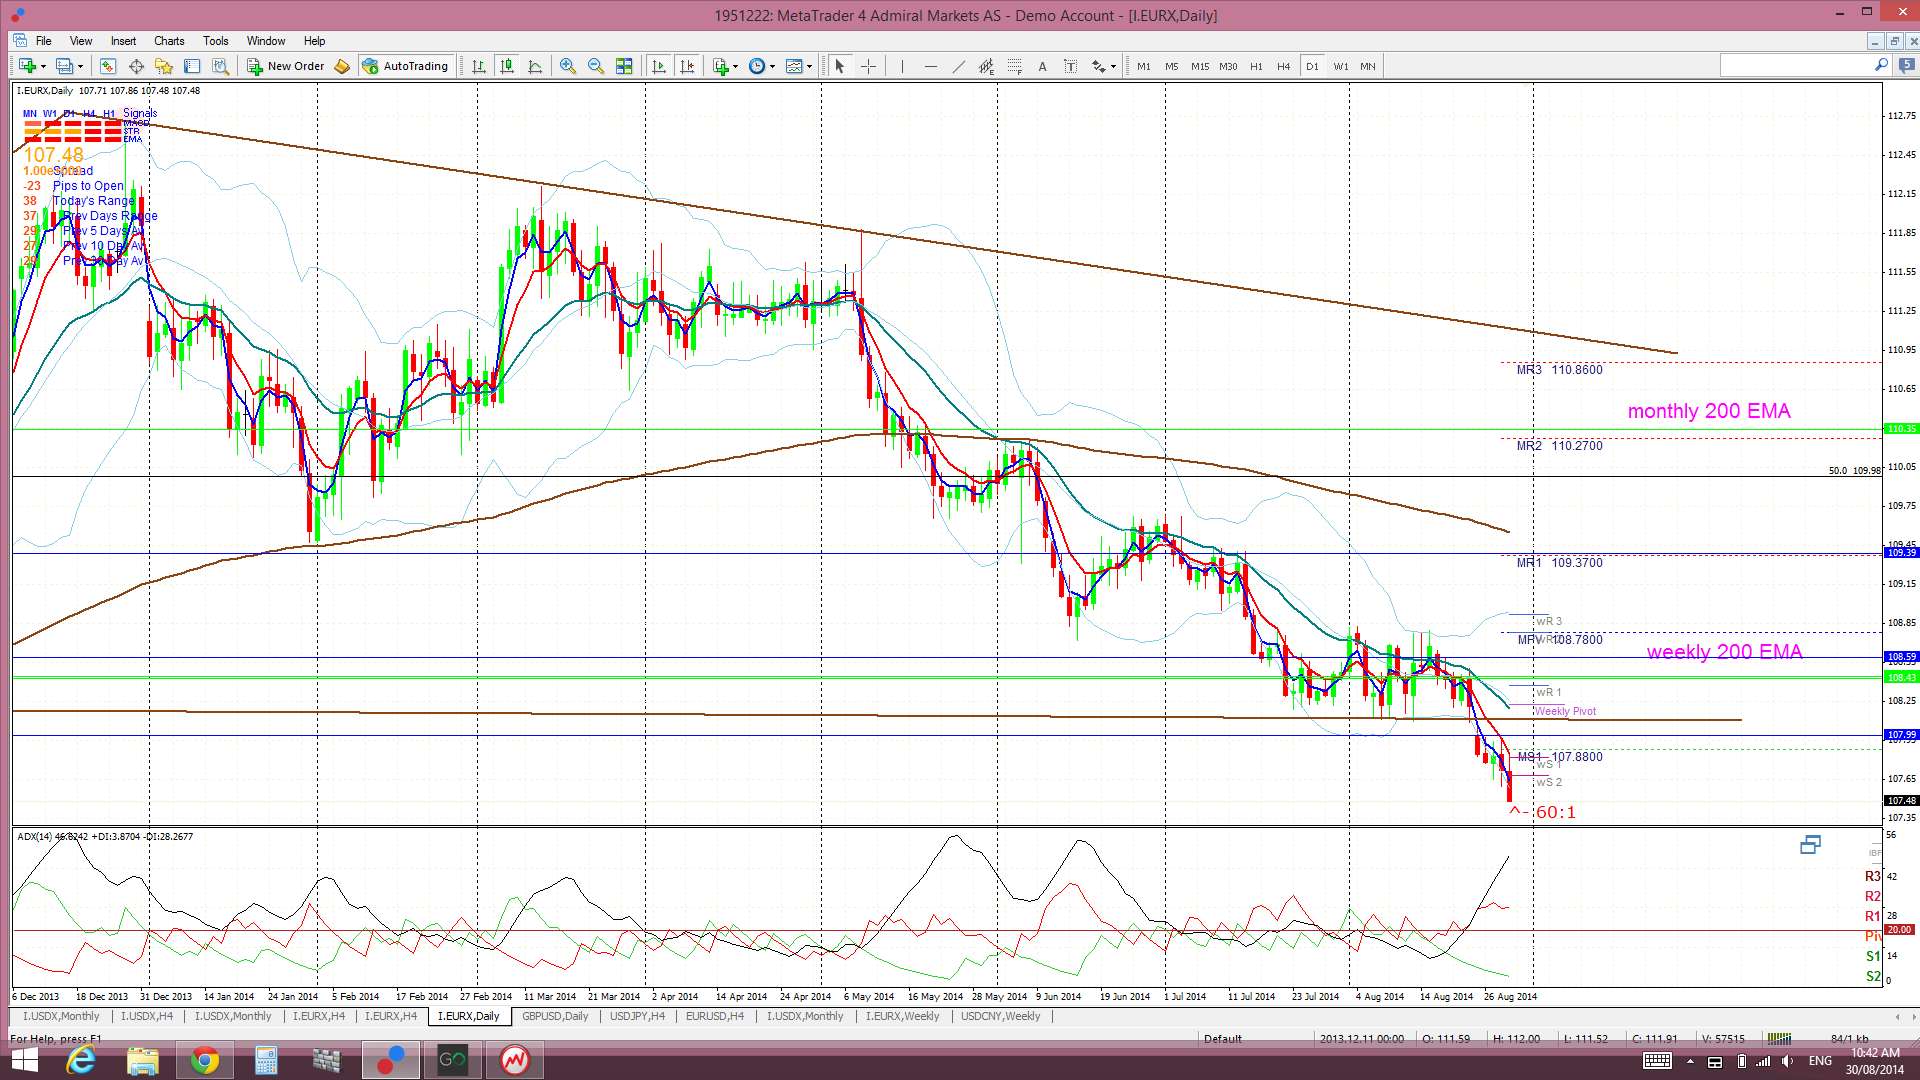
Daily Ichimoku Cloud chart: Price traded below the Cloud all week.
4 hr: Price gapped lower on market open and trended down from there all week.
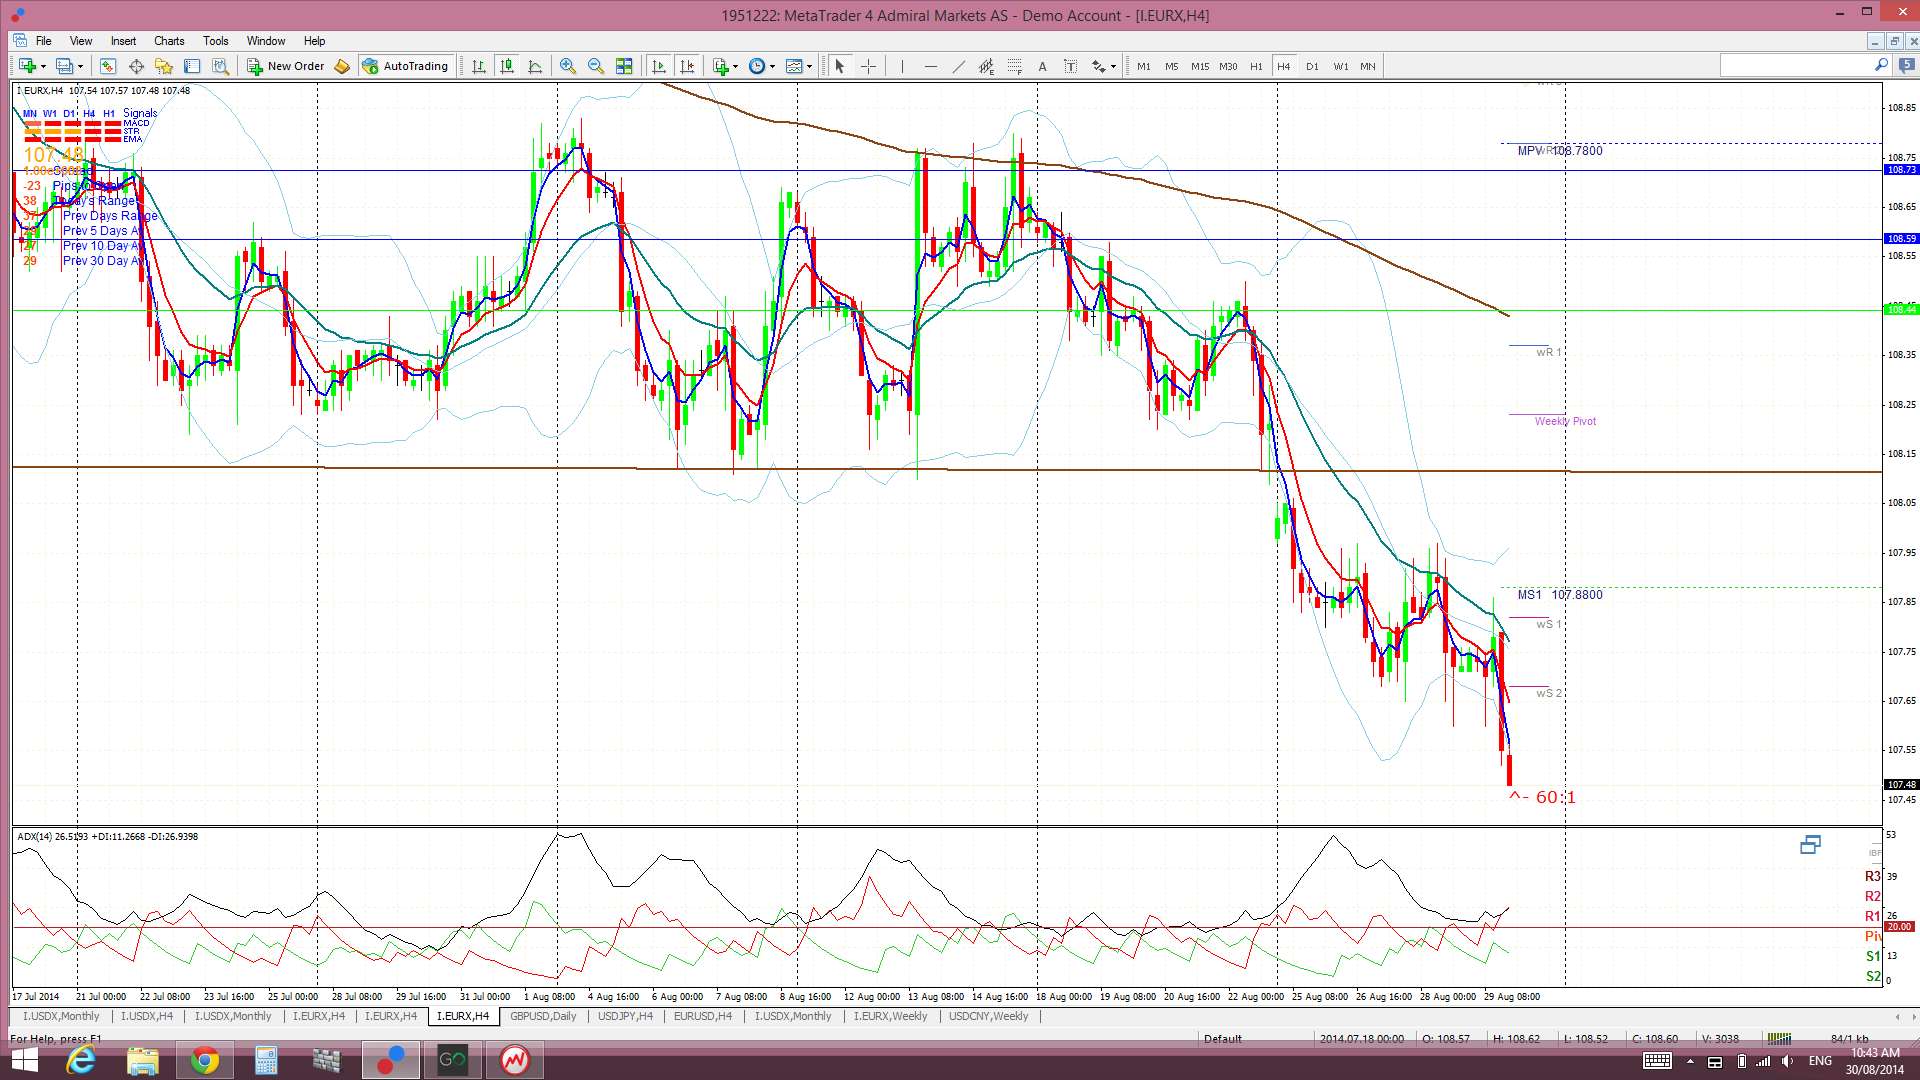
4 hr Ichimoku Cloud chart: The EURX traded below the Cloud all week below. This chart is aligned with the daily chart and suggests short EUR.
Comments:
I have been watching two key levels on the FX indices over recent weeks:
- USDX: the 81.50 resistance level. The index has now made a monthly candle close above this key resistance level for the first time in 11 months.
- EURX: the 108.5 support area: this is the region of the weekly support trend line, the bottom of the weekly Cloud and the weekly 200 EMA. The index is now below all of these support levels.
USDX: the USDX has had another bullish week. It made a bullish monthly close above the 81.50 level and this marks a monthly breakout from the 81.50 – 79 trading channel for the first time in 11 months! The index has also made a bullish monthly close above the 82.50 level. The 82.50 level is the 61.8% fib of the last major swing bear move of 2010-2011. As mentioned last week, 61.8% fib levels are key Fibonacci levels as they are often regarded as the demarcation point for a trend change. That is, a close and hold above the 61.8% fib level can often signal a change in overall trend. In this case, the close above the 82.50 level could signal further bullish continuation but we will need to see the index hold above this level to confirm the bullish breakout. There is a lot of high impact data next week, culminating with NFP on Friday, which may help to confirm the picture on the USDX.
The monthly chart shows that the next two main resistance levels after this 61.8% fib at 82.50 and, apart from the usual psychological half and whole numbers, would be the monthly 200 EMA near 83.50 and, then, the 78.6% fib near the 85 level. I still would not be surprised to see this index test the 81.50 level again even if there is to be bullish continuation. This was a major resistance level for the index and major levels often tend to be tested before any continuation and so traders need to be wary of this possibility.
EURX: the EURX closed lower for the week. The index has now closed below the weekly Cloud, 108.5 level, the weekly 200 EMA and now also below the recently revised the weekly support trend line. This is a significant bearish development for the EURX as divergence between the Eurozone and US economies continues. This break and hold below the revised weekly trend line might signal further falls as this had seemed to be a ‘last line of defense’ for the index. The ECB meets next week and news from this meeting may have significant impact on the EURX.
NB: I am away still and my ‘Trade Week Analysis’ may not be posted until Monday 1st September.
Note: The analysis provided above is based purely on technical analysis of the current chart set ups. As always, Fundamental-style events, by way of any Ukraine, Euro zone or Middle East events and/or news announcements, continue to be unpredictable triggers for price movement on the indices. These events will always have the potential to undermine any technical analysis.
The post USDX prints a bullish monthly close: FX Indices Review for 01/09/14 appeared first on www.forextell.com.