US Stocks have made a bad start to the month and, in doing so, have triggered a few warning signals that can’t be ignored. There seems to be some ‘Flight to Safety’ movement out of stocks and into bonds as well. As always, ‘One Swallow Does not a Summer Make’ so, look for weekly confirmation signals.
S&P500 daily: has broken the daily support trend line that had been intact since Nov 2012, a period of almost 2 years.
- A hold below this trend line would have me looking for this index to test the 1,900 horizontal S/R level.
- Further key bearish levels below the 1,900 include the 50% fib of this recent bull run near 1,685 which is also near the monthly support trend line.
- Below these levels is the 61.8% fib near the 1,577 level which is also the major trend line previously broken on the monthly chart:

S&P500 monthly chart: showing the significance of the 1,577 level:

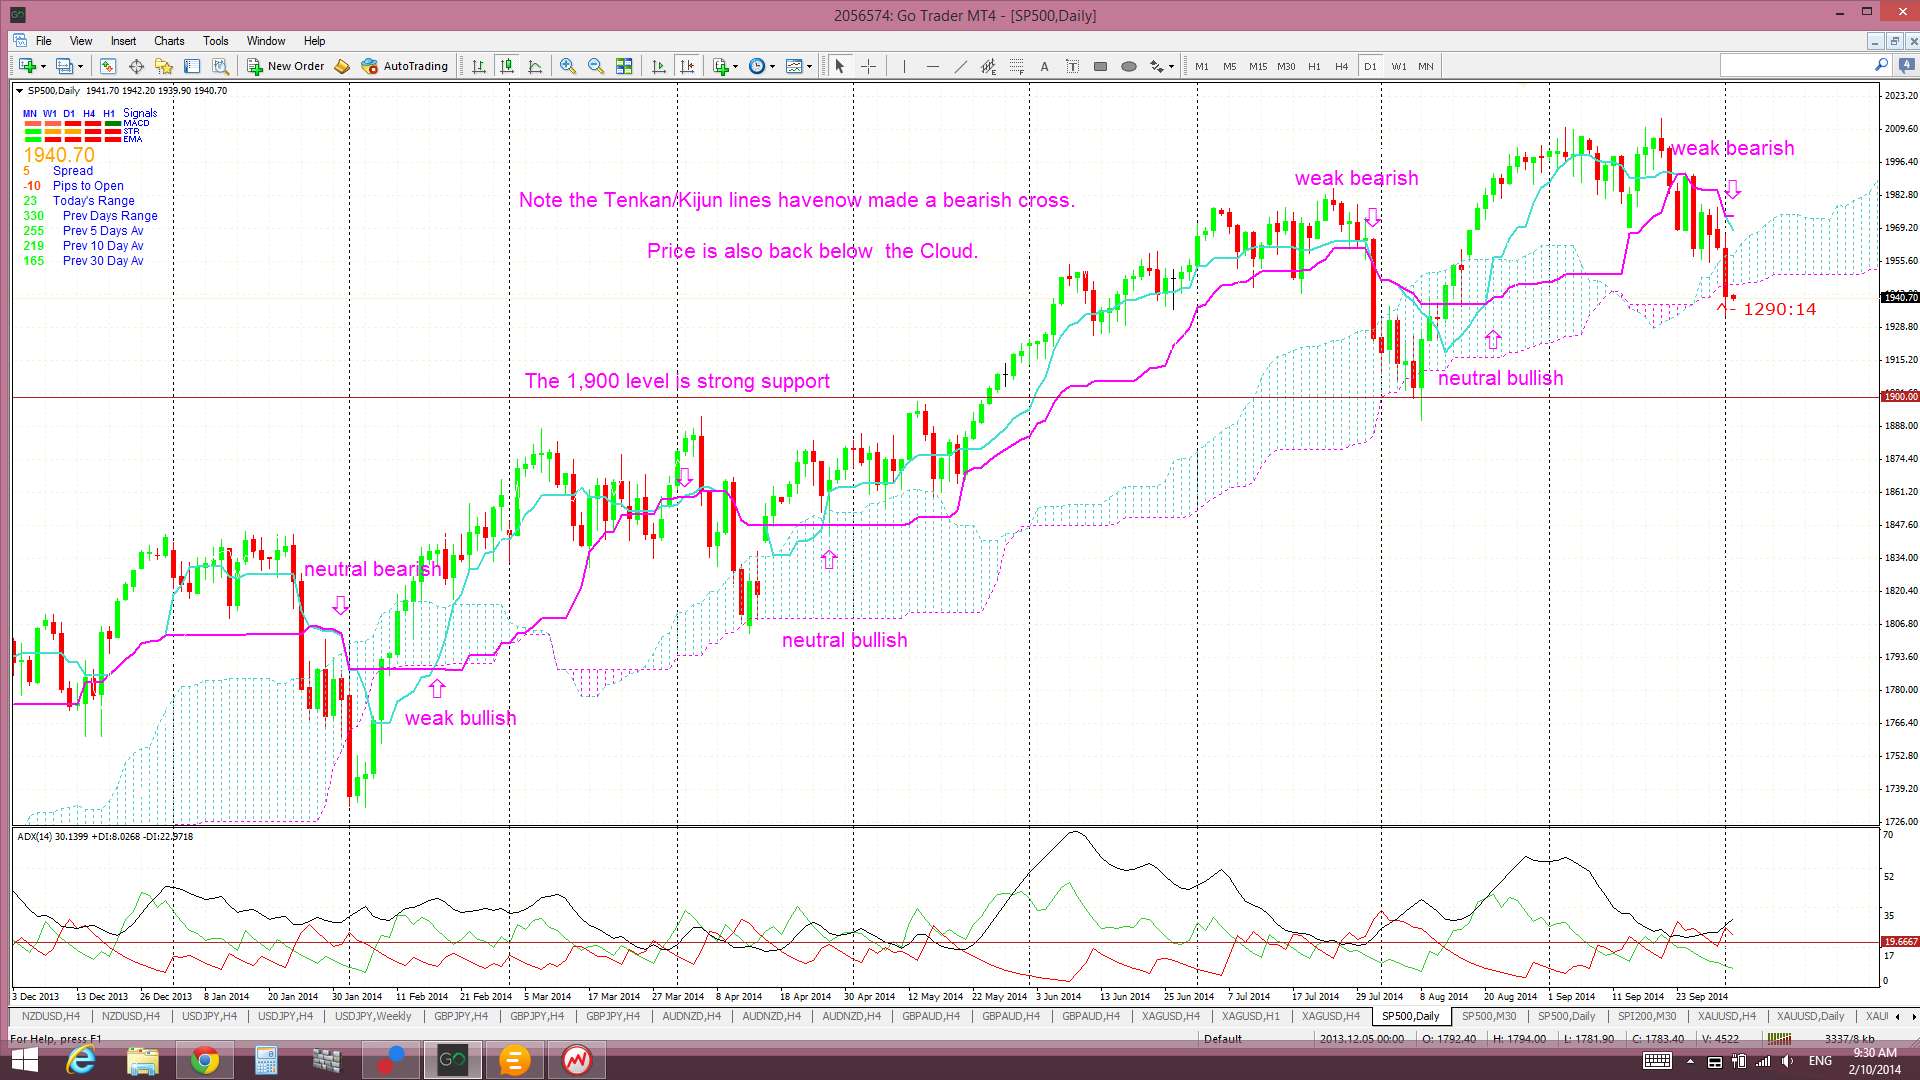
S&P500 daily Ichimoku: this has triggered a new bearish Tenkan/Kijun cross and moved below the daily Cloud. The signal is deemed ‘weak’ though as it evolved above the Cloud:
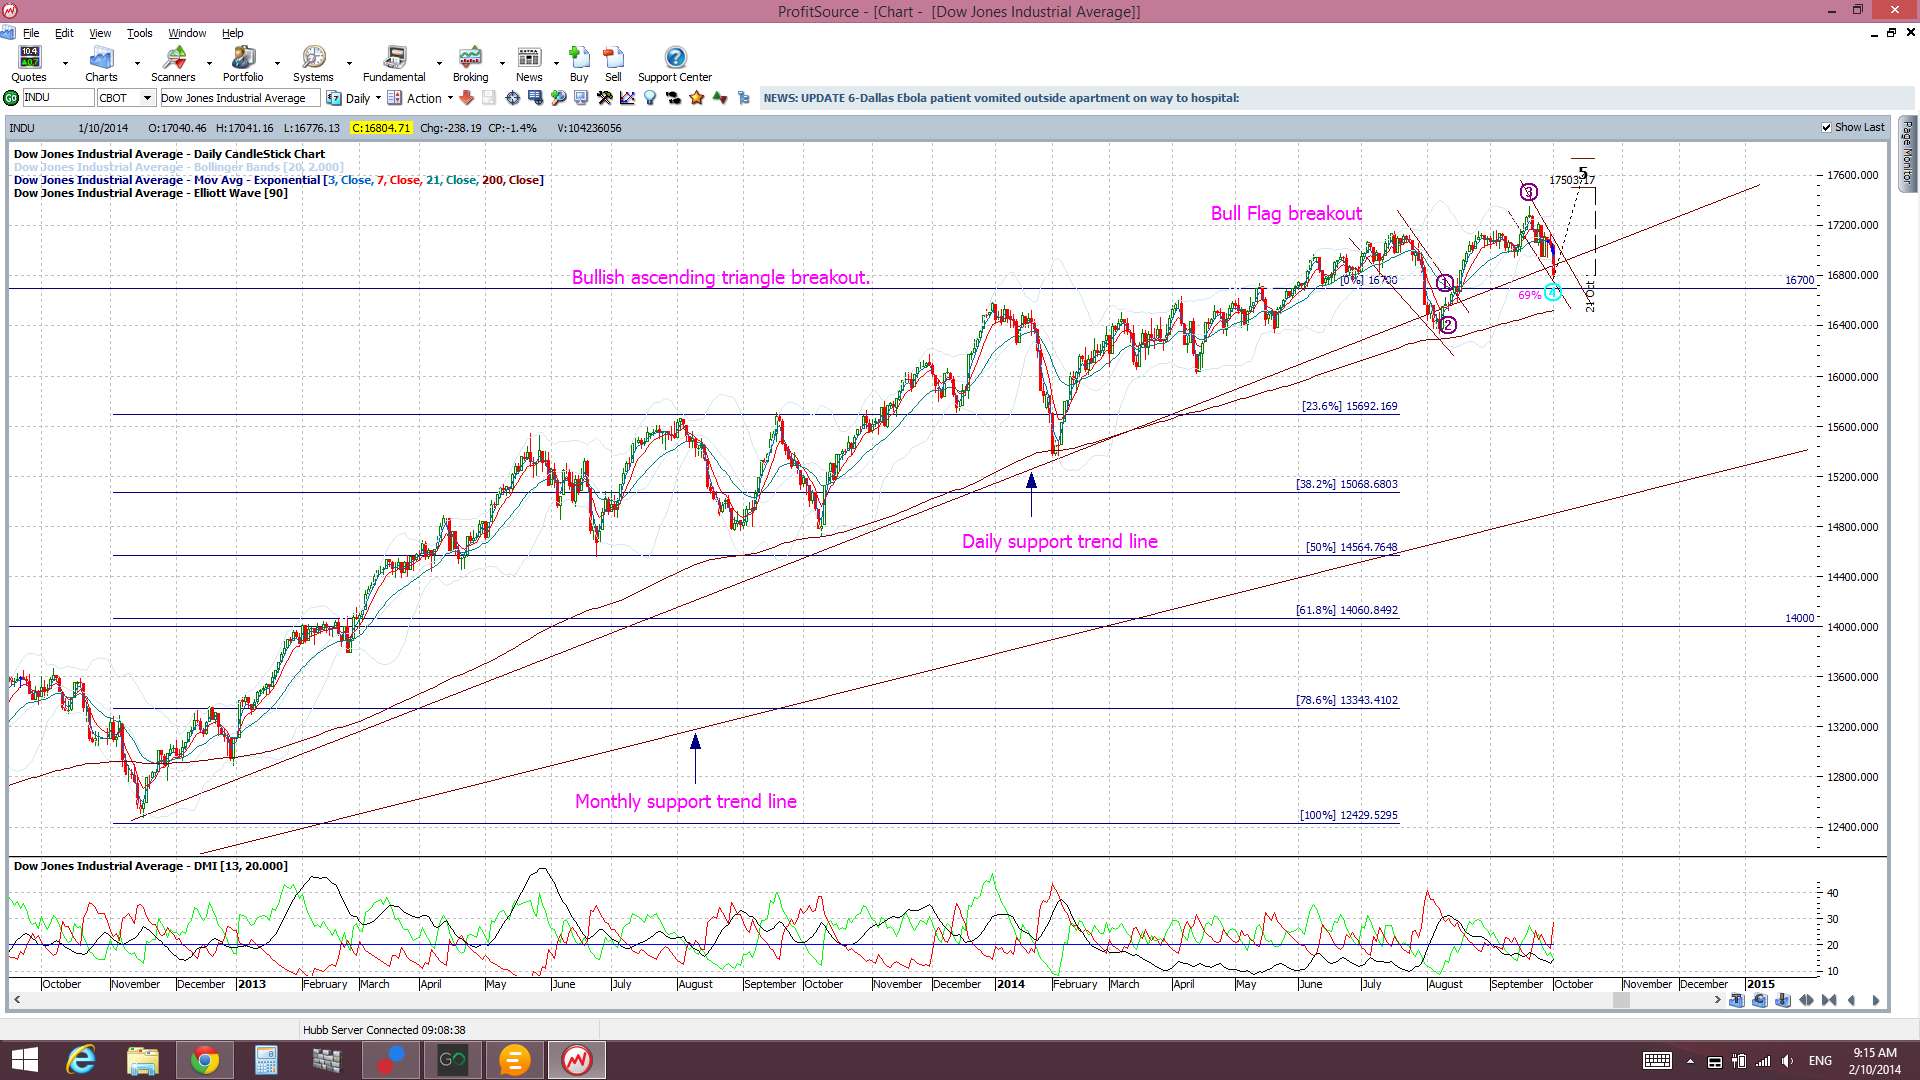
DJIA: has index also broken below the daily support trend line. A word of caution here though. This index made a bearish breakdown a few weeks ago only to have price action consolidate into a Bull Flag and subsequently make a bullish breakout. I have drawn similar ‘Flag’ trend lines again here now and will watch for a break of these for guidance. Any break and hold below the 16,700 would be quite bearish though and I would then be looking for a move to test the monthly support trend line:
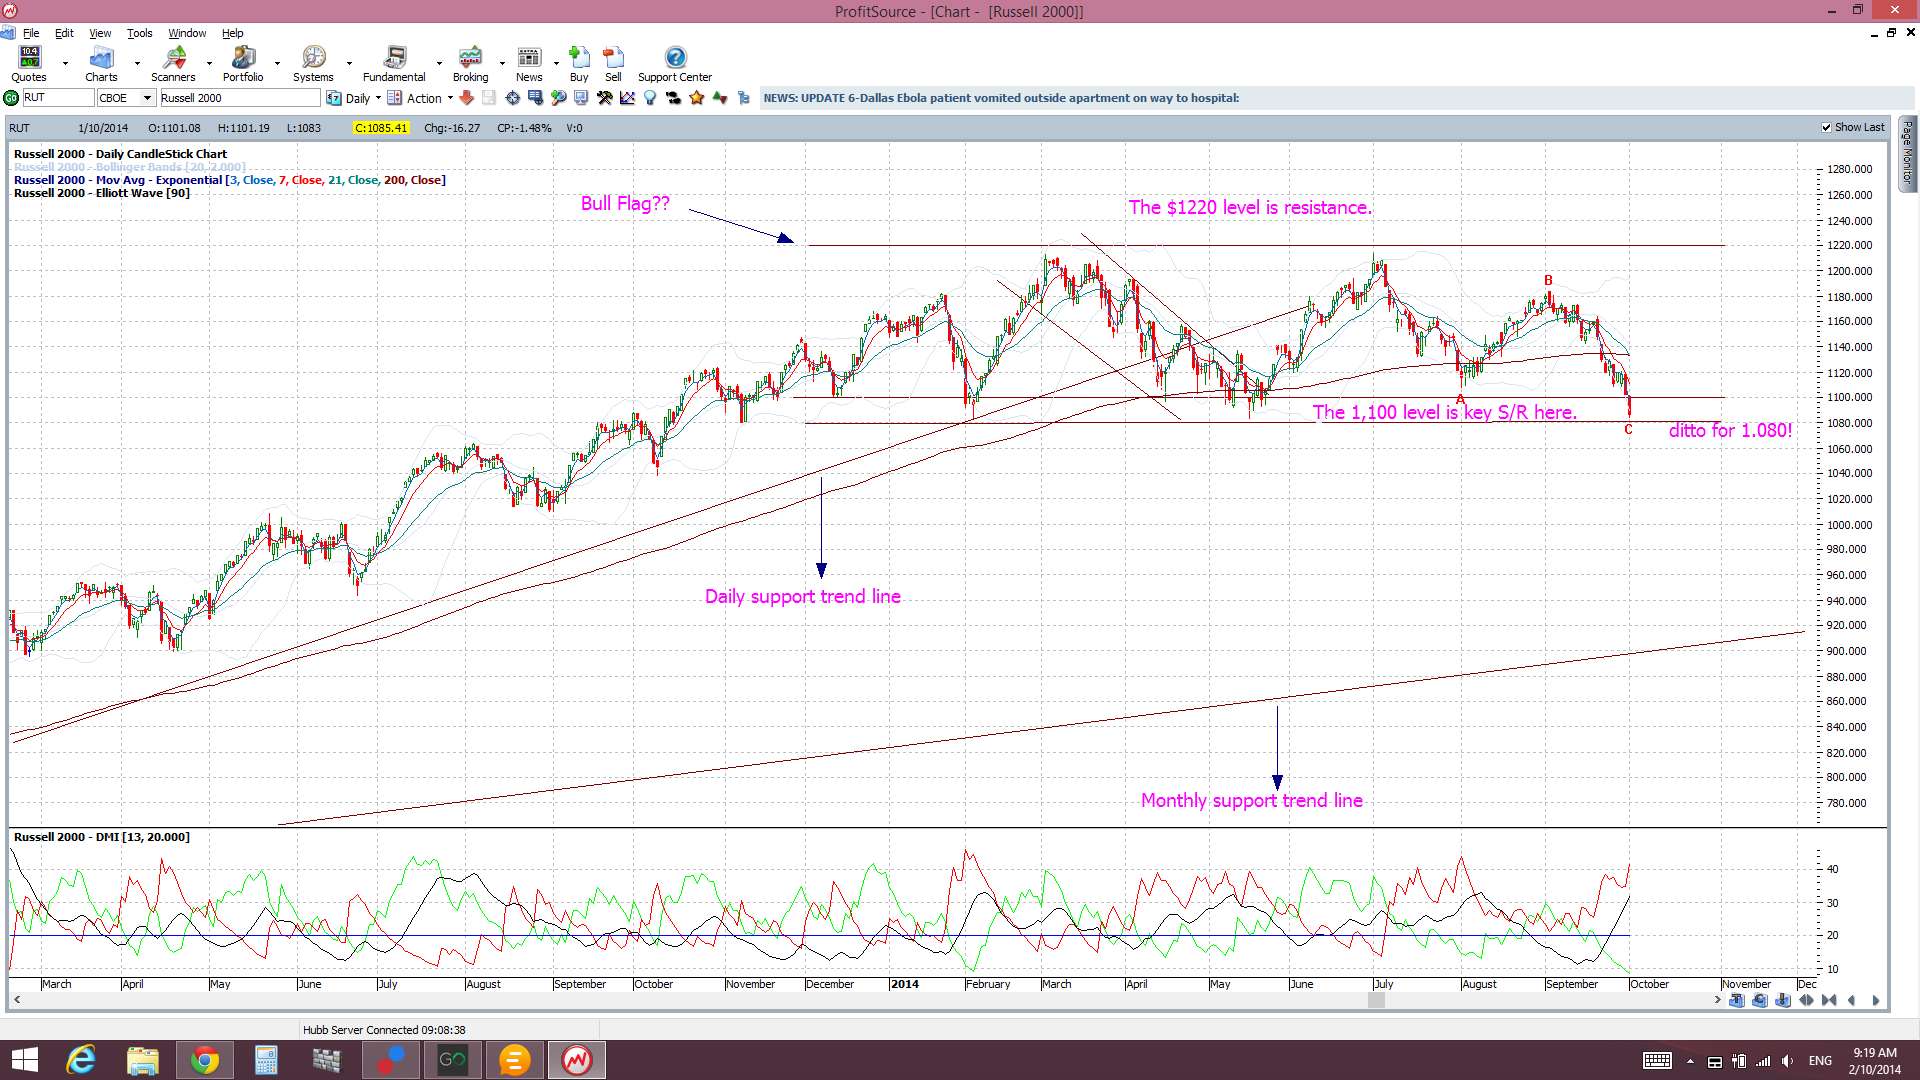
Russell 2000: this small caps index has made a close below the key 1,100 level but I want to a weekly close below this level for confirmation. Also, any weekly close below the 1,080 would be especially bearish and suggest a move down to monthly support tend line:
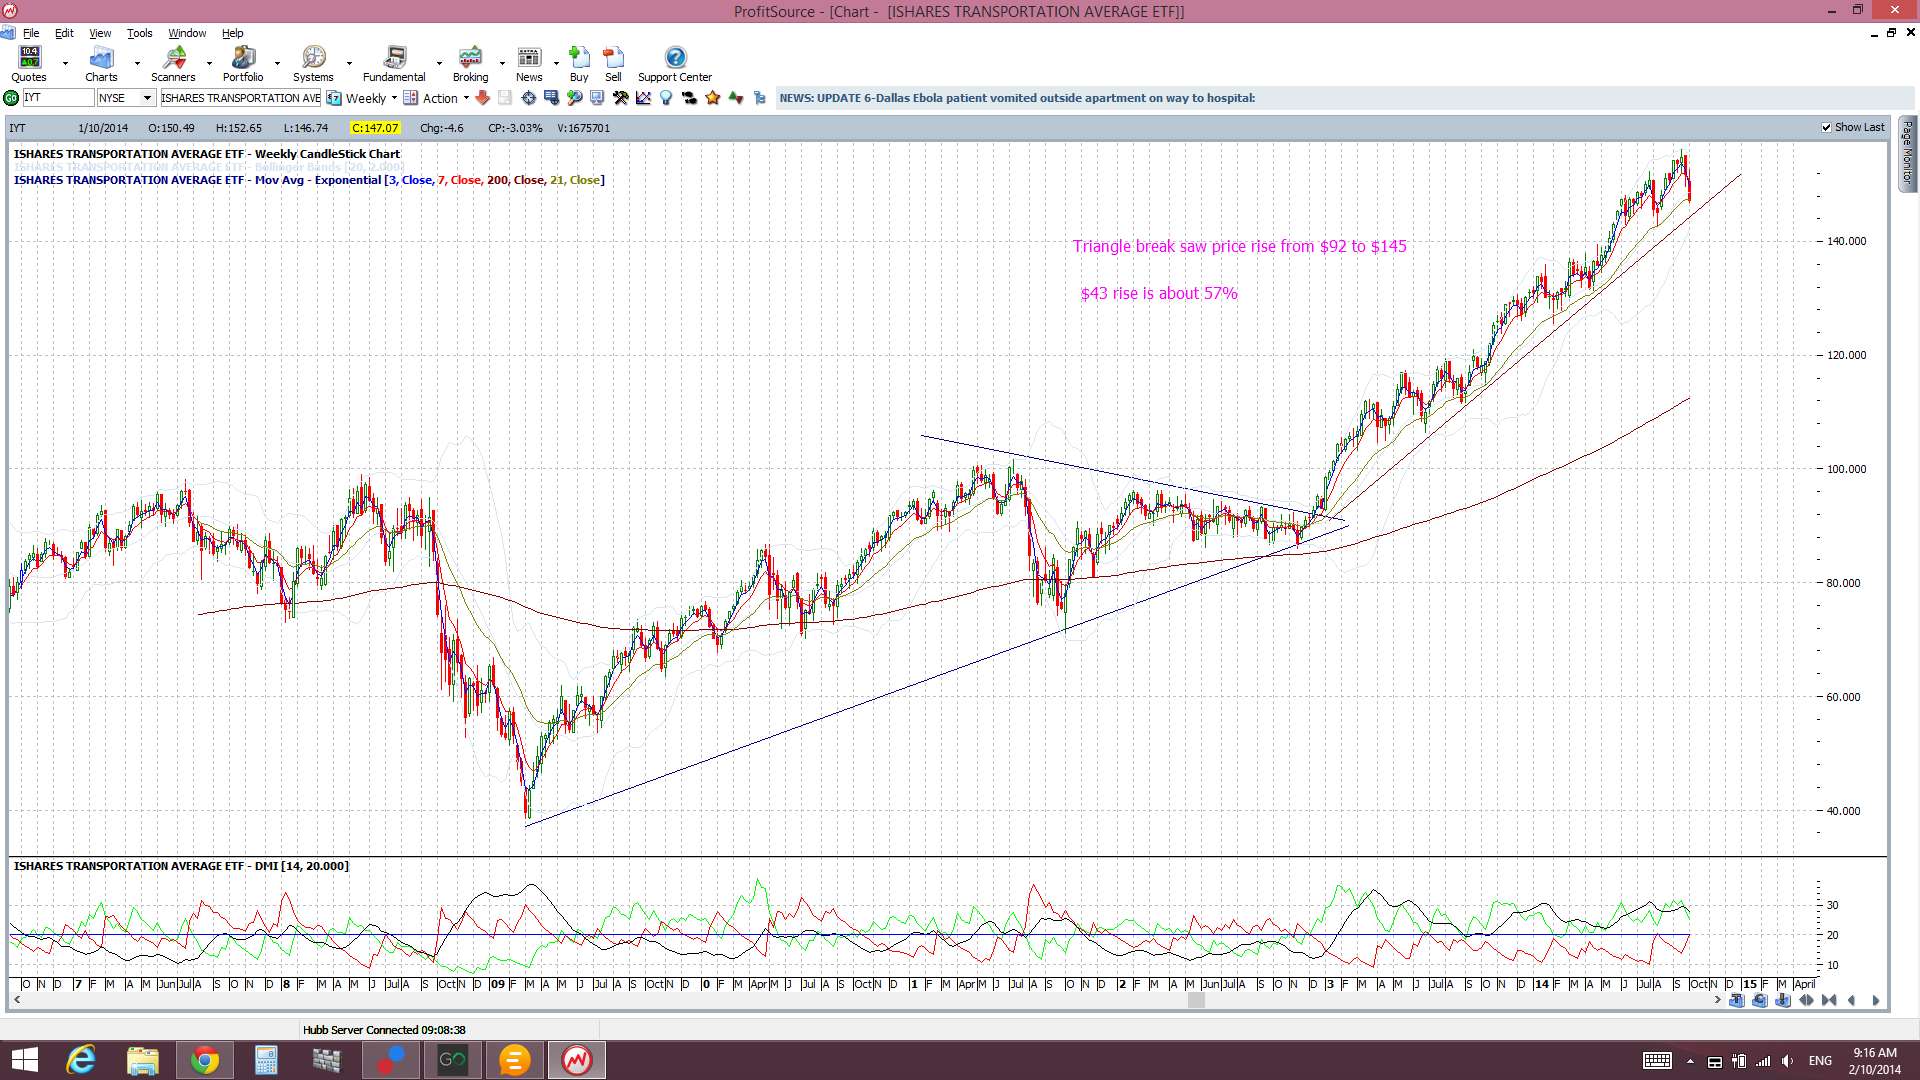
IYT: the transport ETF is looking vulnerable as it trades down near weekly support. I’ll be watching to see where this closes for the week:
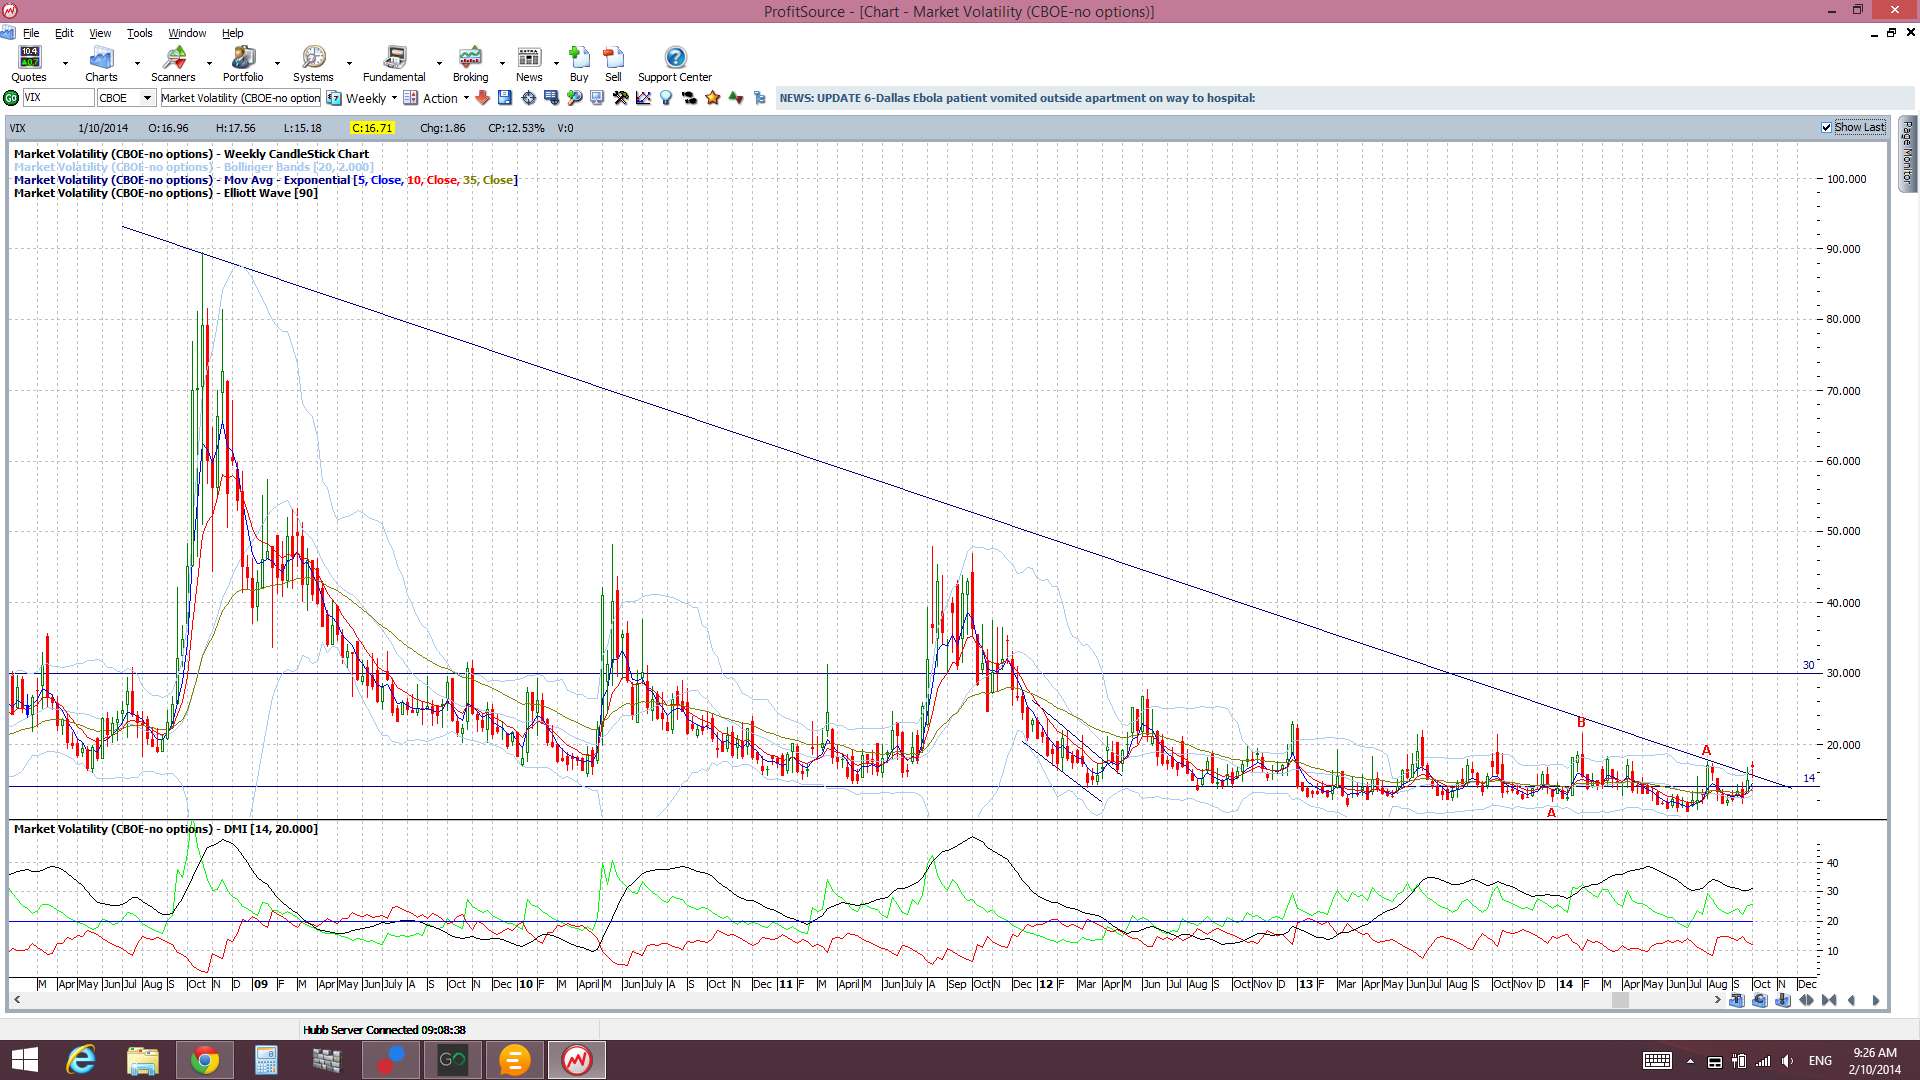
VIX weekly: the VIX may be about to make a weekly close above the bear trend line. This would be significant even though it is still below the 30, and even 20, level:
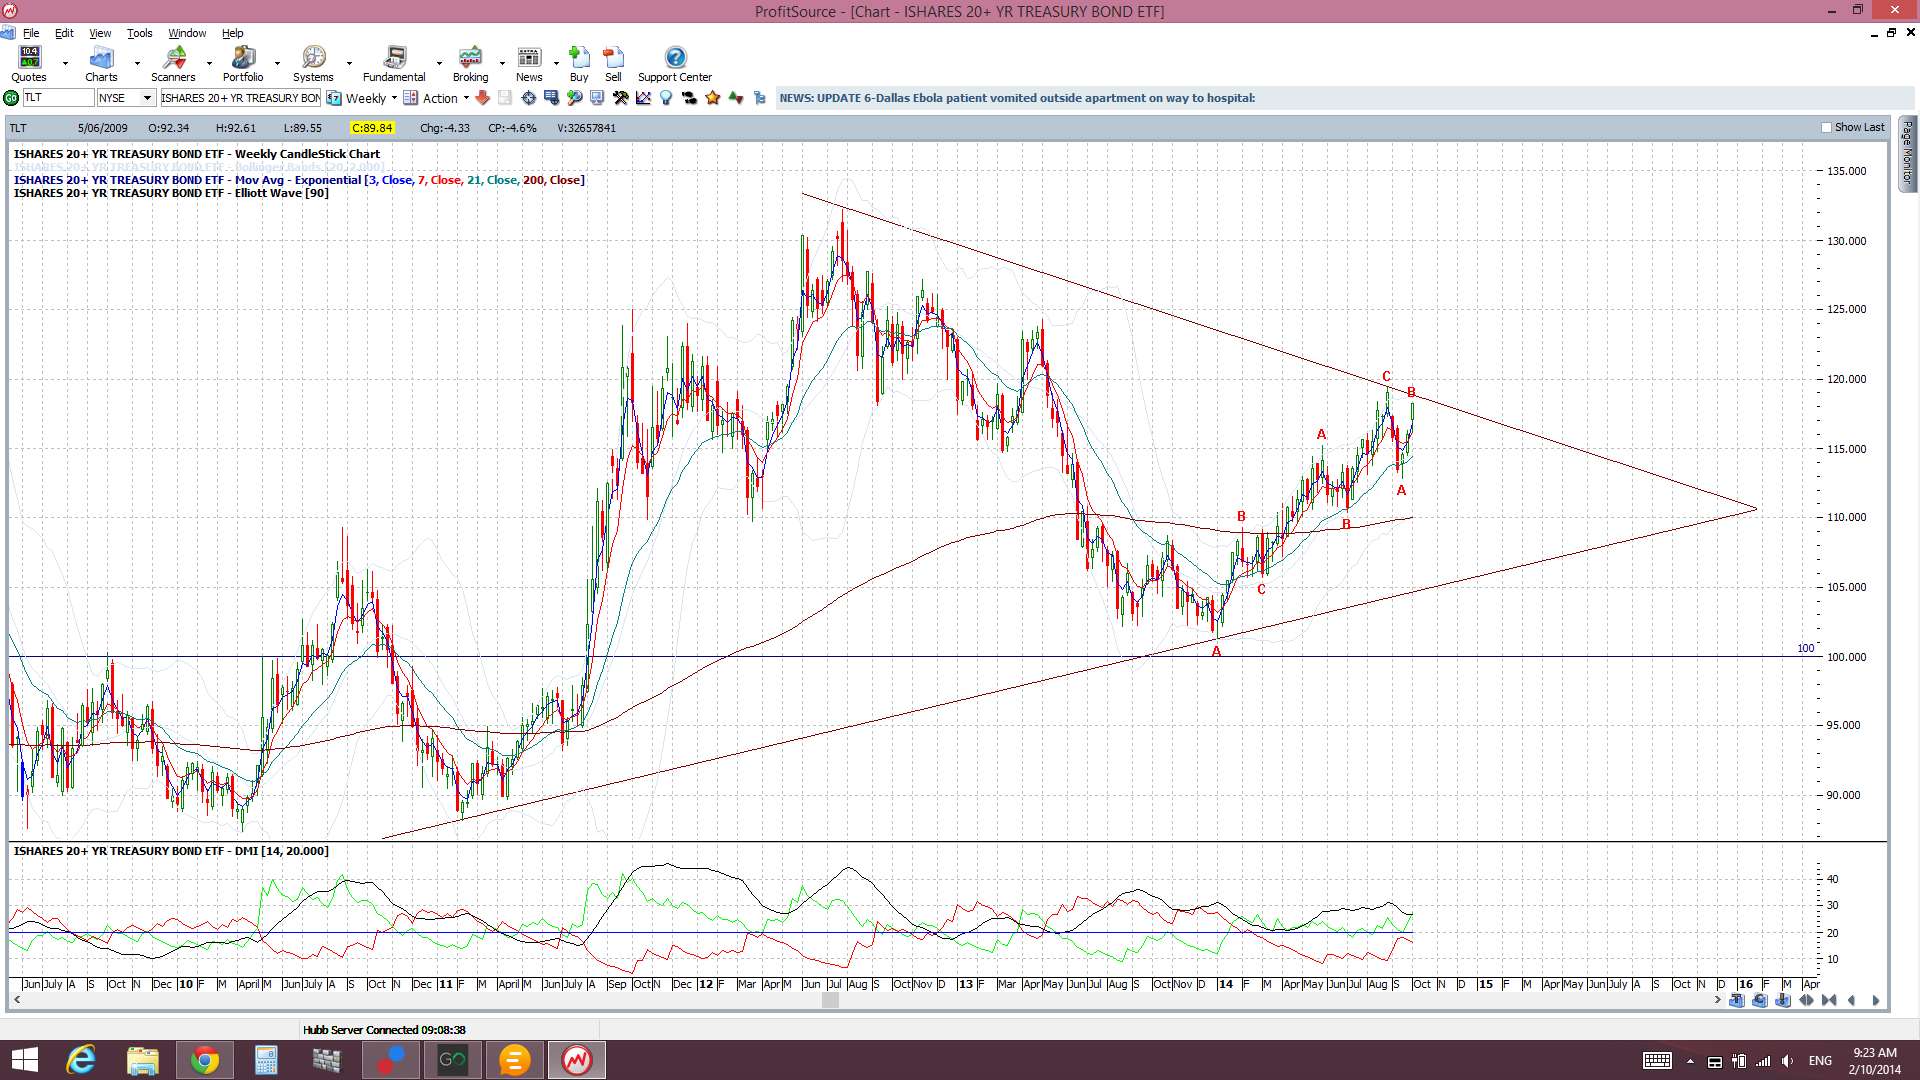
TLT weekly: I note this Treasury Bond ETF has moved up to near the upper triangle trend line. The weaker than expected US data overnight must have folks thinking that low US interest rates are here for a bit longer! Also, folks often move to bonds when they’re worried about the stock market. I’ll be watching for any breakout:
An elementary explanation of the relationship of Bonds, Bond Yields & Interest rates can be found through this link. Some correlations are listed below:
- A rising bond yield is USD bullish.
- A falling bond yield is USD bearish. (yields and the USD slipped a bit overnight)
- ‘Flight to Safety: stocks decrease, Â bonds increase, bond yields decrease. (we saw a bit of this type of activity overnight too)
- Generally, as interest rates rise then bond prices fall: as per the diagram:

The post US Stocks, Bonds & VIX: the warning signals. appeared first on www.forextell.com.