The future for Gold is looking increasingly bright. Fear of deflation, and further Central Bank stimulus measures to address this, plus the current dizzying height of the USD all seem to be pointing to the Long Gold trade as a lay down misere. An article discussing the path of Gold during periods of deflation can be found through this link. Technical patterns are supporting these fundamental observations and now it seems a matter, for those not already in the trade, of finding out where it might be safe to enter.
Gold monthly: the monthly chart of Gold shows that price has bounced up off the technical support level of the 61.8% fib of the 2008-2011 bull run. The December candle was a big give away here with a bullish engulfing candle print. January looks set to print a bullish follow through candle, at this stage, as well:
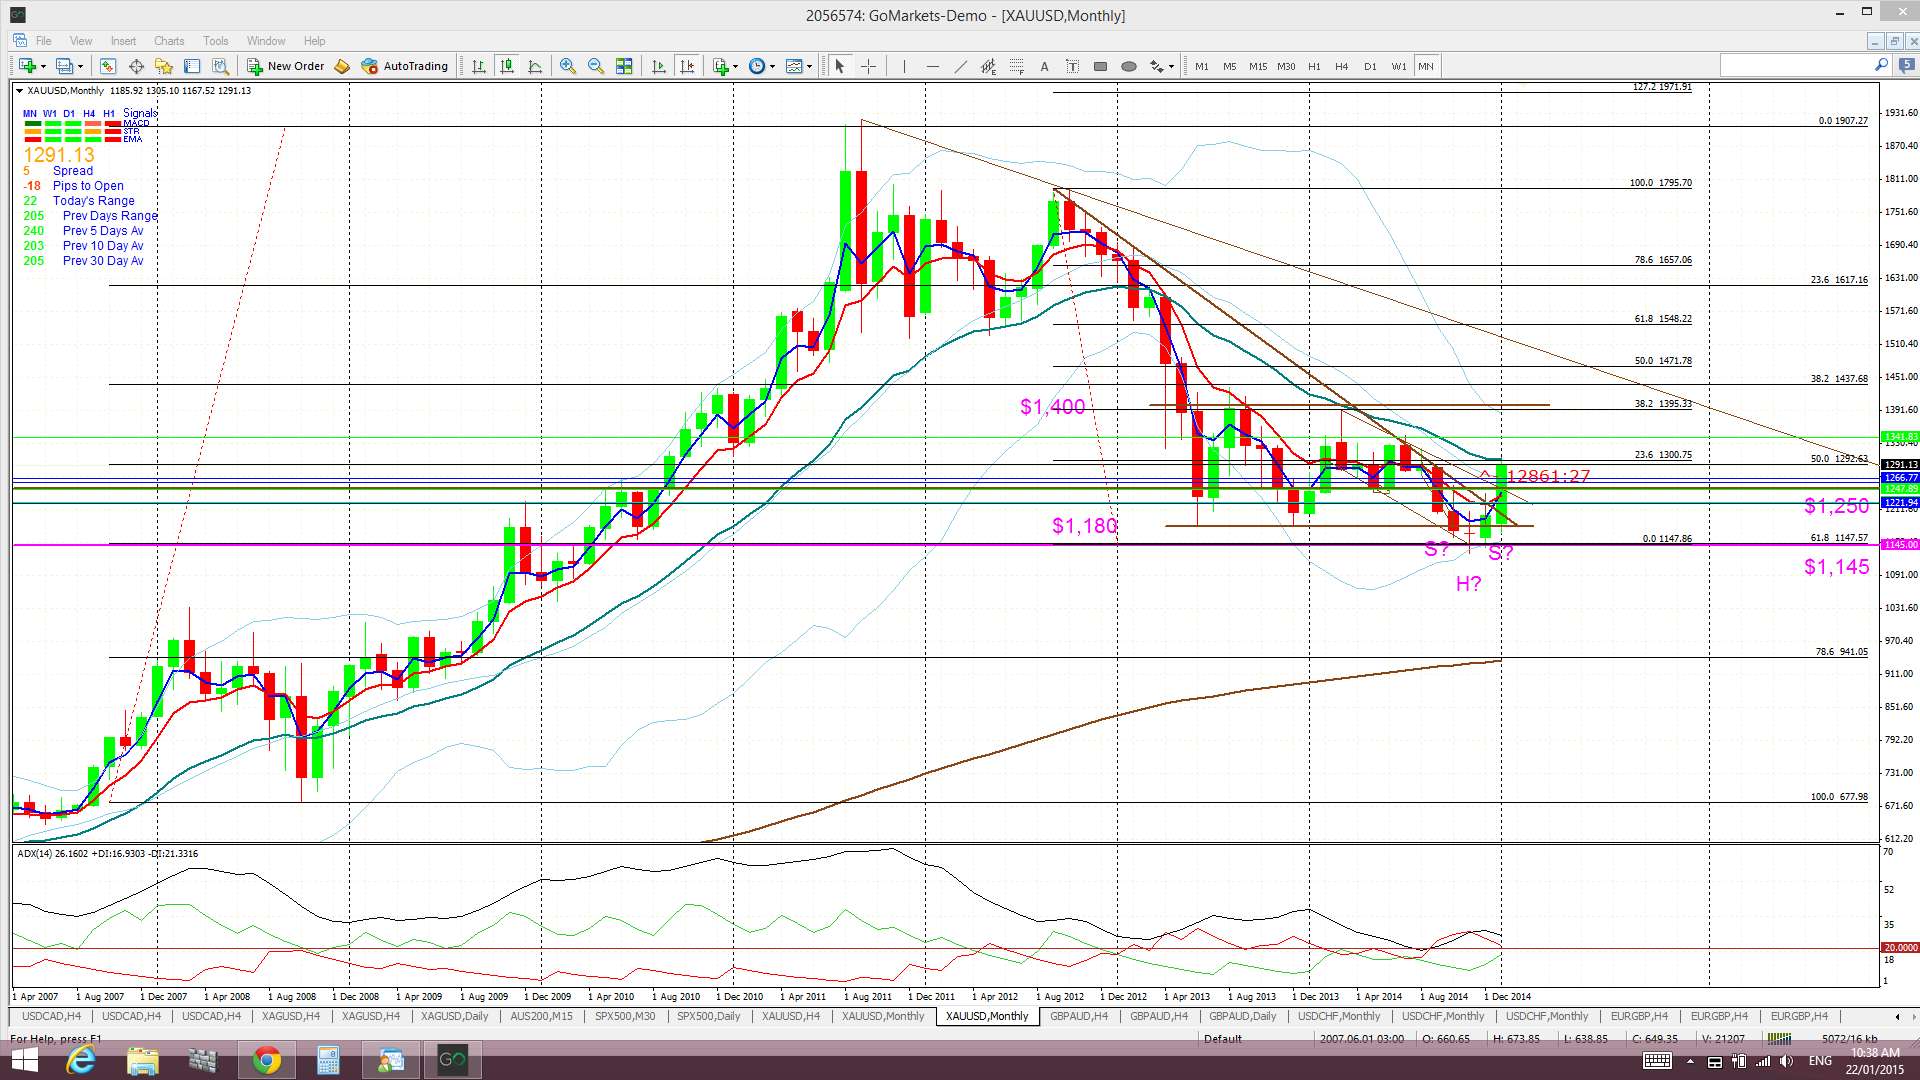
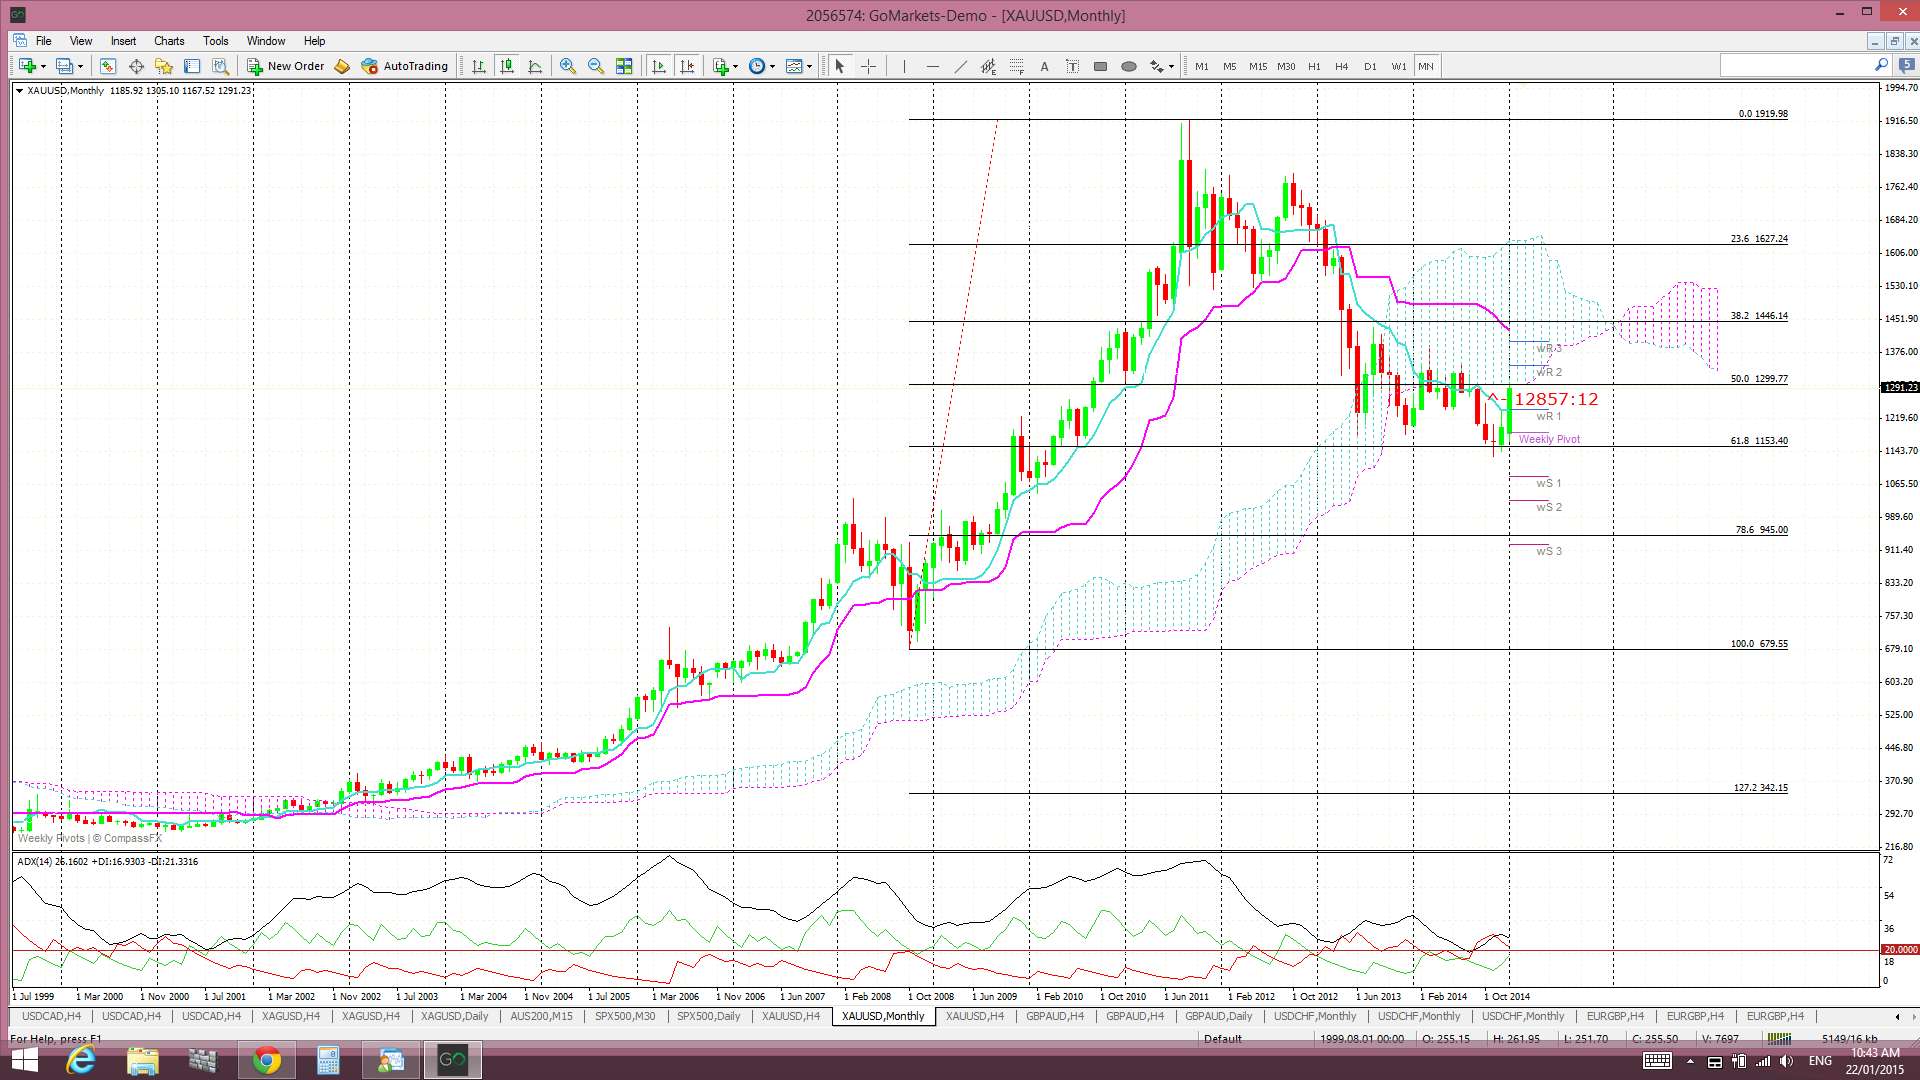
Gold monthly Cloud: price has rallied now up to the $1,300 level where it is meeting some resistance from the bottom of the monthly Cloud and the 50% fib level:
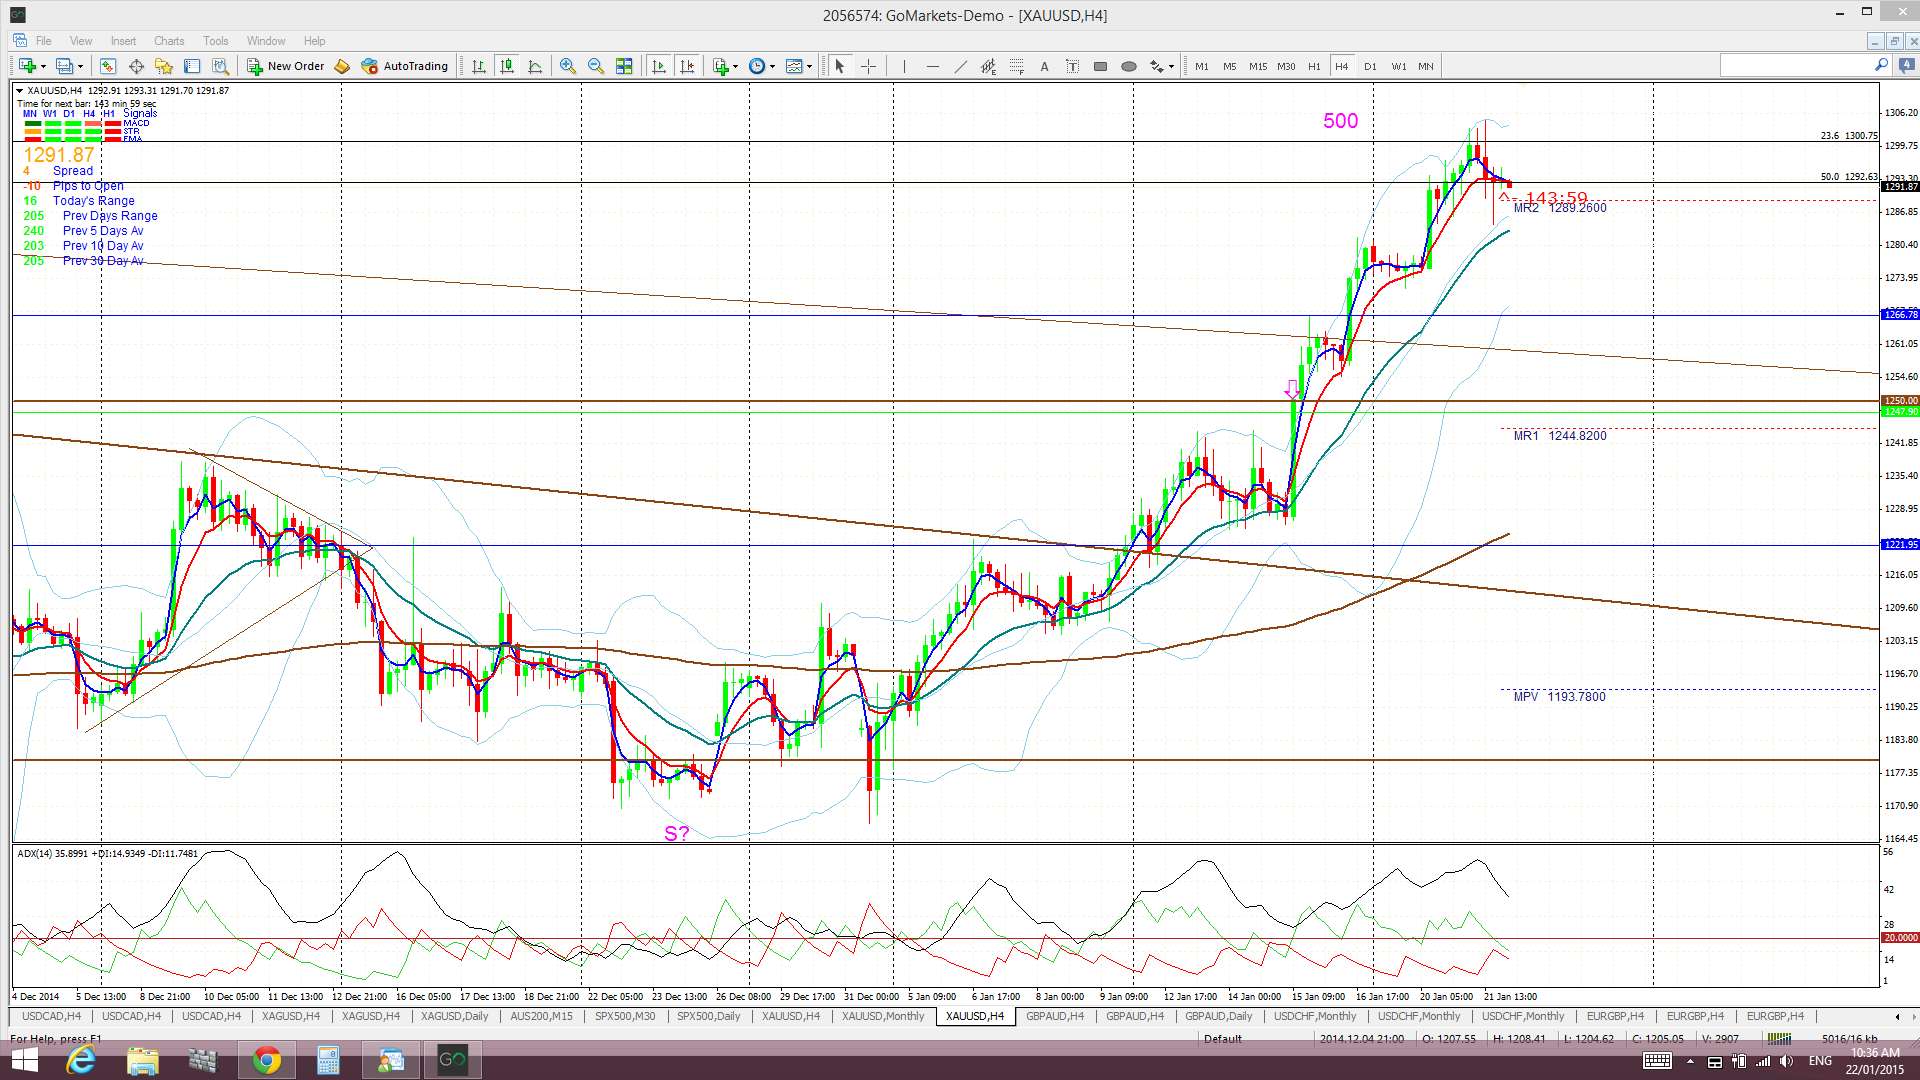
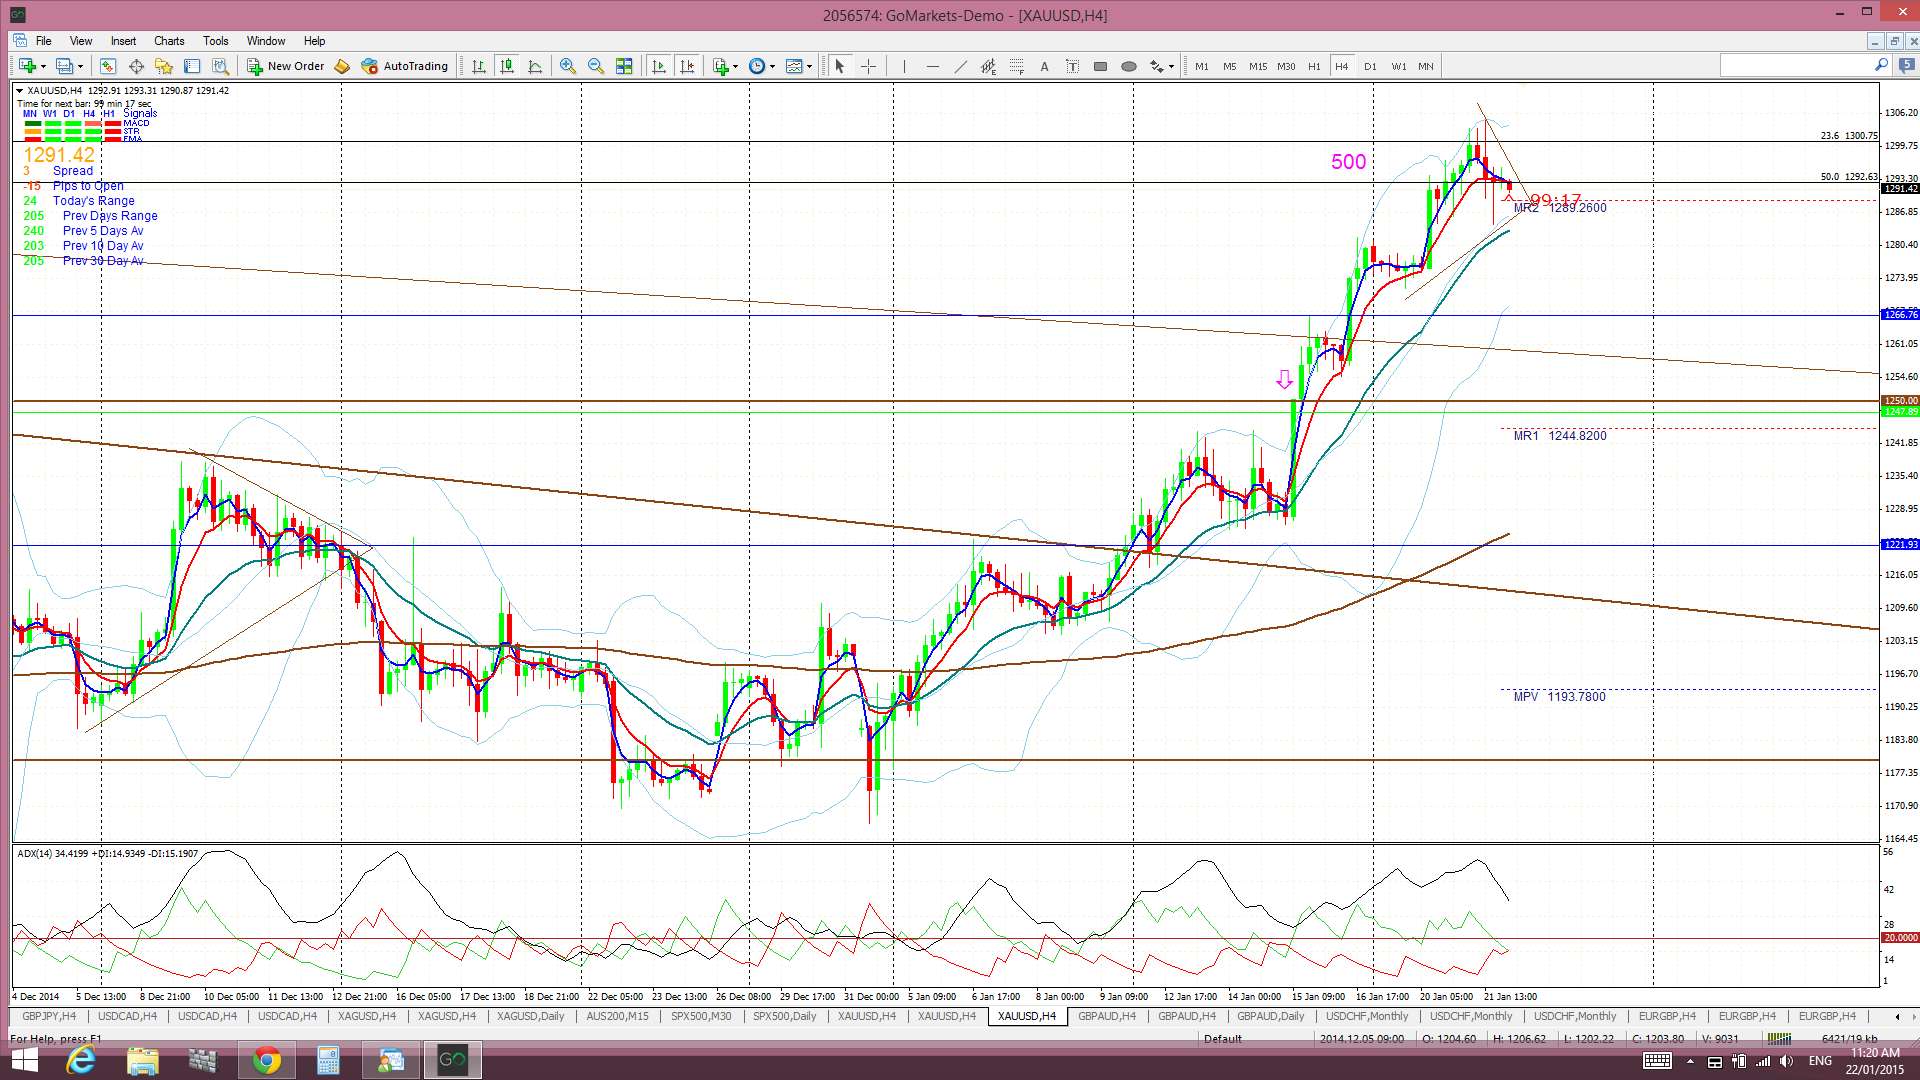
Gold 4hr: the TC signal here has given up to 500 pips but price is struggling at the $1,300 level:
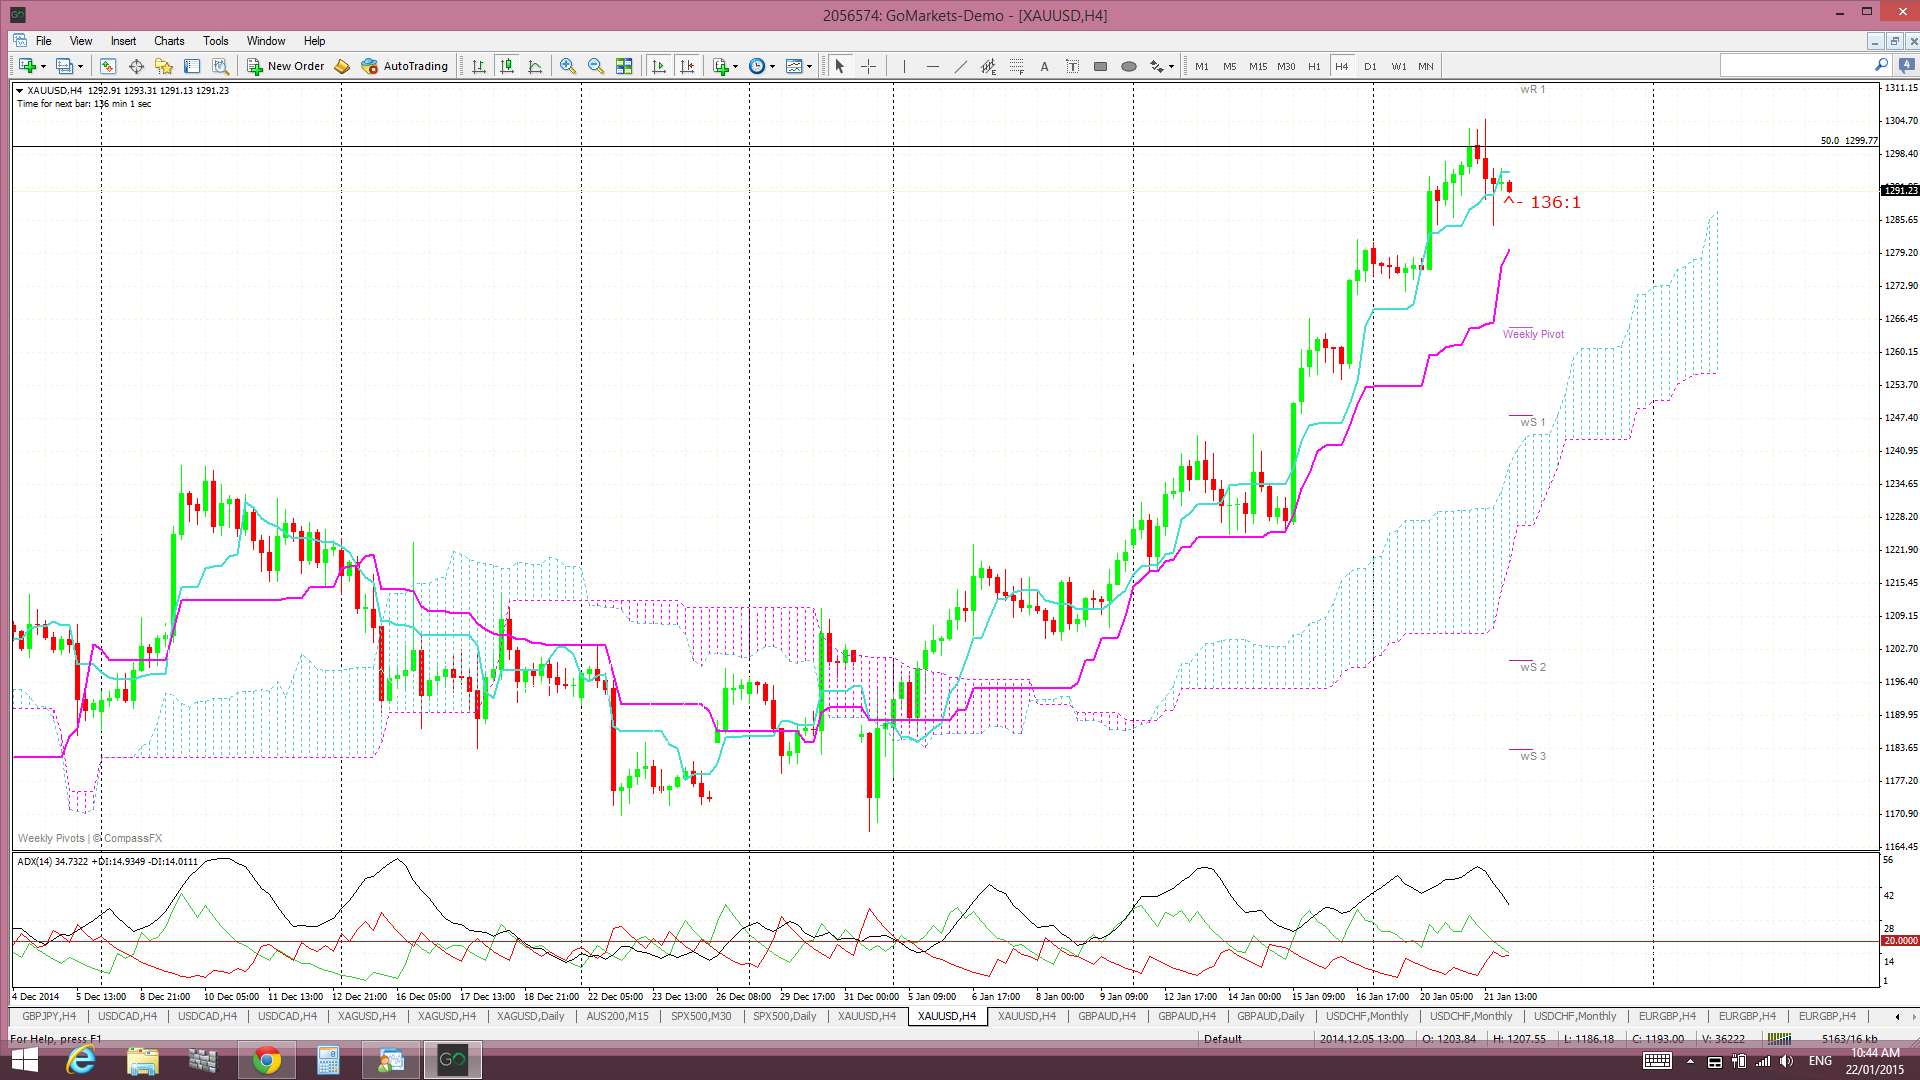
Gold is still above the 4hr Cloud:
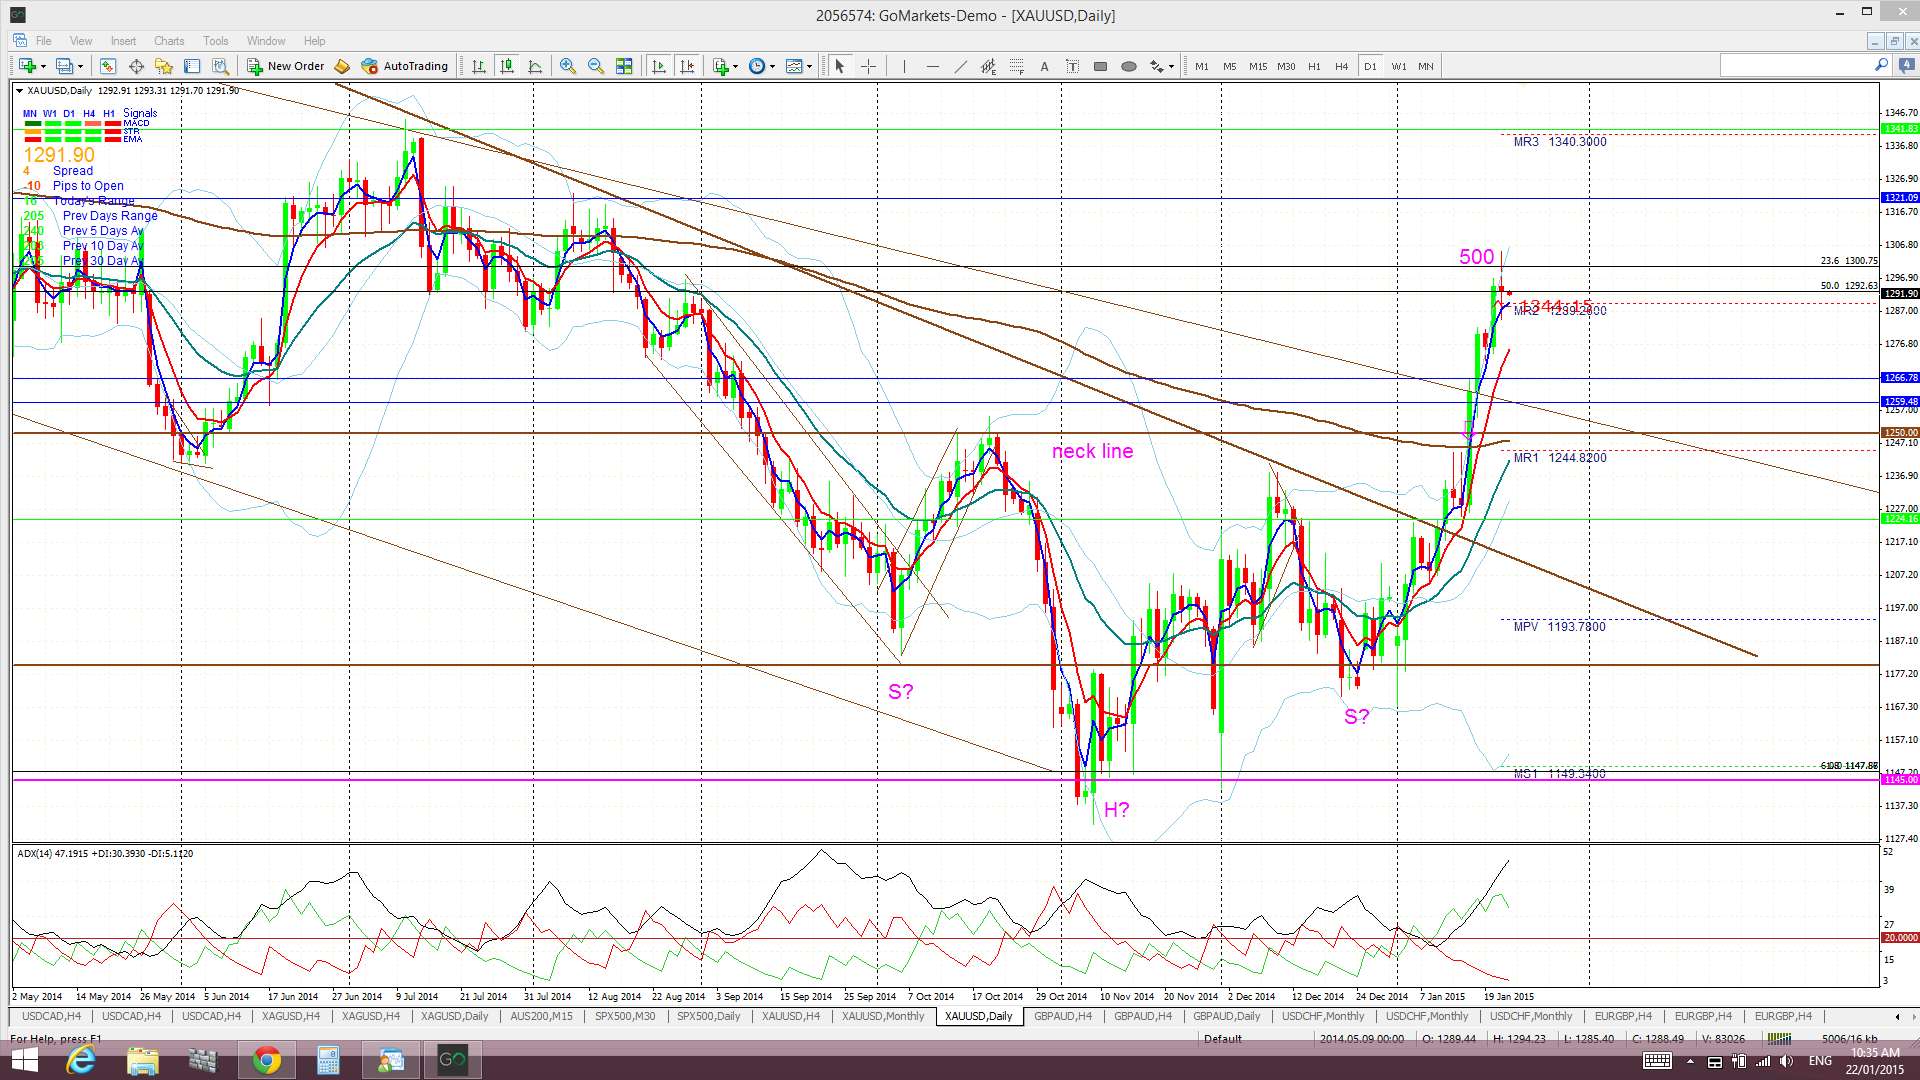
Gold daily: the 4 hr chart’s TC signal triggered at the same time that the daily chart’s bullish ‘Inverse H&S’ move started. The inverse H&S had a neck line at $1,250 and the target is expected to reach $1,355:
Inverse H&S on Daily Chart: The previous weekly close above the $1,250 ‘neck line’ suggests that this technical pattern is underway. The ‘height’ of the H&S is about $105 ( $1,250 – $1,145). This would suggest bullish continuation of the same order which places the target move at around $1,355 ($1,250 + $105). Interestingly, this target is near the weekly 200 EMA and just below the upper limit of the weekly charts horizontal trading channel that has held price since the start of 2013. I still would not be surprised to see another test of this $1,250 level though so ‘long’ traders might want to lock in profit before any possible dip.
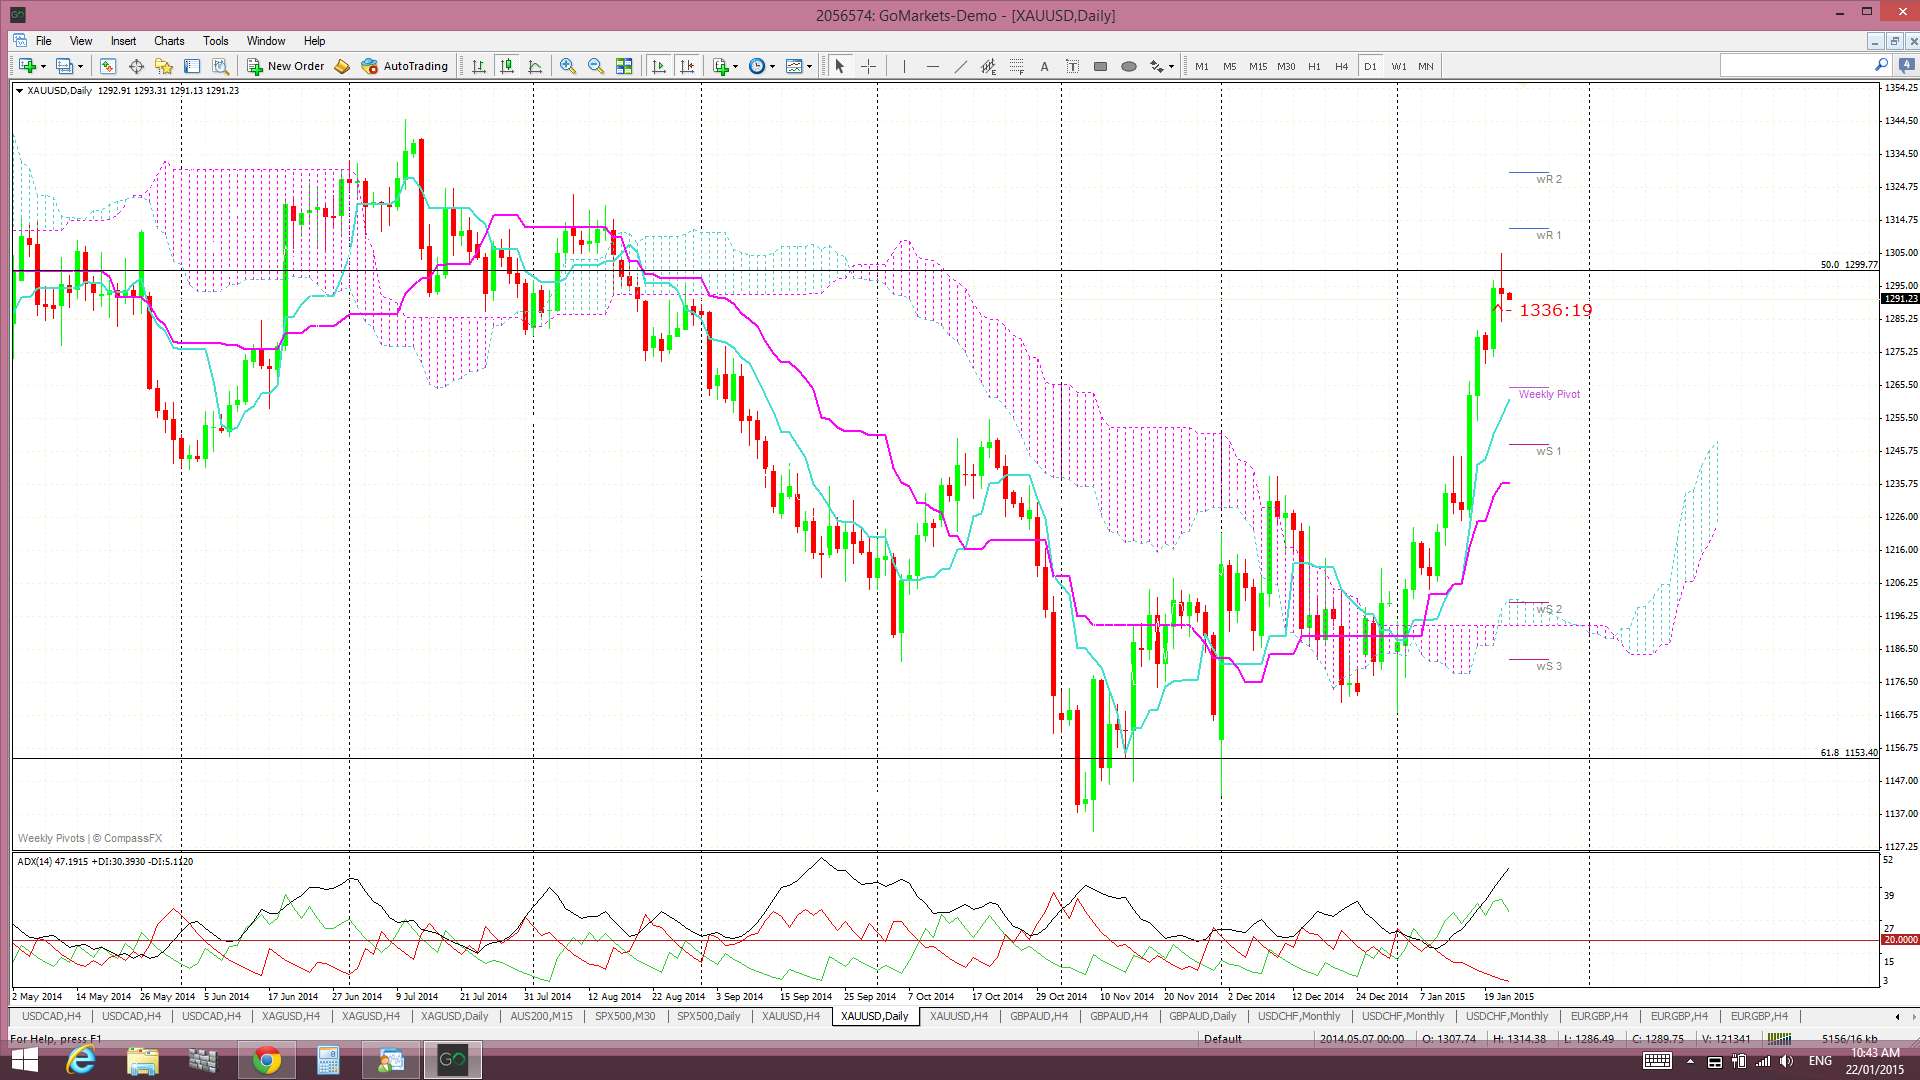
Price is above the daily Cloud but the recent daily candles reflect the uncertainty under this $1,300 resistance:
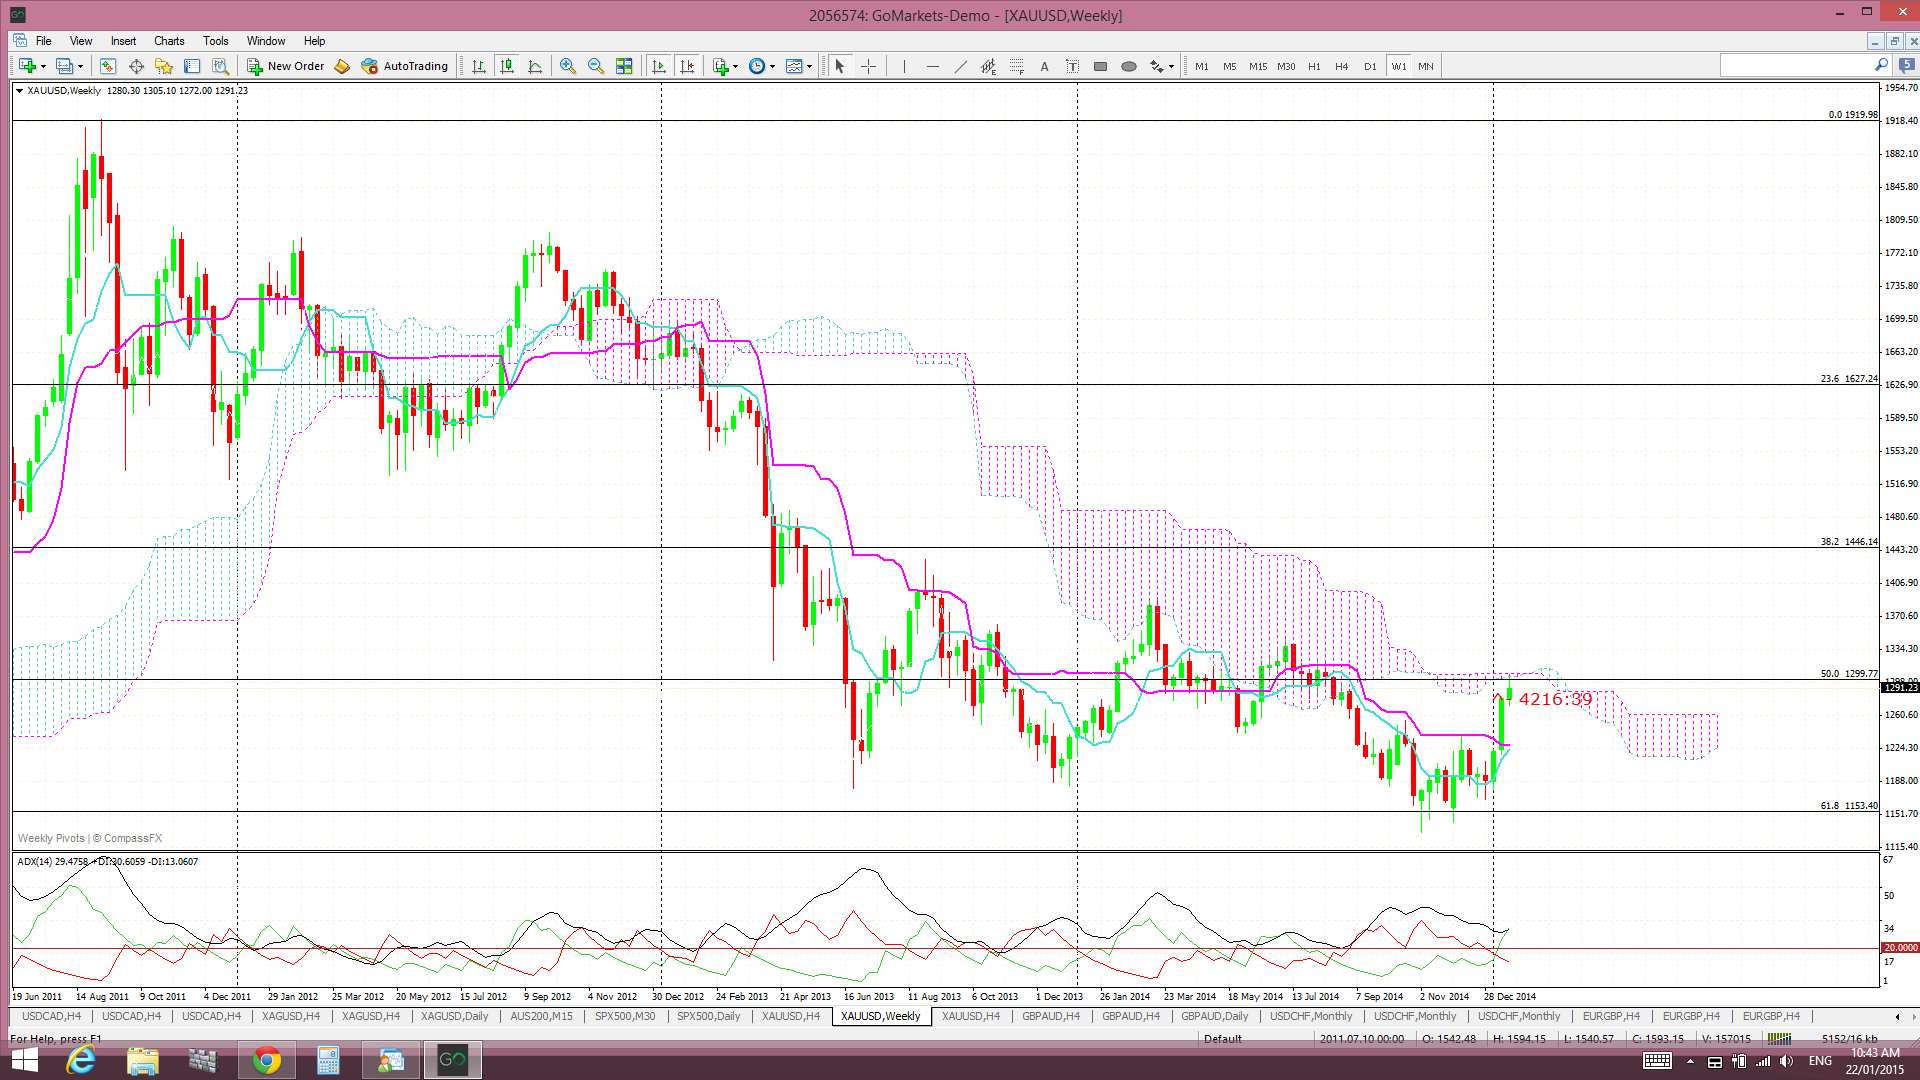
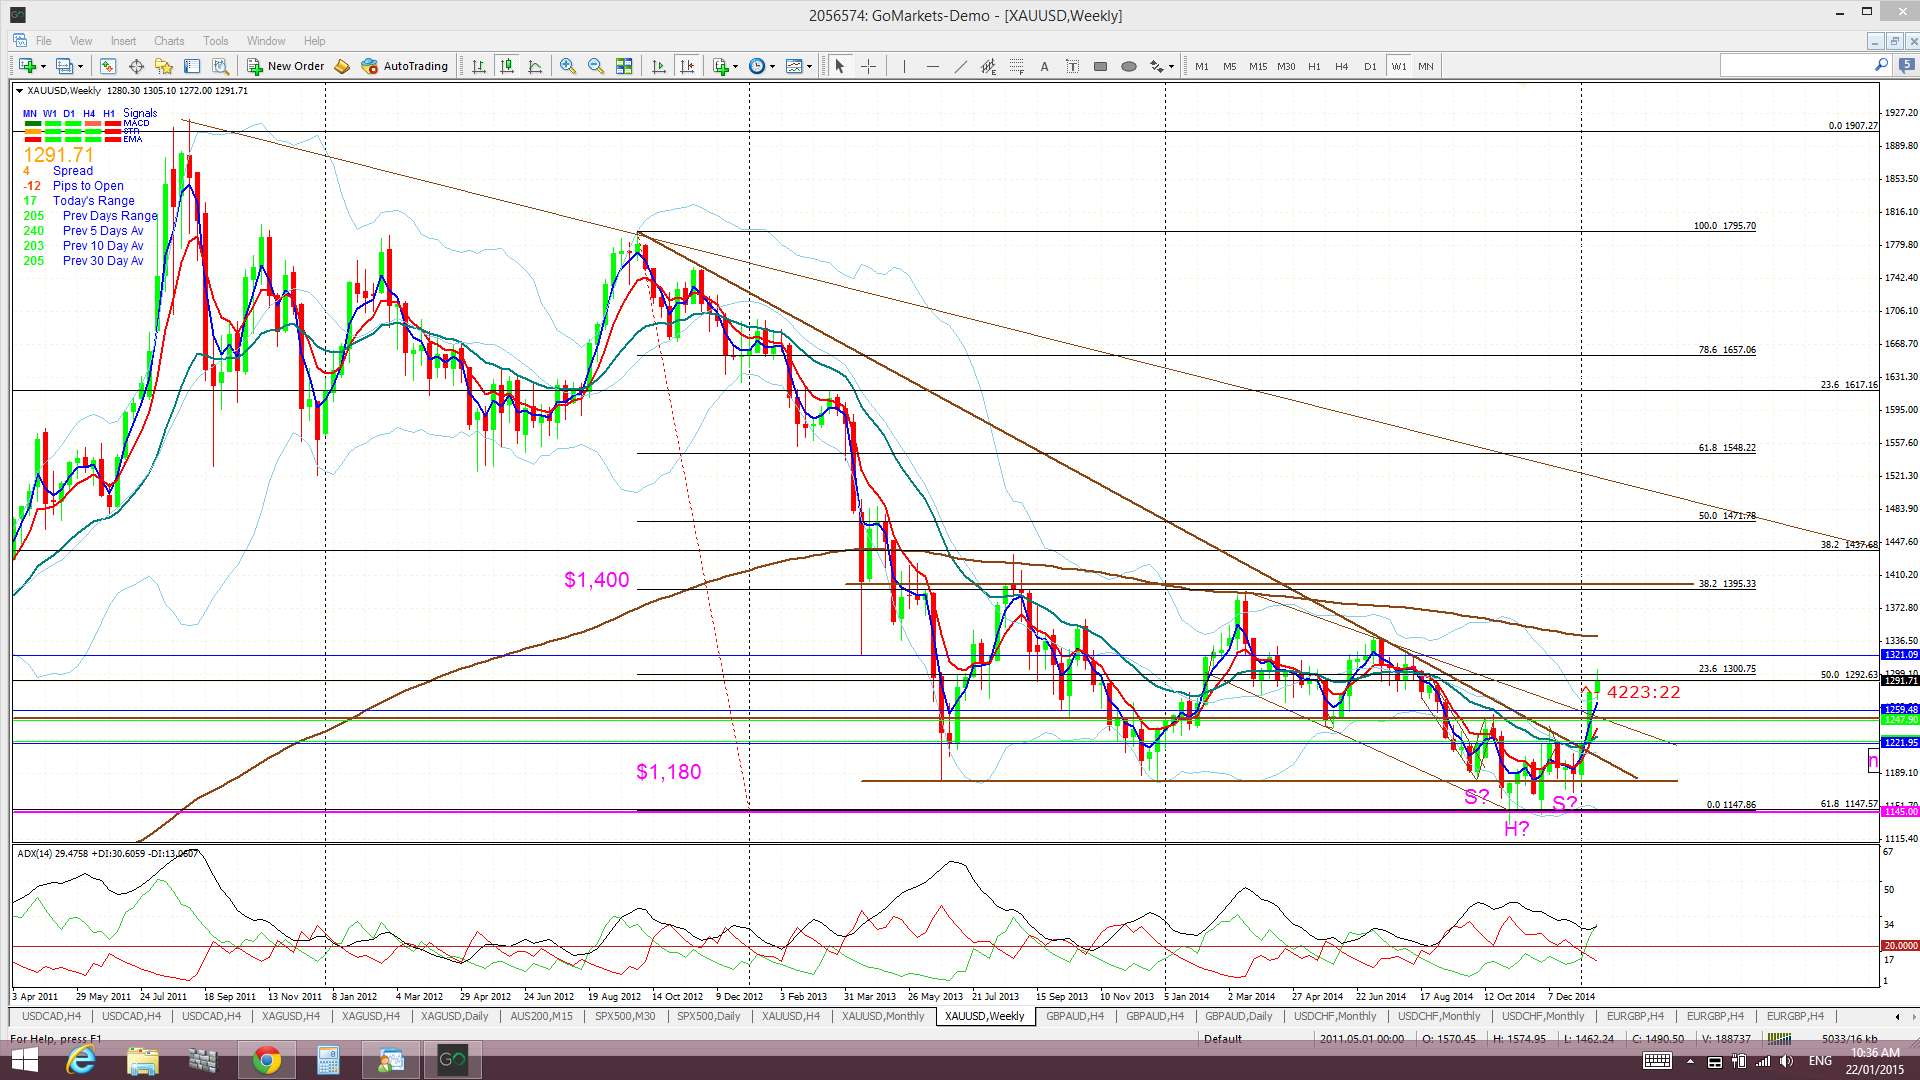
Gold weekly: the weekly chart shows how a two-year bear trend line was broken last week and a more recent one-year bear trend line looks set to be broken this week. If price can break up through the $1,300 level then the next hurdle will be near $1,350 with the weekly 200 EMA and, then, after that up at $1,400 with a trading channel resistance trend line.

Gold weekly Cloud: price is also up testing the bottom of the weekly Cloud which will be offering resistance too:
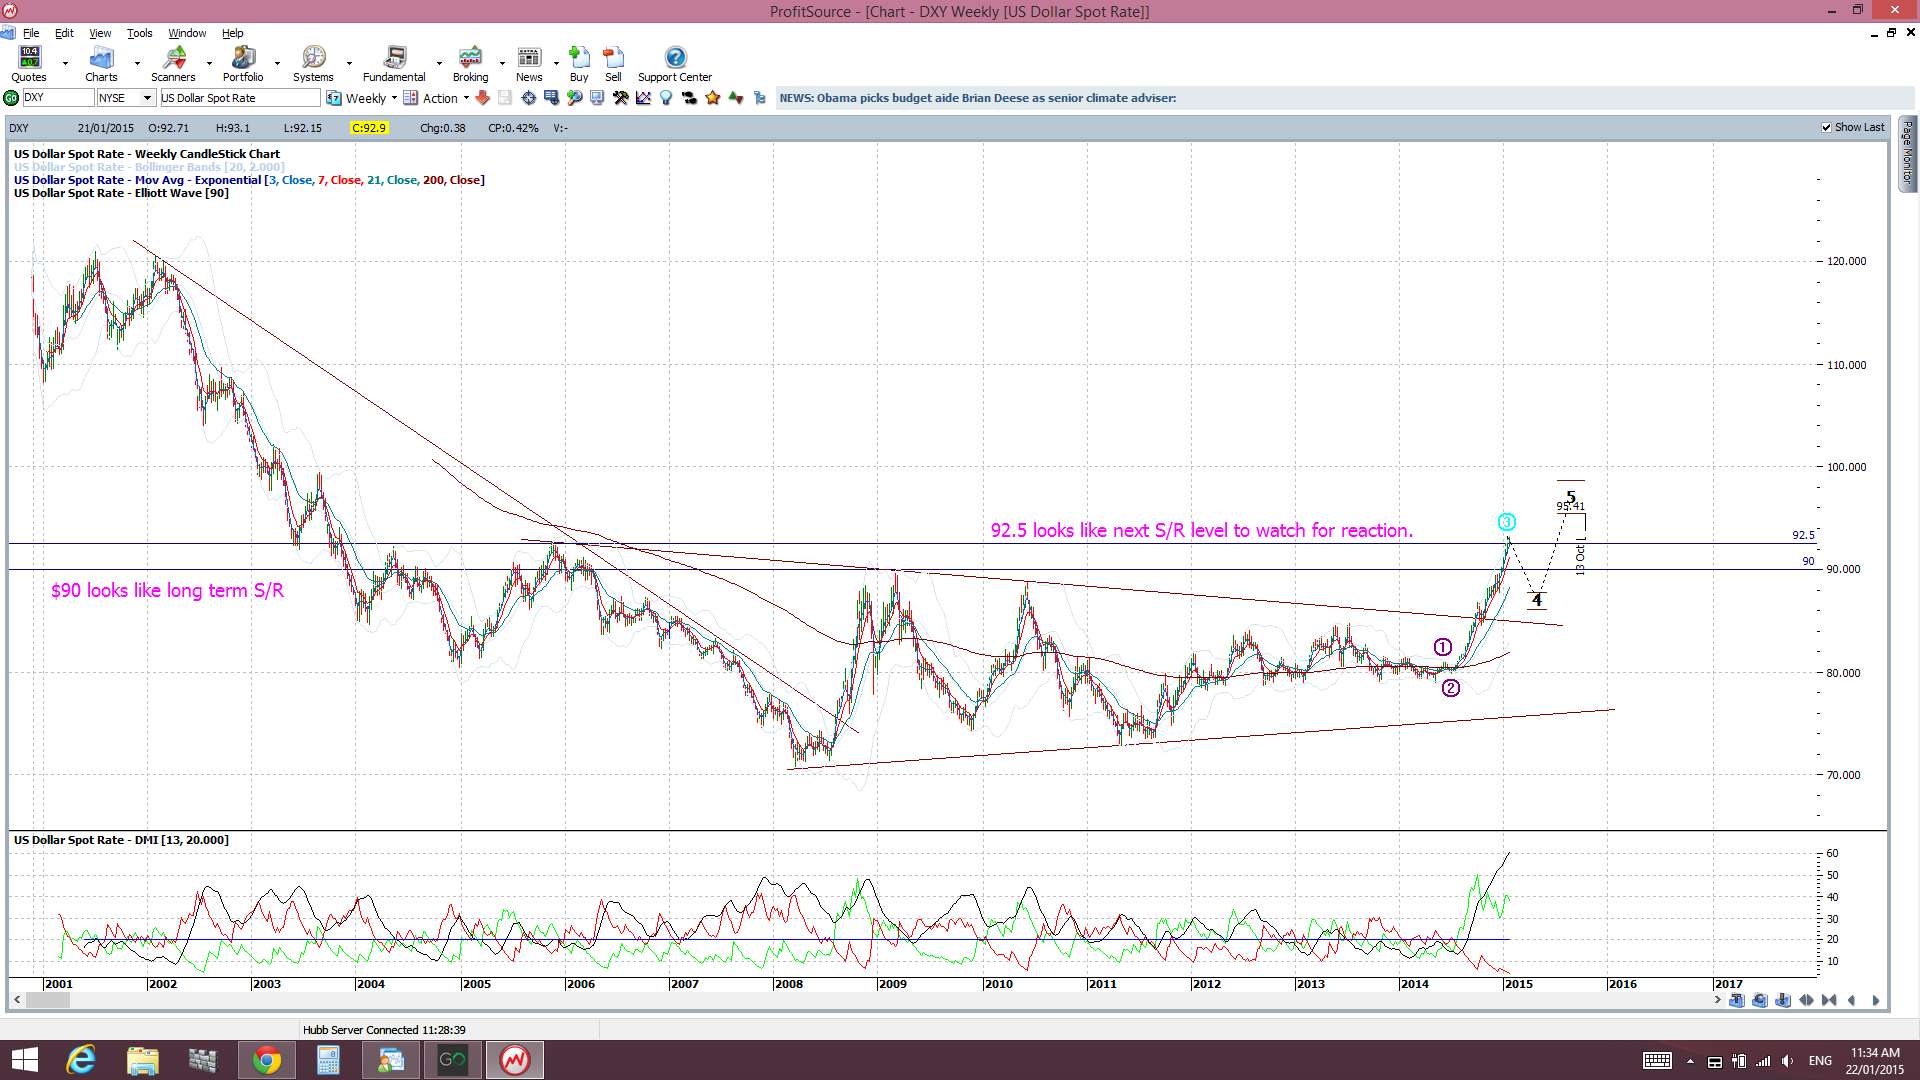
Gold is resting at $1,300 ahead of tonight’s ECB. A large QE package from the ECB here would most likely support Gold as this would see flows out of the EUR and Gold would be one safe haven that might be sought. However, even a disappointing QE package could help to support Gold as any bounce in the EUR may depress the USD and a falling USD supports Gold price too. The chart of the USD index shows price hovering near a major S/R level and thus ripe for a possible corrective move lower, even if only temporarily:
USD weekly chart: price is resting above the major 92.50 support level but has yet to print a monthly candle close above this key resistance. A pullback here is still a possibility but it may take until next week’s FOMC to clarify this possible outcome:
So, is the ‘Long Gold’ idea a win/win trade or ‘lay down misere? The charts seem to be pointing to this idea for now and so I will be sticking with my long. However, the weekly chart (printed again below) shows that the $1,250 is a major level and this fact, along with $1,250 being near the broken bear trend lines, makes me suspect that a test of this key level could be expected even with overall bullish continuation:
For those not in the trade then where might it be safe to enter? I would advise waiting until after ECB and watching the 4hr chart. This chart is starting to shape up with a bit of a triangle pattern and a breakout here might give clues as to which way Gold might head next. A bullish breakout would suggest continuation and offer a trade entry near the $1,300 S/R level. A bearish breakdown might suggest that $1,250 is going to be tested again:
Gold 4hr: showing developing triangle pattern:
I am still long on Gold but with a reasonably tight stop and will look to long again with any test of $1,250.
New traders: watch for any triangle breakout after ECB to either long near $1,300 or wait for a possible pullback and test of $1,250.
The post Gold: LONG a ‘lay down misere’ trade? appeared first on www.forextell.com.