Last week: Short-term chart trading seems the safest approach for trend traders at the moment given the amount of high impact news events and the impact these have on price action. There were fewer trend line breakout trades last week but still some profitable ones: I’m discounting the large moves on the GBP pairs. It is another busy week on the trading calendar again with four Central bans reporting rate updates but there are trend lines to monitor for any new breakout moves.
Trend line breakout tally: these trades were updated throughout the week here, here and here.
- EUR/AUD: 120 pips and 120 pips later in the week.
- Gold: 150 pips.
- GBP/JPY: 140 pips.
- USD/JPY: 90 pips.
- GBP/NZD: 100 pips.
- EUR/NZD: 60 pips and 90 pips later in the week.
- USD/MXN: 3,700 pips.
- USD/CNH: 250 pips.
- USD/TRY: 200 pips.
- ASX-200: 80 points.
- STOXX50: 25 points.
- JP225: 200 points.
Next Week:
- US$: The US$ closed with a bullish coloured candle for the week however this was an indecision-style ‘Inside’ candle. A review of the FX Indices can be found through this link.
- Central Banks: four Central banks update interest rates next week: USD FOMC, CHF SNB, GBP BoE and JPY BoJ.
- GBP/AUD, GBP/NZD and GBP/JPY: these pairs continue chopping under 20+ month bear trend lines so watch for any make or breakactivity. These trend lines form part of triangle patterns that technical theory suggests are worth over 4,000 pips so these are well worth monitoring.
- Gold and Silver: both metals have pulled back from 6-year bear trend lines but I would expect some choppiness around these major demarcation zones.
- NZD/USD: the Kiwi looks to have broken up through a 3-year bear trend line so watch for any hold above this region to support an inflection-type move for the currency.
- TC Trial Update: I’ve only heard back from two of the full-time female traders at this stage for the end of Week 2. One of them had 4 winning trades and 1 break-even for 157 pips and the other had 3 winning trades and 1 break-even for 187 pips and 53 points. The pressure is on the guys now to try and match or better this

- NB: this is a brief update as I am away for the long weekend.
Calendar:
- Mon 12th: AUD Bank Holiday.
- Tue 13th: GBP CPI. USD PPI.
- Wed 14th: CNY Industrial Production. GBP Employment data. USD CPI, Retail Sales, Crude Inventories & FOMC
- Thurs 15th: NZD GDP. AUD Employment data. CHF SNB rate update. GBP Retail Sales & BoE rate update. USD Weekly Unemployment Claims.
- Fri 16th: JPY BoJ Rate update. USd Building Permits.
Forex:
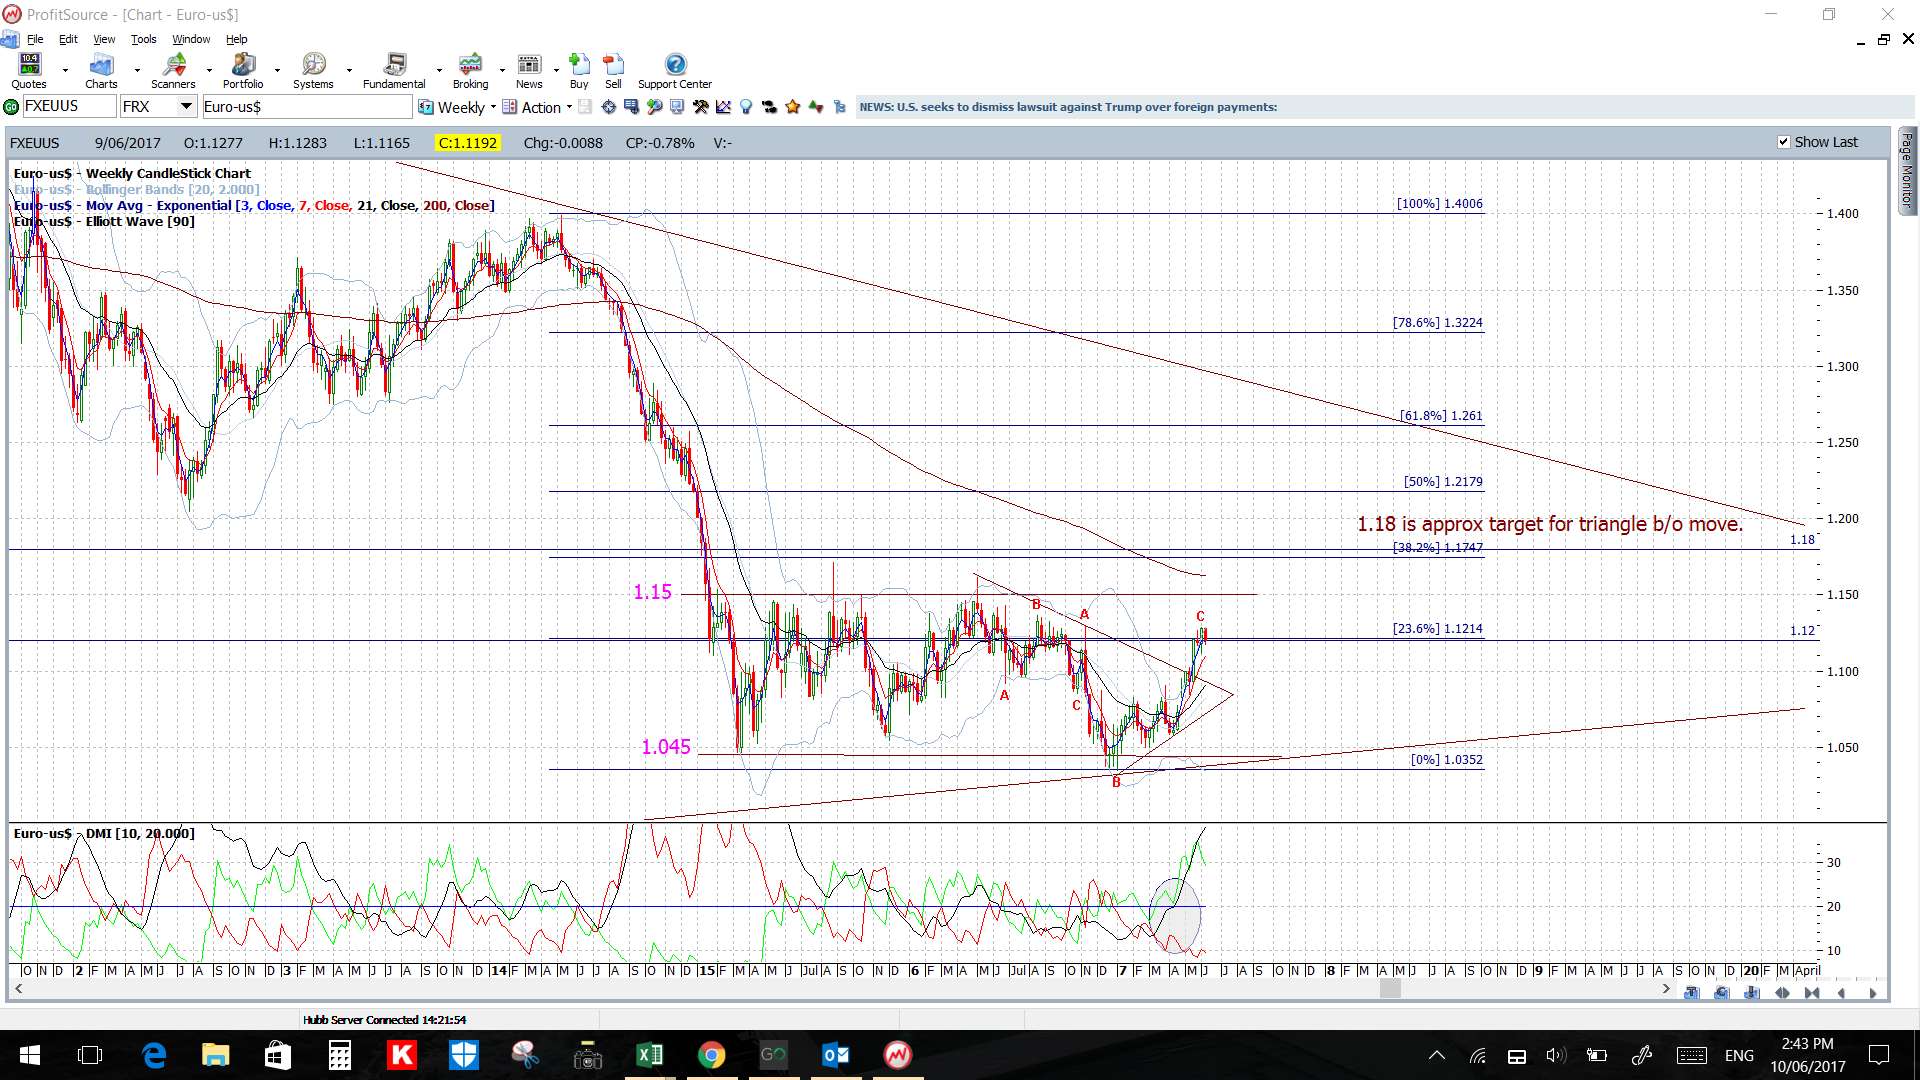
EUR/USD: Watch the 4hr chart’s triangle pattern for any breakout move:
- Upper targets: 1.15 as previous S/R followed by 1.18 as the daily chart triangle breakout target.
- Lower targets: any pullback would have me looking for a test of the daily chart’s broken trend line. After that, the 4hr chart’s 61.8% Fib.
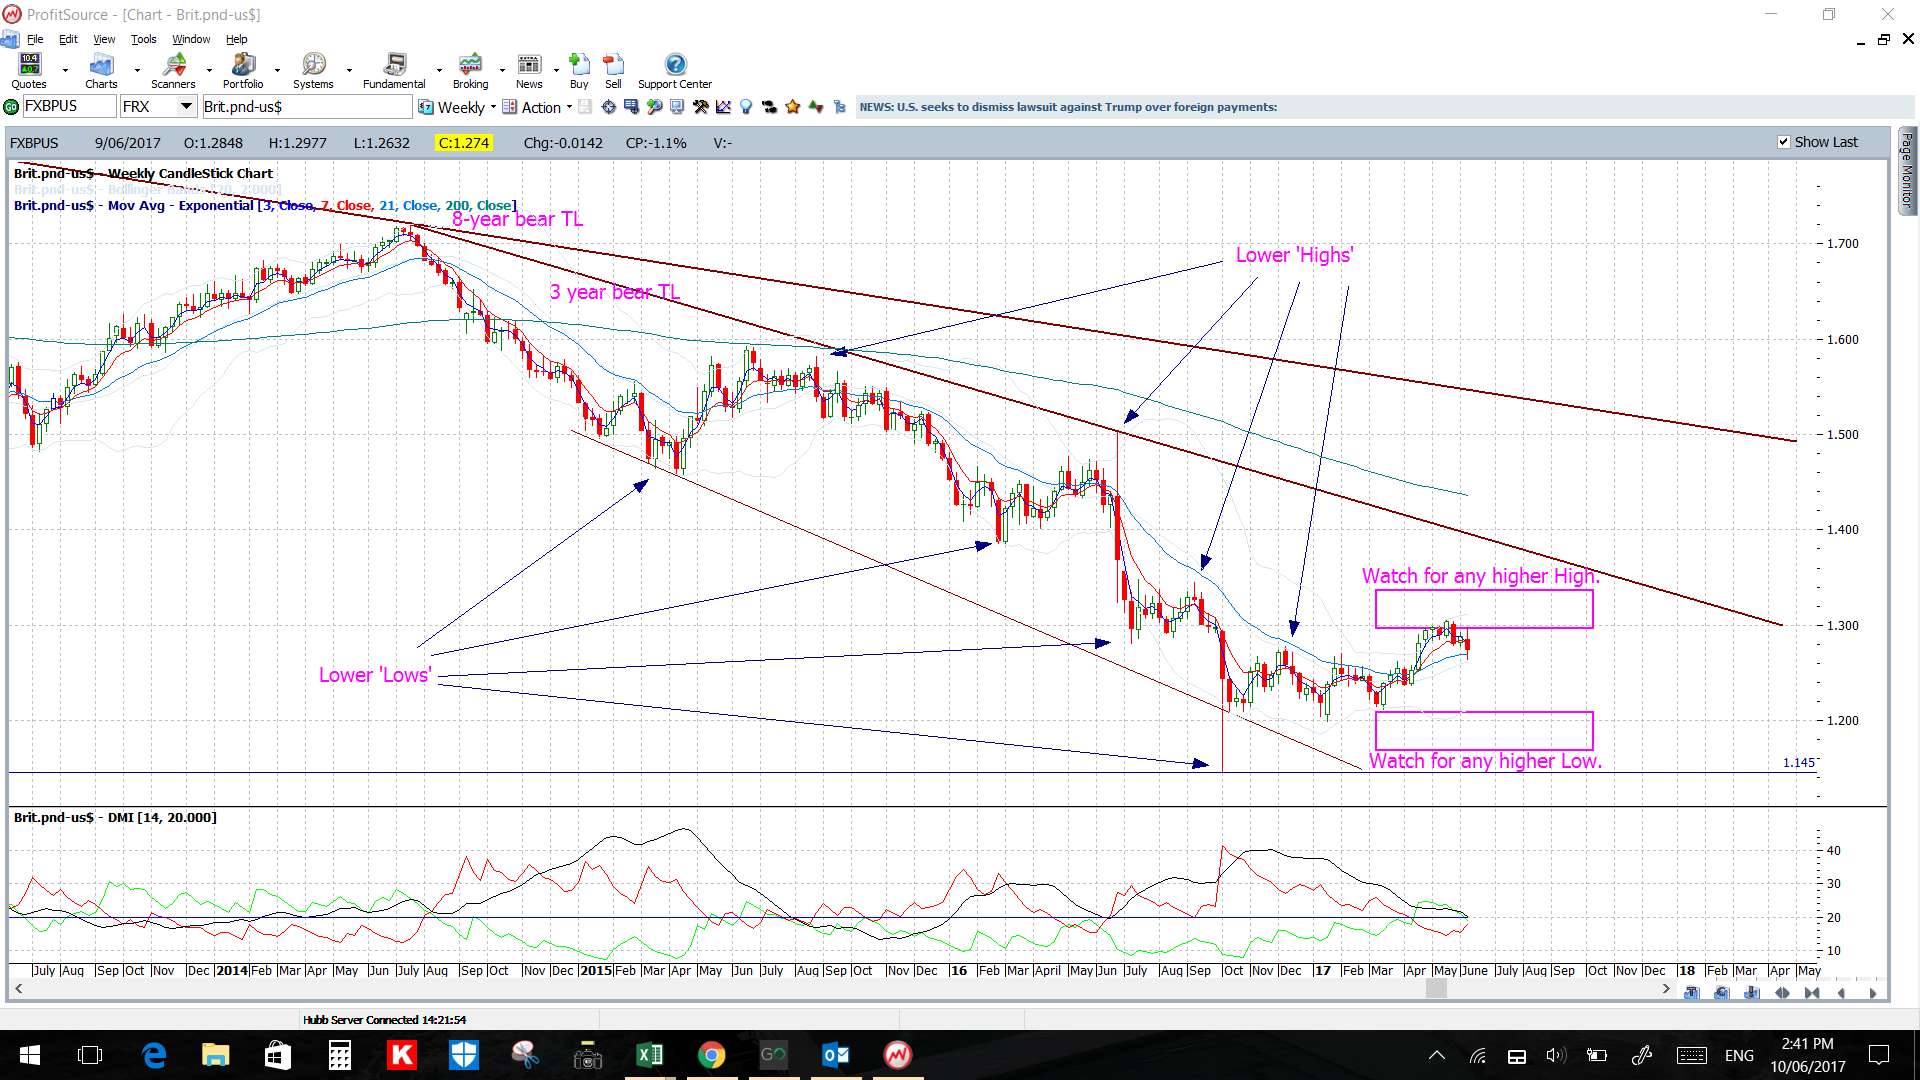
Remember: The yield from the earlier triangle breakout remains around 280 pips of a projected move that could be worth up to 800 pips. The target for the daily triangle breakout move is up near 1.18 and this is near the upper edge of the trading range for this pair since the start of 2015 (shown on the weekly chart below).
Watch this week with FOMC.

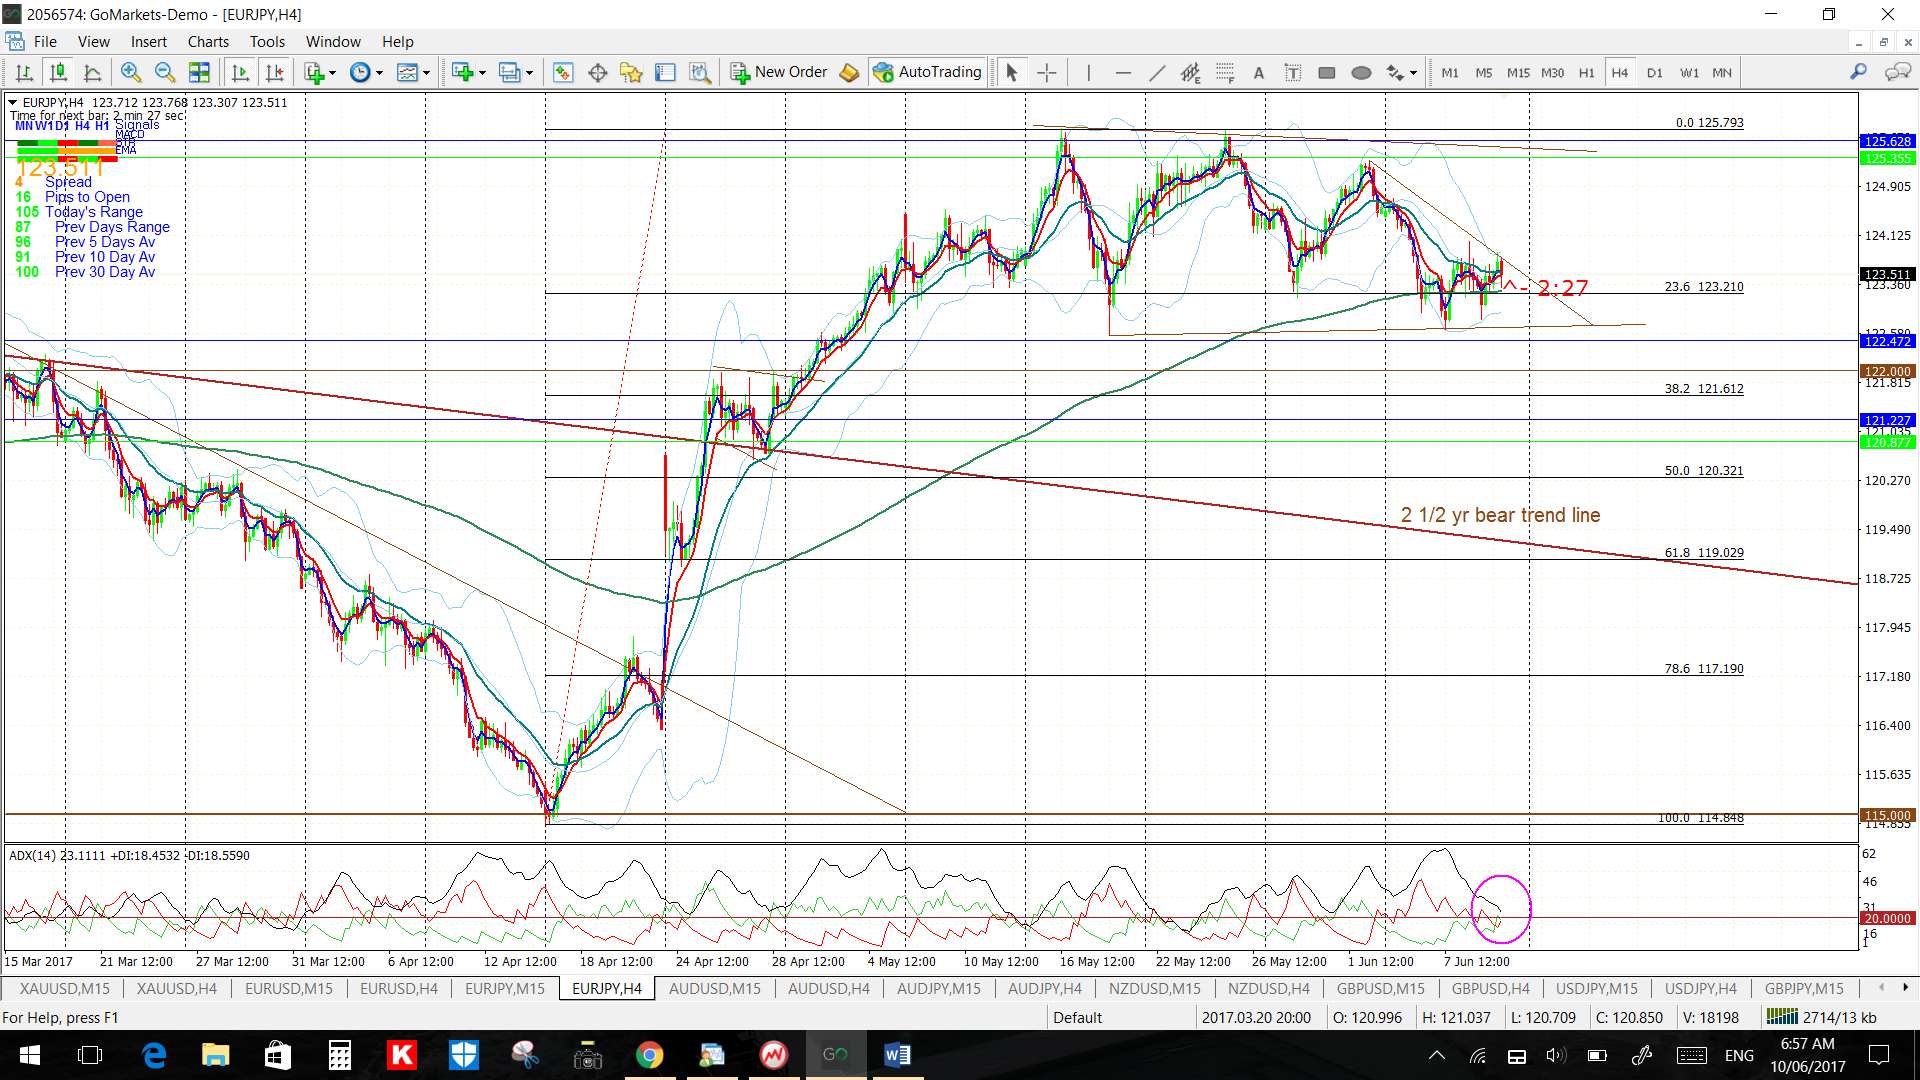
EUR/JPY: This pair has been chopping sideways in a wide channel for the last four weeks. It remains above a broken 2 ½ bear trend line.
Watch the 4hr chart’s triangle within the channel for any new breakout:
- Upper targets: the weekly chart’s 61.8% Fib near 135.
- Lower targets: any pullback would have me looking for a test of the daily chart’s broken 2 ½ bear trend line which is near the 4hr chart’s 50% Fib.

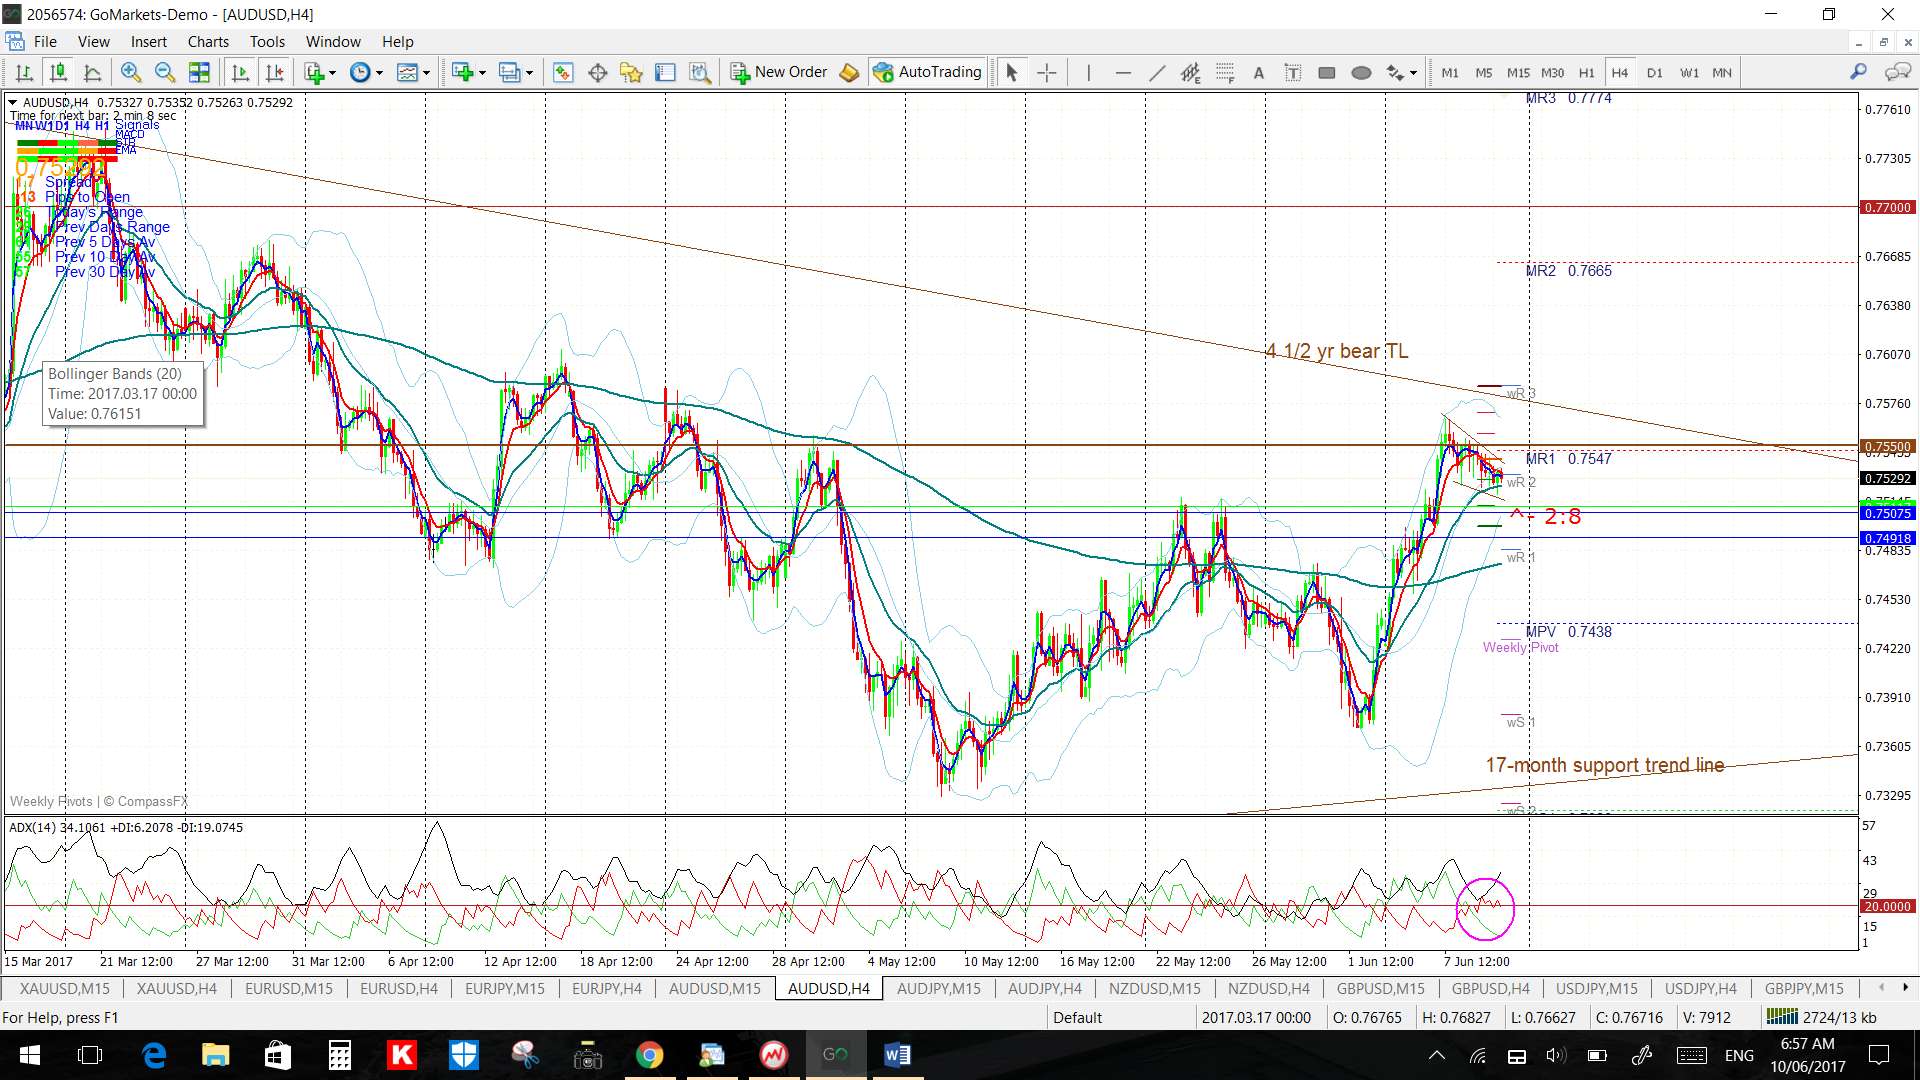
AUD/USD: Watch the daily chart’s 4 ½ year bear trend line for any breakout. There is a consolidation style Flag on the 4hr chart just below this major trend line and 0.755 level so watch these for any breakout too:
- Upper targets: 0.76 and 0.77.
- Lower targets: any pullback would have me looking for a test of the daily chart’s 17-month support trend line and, after that, the monthly chart’s 61.8% fib which is near 0.72.
Remember: The Aussie continues to be increasingly squeezed into the apex of a daily, and then 1,700 pip weekly, chart triangle so this upper 4 ½ year trend line is significant.
Watch with this week’s CNY Industrial Production data, FOMC and AUD Employment data.

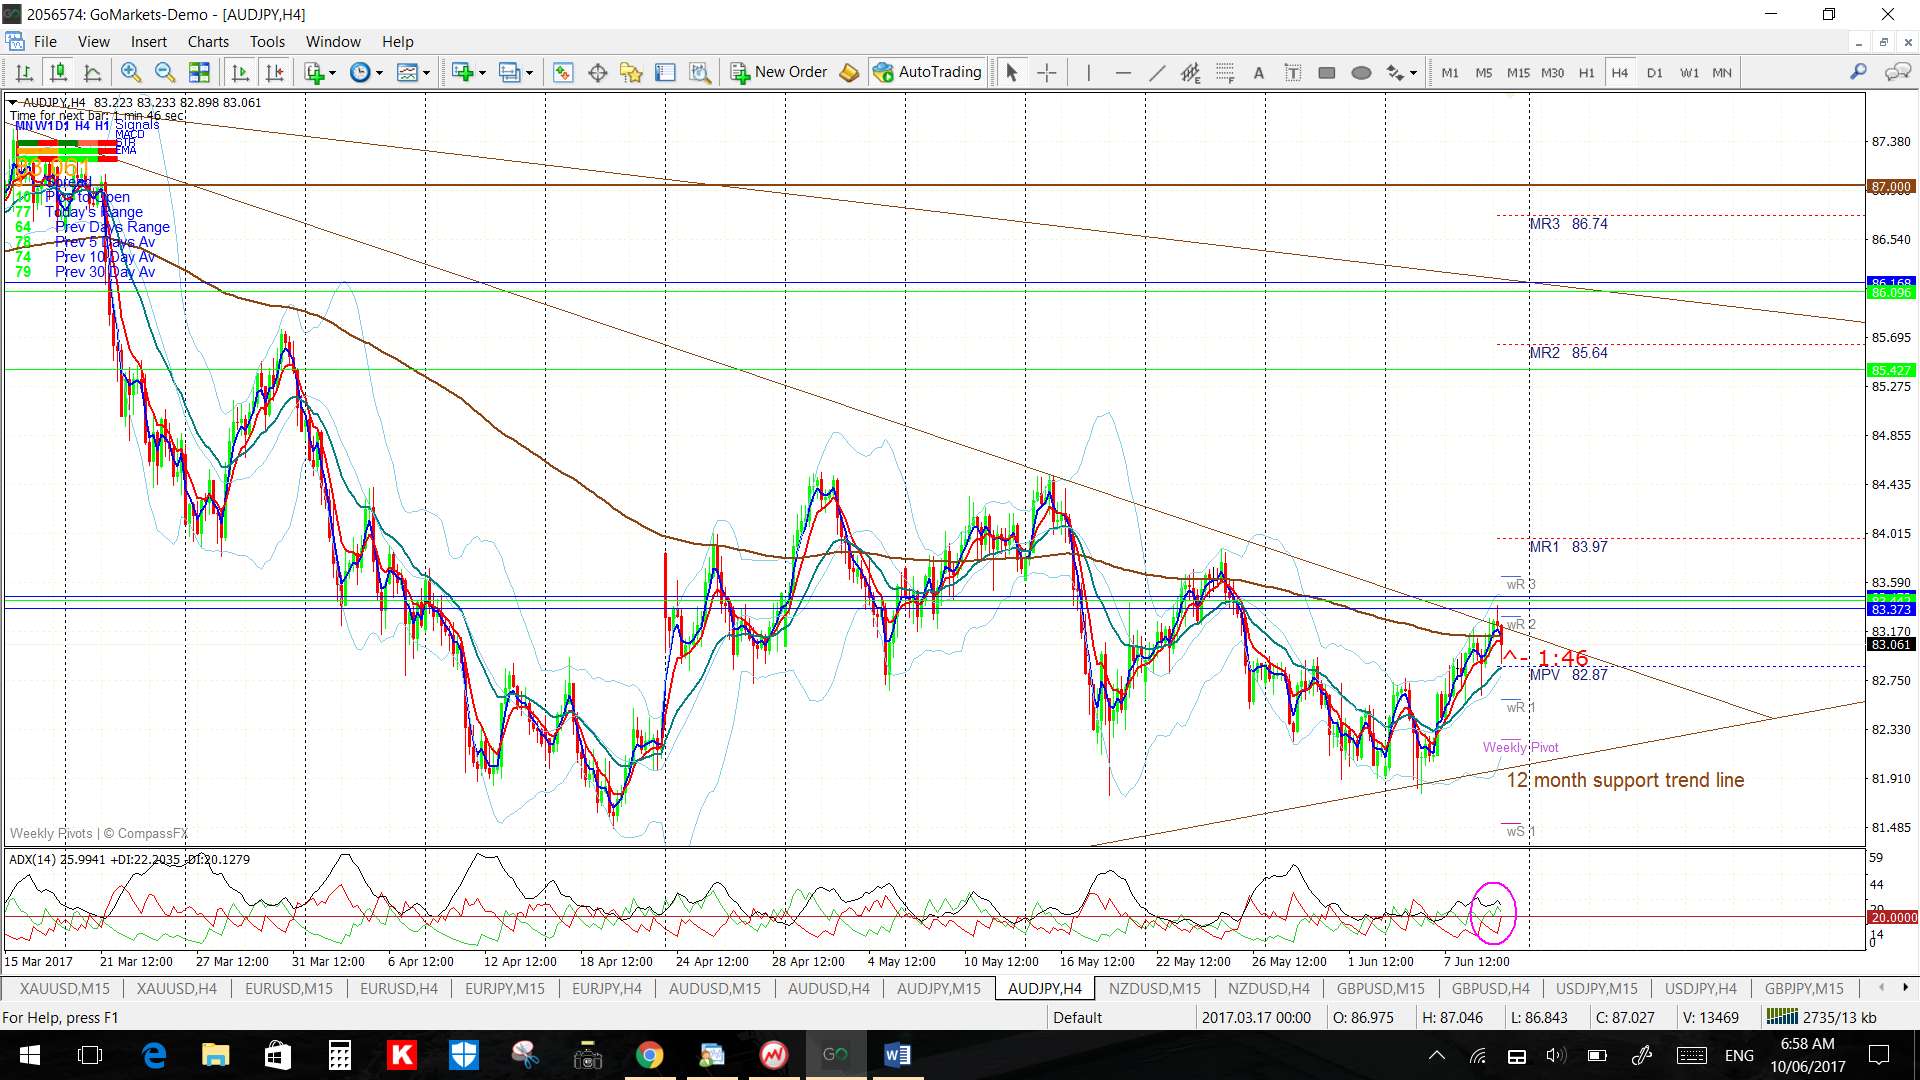
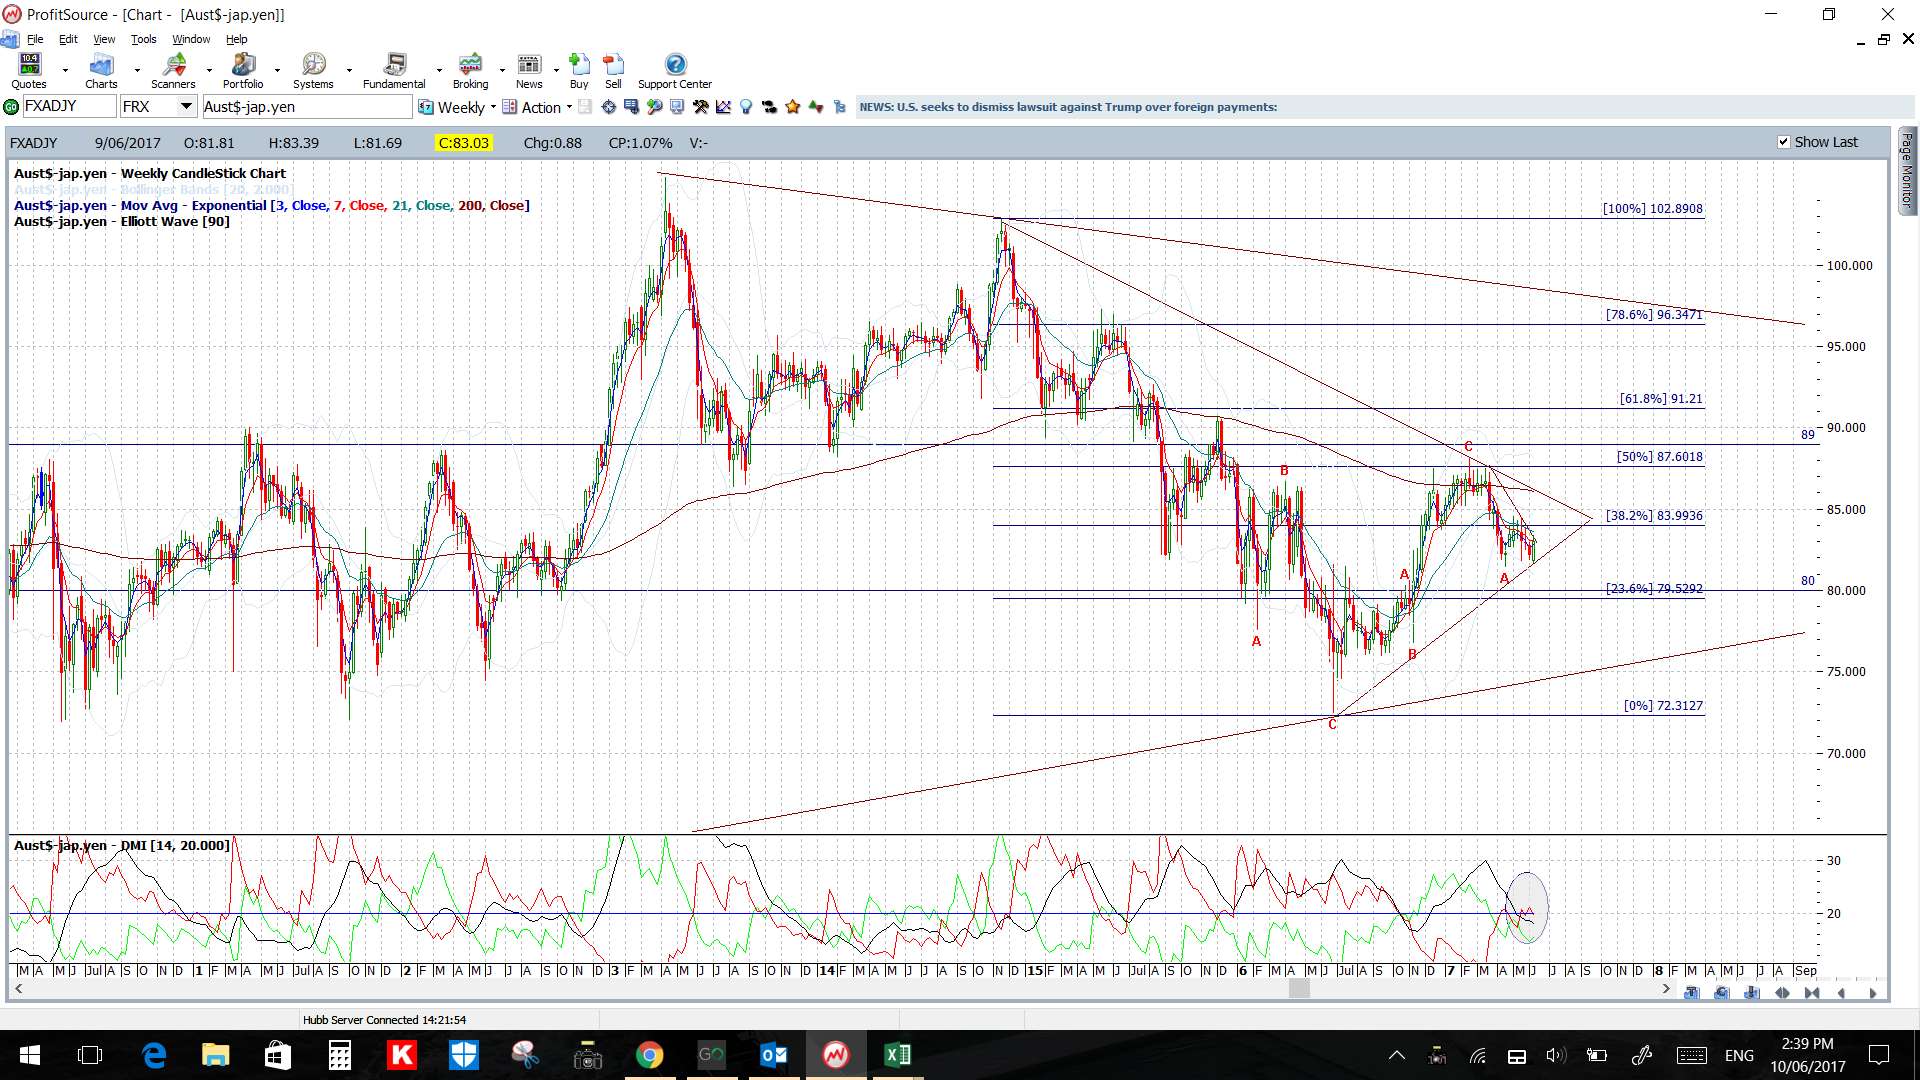
AUD/JPY: Price action has been consolidating in an increasingly tighter range within a 4hr chart triangle for the last 12 weeks and is nearing the apex of this triangle just ahead of next week’s FOMC and BoJ rate update. The 4hr chart triangle is set within a larger daily chart triangle.
Watch the 4hr chart’s triangle for any breakout:
- Upper targets: the upper triangle trend line from the daily chart triangle and, then, the 87 S/R level.
- Lower targets: any pullback would have me looking for a test of the bottom trend line of the daily chart triangle followed by 80 S/R and then the daily chart’s 61.8% Fib near 79 S/R and then 75.
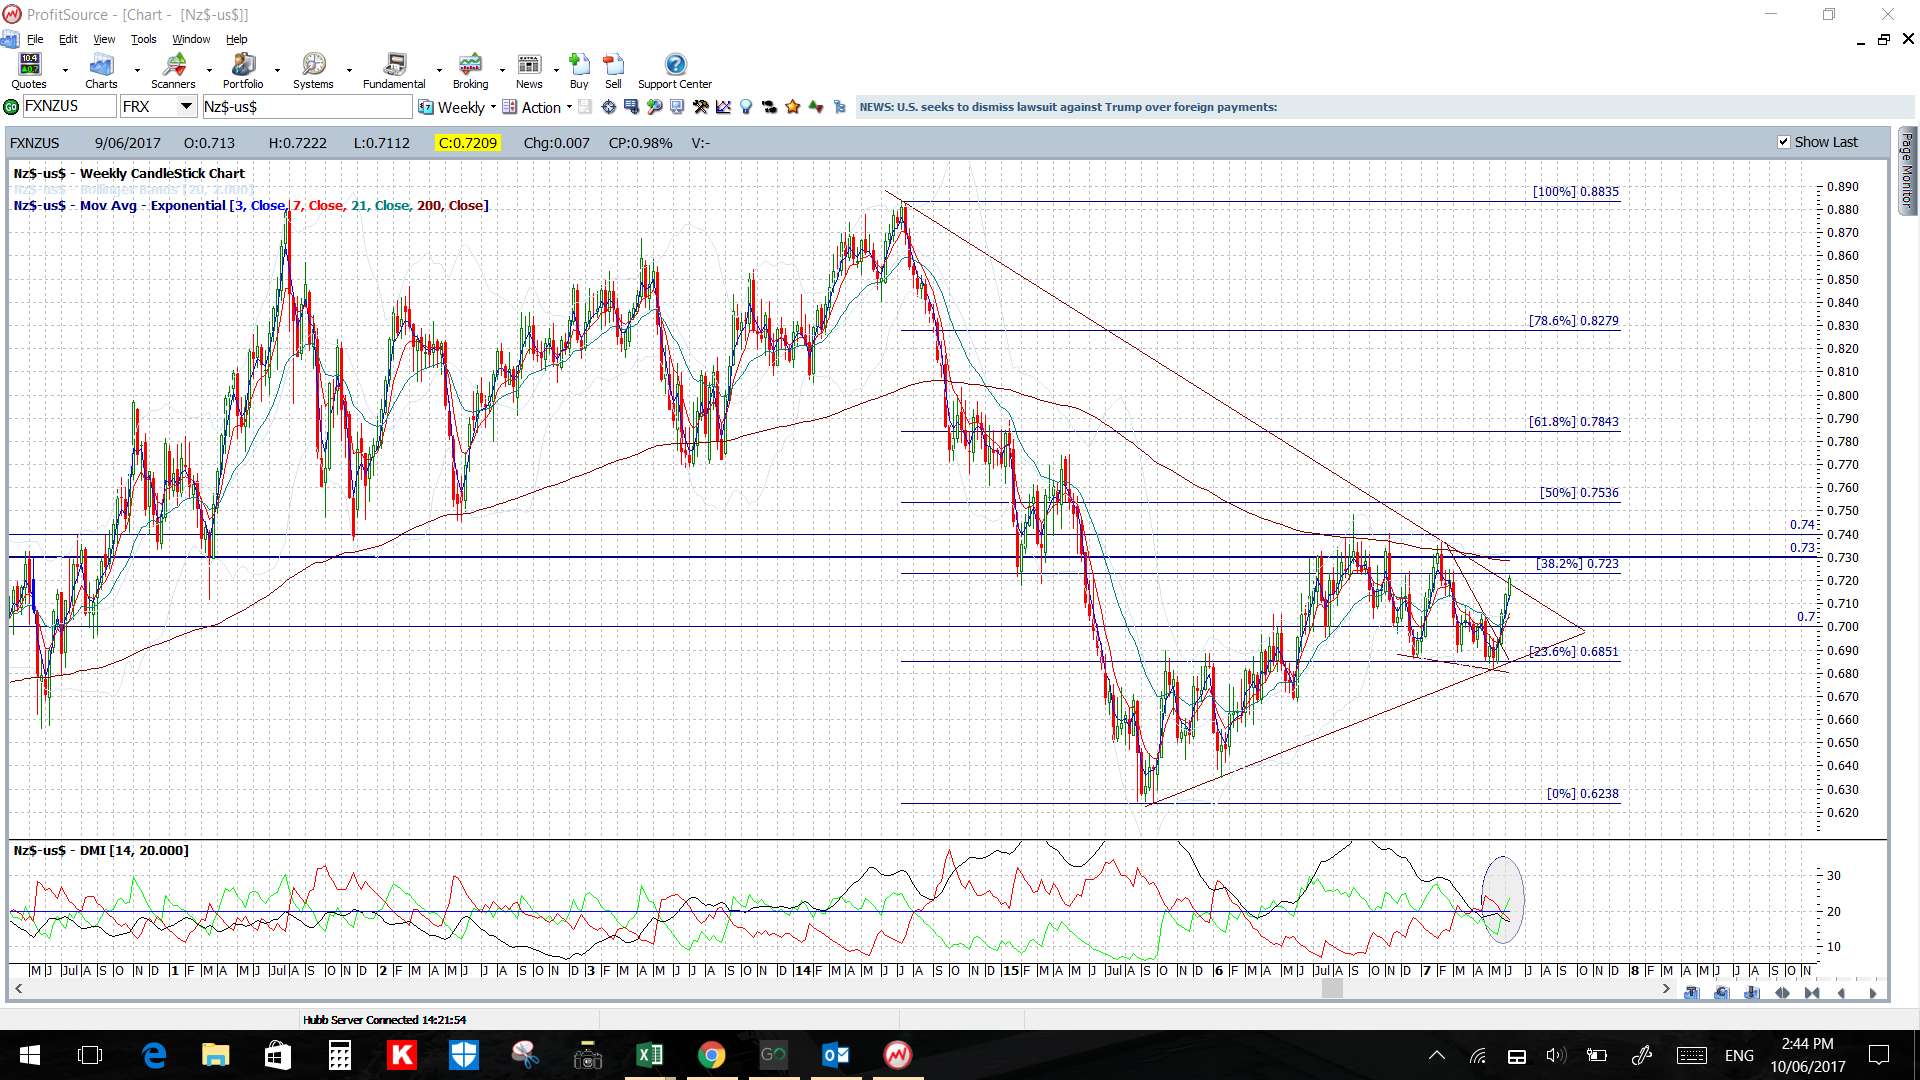
 NZD/USD: I’d mentioned last week that 0.72 might be a target here and that it has been and price consolidated there to see out the week. The Kiwi also looks to have broken a 3-year bear trend line so watch for any hold above this level to support a shift in bias here.
Watch this 0.72 level and 3-year bear trend line for any make or break:
- Upper targets: 0.73 and 0.74 as previous S/R.
- Lower targets: 70 and 0.67.
Watch with this week’s CNY Industrial Production data, FOMC and NZD GDP.

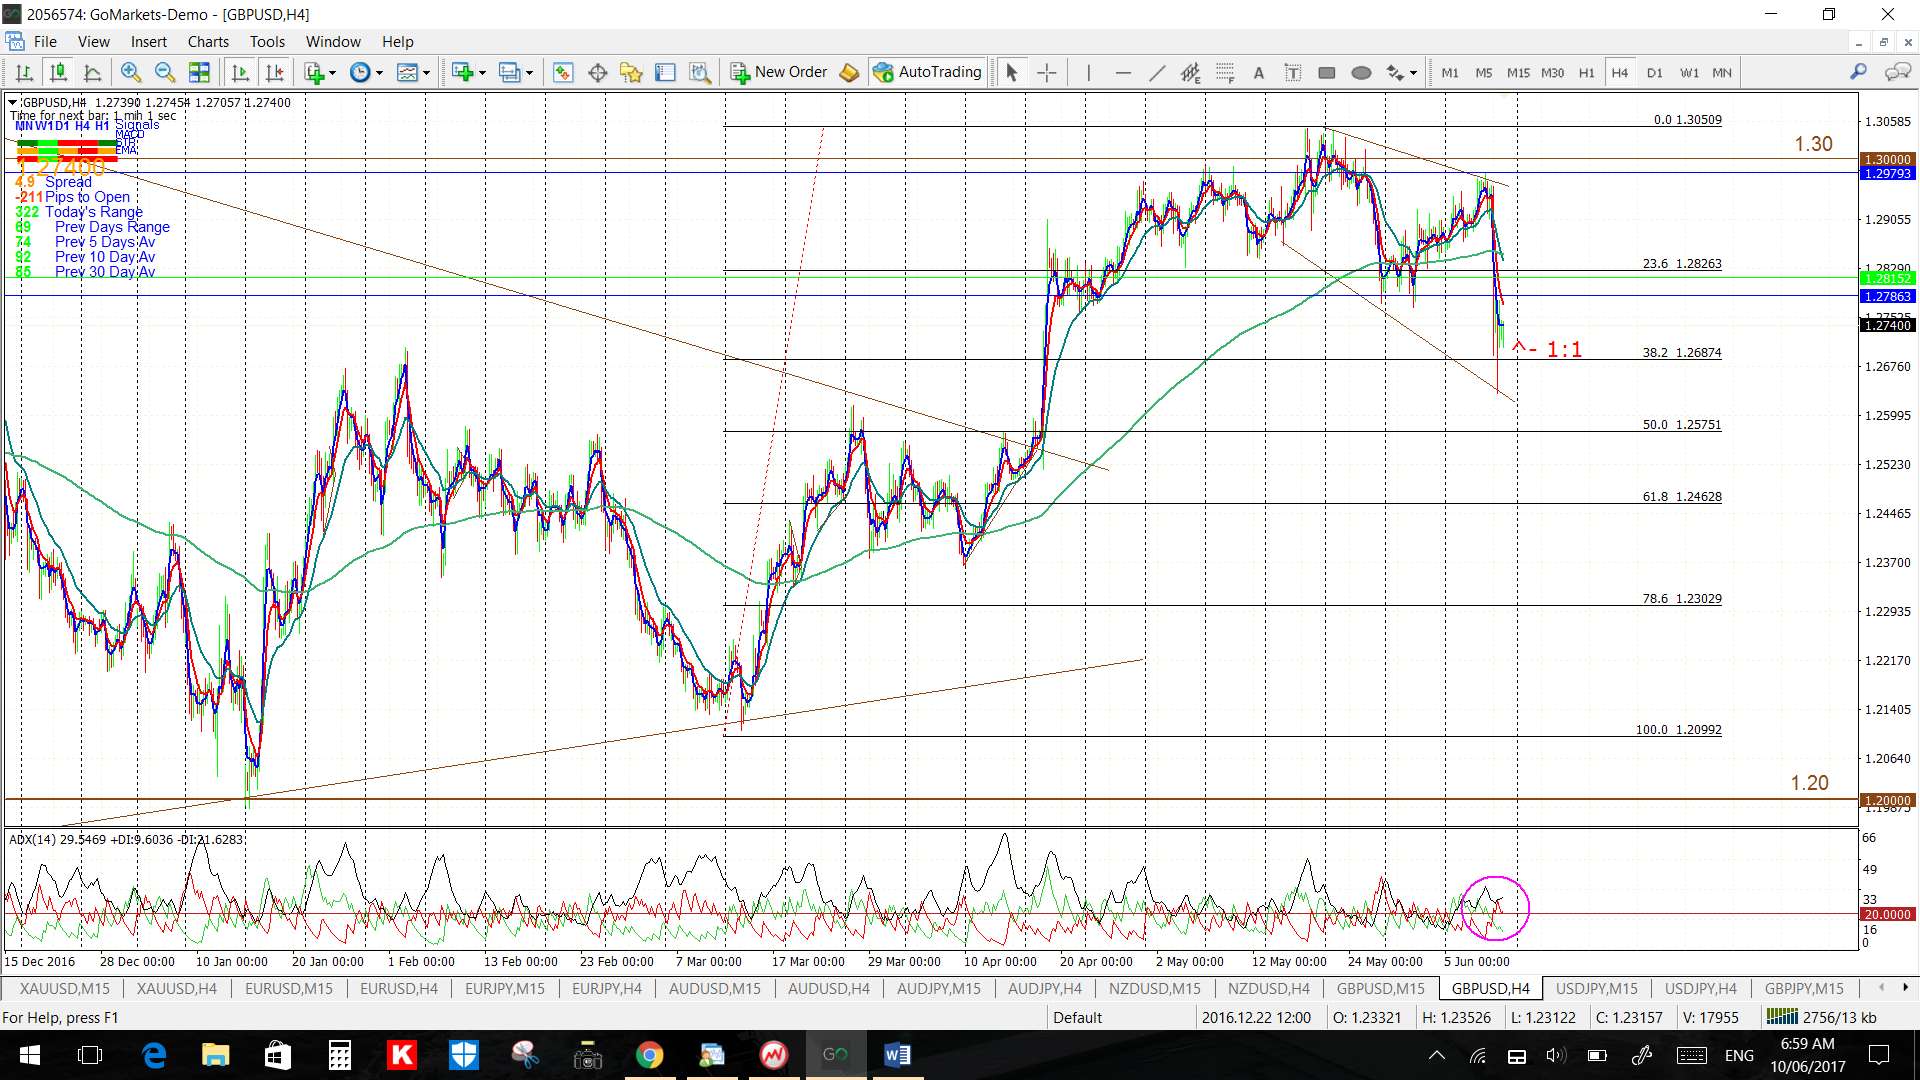
GBP/USD: The Cable fell heavily following the UK Election result but, to put this in perspective, it only pulled back to the 38.2% fib of the recent swing high move. This pair might remain a bit volatile though as plans for the new Government are sorted out.
There is a broadening Flag on the 4hr chart so watch these trend line for any breakout activity:
- Upper targets: 1.30 and then 1.35 as previous S/R followed by 1.40, which is near the 3-year bear trend line.
- Lower targets: any continued pullback would have me looking for a test of the 4hr chart’s 61.8% Fib near 1.25.
Watch this week with GBP CPI, Employment data, Retail Sales data and the BoE rate update as well as FOMC and continued fallout from the UK Election
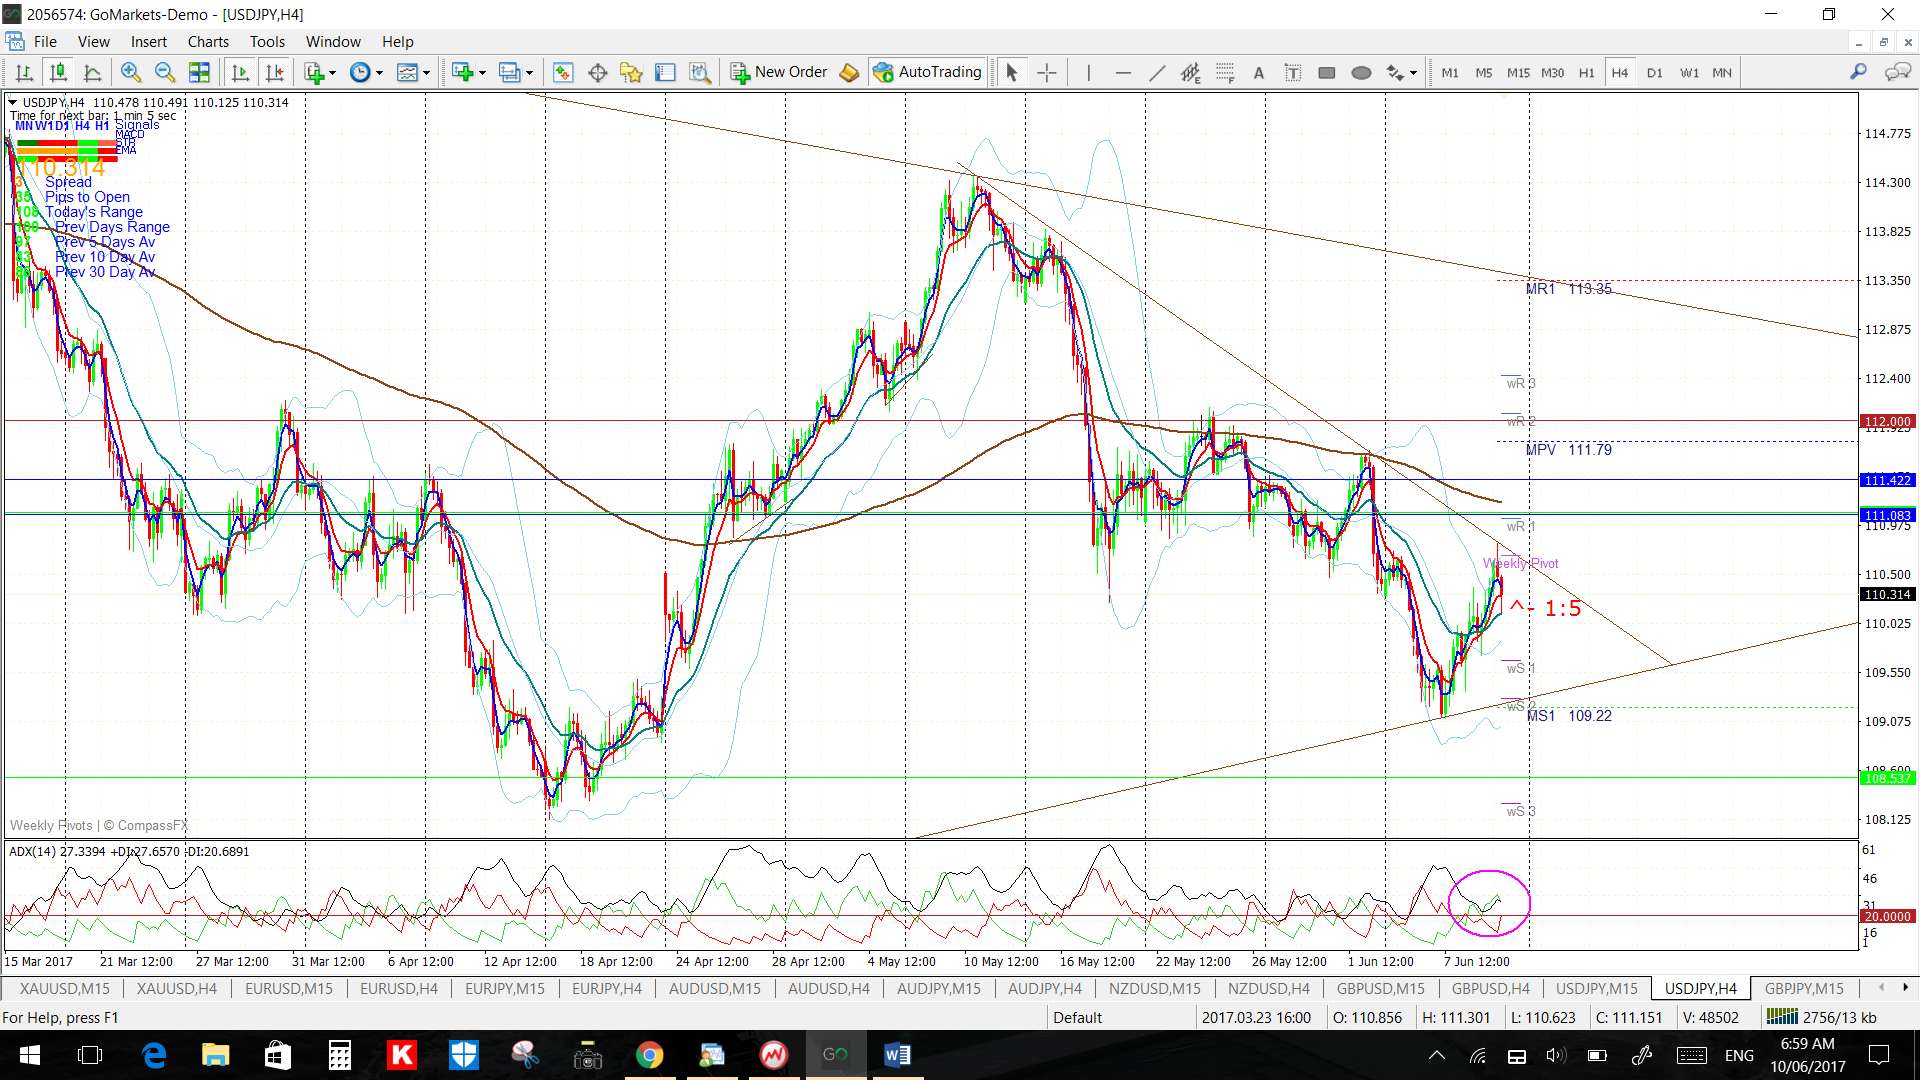
USD/JPY: Watch the 4hr chart’s triangle trend lines for any breakout:
- Upper targets: the daily chart’s upper triangle trend line.
- Lower targets: the daily chart’s lower triangle trend line.

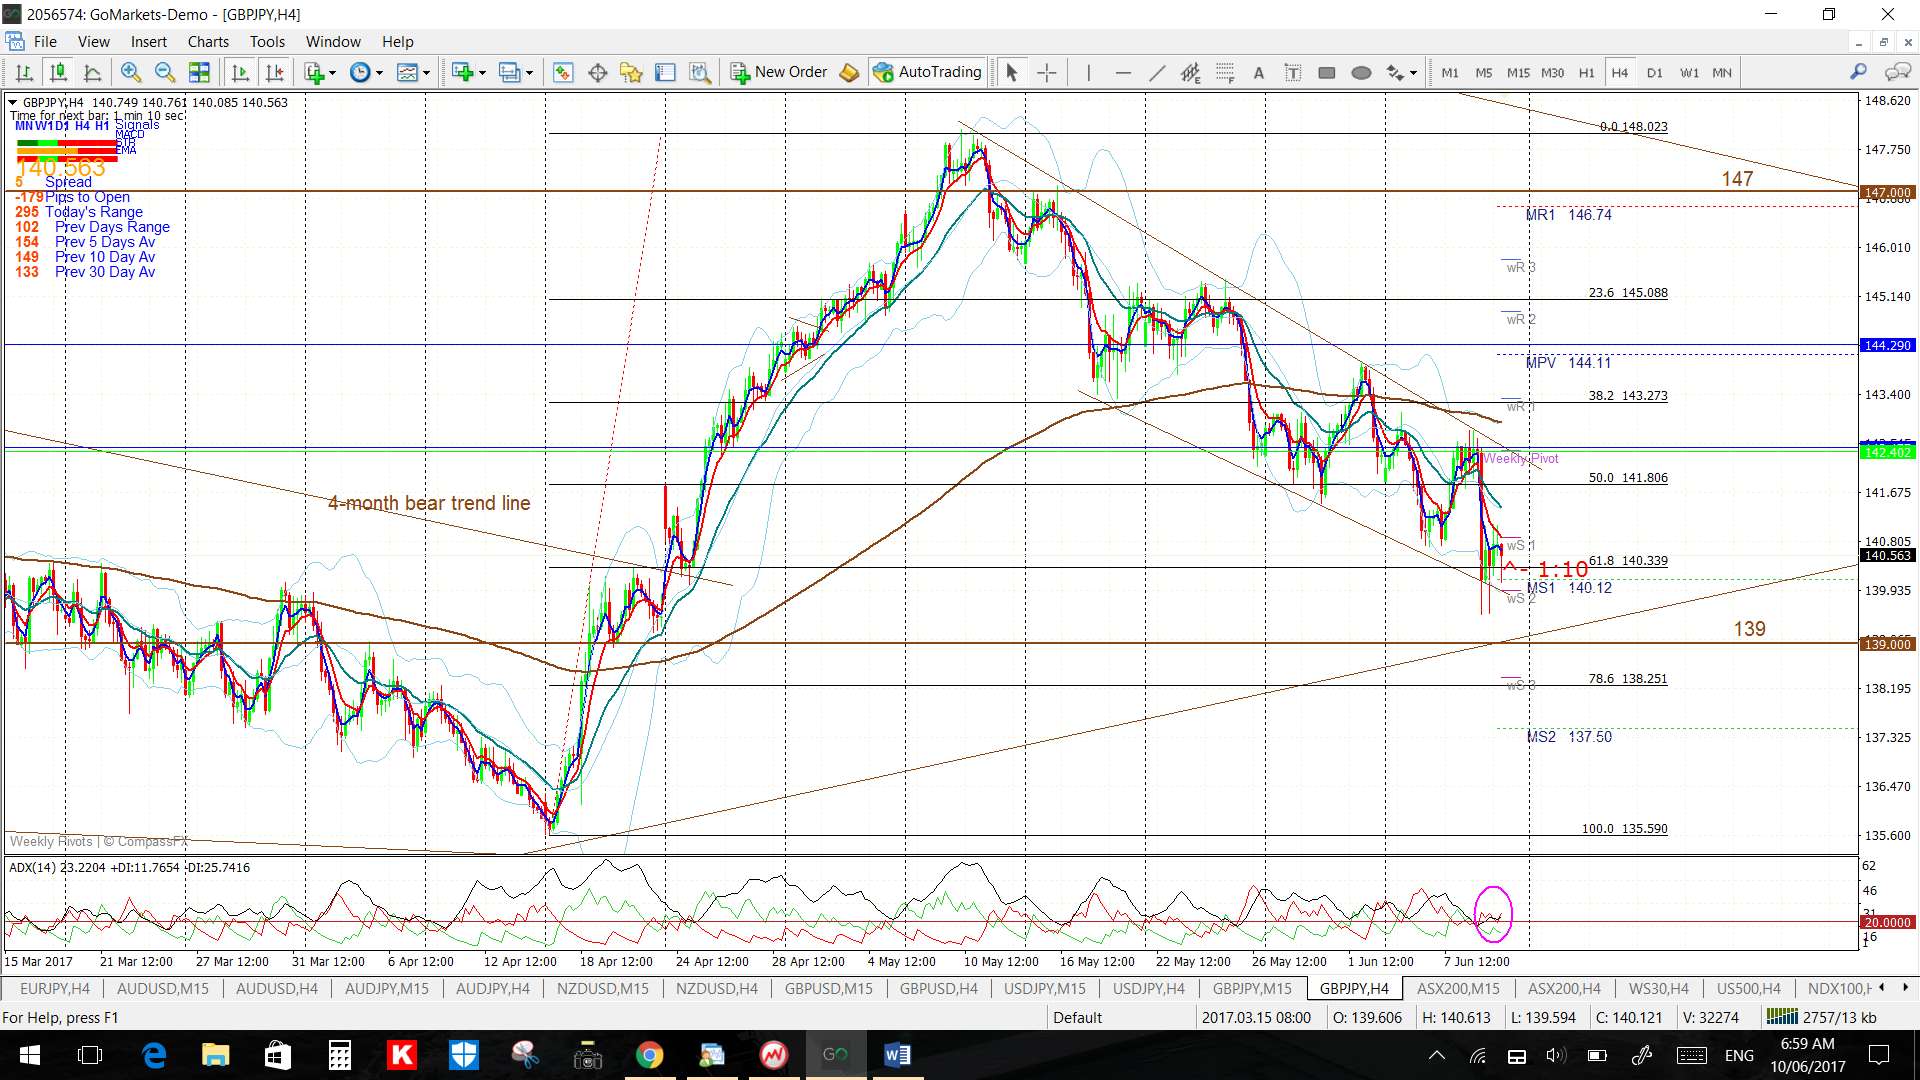
GBP/JPY: The GBP/JPY has pulled back within a descending channel to the 61.8% fib of the recent swing high move and so I’ll be watching this level for any make or break. Note the triangle support trend line just below this level as well.
Watch the 4hr chart’s descending channel trend lines though for any new breakout:
- Upper targets: 147 as previous S/R and, then, the 22 month bear trend line followed by the weekly chart’s 61.8% Fib which is up near 168.
- Lower targets: any pullback would have me looking for a test of the triangle support trend line and 139 level.

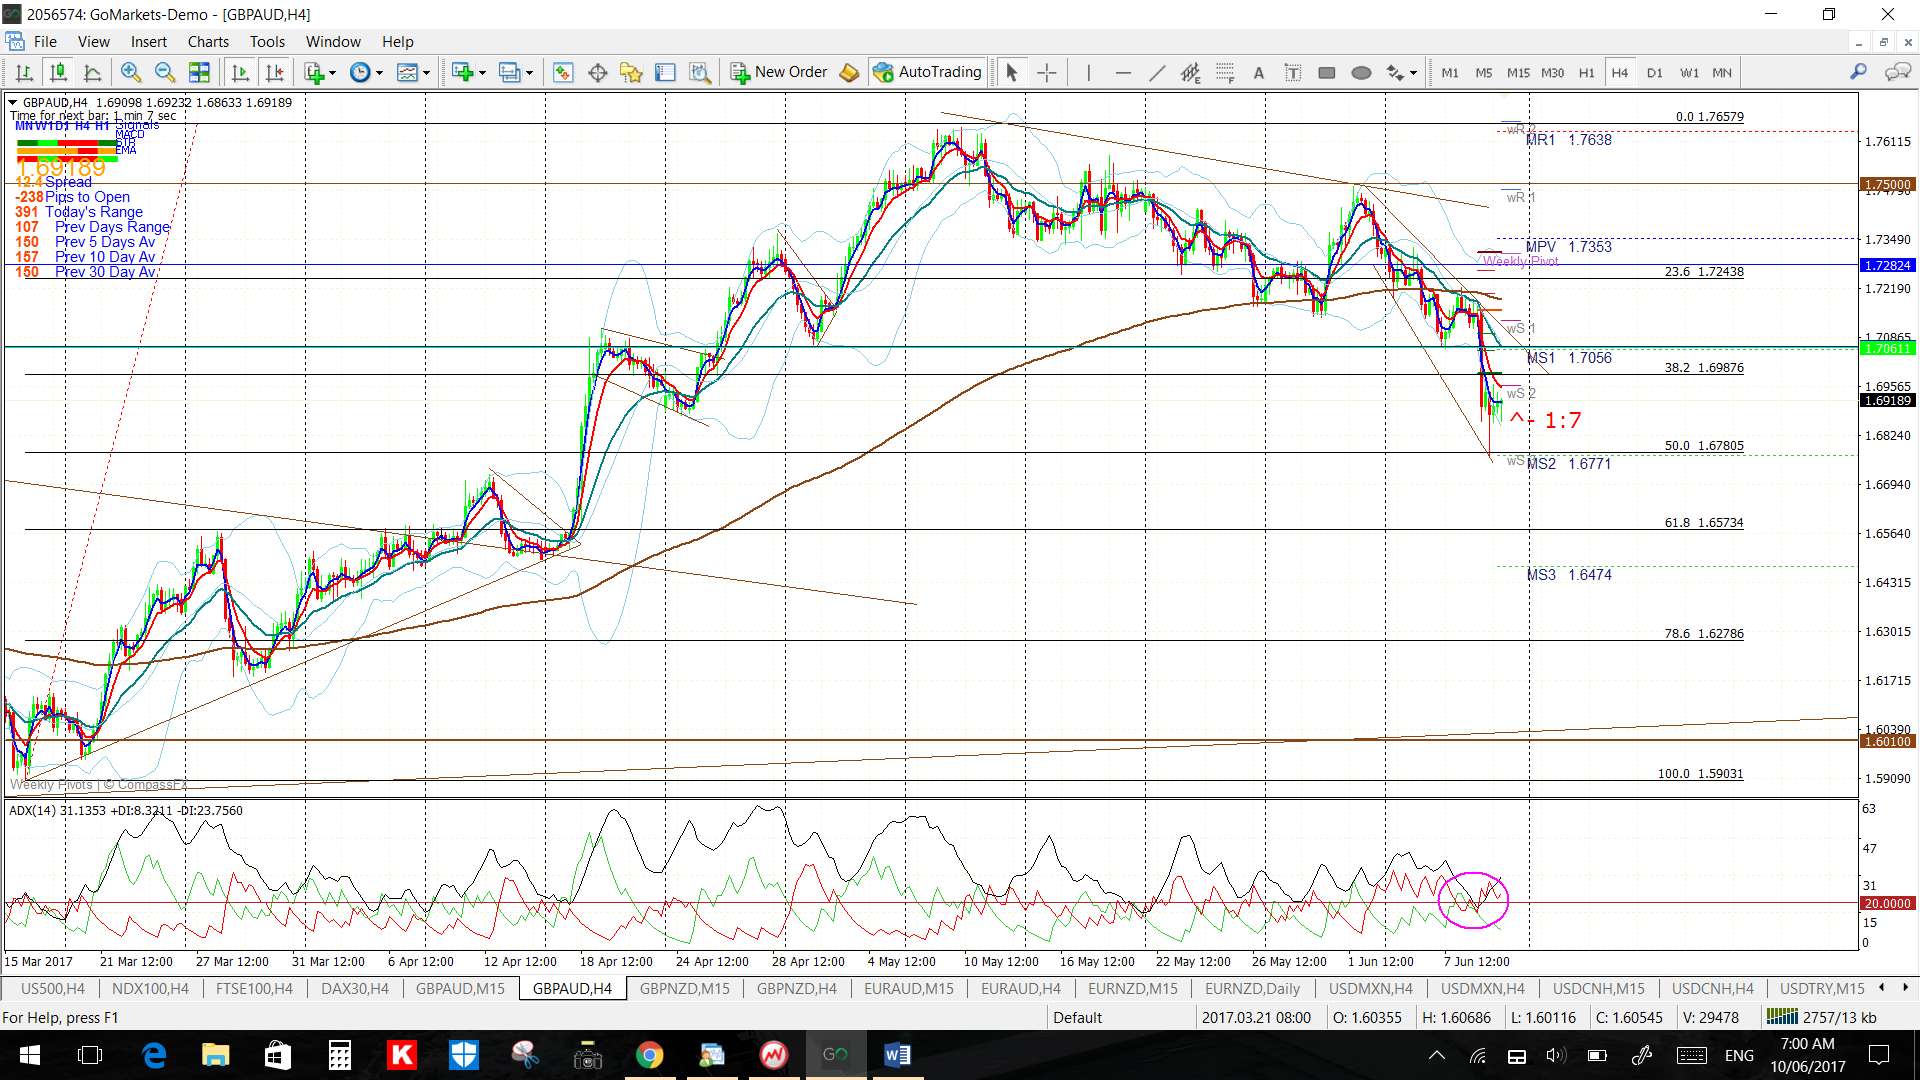
GBP/AUD: The GBP/AUD pulled back to the 50% fib of the recent swing high move and I have noted a descending wedge on the 4hr chart.
Watch the 4hr chart’s descending wedge trend lines for any breakout:
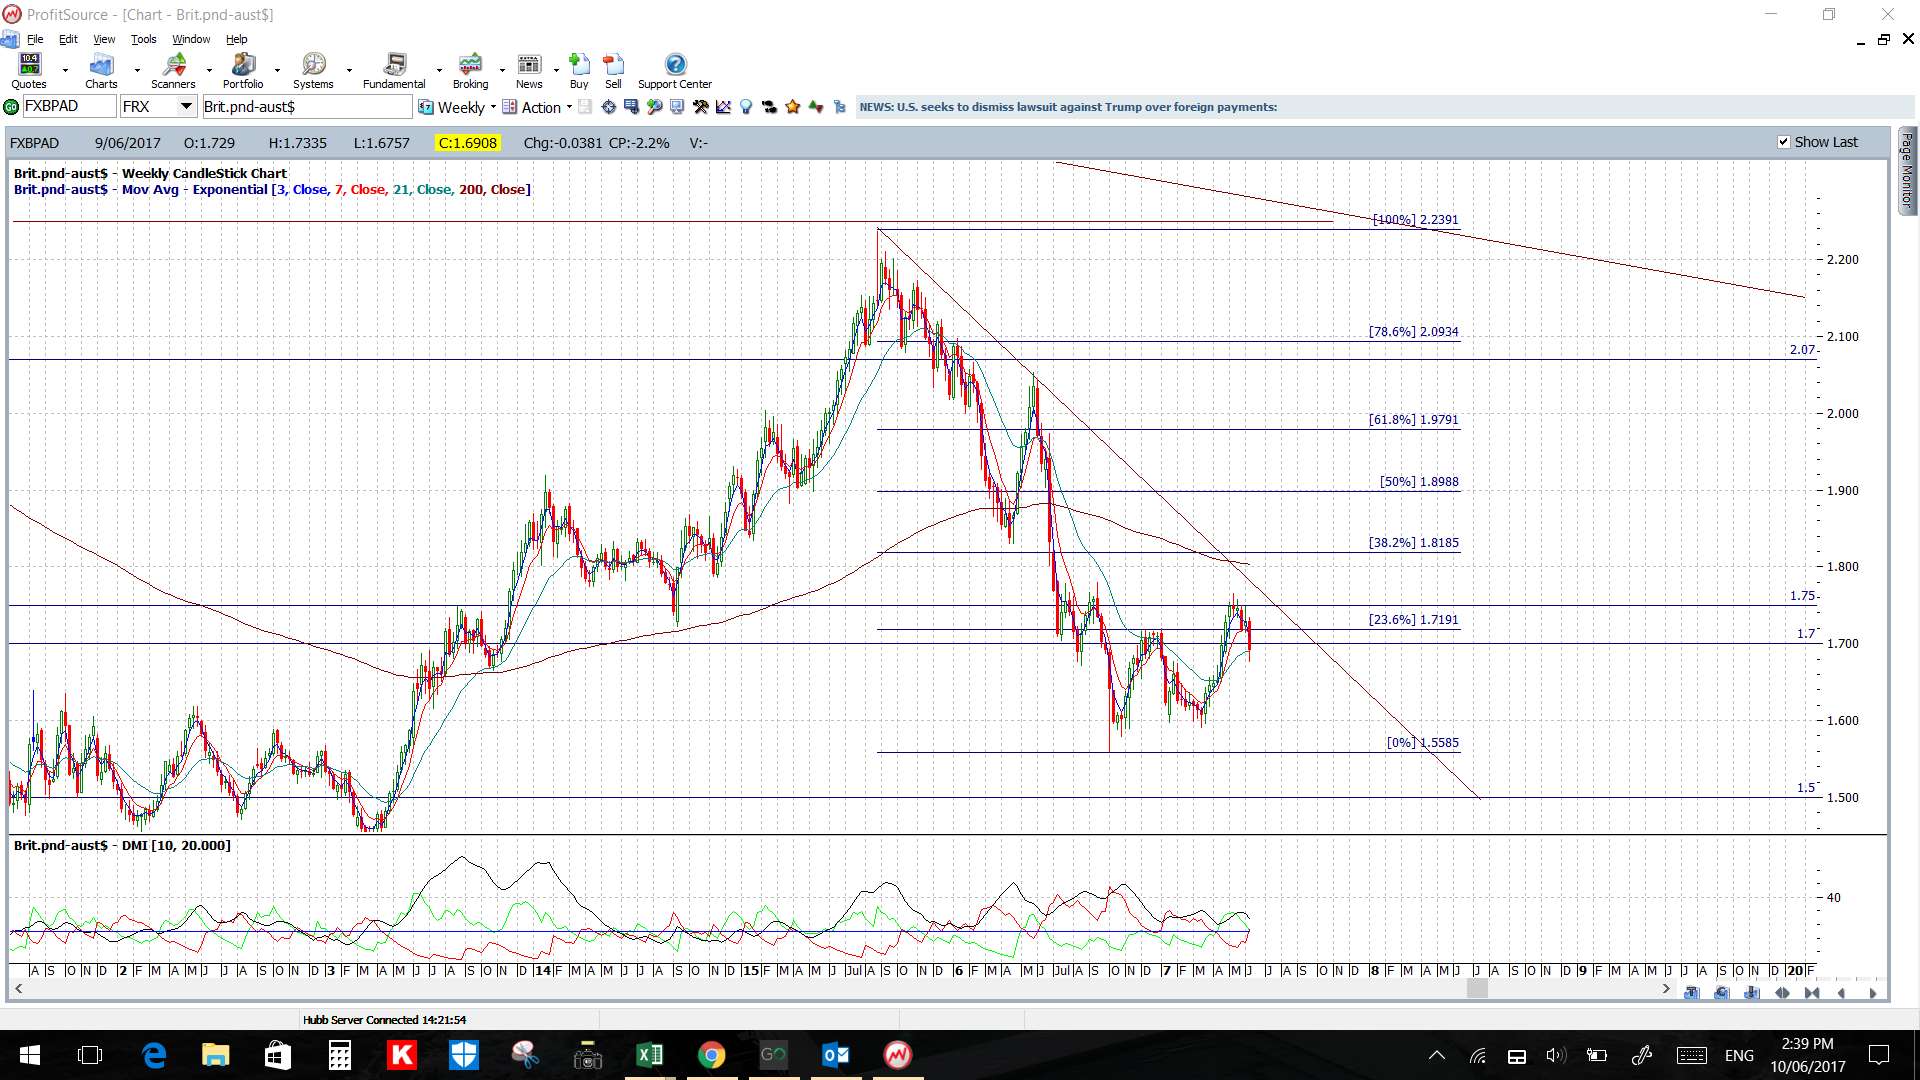
- Upper targets: The 1.75 level, then 1.80 as previous S/R, now some 700 pips away and, then, the 20-month bear trend line that is some 900+ pips away.
- Lower targets: any pullback would have me looking for a test of the 4hr chart’s 61.8% Fib near 1.65 followed by 1.601 S/R.
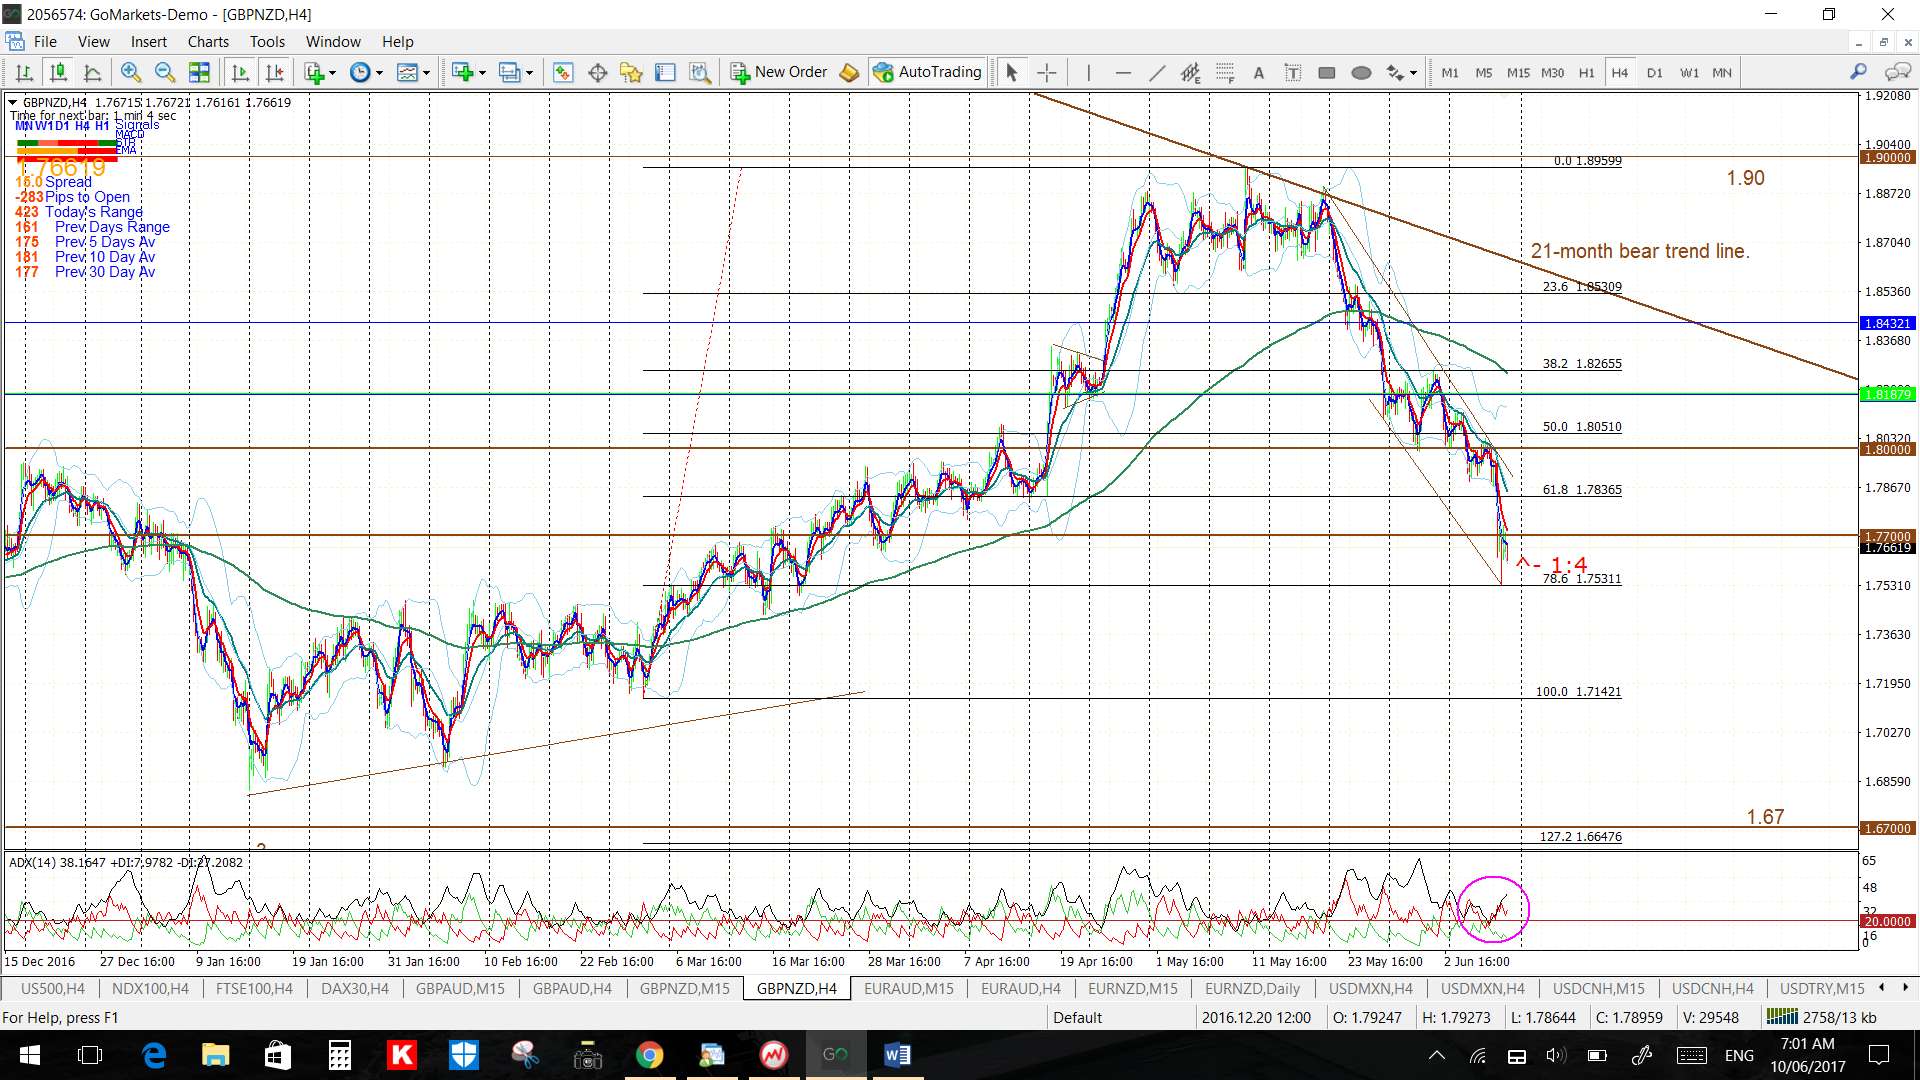
GBP/NZD: This pair has pulled back to the major 1.77 S/R level and is trading within a descending channel.
Watch the 4hr chart’s channel trend lines for any breakout:
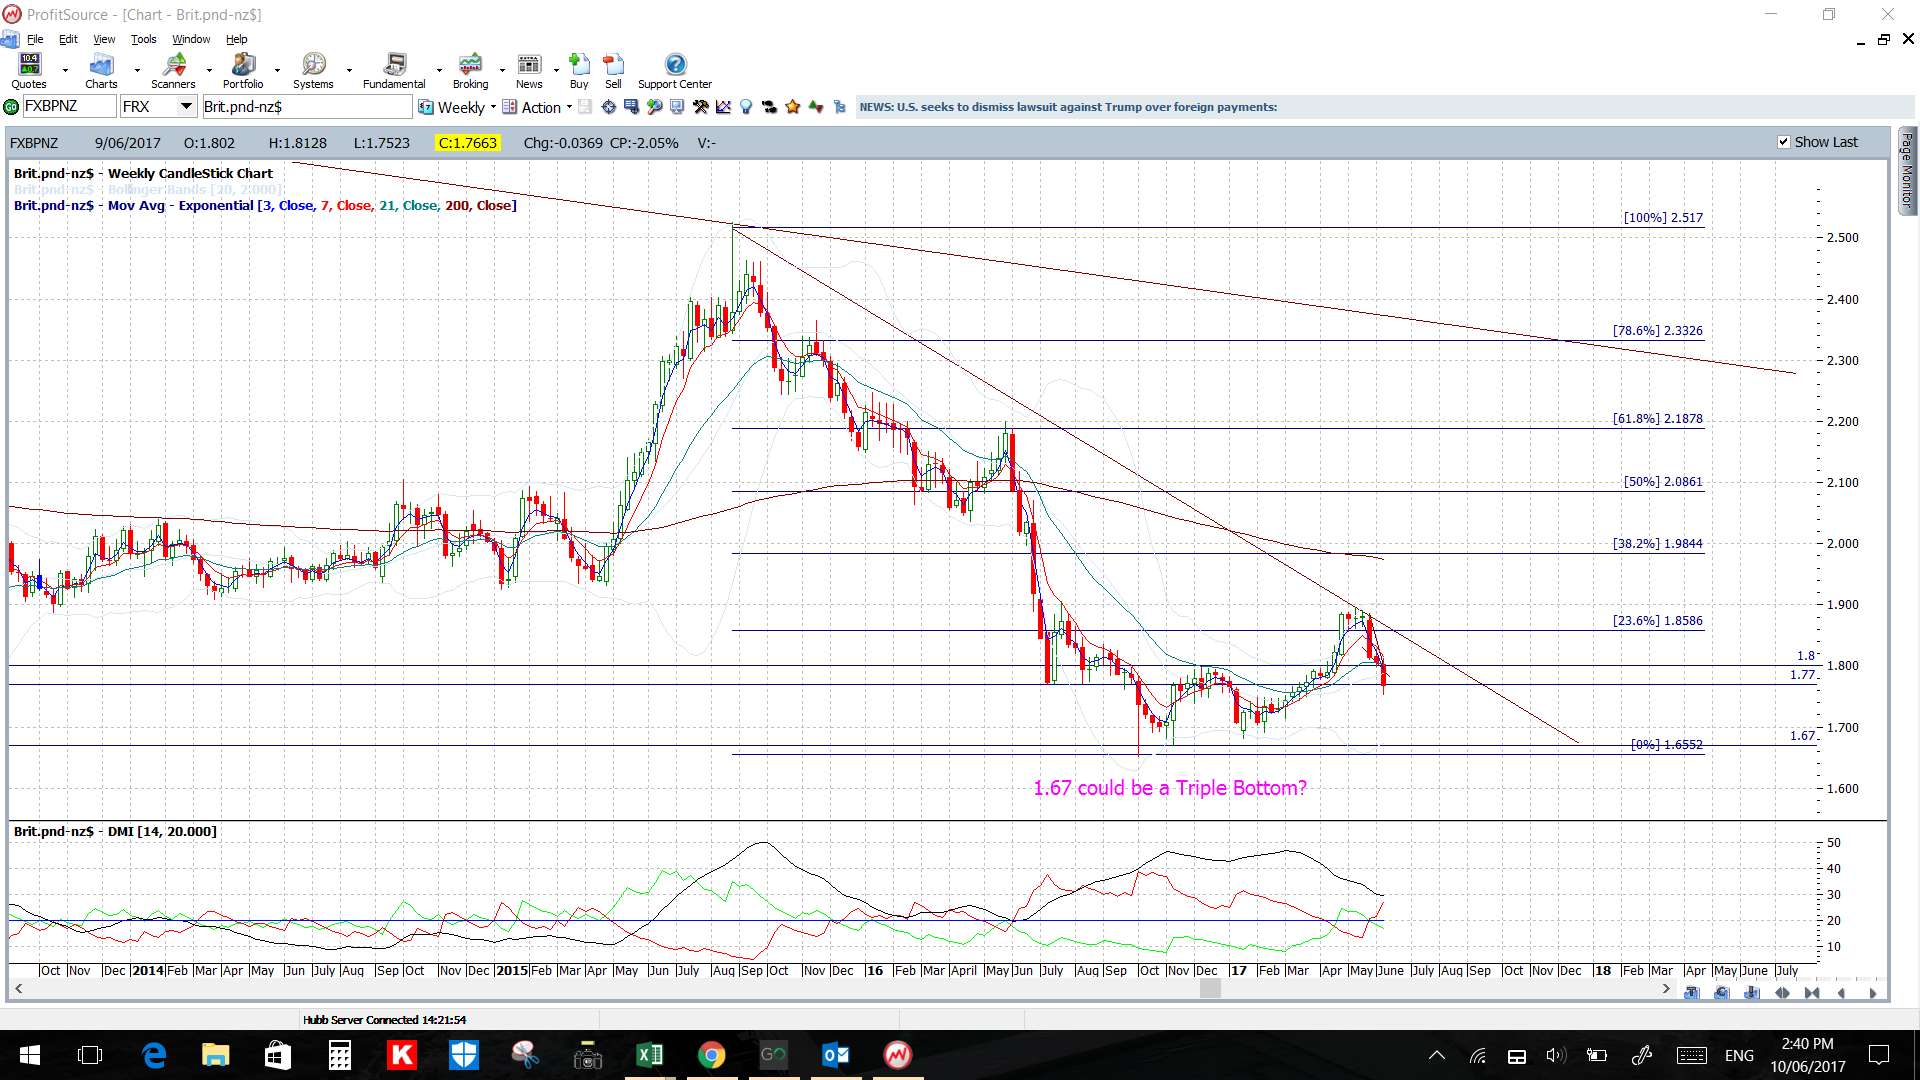
- Upper targets: The 1.80 level followed by the monthly charts revised monthly bear trend line, then the 1.90 as previous S/R and, after that, the weekly chart’s 61.8% Fib near 2.20 S/R.
- Lower targets: any deeper pullback would have me looking for a test of the 1.67 S/R level.
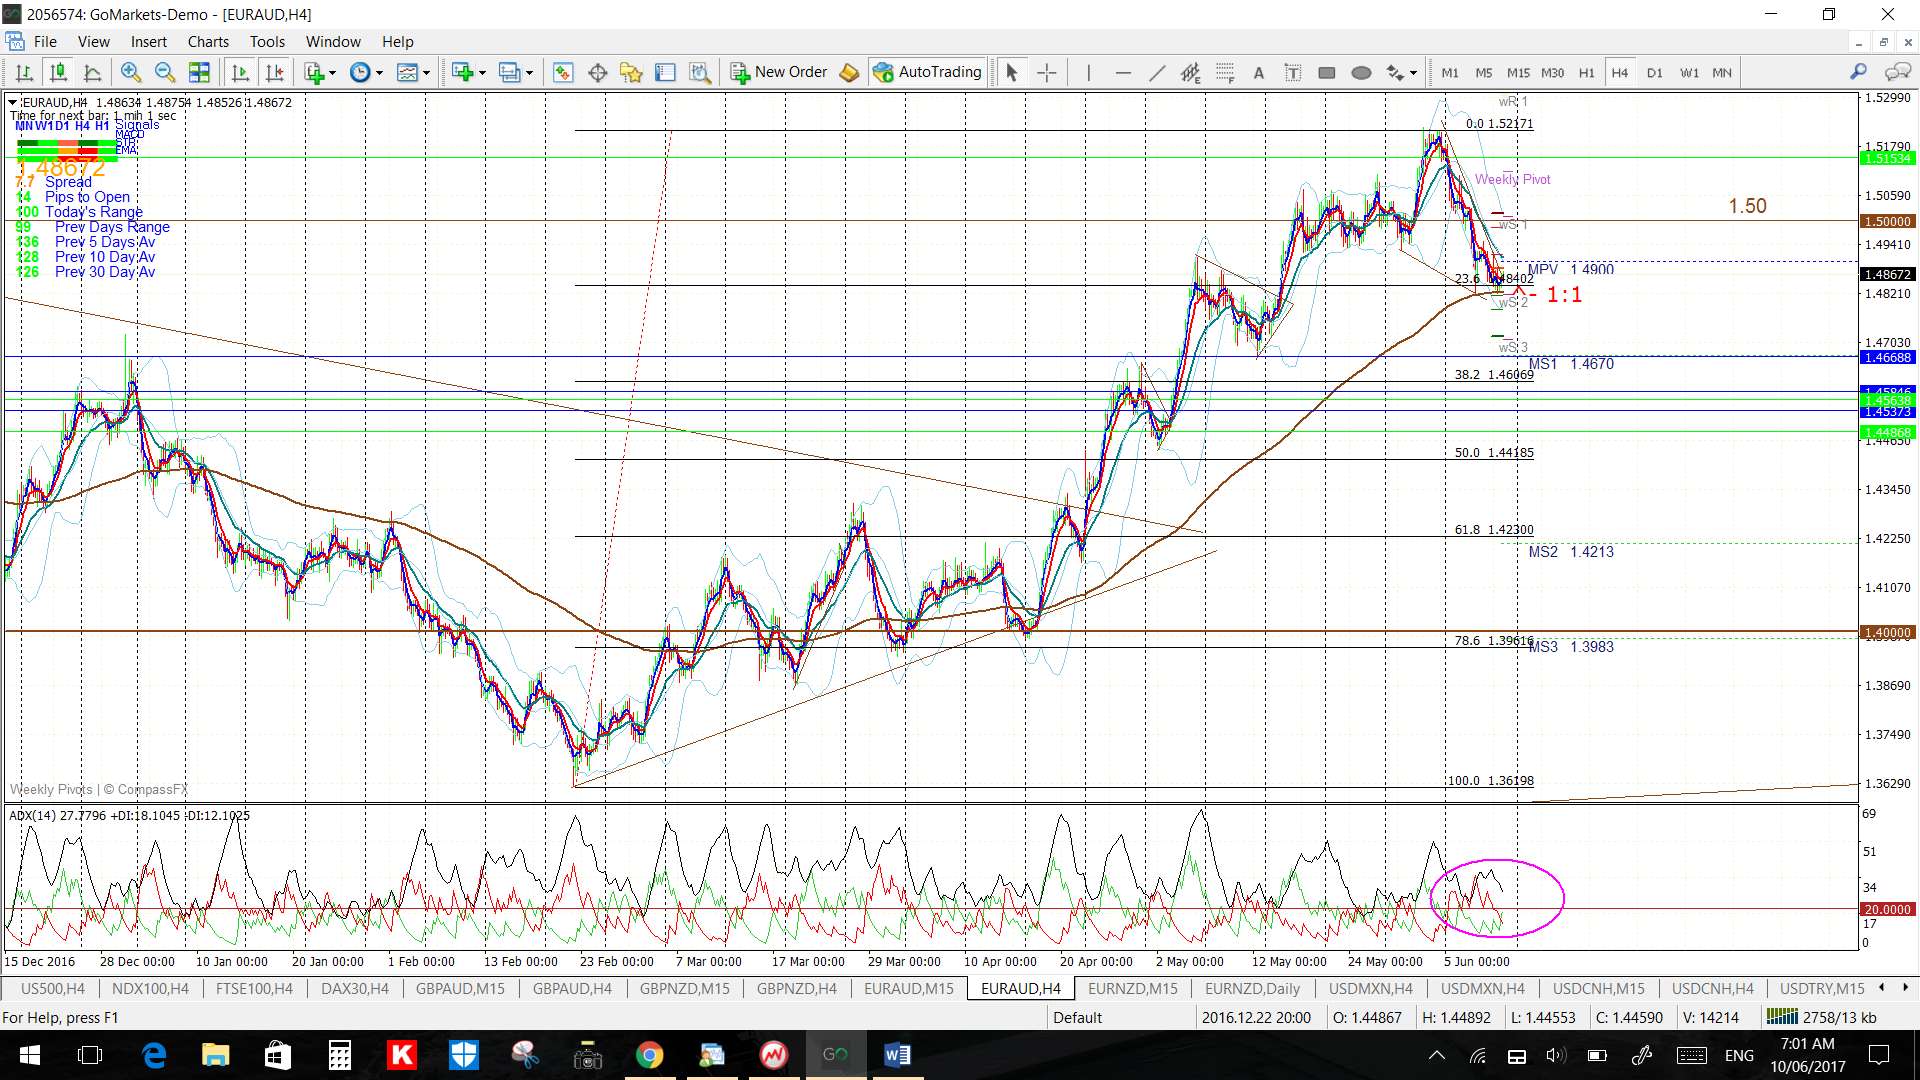
EUR/AUD: This pair looks to be consolidating under the 9-year bear trend line and has been doing so within a 4 hr Flag pattern for the last two weeks.
Watch the 4hr chart’s Flag trend lines for any breakout:
- Upper targets: The 1.50 level, then the 9-year bear trend line and then the previous S/R level of 1.55.
- Lower targets: any pullback would have me looking for a test of the 4hr chart’s 50% Fib near 1.44 and then the 1.40 level.

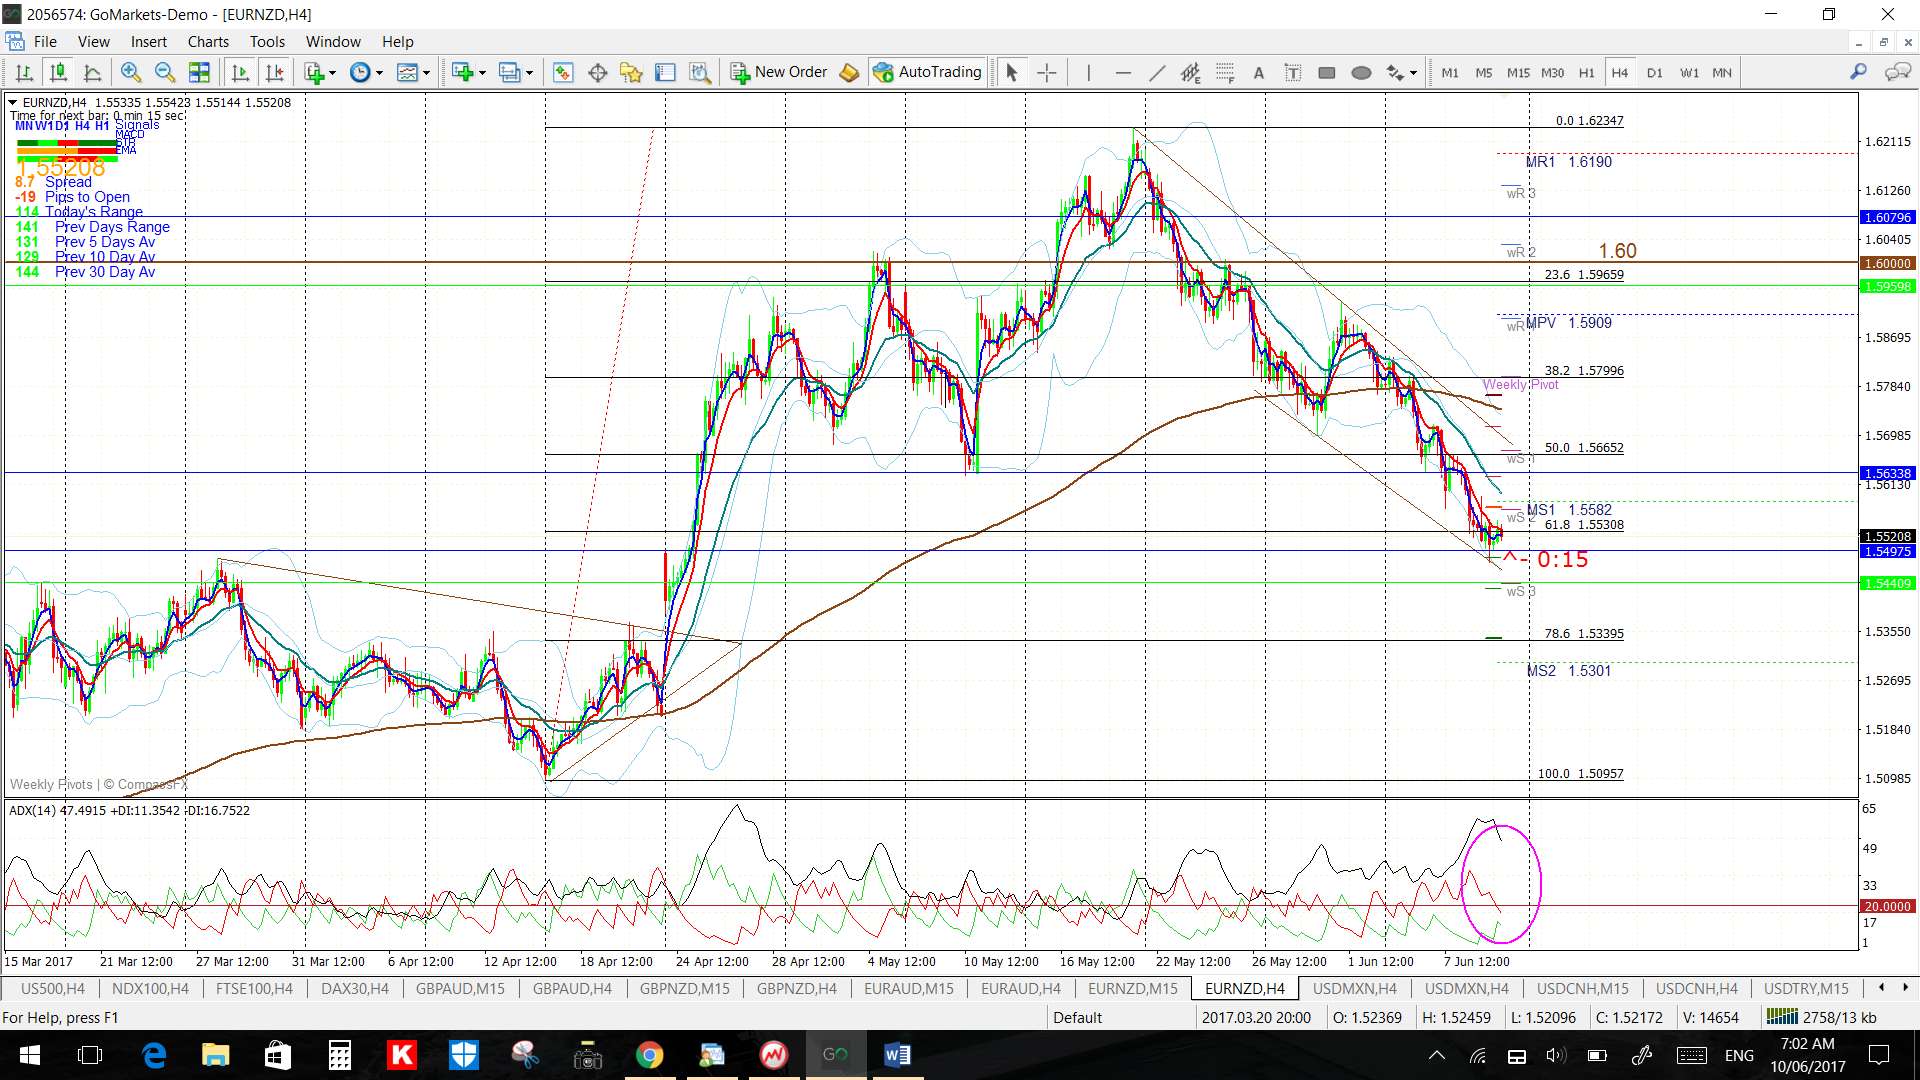
EUR/NZD: The EUR/NZD has pulled back to the 61.8% fib of the recent swing high move and this action has formed up within a descending trading channel.
Watch the 4hr chart’s channel trend lines for any breakout:
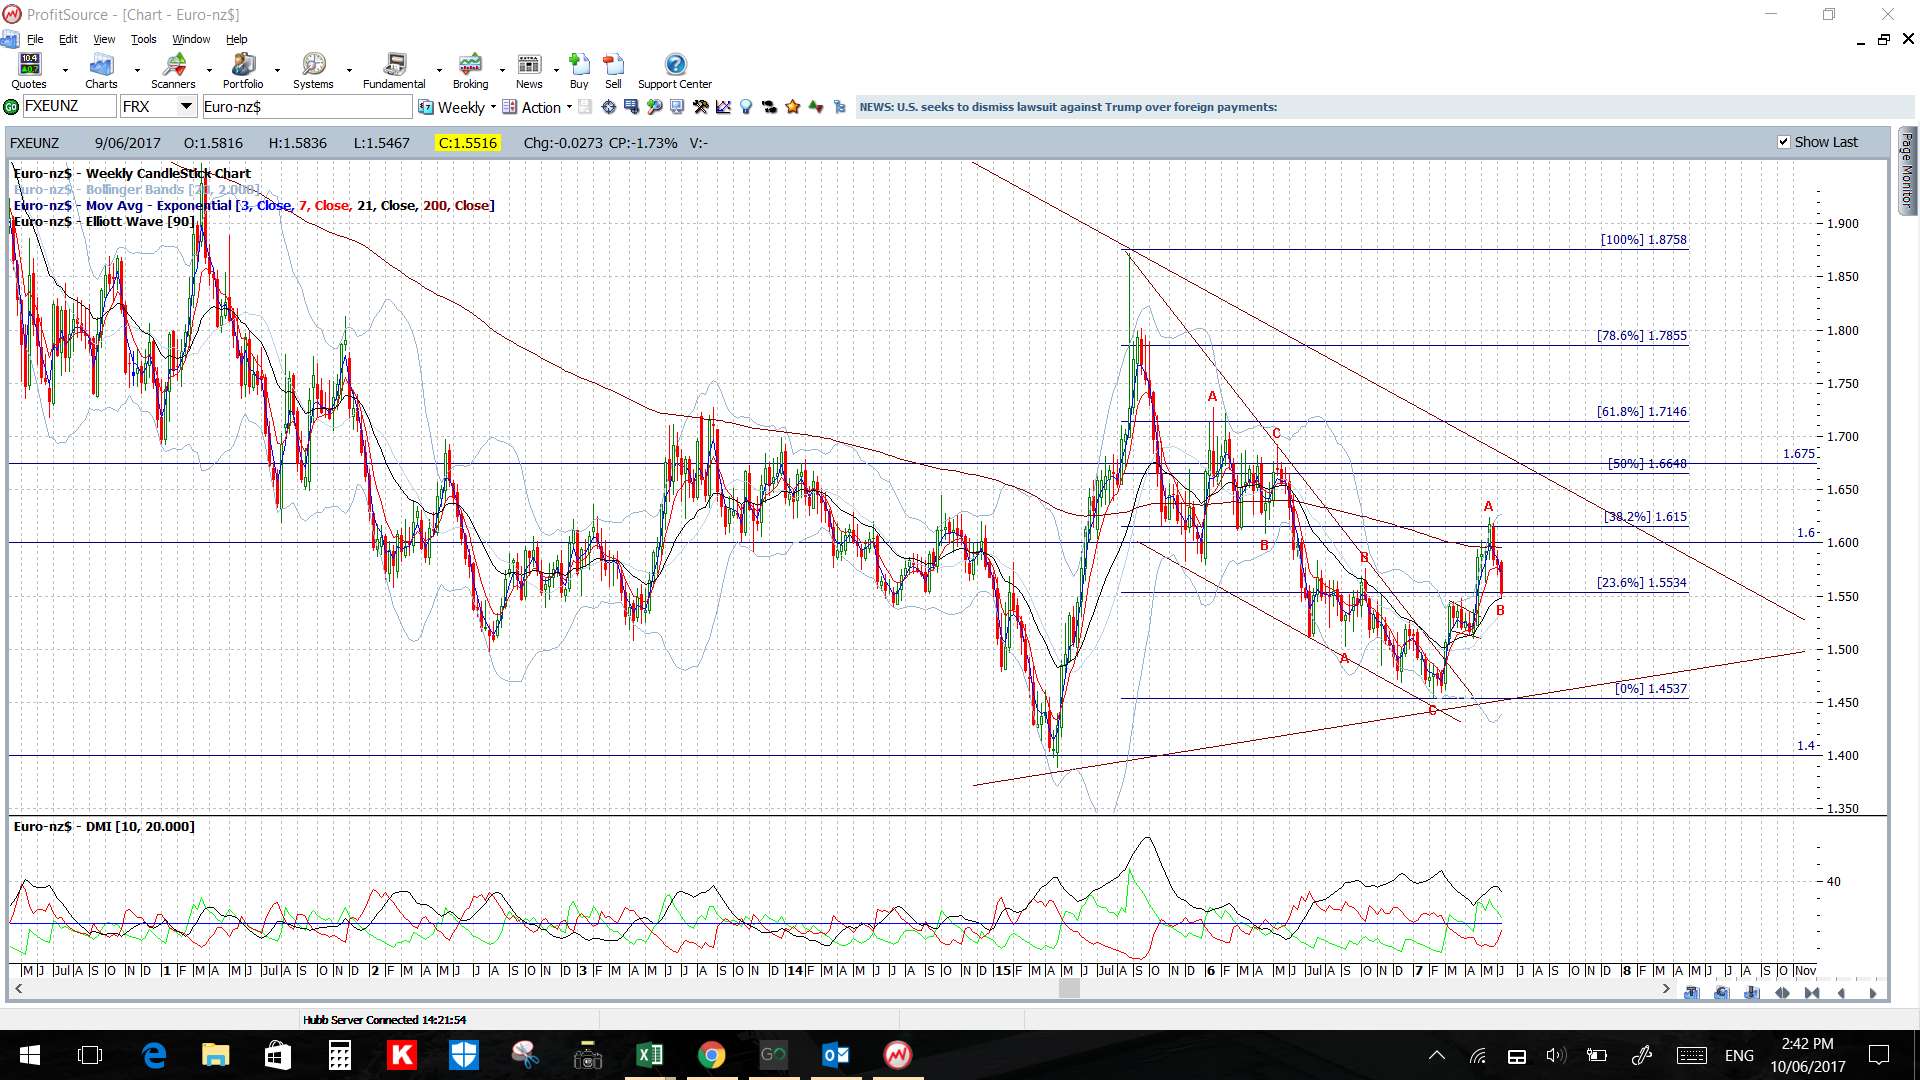
- Upper targets: The key 1.60 and then the 1.675 S/R region, which is about 900+ pips above current price and, then, there is the 9-year bear trend line.
- Lower targets: any continued pullback would have me looking for a test of the 4hr chart’s 100% Fib near 1.50.
Commodities:
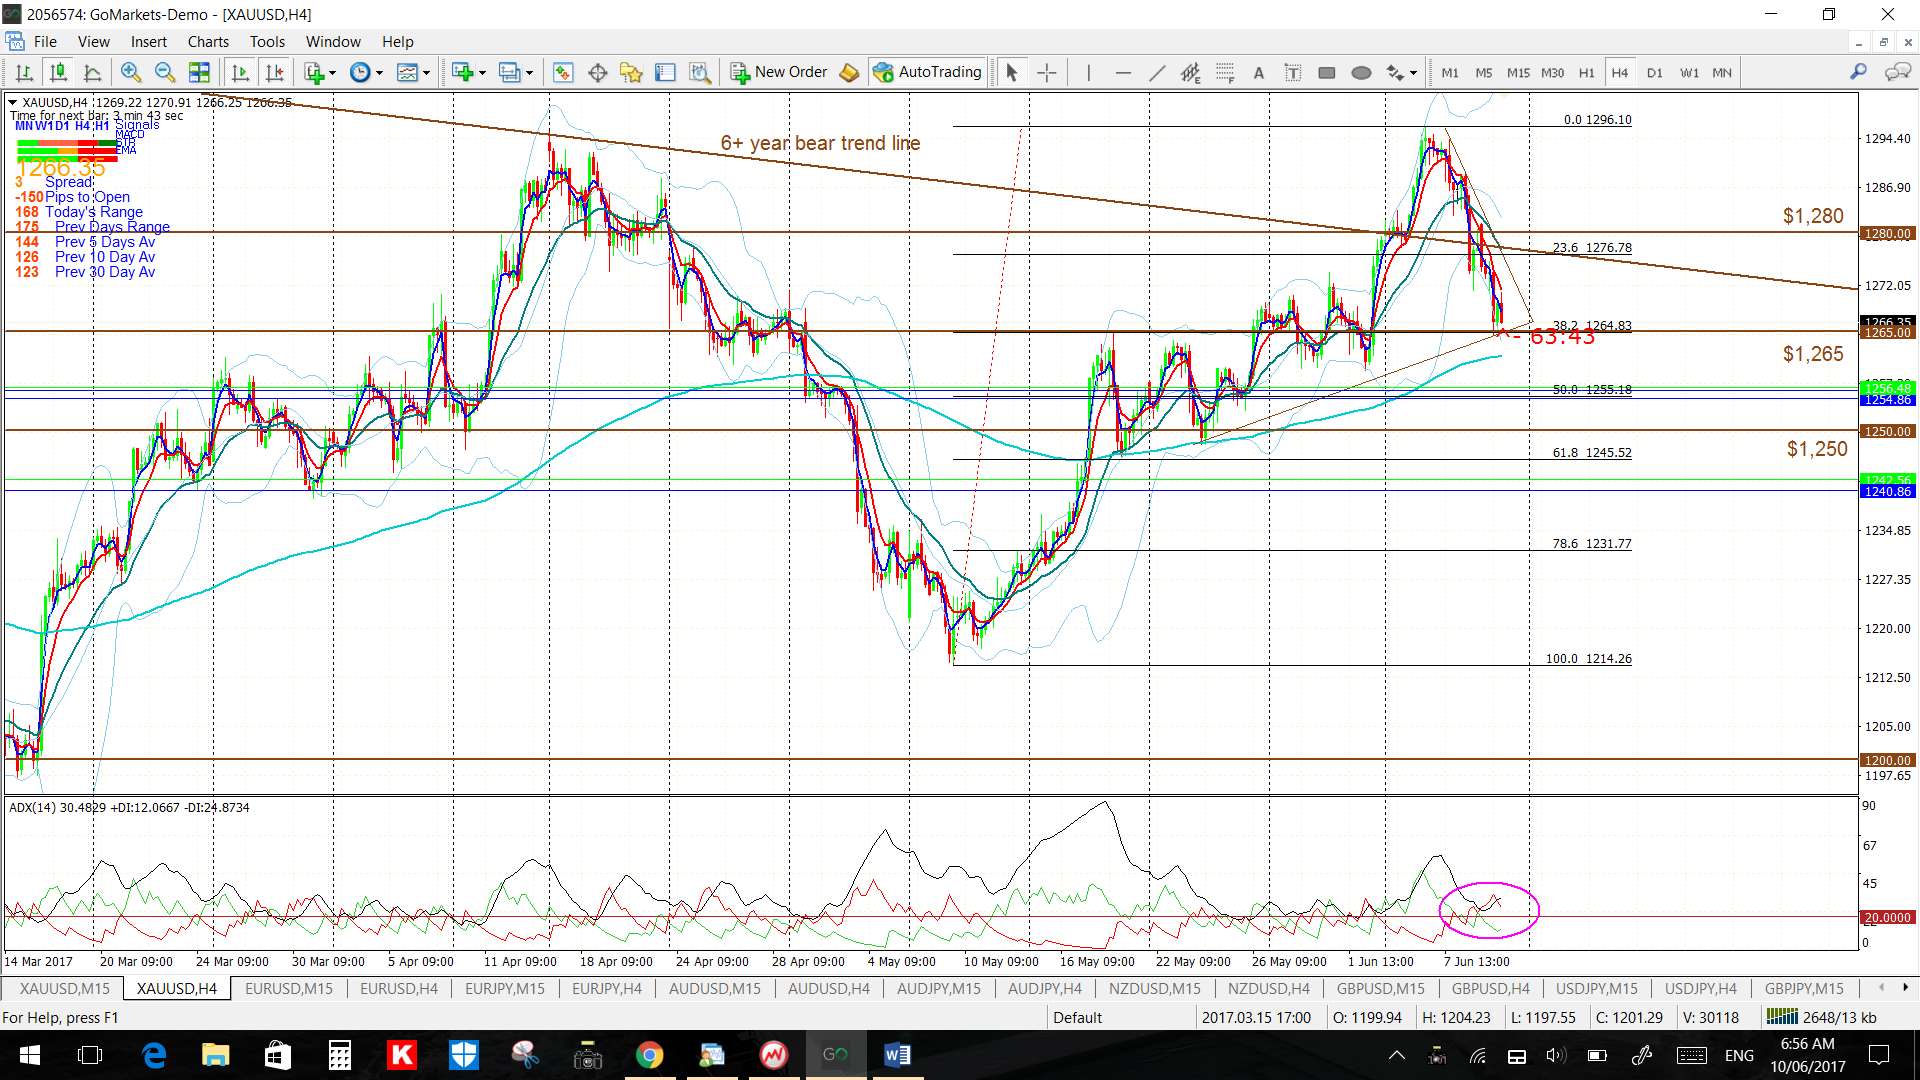
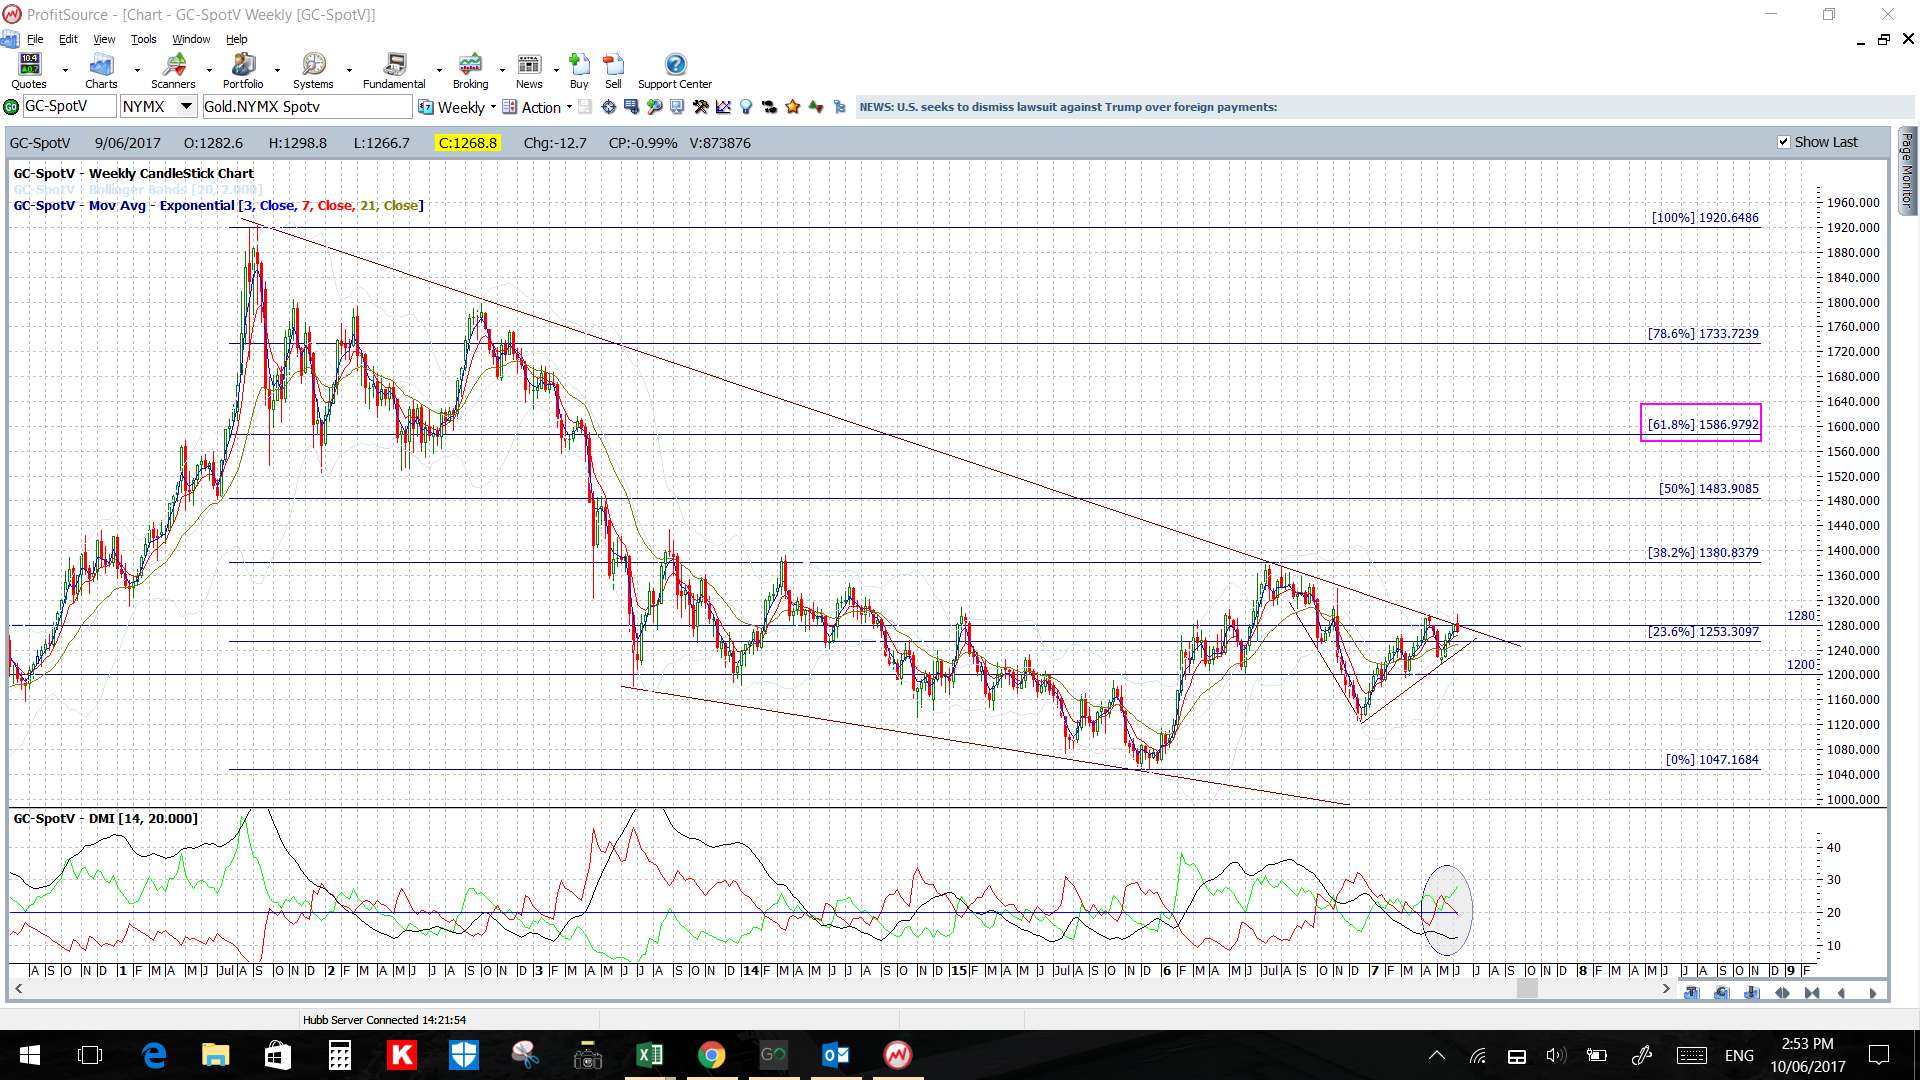
Gold: Gold has not managed to close the week above the 6-year bear trend line near the $1,280 level but this remains the level to watch for any make or break in future sessions.
Watch the 4hr chart triangle for any breakout:
- Upper targets: the weekly chart’s 61.8% fib near $1,600.
- Lower targets: any pullback would have me looking for a test of the $1,250 region followed by the 4hr chart’s 61.8% fib level near $1,240.
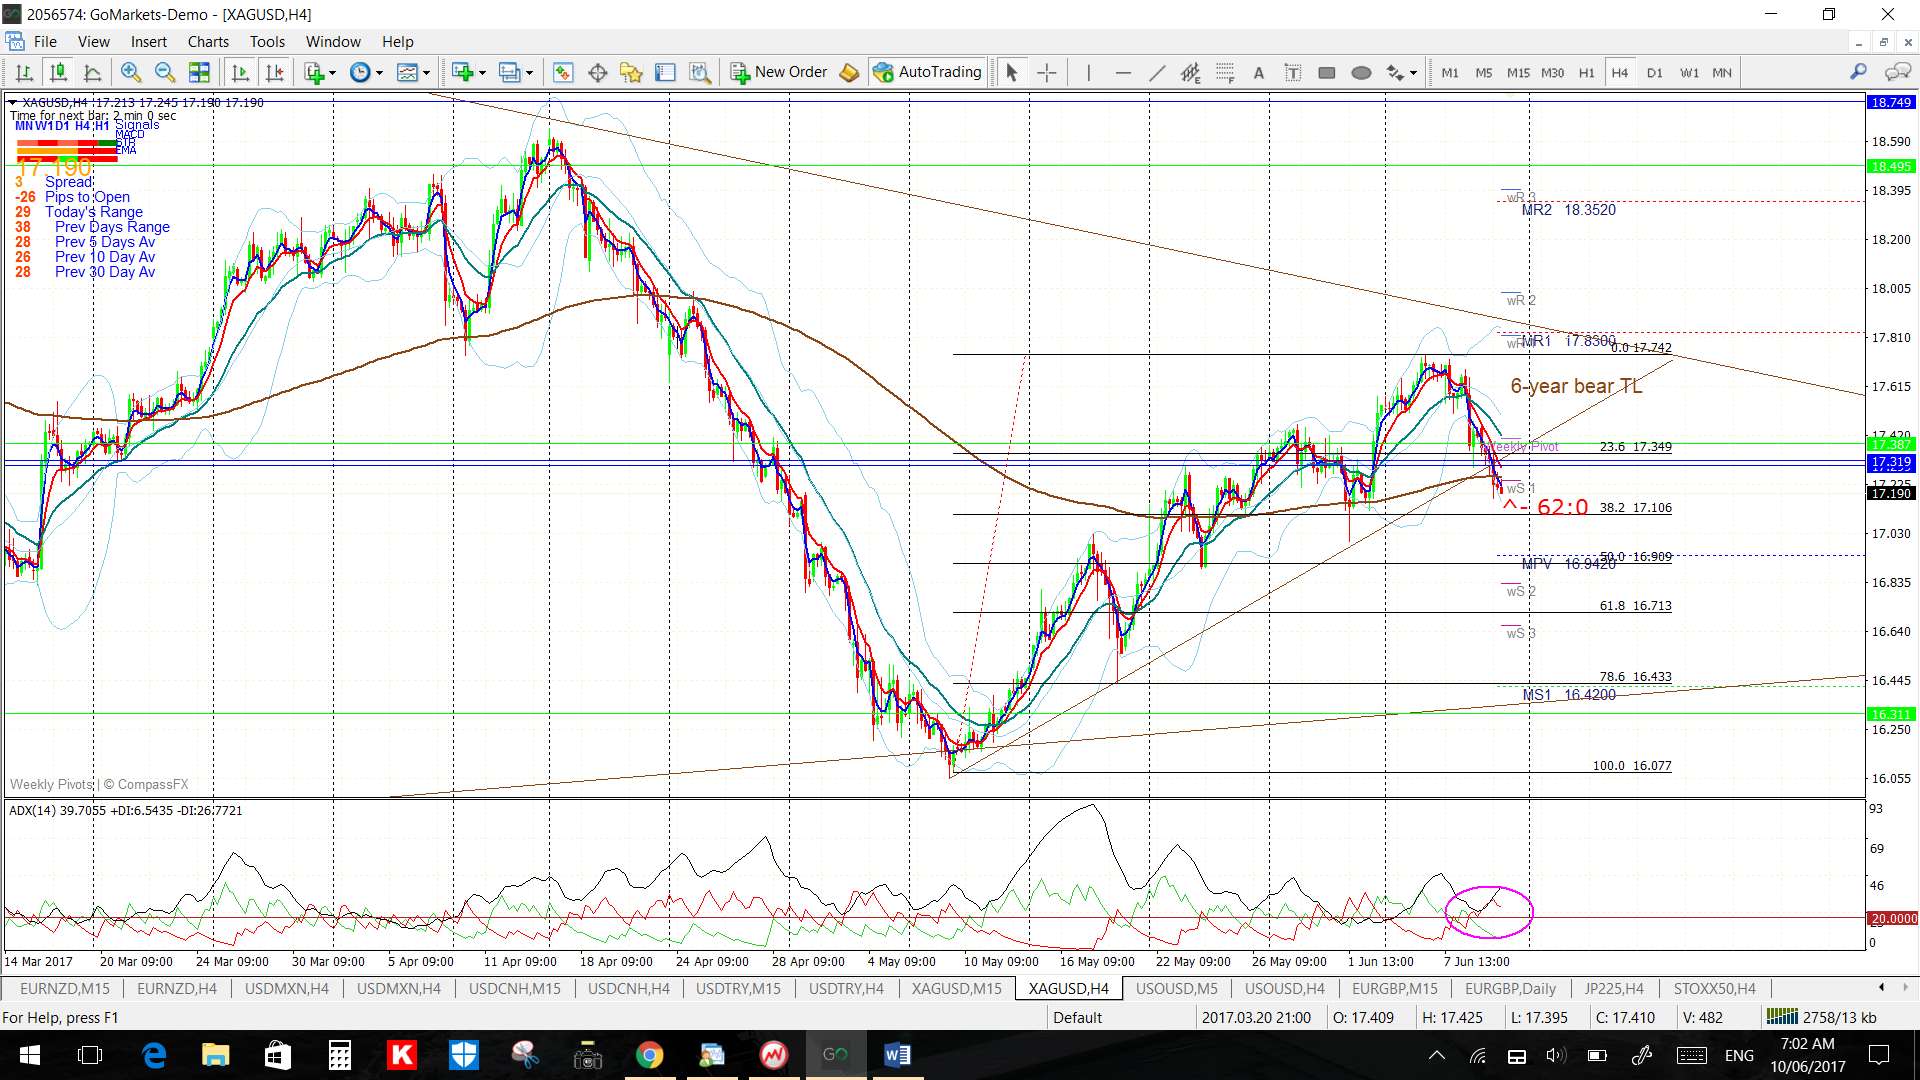
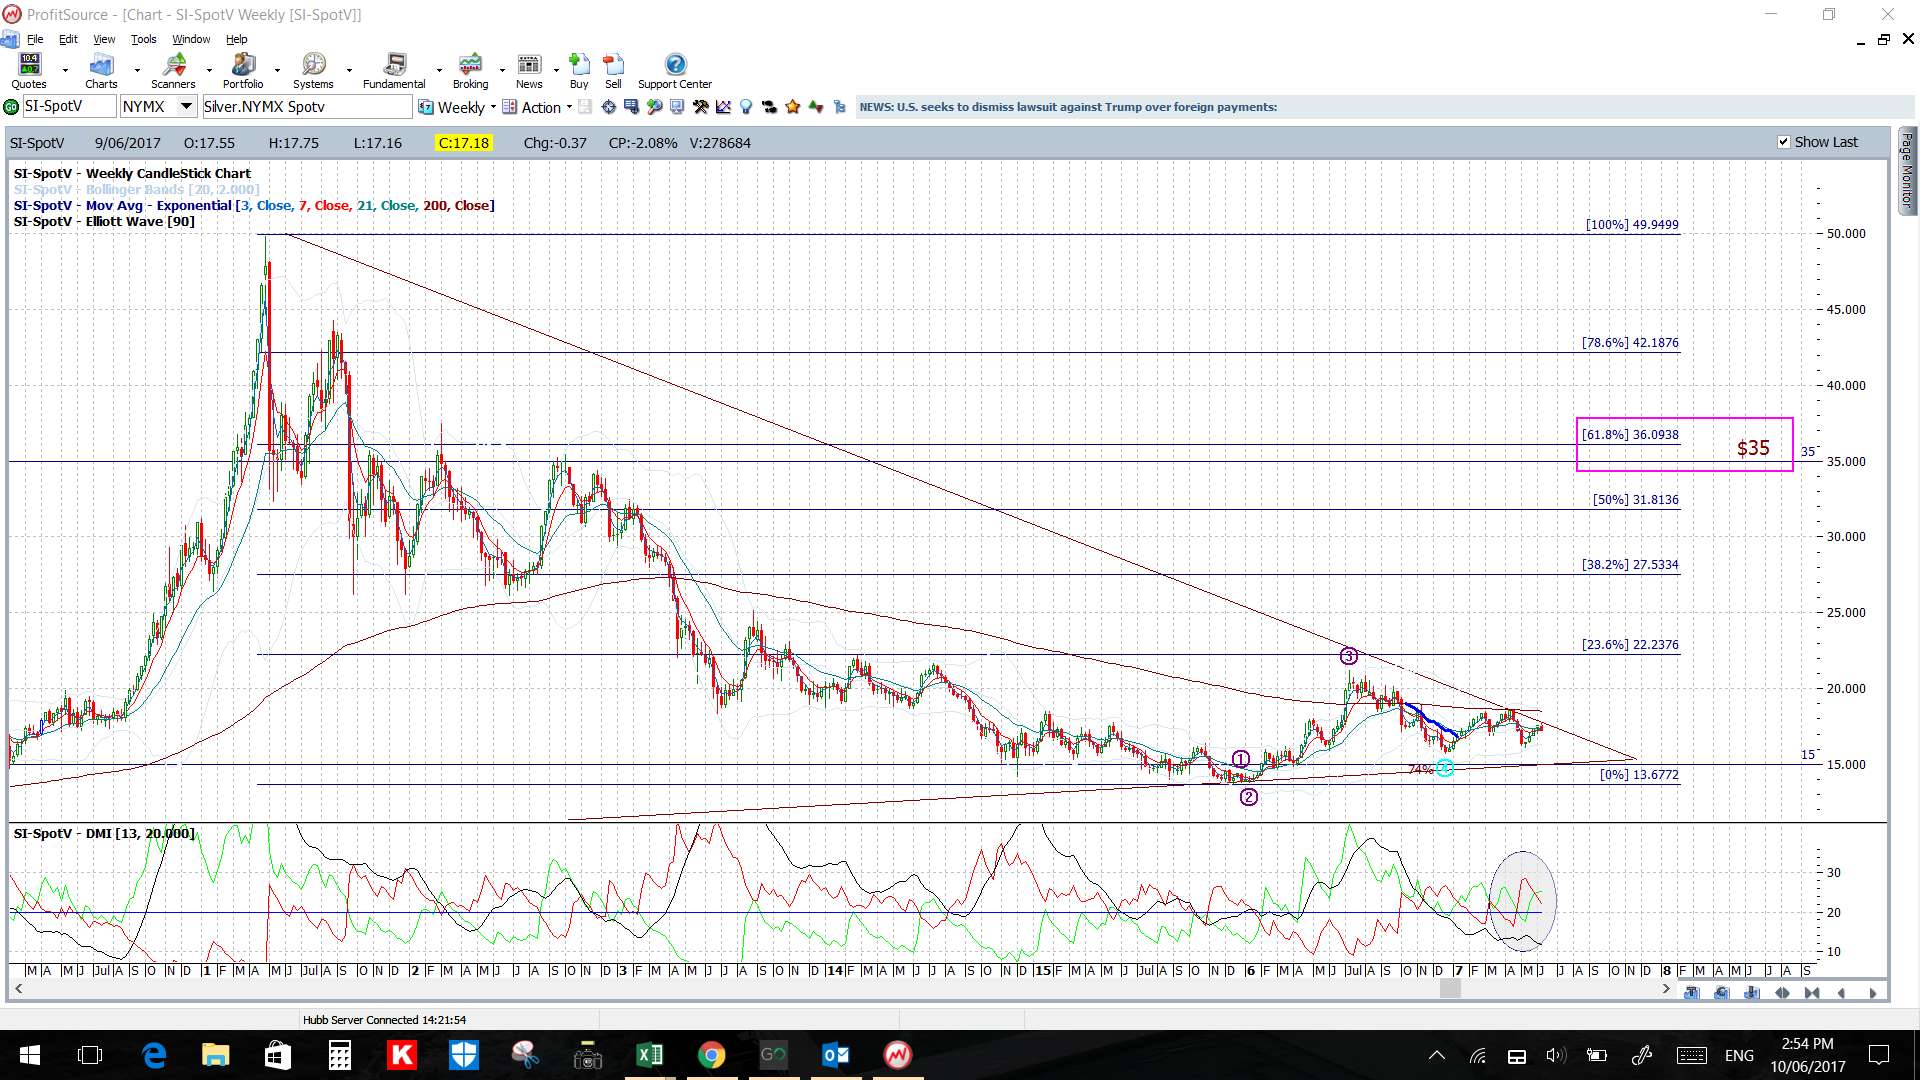
Silver: Silver has pulled back from the 6-year bear trend line and below a recent support trend line.
Watch the recent support trend line for any make or break:
- Upper targets: the 6 year bear trend line.
- Lower targets: the 4hr chart’s 61.8% fib followed by the daily chart’s bottom triangle trend line.
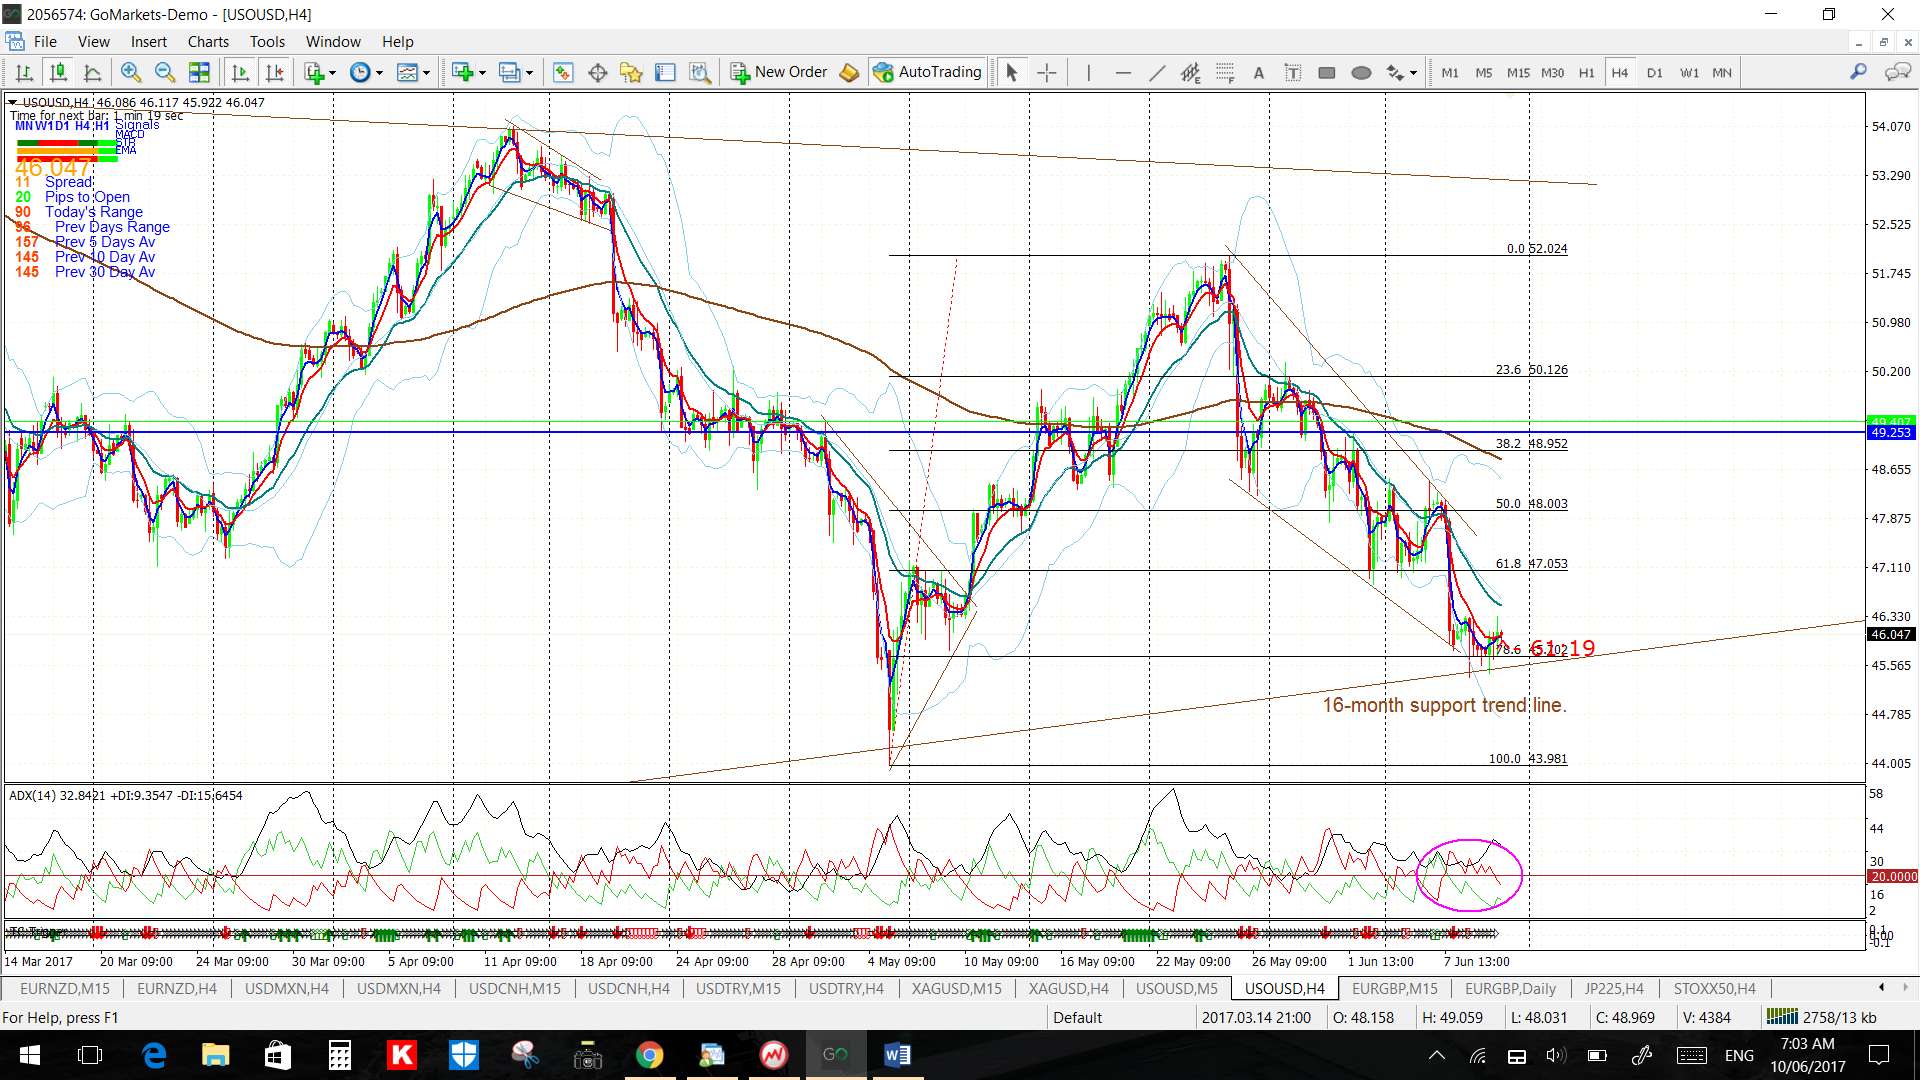
Oil: Oil is back down at the 16 month support trend line so watch this for any make or break:
- Upper targets: the daily/weekly/monthly chart’s upper trend line.
- Lower targets: the 4hr chart’s 100 Fib near $44.
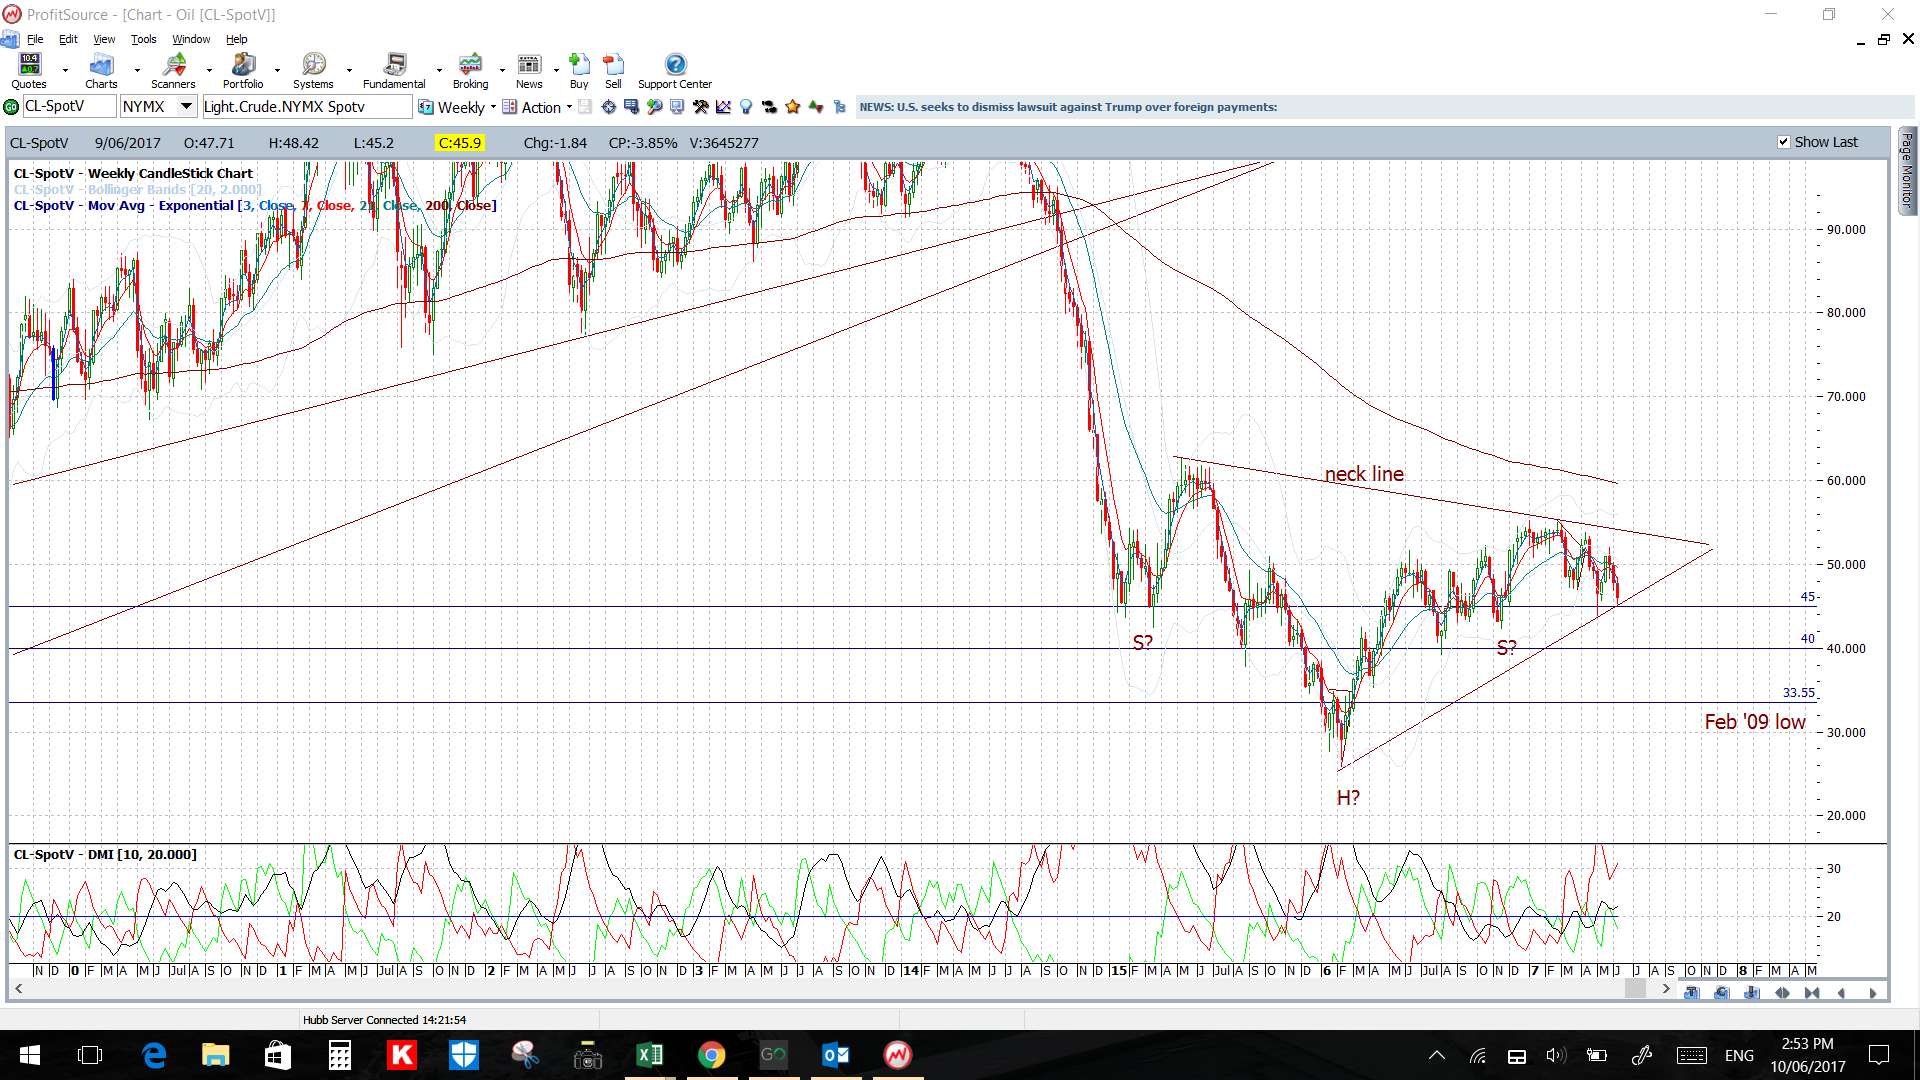
Note: There is 2-year bear trend line above current price and this also forms the monthly chart’s ‘Neck Line’ for a potential ‘Inverse H&S’ pattern. This pattern has a height of approximately $30 or 3,000 pips and this puts the target for any breakout move up near the $85 level which ties in with the 50% Fibonacci of the 2008-2016 swing low move.