I’m back from holidays and slowly getting back into charting. There seem to be plenty of FX trend lines to monitor for potential breakouts this week, a fact which is rather pleasing.

ASX-200: another matter which is rather pleasing is the bullish momentum that seems to be building on the Aussie stock market; and none too soon at that! You can check the charts in this post. We have a huge horse race down here this week, with the Melbourne Cup, but I think the ASX-200 6,000 level might be as closely watched an event in coming sessions for any new make or break of this major psychological level.
FX Indices: both indices remain trapped in Flag patterns for the time being and you can check these charts in this post. Last Friday’s US jobs data was mixed and the weaker than expected ‘average earnings’ component could work against the US$ in coming sessions so keep an eye on how the DXY fares this week.
Calendar: there are two Central Bank rate updates this week: RBA (AUD) and RBNZ (NZD). Friday is a holiday in the US for Veterans Day.

Forex charts:
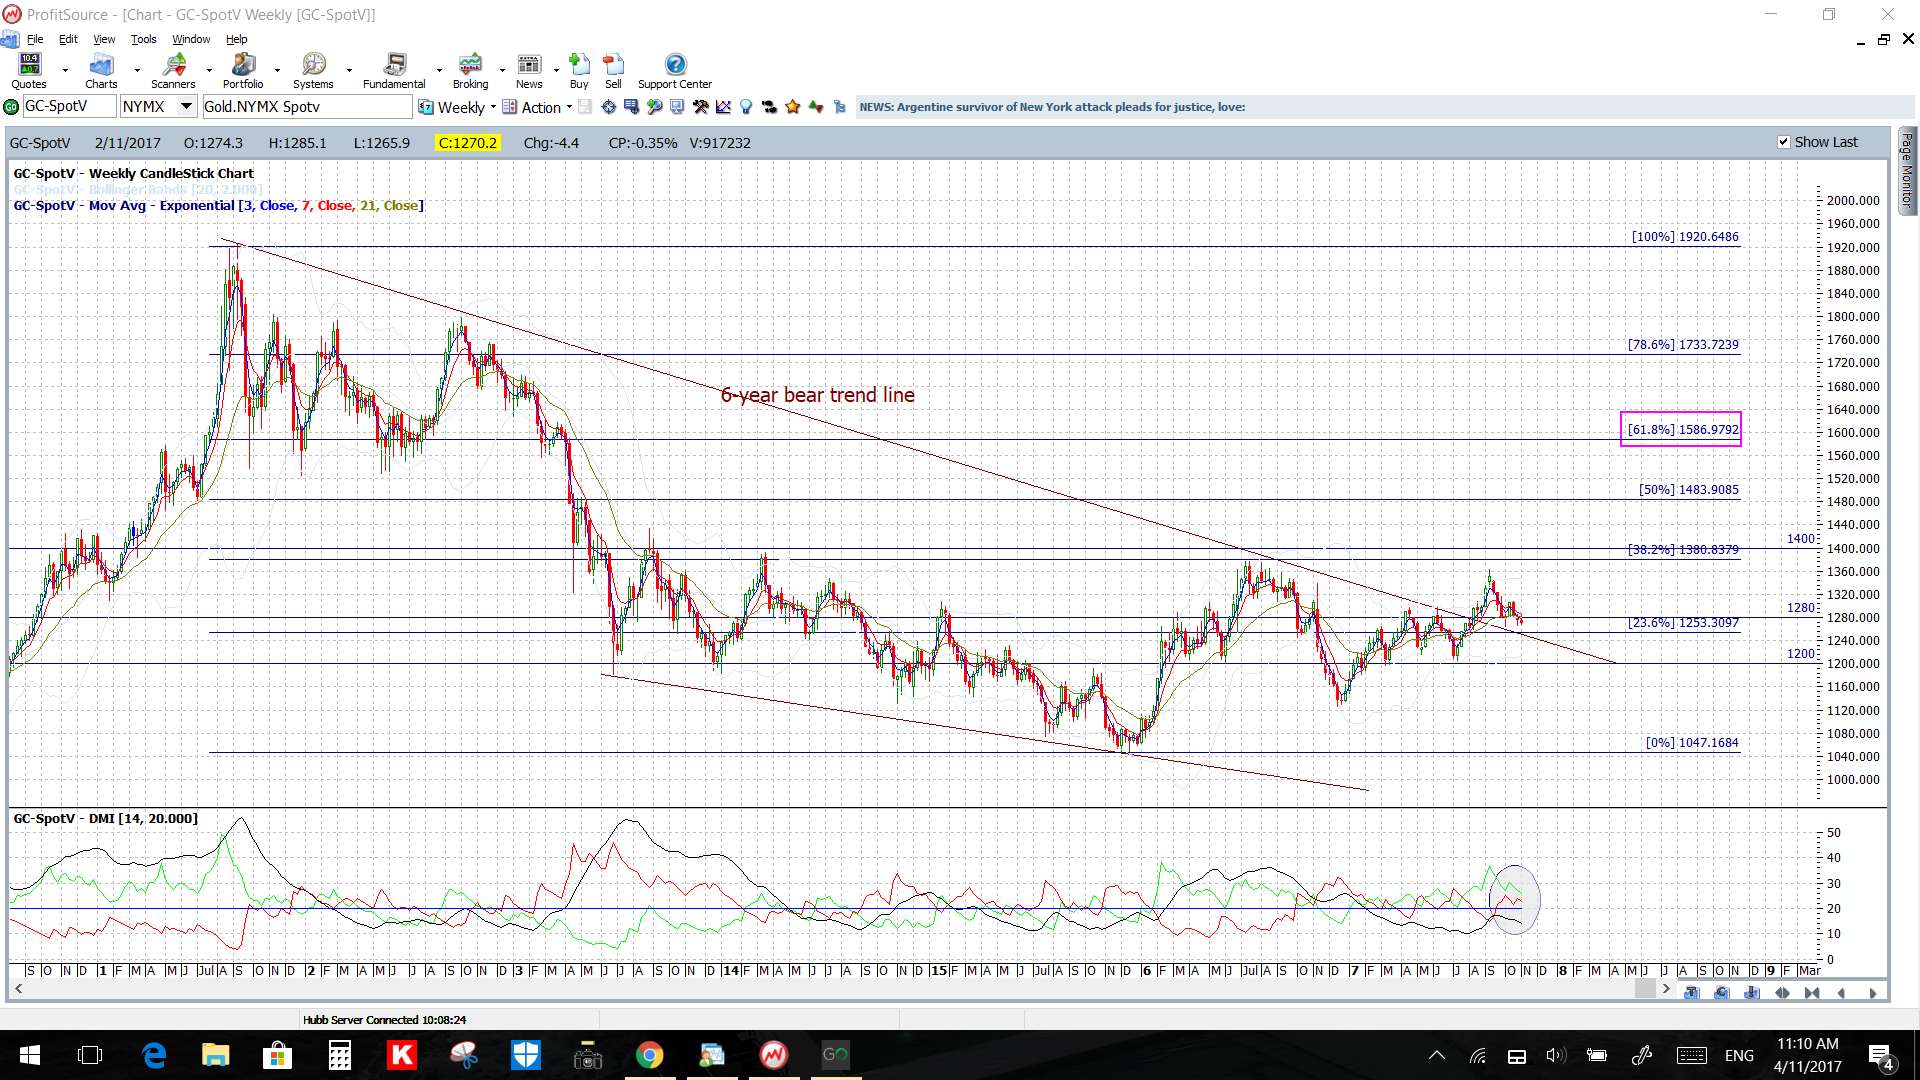
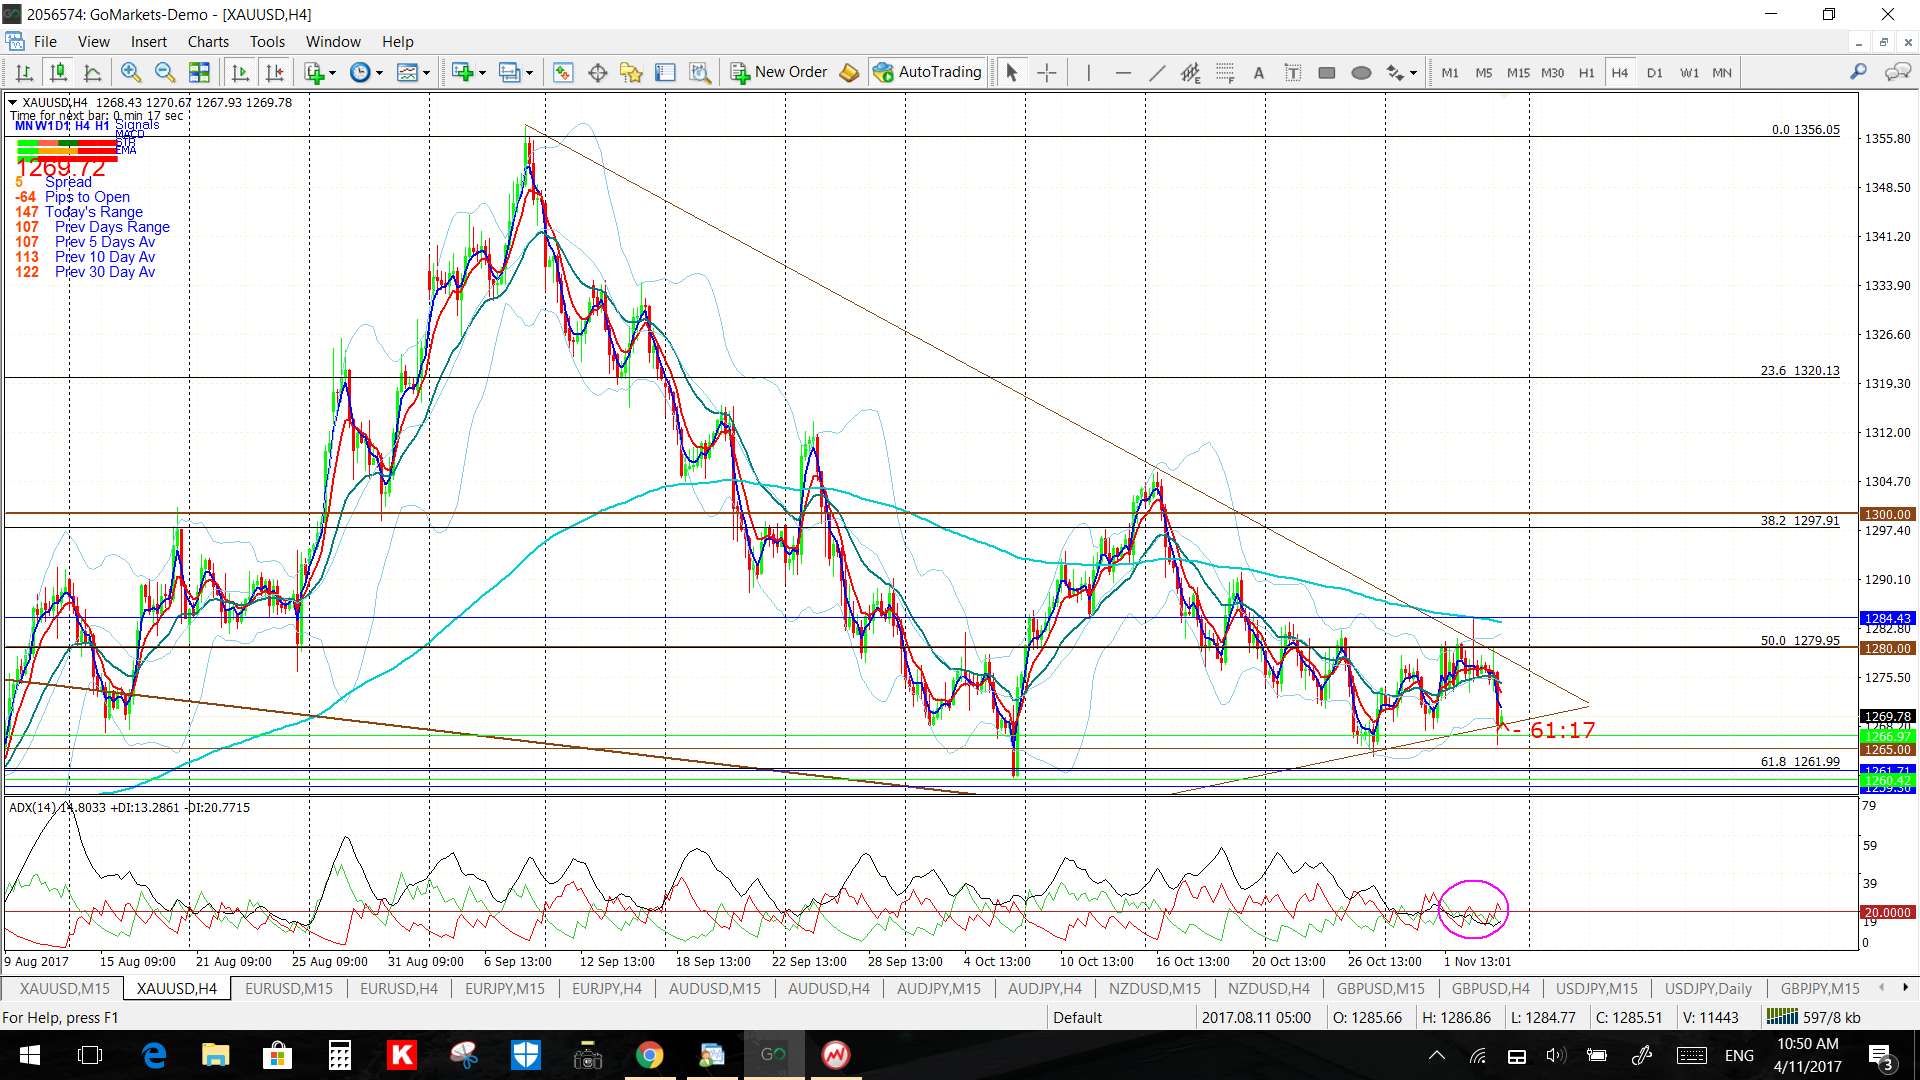
Gold: Price continues consolidating under the $1,280 major S/R level after making an earlier weekly chart triangle breakout. Watch the 4 hr chart triangle trend lines though for any new breakout:
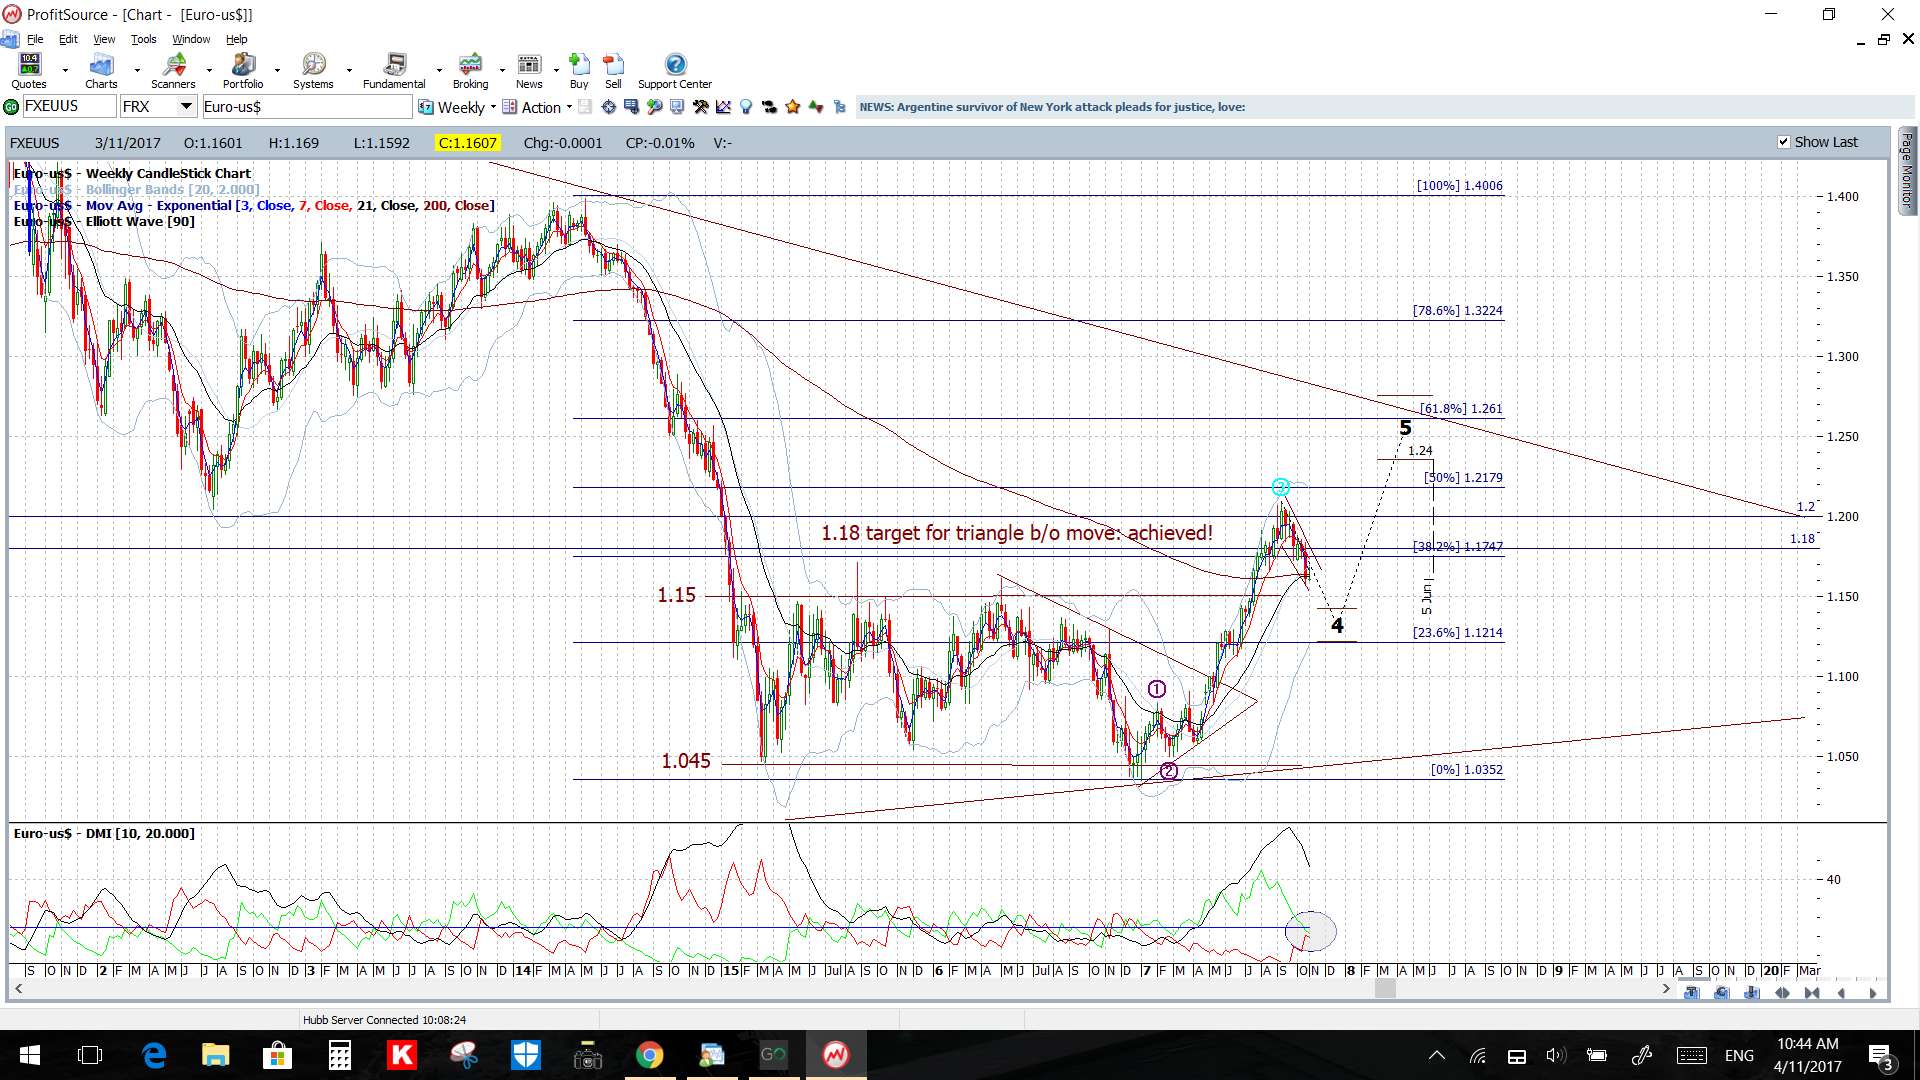
EUR/USD: Price continues consolidating in what looks like a Bull Flag and under the 1.18 major S/R level. Watch the 4 hr chart Channel, and smaller triangle, trend lines though for any new breakout. There are speeches from the ECB President and FEd Chair to monitor here this week:

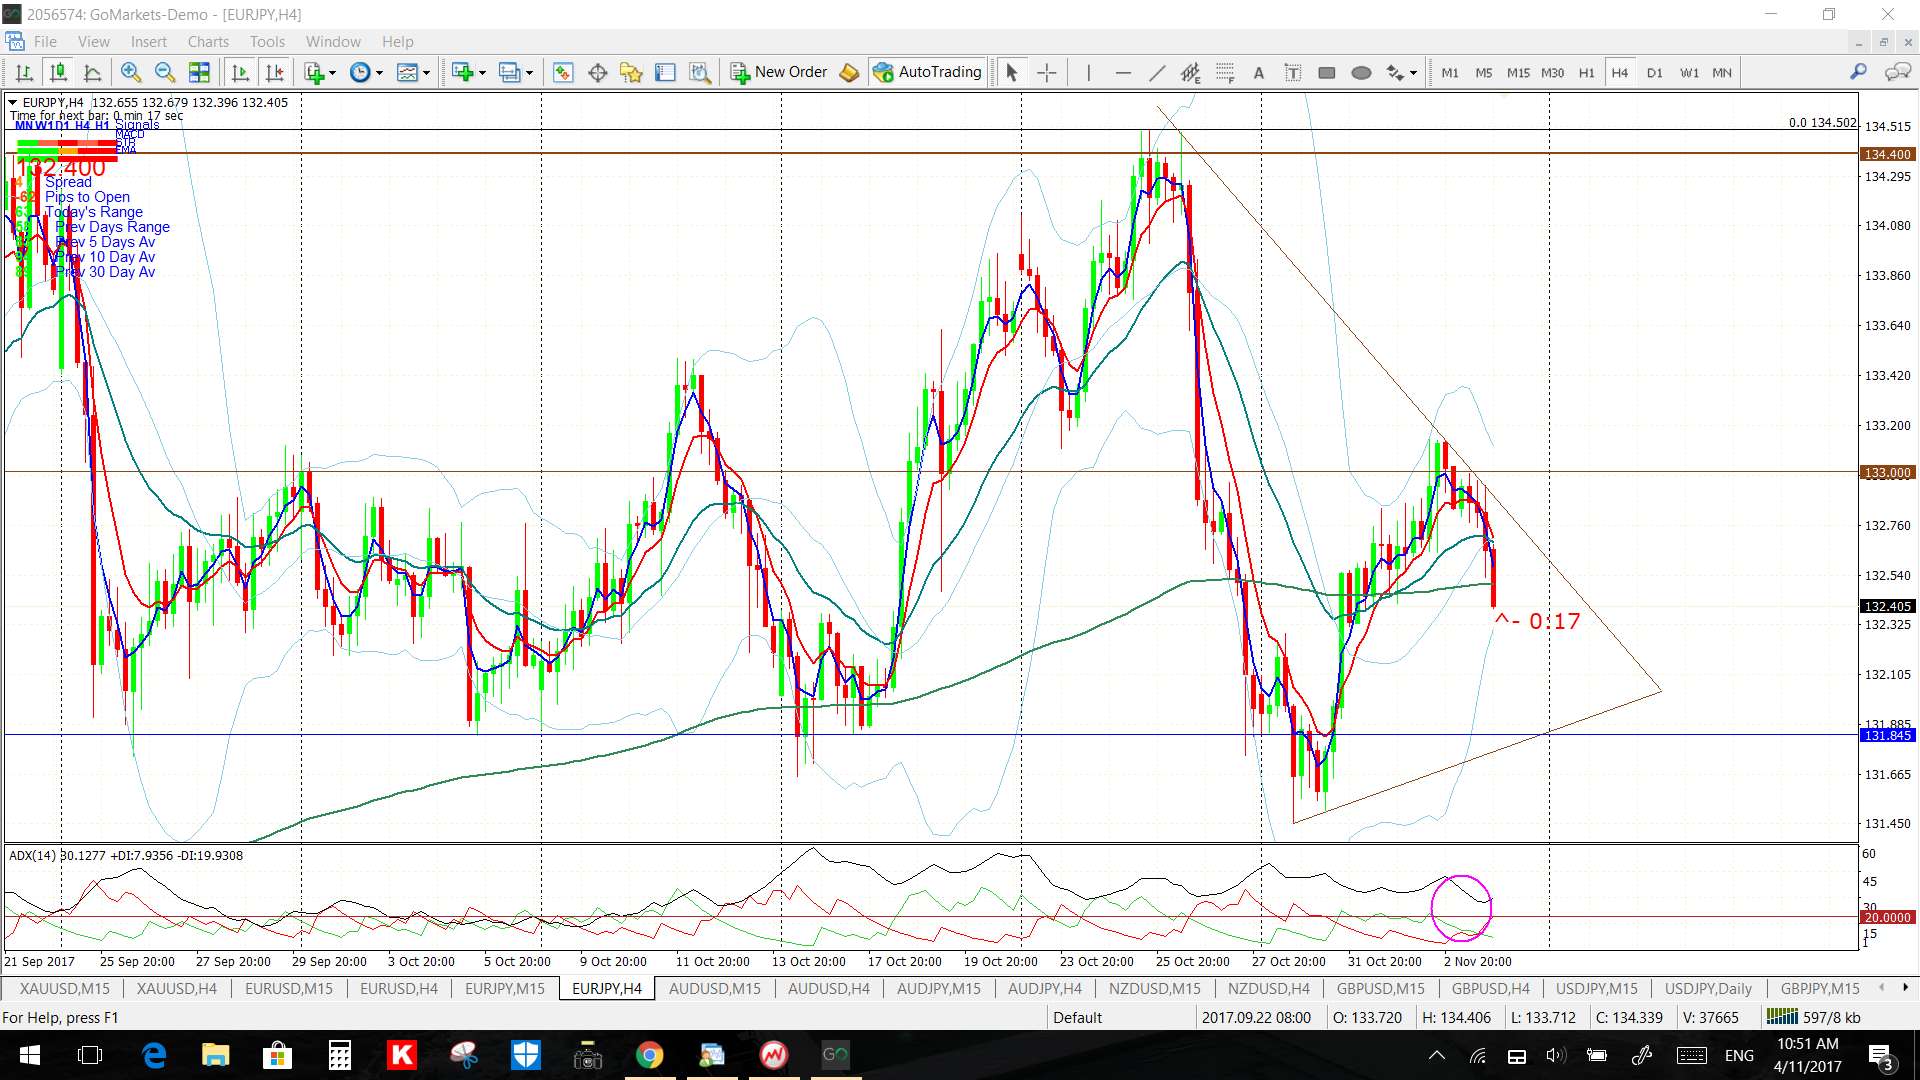
EUR/JPY: Price continues consolidating under the 135 major S/R and weekly 61.8% fib level after making an earlier weekly chart triangle breakout. Watch the 4 hr chart triangle trend lines though for any new breakout:

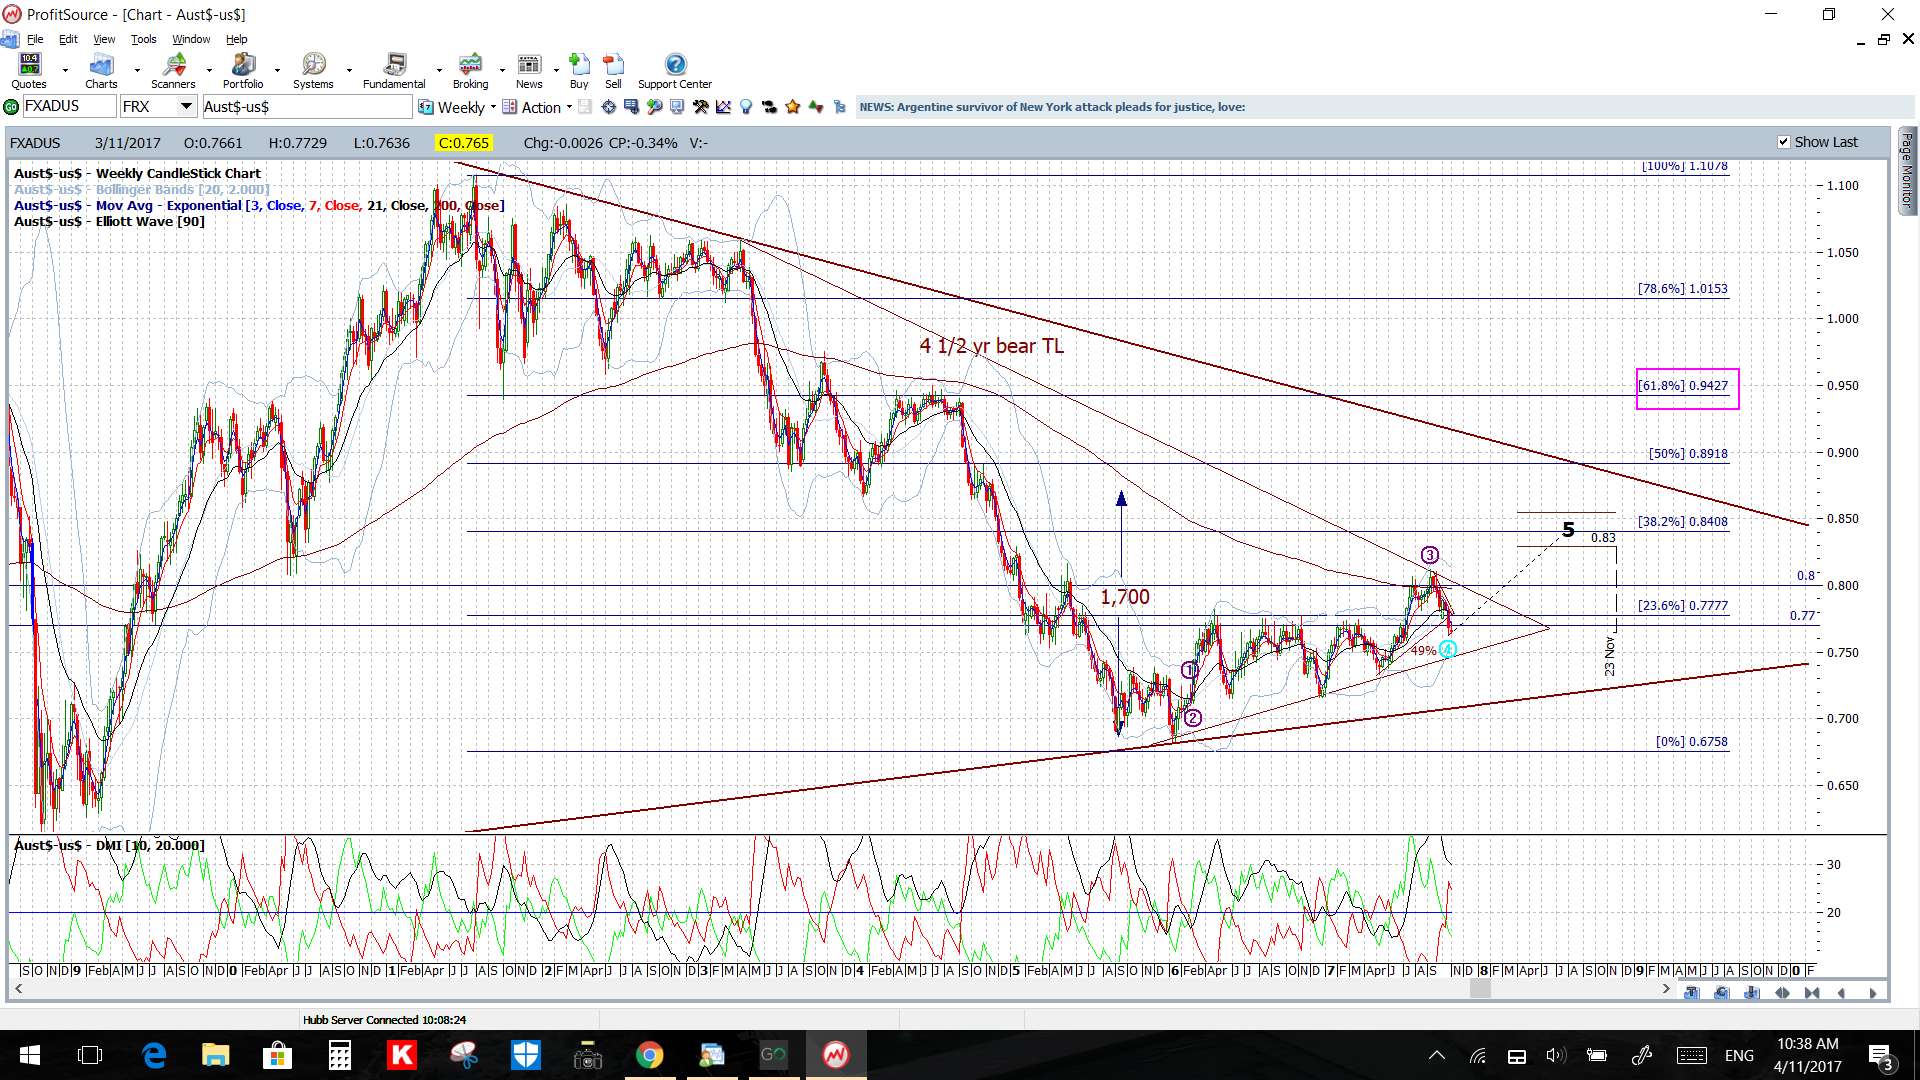
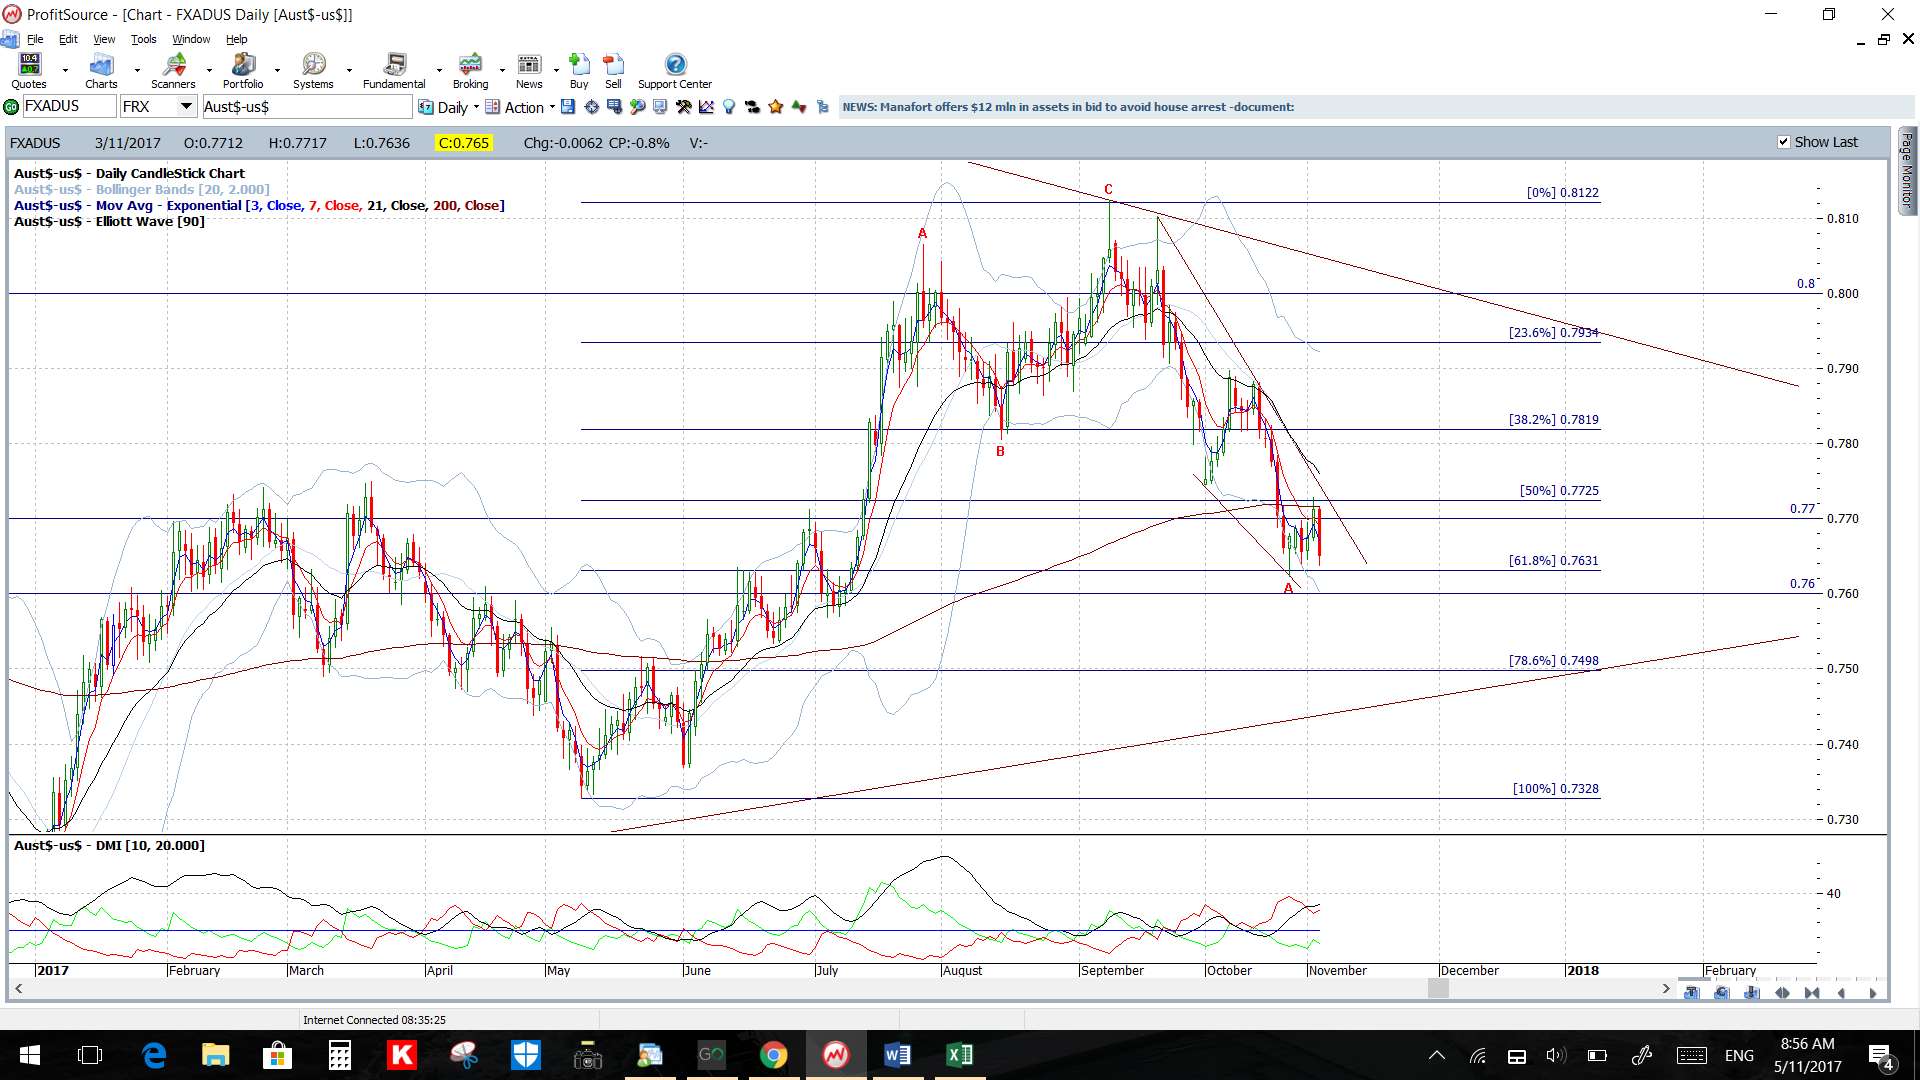
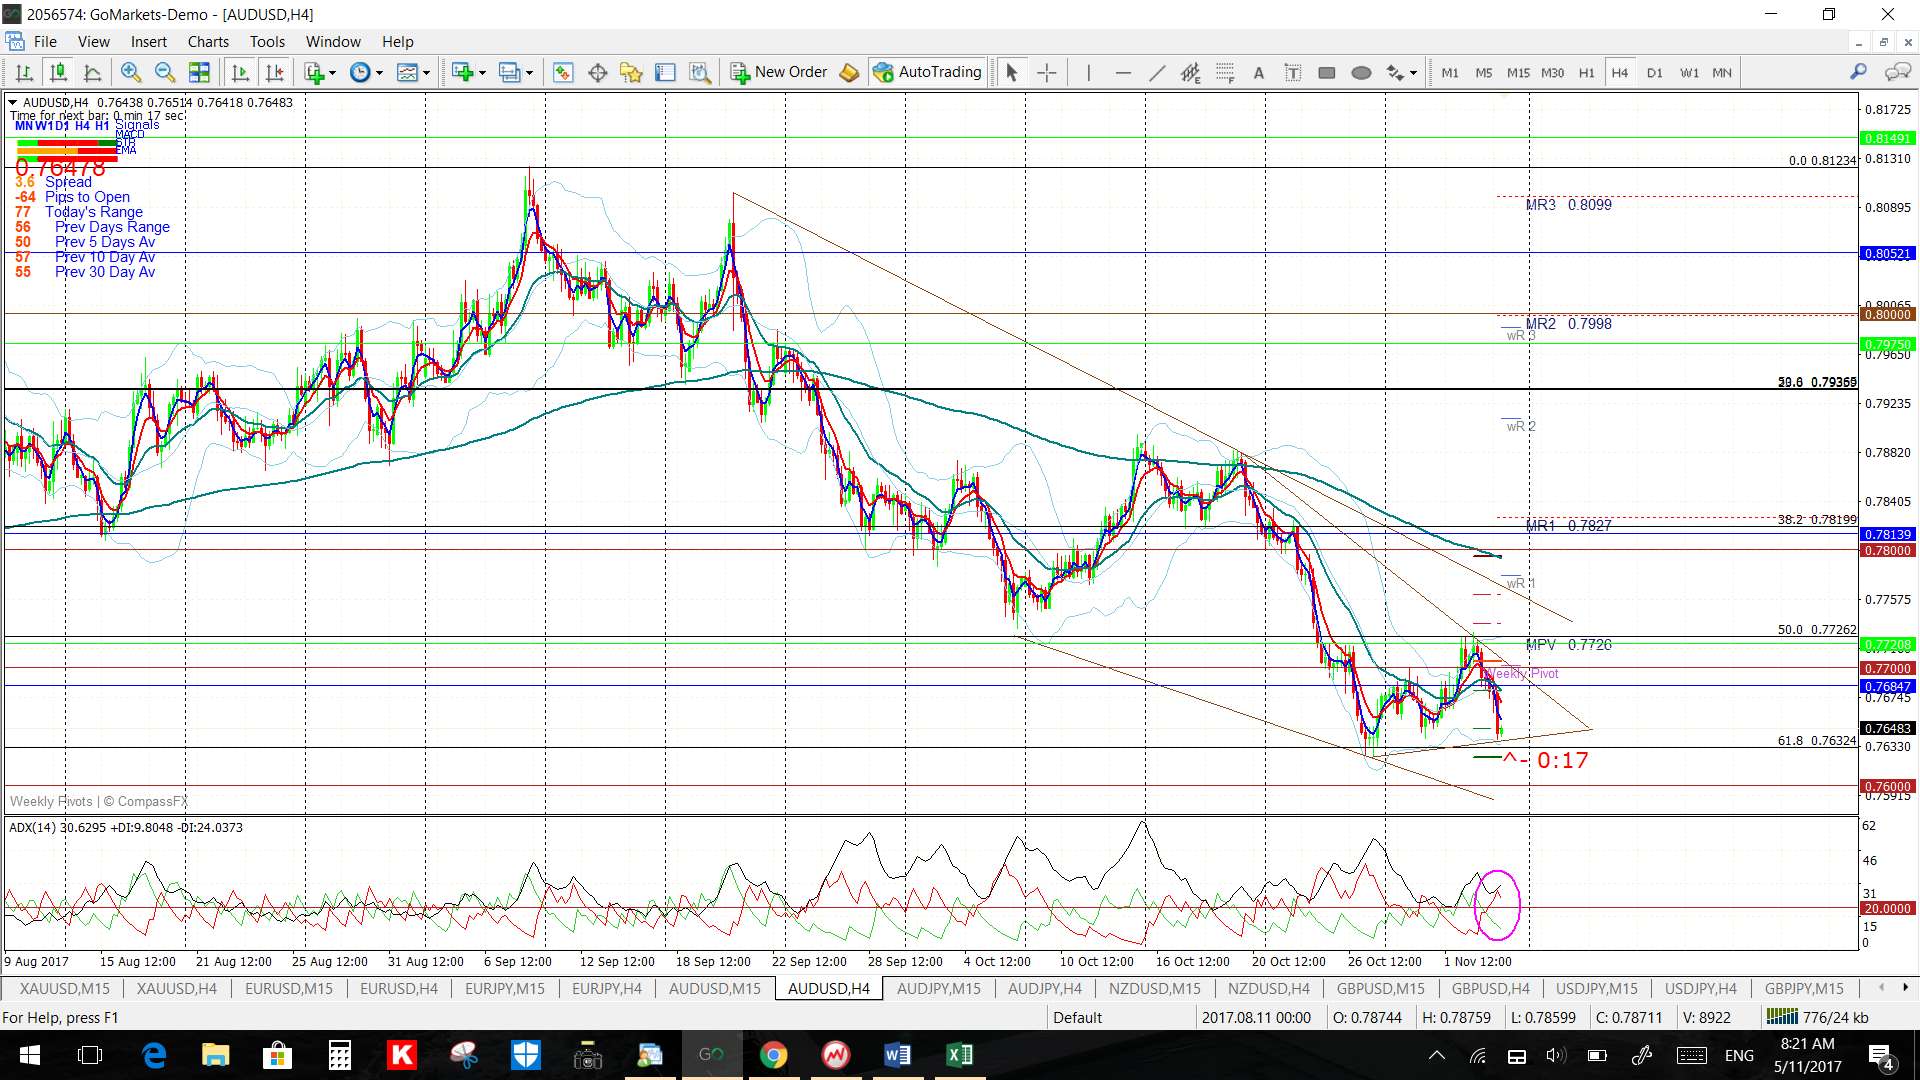
AUD/USD: Price continues to hold above the daily 61.8% fib but is currently just below 0.77 as it continues consolidating in a weekly chart triangle. Watch the 4 hr chart channel, and the smaller triangle, trend lines though for any new breakout. There is the RBA rate update to monitor here this week:
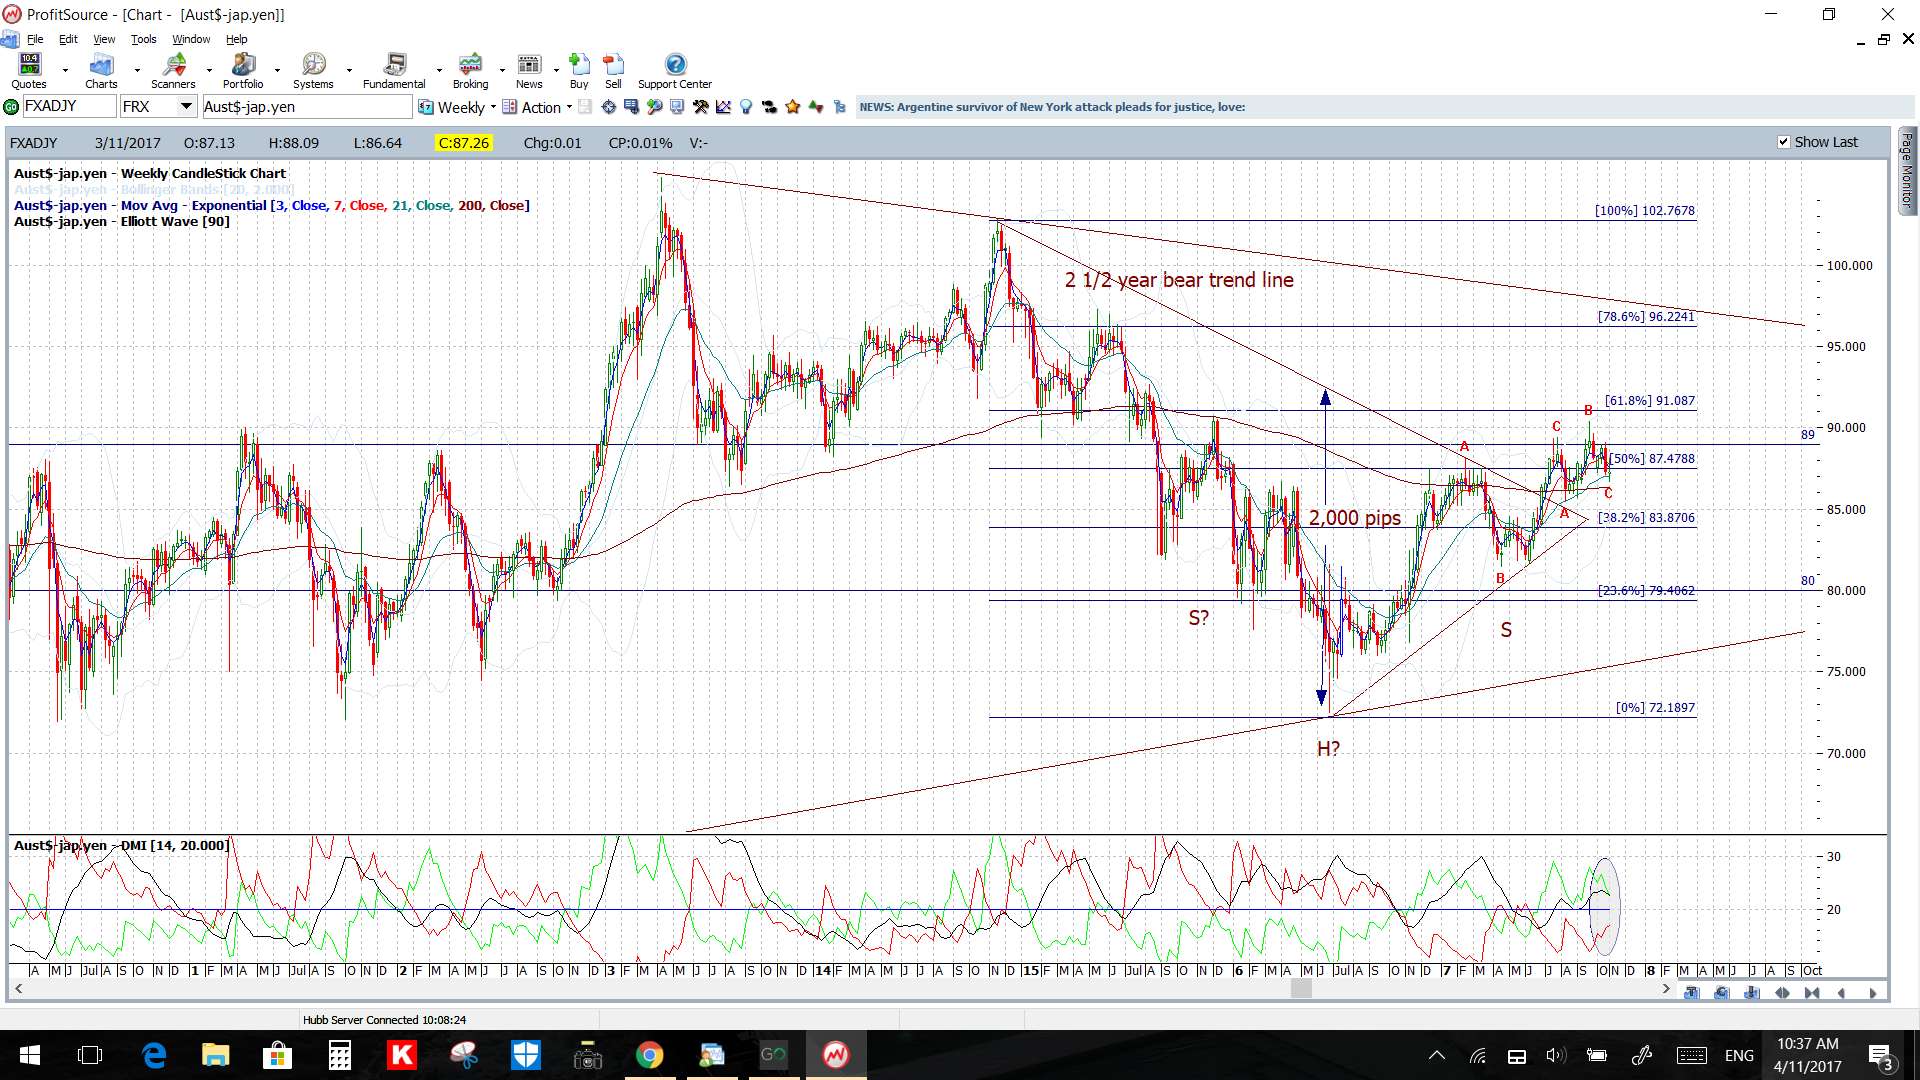
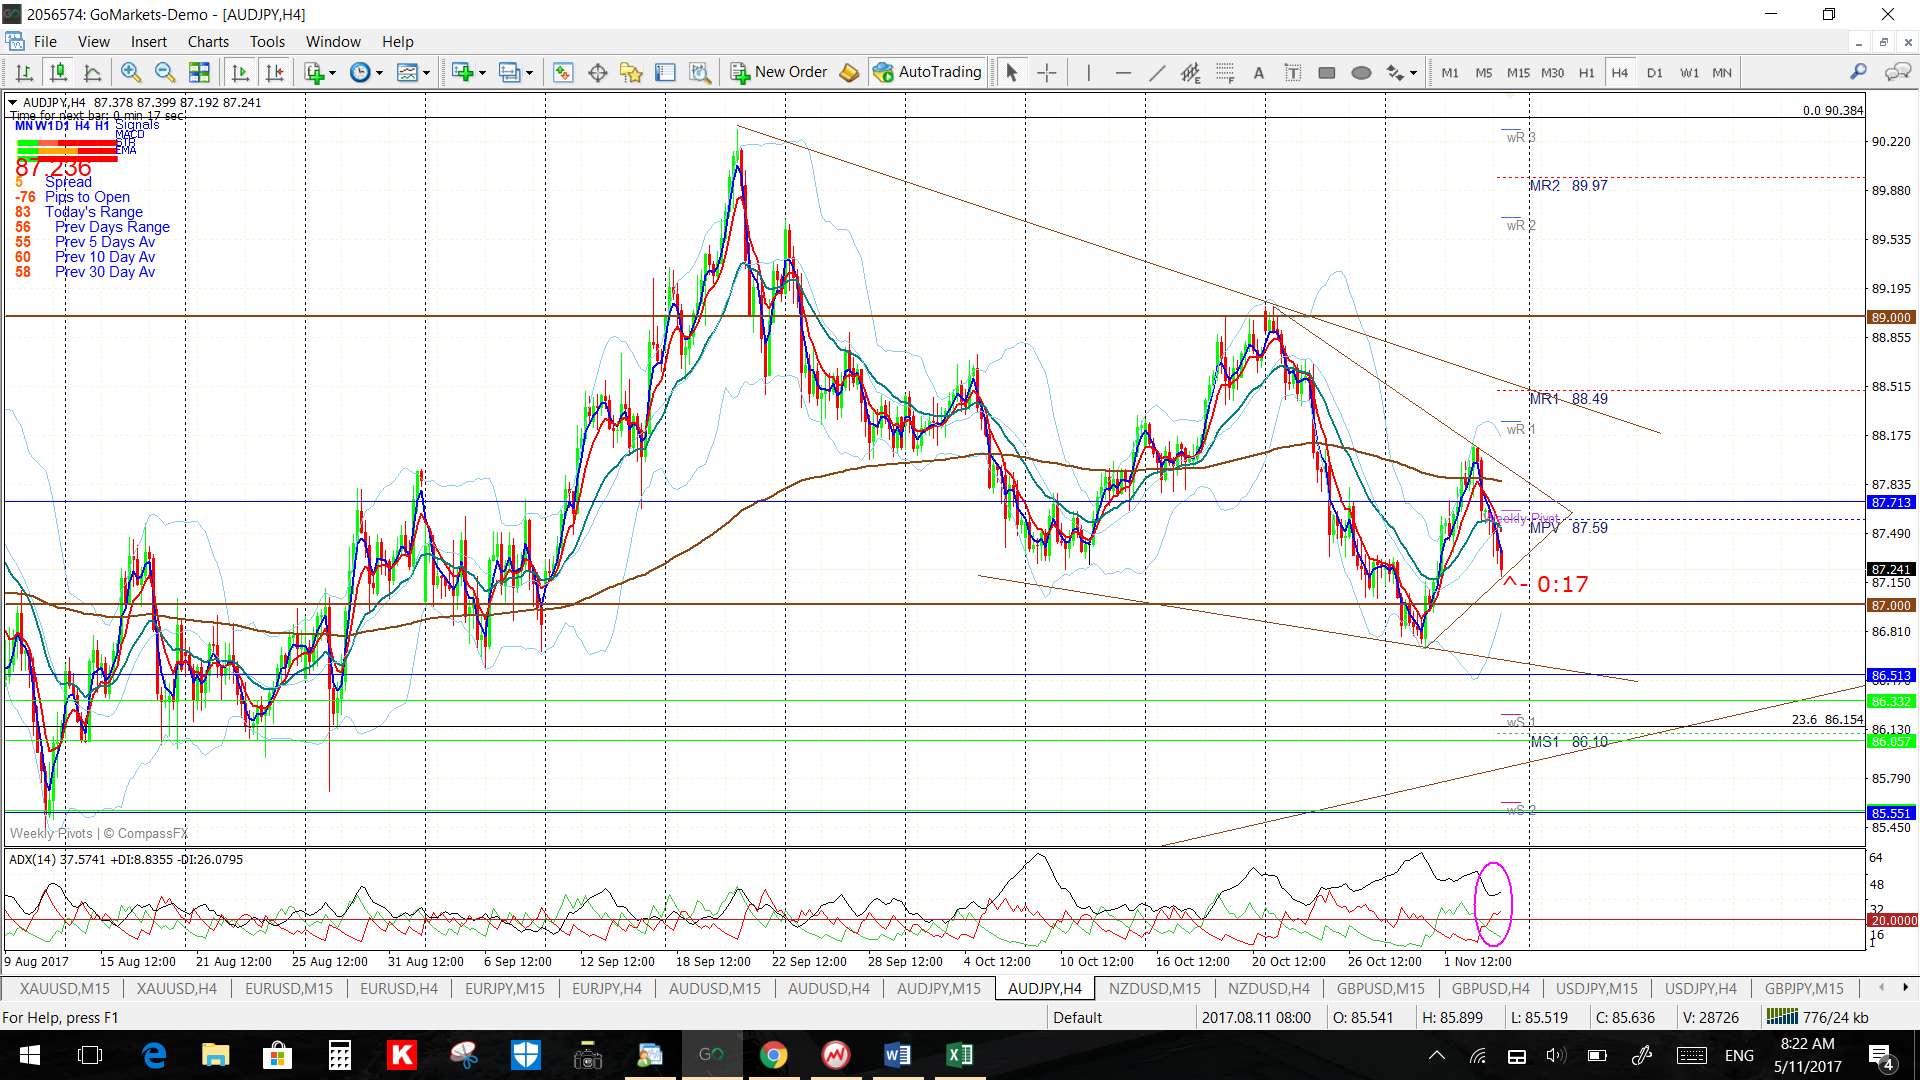
AUD/JPY: Price is currently near 87 S/R but continues consolidating under the major 89 level. Watch the 4 hr chart channel, and smaller triangle, trend lines for any new breakout:
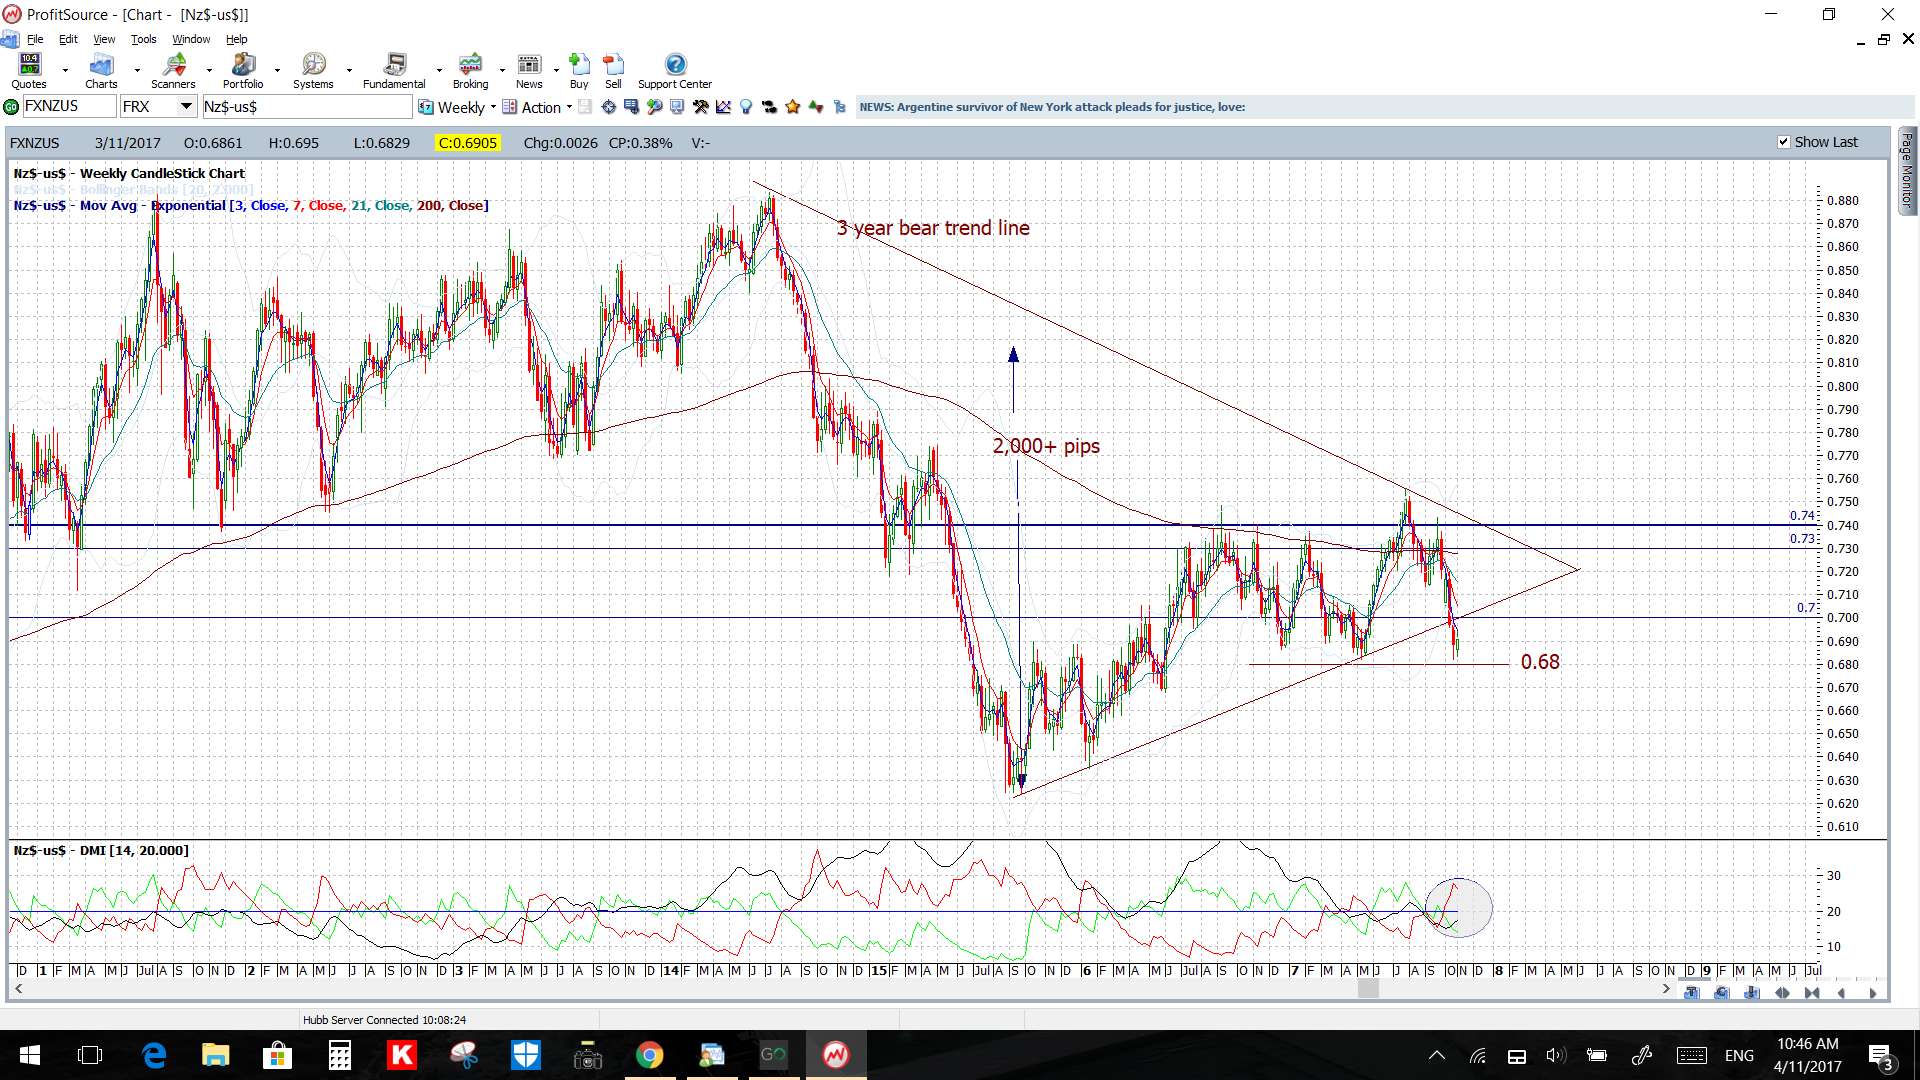
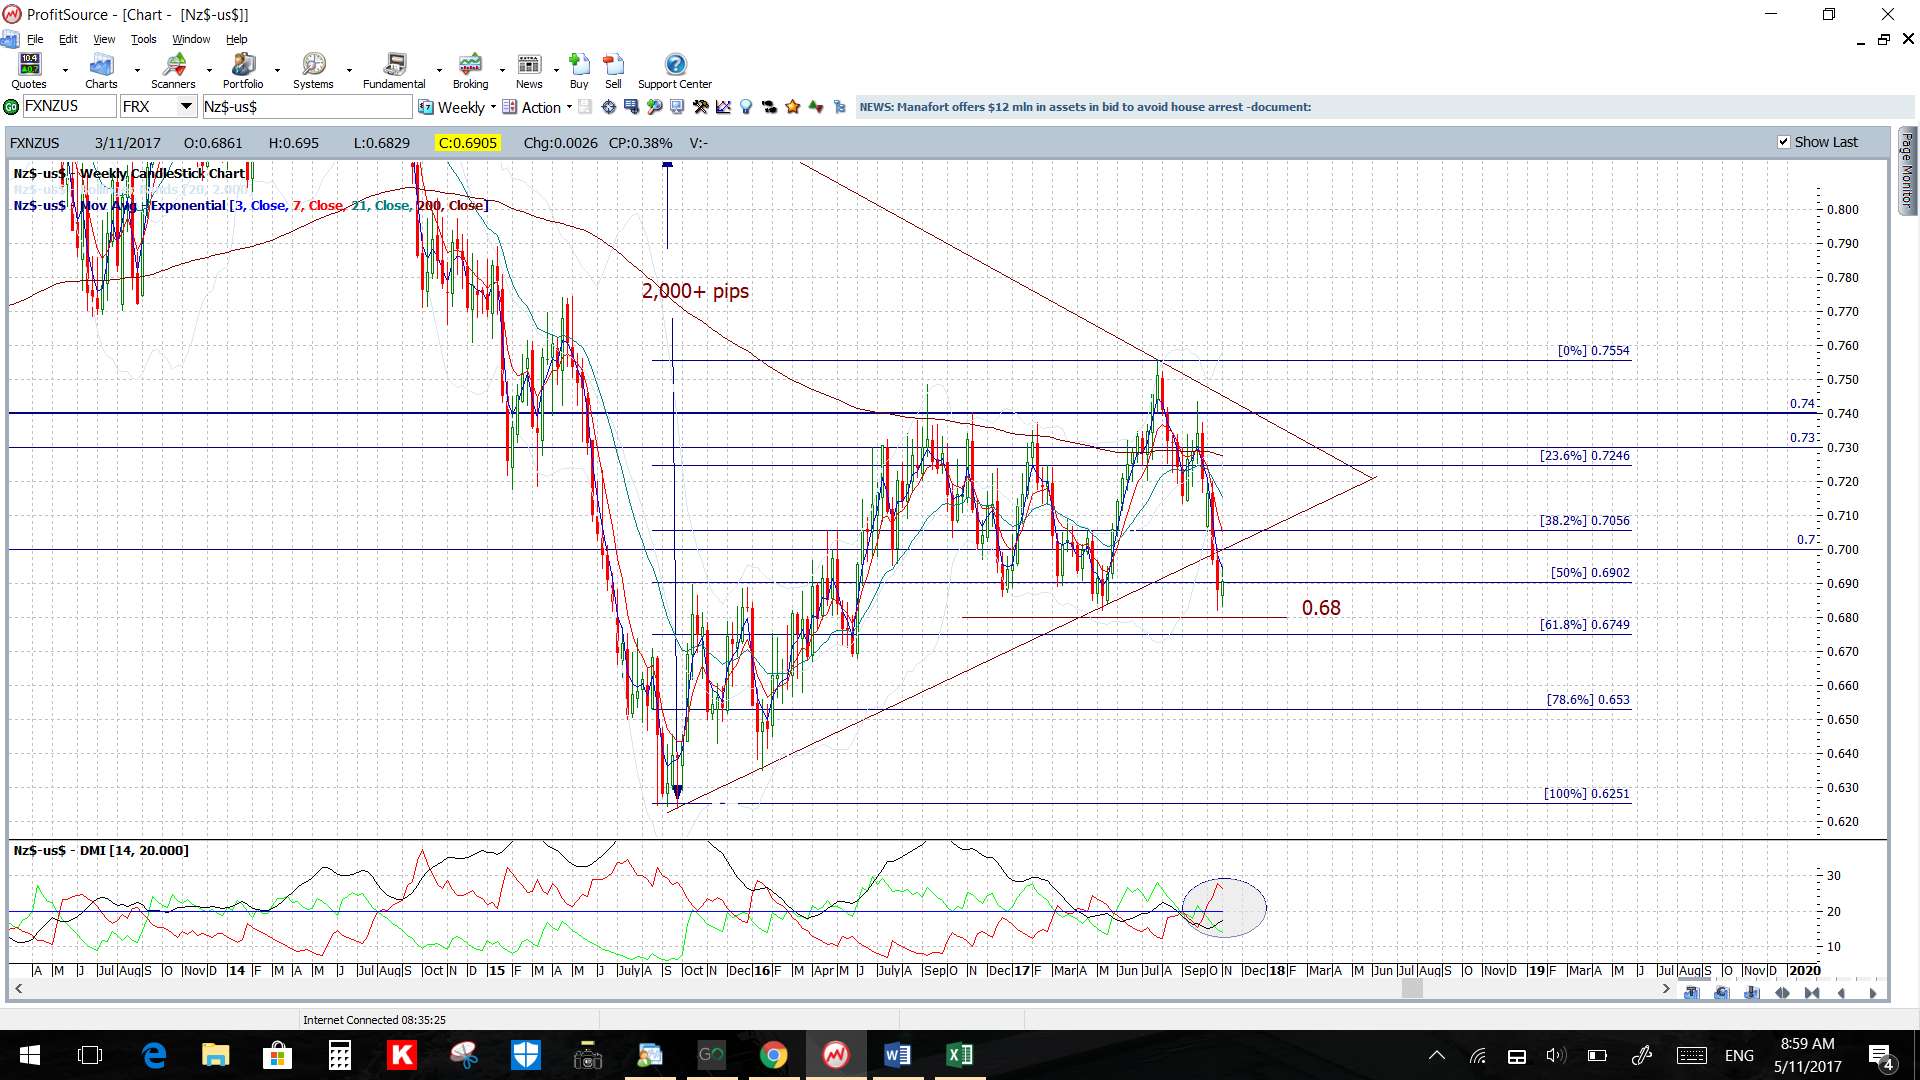
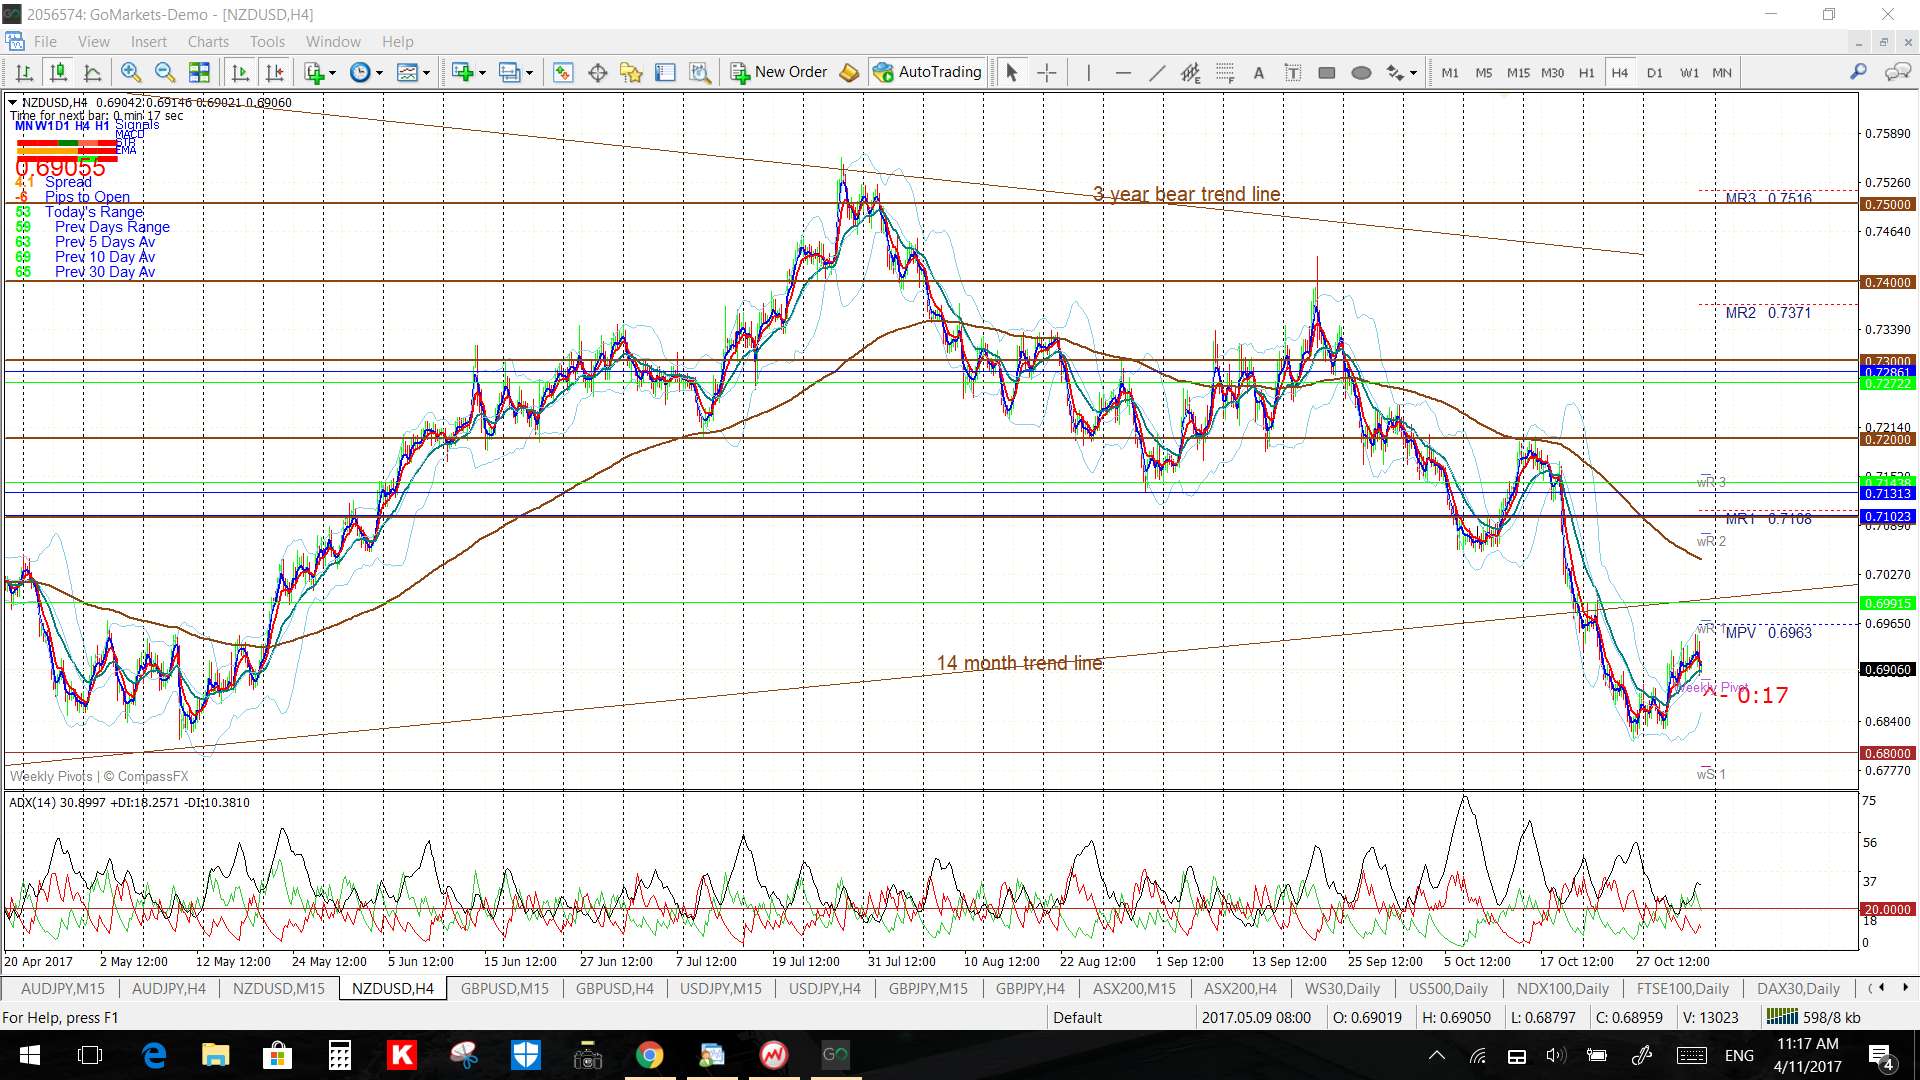
NZD/USD: the Kiwi looks bearish after breaking trend line support but watch the 0.68 for any ‘Double Bottom’ activity. Note also though that there is possible 61.8% fib support just below this 0.68 level. There is the RBNZ rate update to monitor here this week so watch 0.68 for any new make or break:
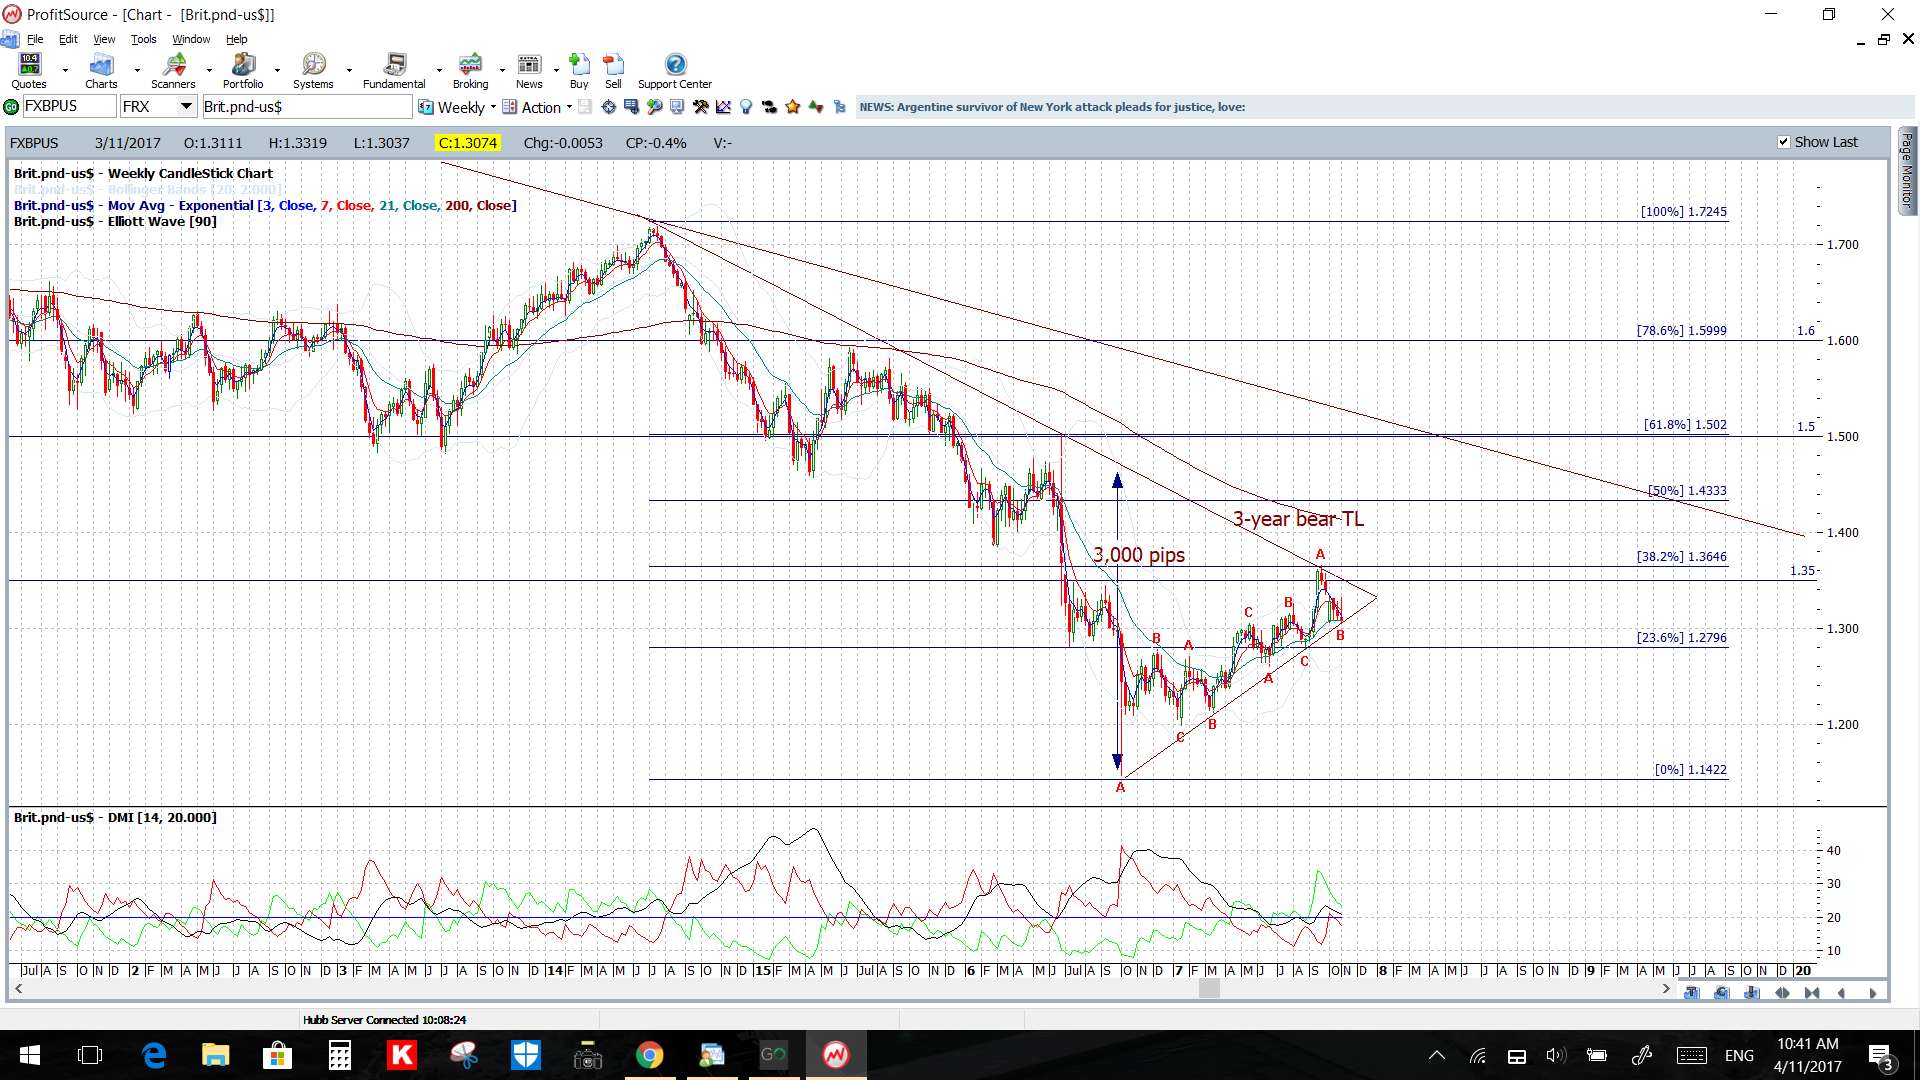
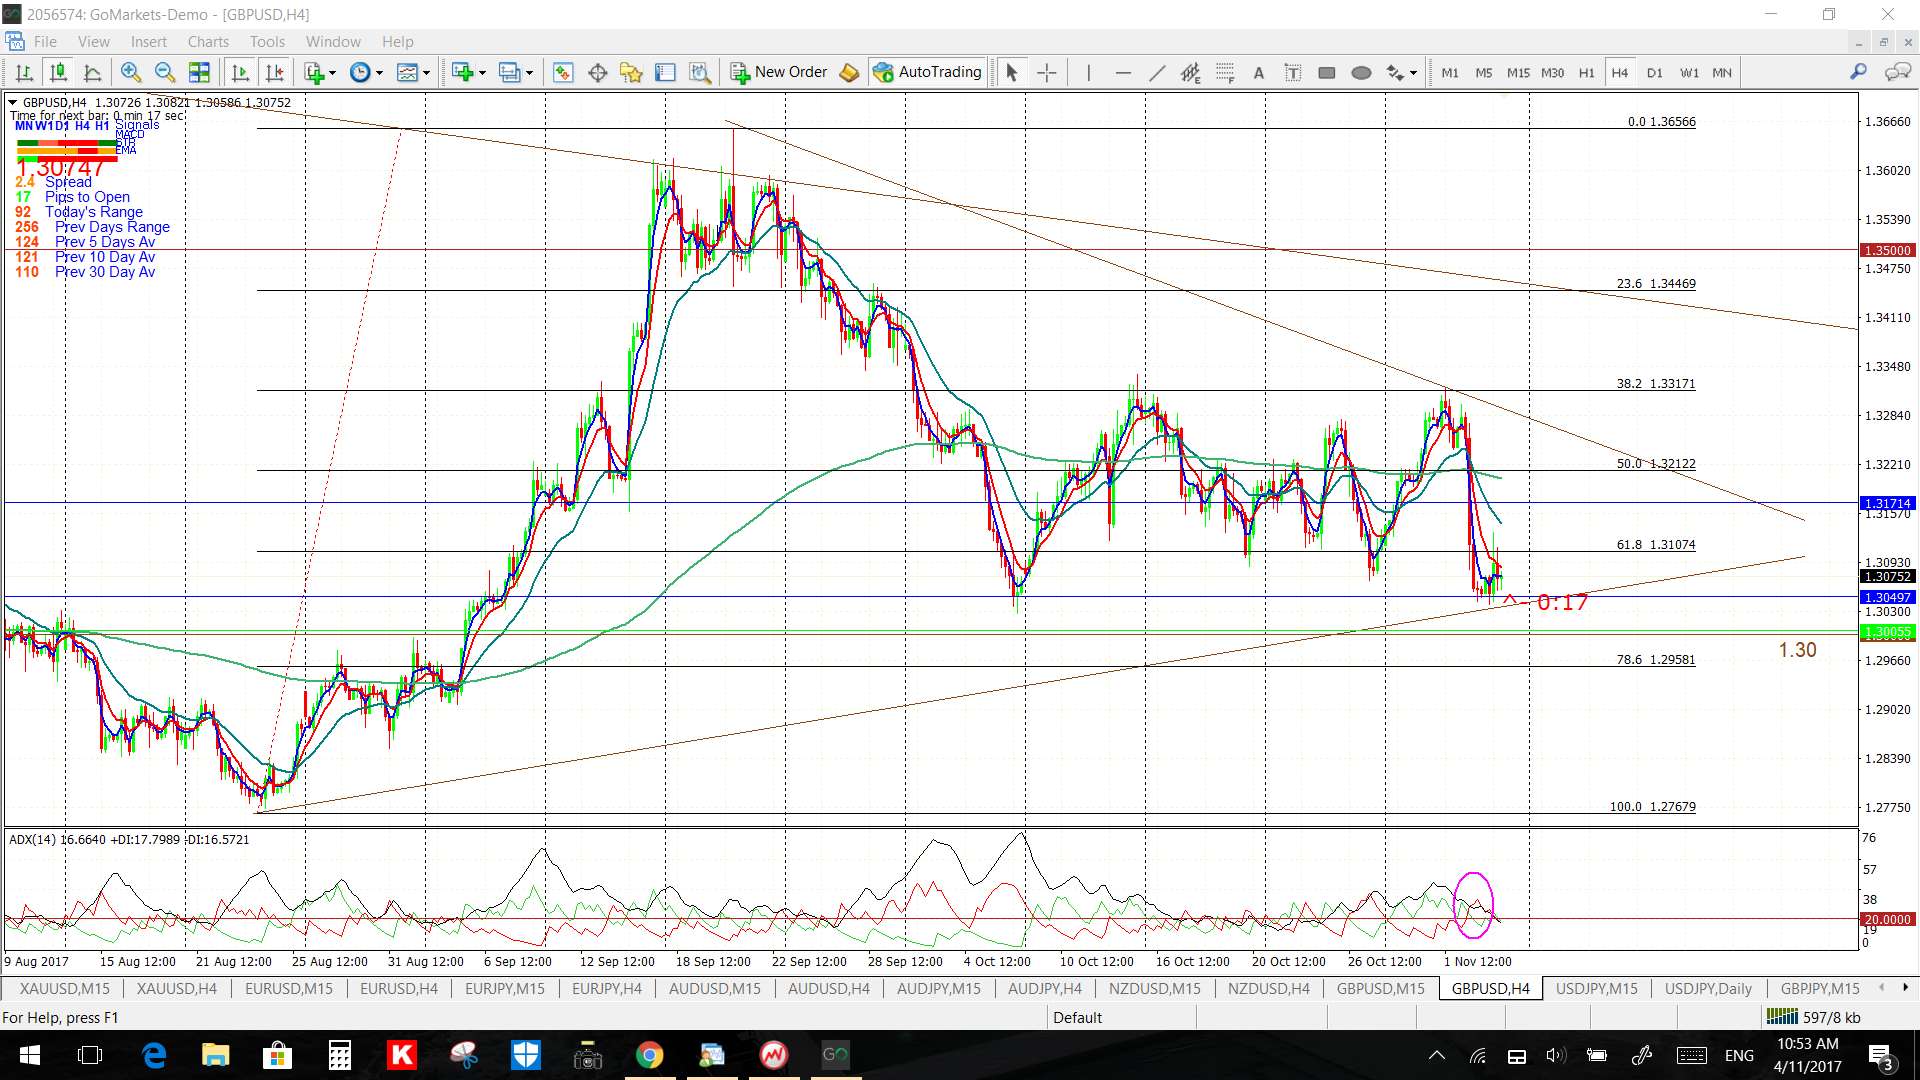
GBP/USD: Price continues consolidating in a weekly chart triangle. Watch the 4 hr chart trend lines though for any new breakout. There is GBP Manufacturing Production data to monitor here this week:
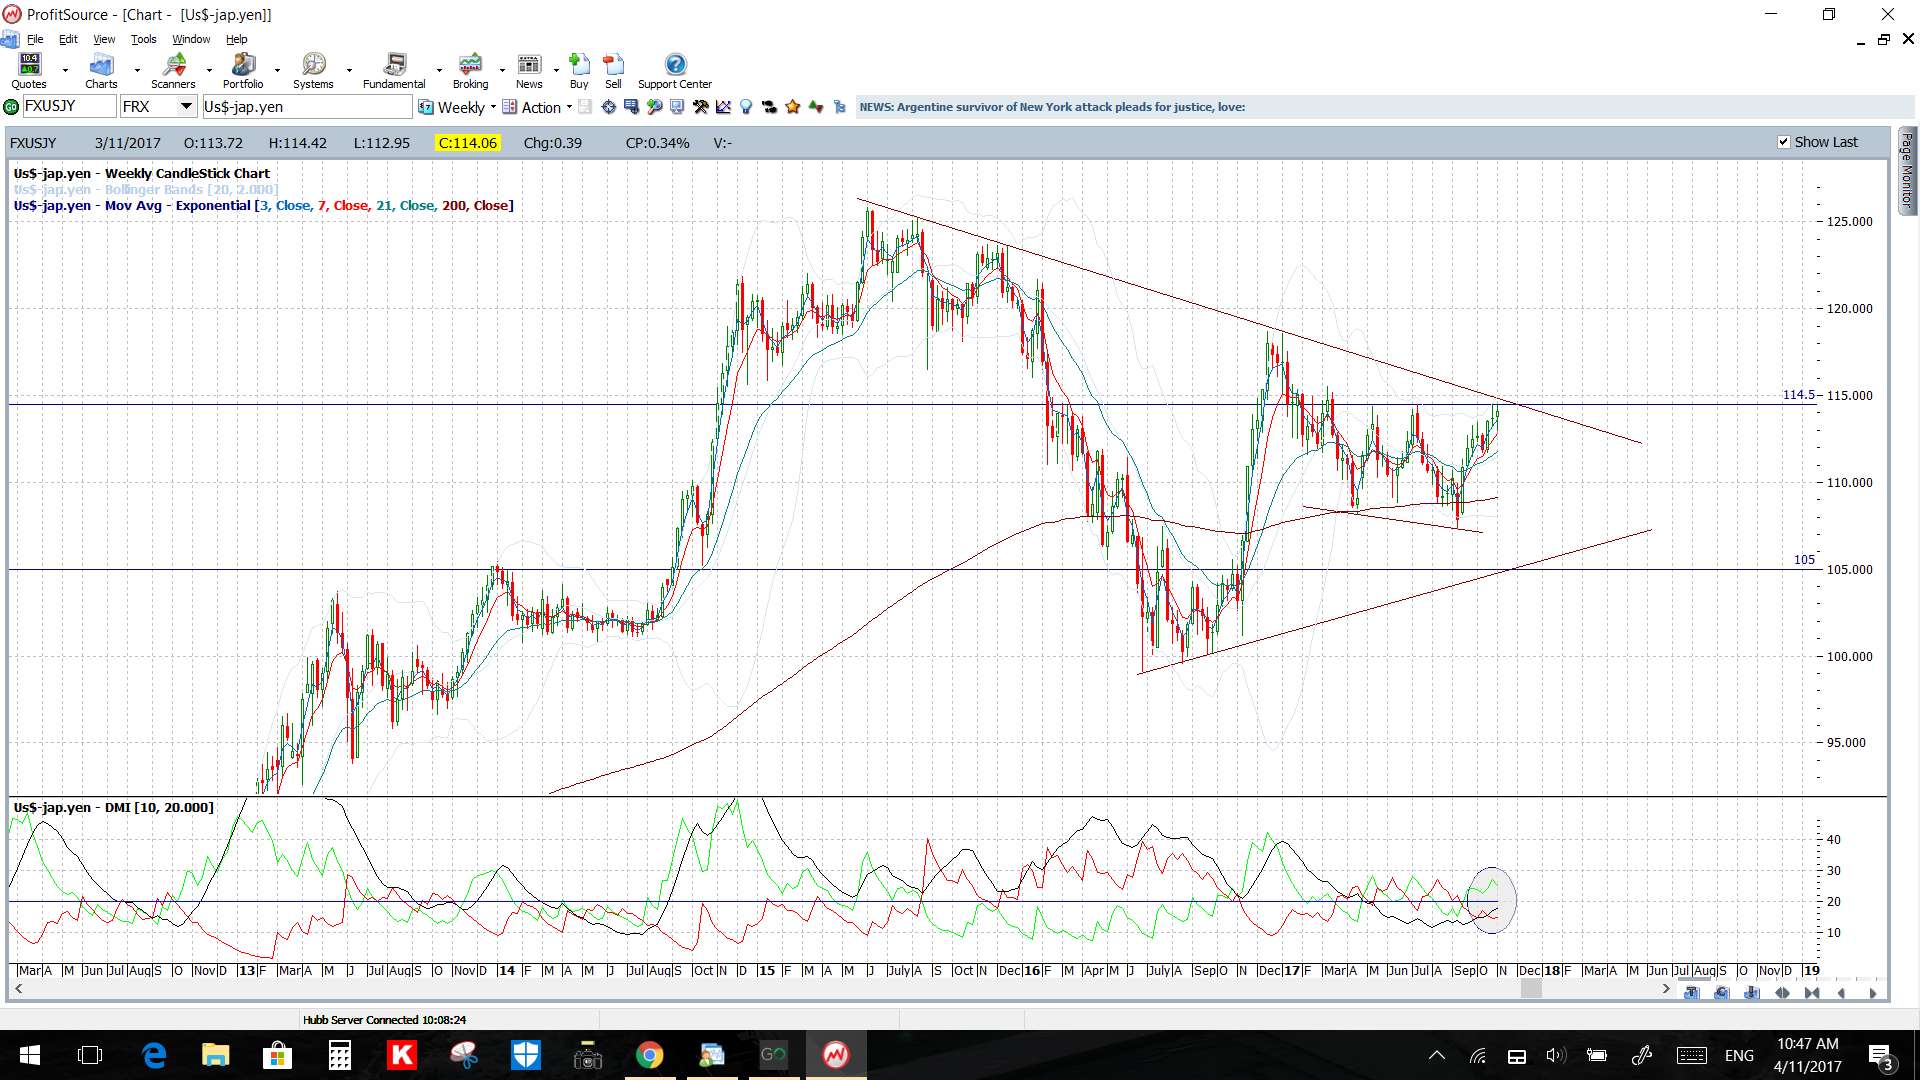
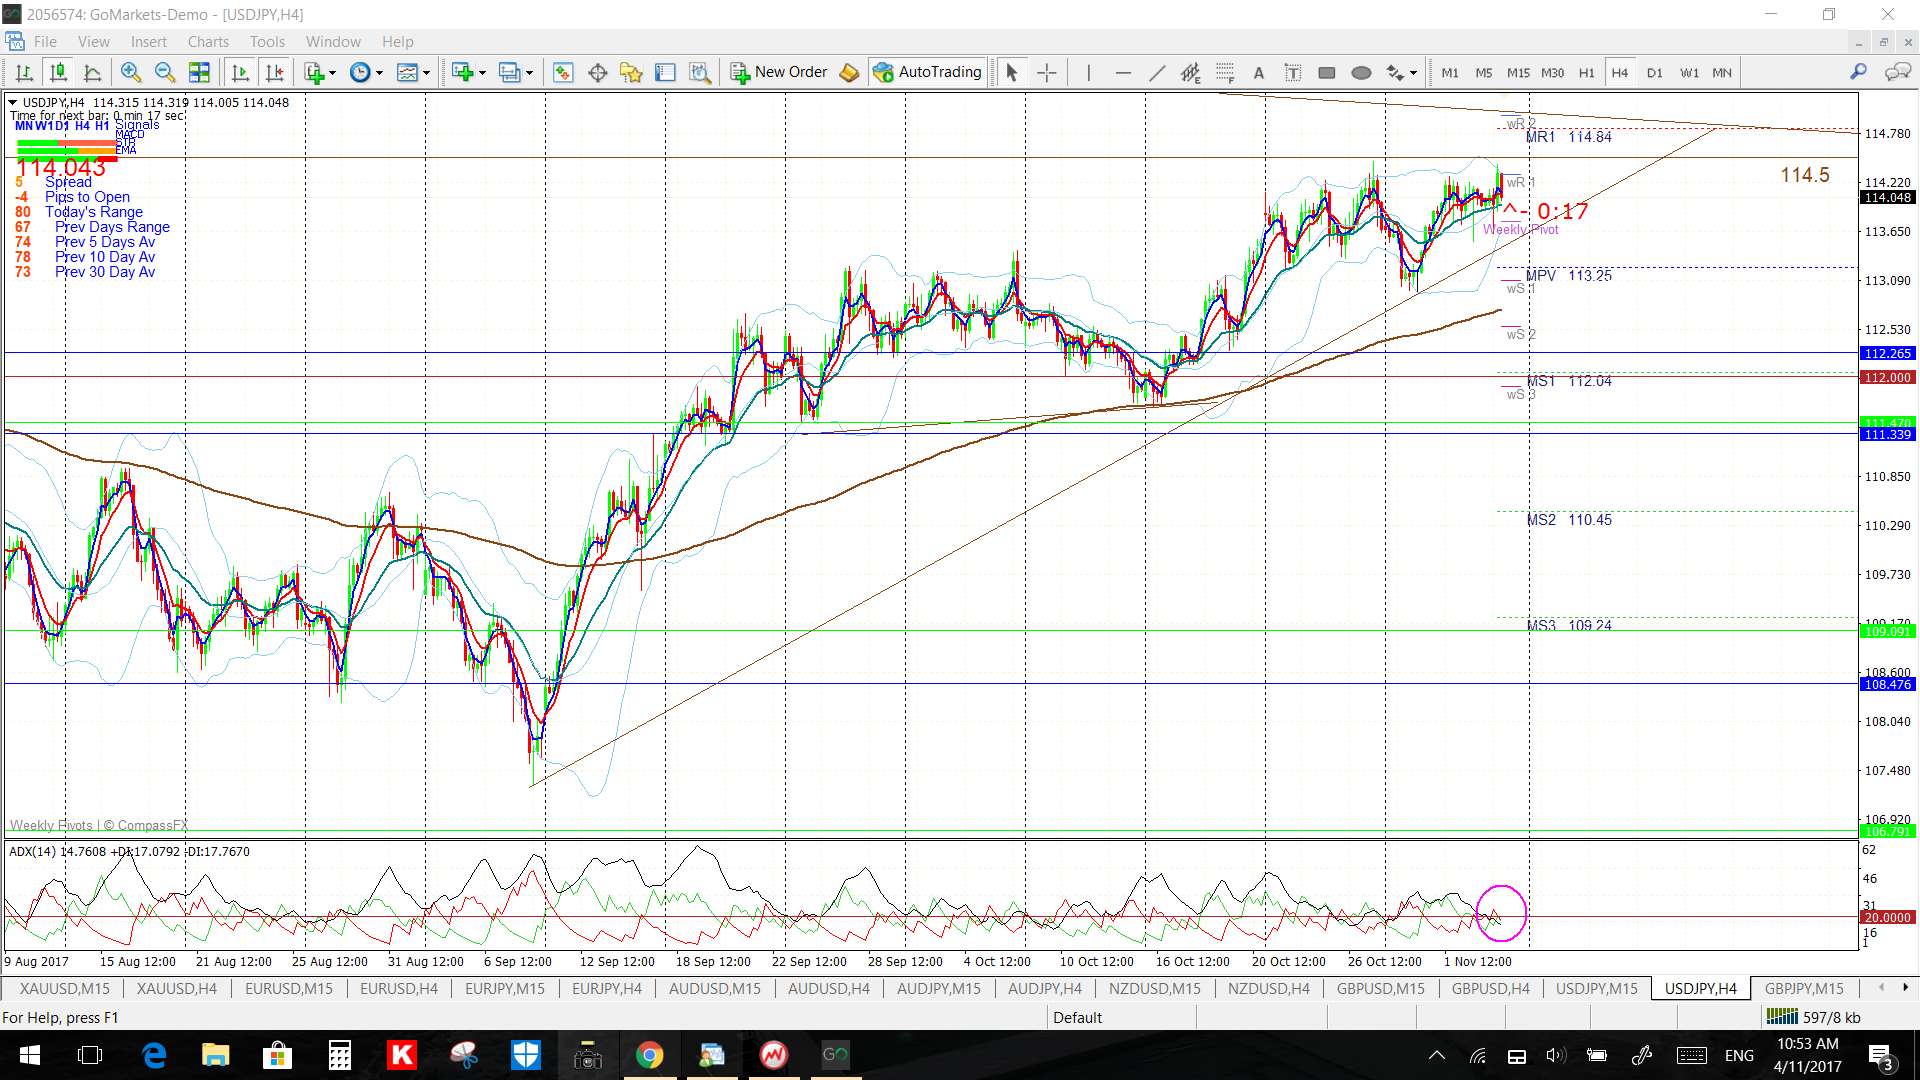
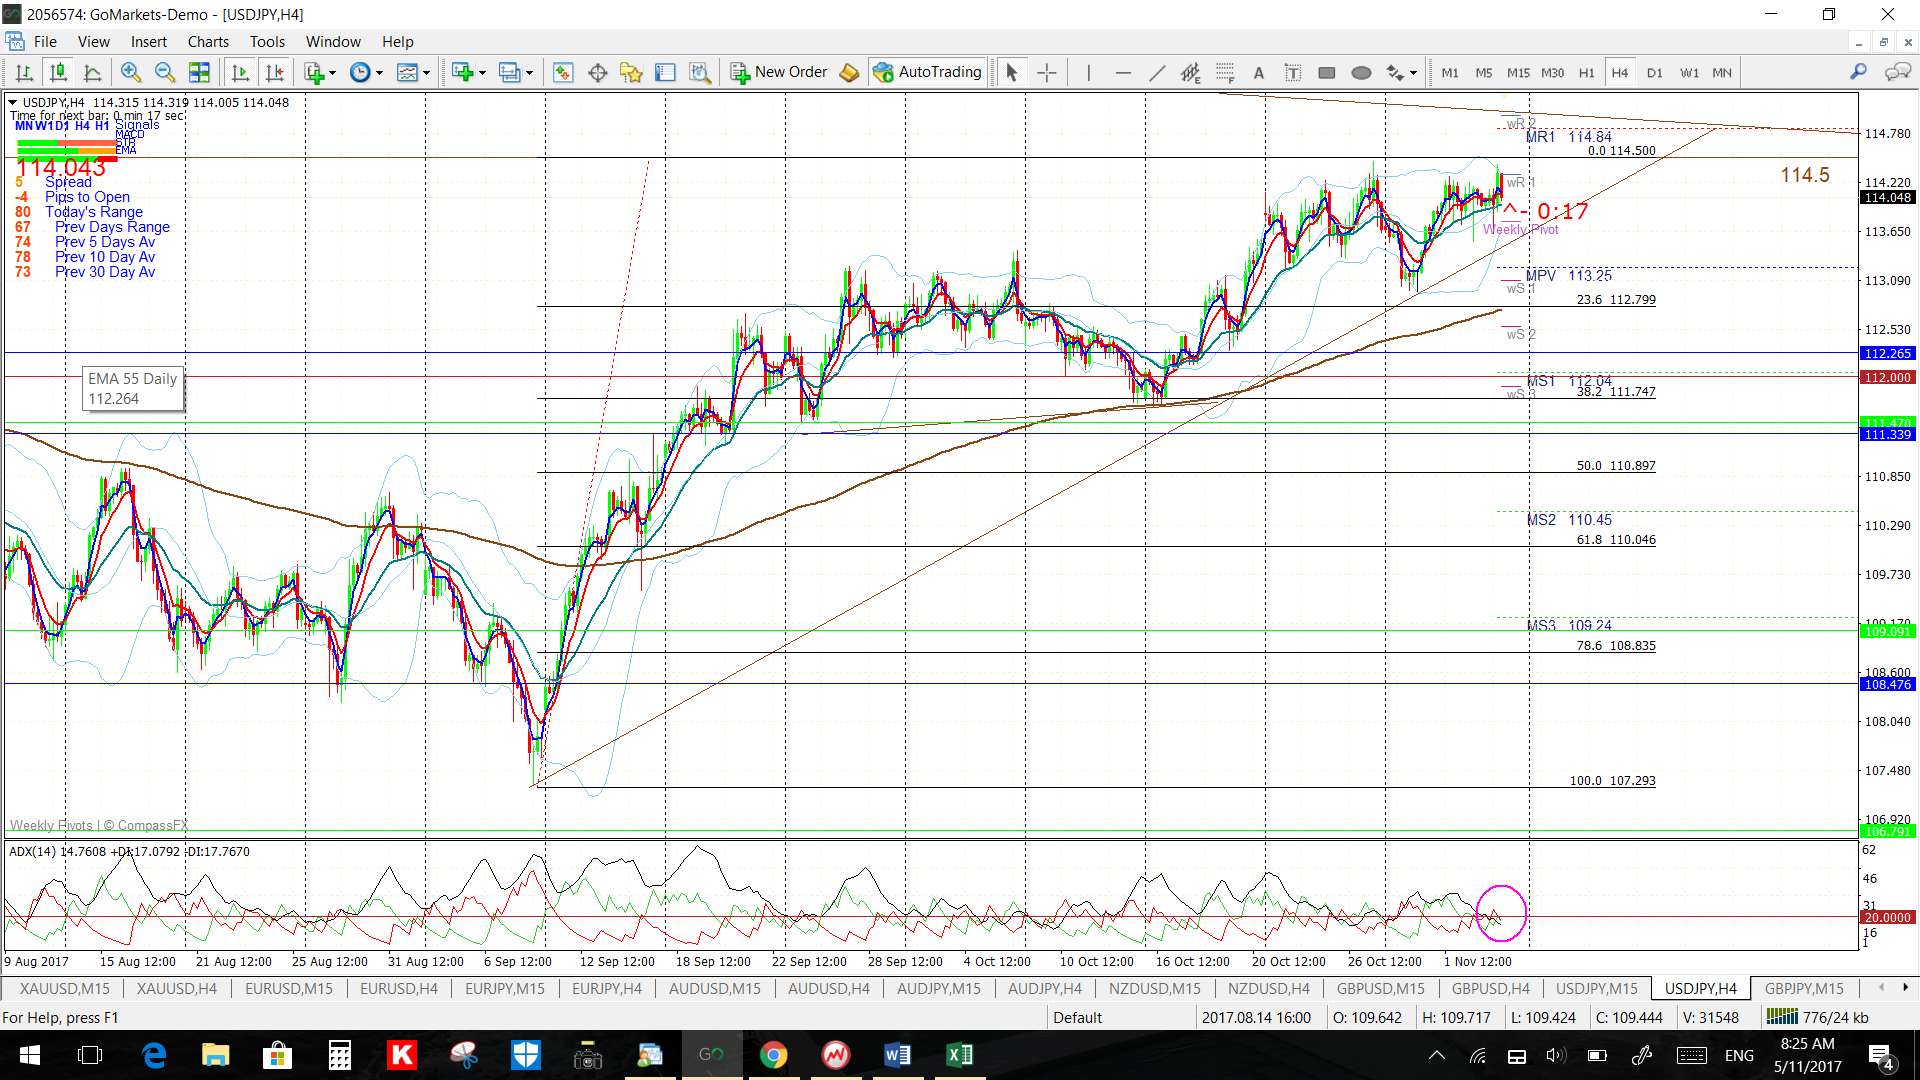
USD/JPY: Price continues consolidating under the 114.50 major S/R level and within a weekly chart triangle. Watch the 4 hr chart triangle trend lines for any new breakout. Note that any break below the support trend line would have me looking down to 110 as this is near the 4hr chart’s 61.8% fib :
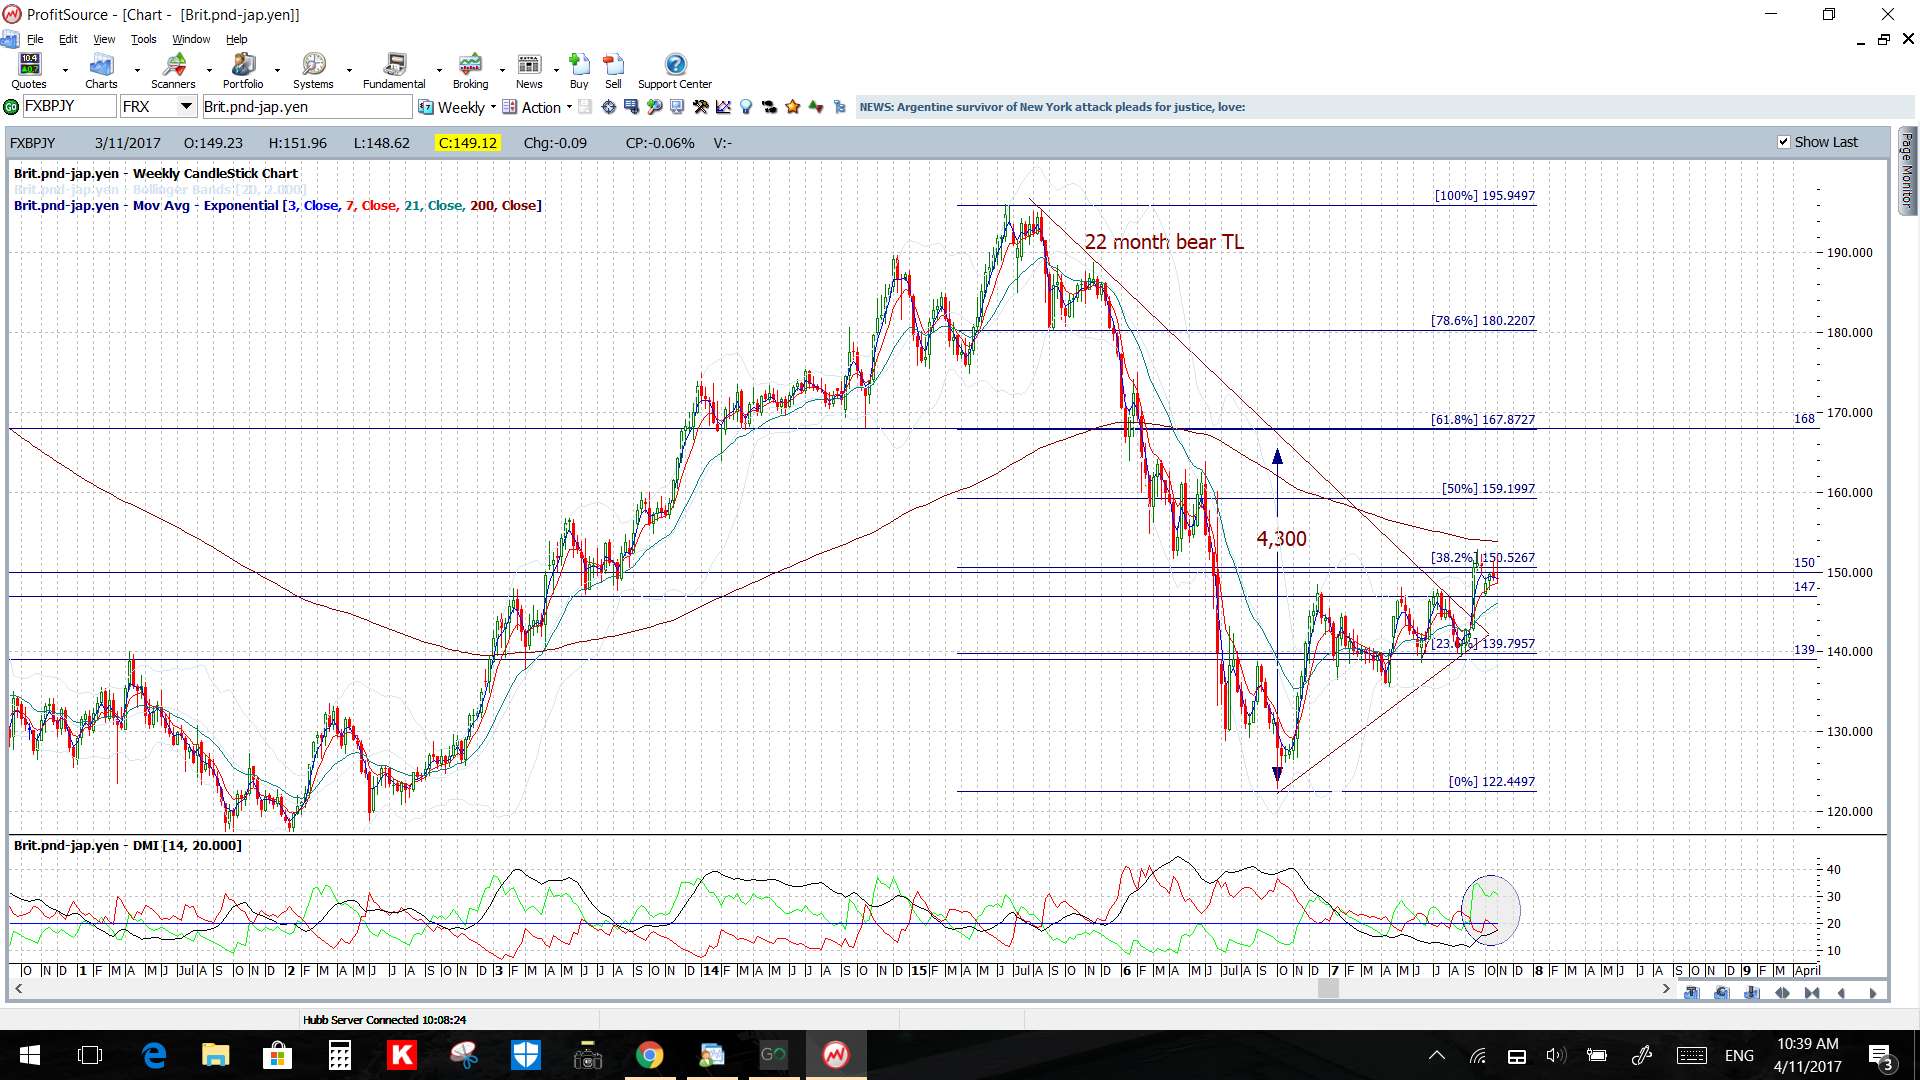
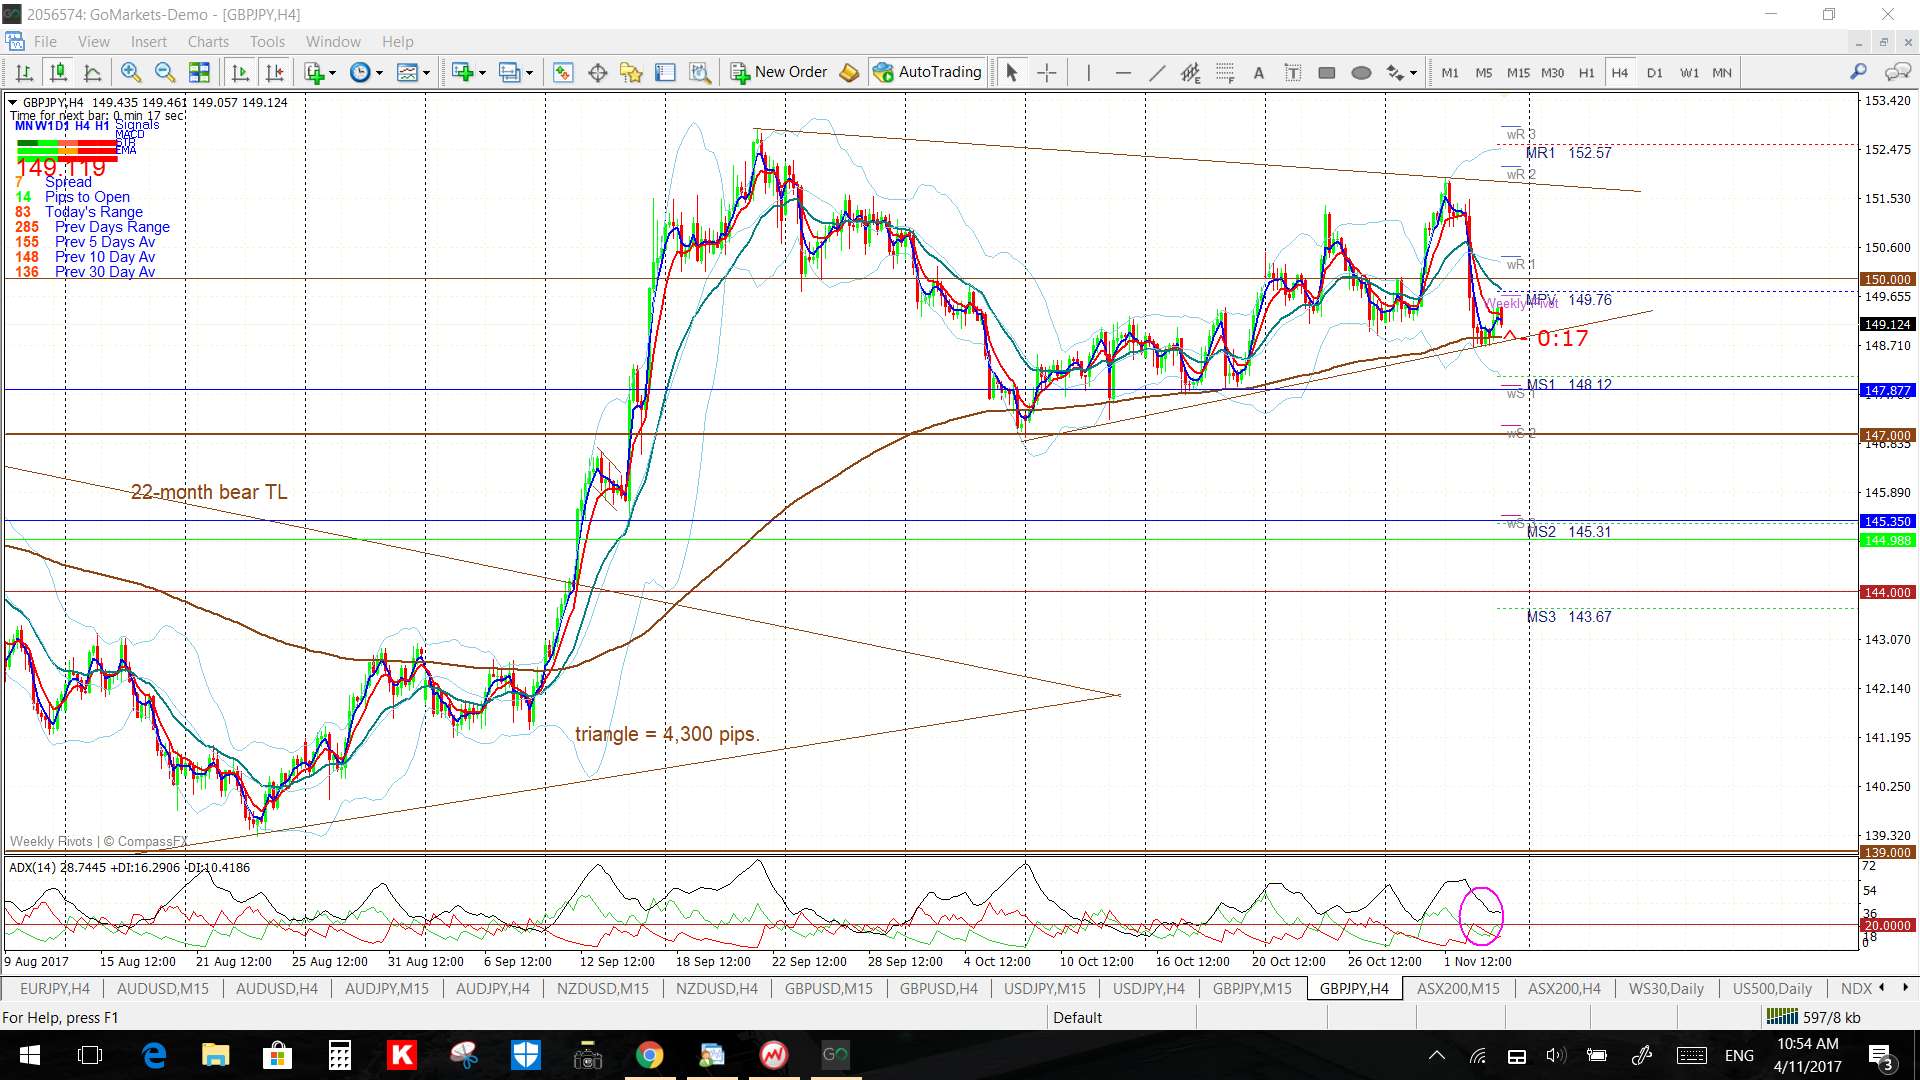
GBP/JPY: Price continues consolidating under the 150 major S/R level after making a weekly chart triangle breakout. Watch the 4 hr chart triangle trend lines though for any new breakout:
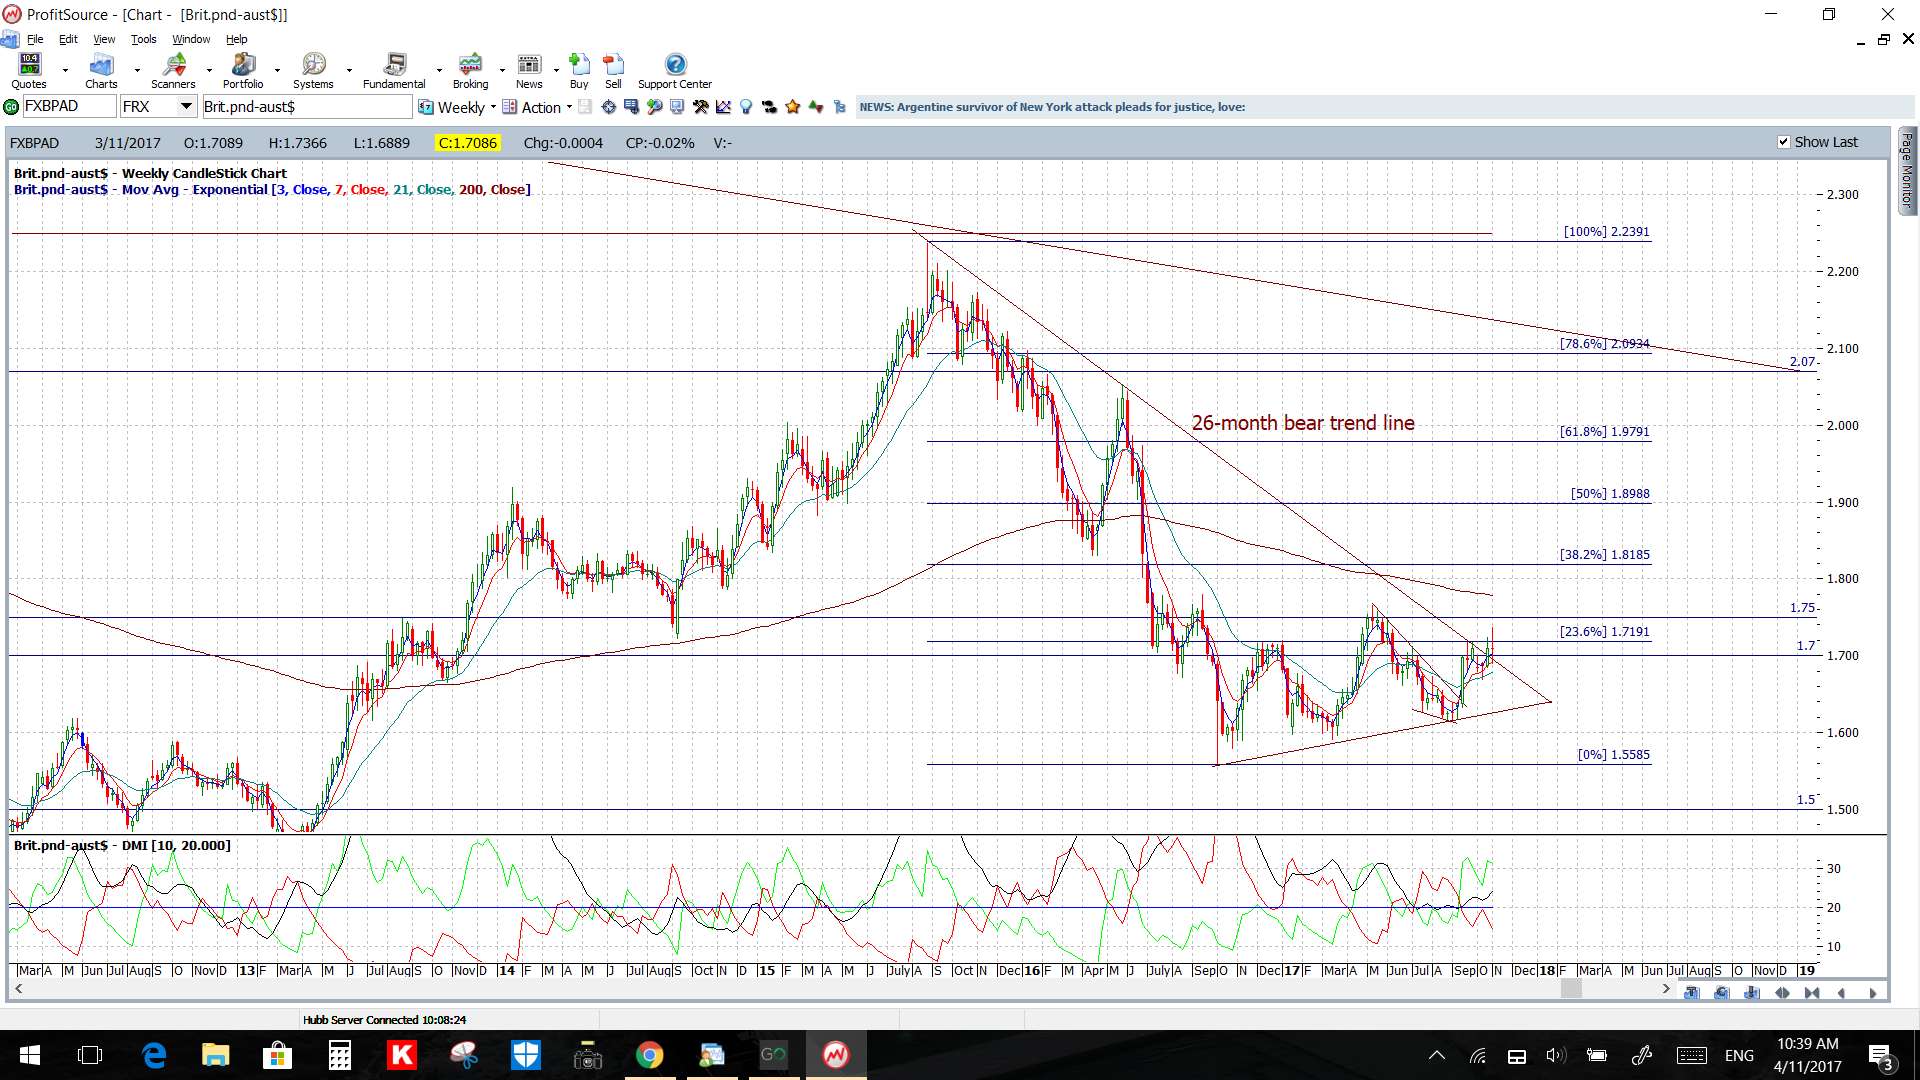
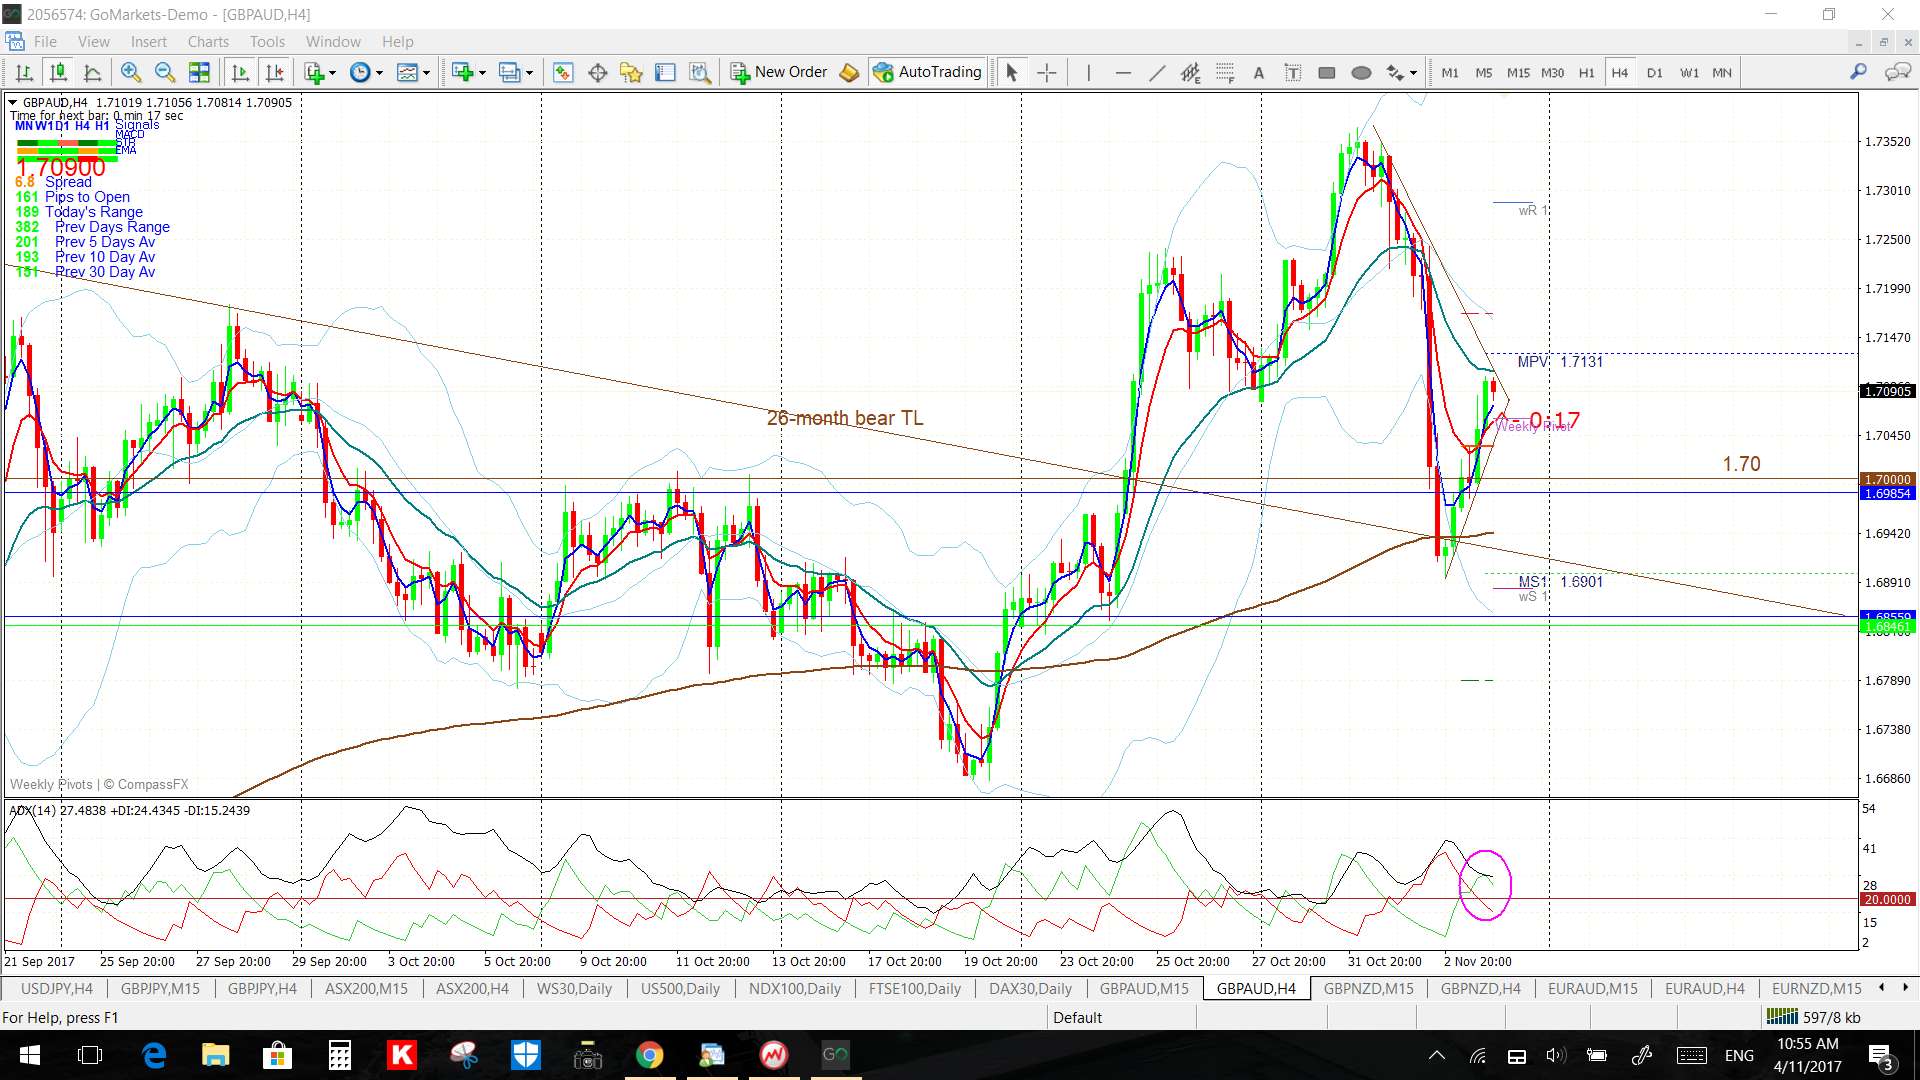
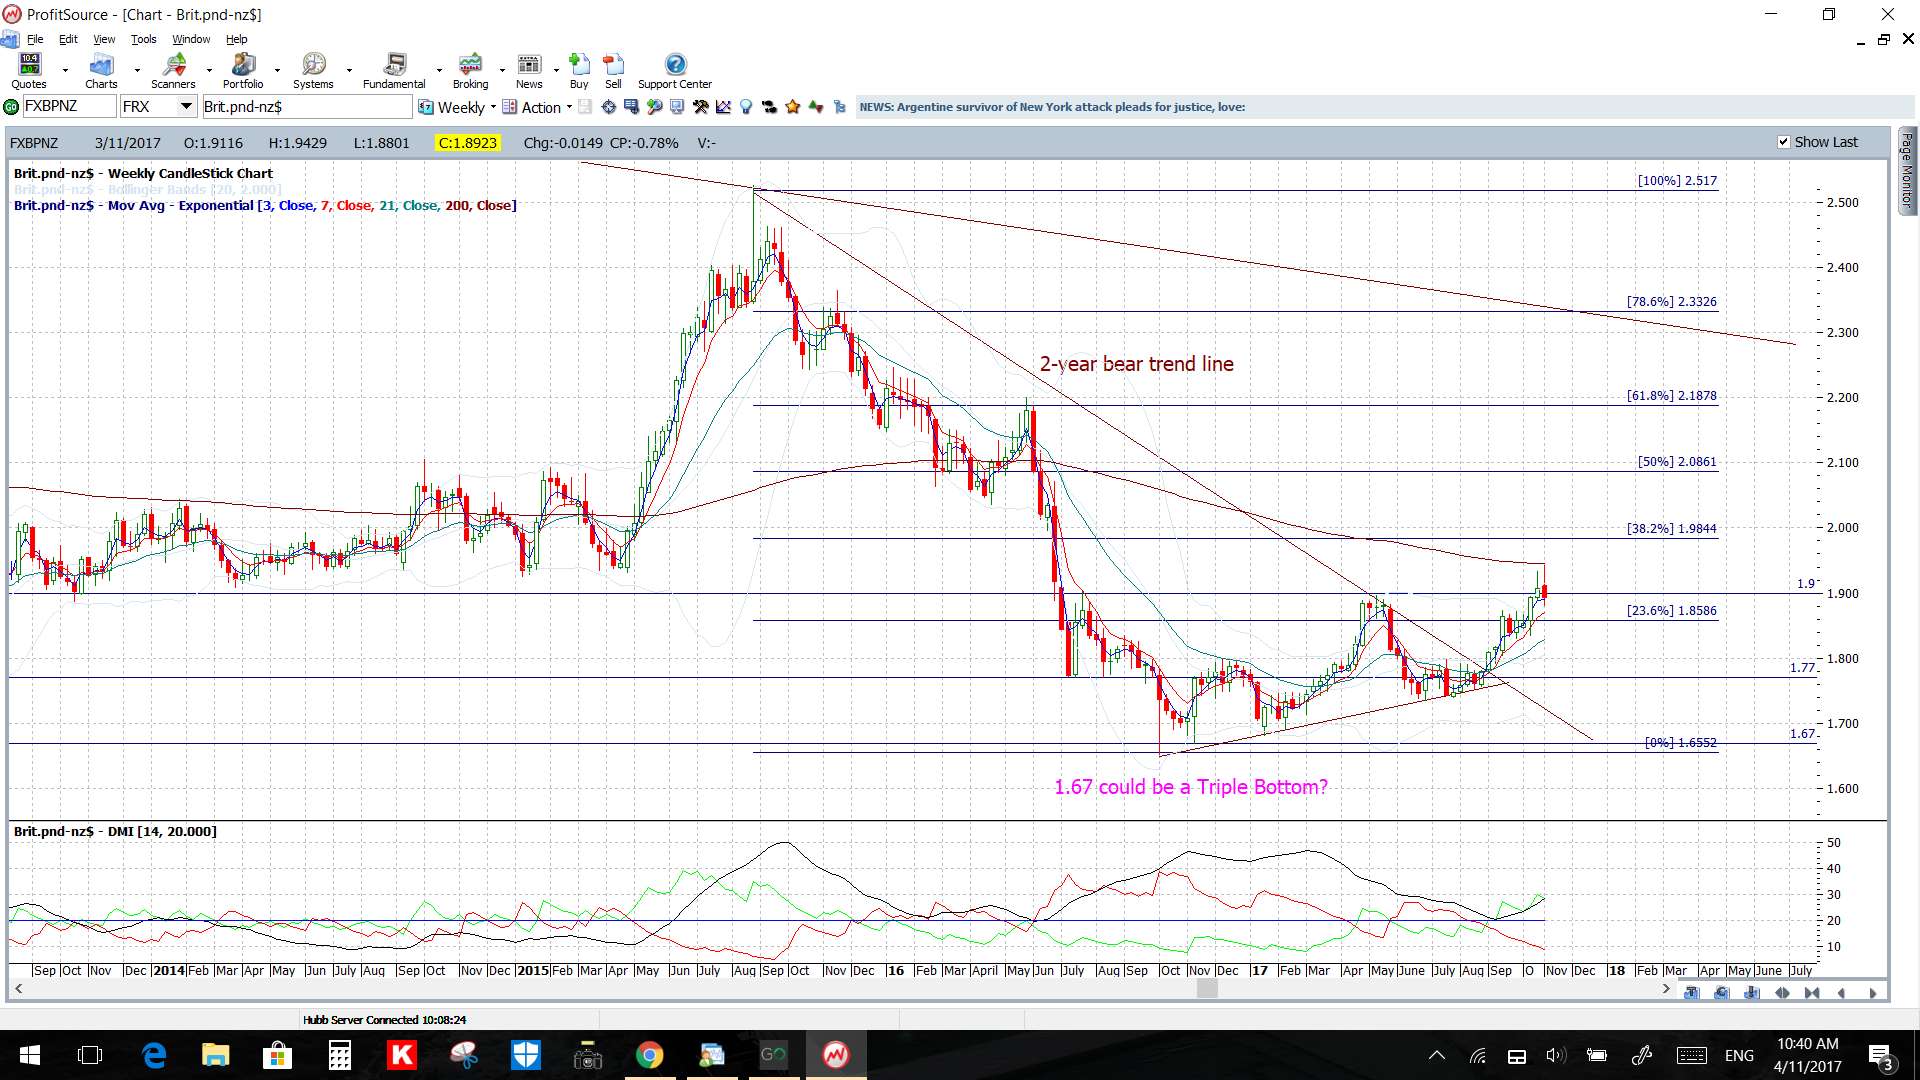
GBP/AUD: Price continues consolidating under the 1.175 major S/R level after making a weekly chart triangle breakout. Watch the 4 hr chart triangle trend lines though for any new breakout:
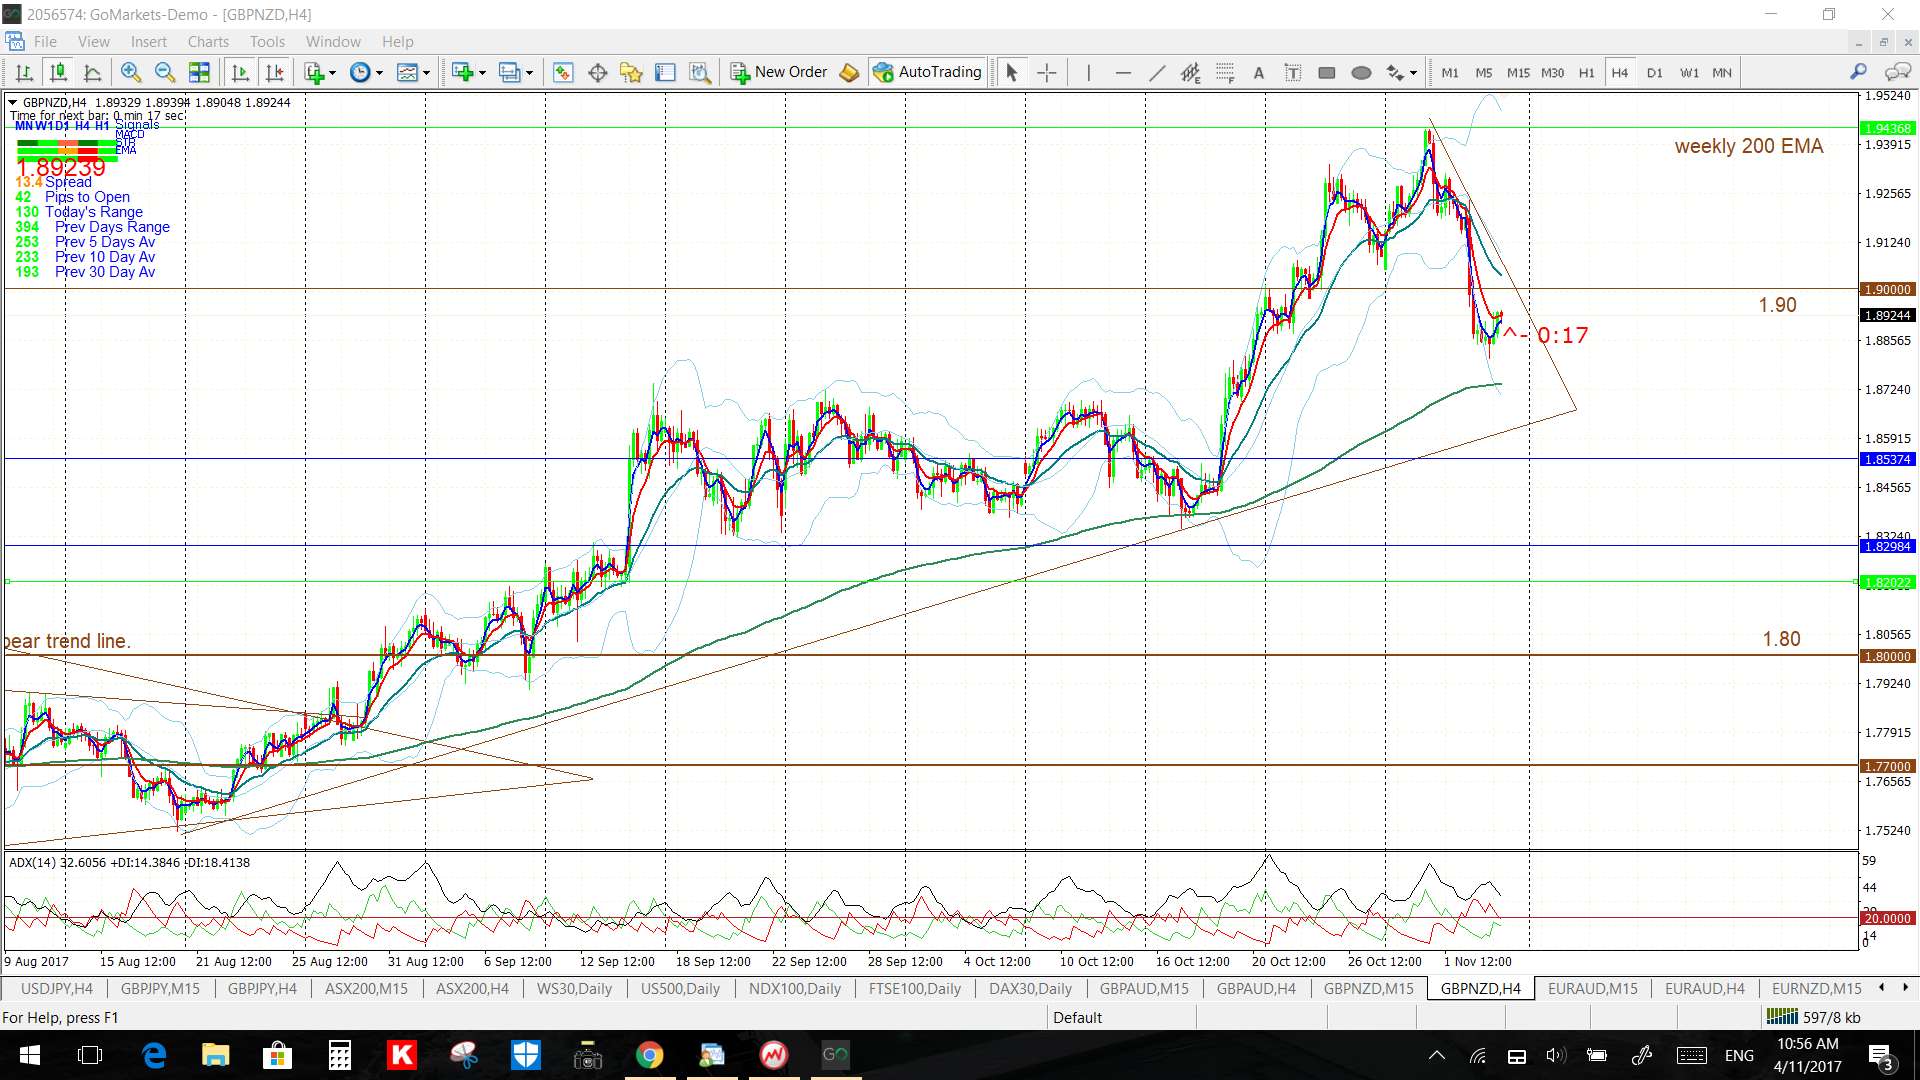
GBP/NZD: Price continues consolidating near the 1.90 major S/R level after making a weekly chart triangle breakout. Watch the 4 hr chart triangle trend lines though for any new breakout:
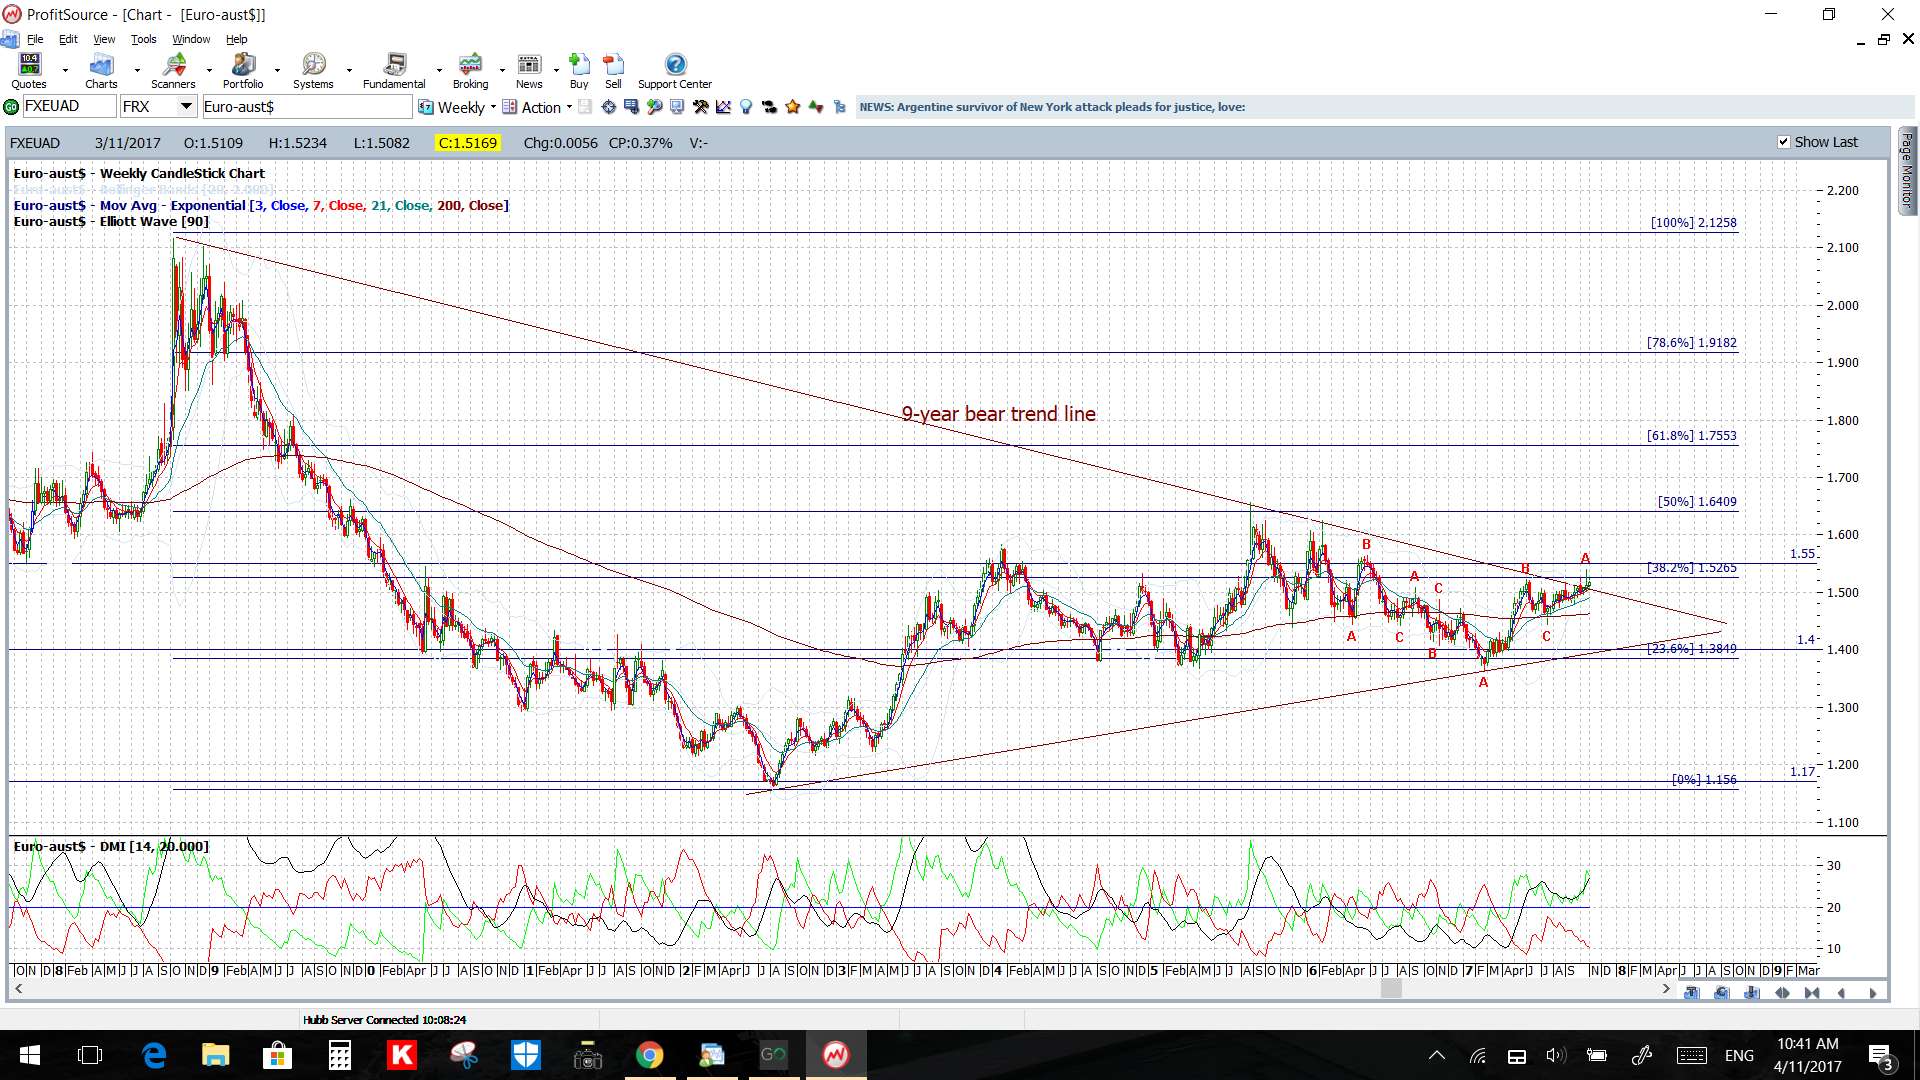
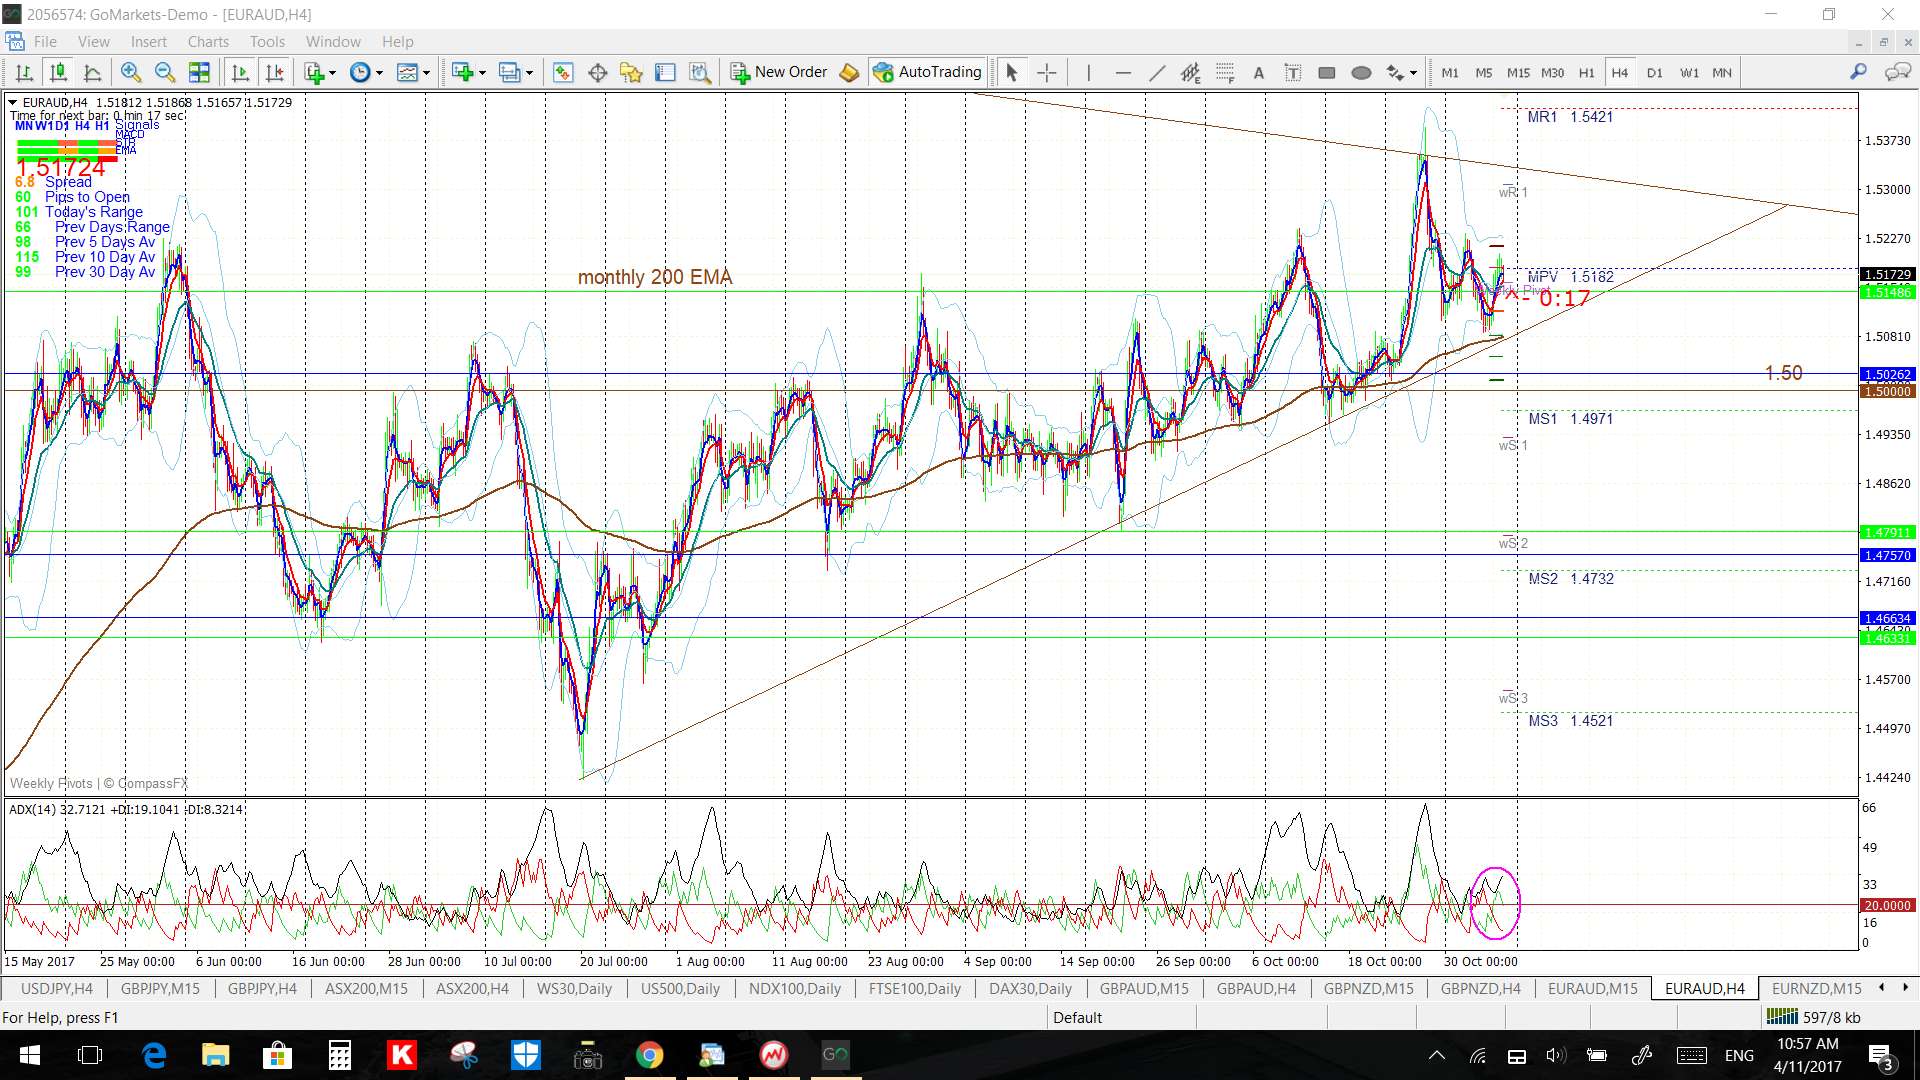
EUR/AUD: Price continues consolidating under the 1.55 major S/R level after making a weekly chart triangle breakout. Watch the 4 hr chart triangle trend lines though for any new breakout:
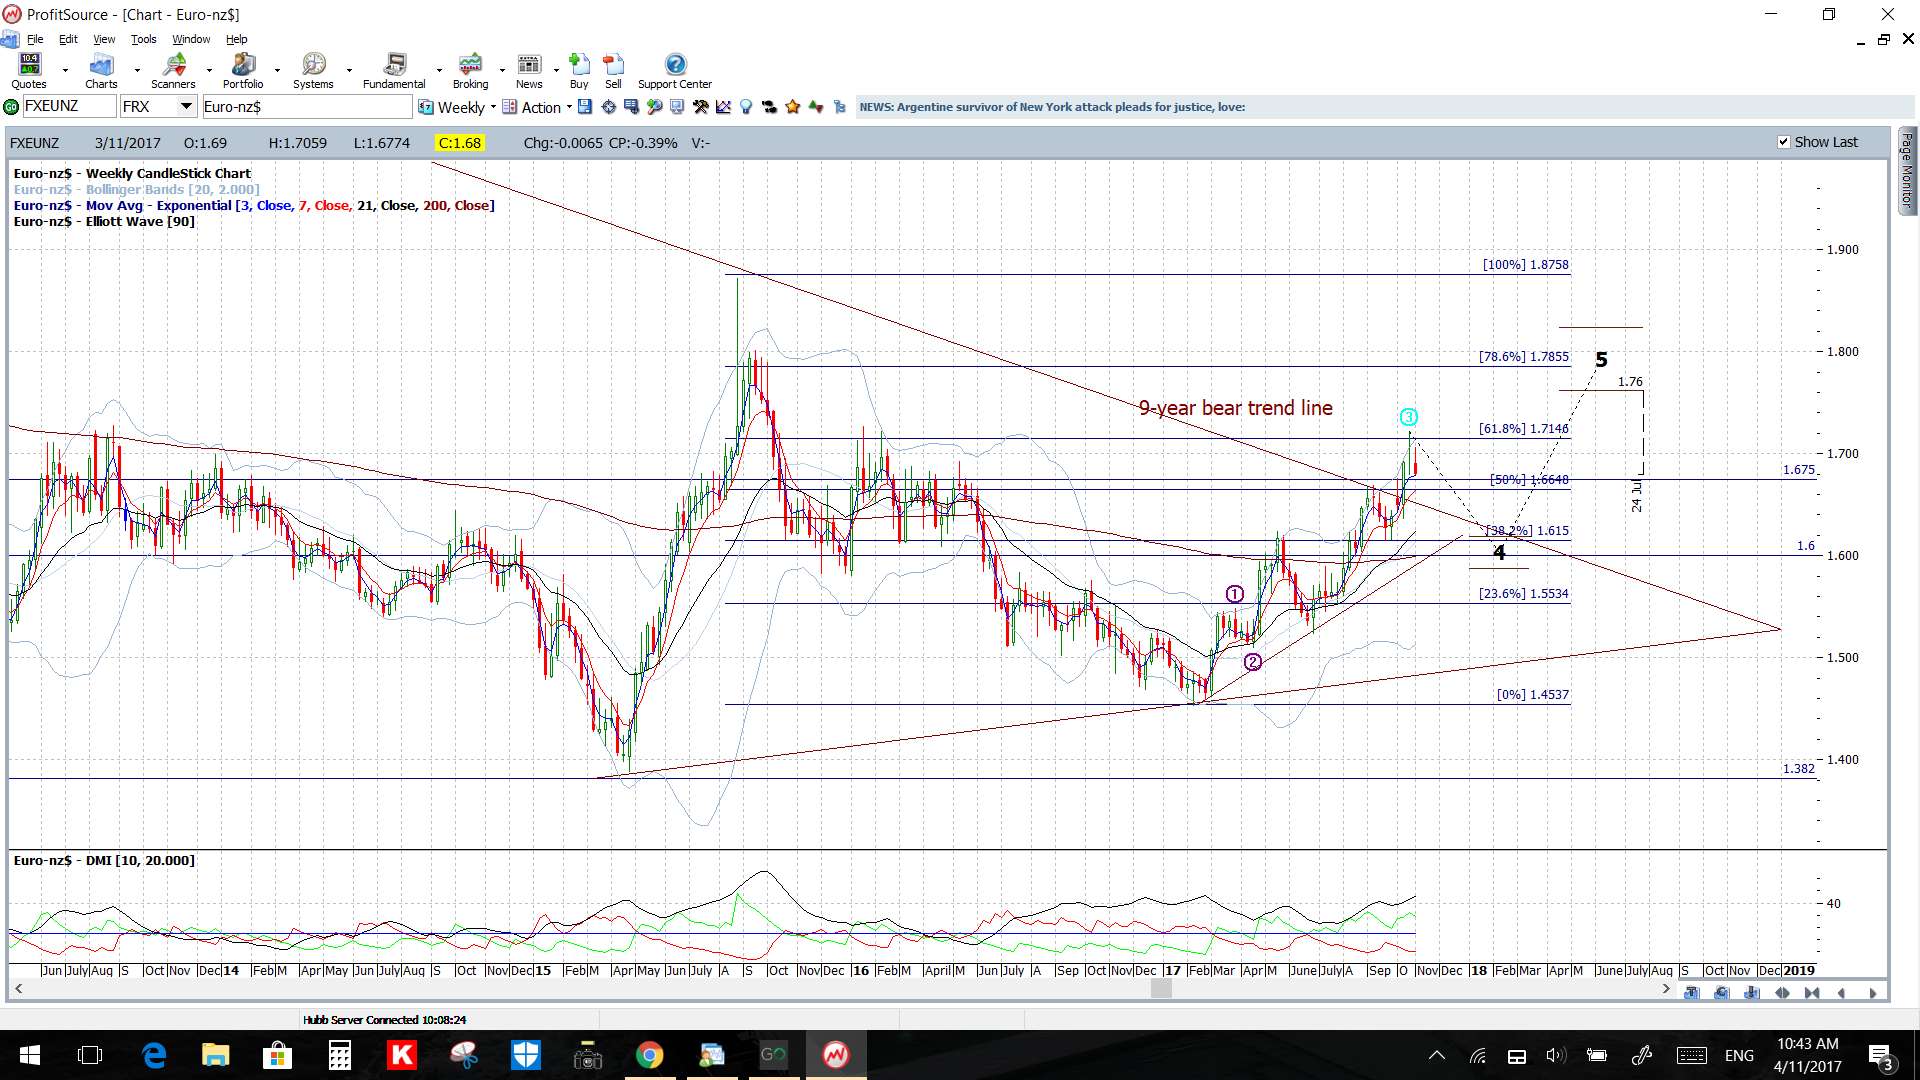
EUR/NZD: Price continues consolidating above the 1.675 major S/R level but under the weekly 61.8% fib after making an earlier weekly chart triangle breakout. Watch the 4 hr chart triangle trend lines though for any new breakout:

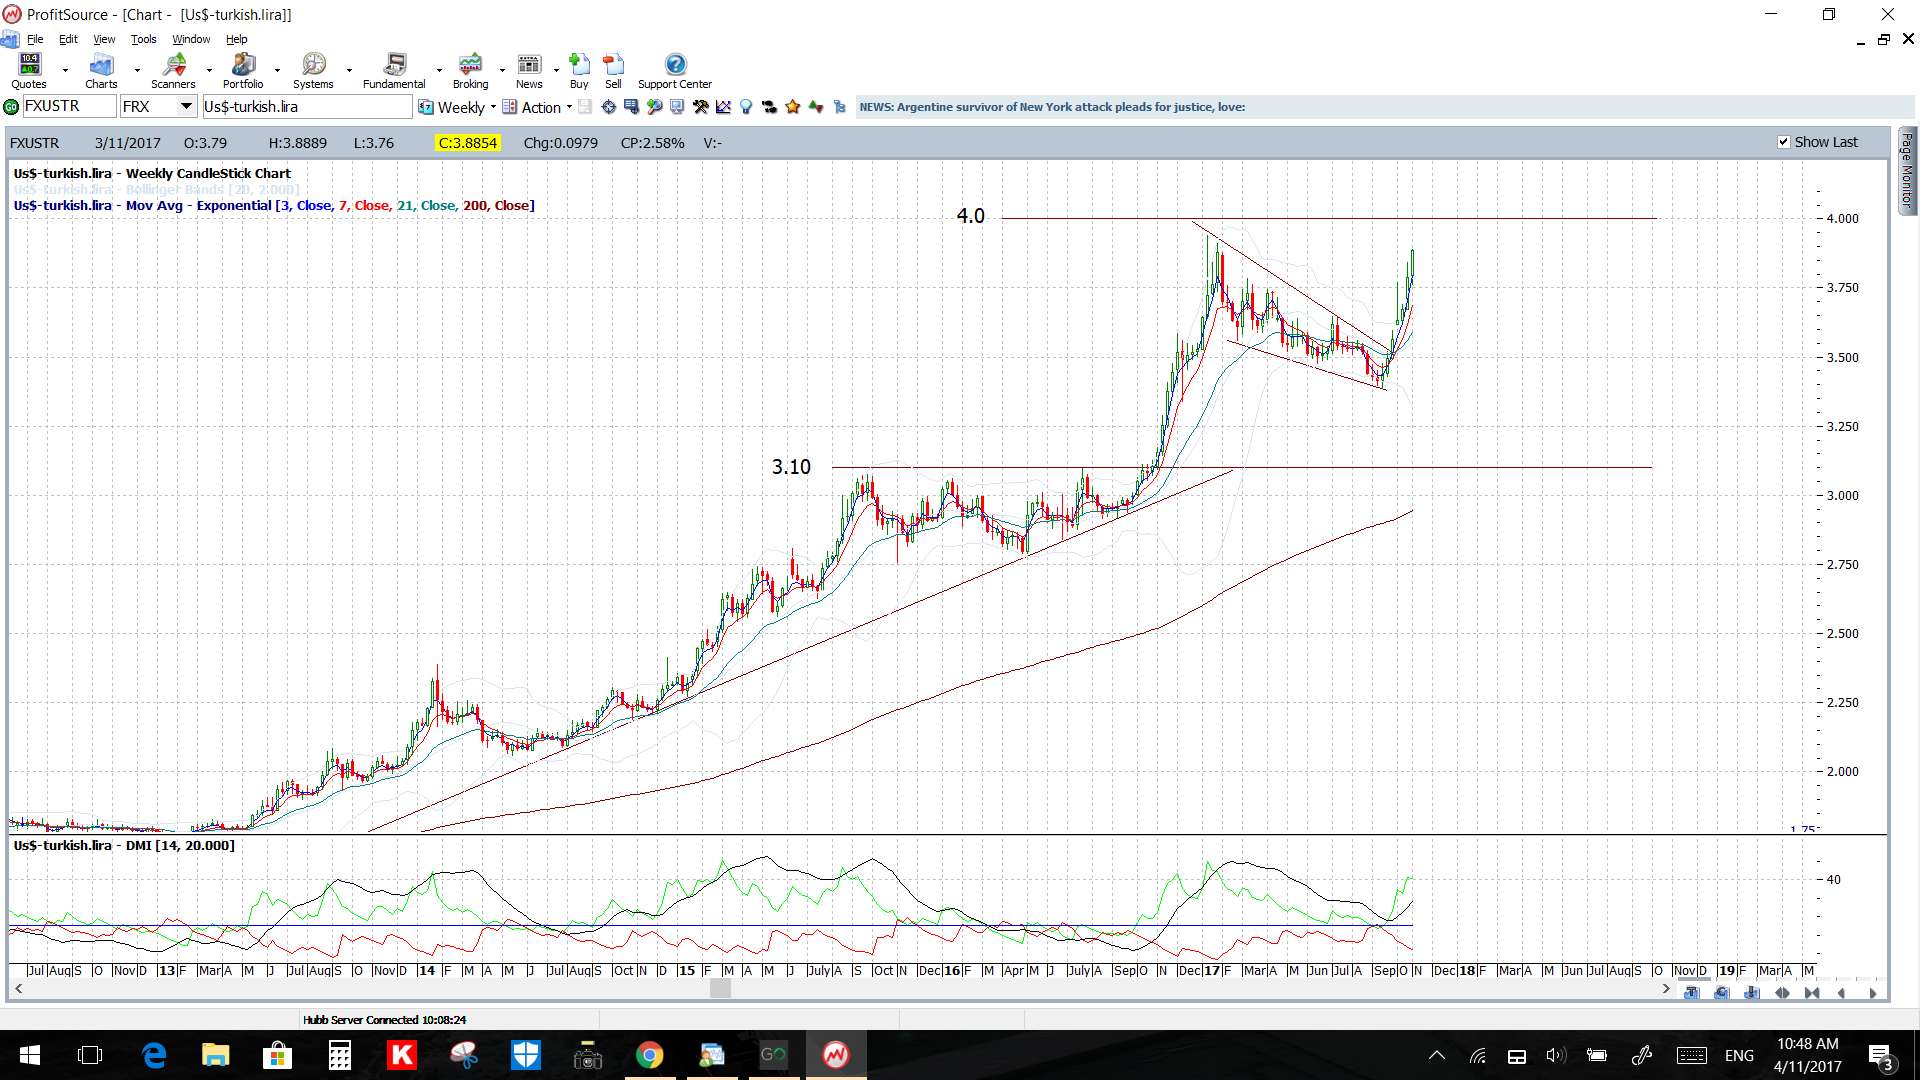
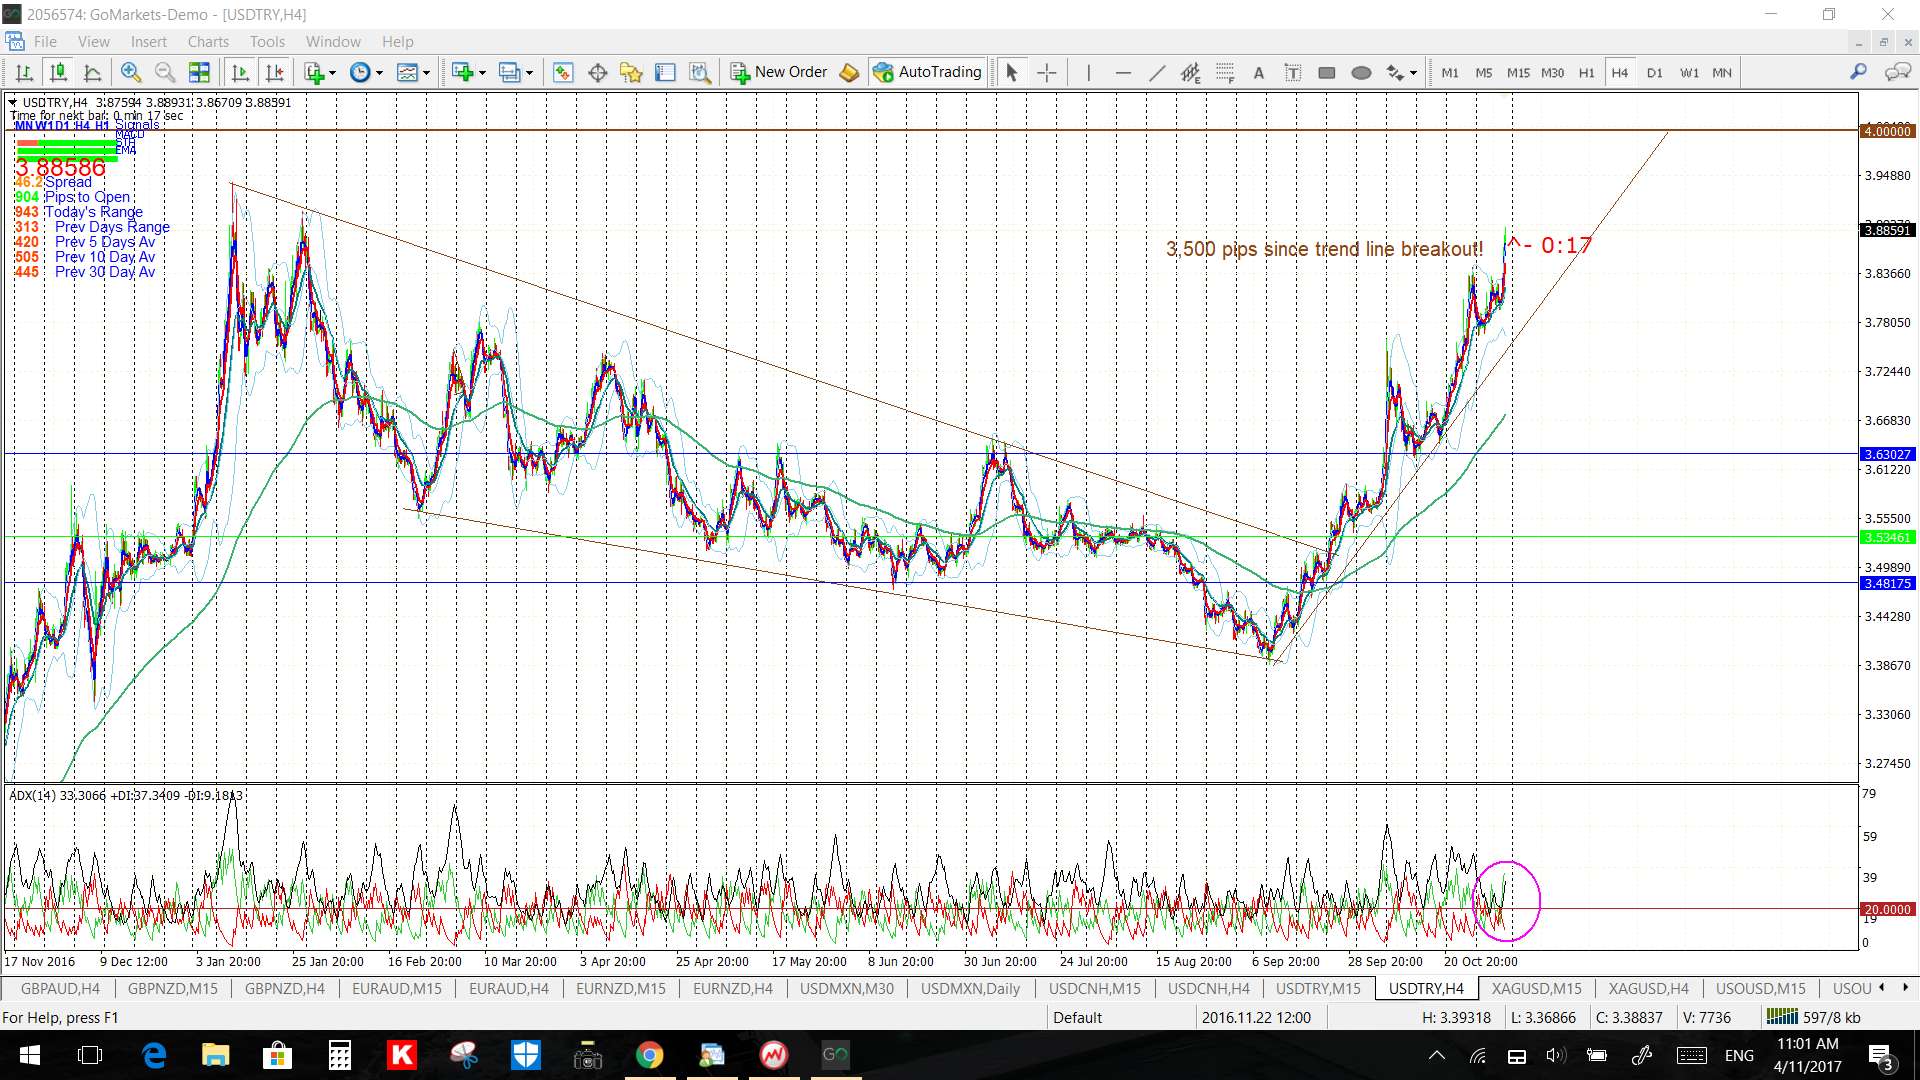
USD/TRY: What a huge rally after breaking our from the bullish-reversal Descending Wedge; for around 3,500 pips! Watch the 4 area now for any potential Double Top test and or activity:
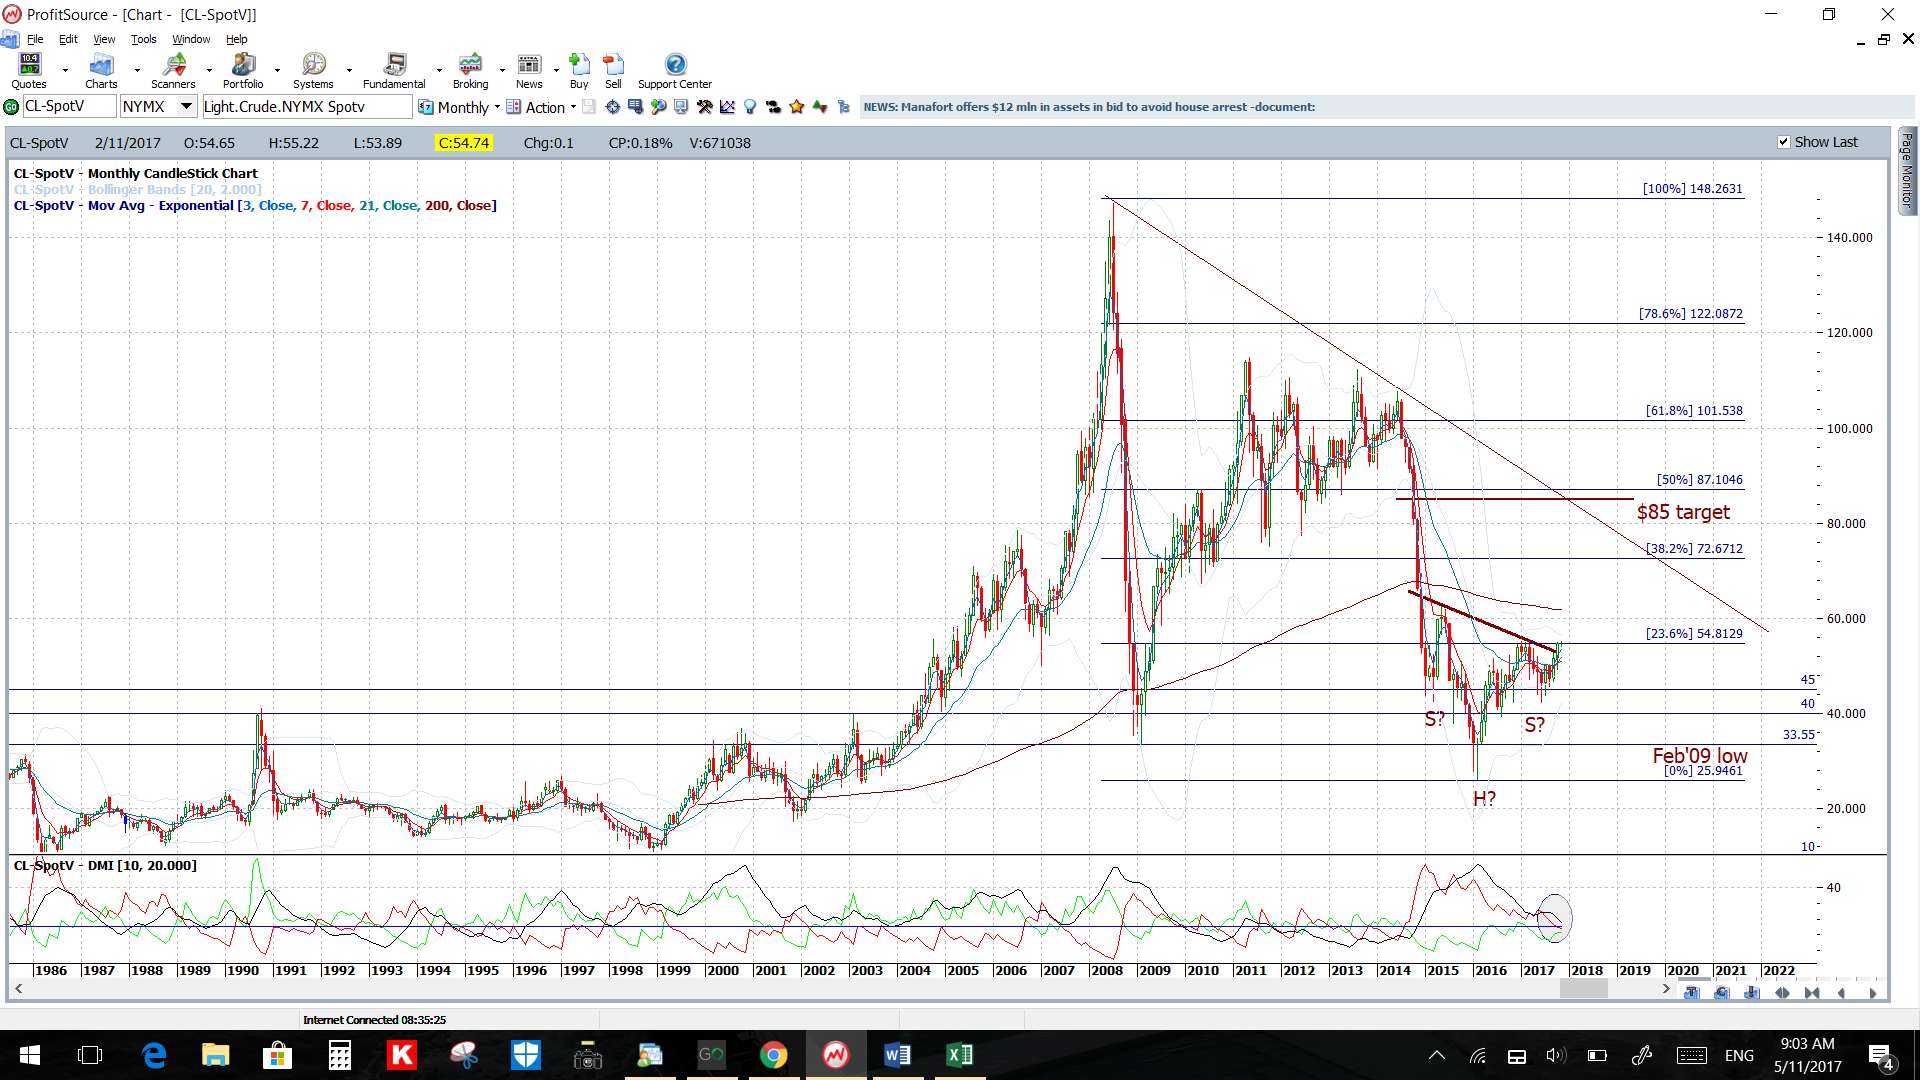
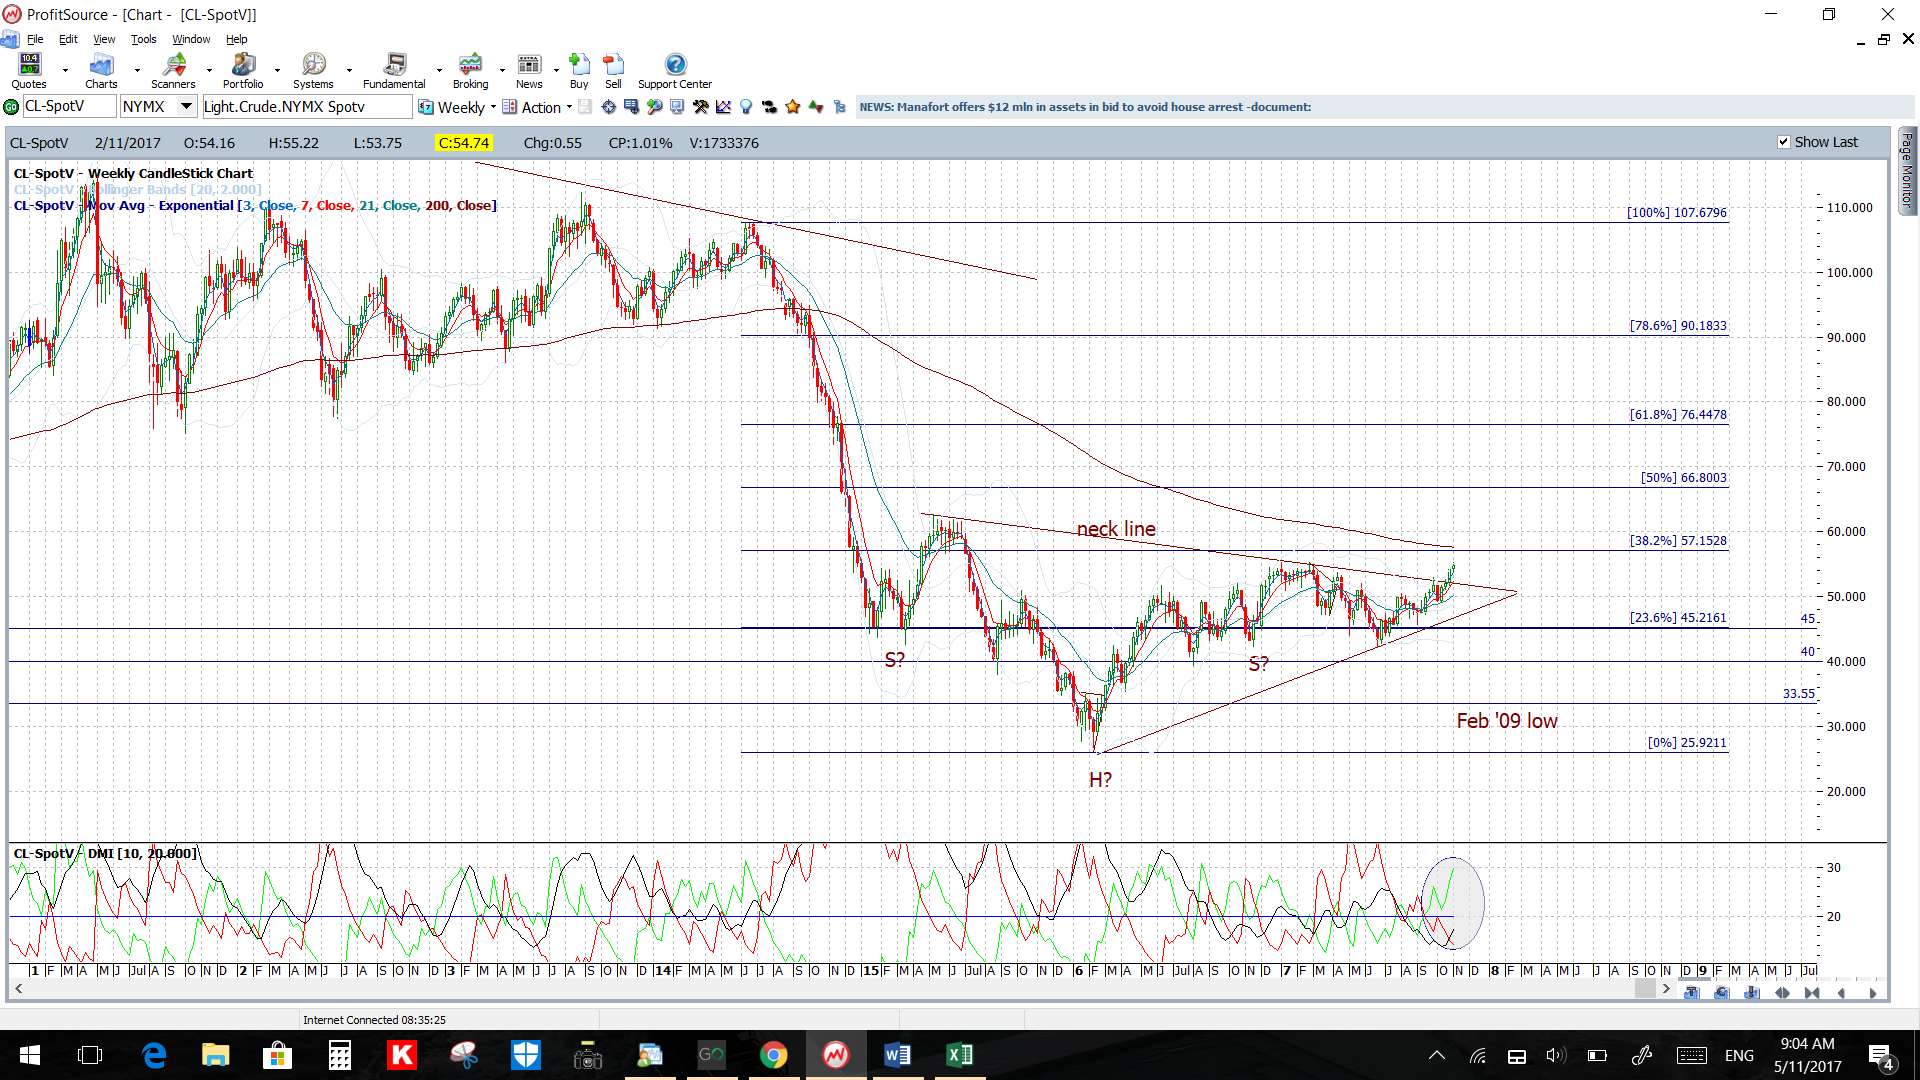
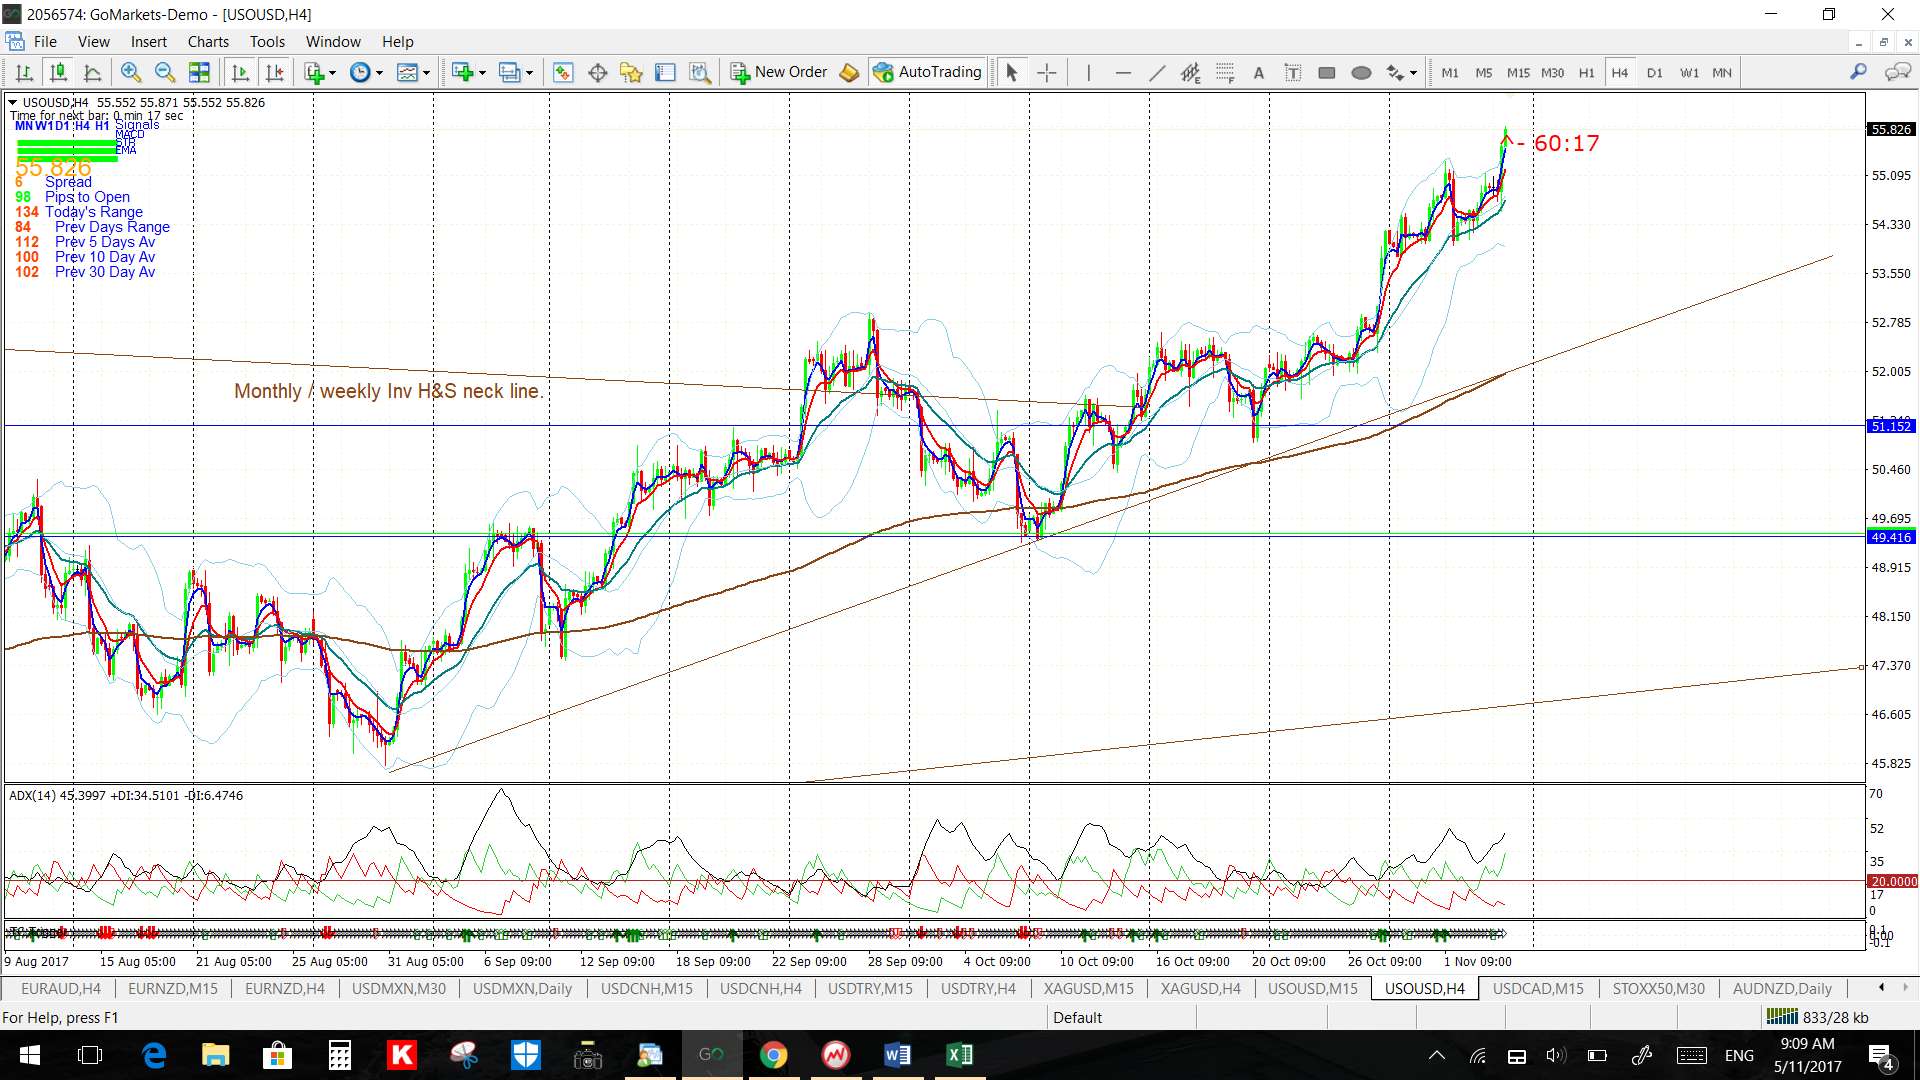
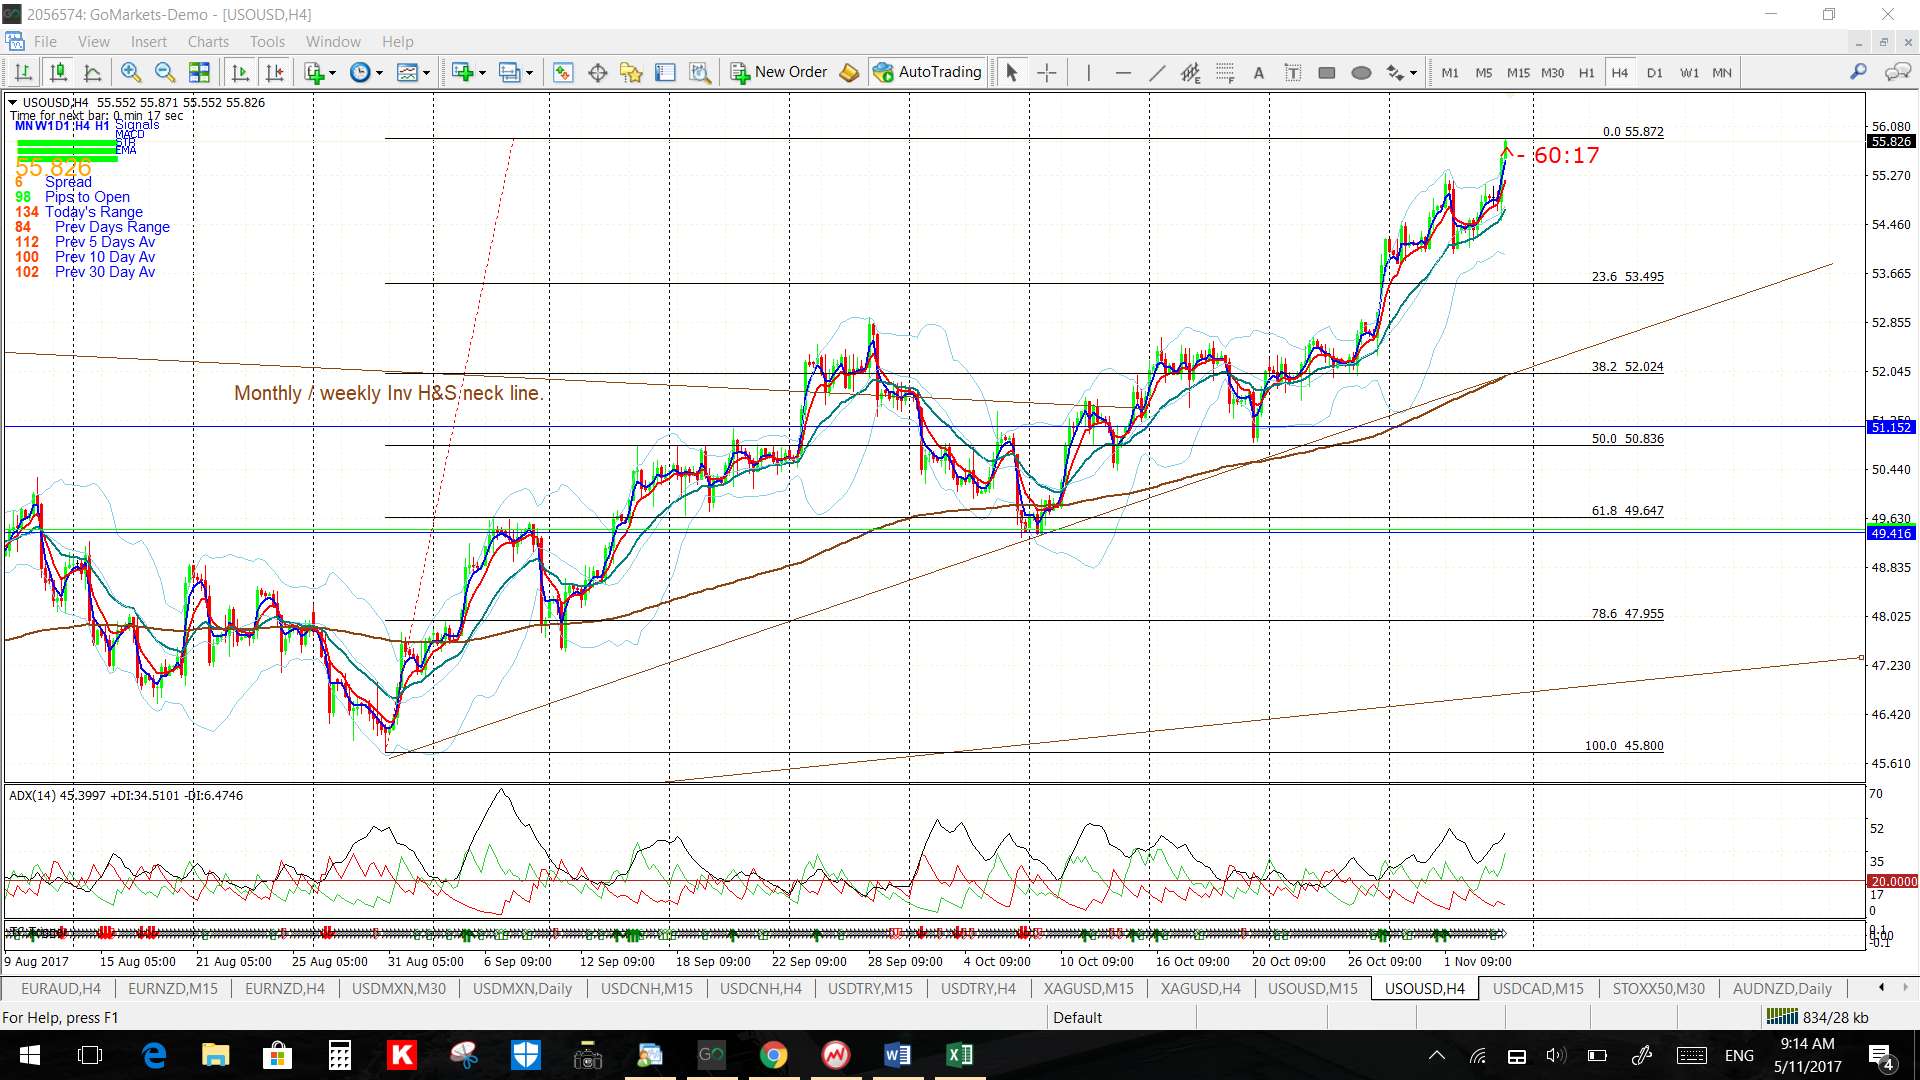
Oil: Oil has been on a decent rally whilst I have been away. There has been a weekly and monthly chart break up through the bullish ‘Inverse H&S’ pattern I’ve been tracking for some months. The weekly chart’s 61.8% fib is near $80 and the ‘Inverse H&S’ target is near $85 so these levels will be in focus as longer term targets but $55, and then $60, look to be the next main S/R levels to negotiate. Any pause in this rally would bring the $50 back into focus though as this is near the 4hr chart’s 61.8% fib: