The GBP/NZD has been in an overall downtrend since 2001 printing lower Highs and lower Lows throughout. Whilst this period has had its troughs and peaks, the period since September 2015 has been one of rather steep decline. However, over recent months, since September 2016, price action seems to have found a base near 1.67 and has recently bounced up from the region on three occasions. This is giving the monthly chart a bullish-reversal ‘Triple Bottom’ appearance and has stemmed the flow of lower Lows for now. As well, the daily chart shows that a twelve-month bear trend line was broken today adding to the recovery-style picture forming up here.
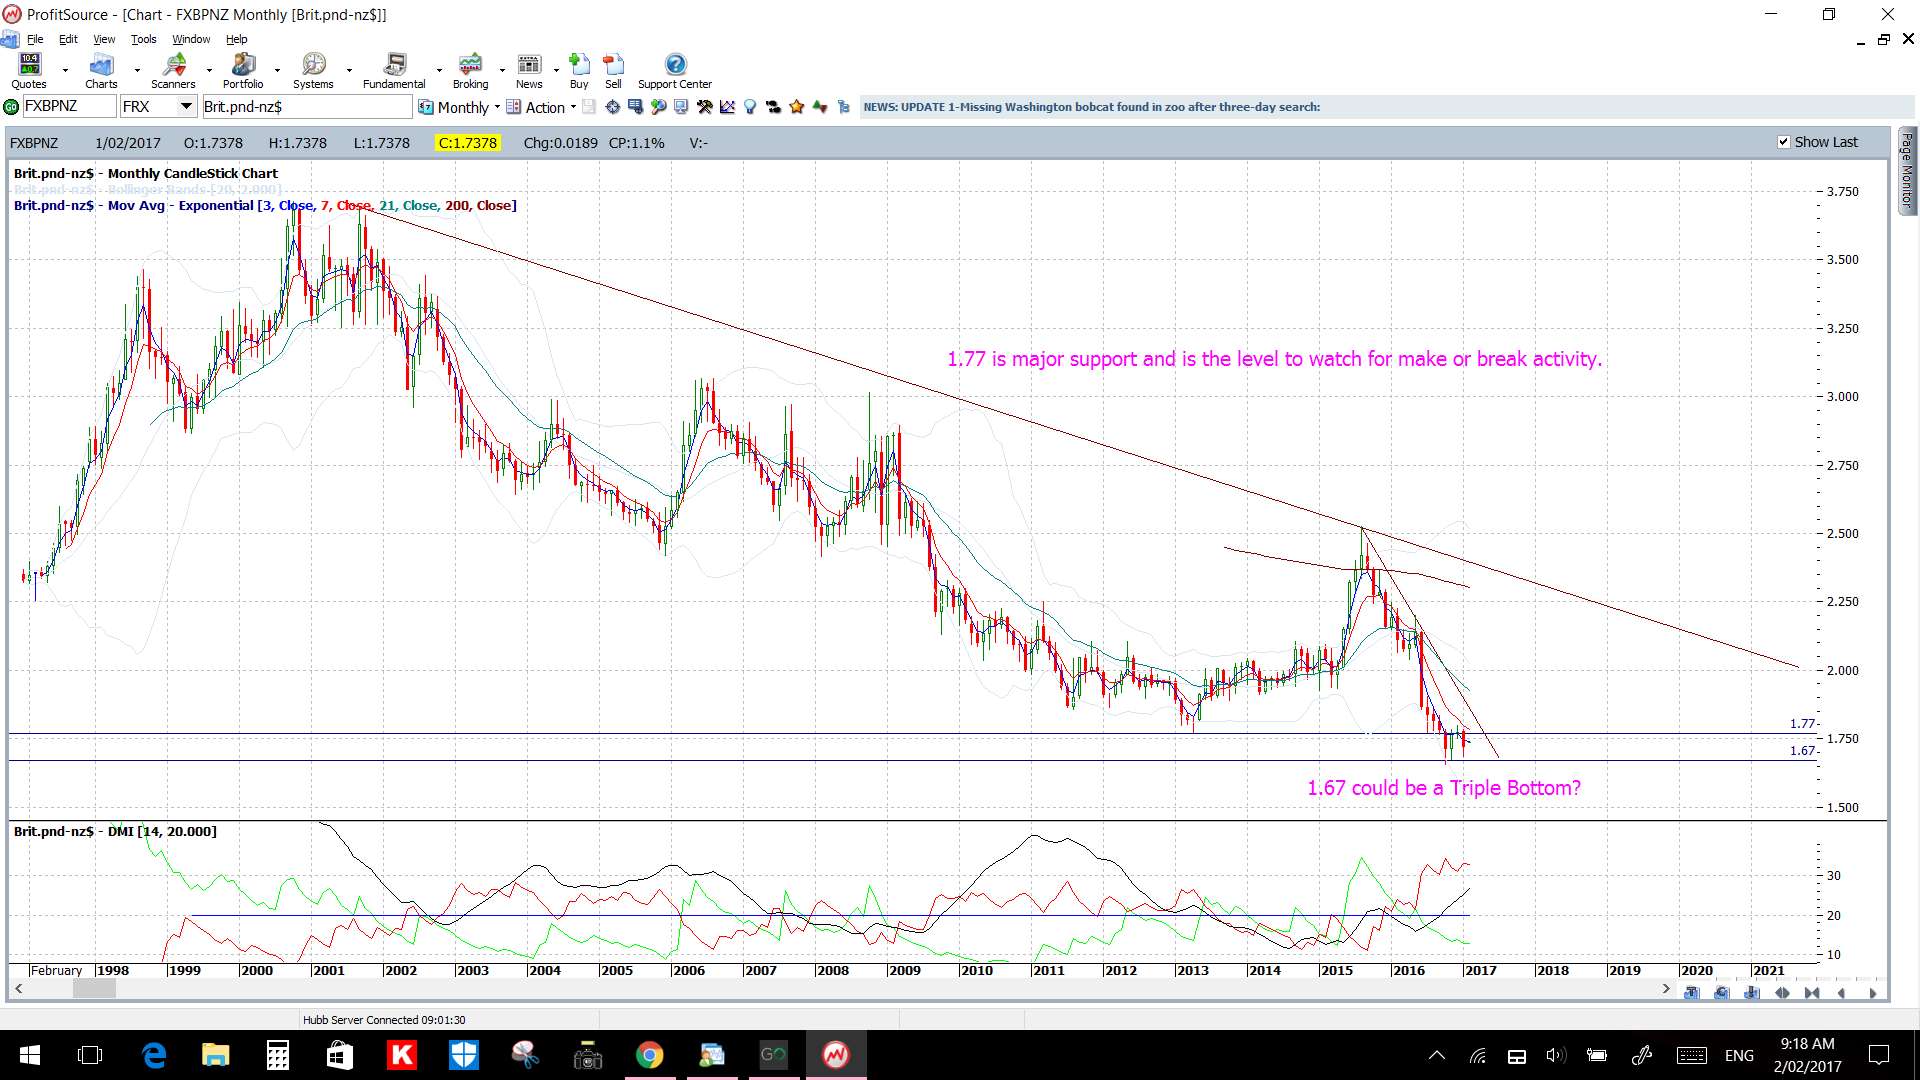
GBP/NZD monthly: this currency pair has been in a gradual down trend since 2001. The S/R level of 1.77 had previously been in focus BUT note the recent hold and basing-style formation forming up off 1.67.
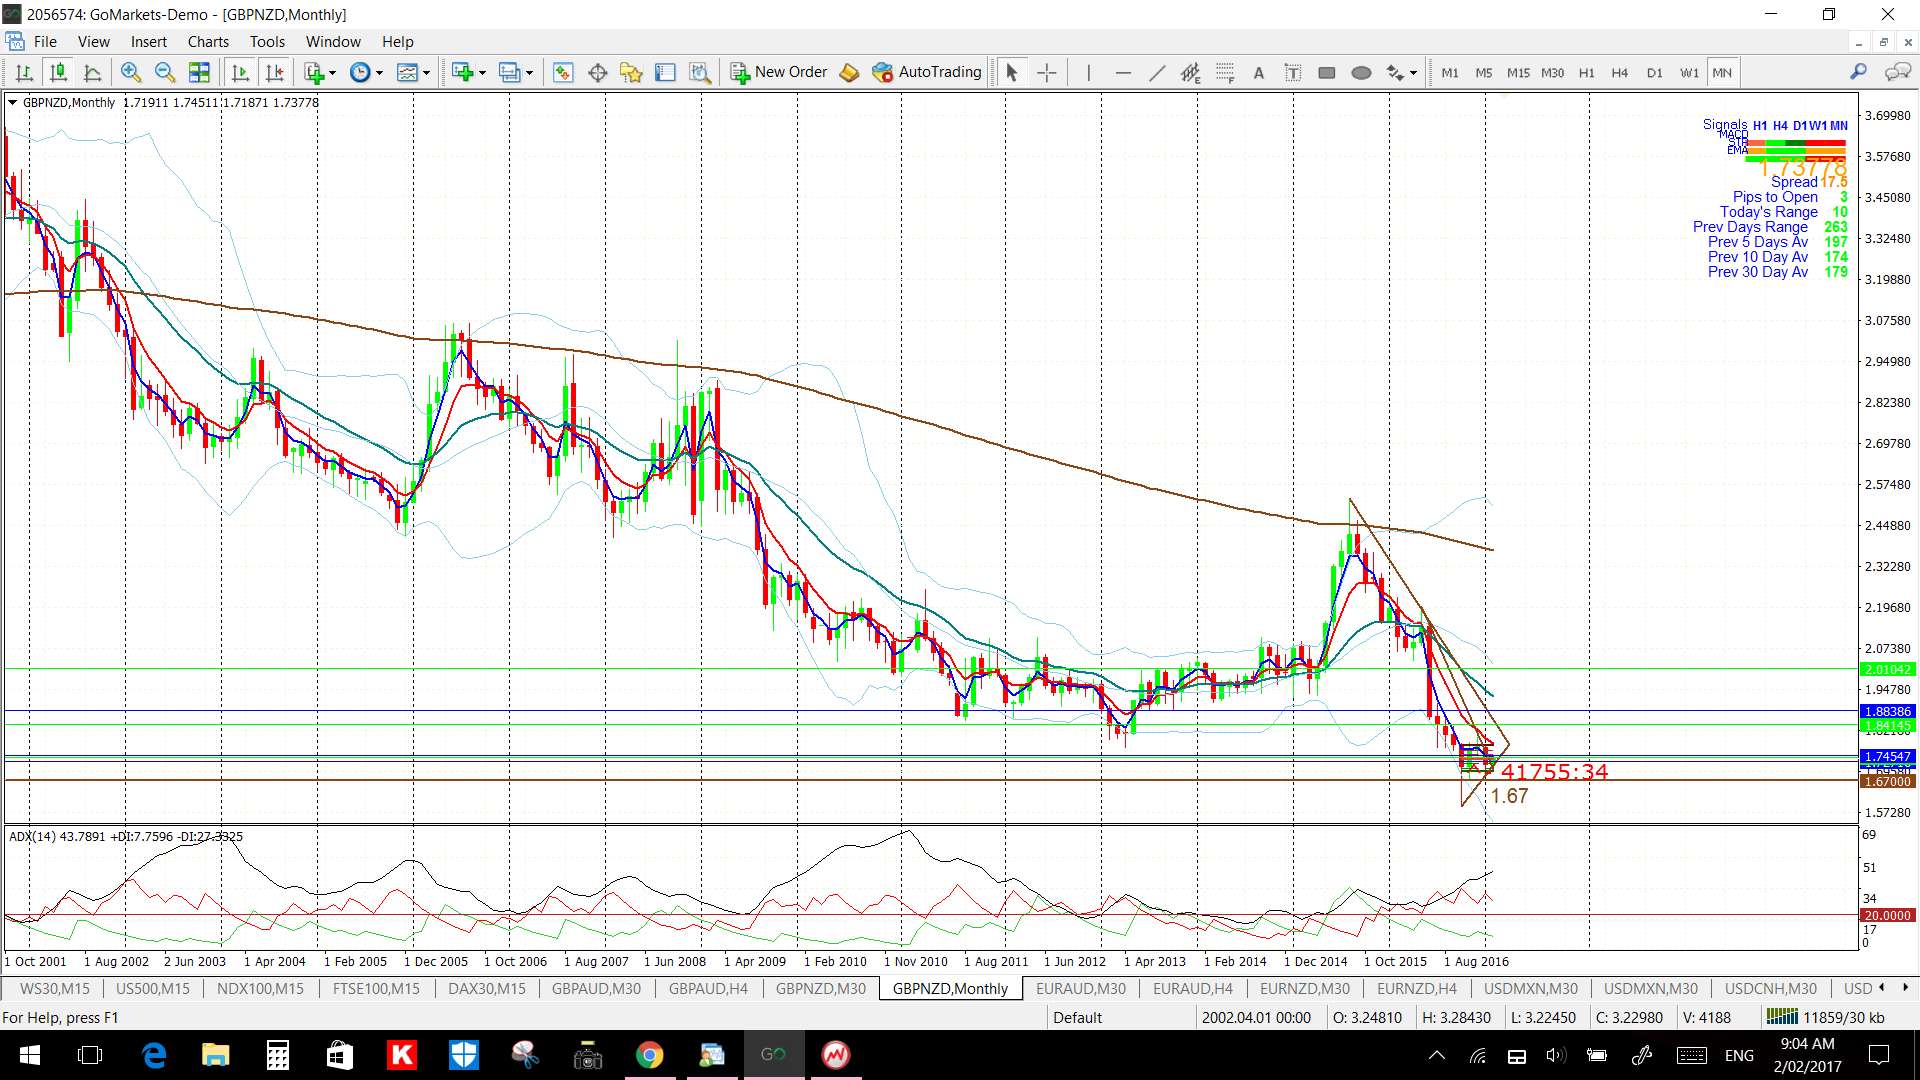
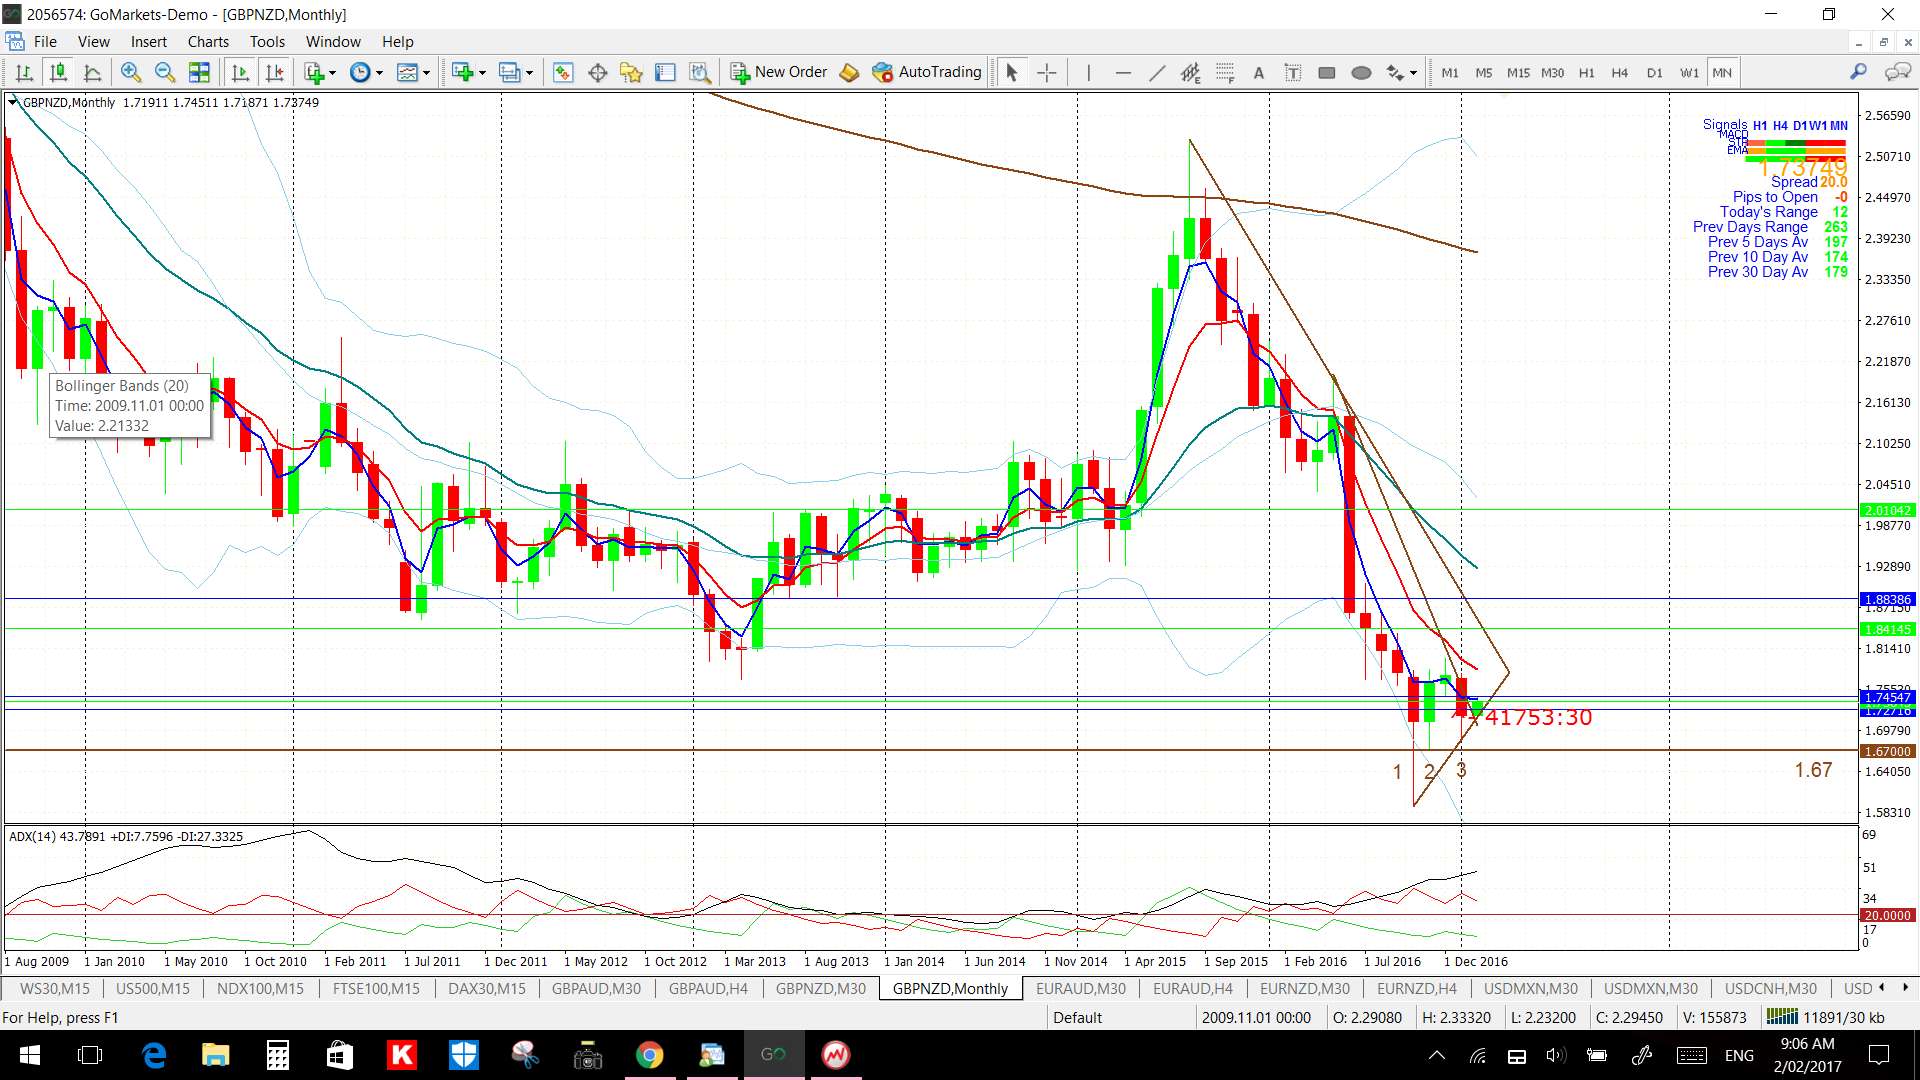
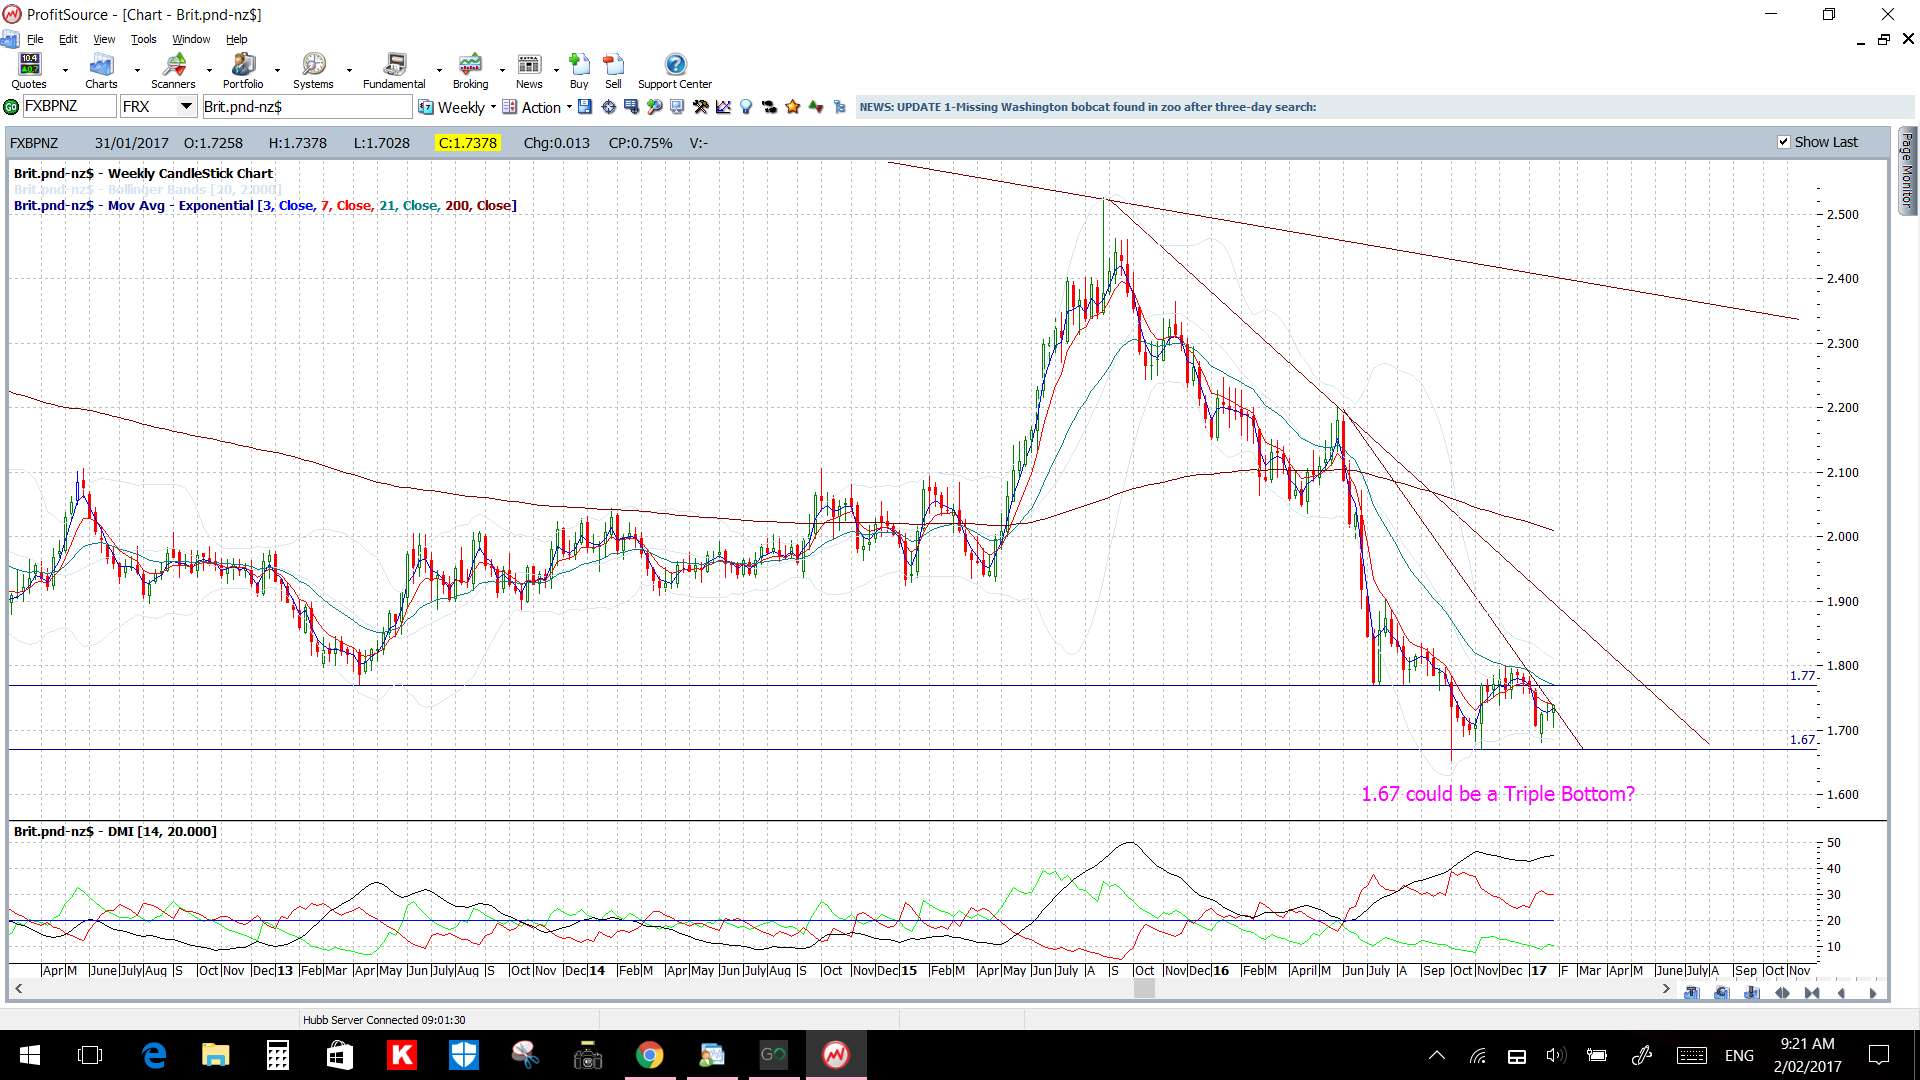
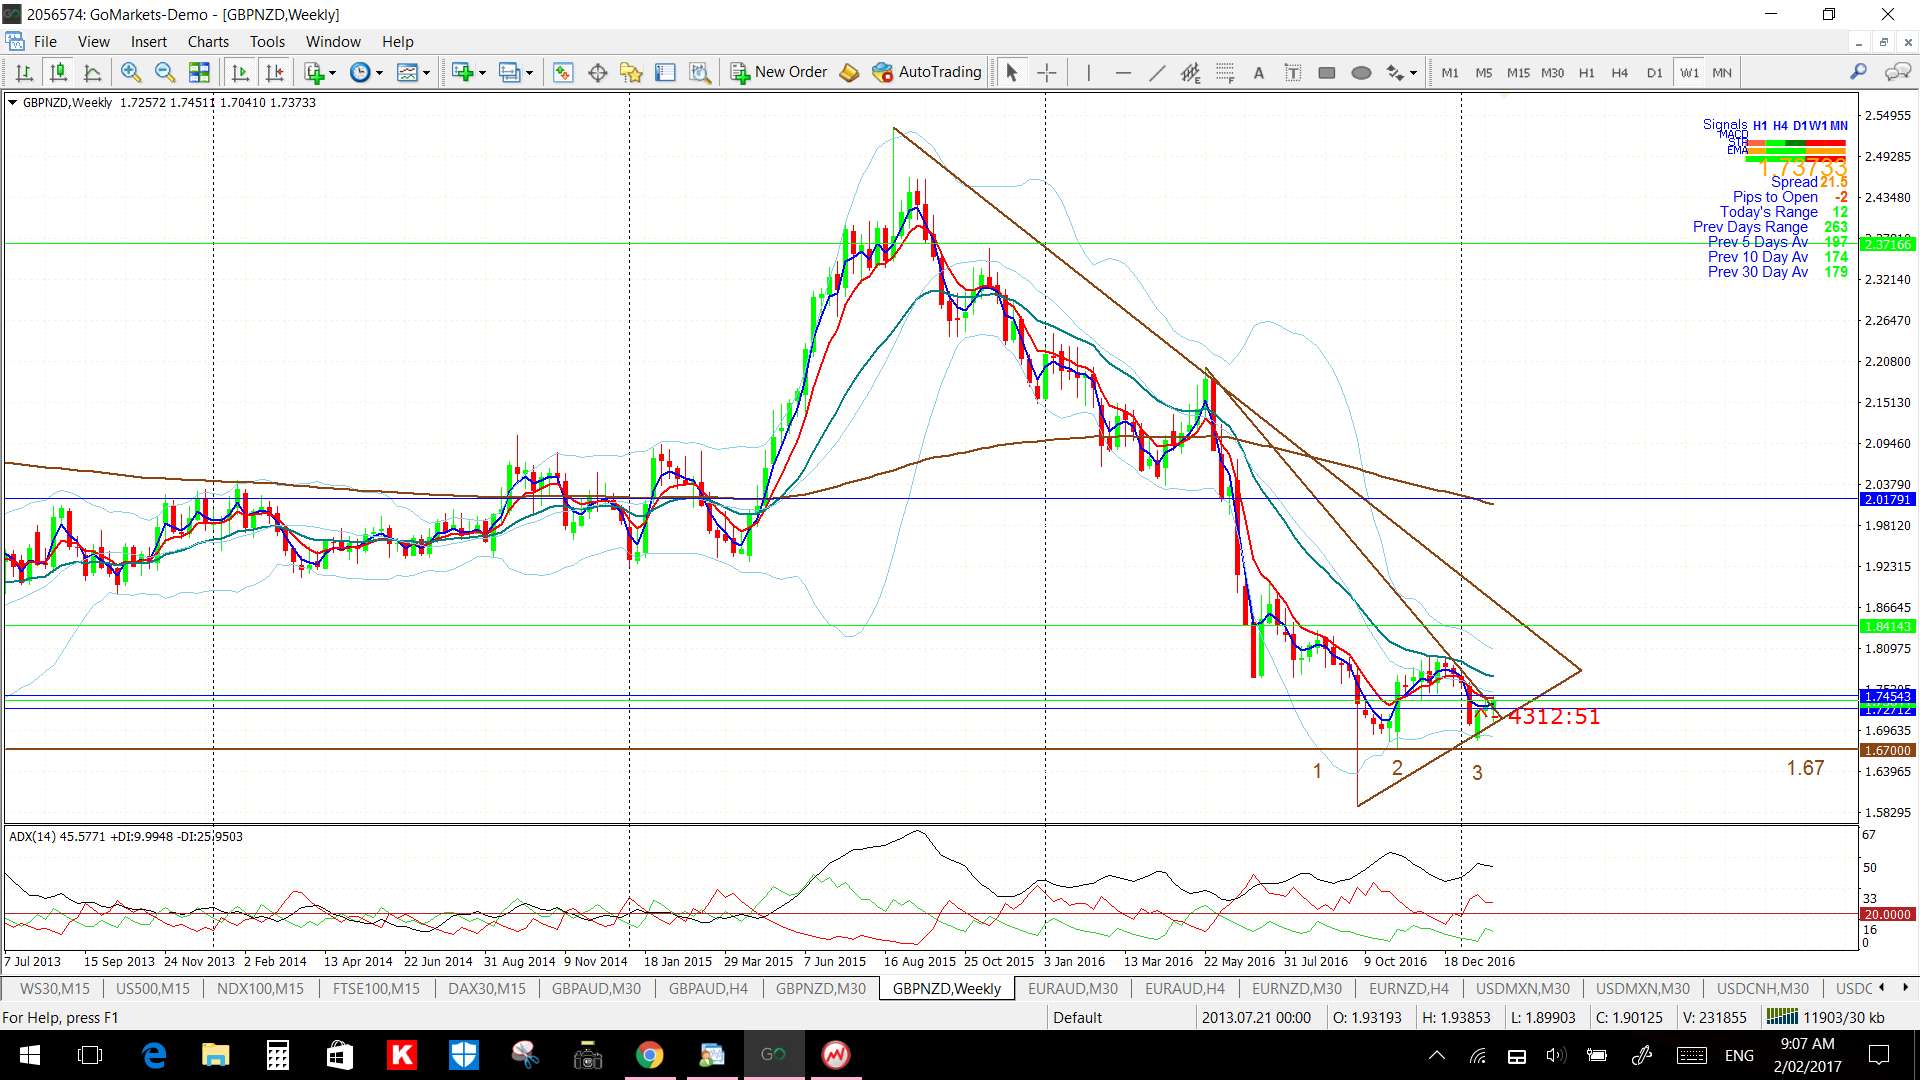
GBP/NZD weekly: the weekly chart shows three different bear trend lines in effect; the most recent of which is currently being tested. Note the ‘Triple Bottom’ forming up above 1.67:
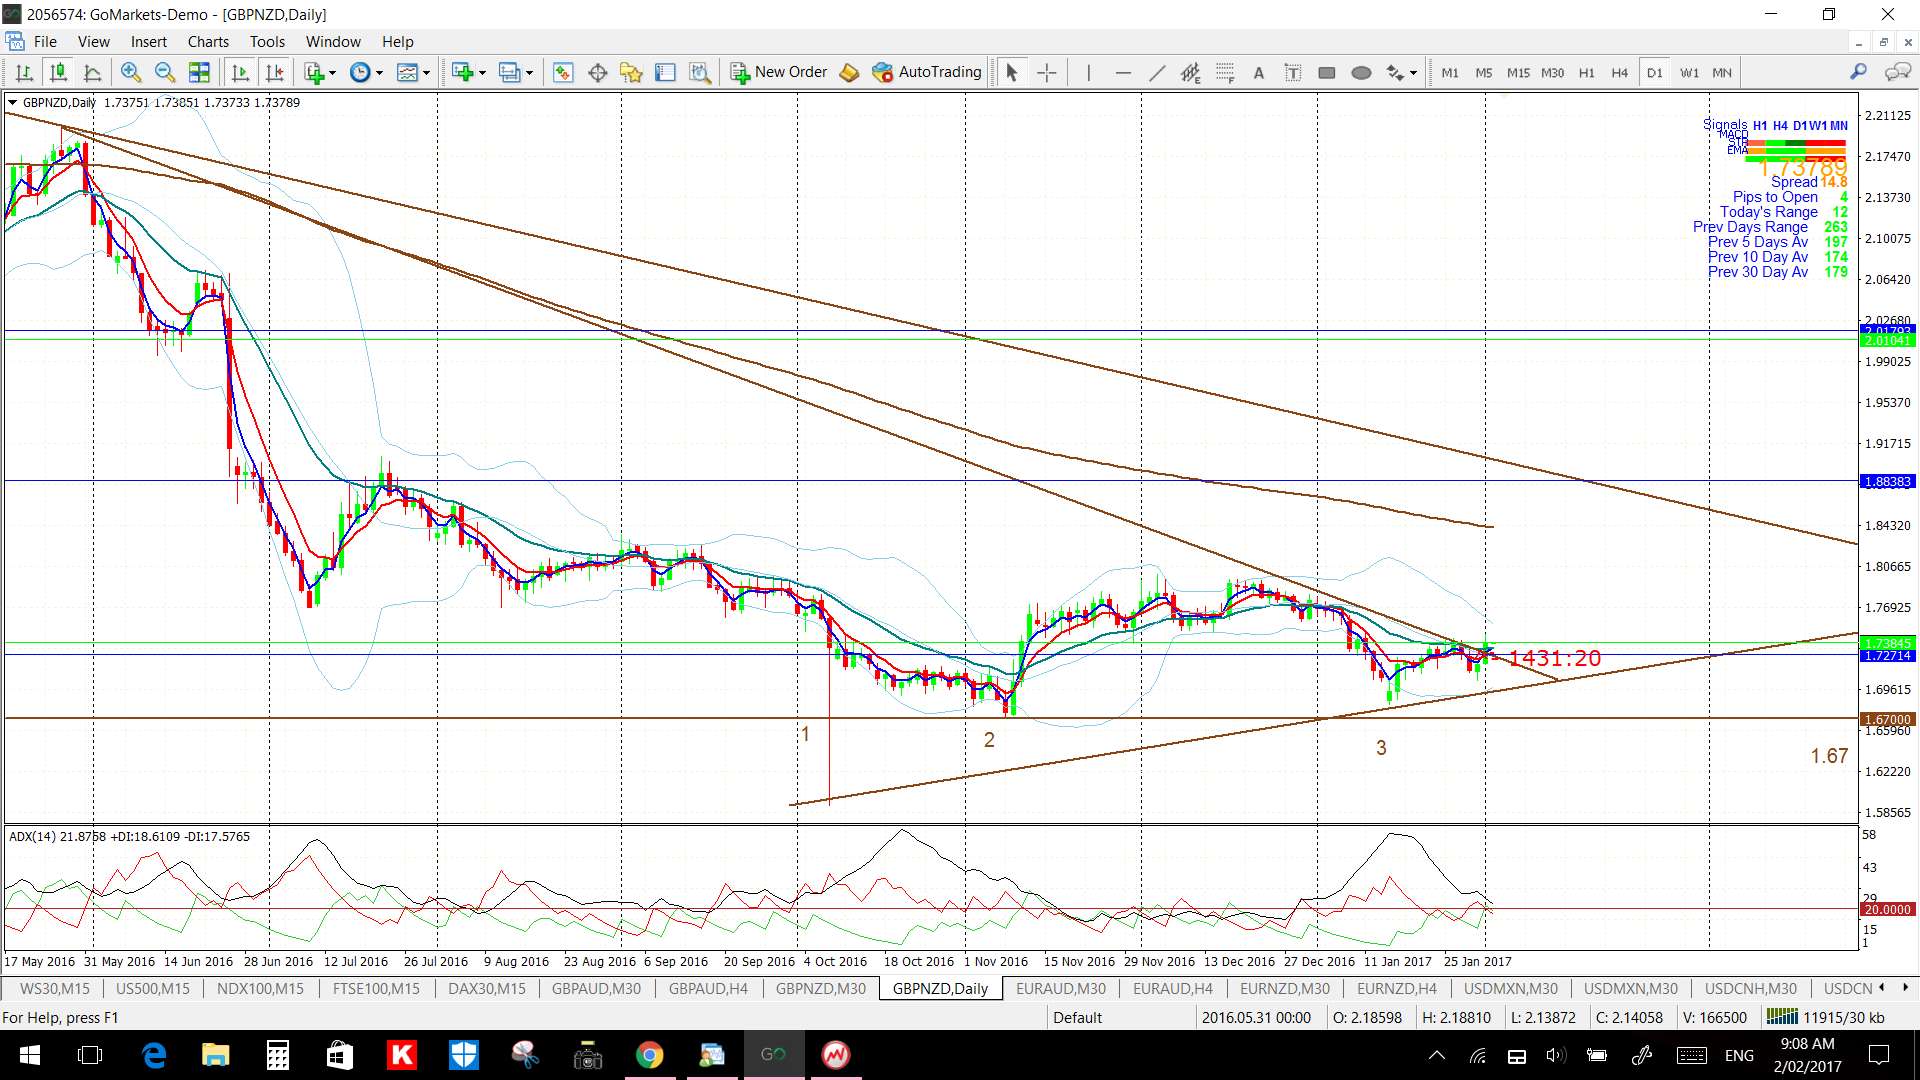
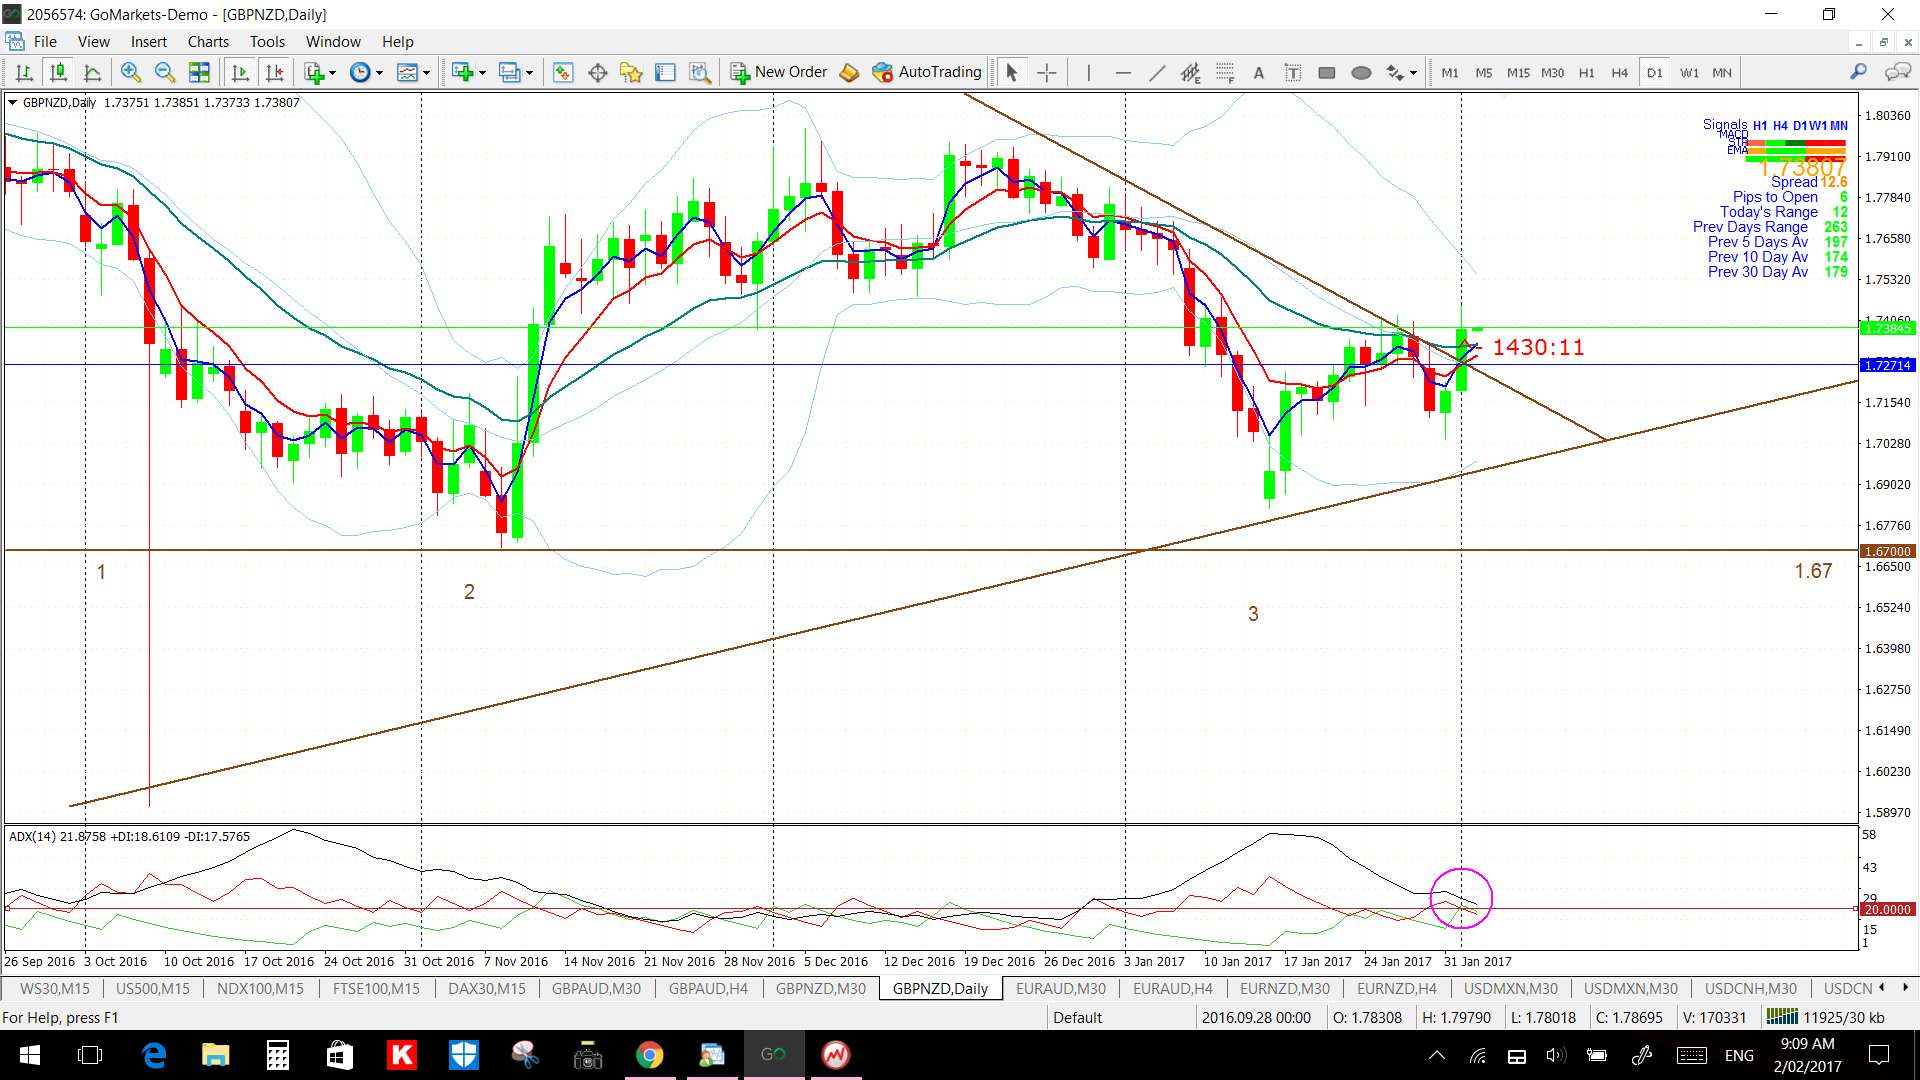
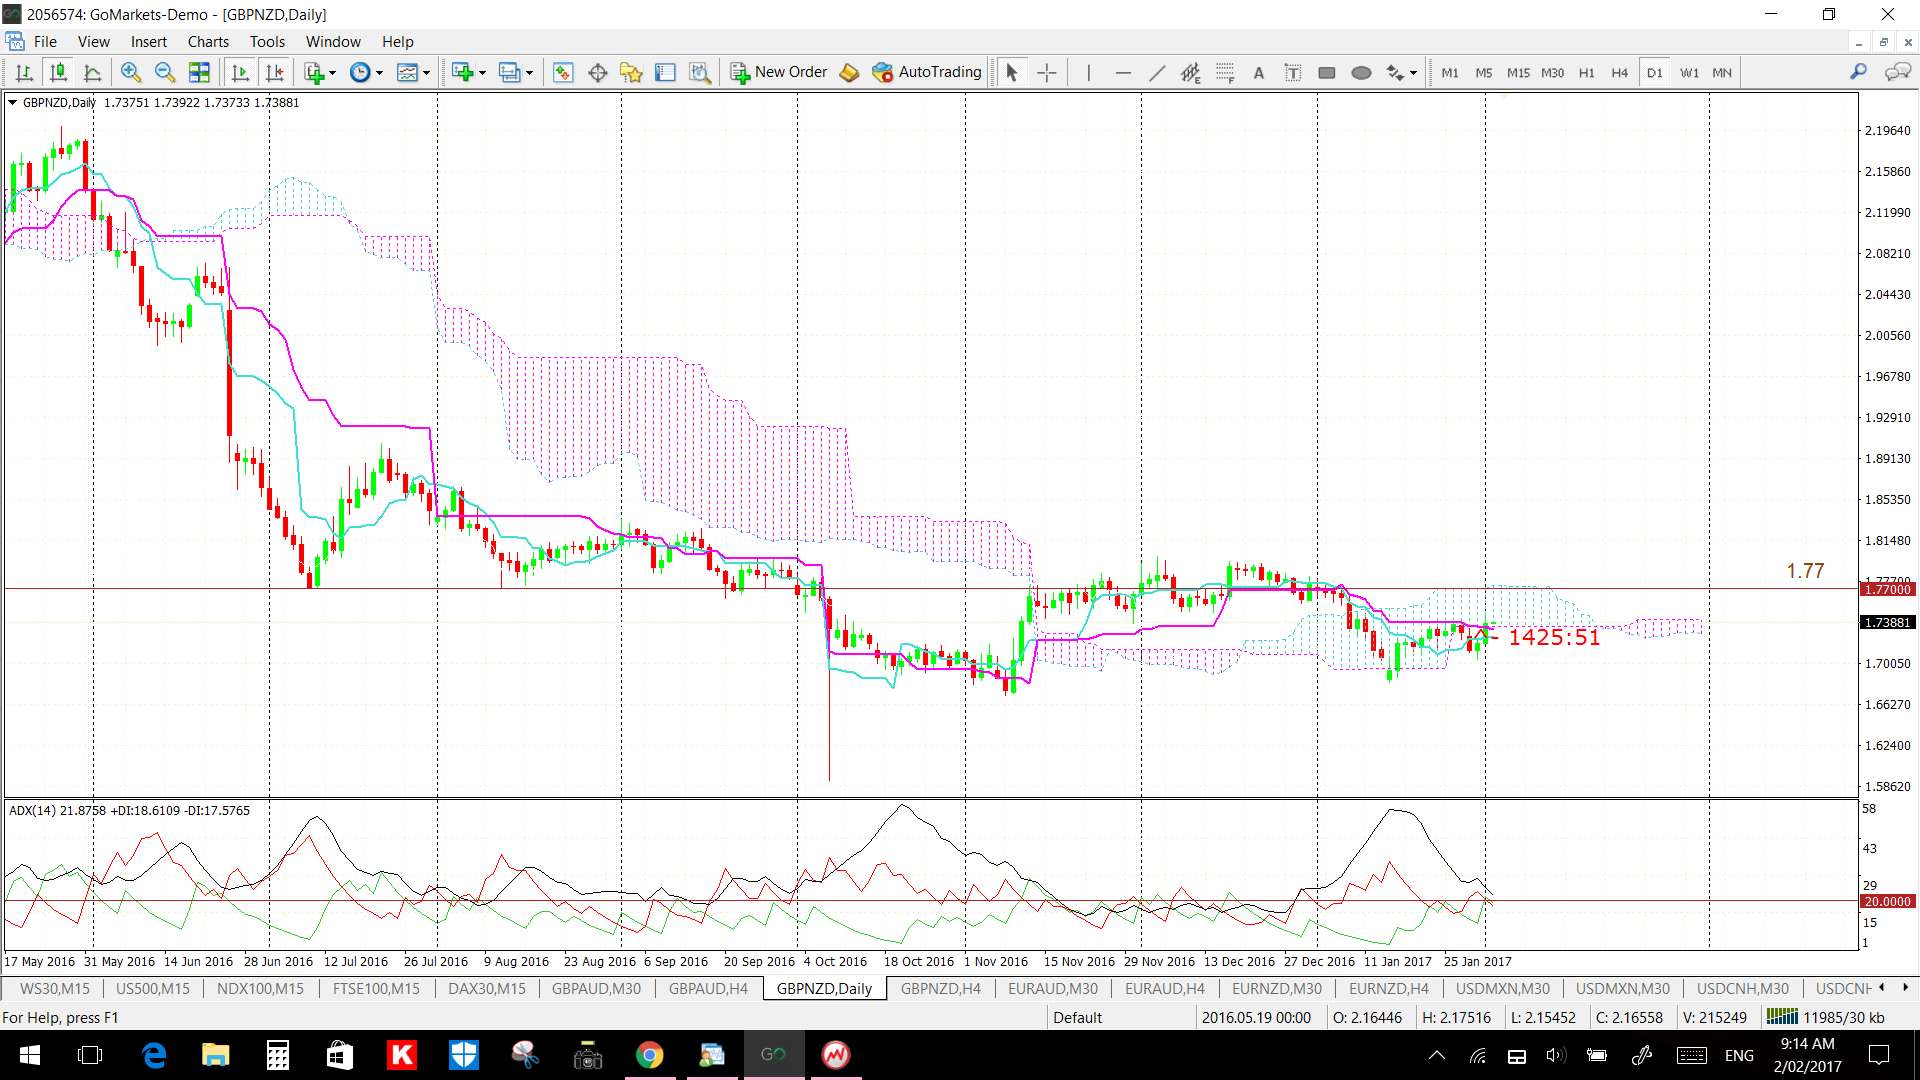
GBP/NZD daily: the daily chart shows that nearest of these bear trend lines was broken today. Watch to see if this trend line remains broken though after the weekly candle closes:
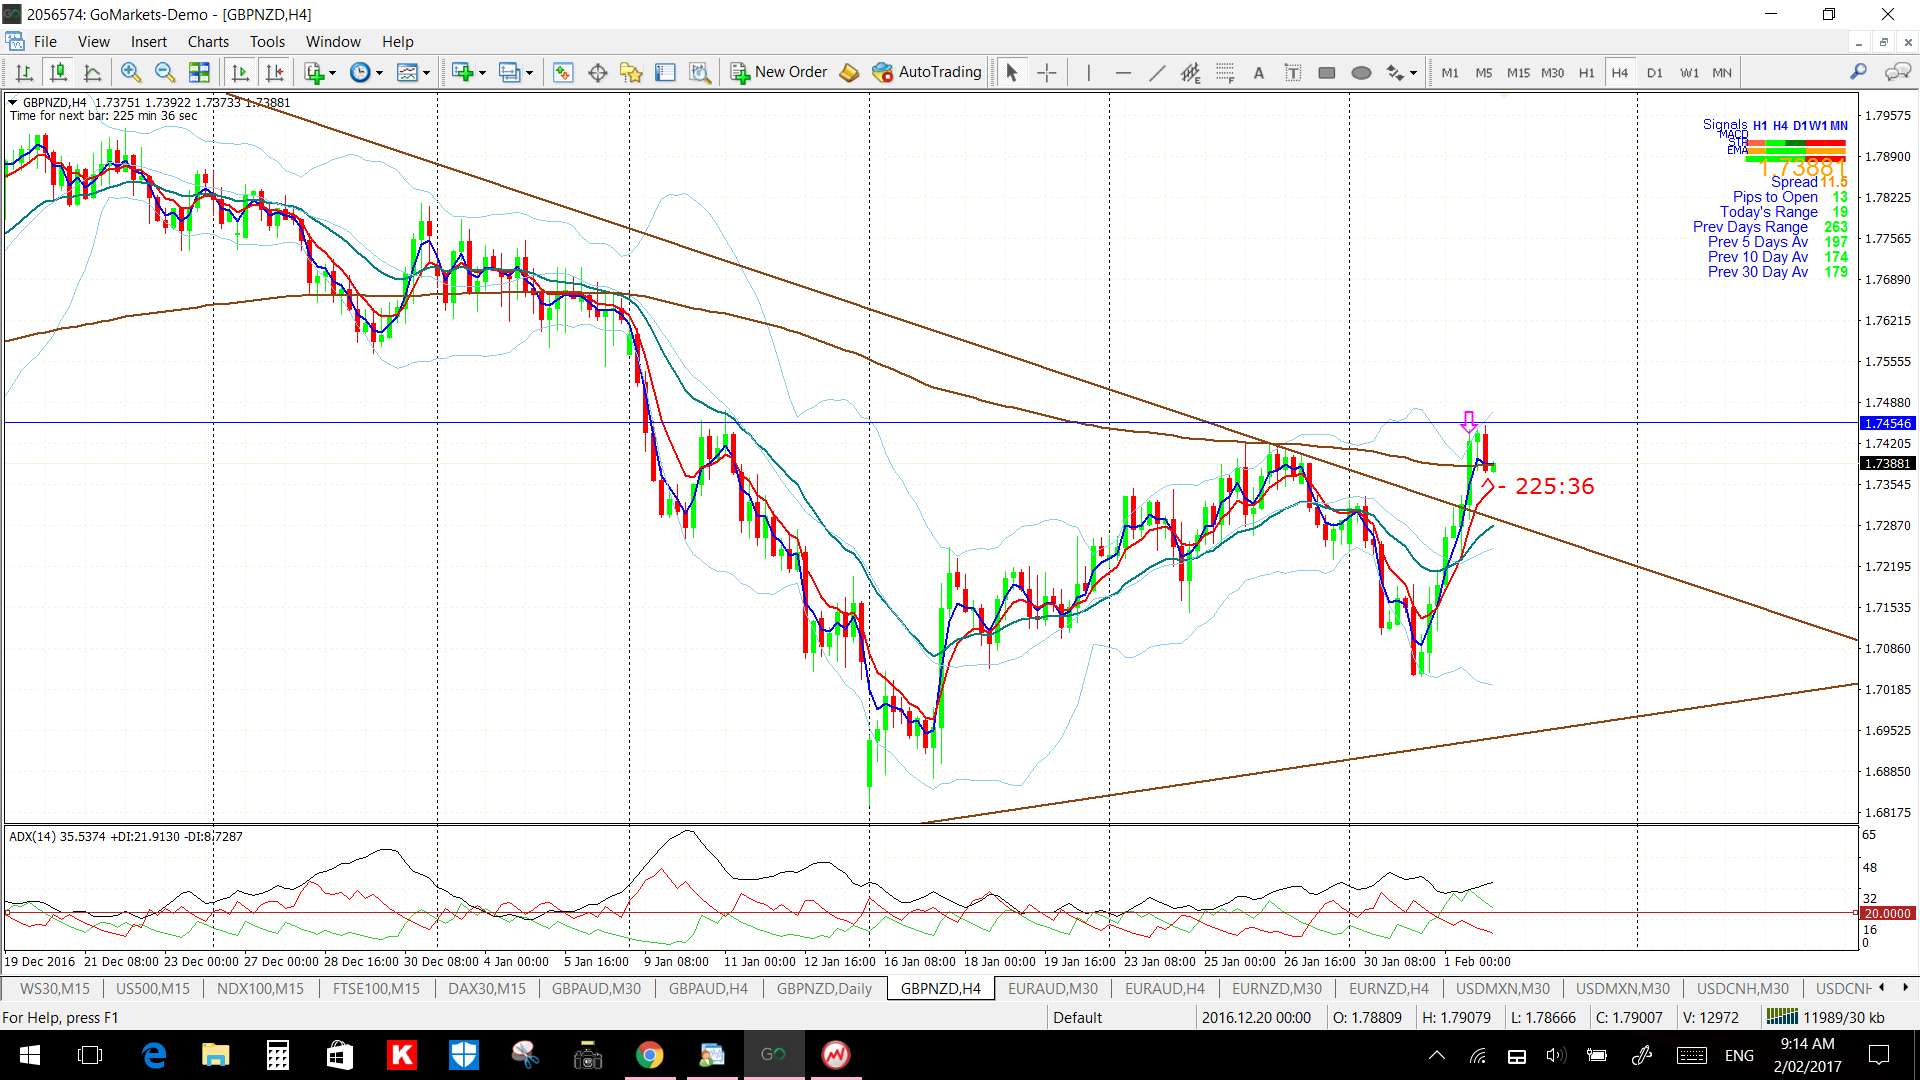
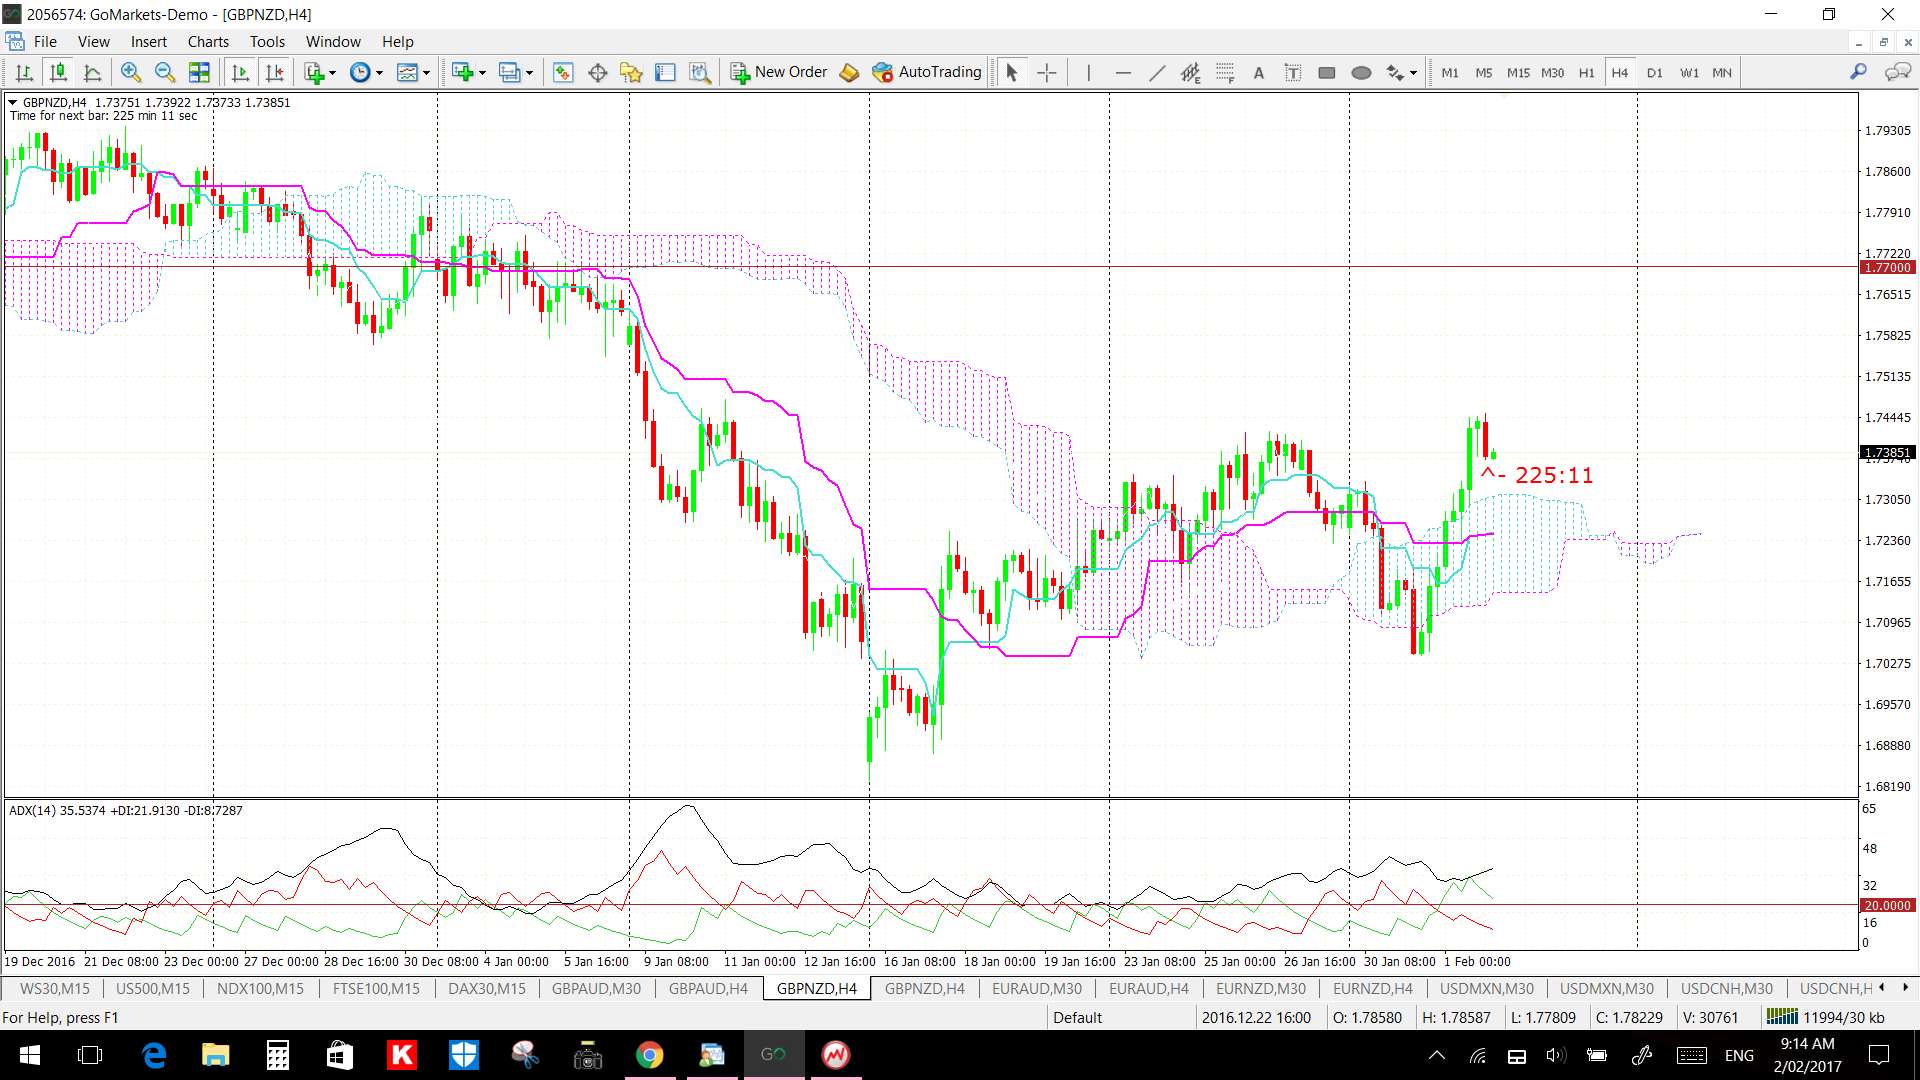
GBP/NZD 4hr: the 4hr chart also shows this trend line break as well as a new TC LONG signal:
GBP/NZD 4hr Cloud: price action is above the 4hr Cloud helping to support the 4hr chart TC LONG signal:
GBP/NZD daily Cloud: However, price action is butting up against the bottom of the daily Cloud and so this may stifle bullish continuation. Note how the top of the daily Cloud resistance zone ties in with the previously noted S/R level of 1.77. Some traders would prefer to wait and see a close and hold above this daily Cloud and 1.77 resistance before being confident of any LONG continuation here:
Summary:
The long-term downtrend on the GBP/NZD since 2001 is showing signs of fatigue. Reversal signals have recently presented in the form of :
- a ‘Triple Bottom’ style base off 1.67.
- a recent break of a bear trend line.
- a new TC 4hr chart LONG signal.
Watch for any continued hold above this broken trend line to support the case for bullish continuation, especially once the weekly candle closes. Resistance lies ahead though in the form of the daily Ichimoku Cloud and previous S/R at 1.77.
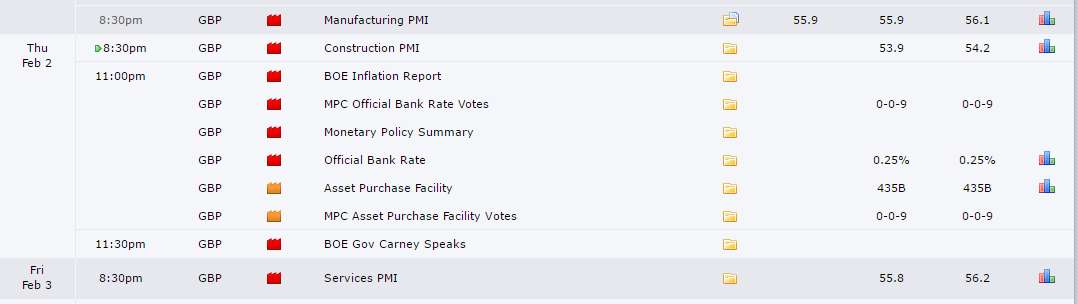
NB: there is a lot GBP news slated for today so watch to see how these items impact price action:
The post GBP/NZD: caught my eye this am ahead of BoE. appeared first on Trade Charting.
The post GBP/NZD: caught my eye this am ahead of BoE. appeared first on www.forextell.com.