Last week: There were some decent trend line breakouts last week but price action on many FX pairs remain in consolidation-style action near key S/R levels. The four major US stocks indices have all printed bearish-reversal monthly candles, as well as bearish weekly candles, so some hesitation, at a minimum, is evident in that space as well. There is a lot of scheduled data for next week with three Central Banks reporting, as well as NFP, but unscheduled news dealing with the US tariff situation will need to be monitored as well.

Trend line breakouts and TC signals: there were a few trend line breakout trades last week and these were updated on my site here, here,here and here:
- NZD/USD: 90 pips and a TC signal for 60 pips and 2 R.
- Gold: 200 pips and a TC signal for 100 pips & 4 R.
- EUR/USD: 120 pips and a TC signal for 45 pips and 4 R.
- AUD/USD: 90 pips and a TC signal for 75 pips and 5 R.
- AUD/JPY: 90 pips and a TC signal for 70 pips and 2 R.
- GBP/USD: 120 pips and a TC signal for 120 pips and 5 R.
- GBP/JPY: 380 pips and a TC signal for 200 pips and 8 R.
- Oil: 280 pips.
- EUR/AUD: 100 pips on Friday.
- EUR/NZD: 100 pips on Friday.
Next week:
- FX Indices: The US$ index closed with an indecision-style Doji for the week and an update on the FX indices can be found through this link. The US$ dipped on Trump’s tariff announcement and a war of words is developing so watch for any further impact from this issue.
- TC Upgrade: I am upgrading my website over coming weeks so please be patient throughout this process in case access is impacted at all. My blog site started rather humbly as a method of distraction for me back in 2011 when I was undergoing chemotherapy. During that time it has evolved to be a more professional site where I post charts and detailed measured analysis on numerous trading instruments for free and on a very regular basis. Please keep this in mind when updates about website changes are released.
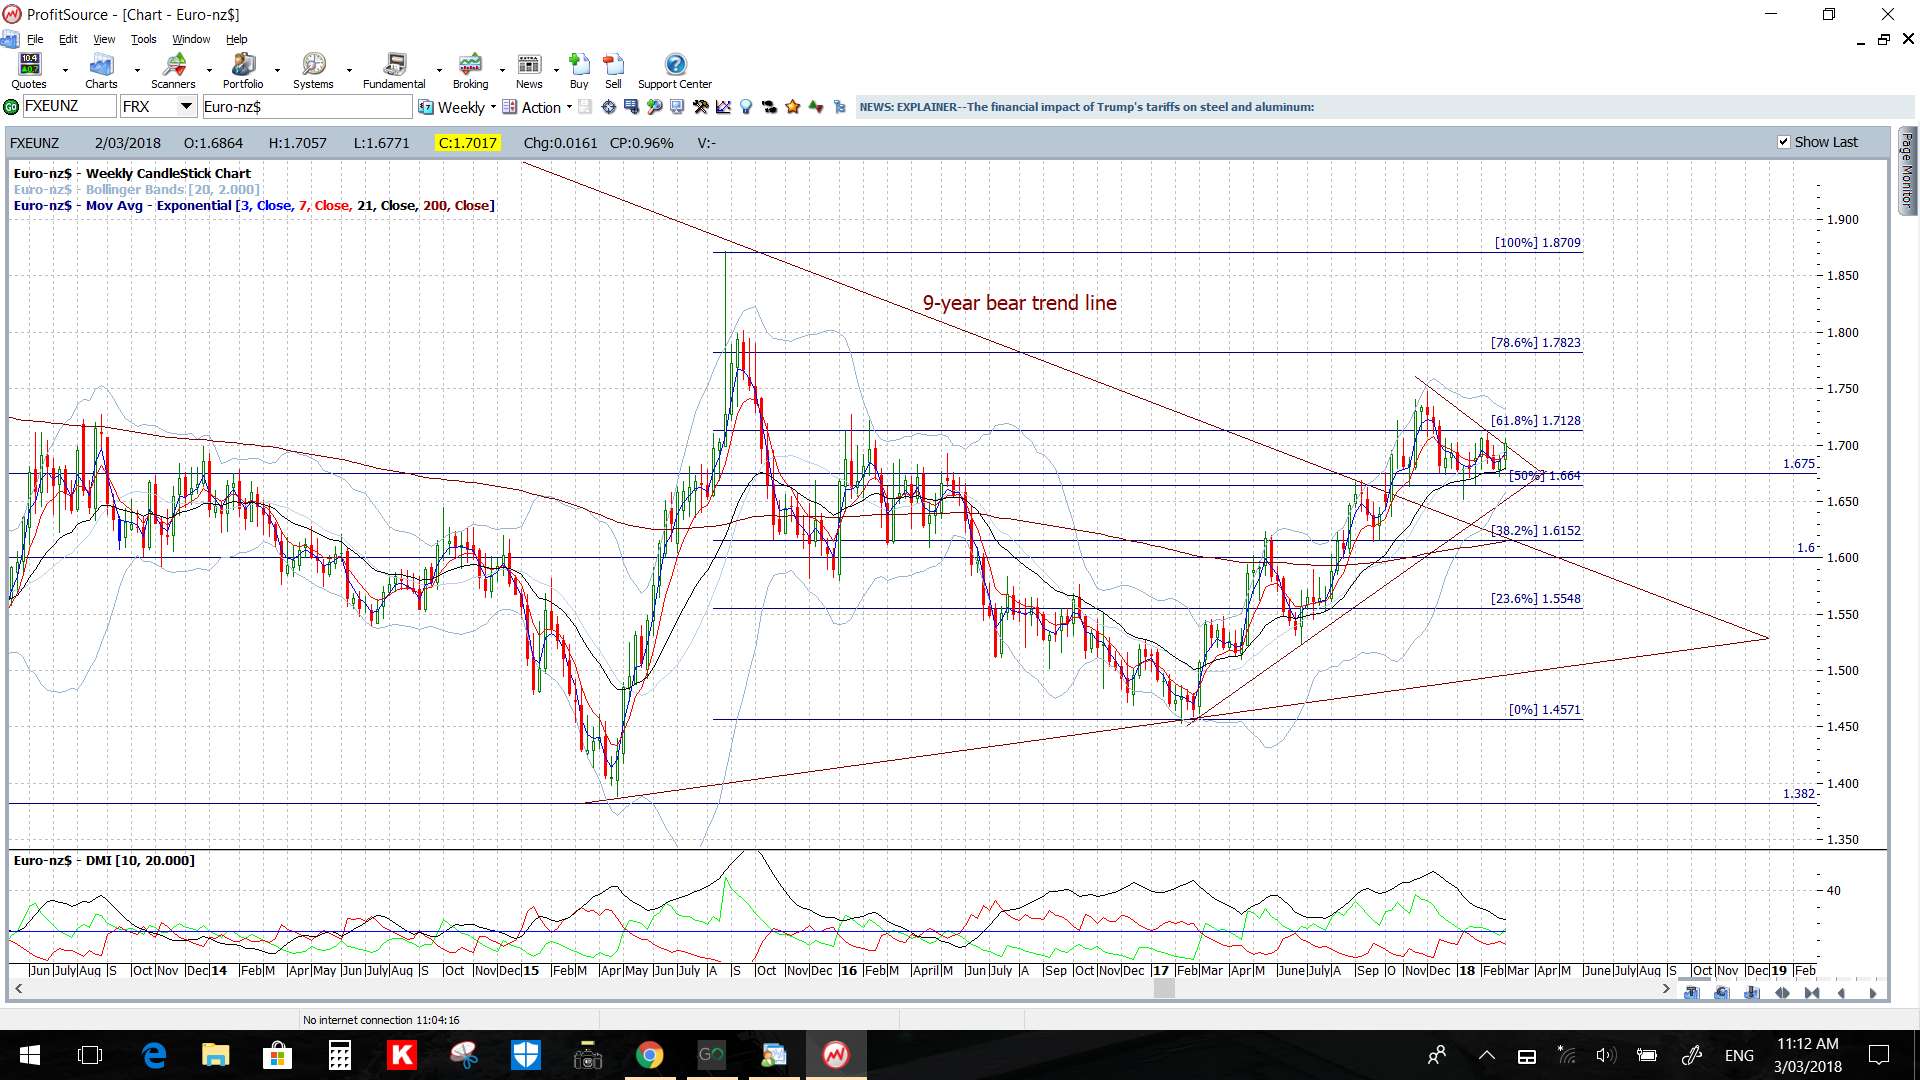
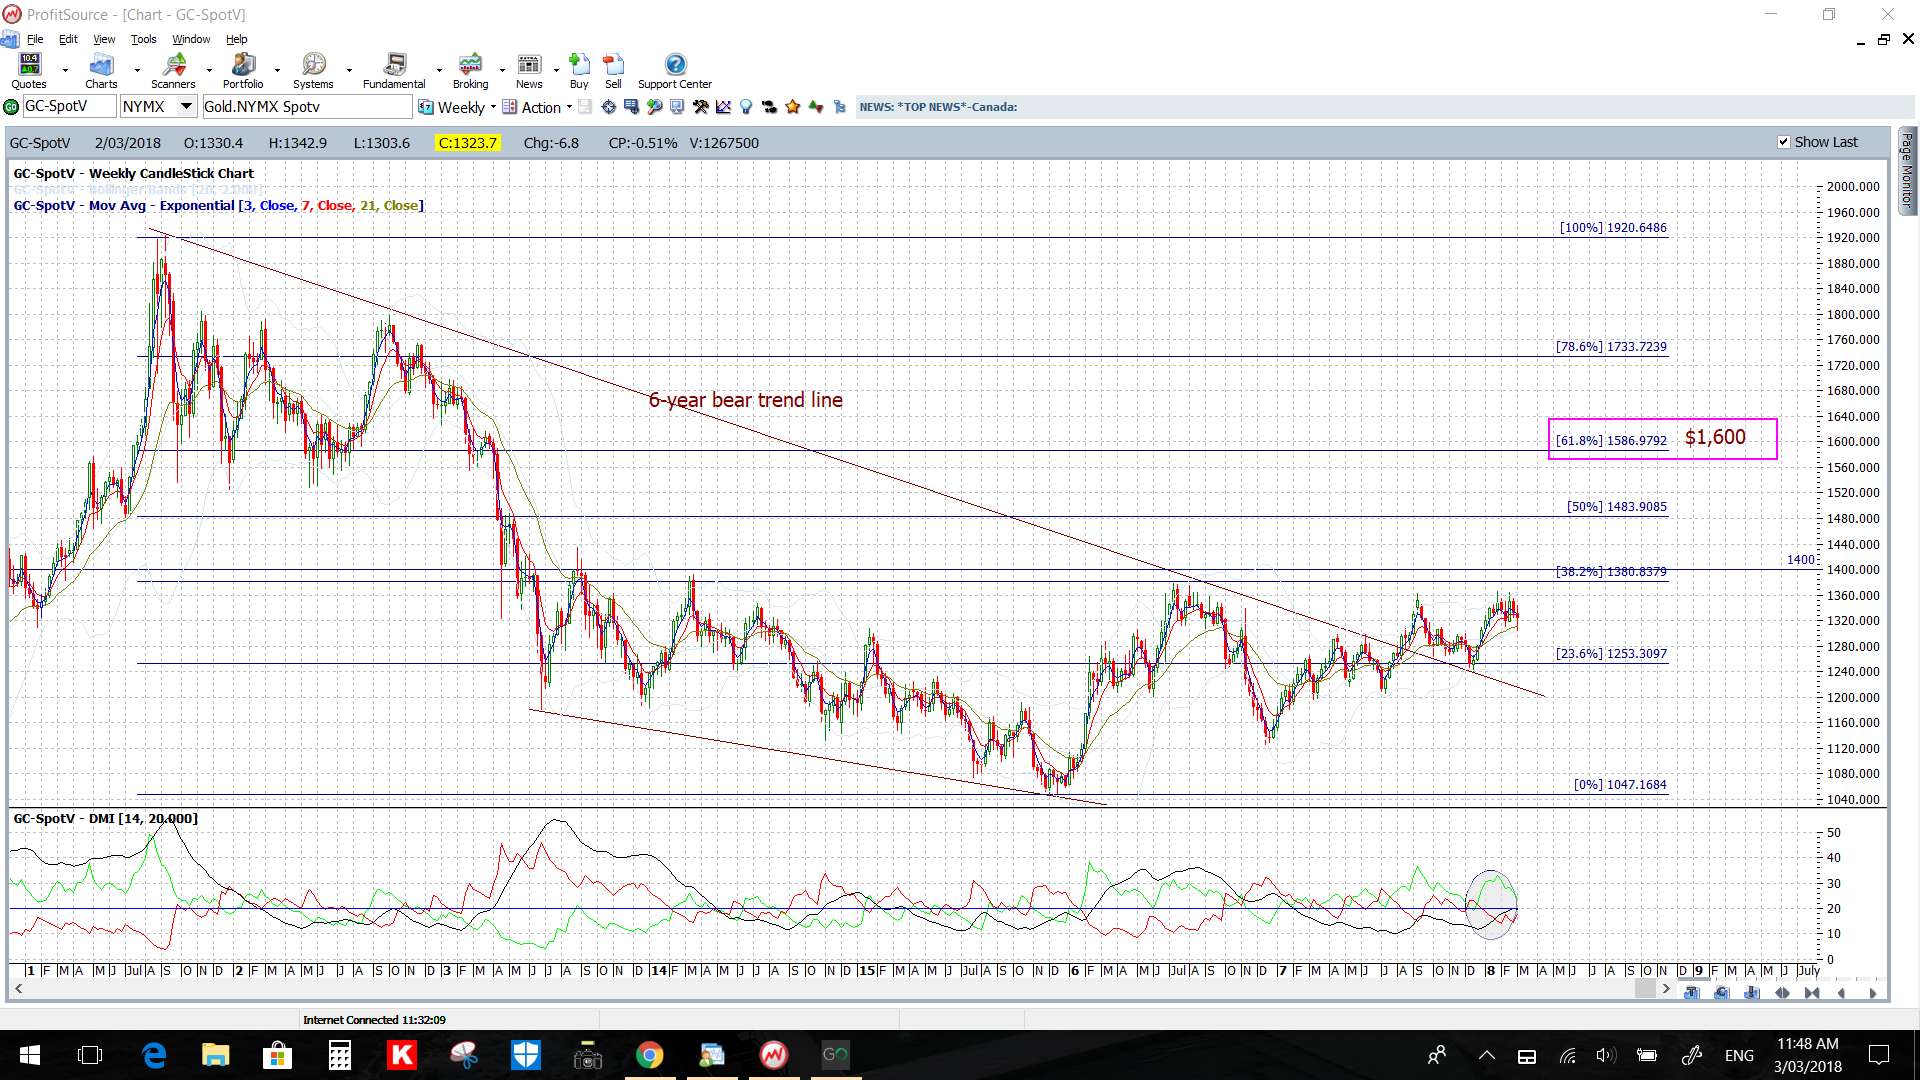
- Major S/R levels: a number of FX pairs continue to consolidate near long-term major S/R levels so watch out for any new make or breakaction at these regions: EUR/USD (1.260), EUR/JPY (135), AUD/USD (0.80), NZD/USD (0.73), GBP/USD (1.40), GBP/NZD (1.90), Gold ($1,400) and BTC/USD ($10,000).
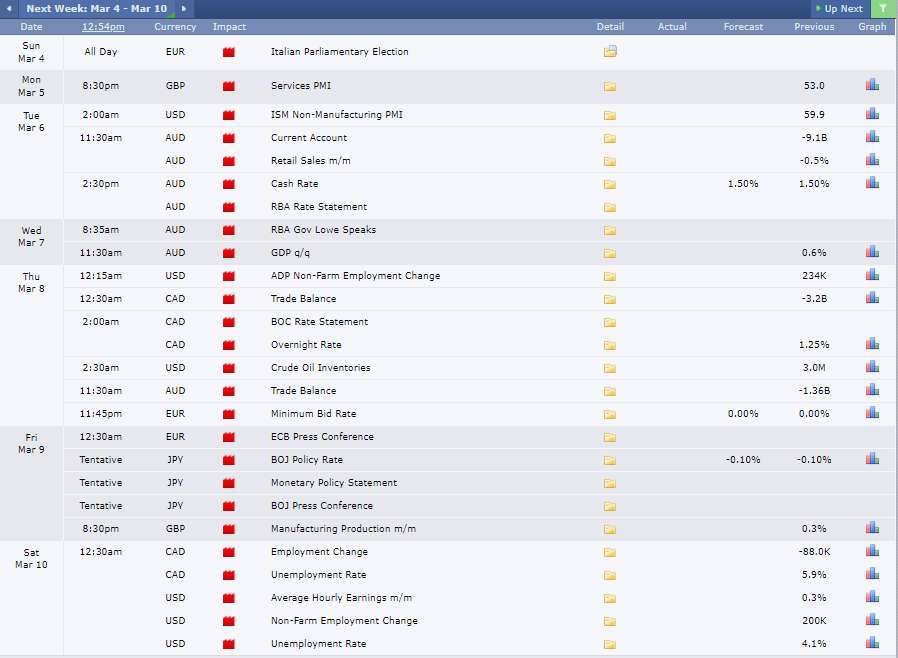
- Central Banks: three Central Banks report interest rate updates: RBA (AUD), ECB (EUR) and BoJ (JPY).
- Italian Parliamentary Elections: watch out at market open for any potential impact on the Euro following the w/e Italian Parliamentary Elections.
- US Stocks: the four major US stock indices printed bearish-reversal monthly candles for February but are holding above support trend lines for now. A review of the S&P500, DJIA, NASDAQ and Russell-2000 can be found through the following link.
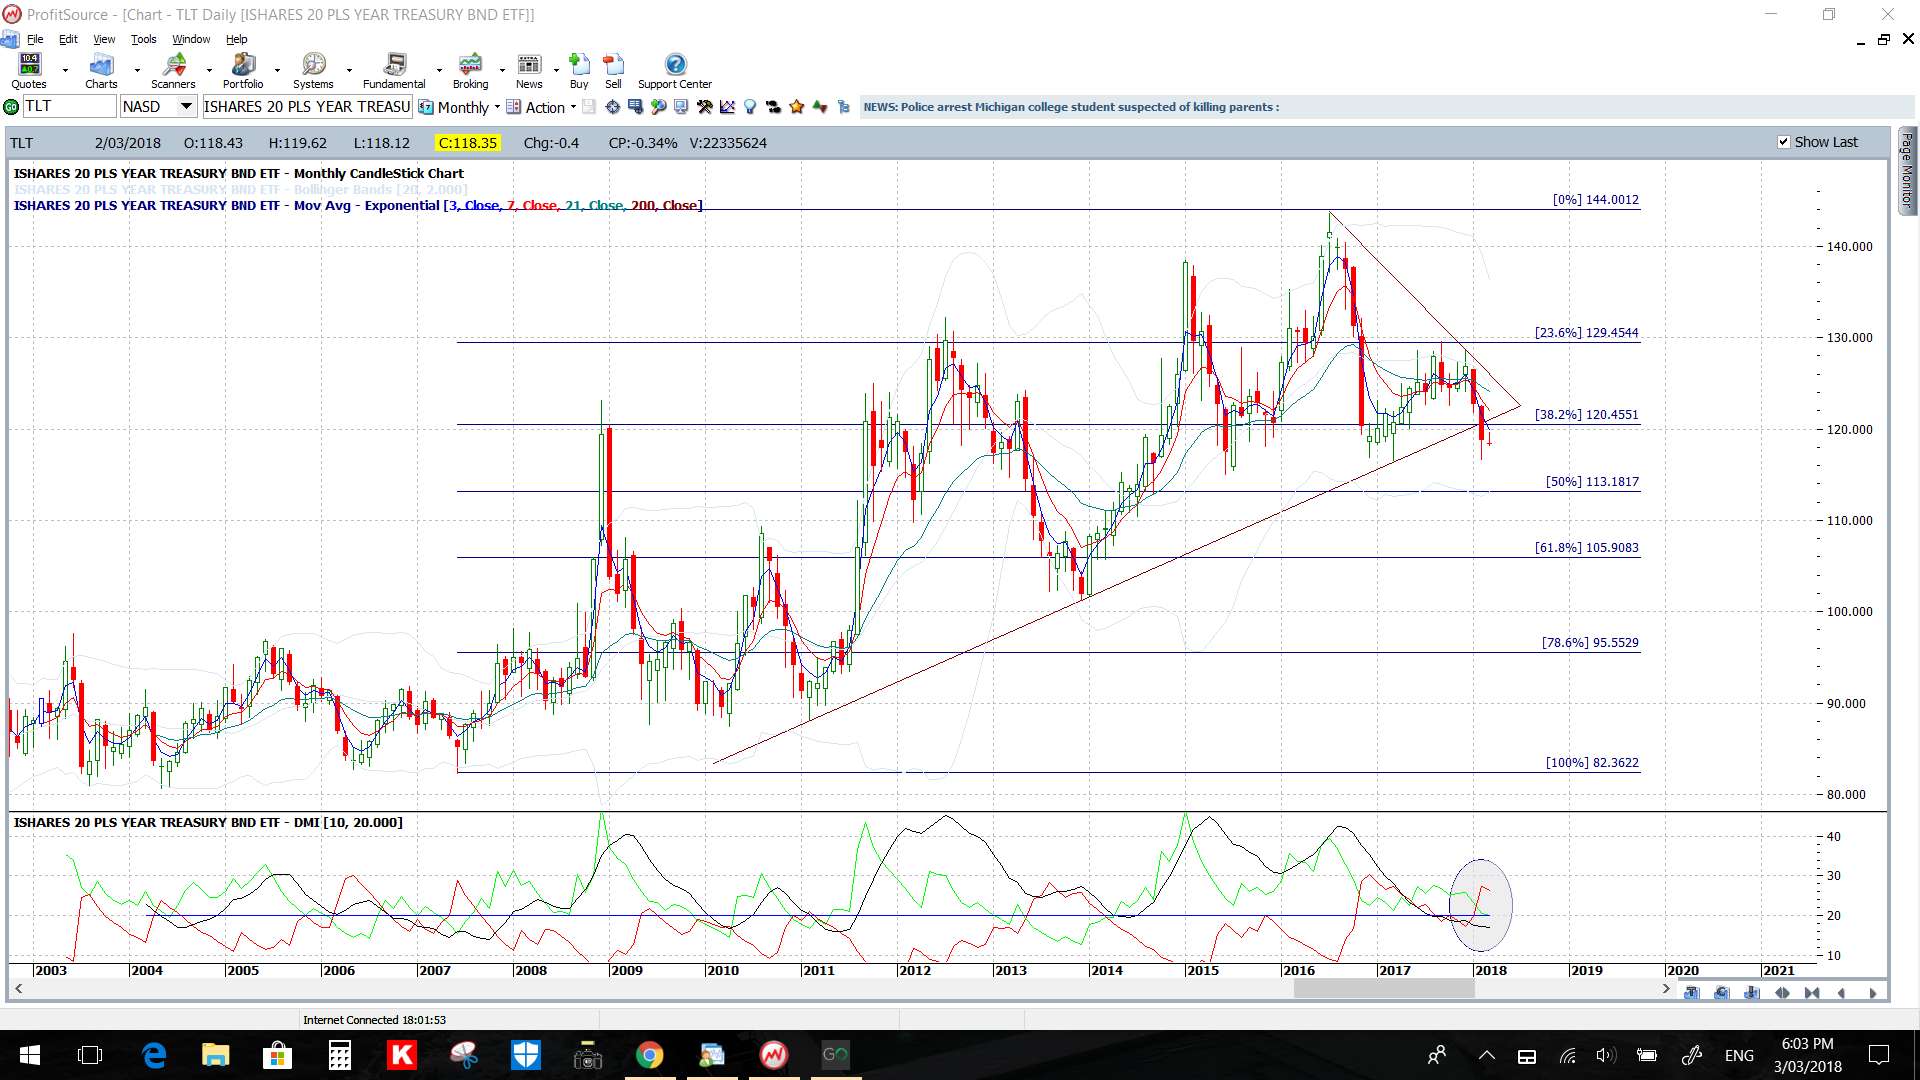
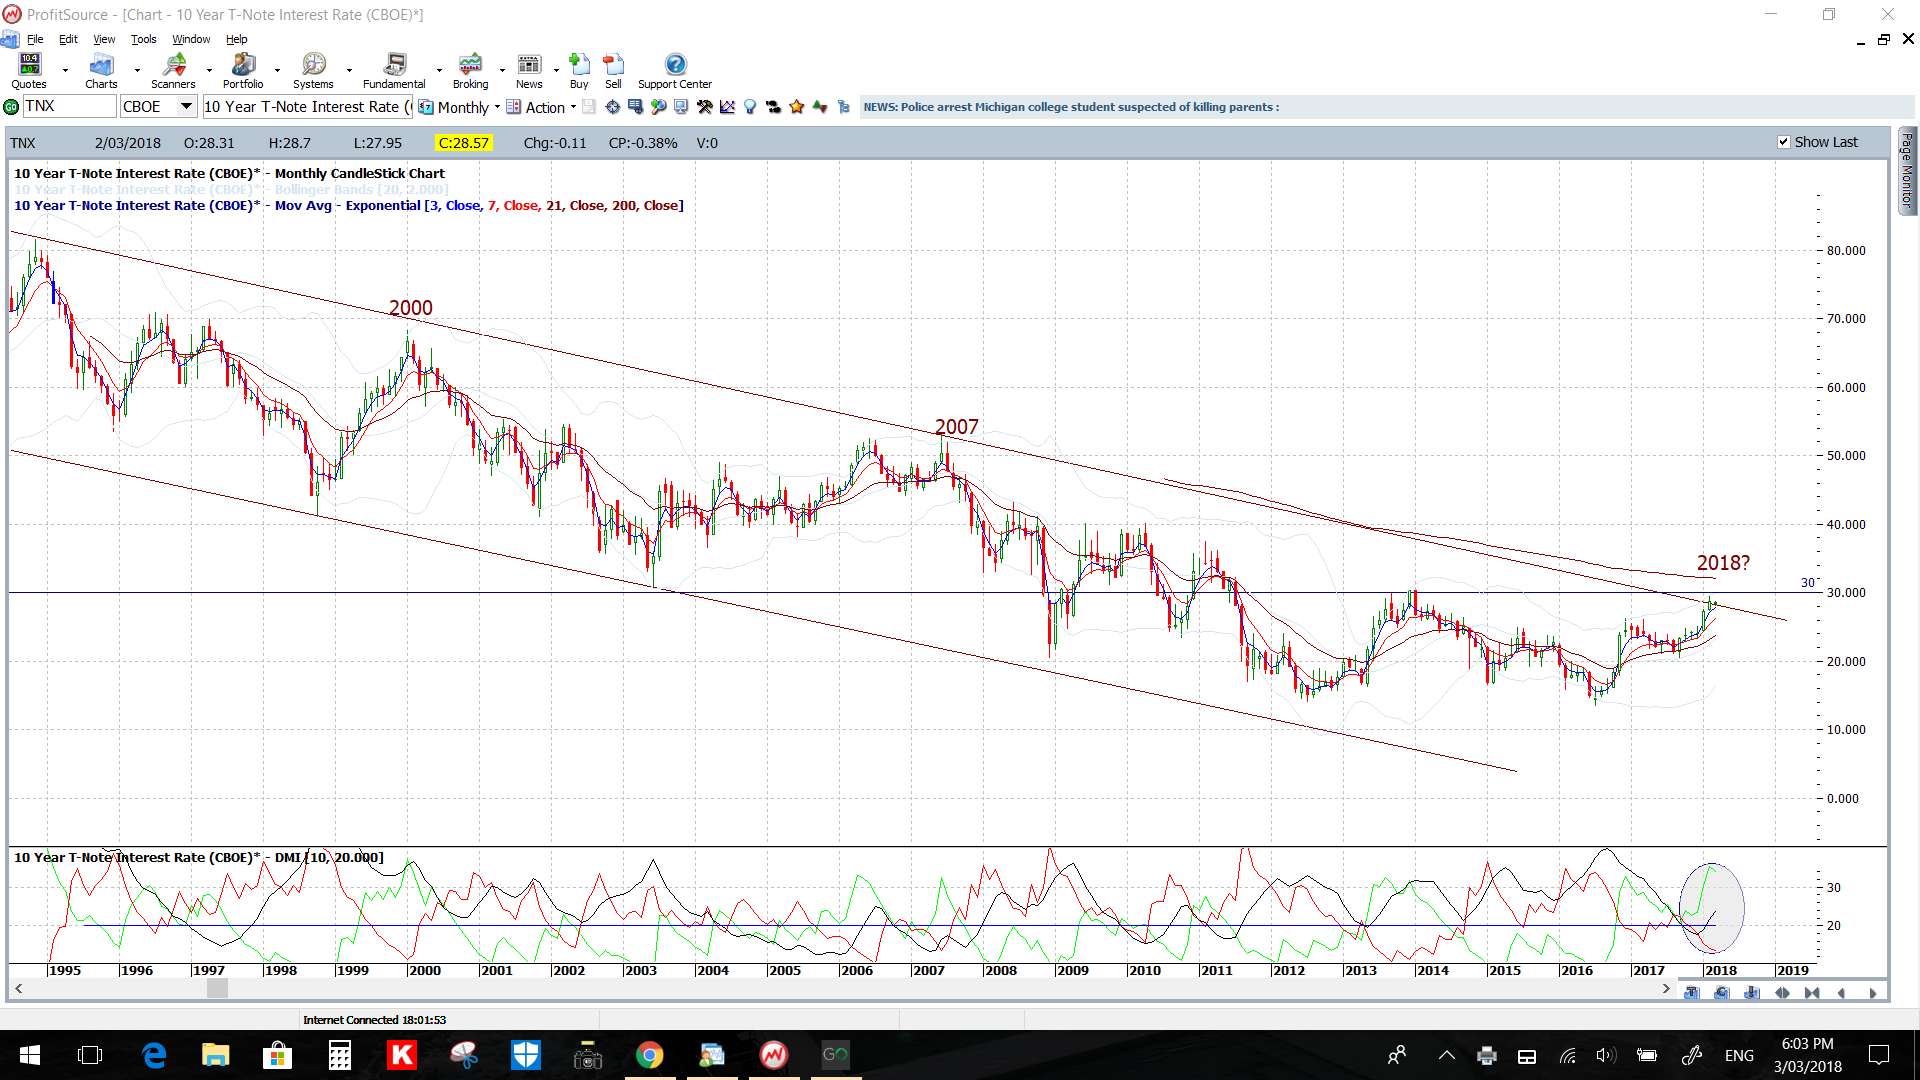
- Bonds and Yields: Both have made a dent on long-term trend lines but watch for any new make or break at these levels.
TLT monthly:
TNX monthly:
- Bitcoin: continues to hold above various support levels and carving out greater credibility. A detailed charting update can be found through this link.
Calendar: there is quite a bit of data with rate updates from the RBA, ECB and BoJ as well as NFP.
Forex:
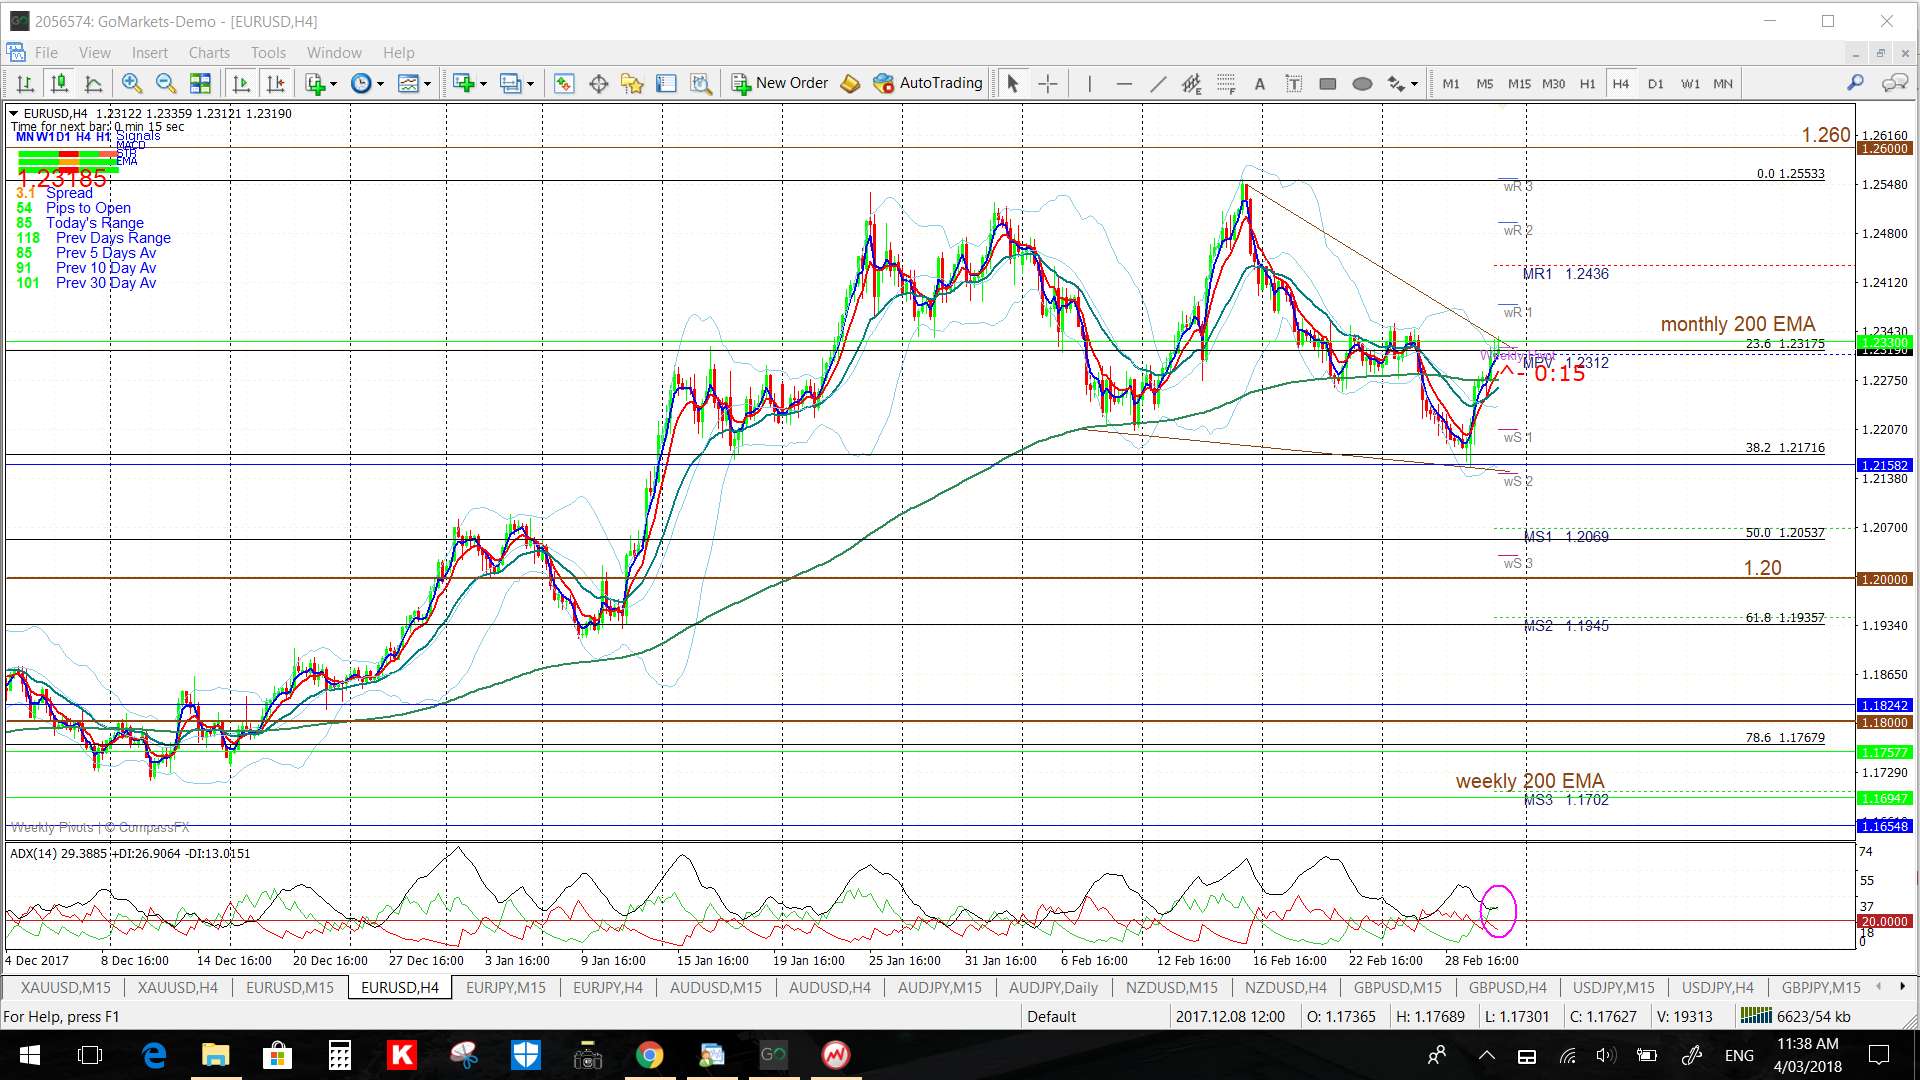
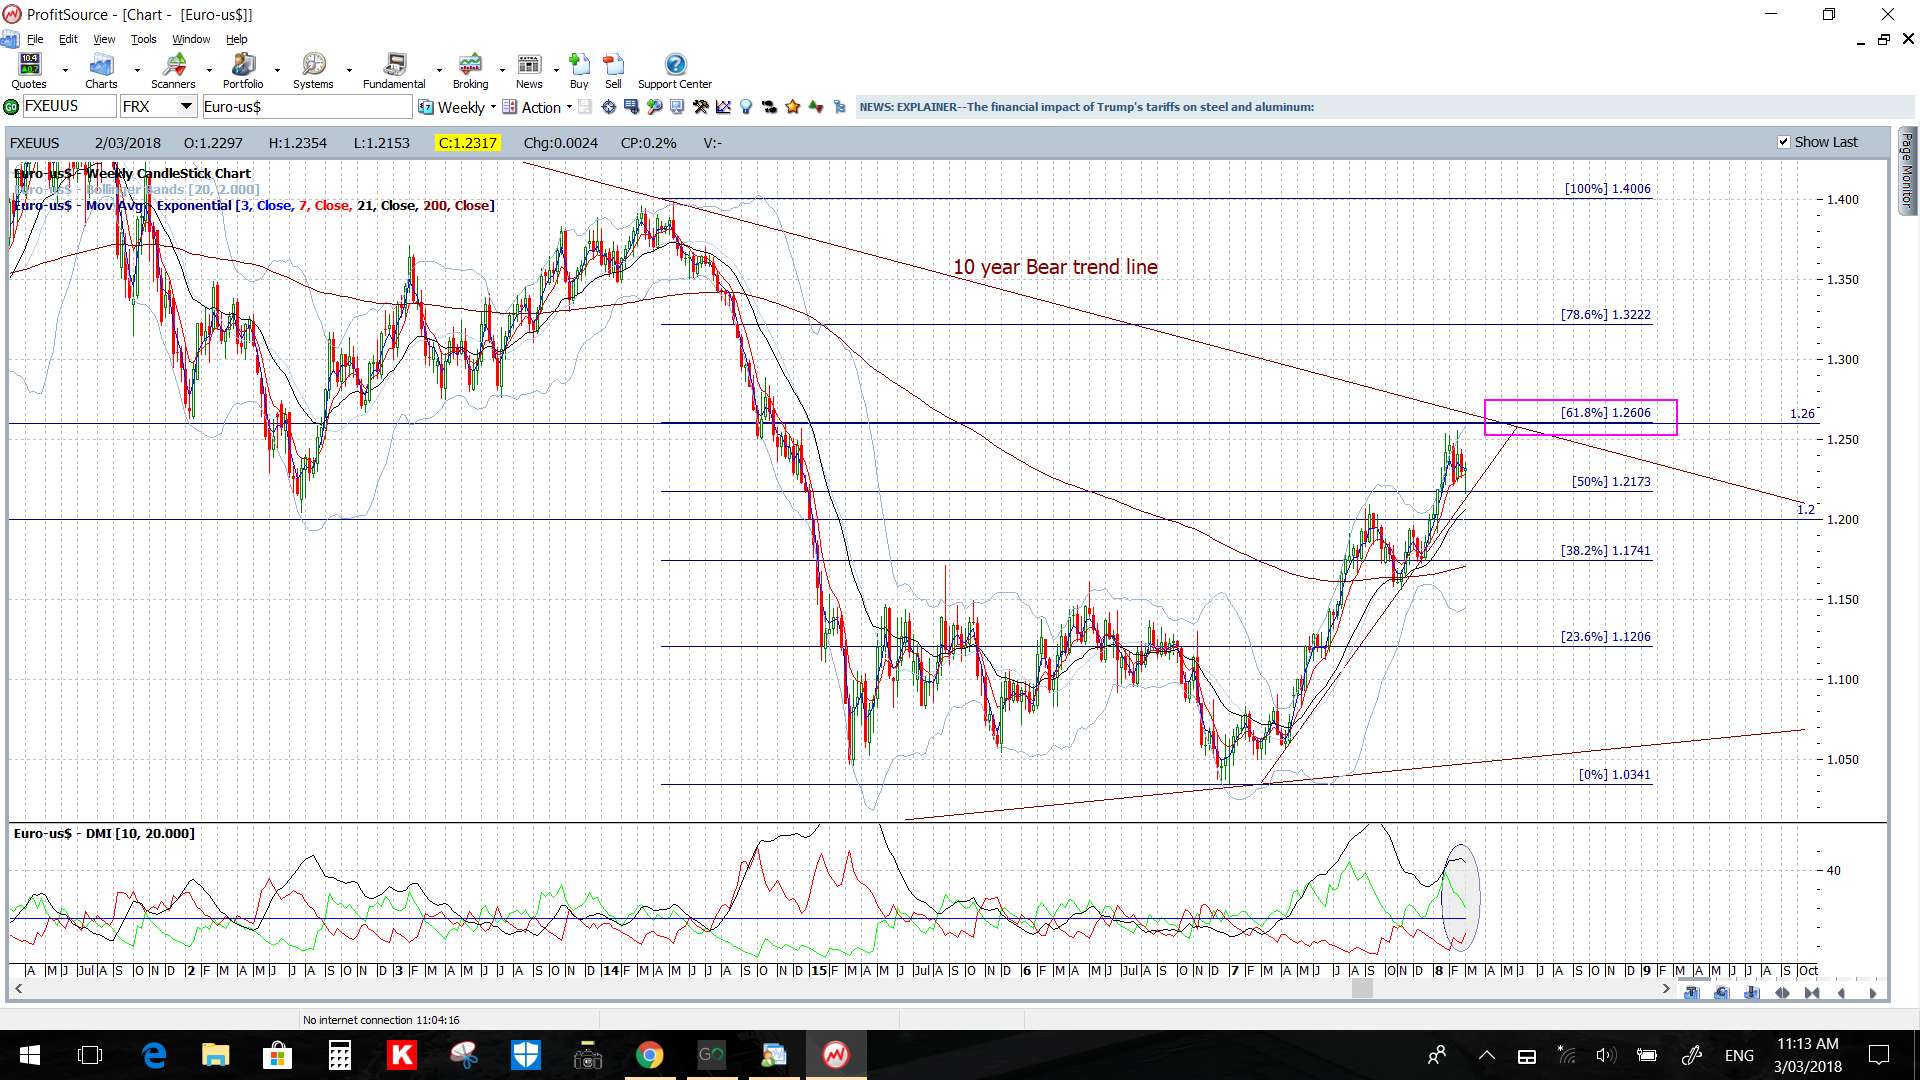
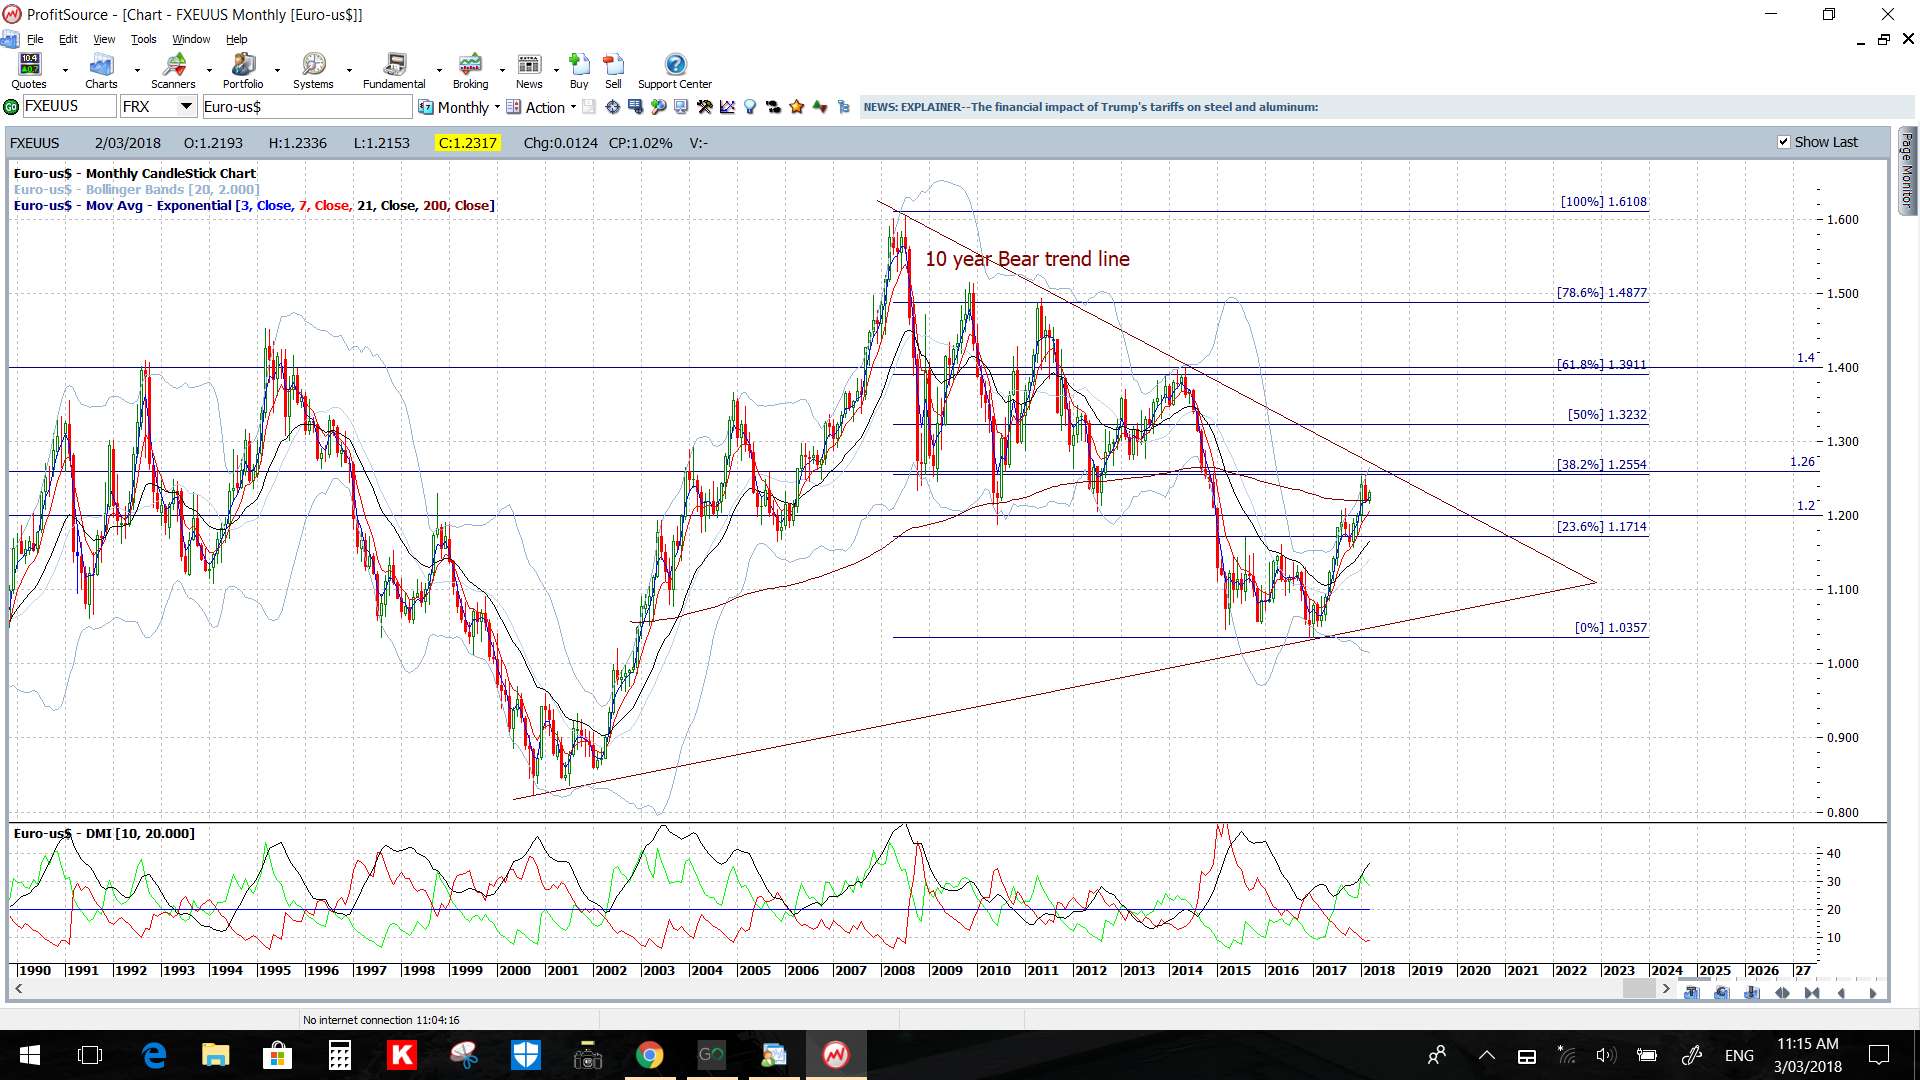
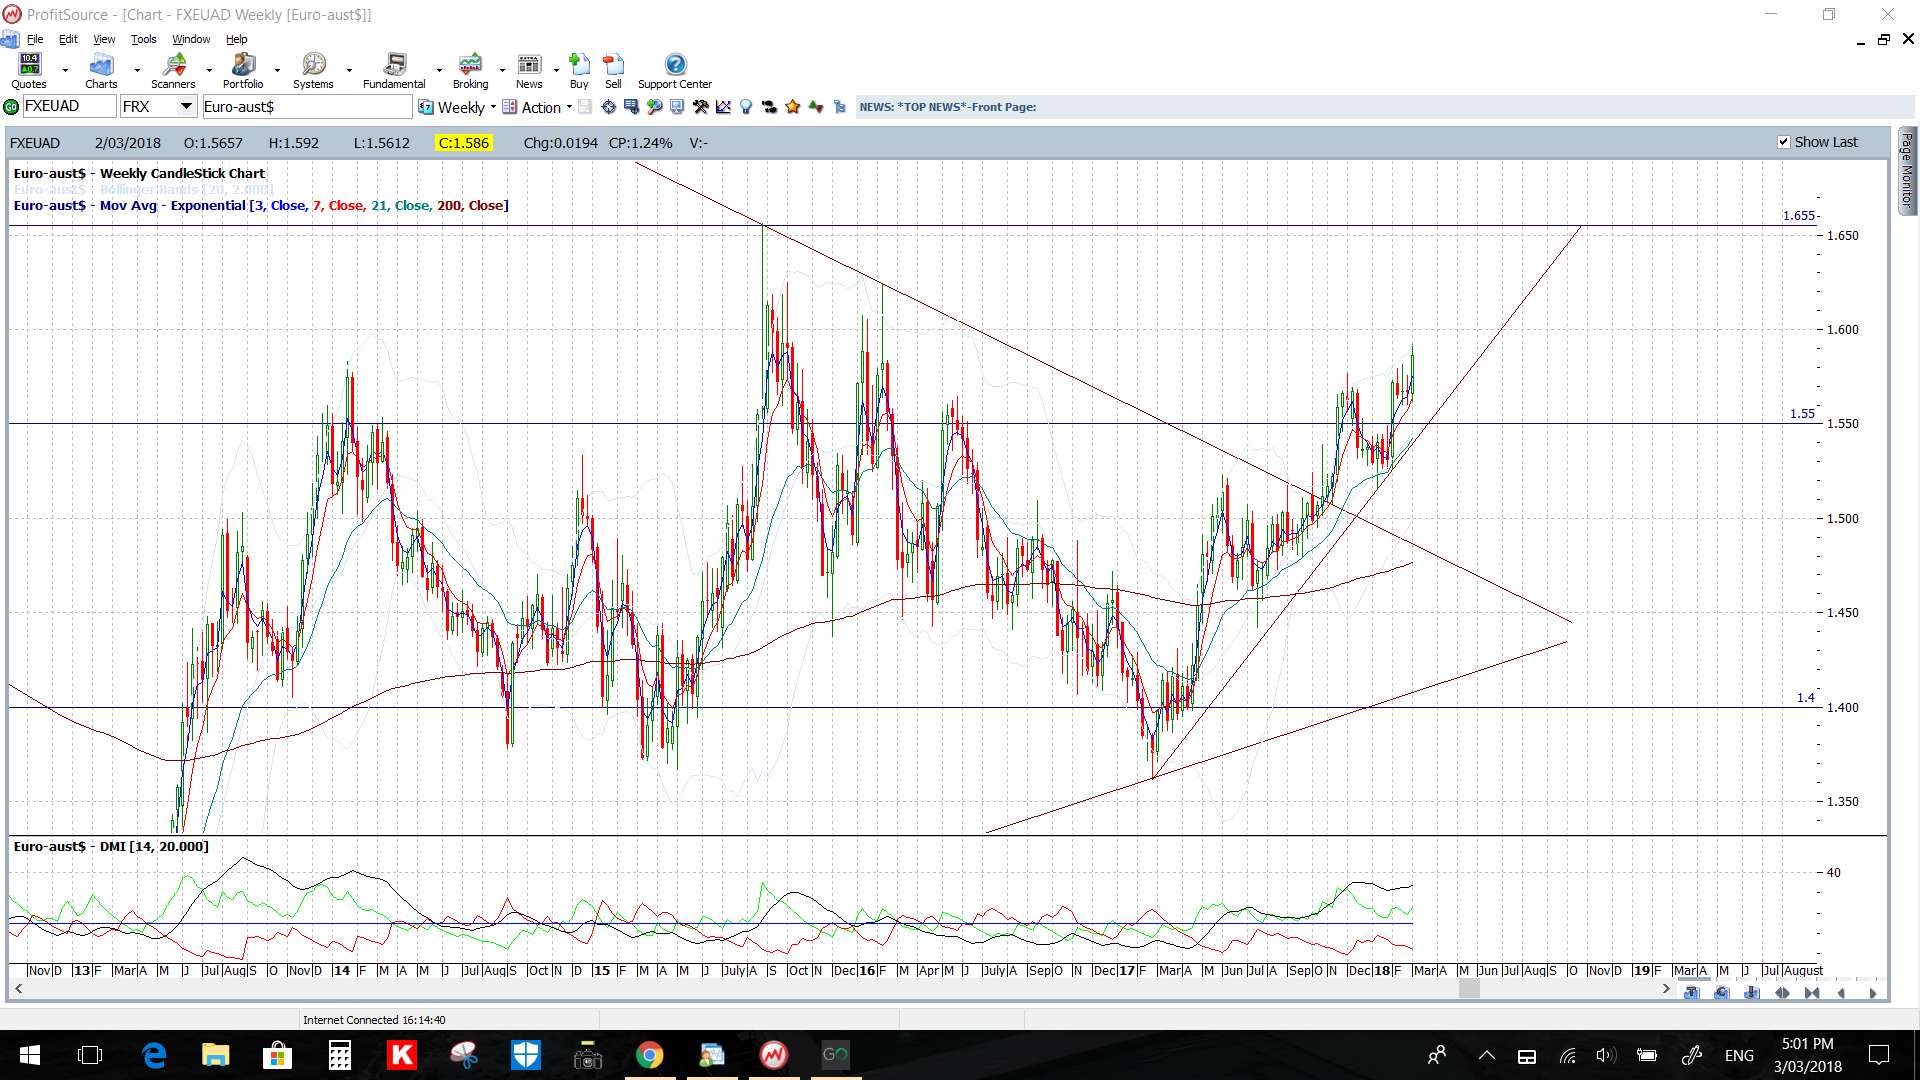
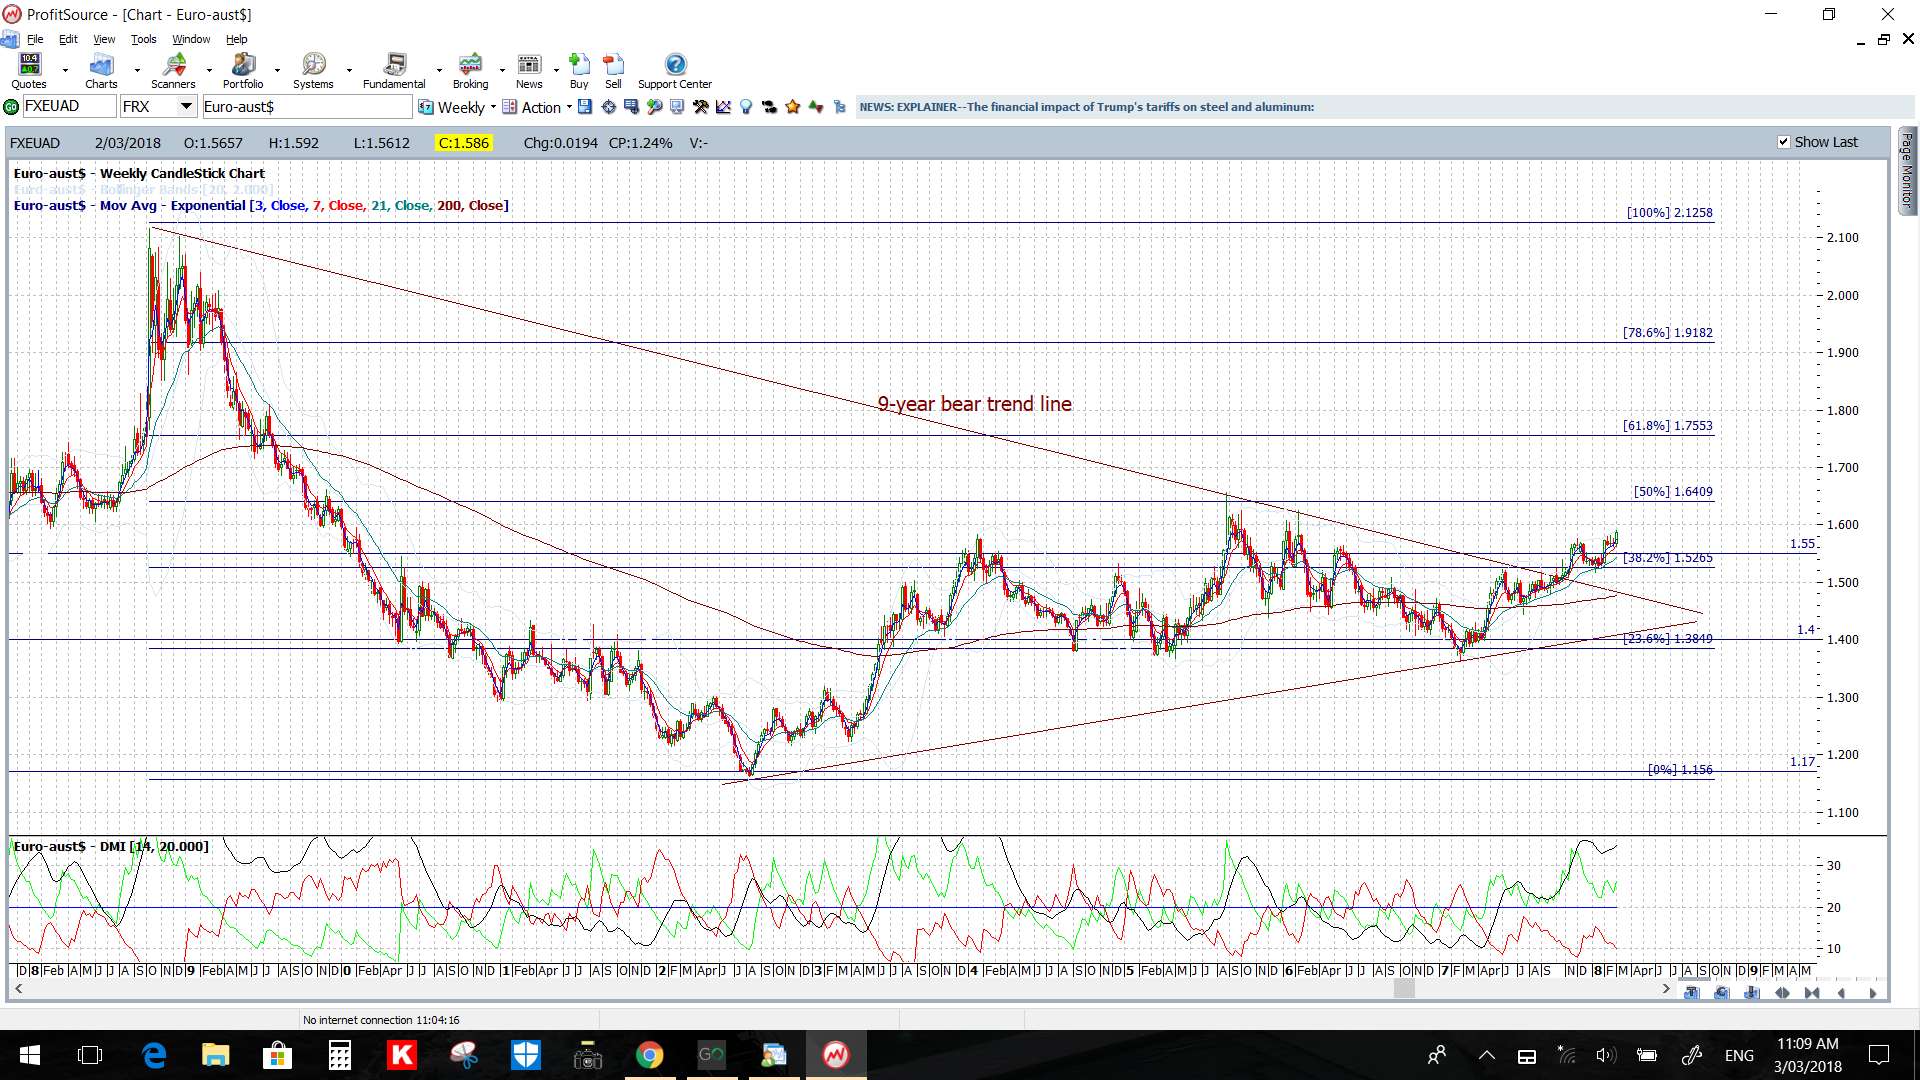
EUR/USD: The EUR/USD closed with a small bullish candle after taking a dip to start the week but then recovering after Trump’s tariff talk. As per my commentary over recent weeks though, I still see this pair essentially consolidating below the key 1.260 level. This remains a major level for this pair as the weekly chart’s 61.8% fib is near 1.26 and it also intersects with the monthly chart’s 10-year bear trend line. Thus, the 1.26 is still the major level to monitor in coming sessions.
Note on the monthly chart below how the 61.8% fib of the swing low move is up near previous S/R at 1.40 and so this would be the longer-term target on any break and hold above 1.26. This constitutes a move worth 1,400 pips so is well worth motioning on any breakout above 1.260.
Any deeper pullback and break of the support trend line would have me looking for a test of the key 1.20 level.
The EUR/USD essentially printed a bearish coloured ‘Inside’ candle for February reflecting some clear indecision here.
- Watch the 4hr chart trend lines for any new breakout; especially with this week’s ECB rate update and NFP.
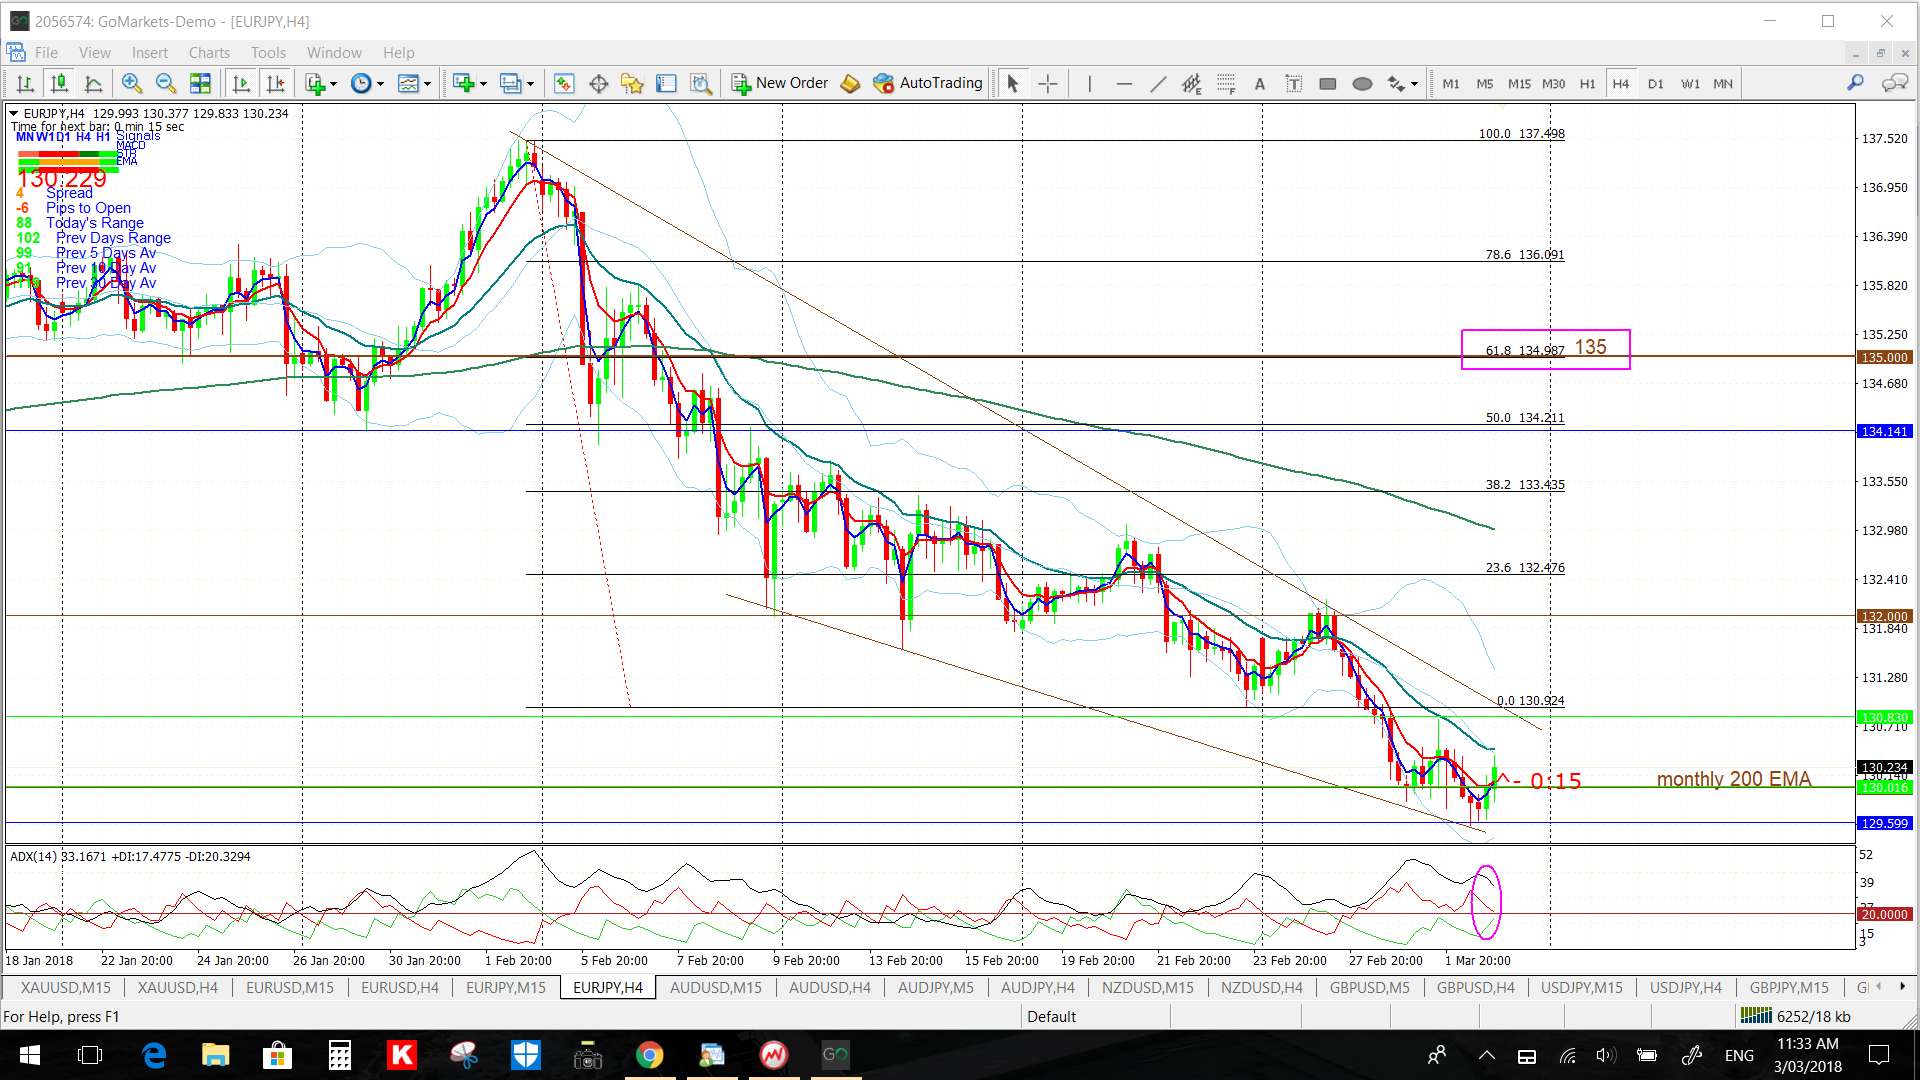
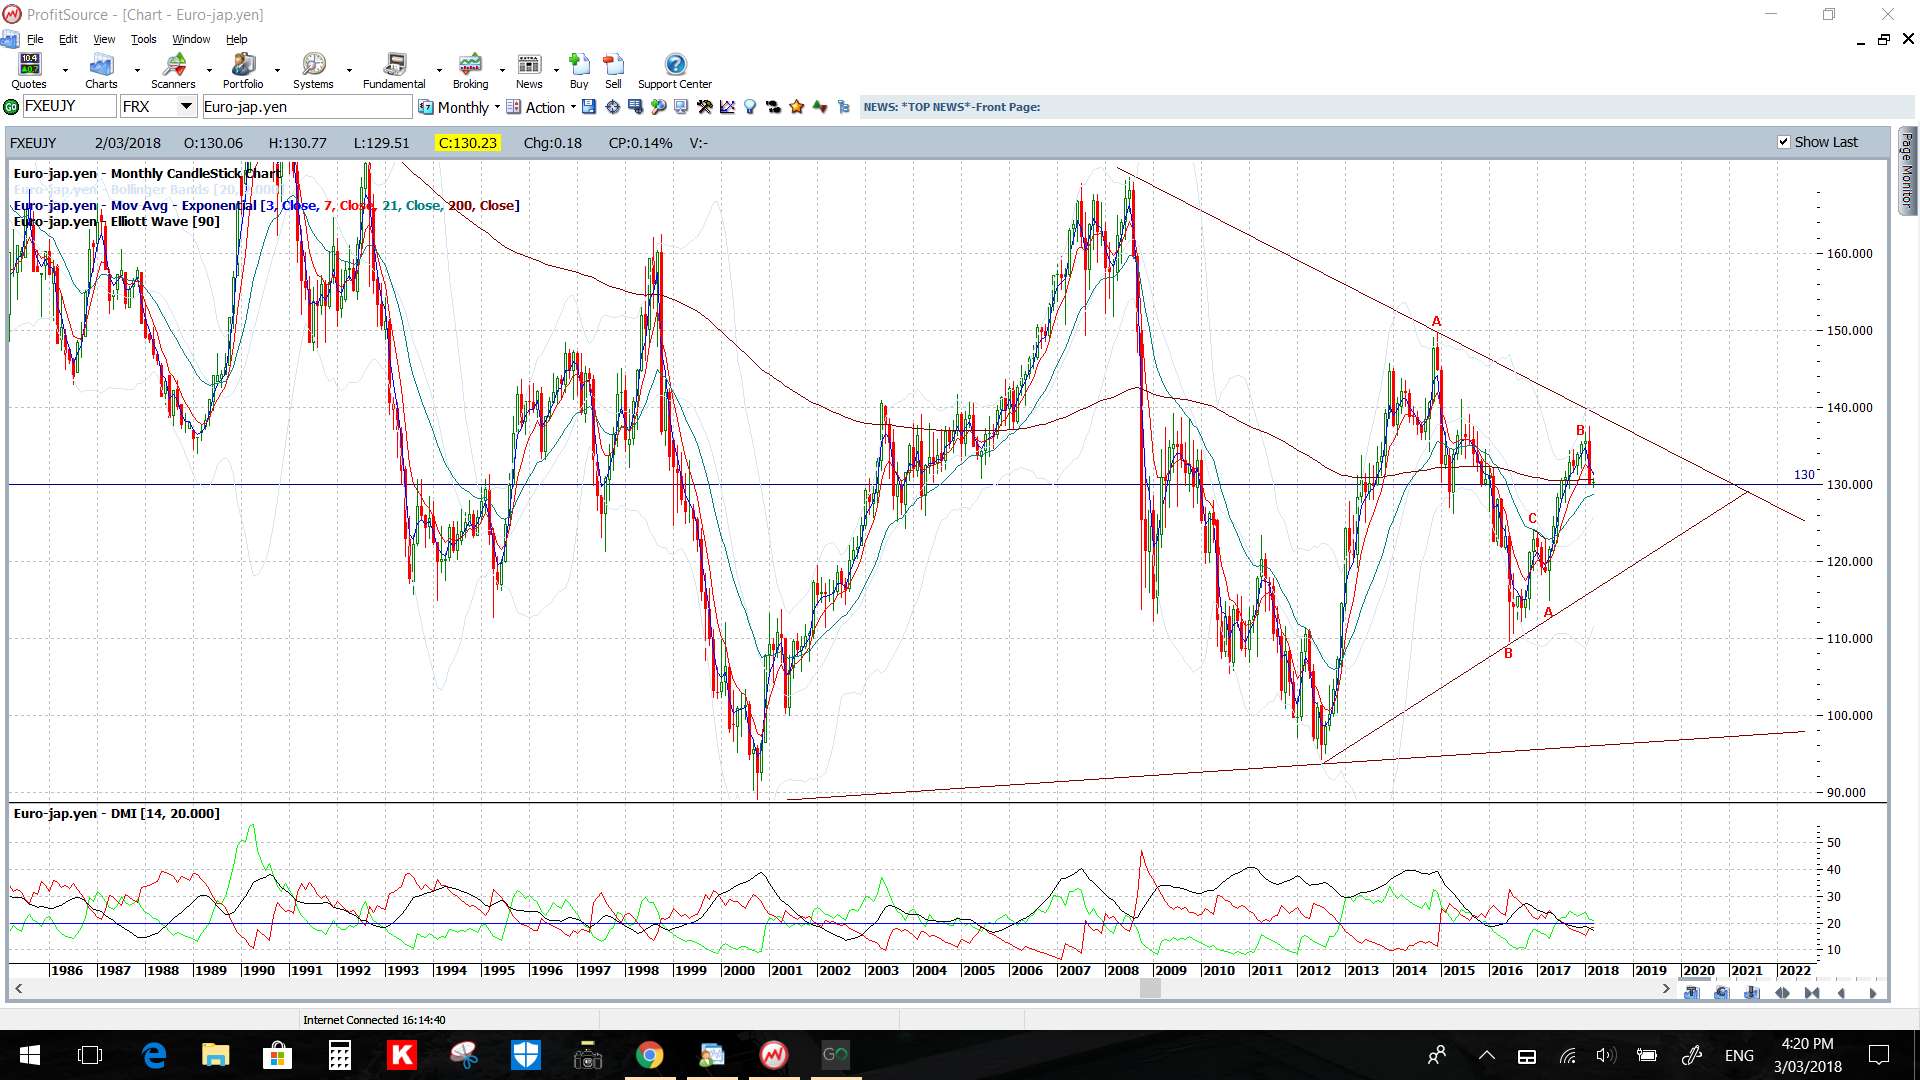
EUR/JPY: There has been further weakness with this pair but I’m still seeing a potentially bullish-reversal descending wedge shaping up on the 4hr chart. Although, it must be said, a large bearish candle was printed for February and a bearish candle for the week.
However, should any relief bounce evolve then I remain on the lookout for any test of the major 135 S/R level as it is the 4hr chart’s 61.8% fib.
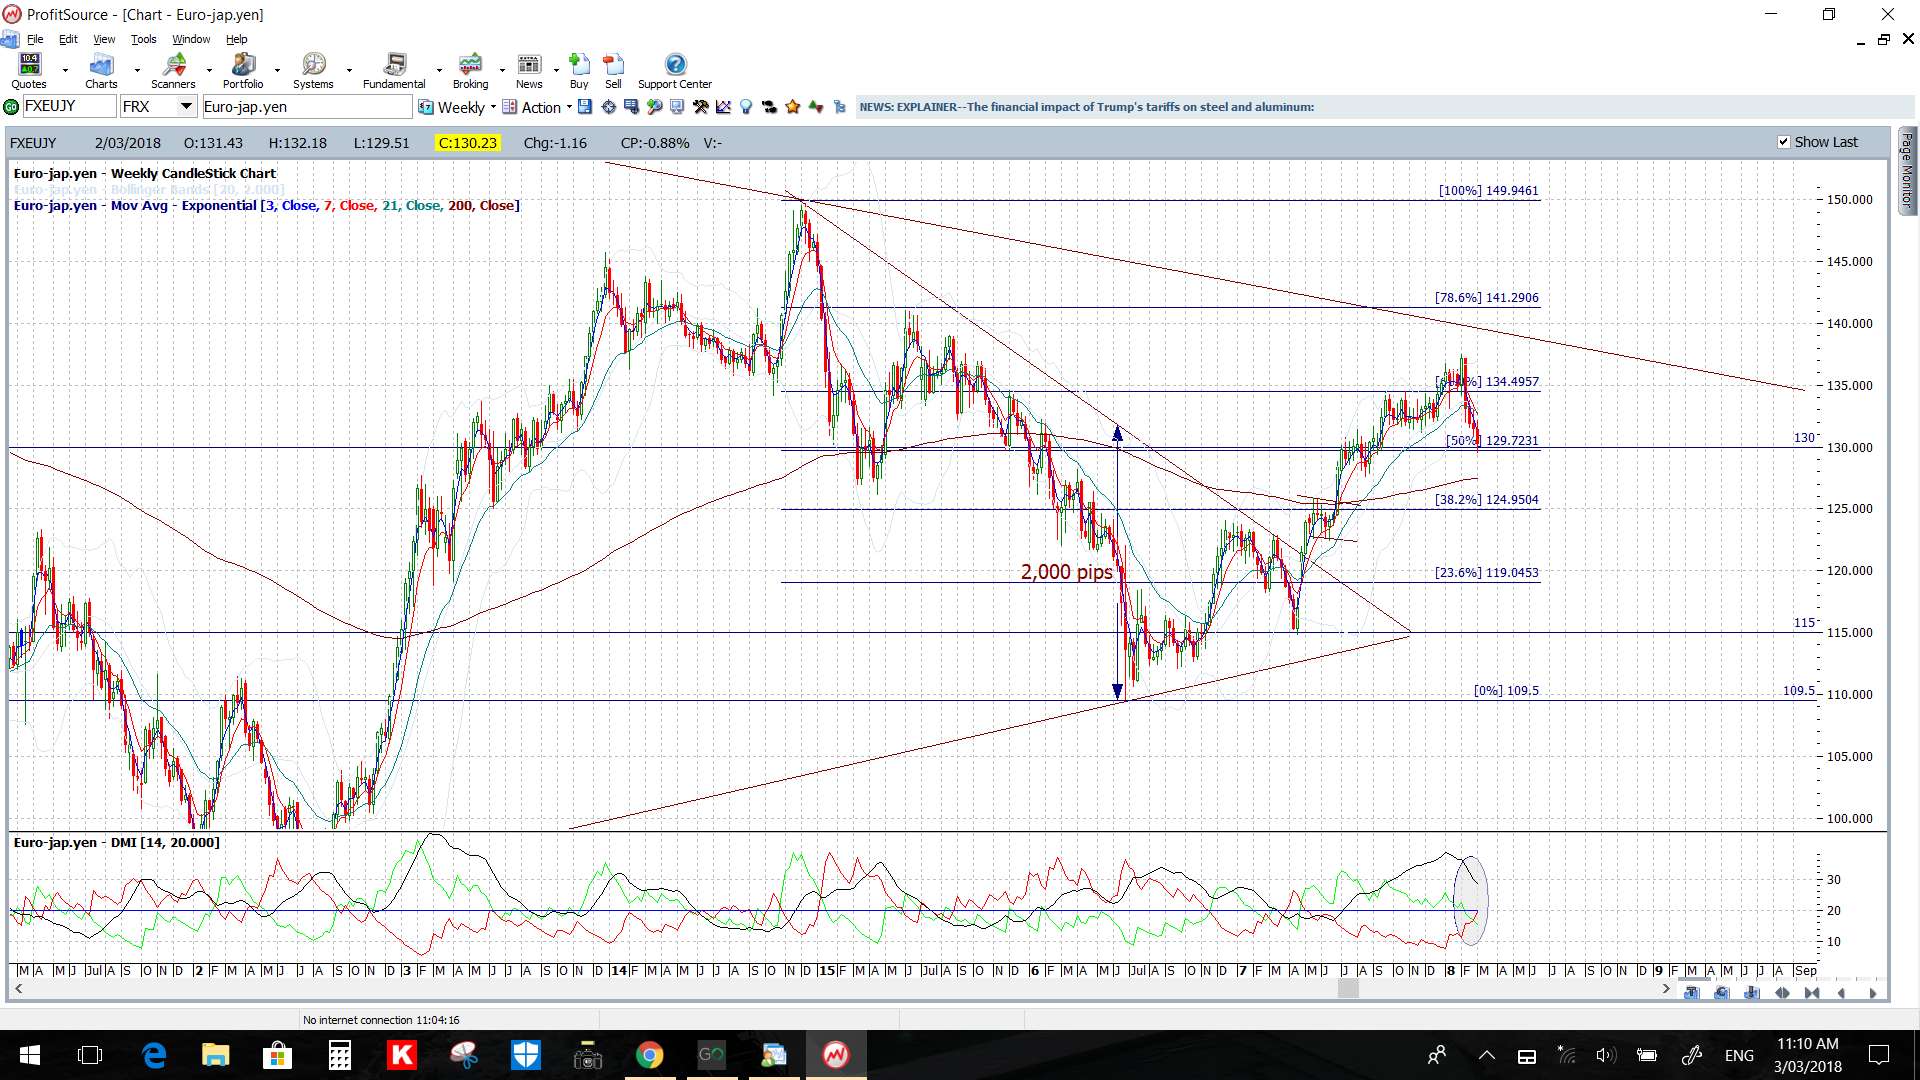
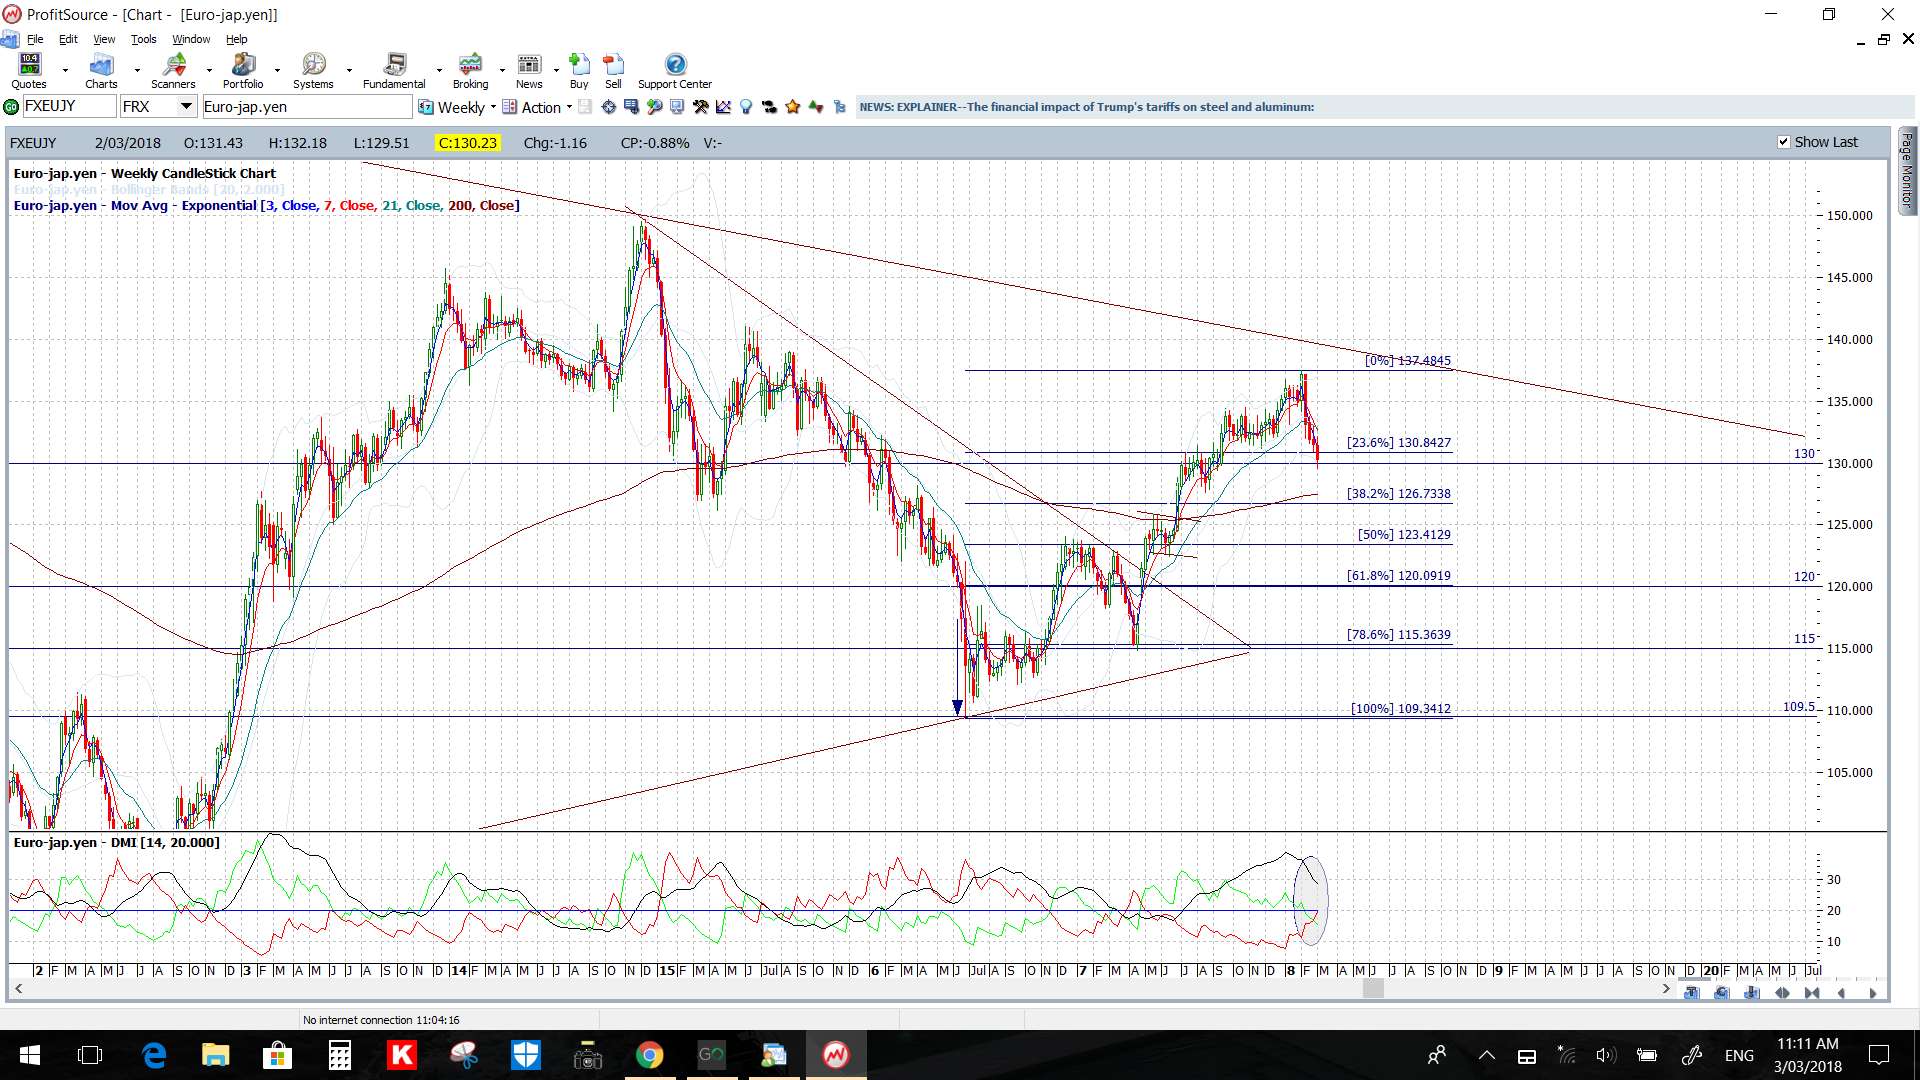
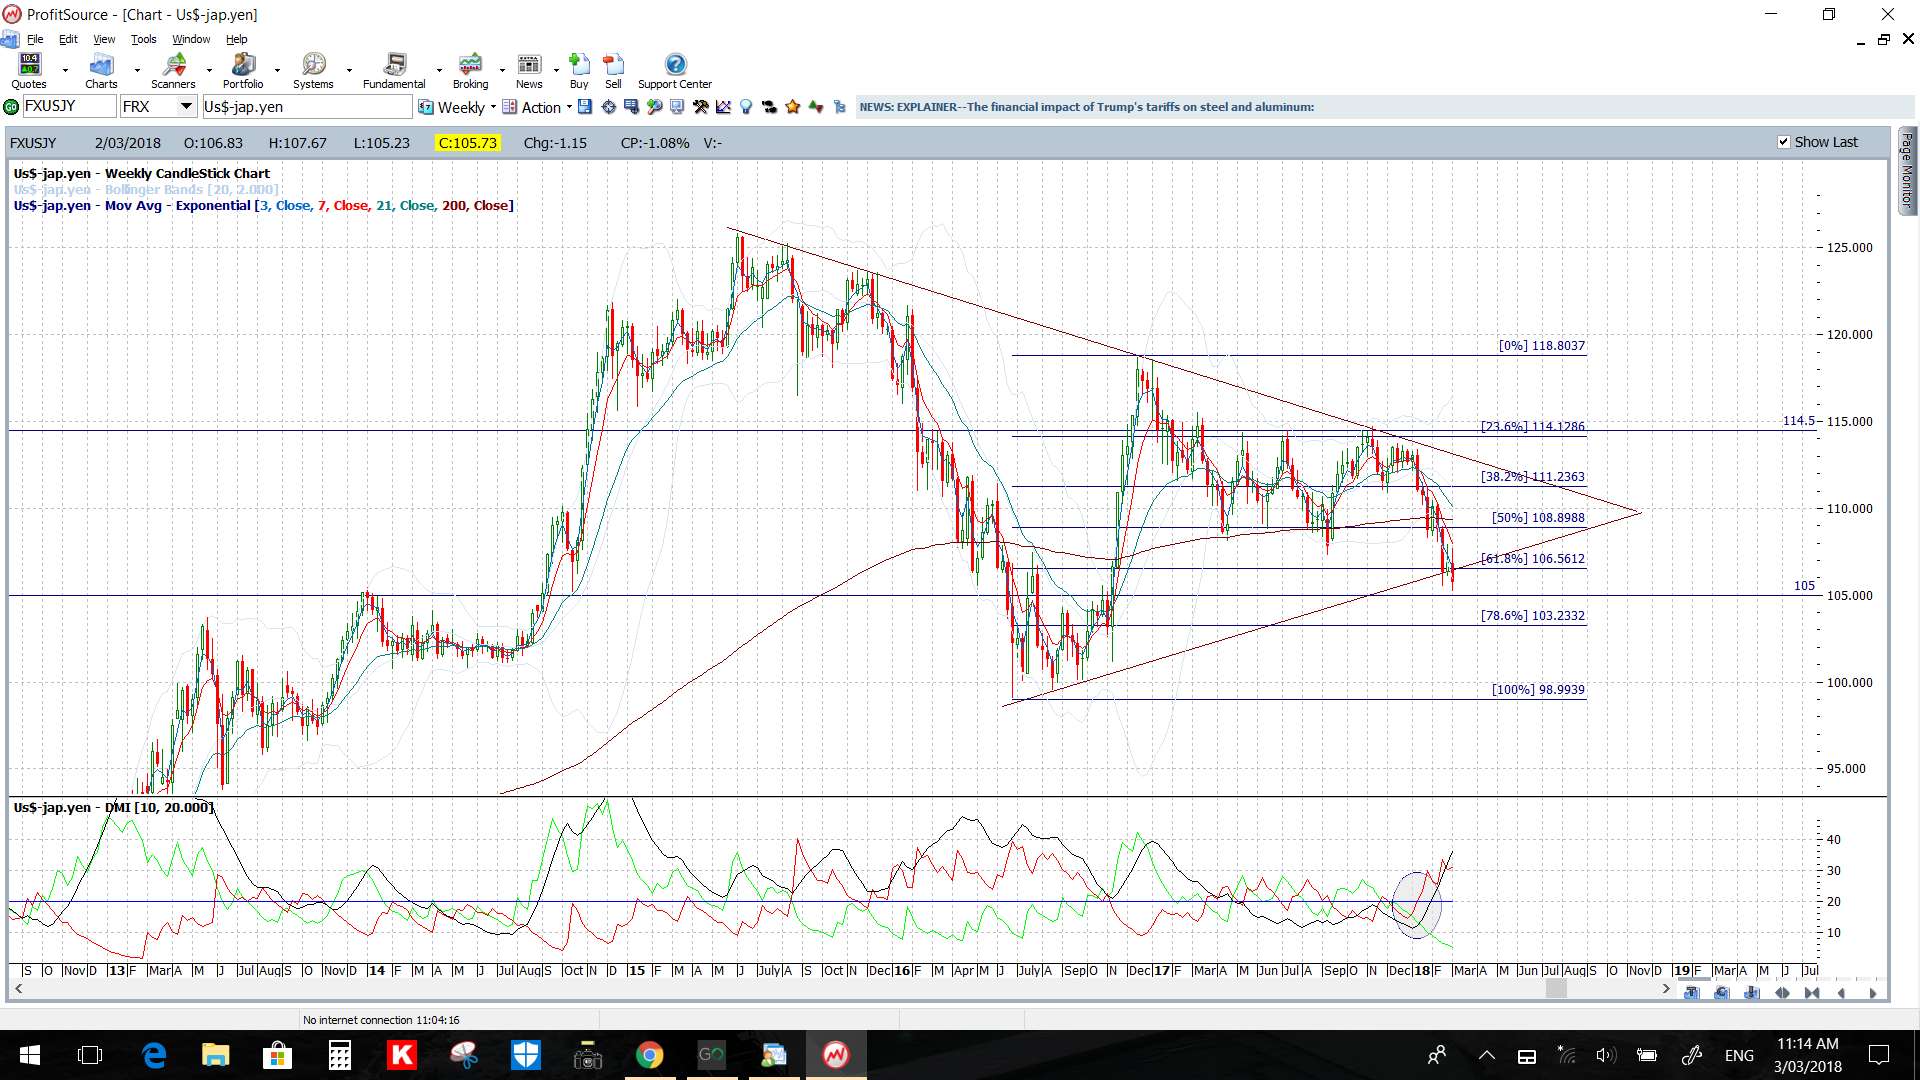
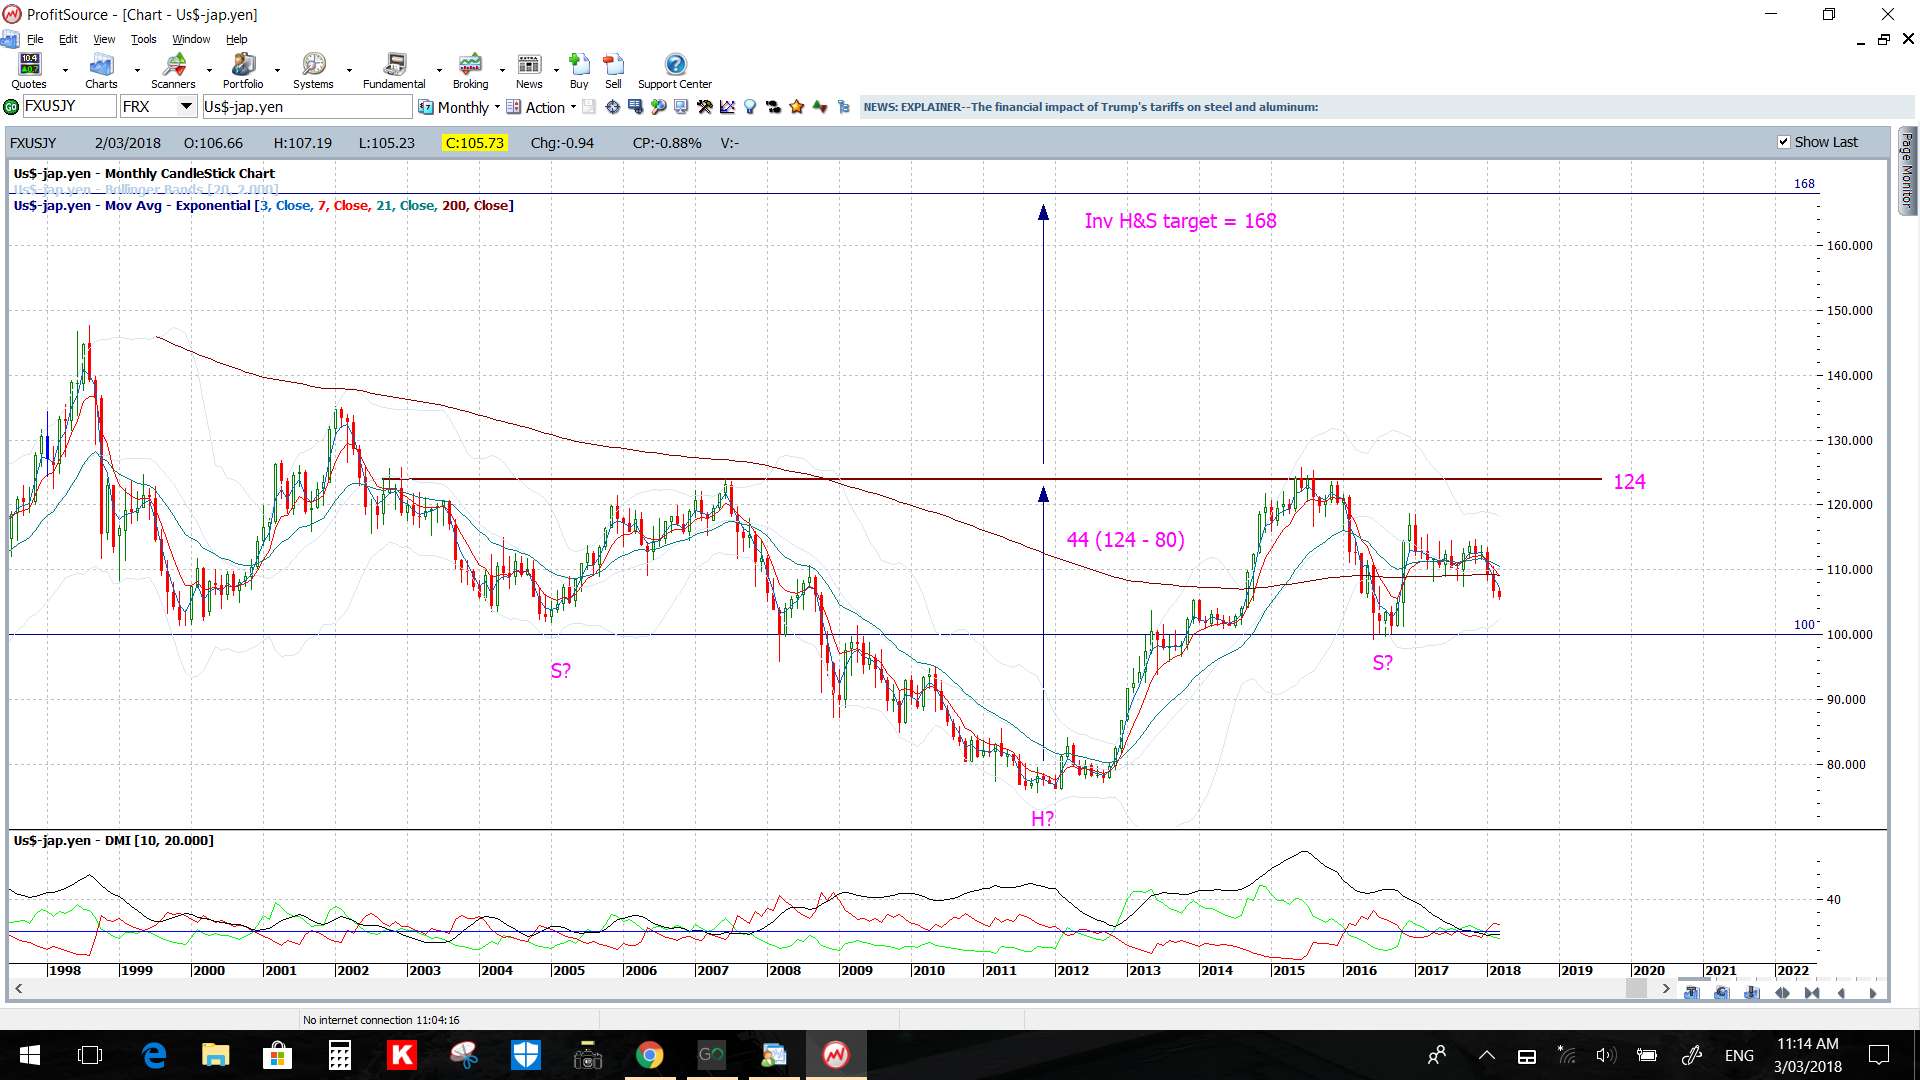
I had previously mentioned that I was on the lookout for any pullback to test the 130 S/R level and this level was tested during last week; the monthly and weekly charts below show the significance of this S/R zone. The 130 level is therefore the one to watch in coming sessions but any deeper pullback would have me looking to the 120 region as this is the weekly 61.8% fib level of the last swing high move (see the second weekly chart below).
- Watch the 4hr chart wedge trend lines and 130 level for any new breakout; especially with this weeks ECB and BoJ rate updates.
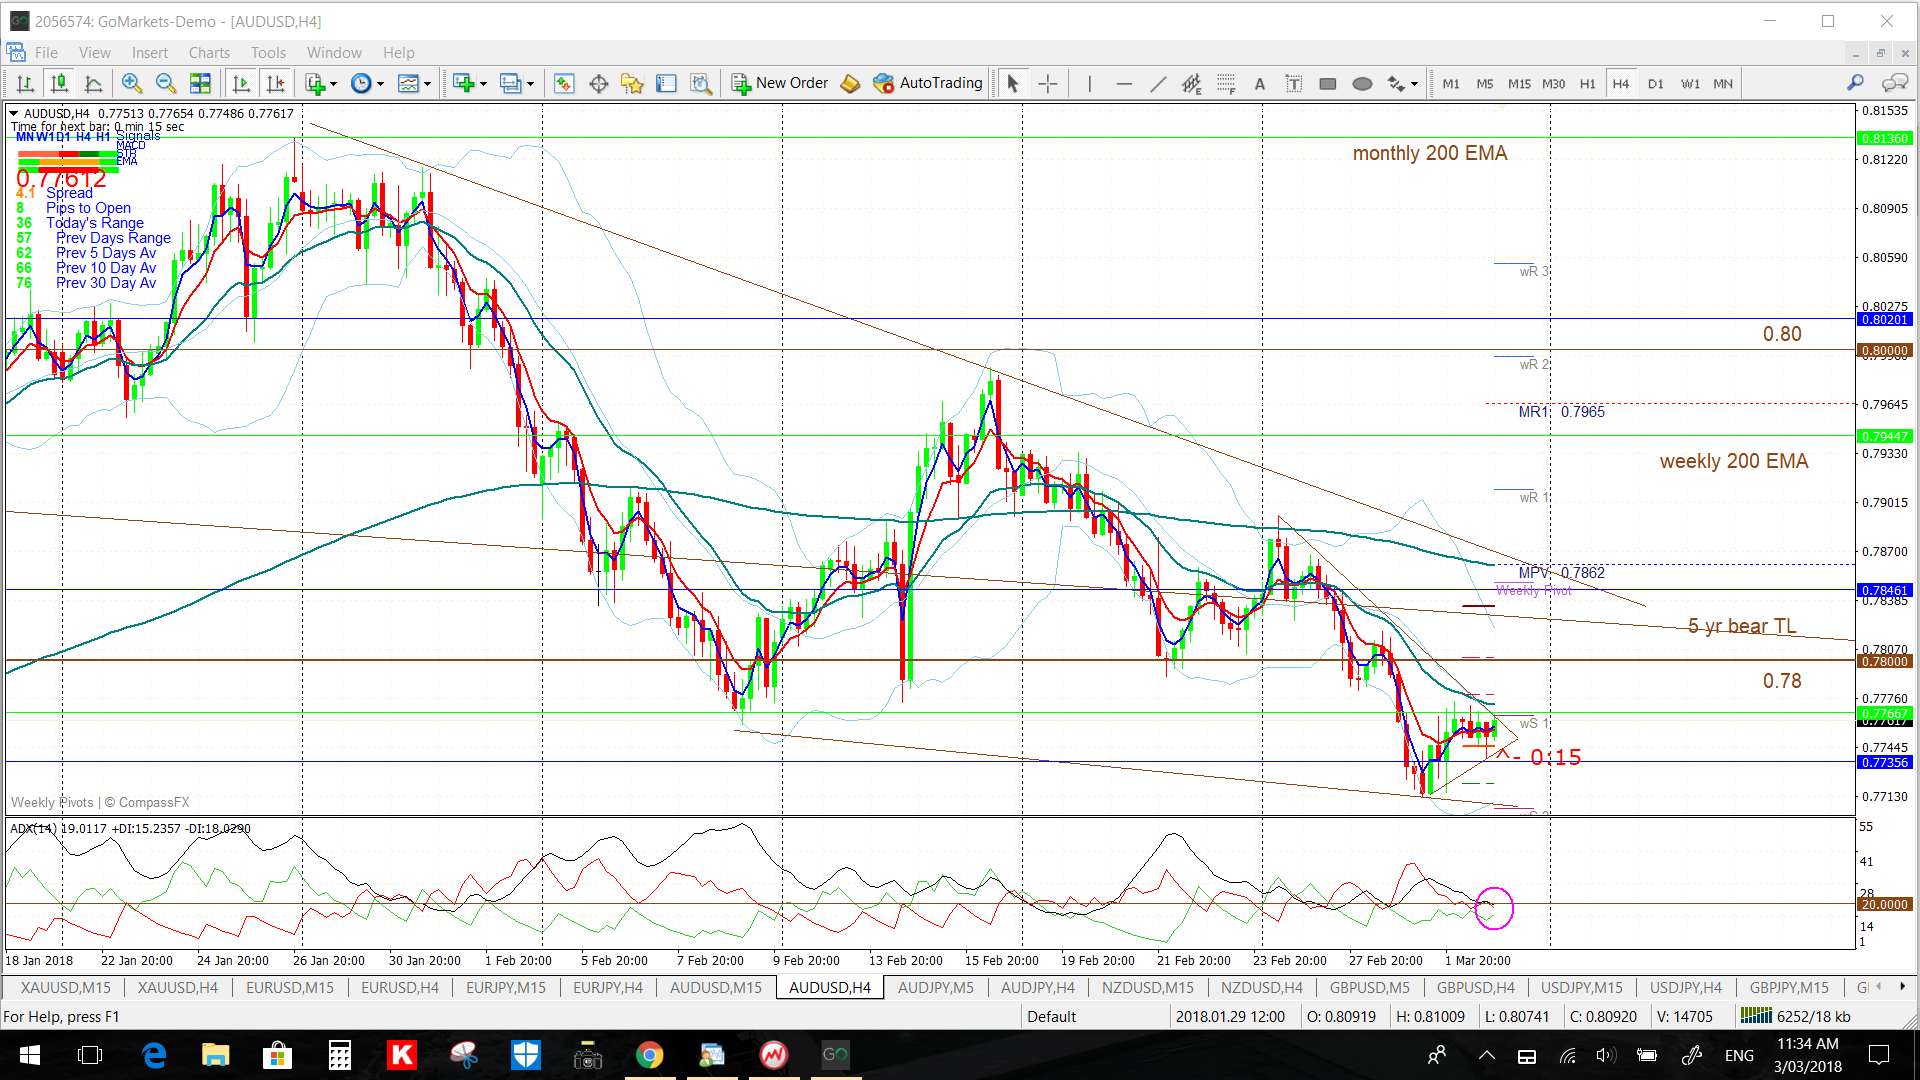
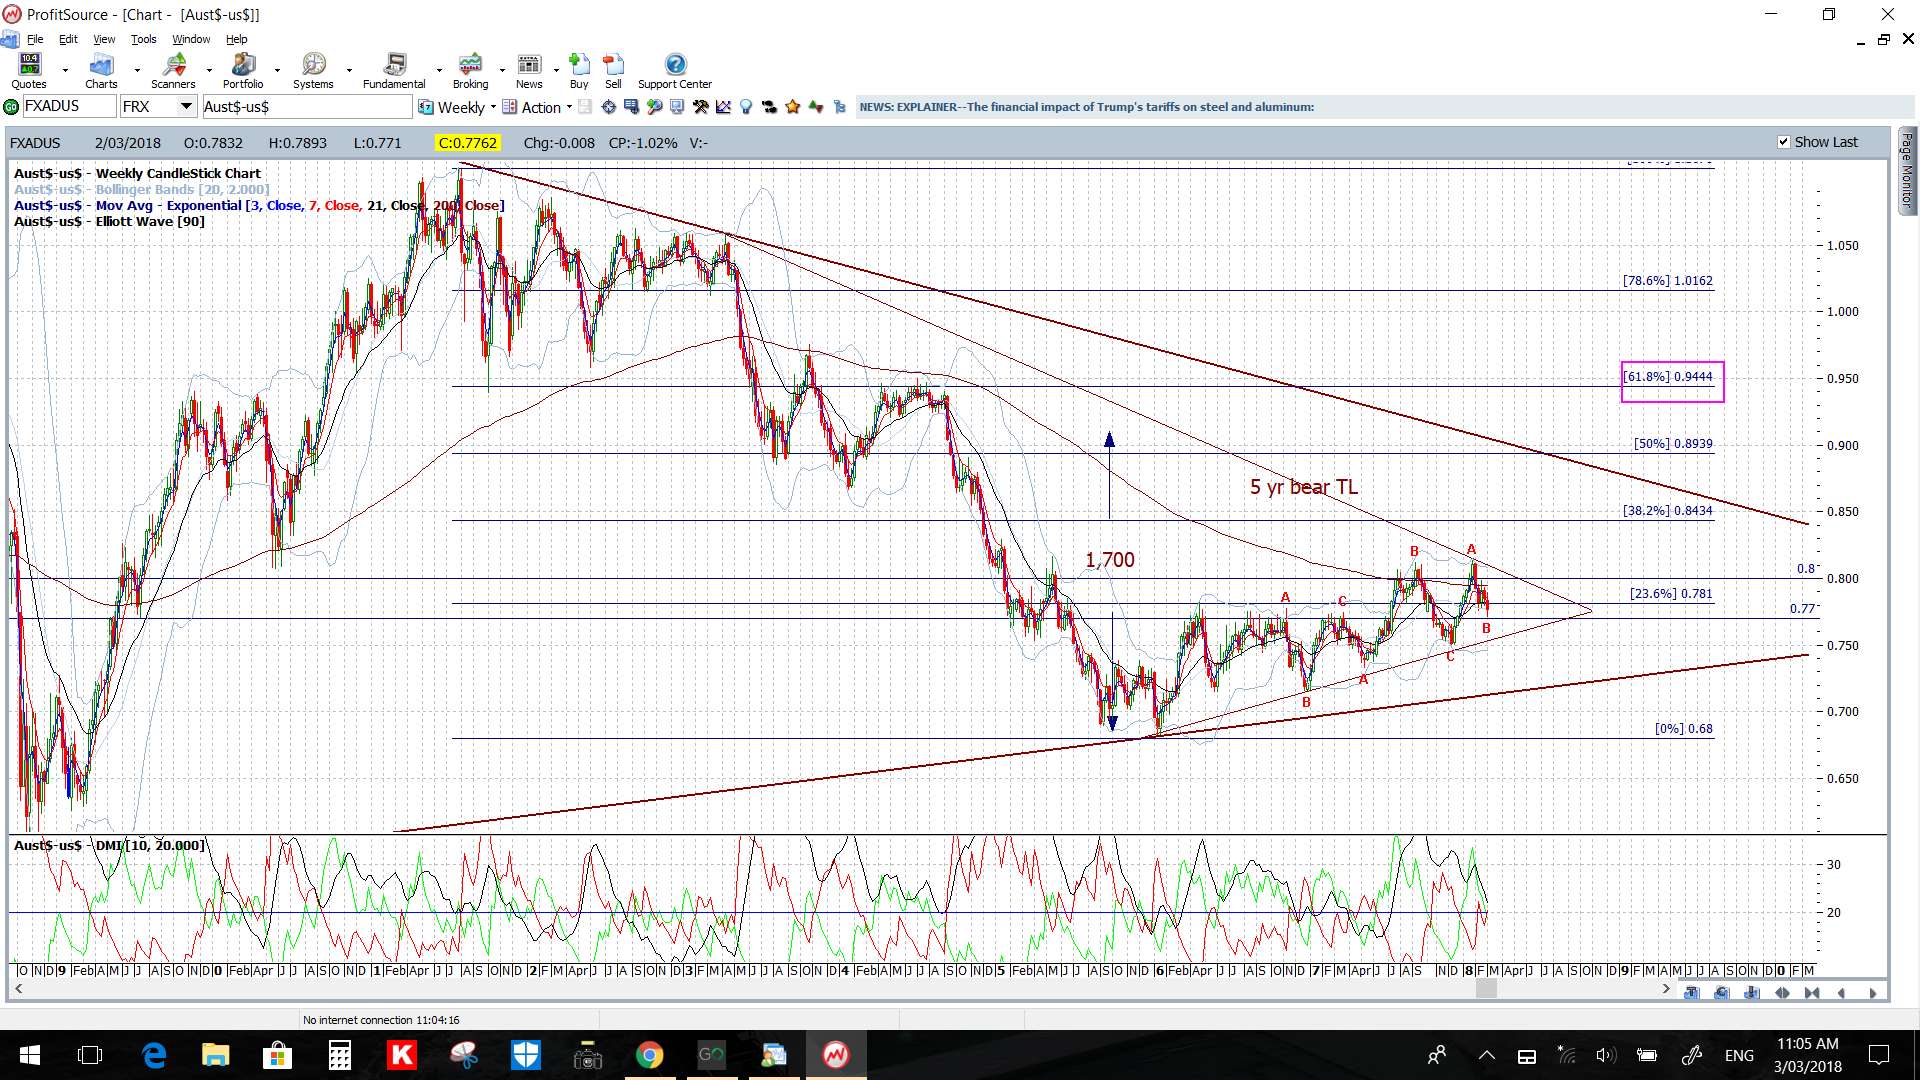
AUD/USD: The Aussie suffered earlier in the week with the stronger US$ but found support near the 0.77 support. However, it did print a rather large bearish candle for the week as well as a large bearish candle for the month. Despite all of this, price action continues to consolidate not too far from the previously broken 5-year bear trend line.
There is quite a bit of AUD data this week so watch to see if one or other of these items gets the Aussie moving away from this major trend line.
- Watch the triangle and wedge trend lines for any new breakout, especially with this week’s AUD Current Account, Retail Sales and Trade Balance data, an RBA Gov Lowe speech as well as the RBA Rate update.
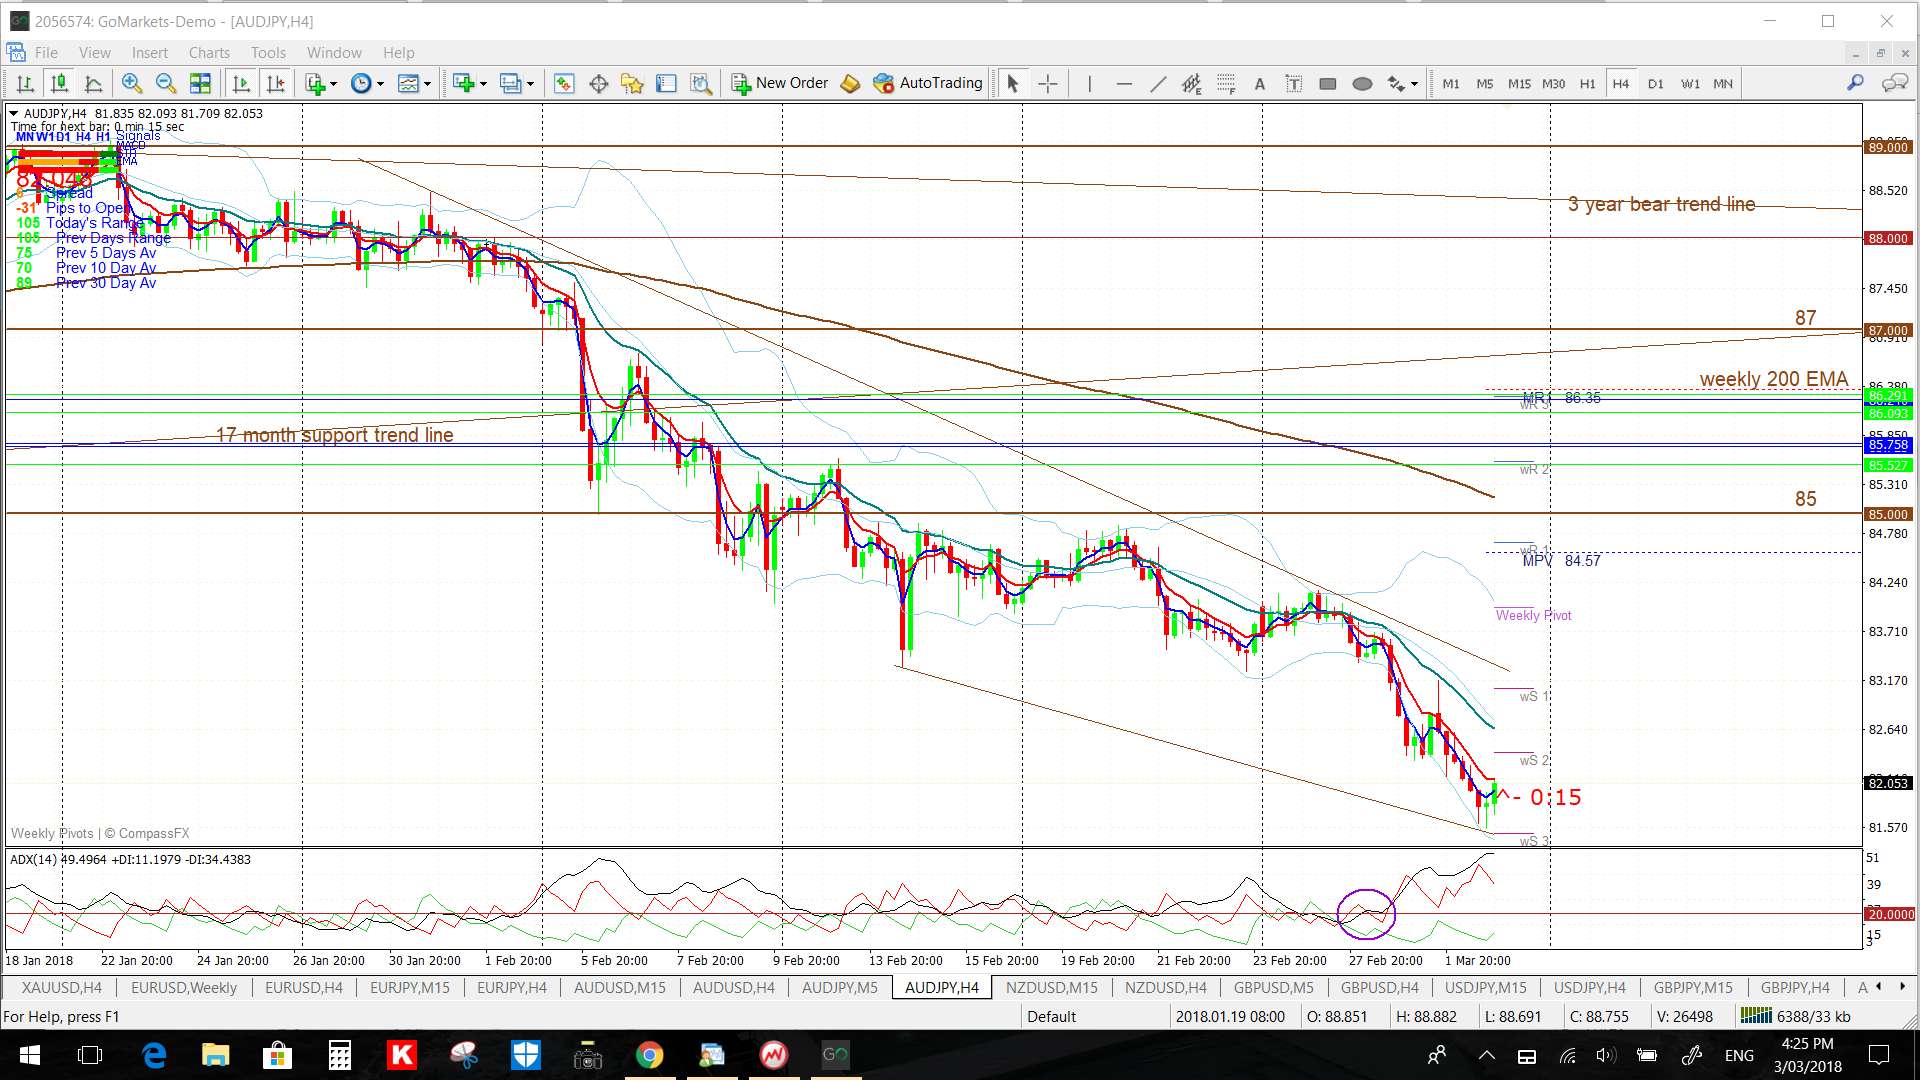
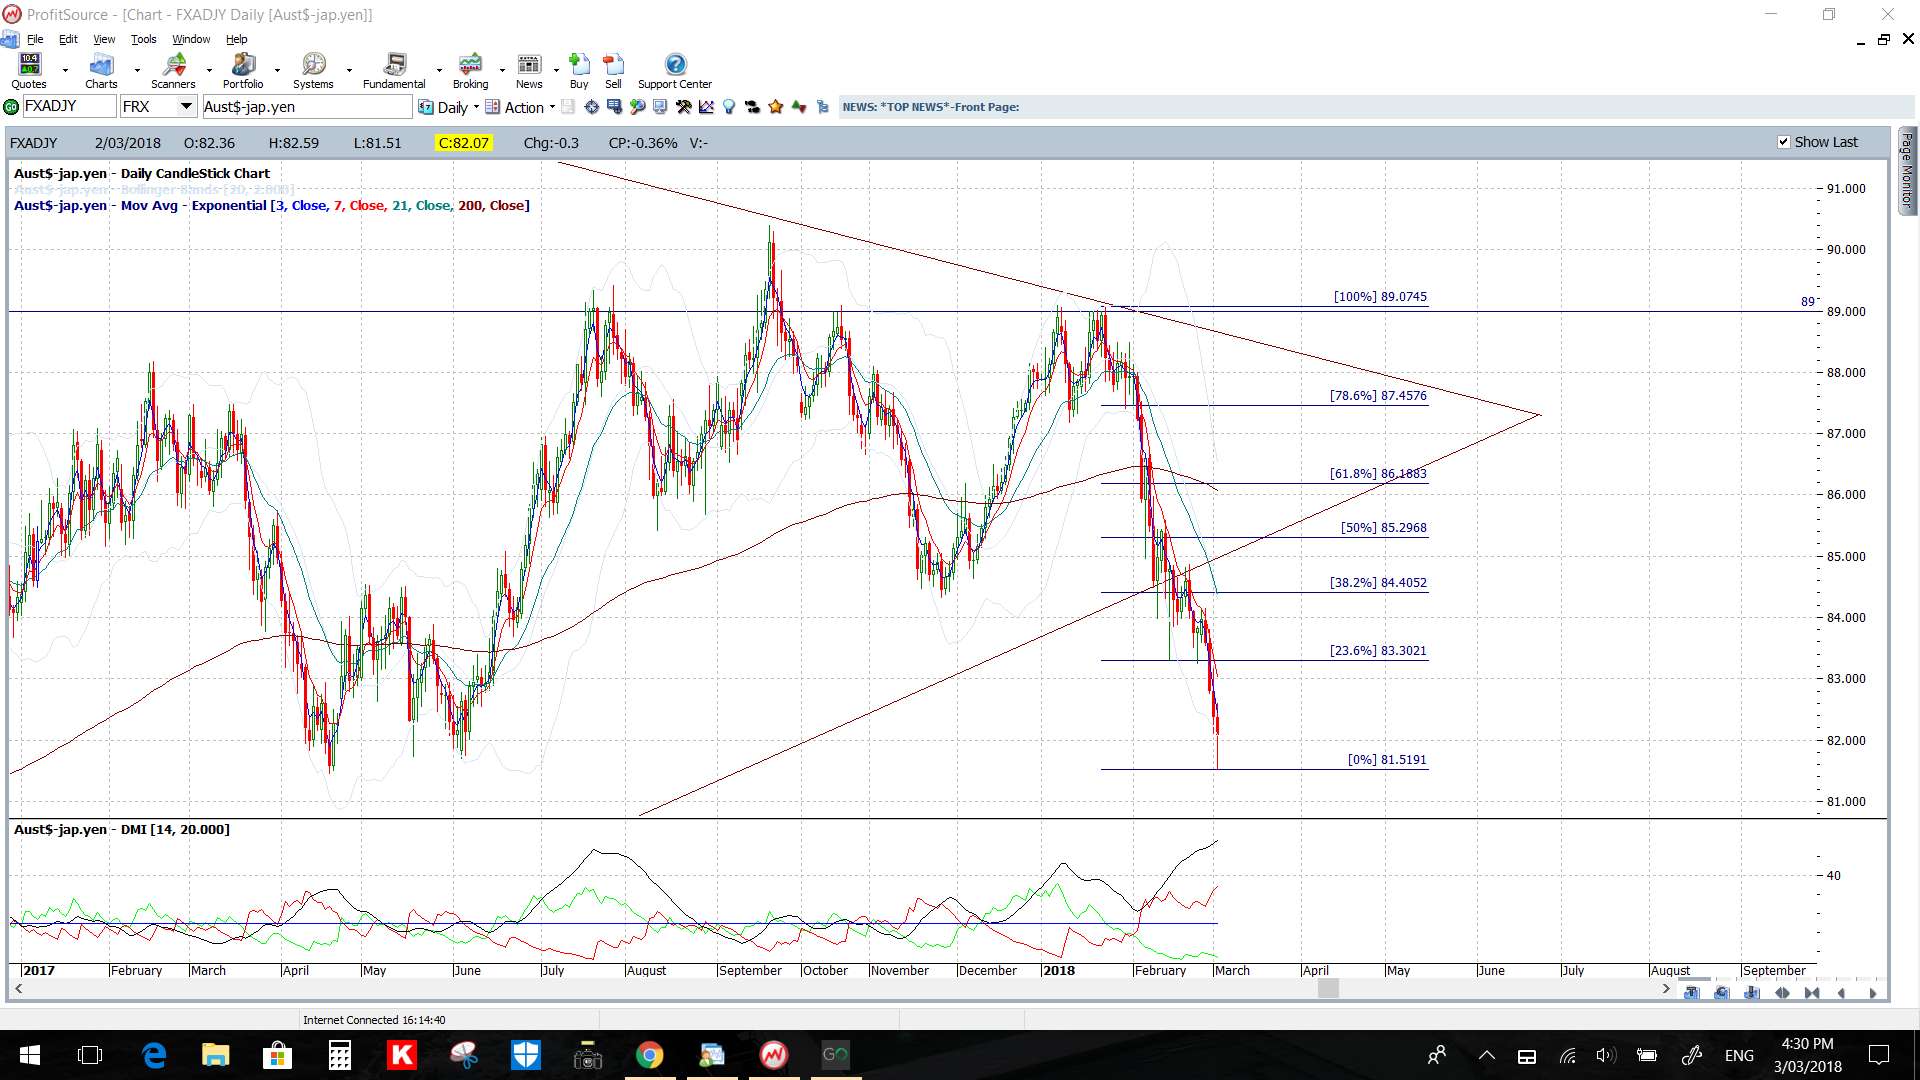
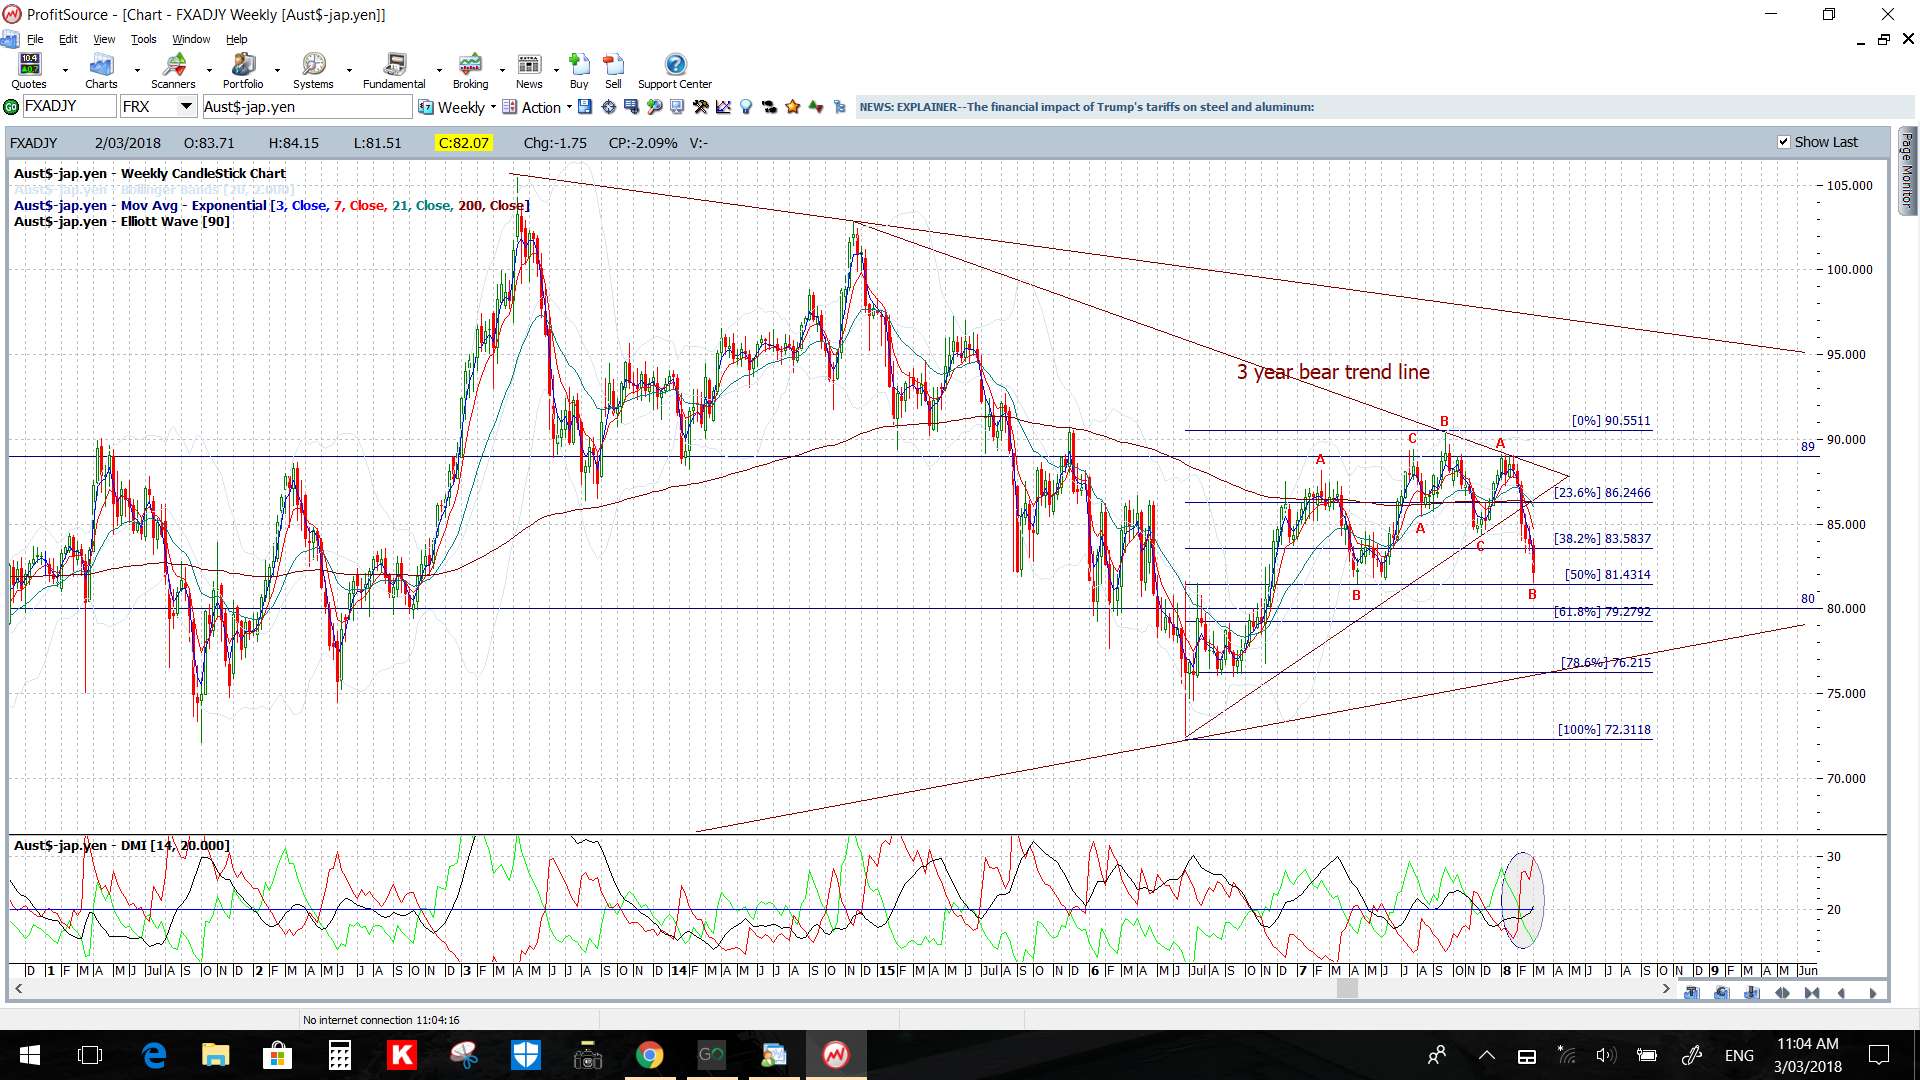
AUD/JPY: The AUD/JPY has given around 450 pips since breaking below the long-term support trend line and has printed large bearish monthly and weekly candles. Note how price reached down to the weekly chart’s 50% fib and I’ll be watching to see if the AUD/JPY continues any lower to test the 61.8% fib near the 80 S/R level.
Any recovery bounce from here would have me looking to the 61.8% fib of the recent swing low move, near 86, and this is best seen on the daily chart.
- Watch the descending wedge trend lines for any new breakout, especially with rate updates from both the RBA and BoJ to come this week:
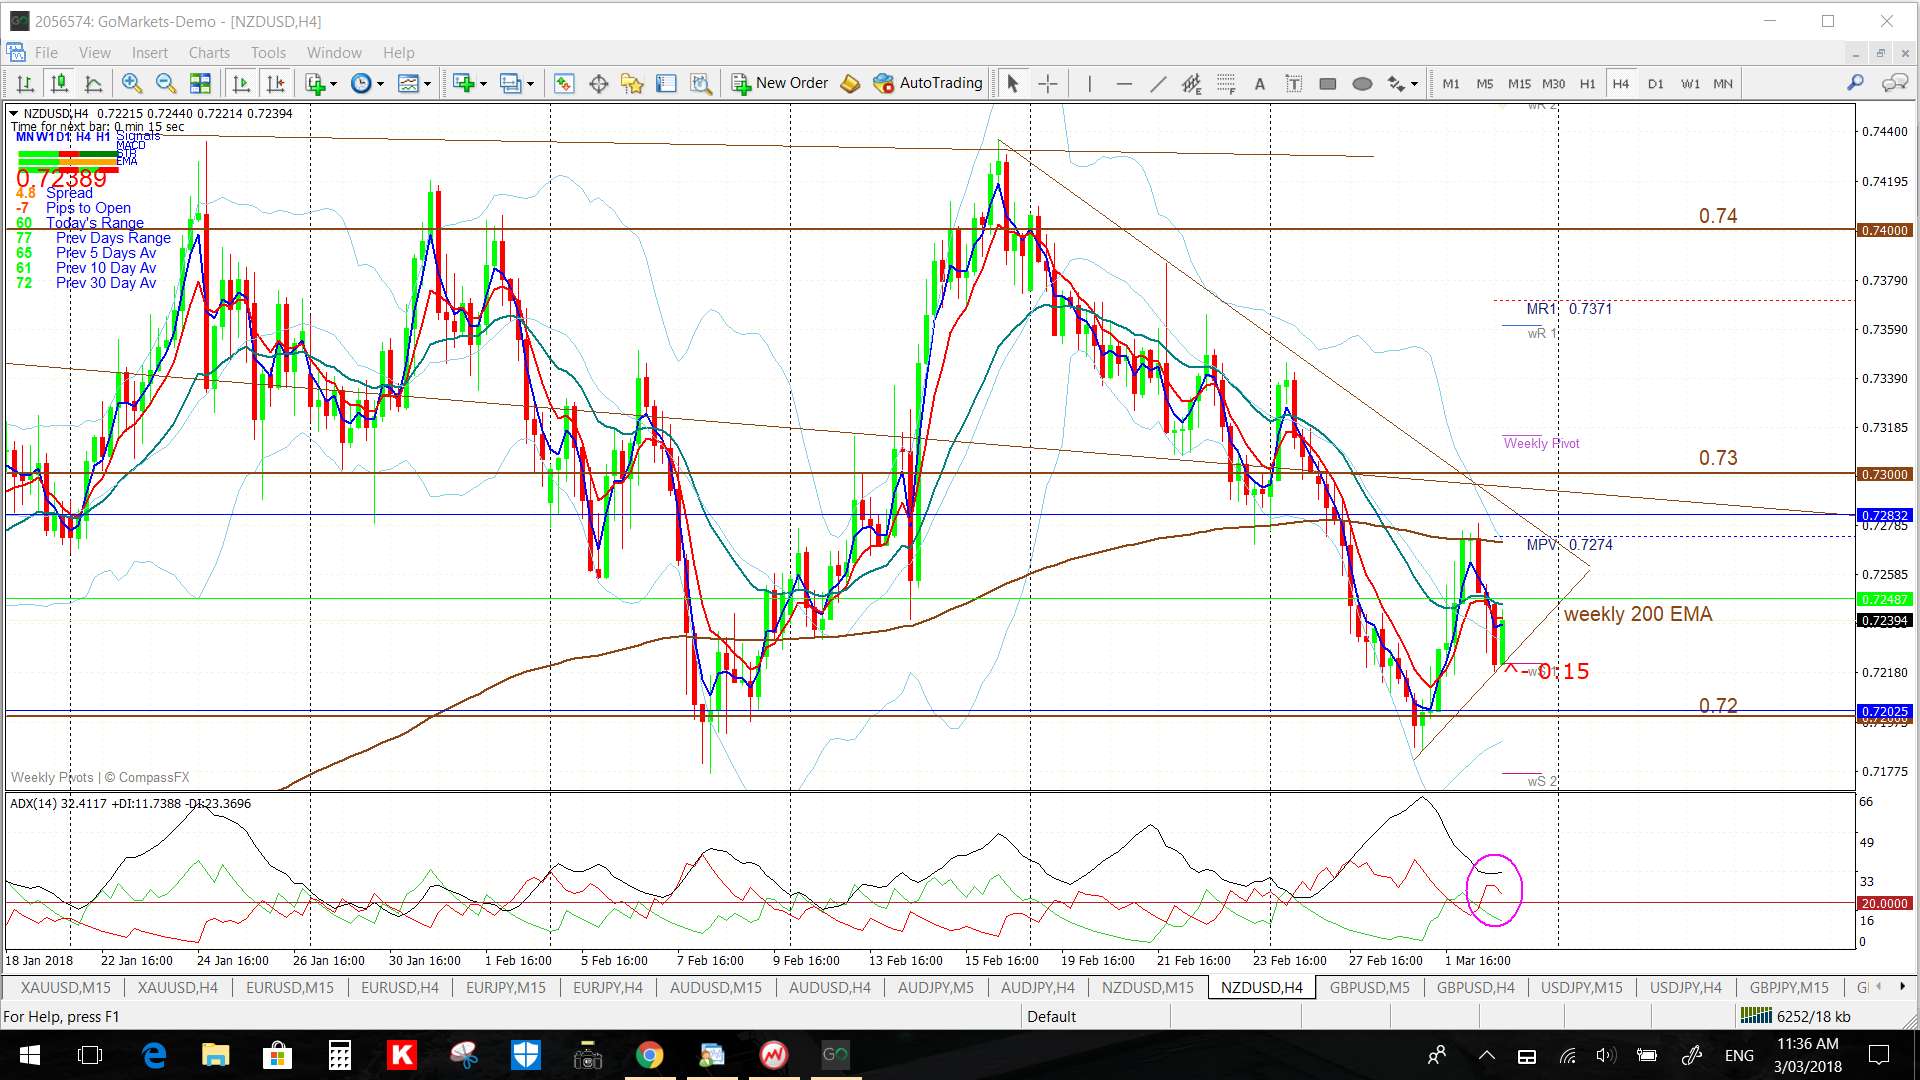
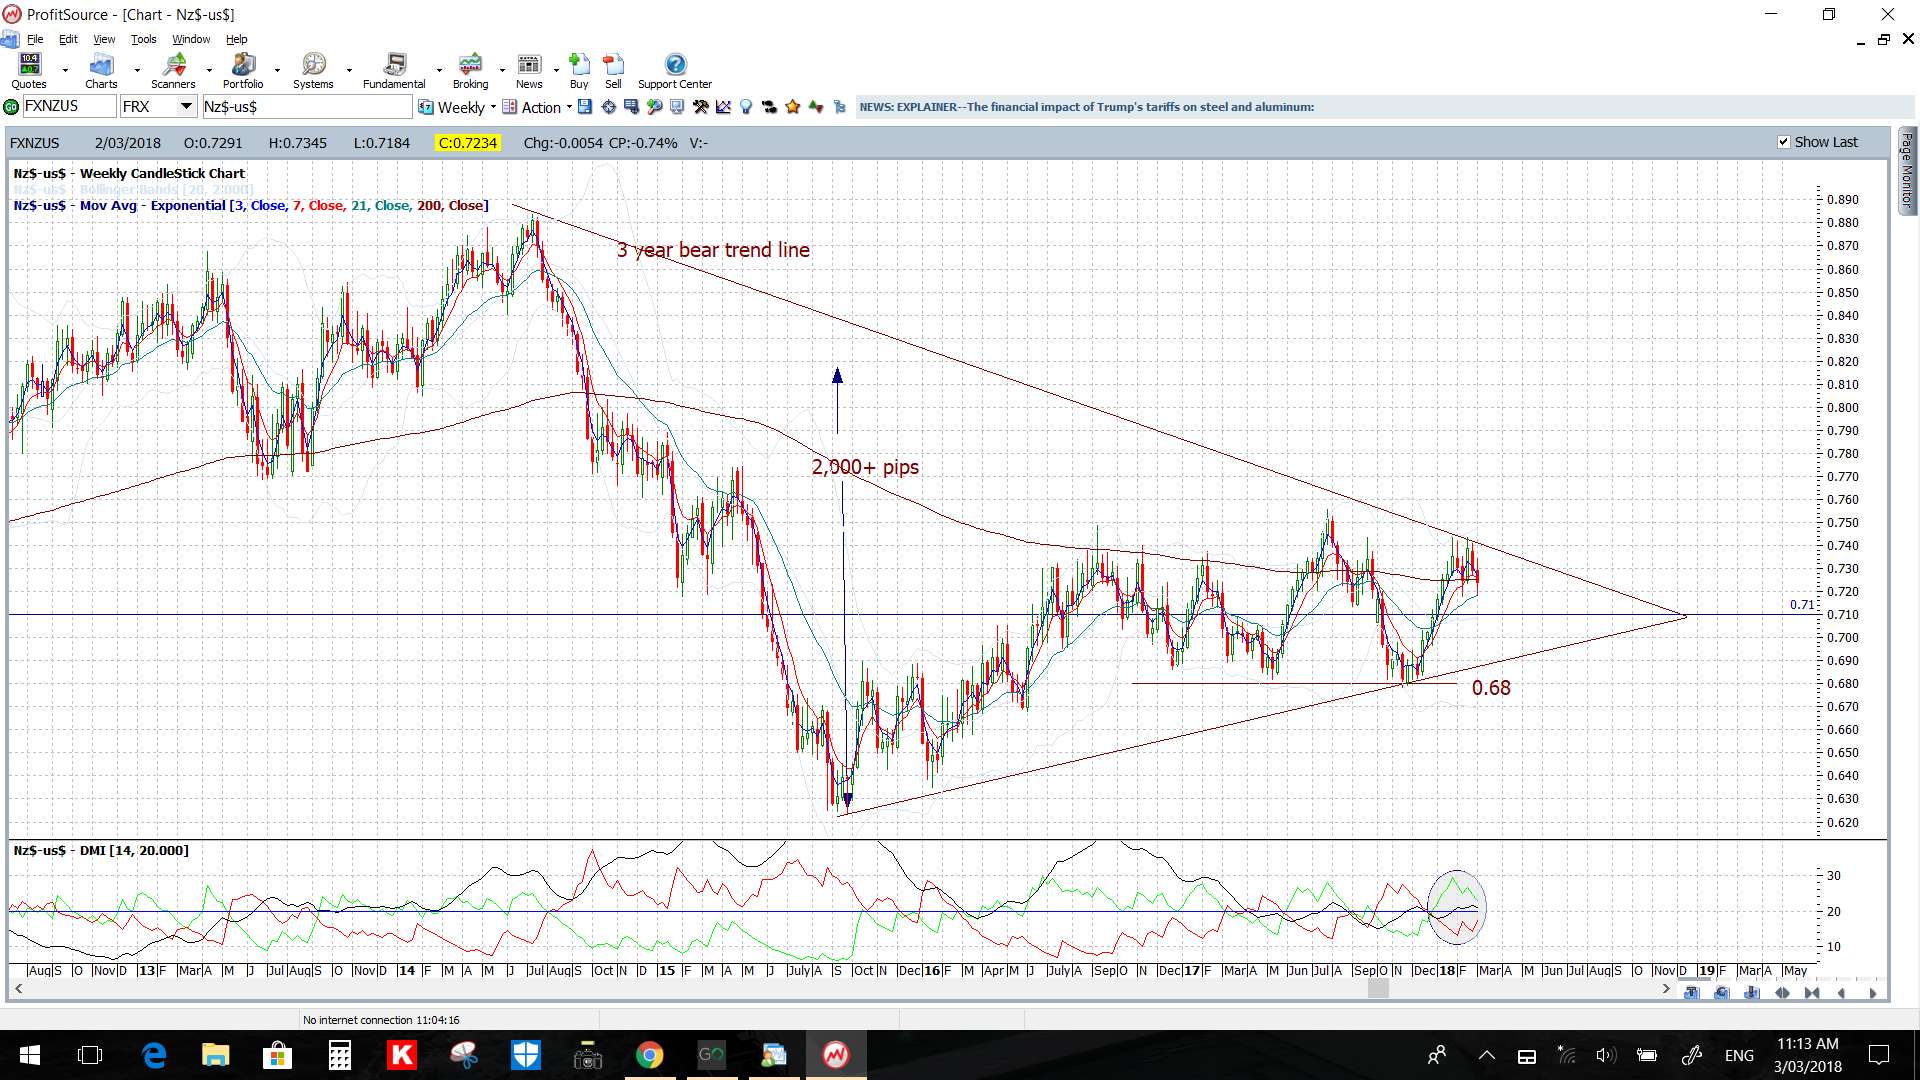
NZD/USD: The Kiwi retreated further last week and is back below the 0.73 level and trading within a new 4hr chart triangle.
The NZD/USD has also printed an, essentially, bearish coloured ‘Inside’ candle for February reflecting some clear indecision.
- Watch the 4hr chart trend lines for any new breakout.
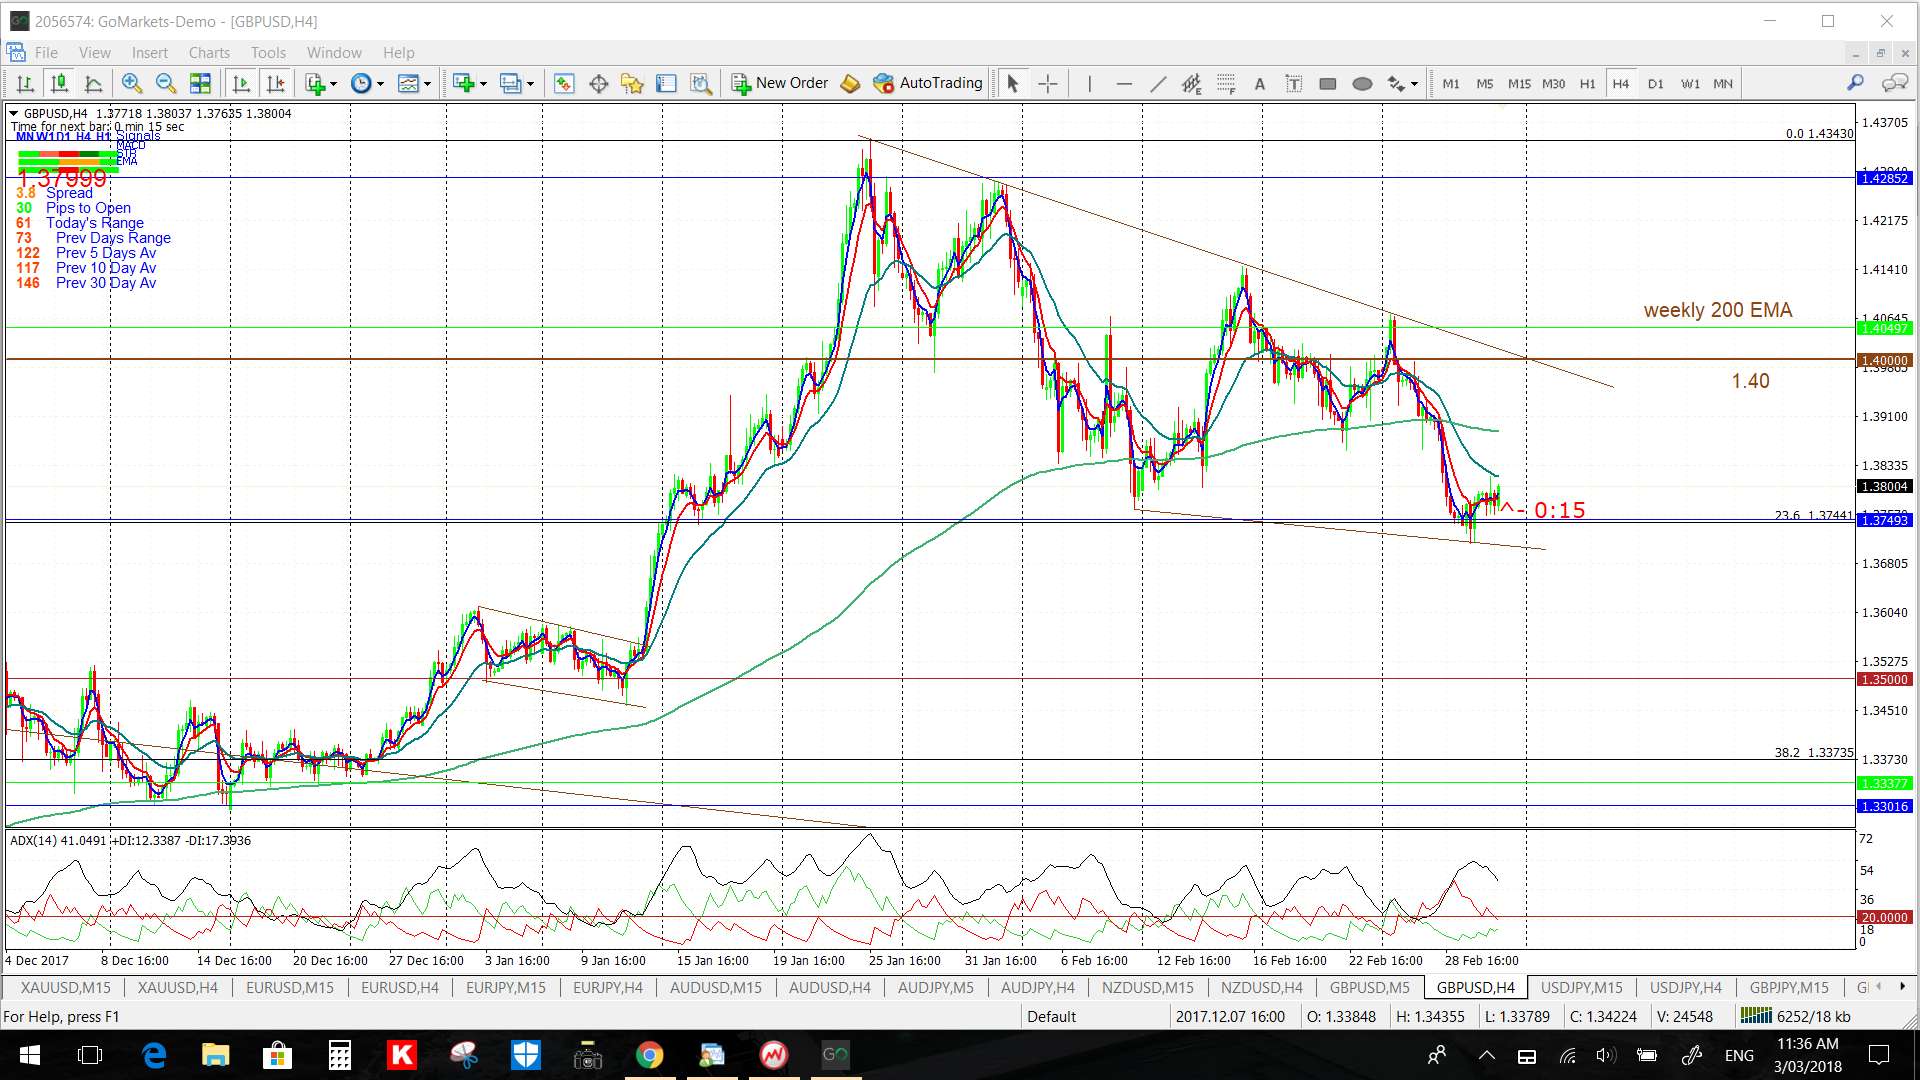
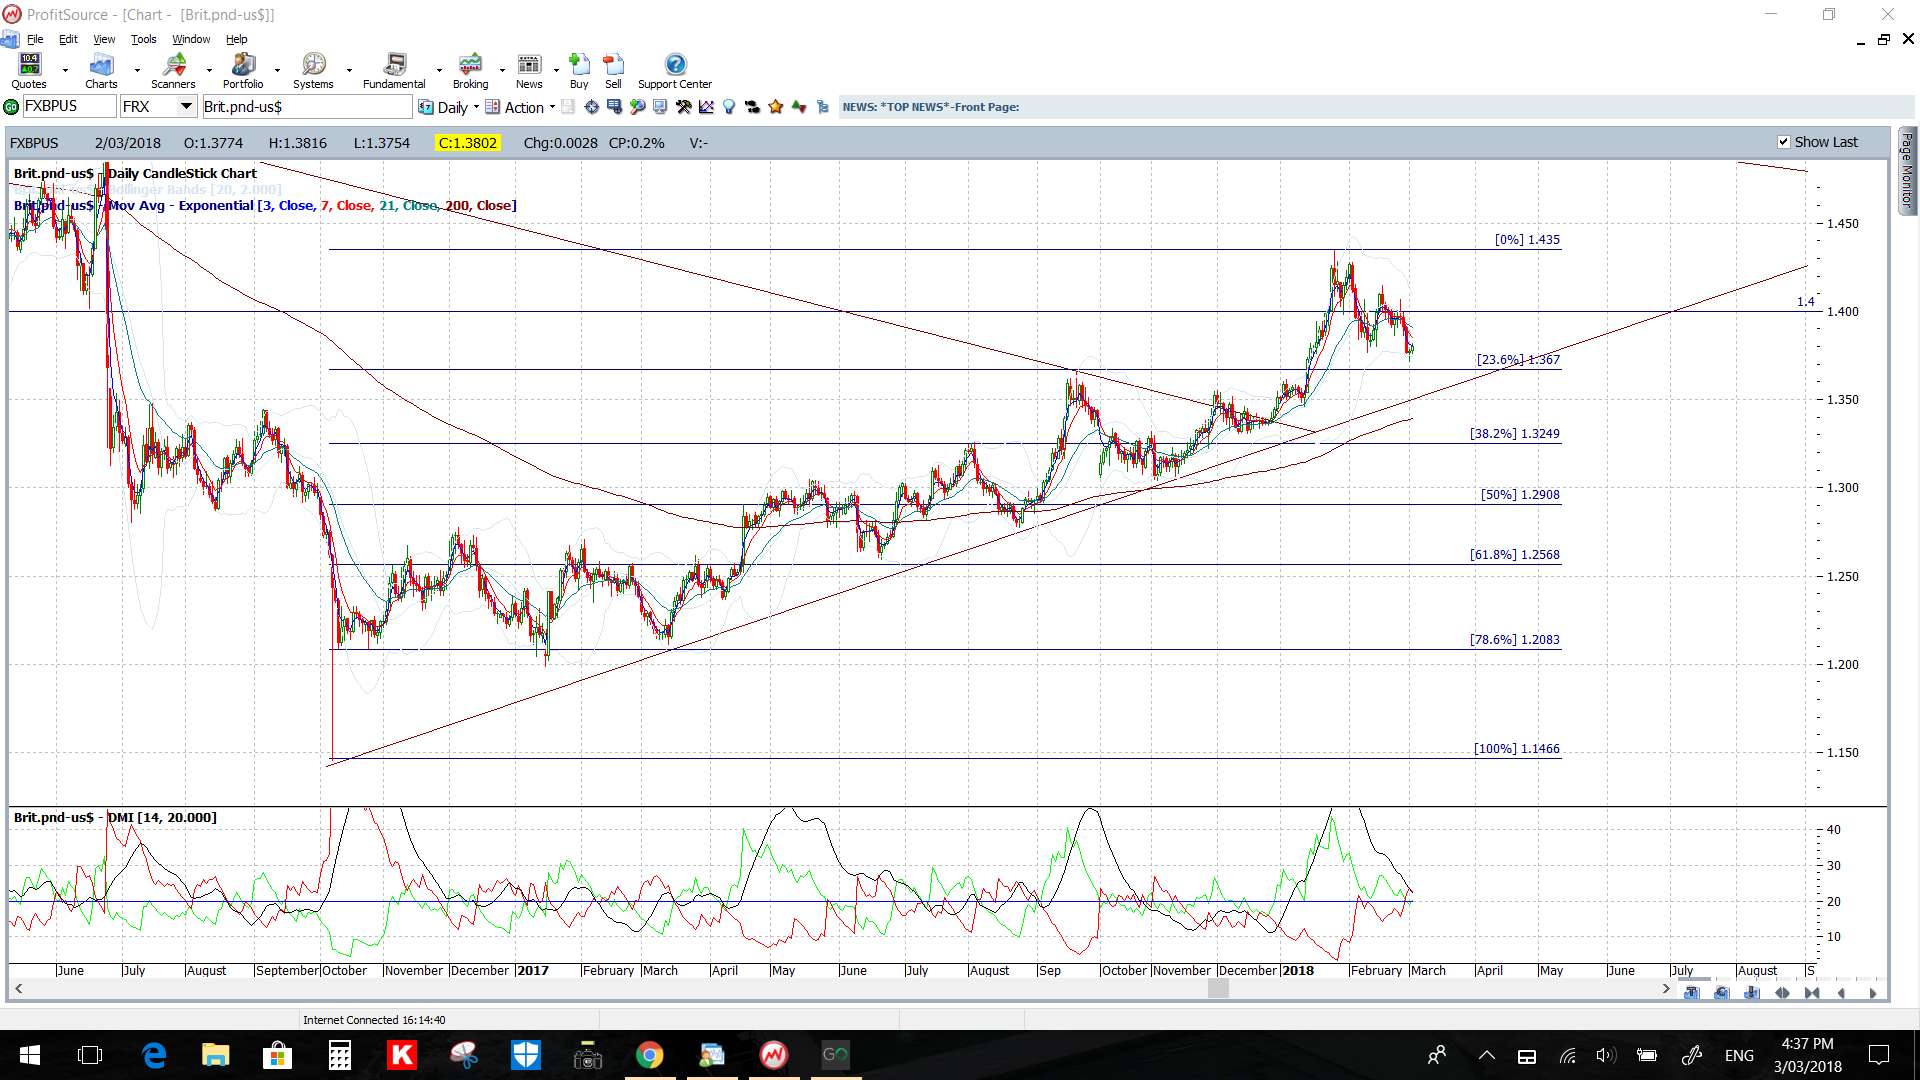
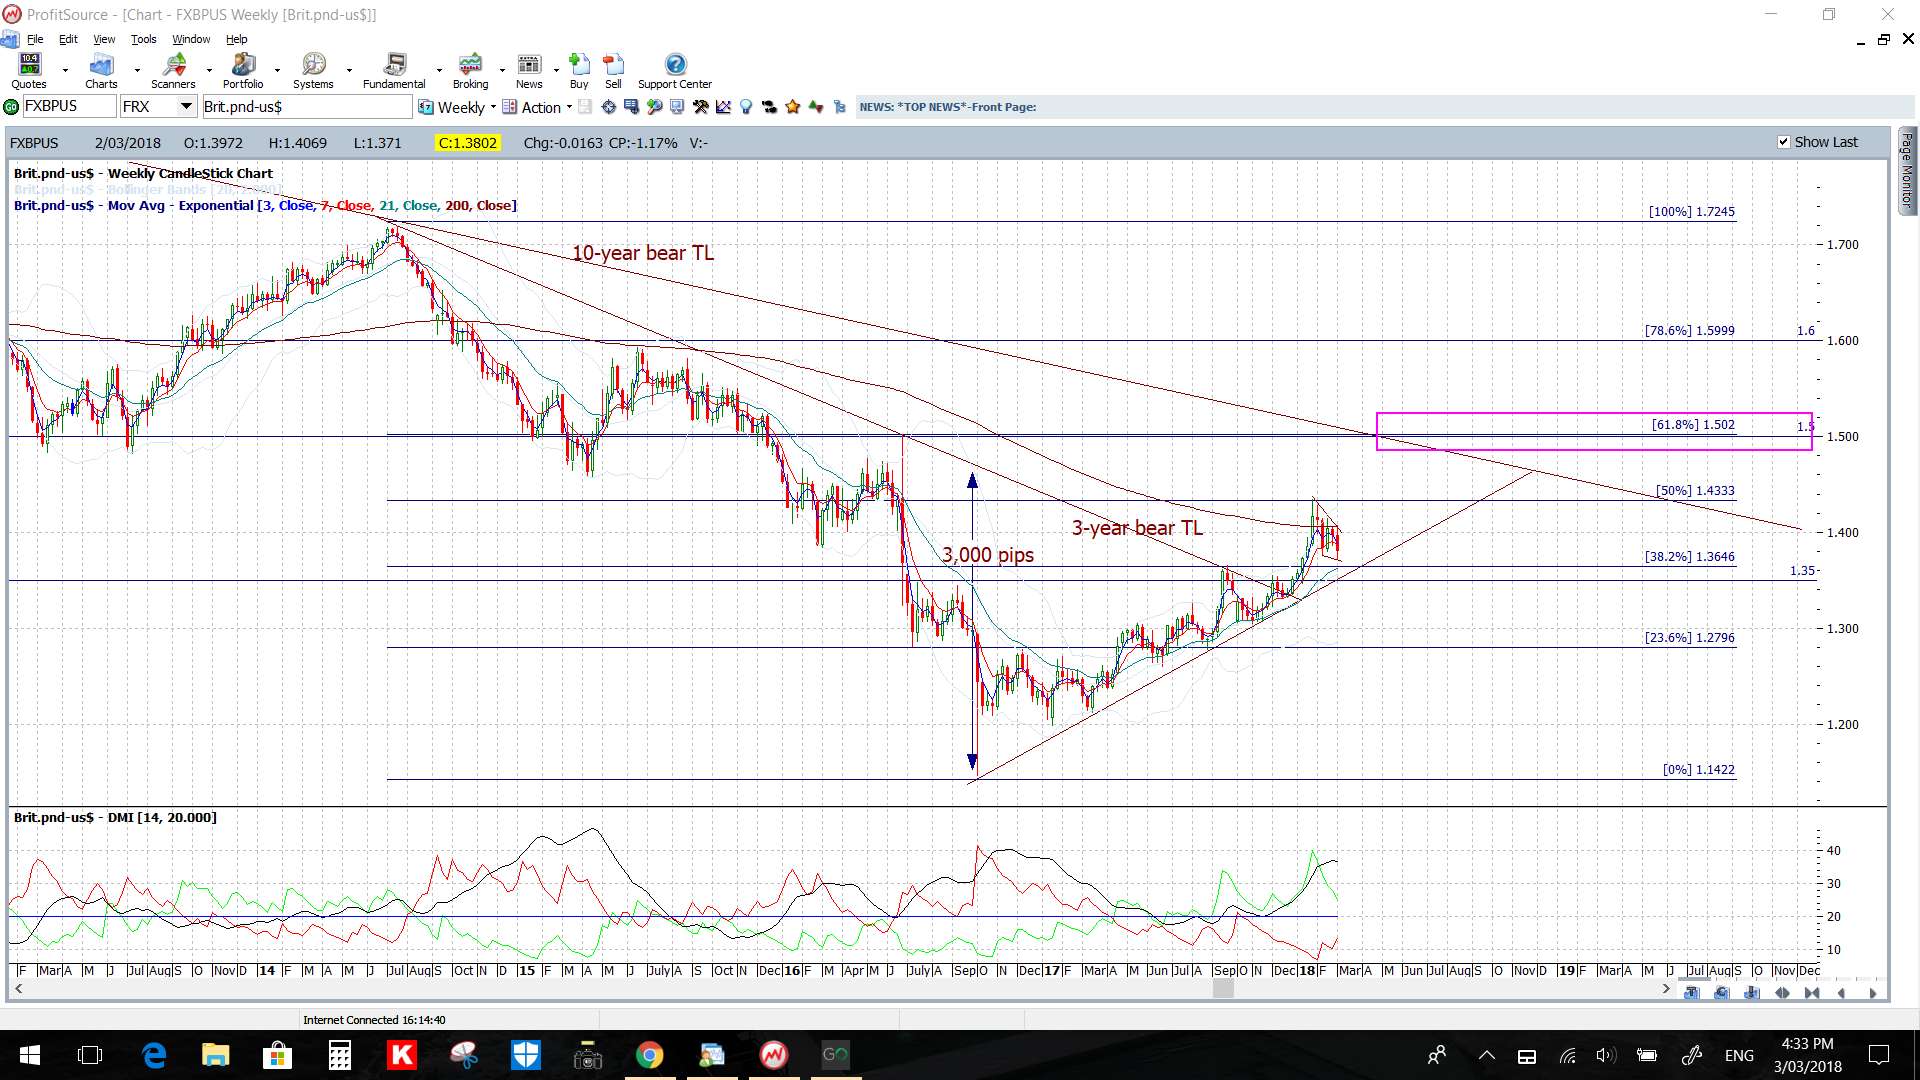
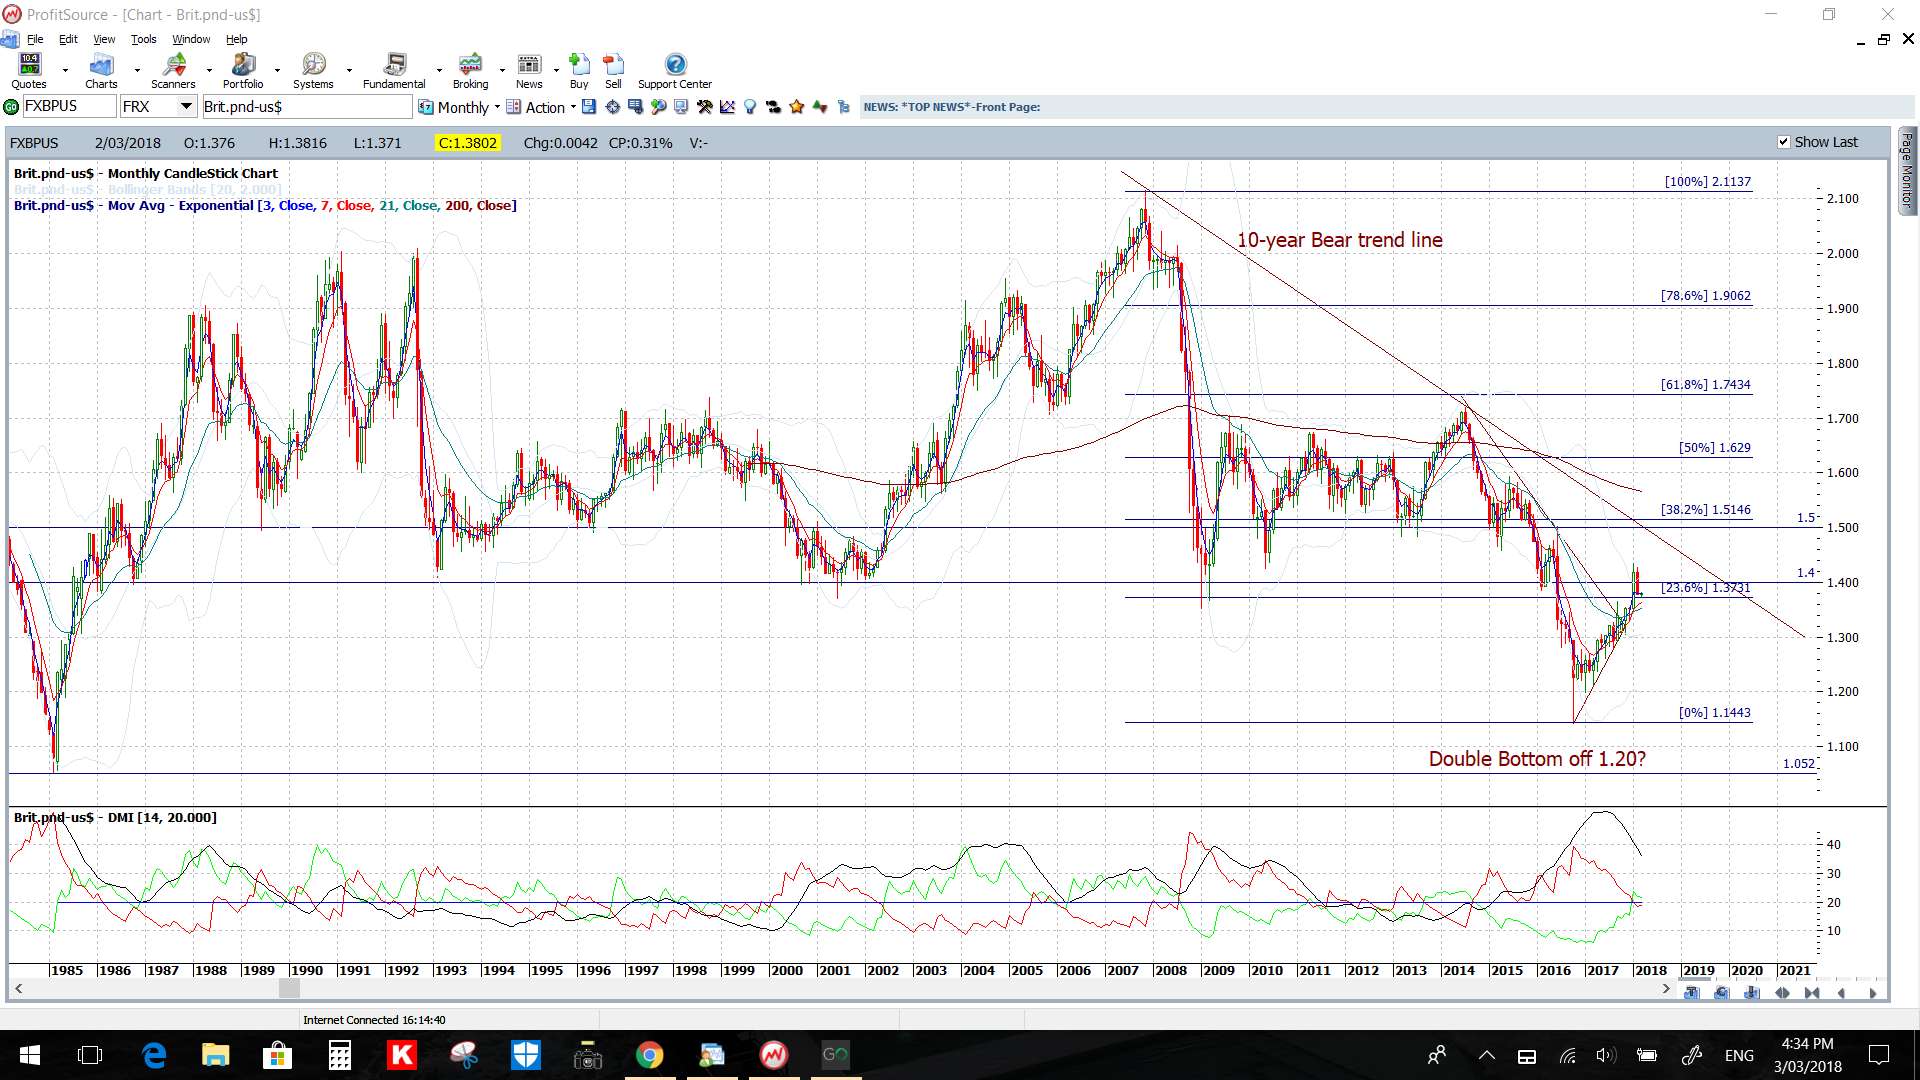
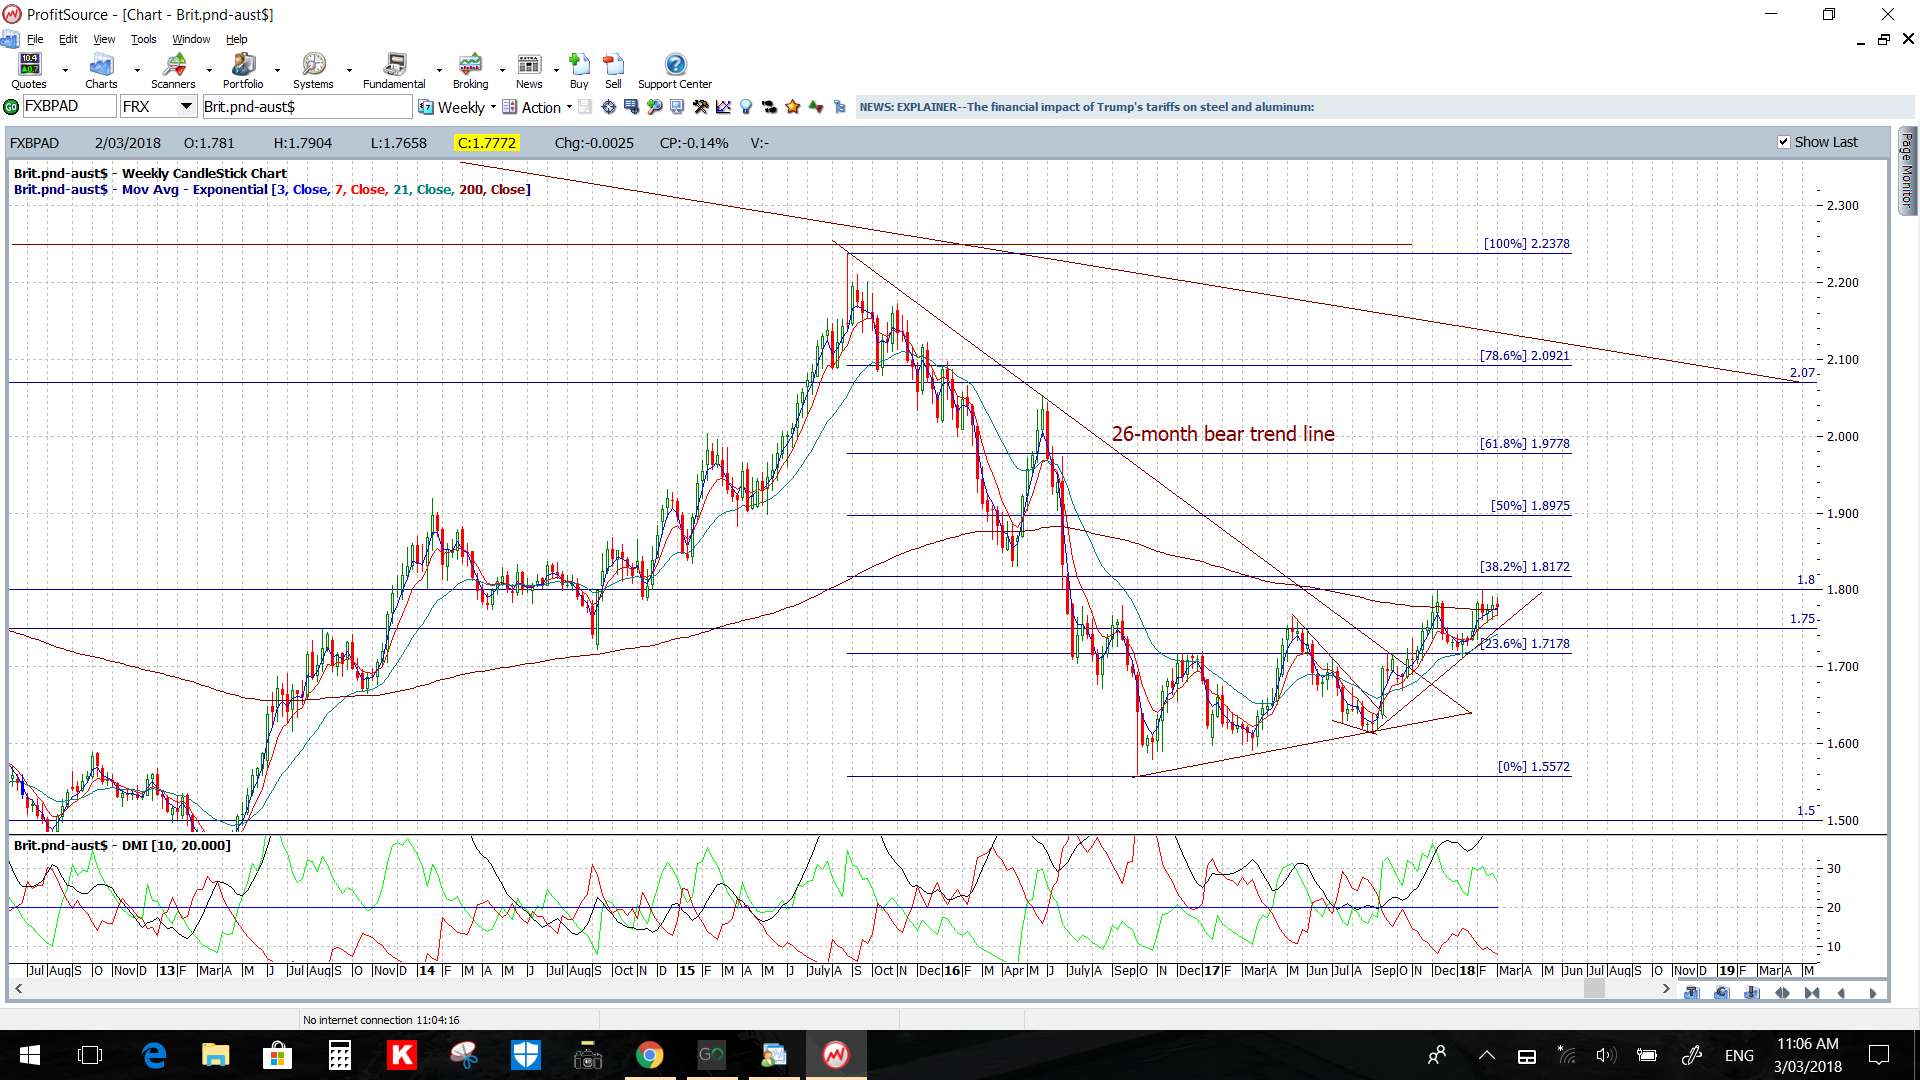
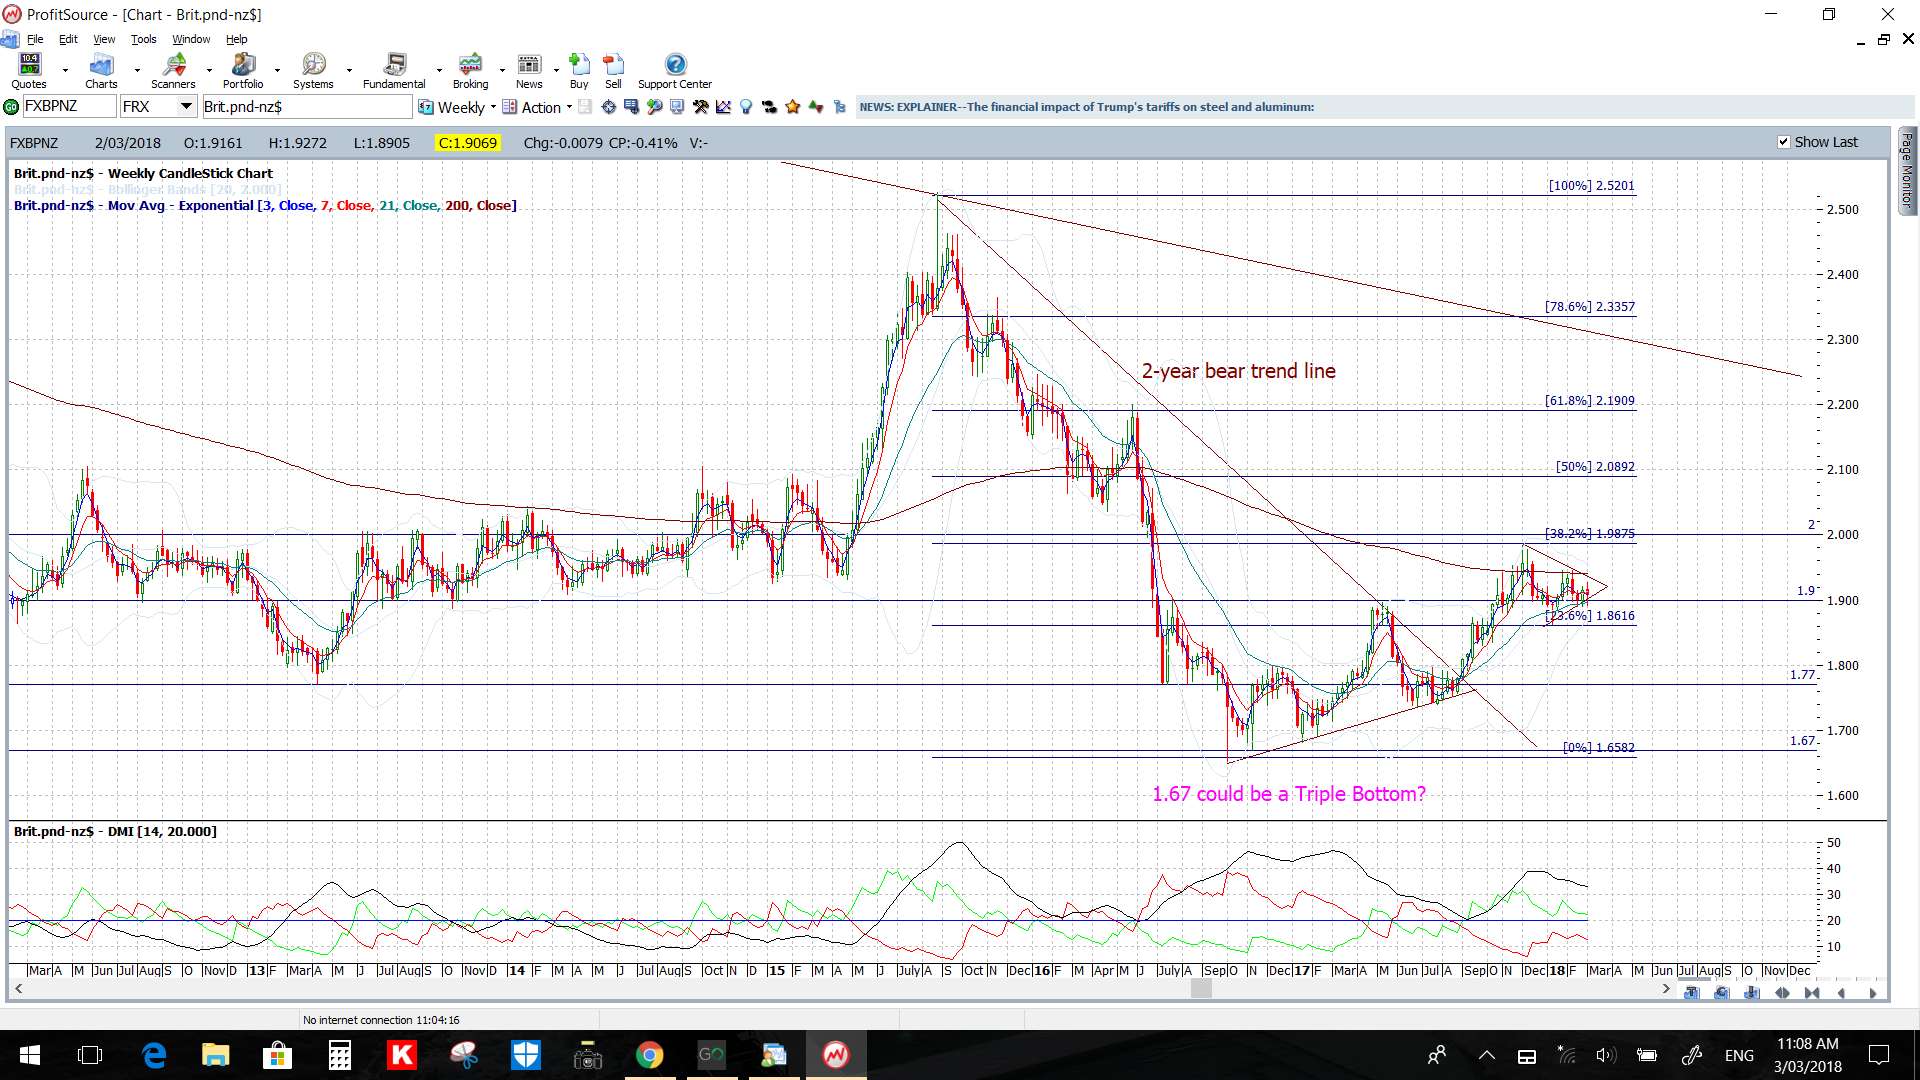
GBP/USD: The Cable retreated with the stronger US$ and renewed Brexit talk last week but is still in a Flag pattern, of sorts, on the 4hr chart and still consolidating under the key 1.40 level. This is a major S/R zone for this pair that is best viewed on the monthly chart when trying to assess its significance.
Note how the weekly support trend line is still in play here though. Any break below this support trend line however would have me looking down to the 1.25 level as this is the 61.8% fib of the last major swing high move (see daily chart).
Any move back above 1.40 would have me looking to the 1.50 region as this is the 61.8% fib of the weekly chart’s longer-term swing low move.
The Cable printed a bearish coloured ‘Inside’ candle for February reflecting the clear indecision here with the US$ fluctuation and renewed Brexit concern. Brexit seems to be back in focus again so make sure you keep updated with news as it is released.
- Watch the wedge trend lines and 1.40 level for any new breakout, especially with this week’s GBP Services PMI and Manufacturing Production data:
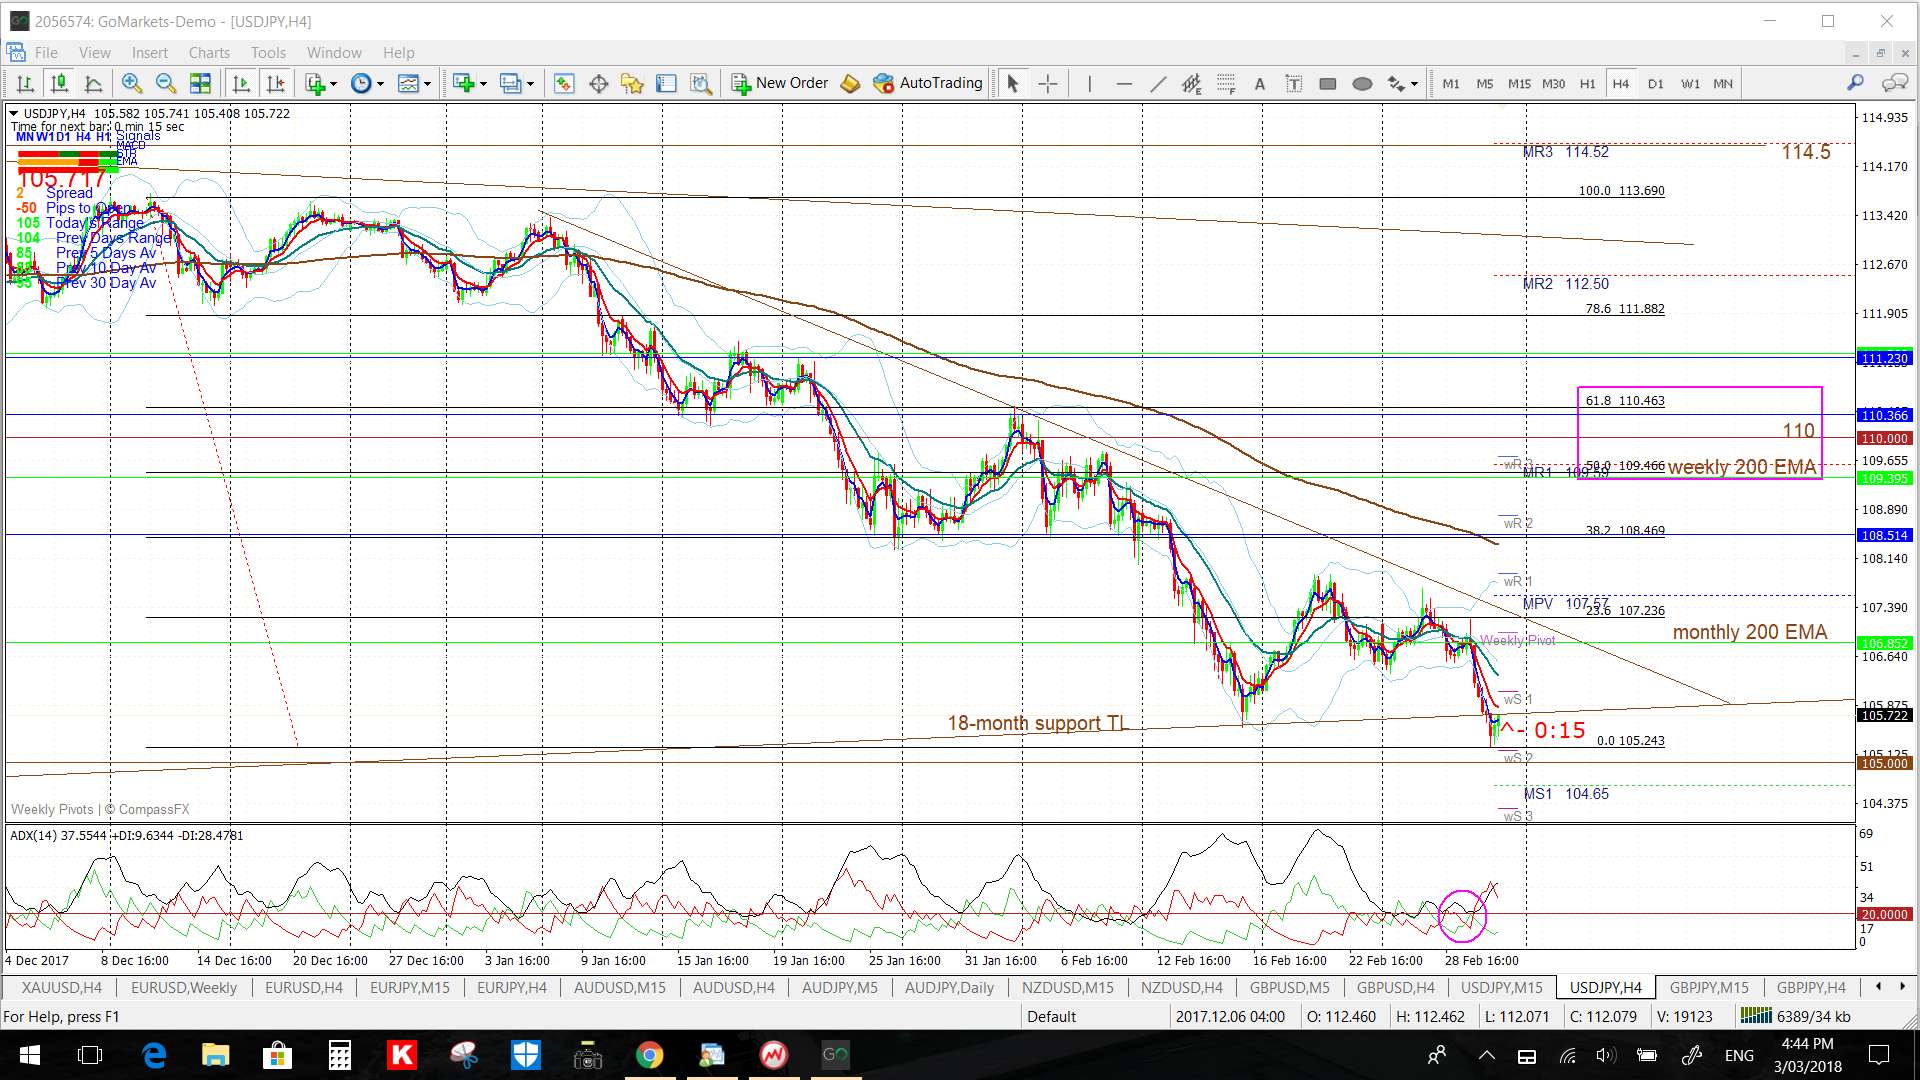
USD/JPY: Price action retreated to test the long-term support trend line last week and this came in just above the 105 S/R level. The weekly candle closed as an almost bearish engulfing candle though so watch for any further weakness here. There are 4 hr chart trend lines to monitor but the 105 is the level to watch for any new make or break.
The USD/JPY printed a decent sized bearish candle for February and a similar one for the recent week.
The BoJ update interest rates on Friday so caution is needed in the lead up to this data release.
- Watch the 4hr chart triangle trend lines and 105 level for any new breakout, especially with this week’s BoJ rate update:
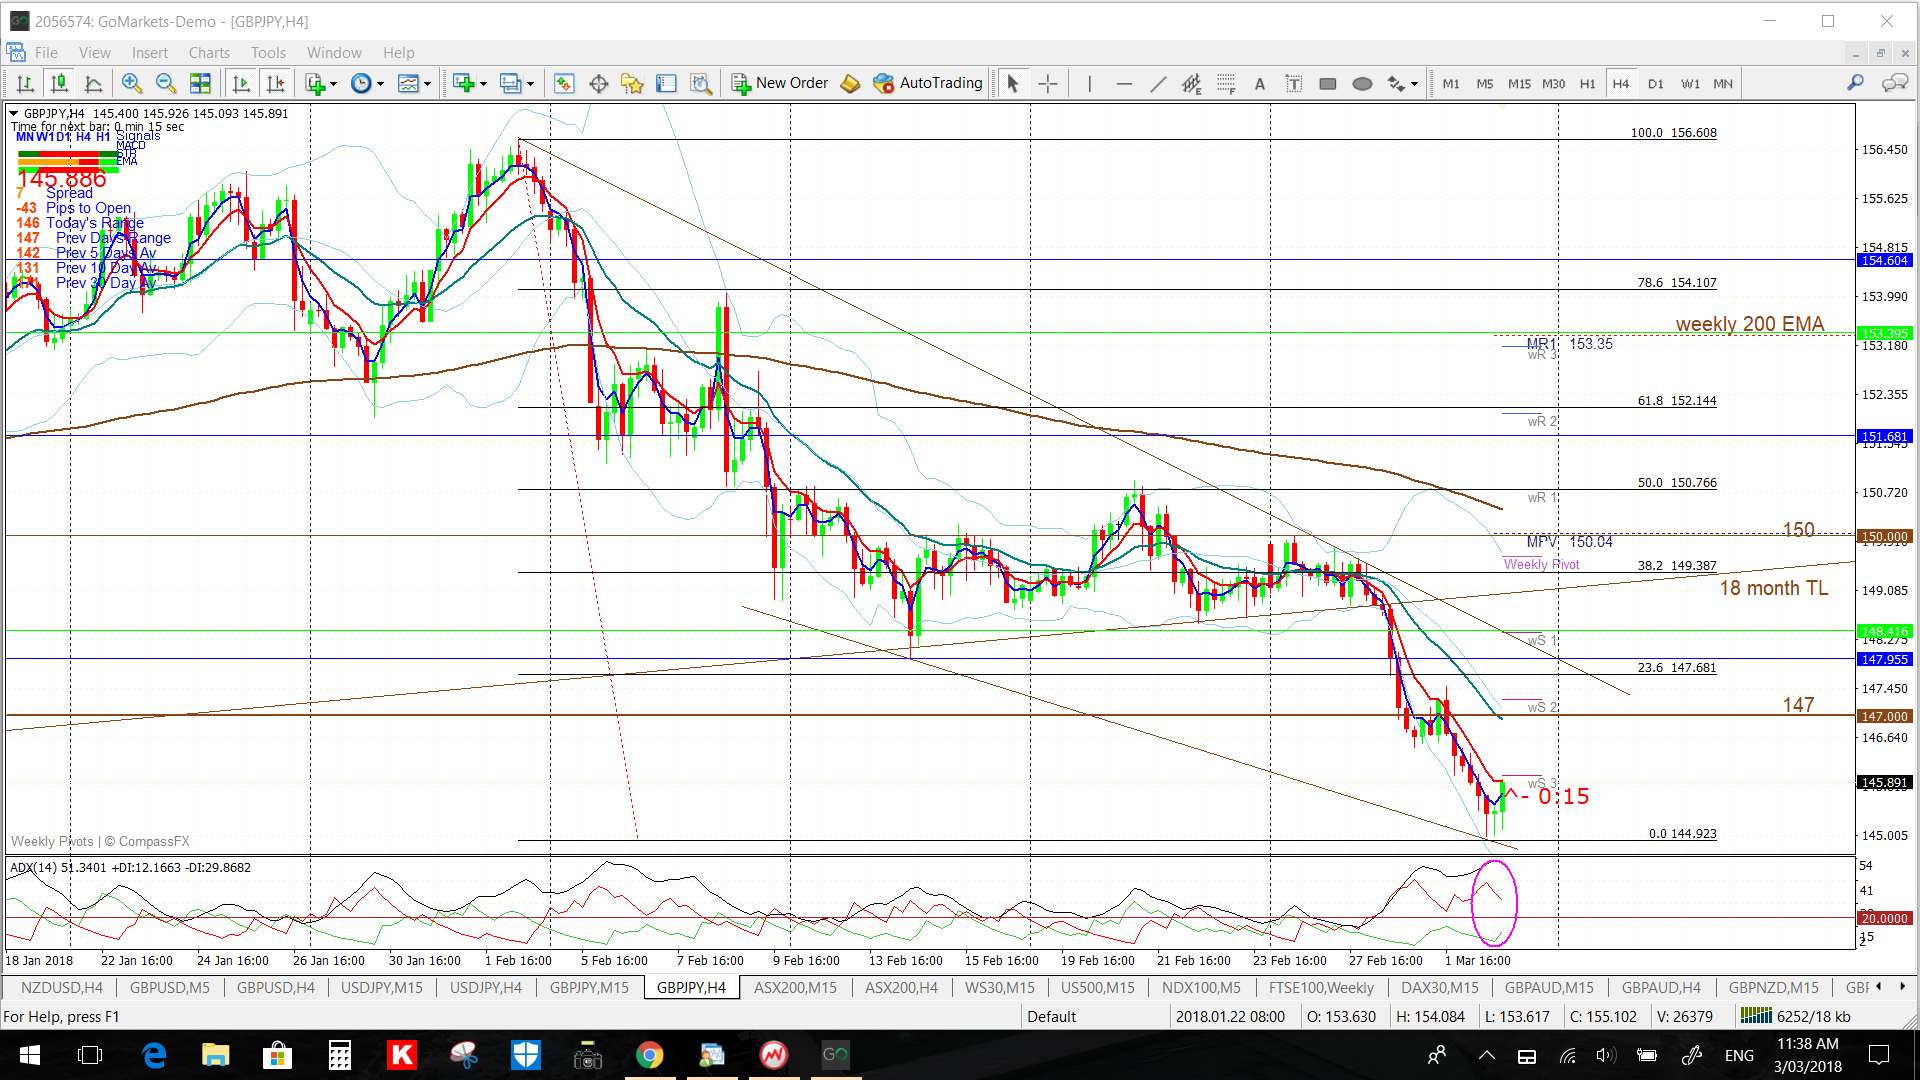
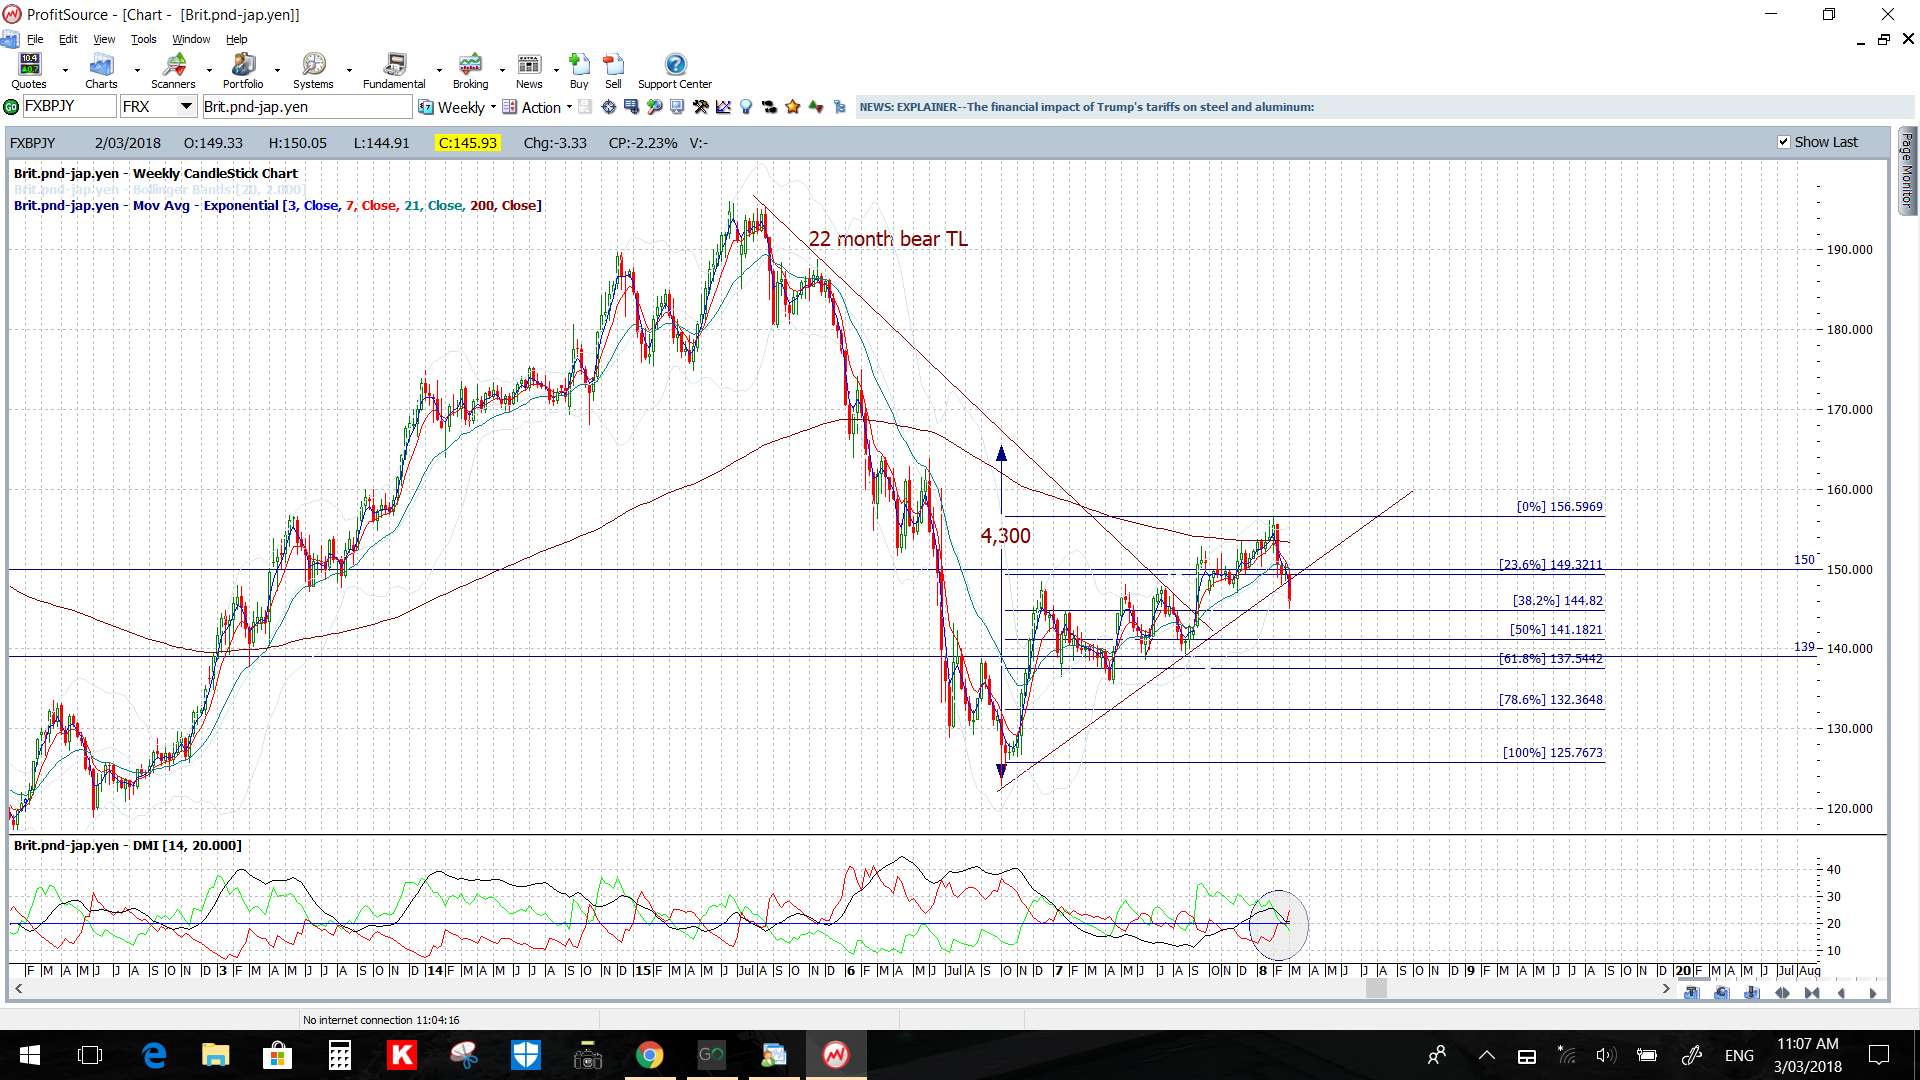
GBP/JPY: The GBP/JPY has given around 380 pips since breaking below the 18-month support trend line. Note how price has reached down to the weekly chart’s 50% fib and I’ll be watching to see if this continues any lower to test the 61.8% fib, near the 139 S/R level (see the weekly chart below).
Any bullish recovery would have me looking at S/R levels on the 4hr chart and these include the 147 and 150 levels, the previously broken 18-month bear trend line and the weekly 200 EMA:
- Watch the 4hr chart triangle trend lines for any new breakout, especially with this week’s BoJ rate update and the swathe of GBP data:
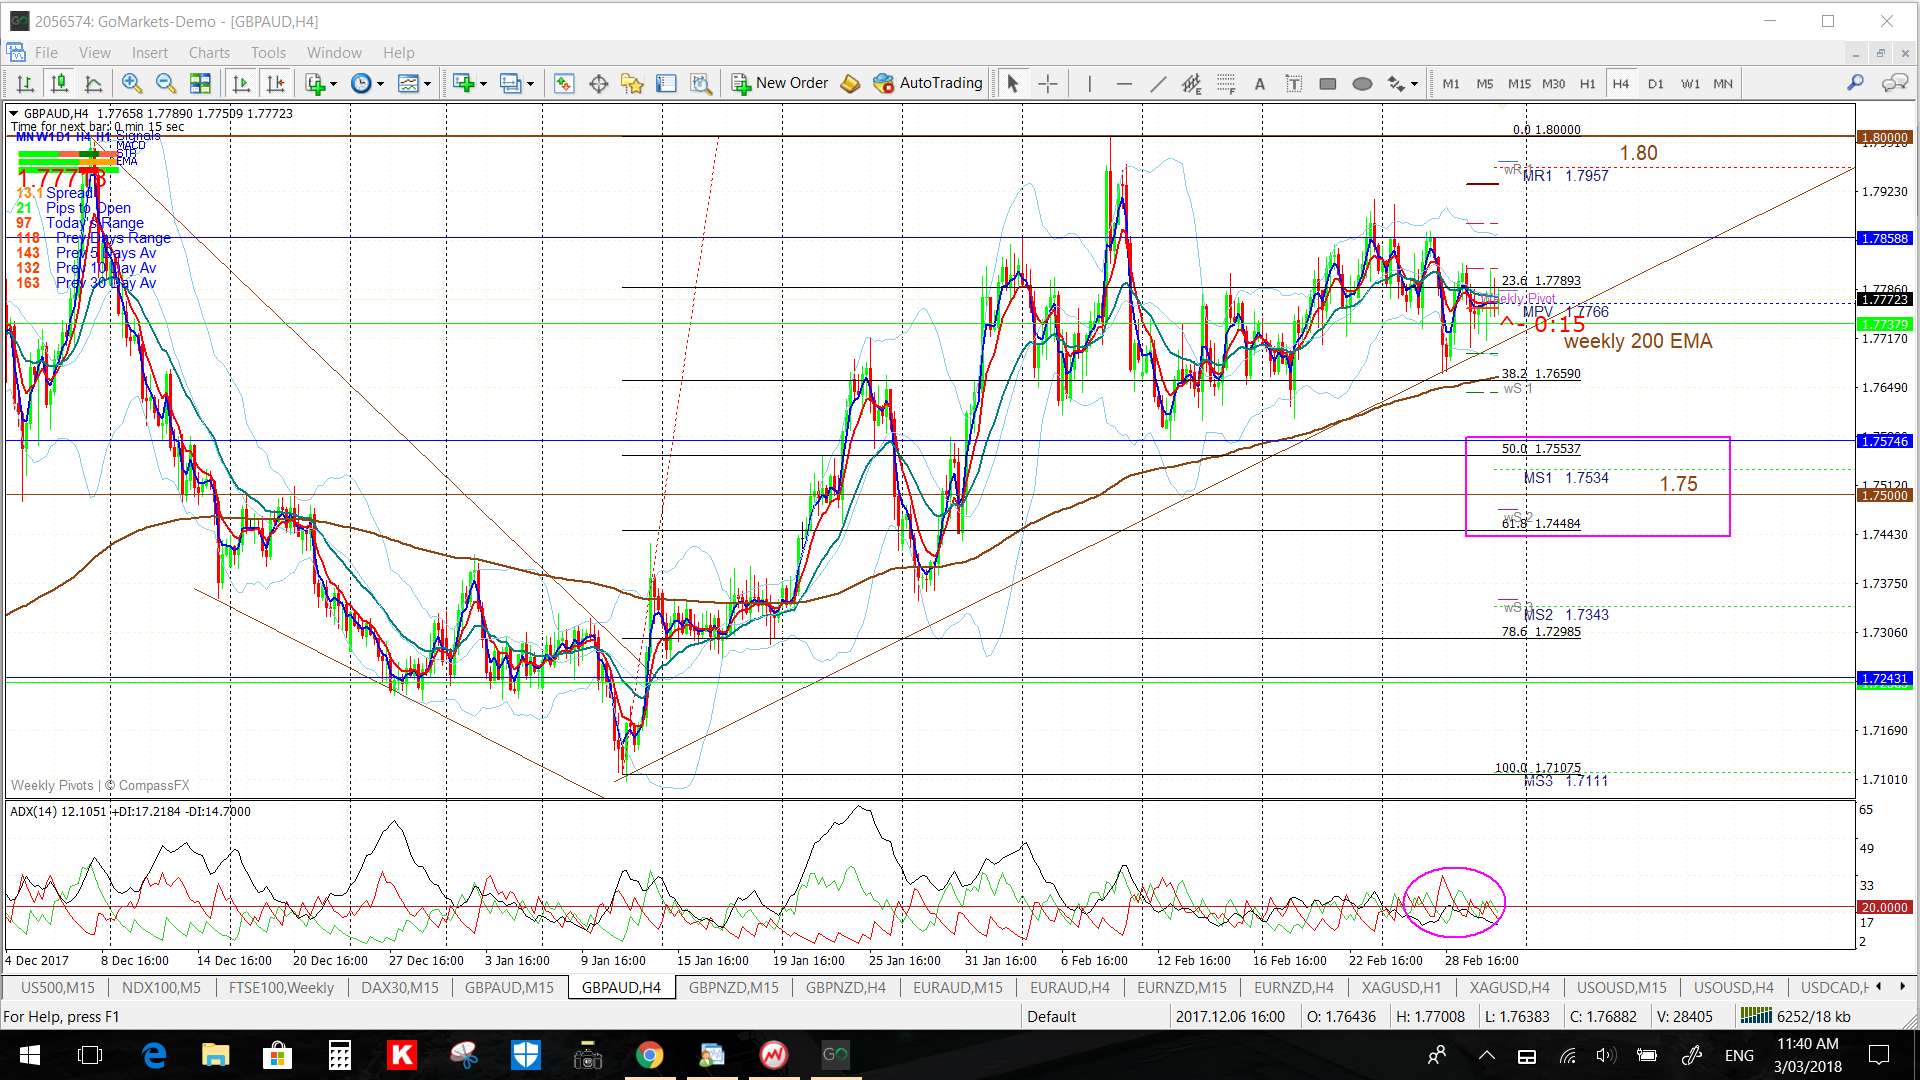
GBP/AUD: This traded a bit lower last week but the 1.80 S/R level is still in focus.
- Watch the 4hr chart’s triangle trend lines and weekly 200 EMA for any new breakout:
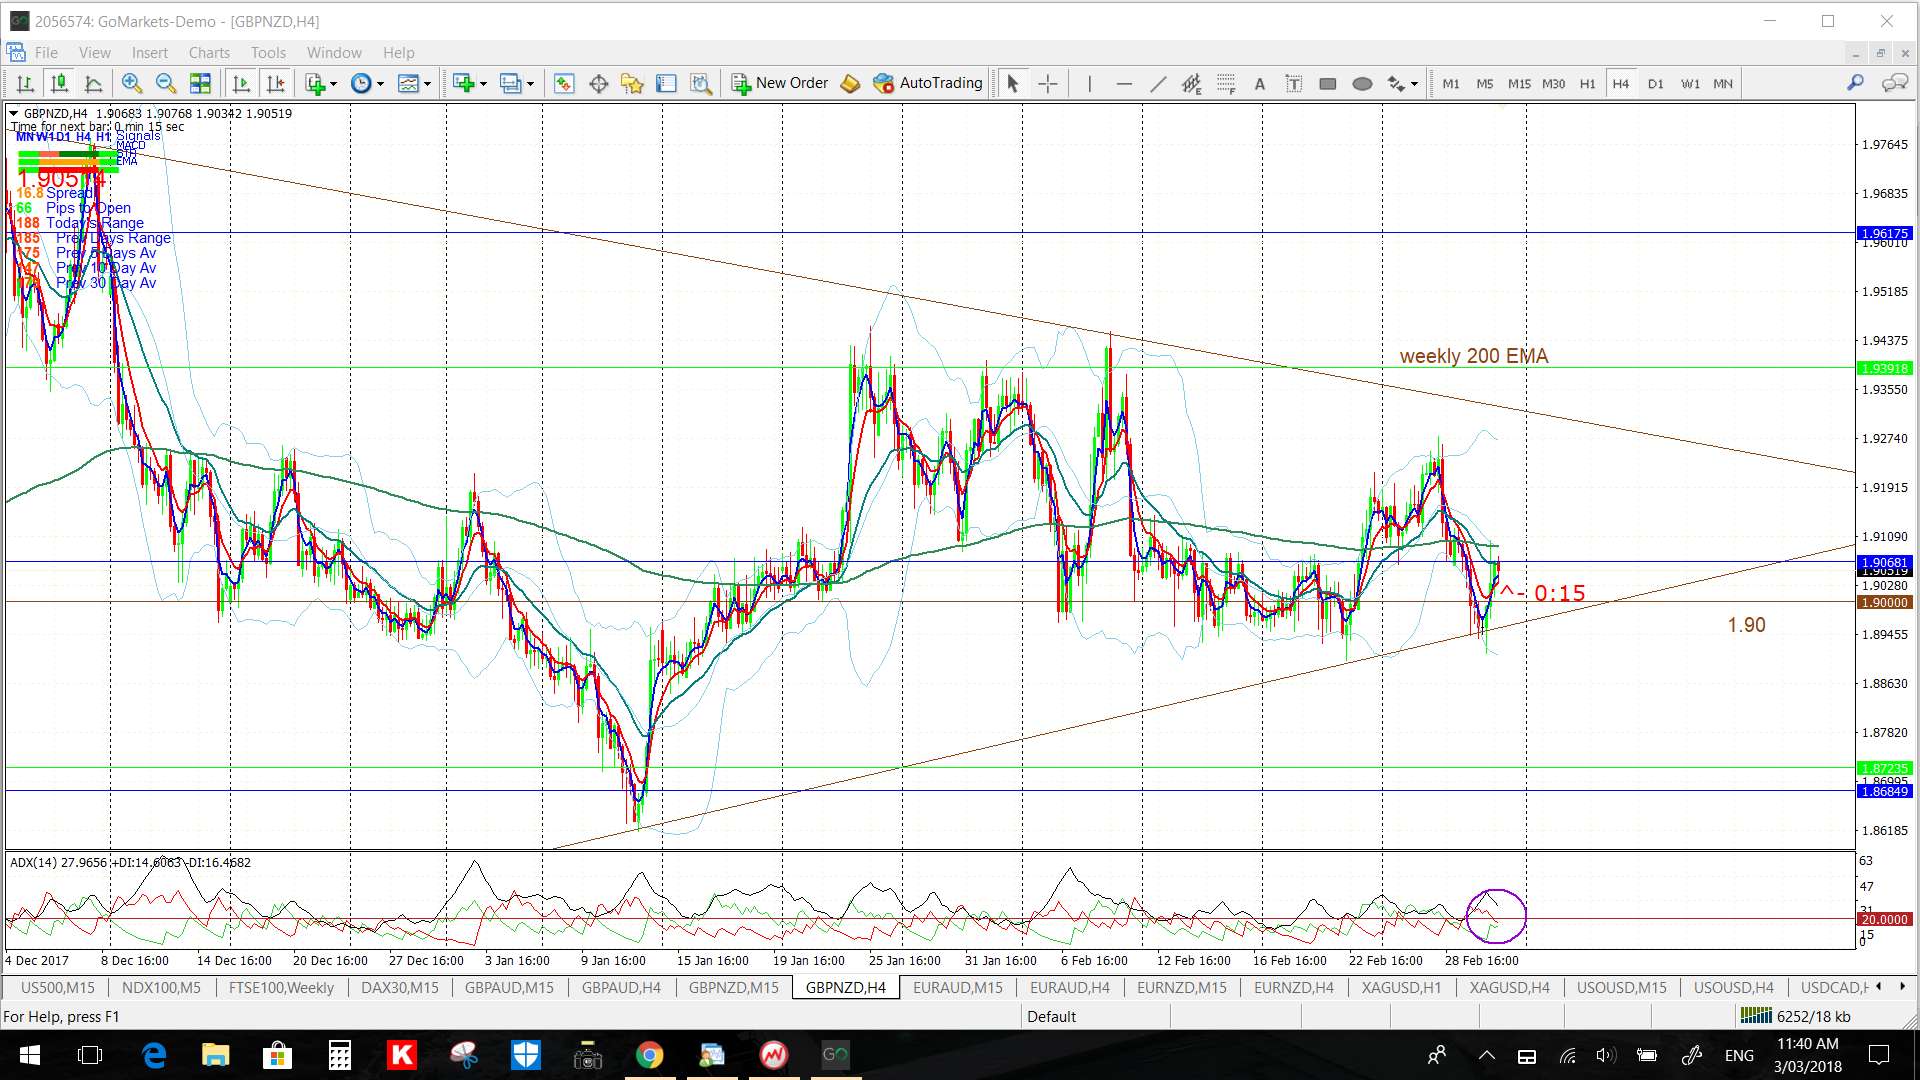
GBP/NZD: Price action continues to consolidate sideways, and never too far from the 1.90 level.
- Watch the 4hr/weekly chart triangle trend lines for any new breakout.
EUR/AUD: Price action broke up and out from a channel late last week for about 100 pips.
I’m struggling to find a decent pattern to pick here but note that that there is a recent support trend line in play and extrapolating this up to a recent High gives a weekly triangle of sorts. Thus, this may be the better chart to watch for any trend line breakout in coming sessions.
- Watch the weekly chart triangle trend lines for any new breakout.
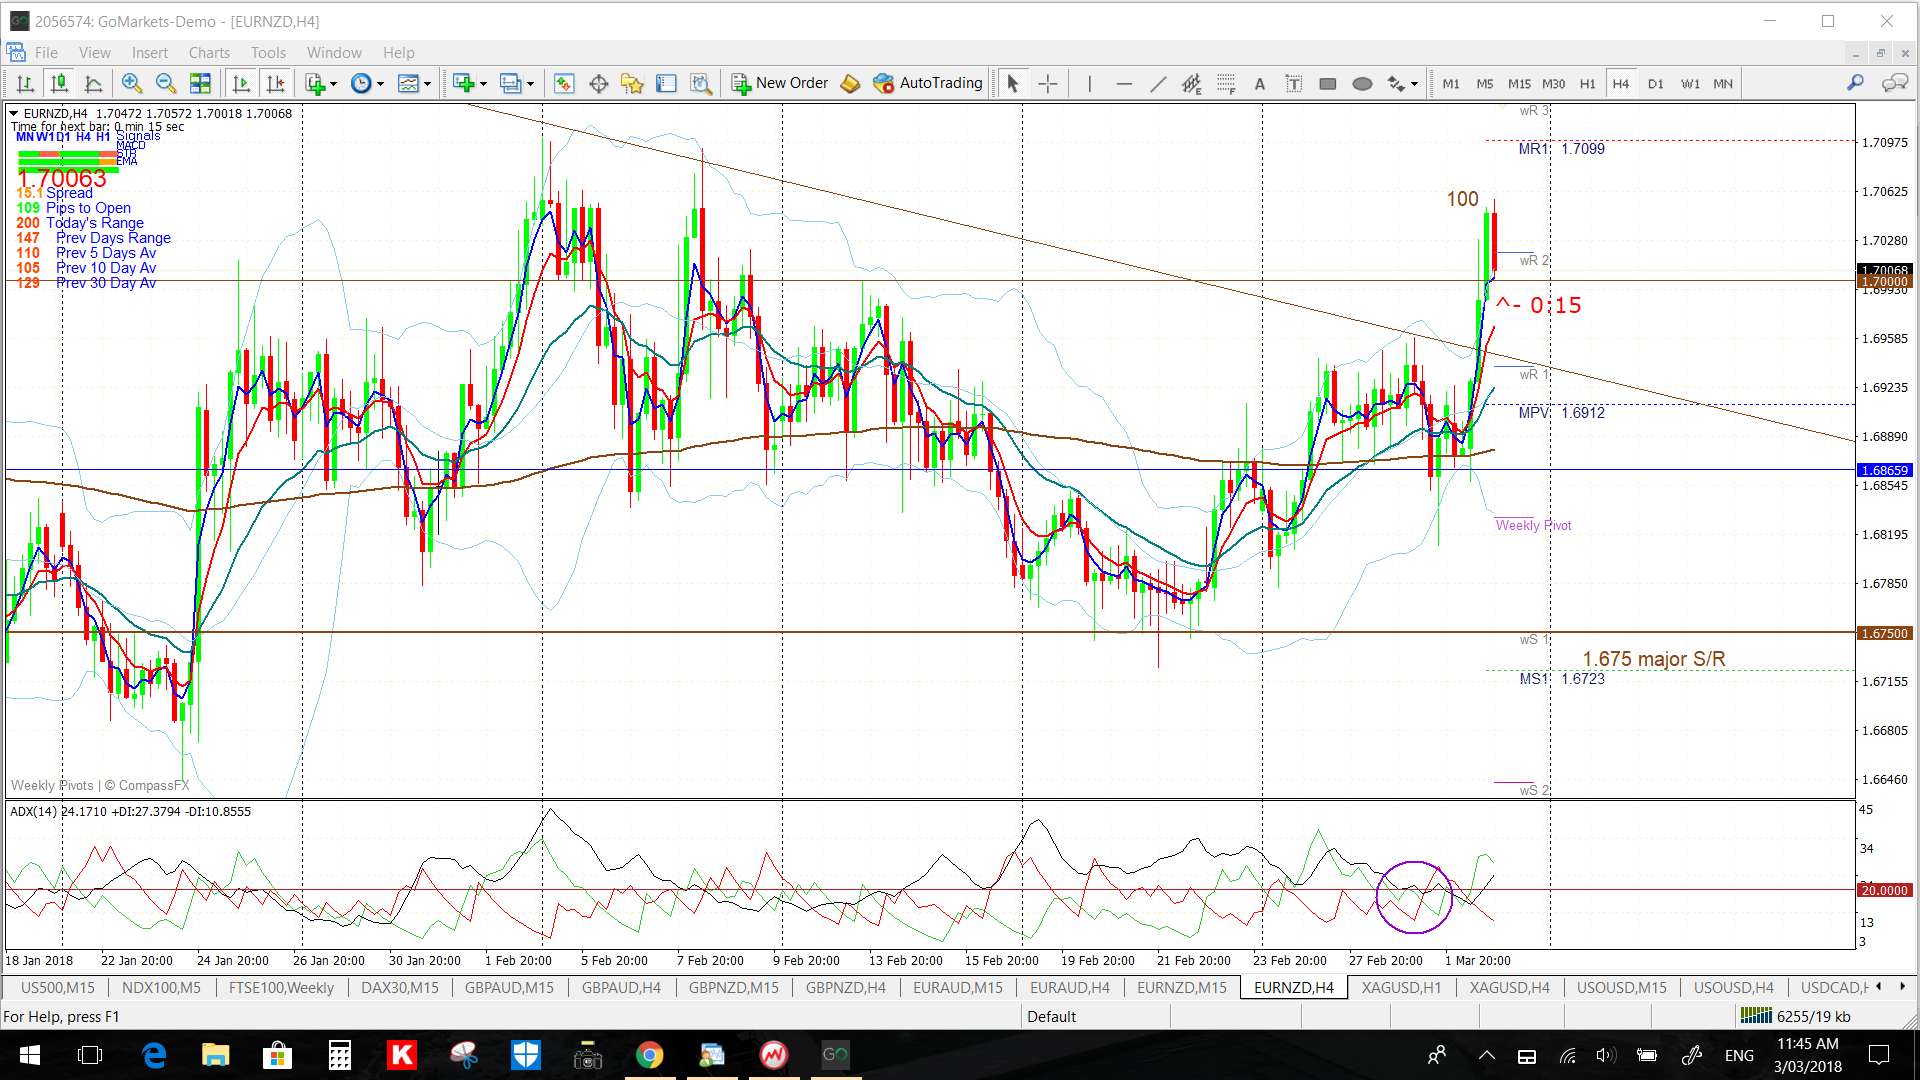
EUR/NZD: This gave a trend line breakout on Friday for 100 pips and, in doing so, looks to have made a new weekly chart triangle breakout although there is little supporting momentum at the moment.
Price closed the week right on the 1.70 level last week and so this will be the one to watch for any new make or break activity.
- Watch the 1.70 level for any new make or break:
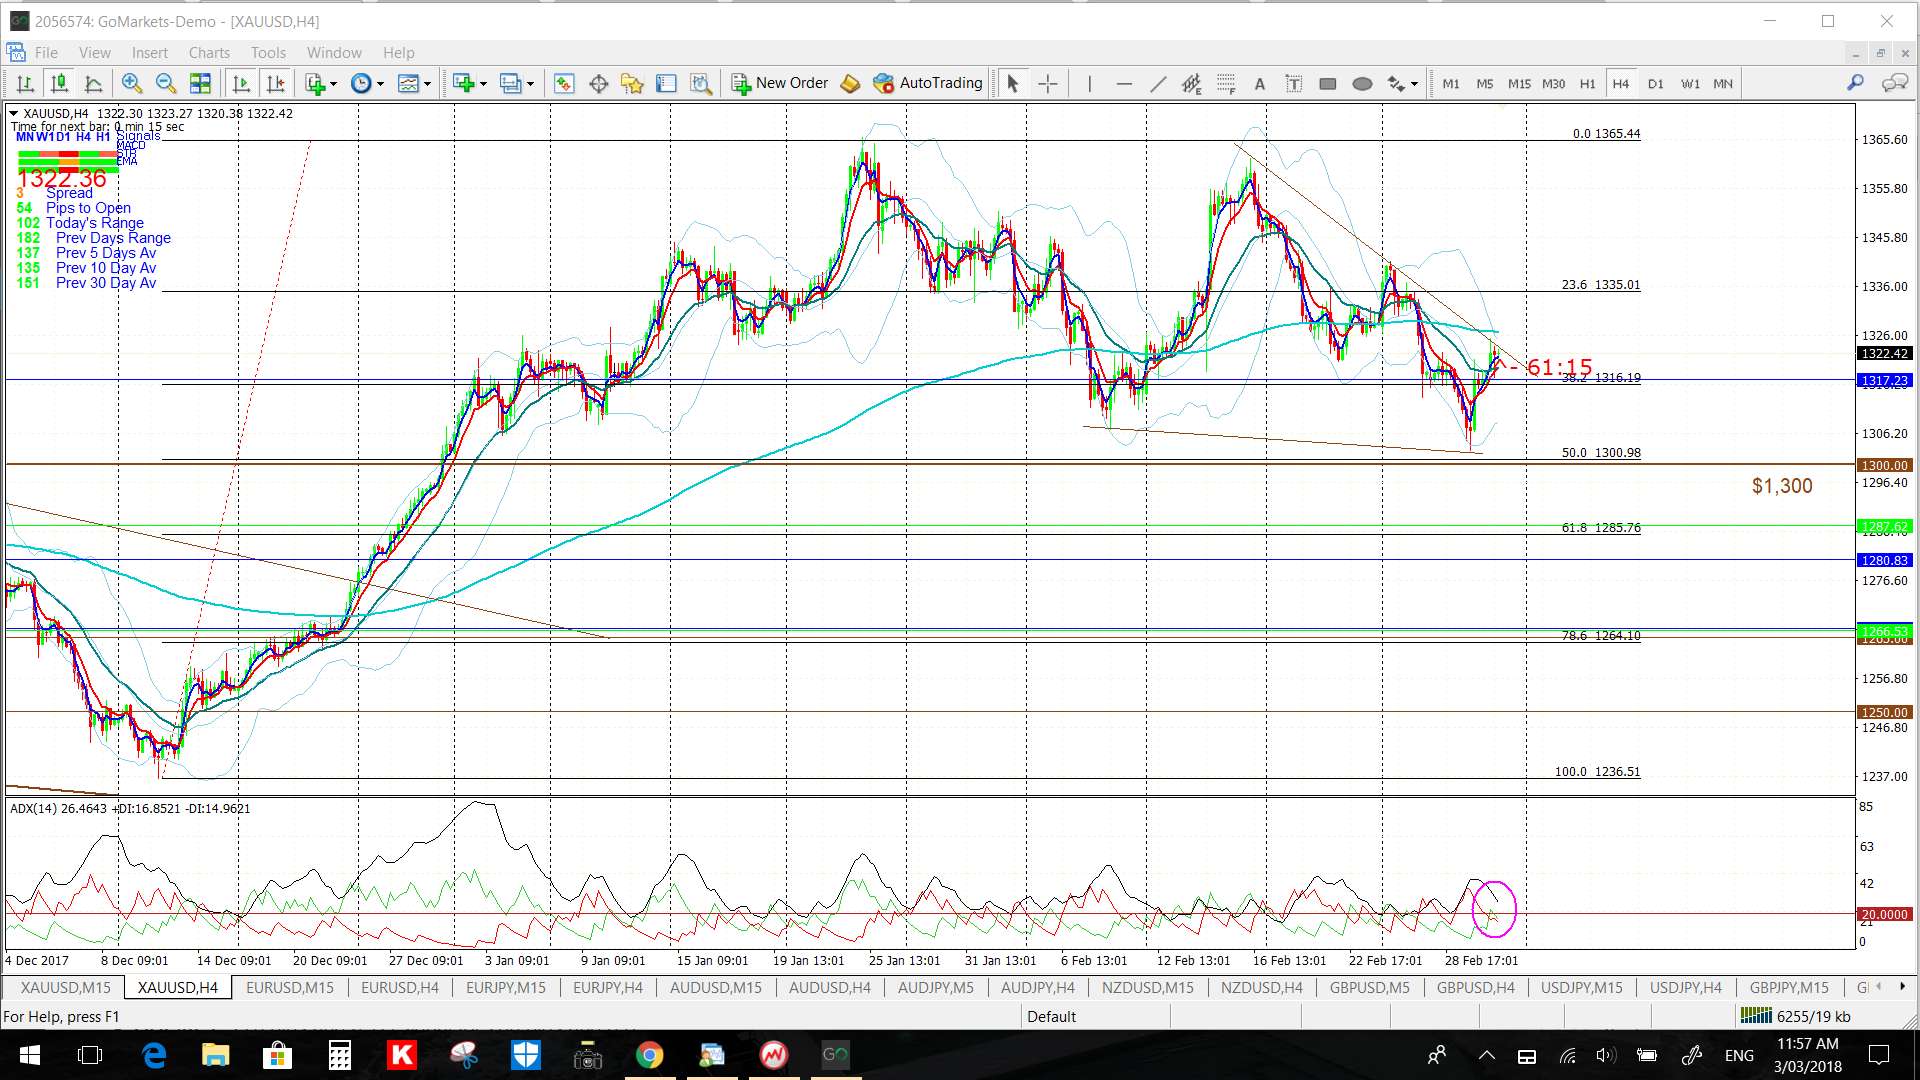
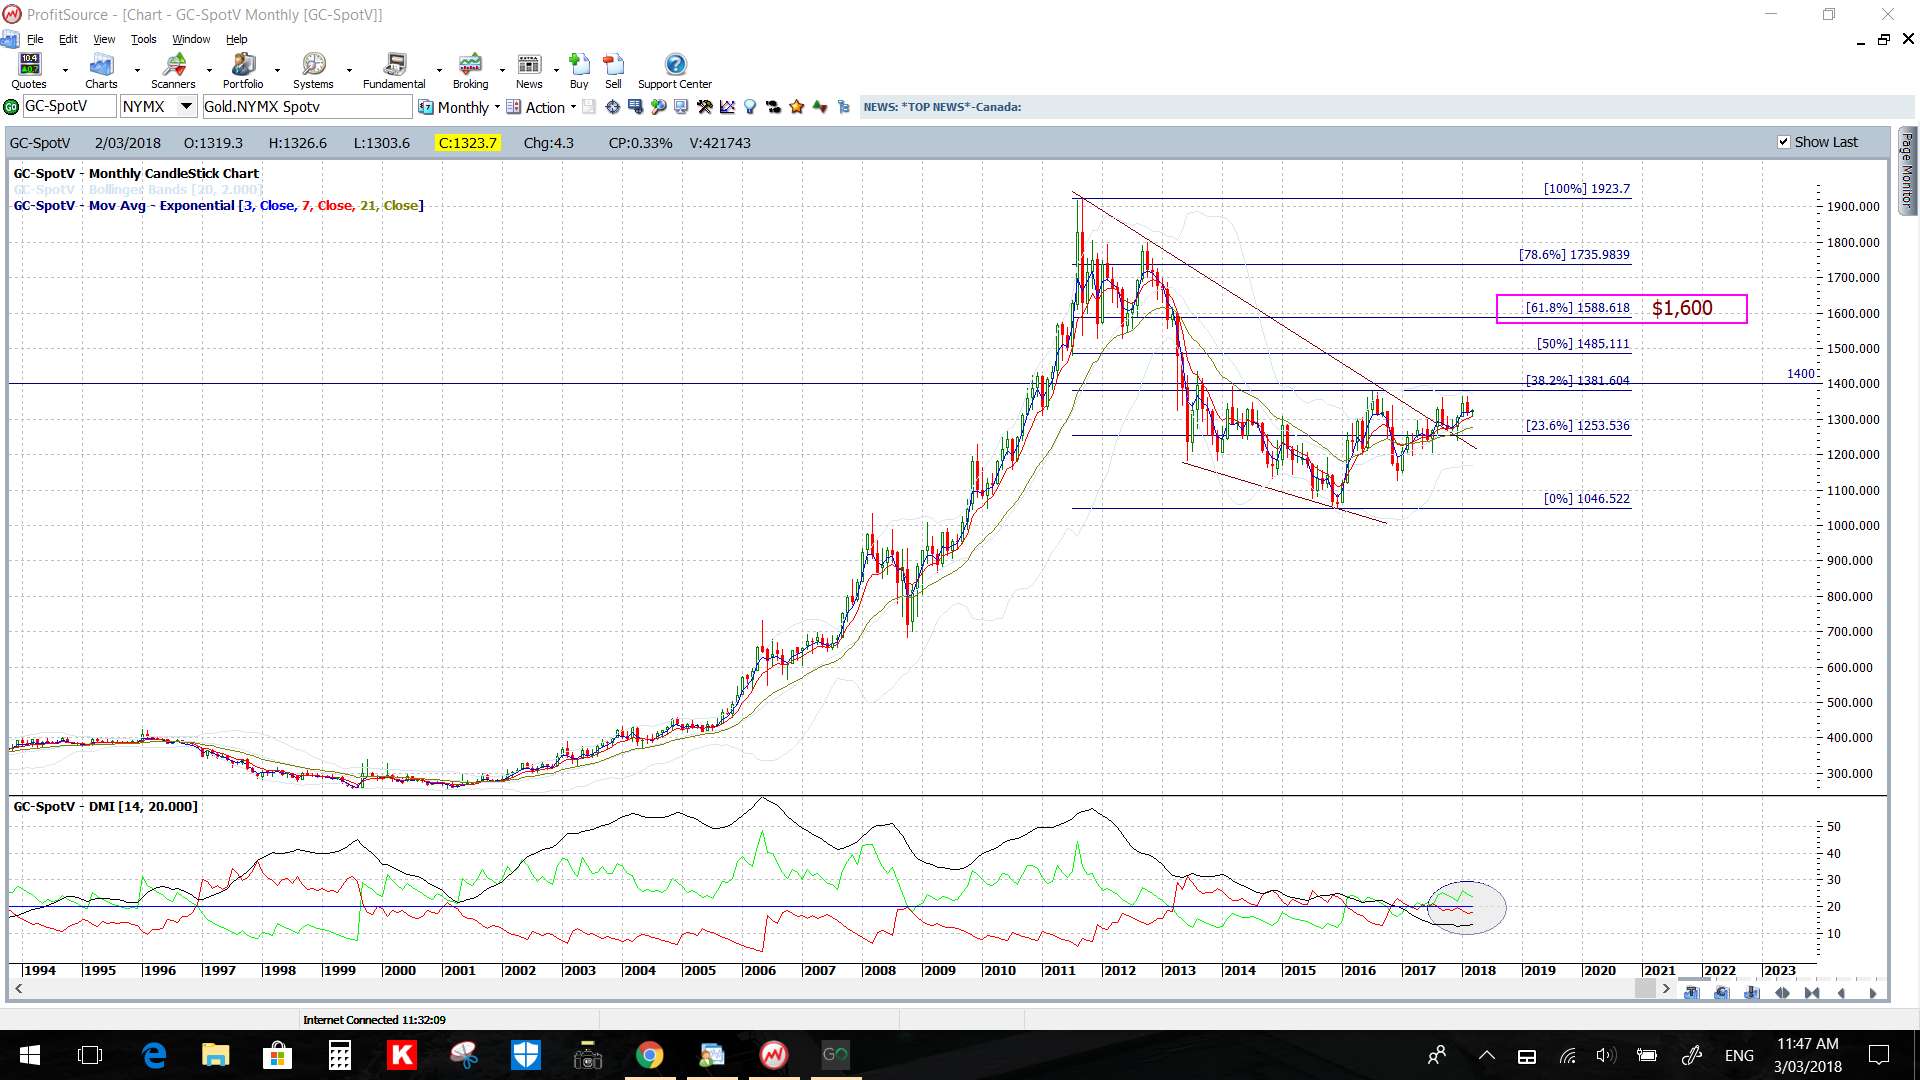
Gold: Gold closed the month with a decent sized bearish candle and the week with a small bearish candle. The precious metal is still holding above $1,300 however and trading within a consolidation style Flag pattern below the key $1,400 level. For me, the $1,4000 level remains the big one to watch for any new make or break when defining the next major move for Gold.
Any pullback and break of $1,300 support would have me looking for a test of the 4hr chart’s 61.8% fib that is near $1,285 and the daily 200 EMA.
- Watch the 4hr chart trend lines for any new breakout.
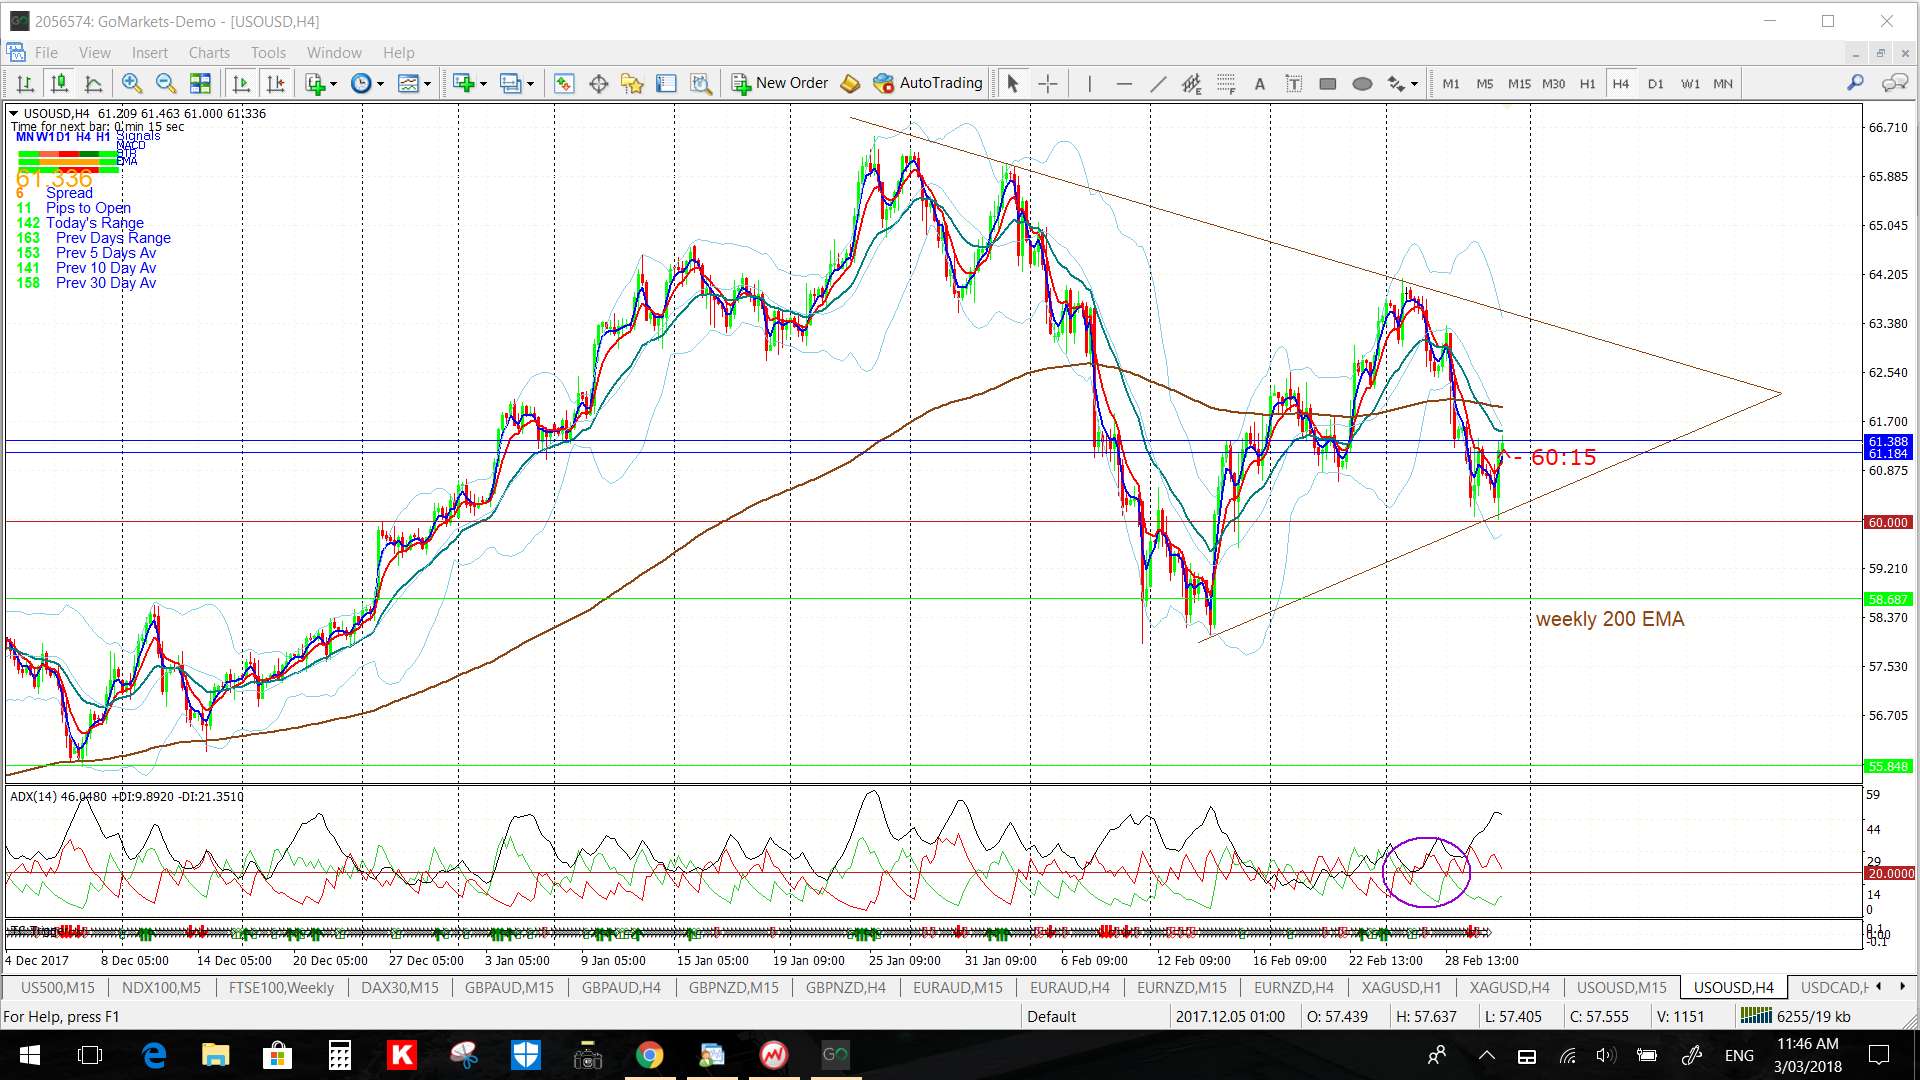
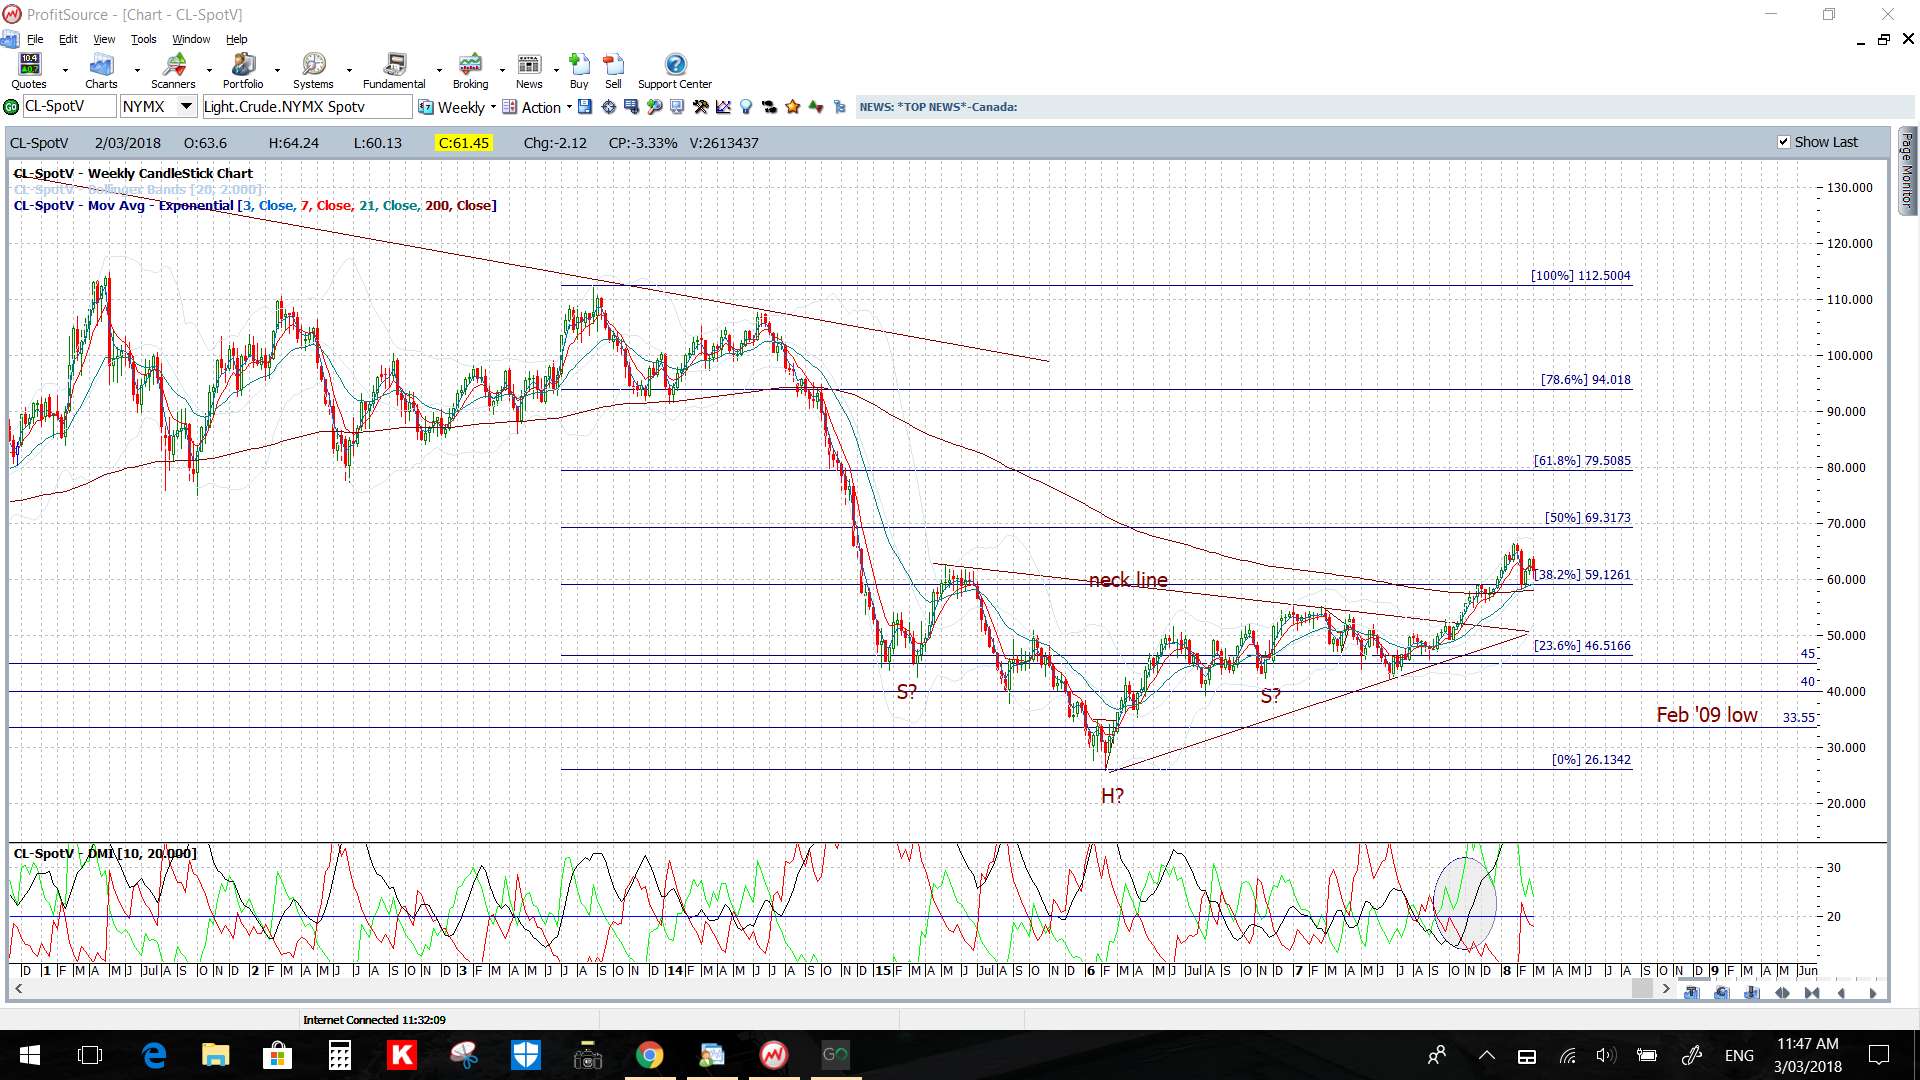
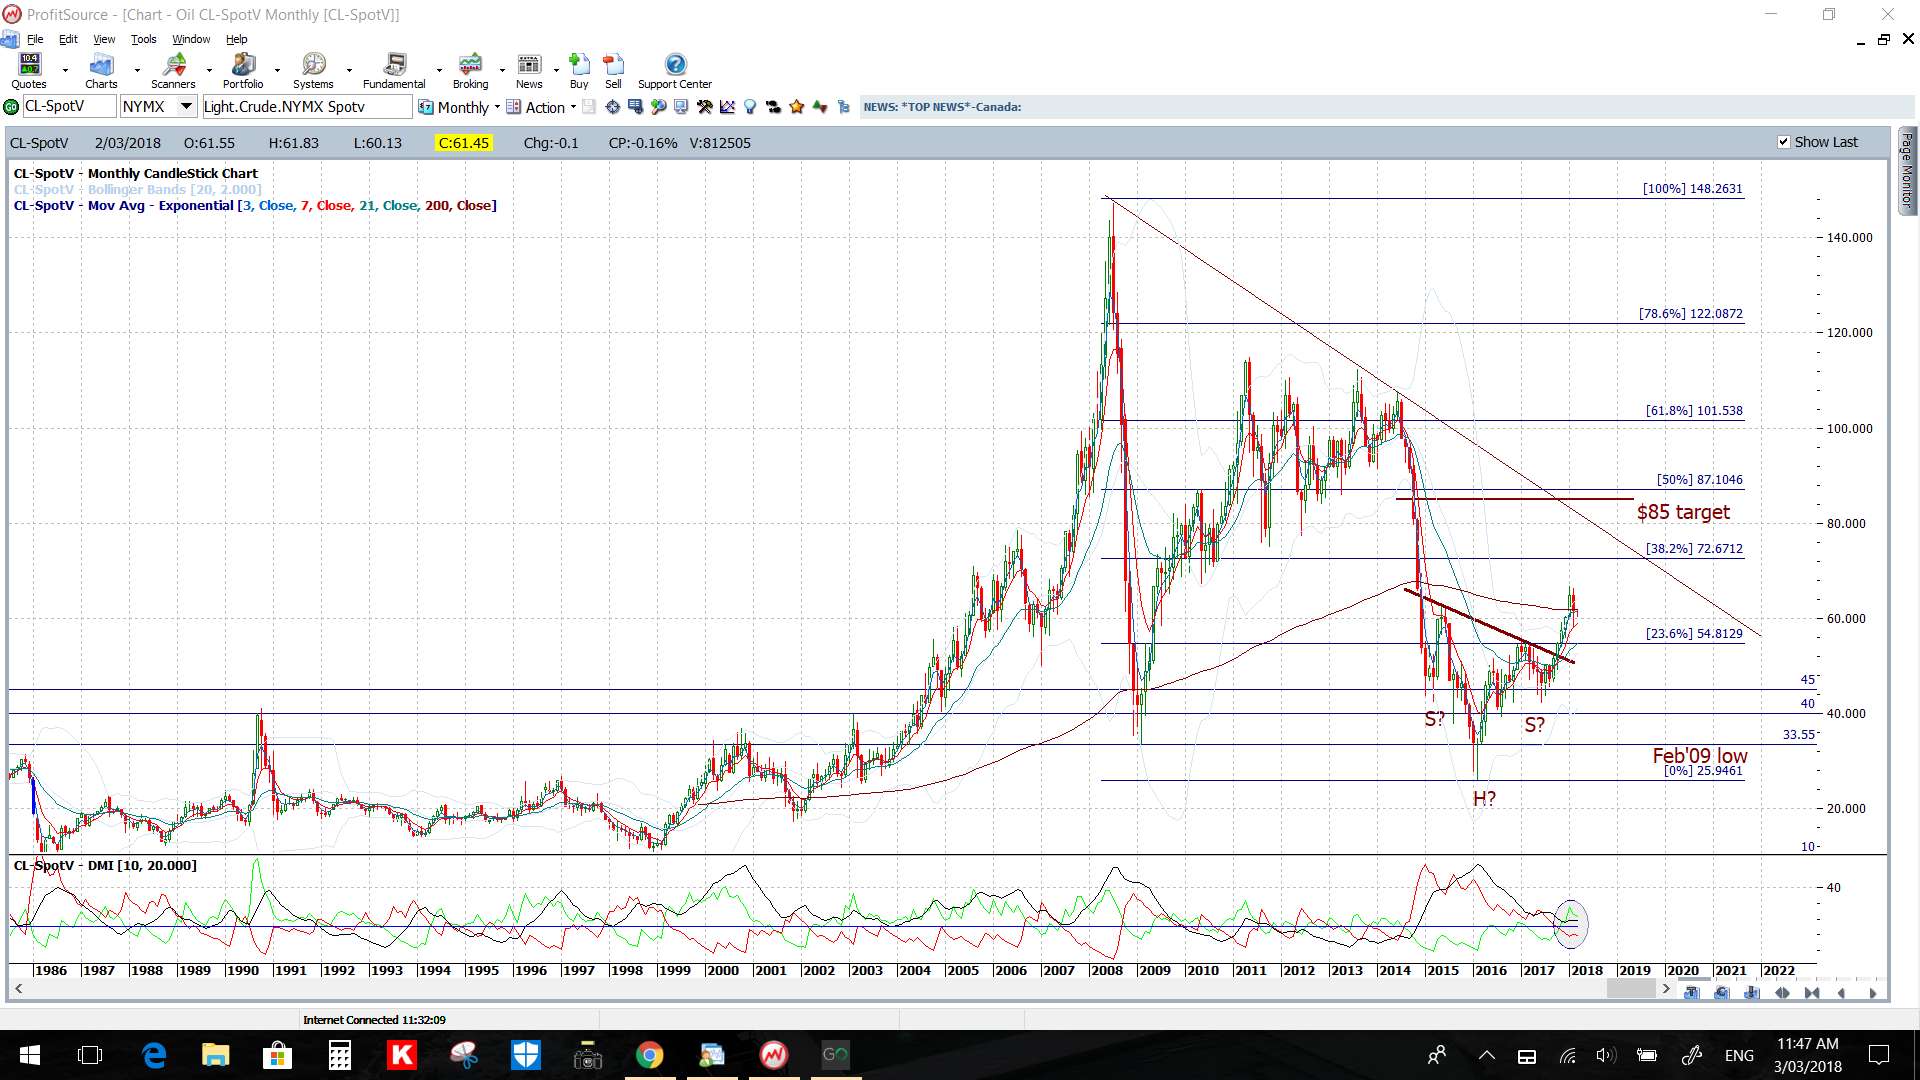
Oil: Oil retreated and tested the $60 support level last week and gave a decent trend line breakout trade in the process. However, there are new 4hr chart trend lines to monitor in the week ahead.
Despite printing a bearish monthly candle traders should keep the monthly chart’s bullish pattern in mind if trading here .
- Watch the revised 4hr chart trend lines for any new breakout: