The S&P500 is consolidating under major resistance ahead of Thursday’s FOMC meeting and there are some key levels and trend lines worth watching for potential breakouts once FOMC news has been released. The 2,000 level is a major S/R zone above current price action and one of the the key levels to watch.
There is no clear sign just yet whether the US Federal Reserve will announce an interest rate rise at this Thursday’s September FOMC meeting however many are expecting a rate to be announced. Just how stocks will react to news of any rate hike or delayed hike is not clear but there are some key levels on the S&P500 worth monitoring to help gauge any new market sentiment following the release of this news. These levels are noted below:
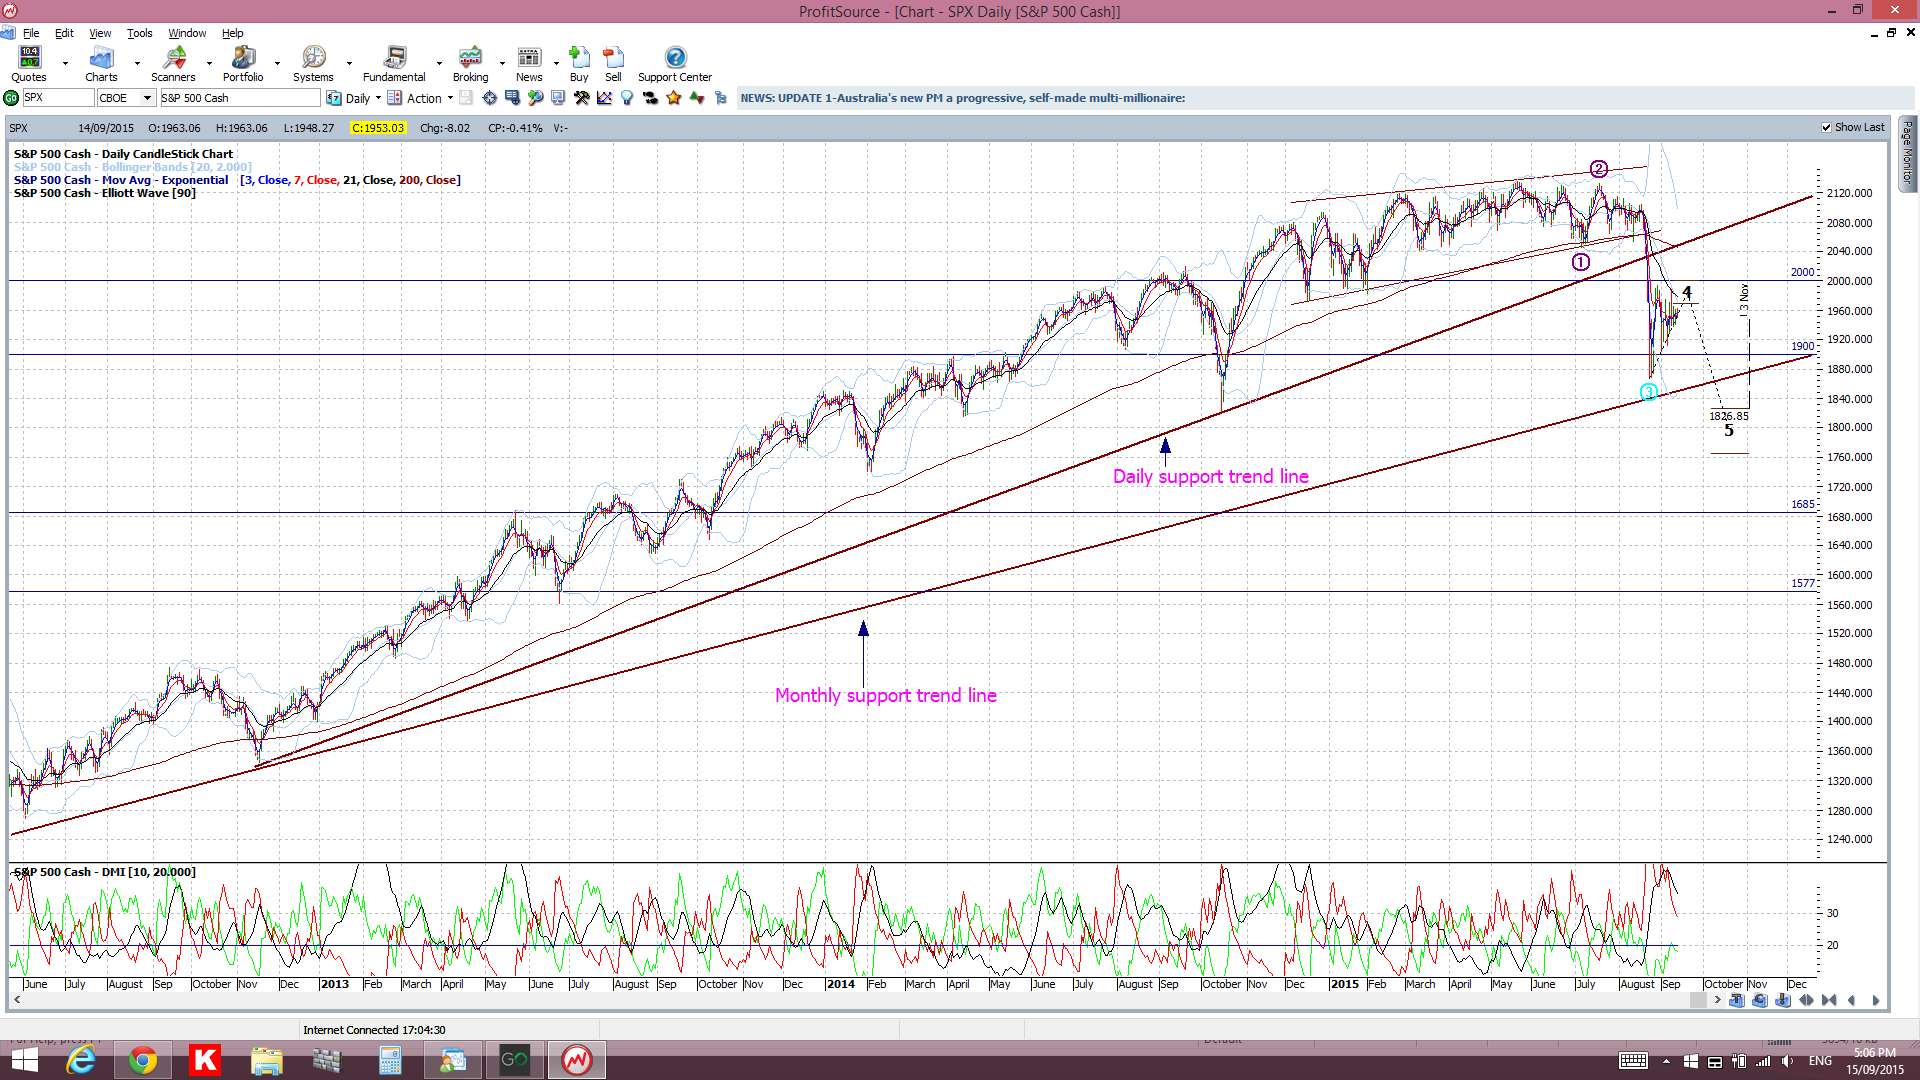
S&P500 daily: the index is below the key 2,000 level and trading between the daily and monthly support trend lines. A new close and hold back above 2,000 would be a bullish signal and this is one key level to watch:
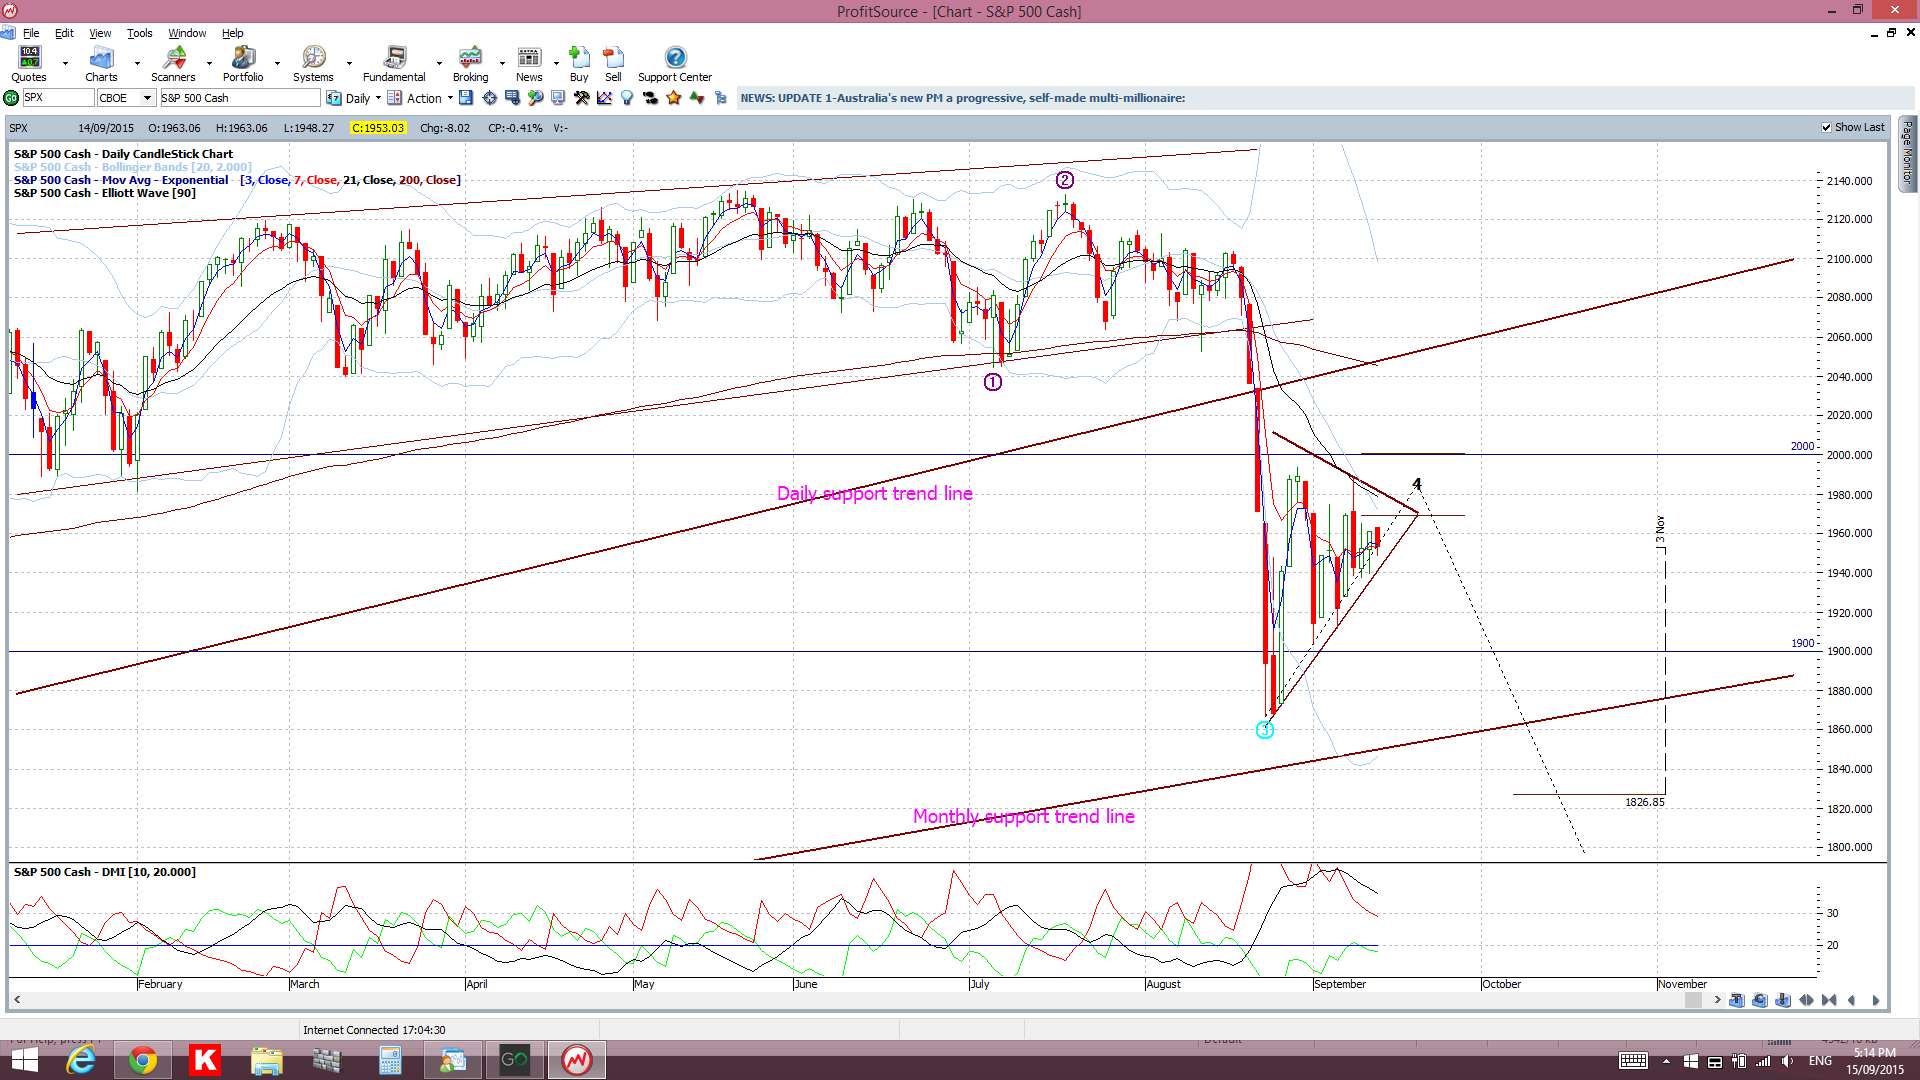
S&P500 daily expanded: current price action is consolidating within a triangle and traders might benefit from watching for a momentum-based triangle breakout as well. Any bullish triangle breakout will bring the 2,000 level back into immediate focus. However any bearish breakdown will have me looking for a move down, in the first instance, to test the monthly support trend line:
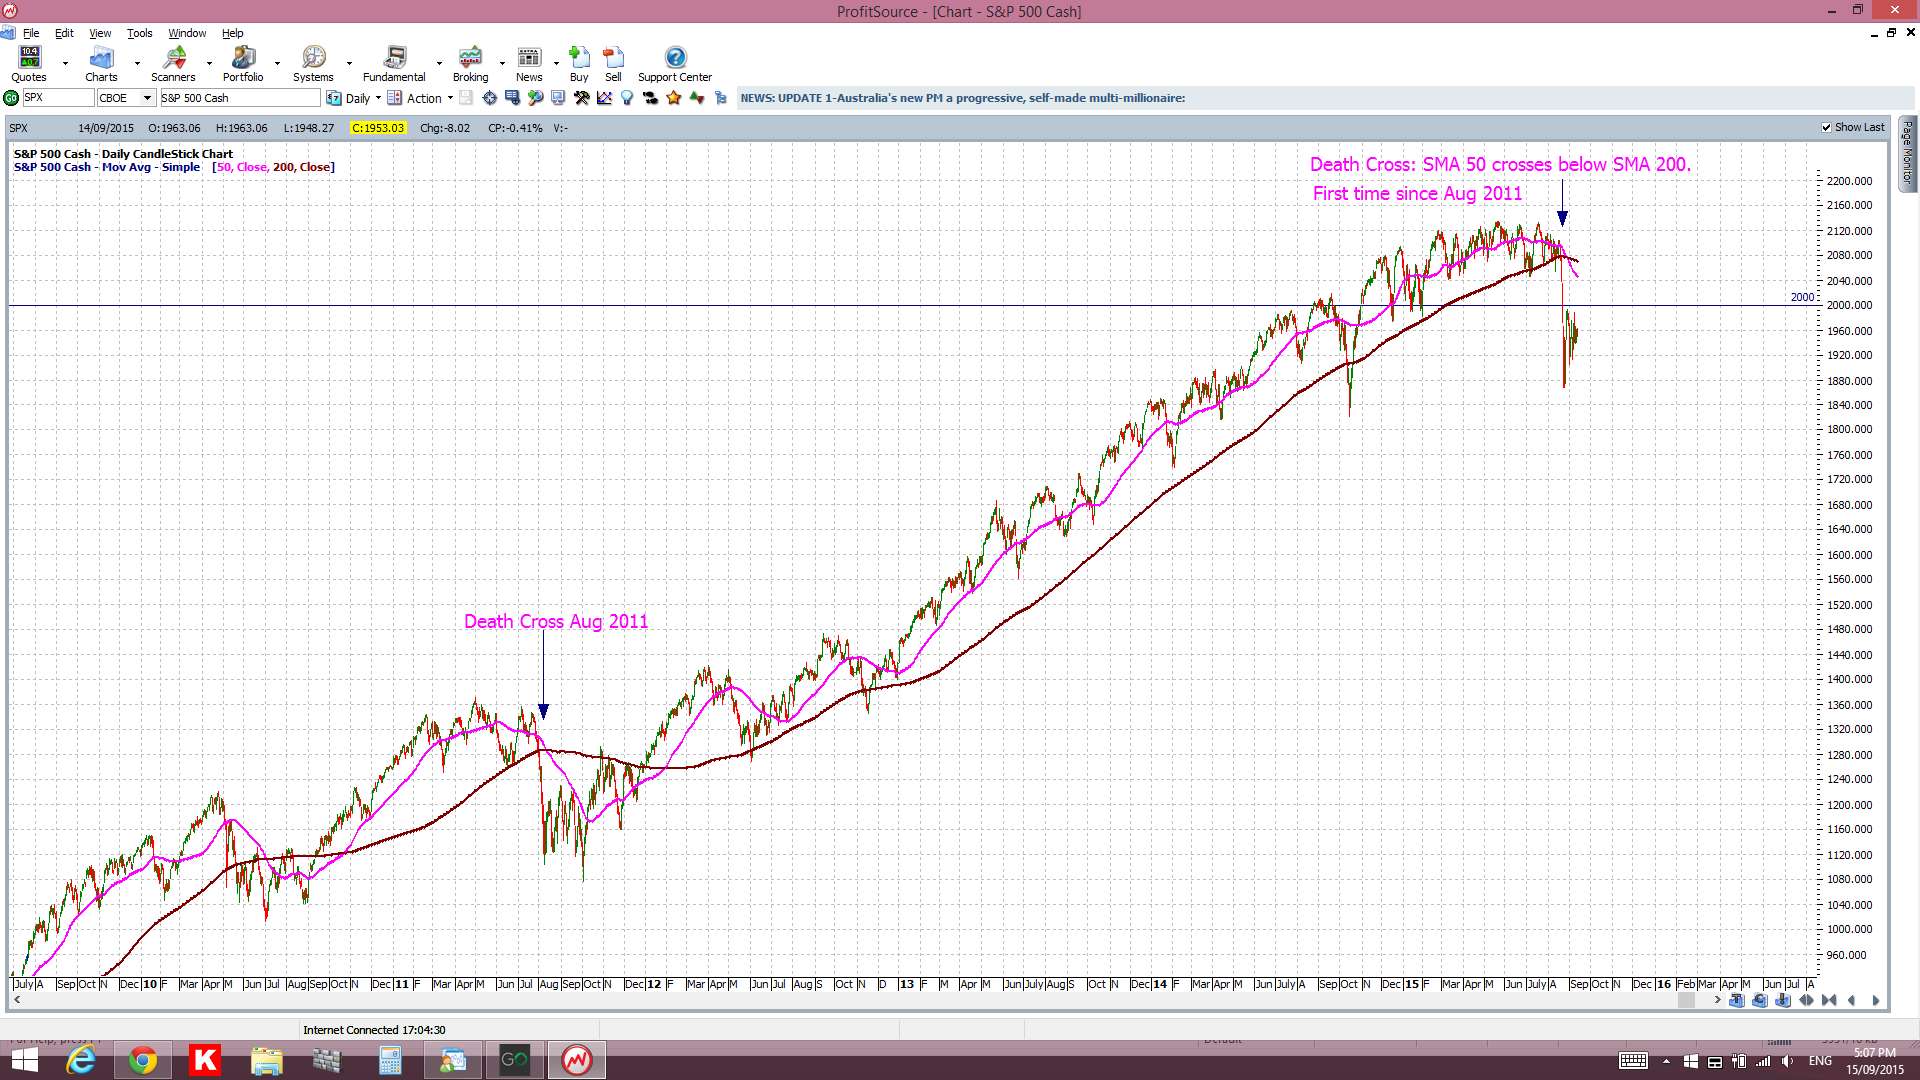
S&P500 daily: Death Cross: the Death Cross is still open:
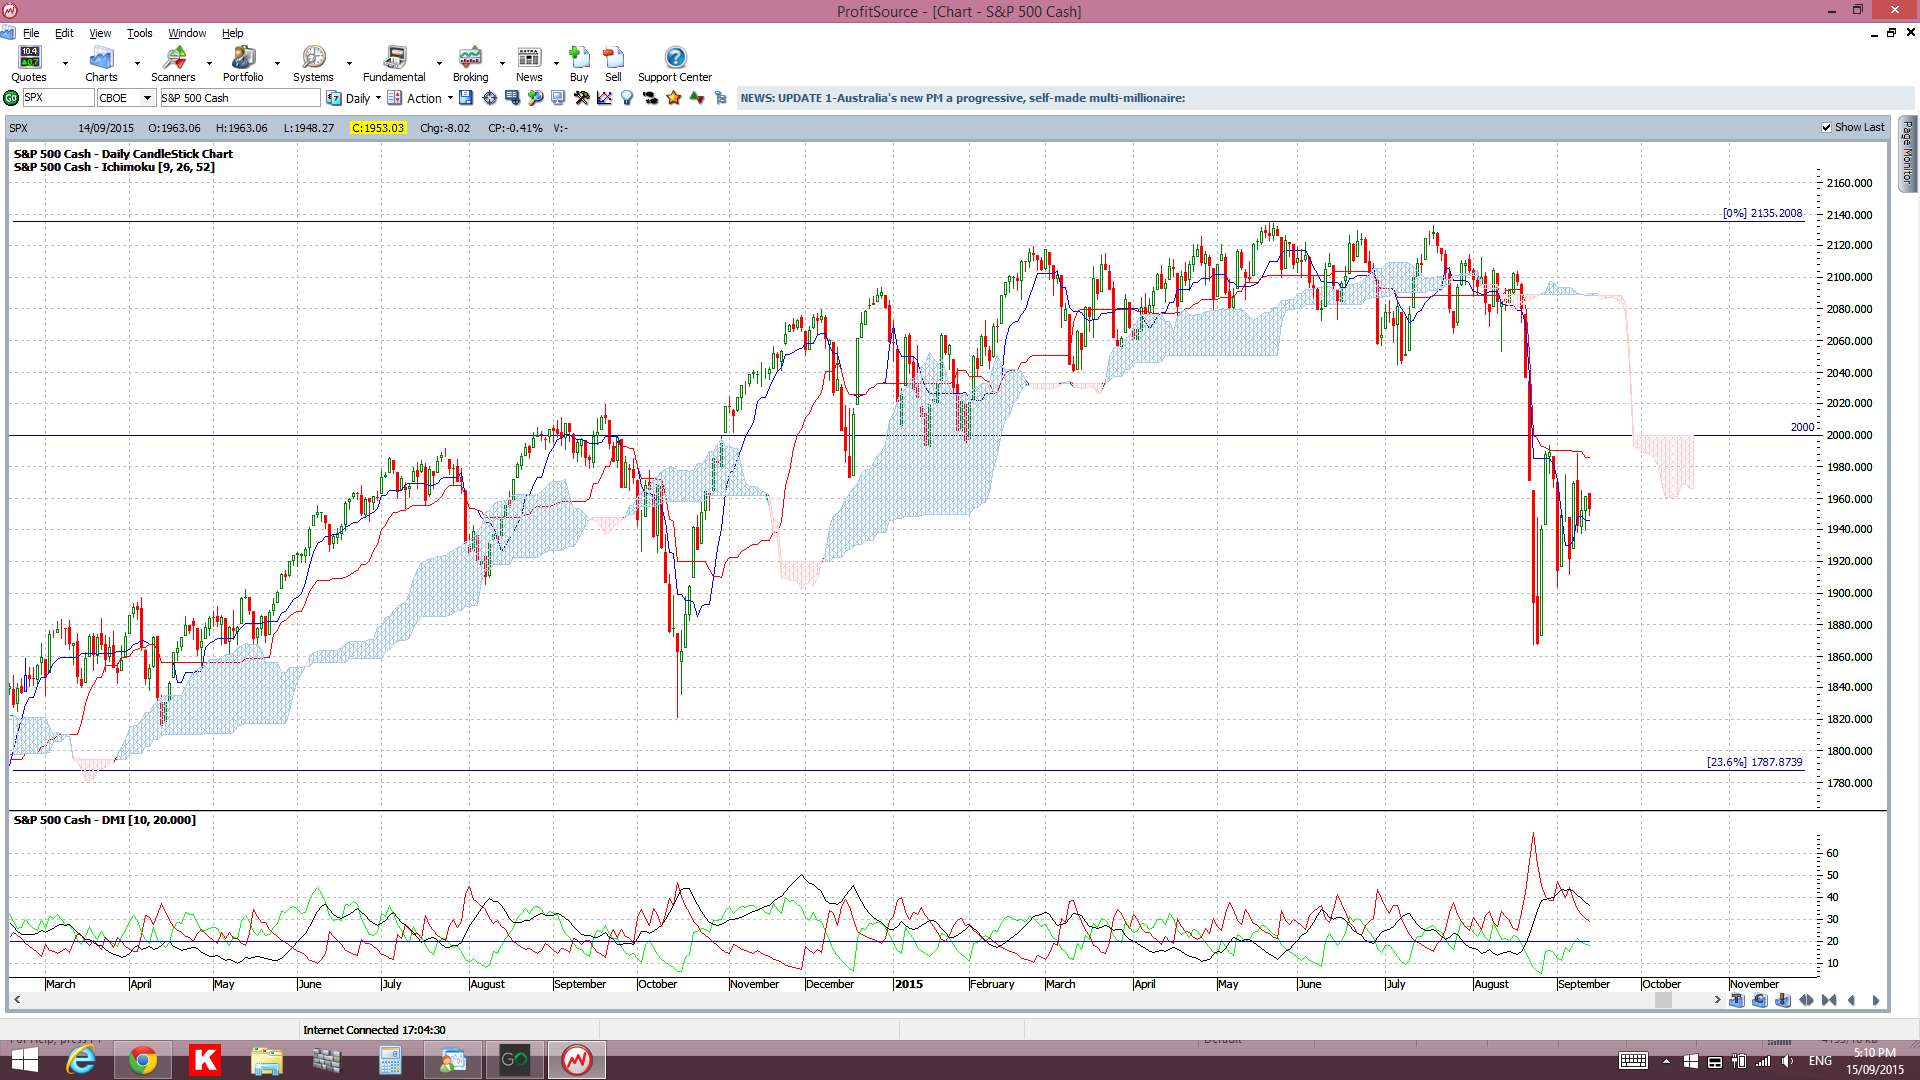
S&P500 daily Cloud: price is below the daily Cloud but note how this Cloud is currently aligned along the 2,000 level. This adds weight to the importance of this level:
S&P500 weekly Cloud: price is just below the weekly Cloud and note how the weekly Cloud is aligned along the 2,000 level on this time frame too. This is further endorsement of the importance of the 2,000 level:

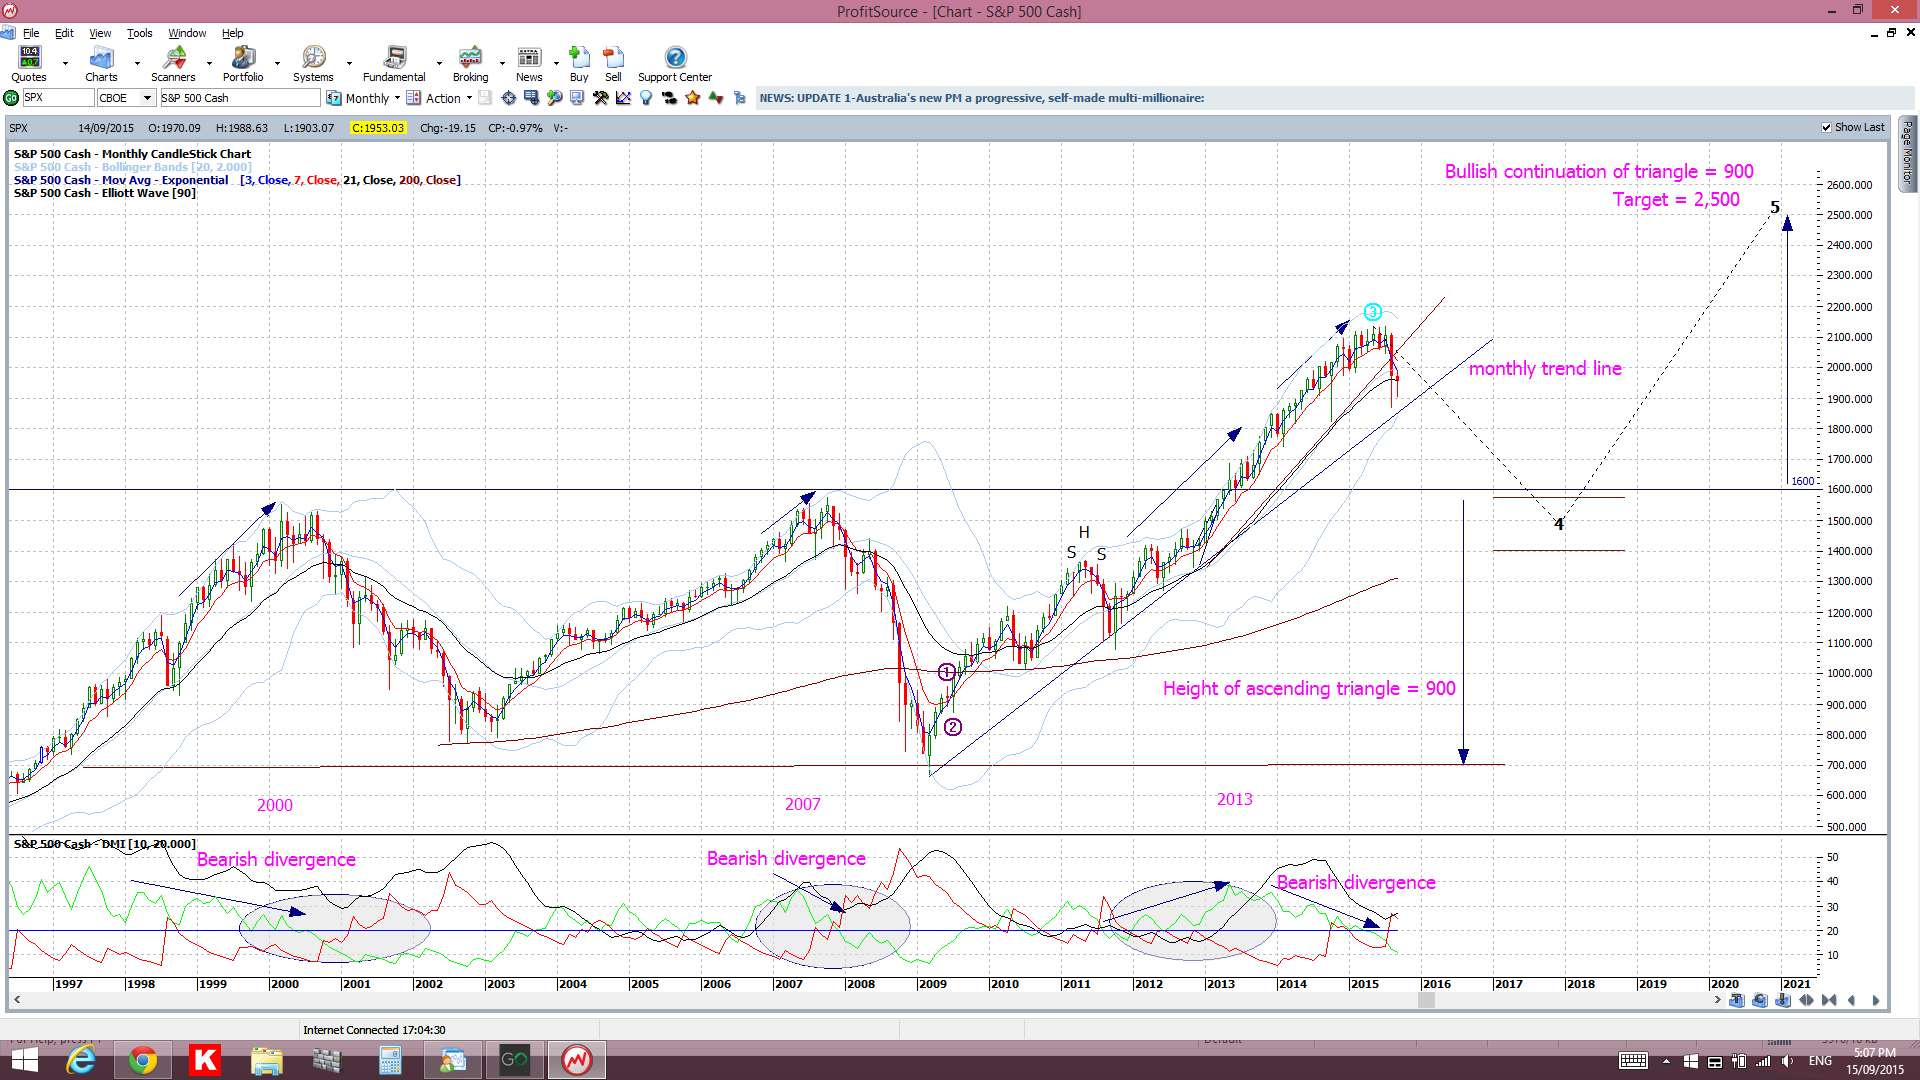
S&P500 monthly: I’m still looking for a possible purge down to 1,600 before potential bullish continuation. Thus, any bearish reaction to FOMC and break below the monthly support trend line will have me focused on this 1,600 level:
Summary: there are key areas to watch on the S&P500 chart following Thursday’s FOMC. These include:
- the daily chart’s triangle trend lines.
- the 2,000 level.
- the monthly support trend line.
- the 1,600 level.
The post S&P500: a quick look at this major index ahead of FOMC. appeared first on www.forextell.com.