I was asked the other day to review the German DAX index and so here is a summary about what I’m seeing. I have displayed monthly down to 30 min charts and so it will depend on your trading time frame as to what bias you may have. For example, momentum has been bullish on the weekly-chart time frame up until recently but price action has been bearish this week on the 4hr and 60 min time frame. My mantra remains the same though; look for momentum-based trend line breakouts to help gauge the next directional move.
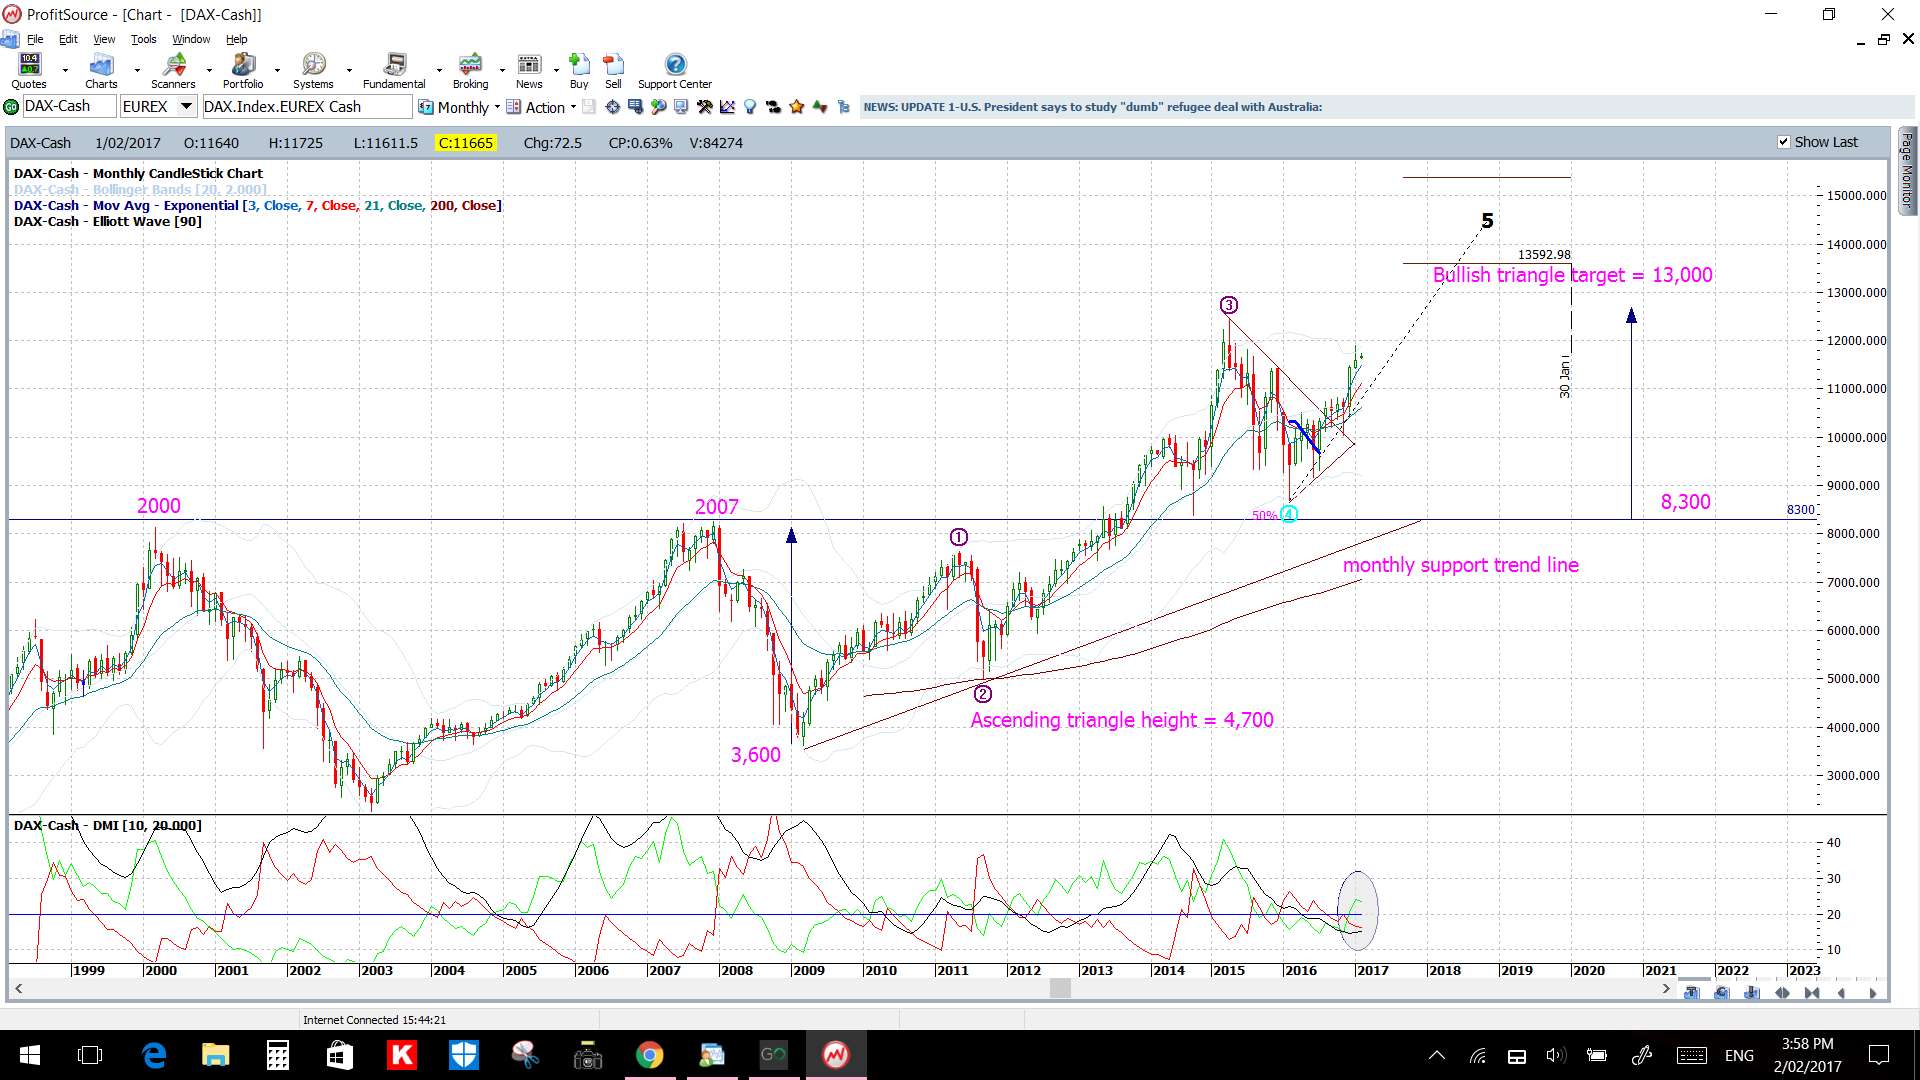
DAX monthly: I’ve had the DAX on a monthly chart based ascending triangle breakout since mid 2013 with a target of 13,000 and that move is still in progress. The bullish +DMI is above 20 but I note that the ADX is yet to tick back above this threshold:
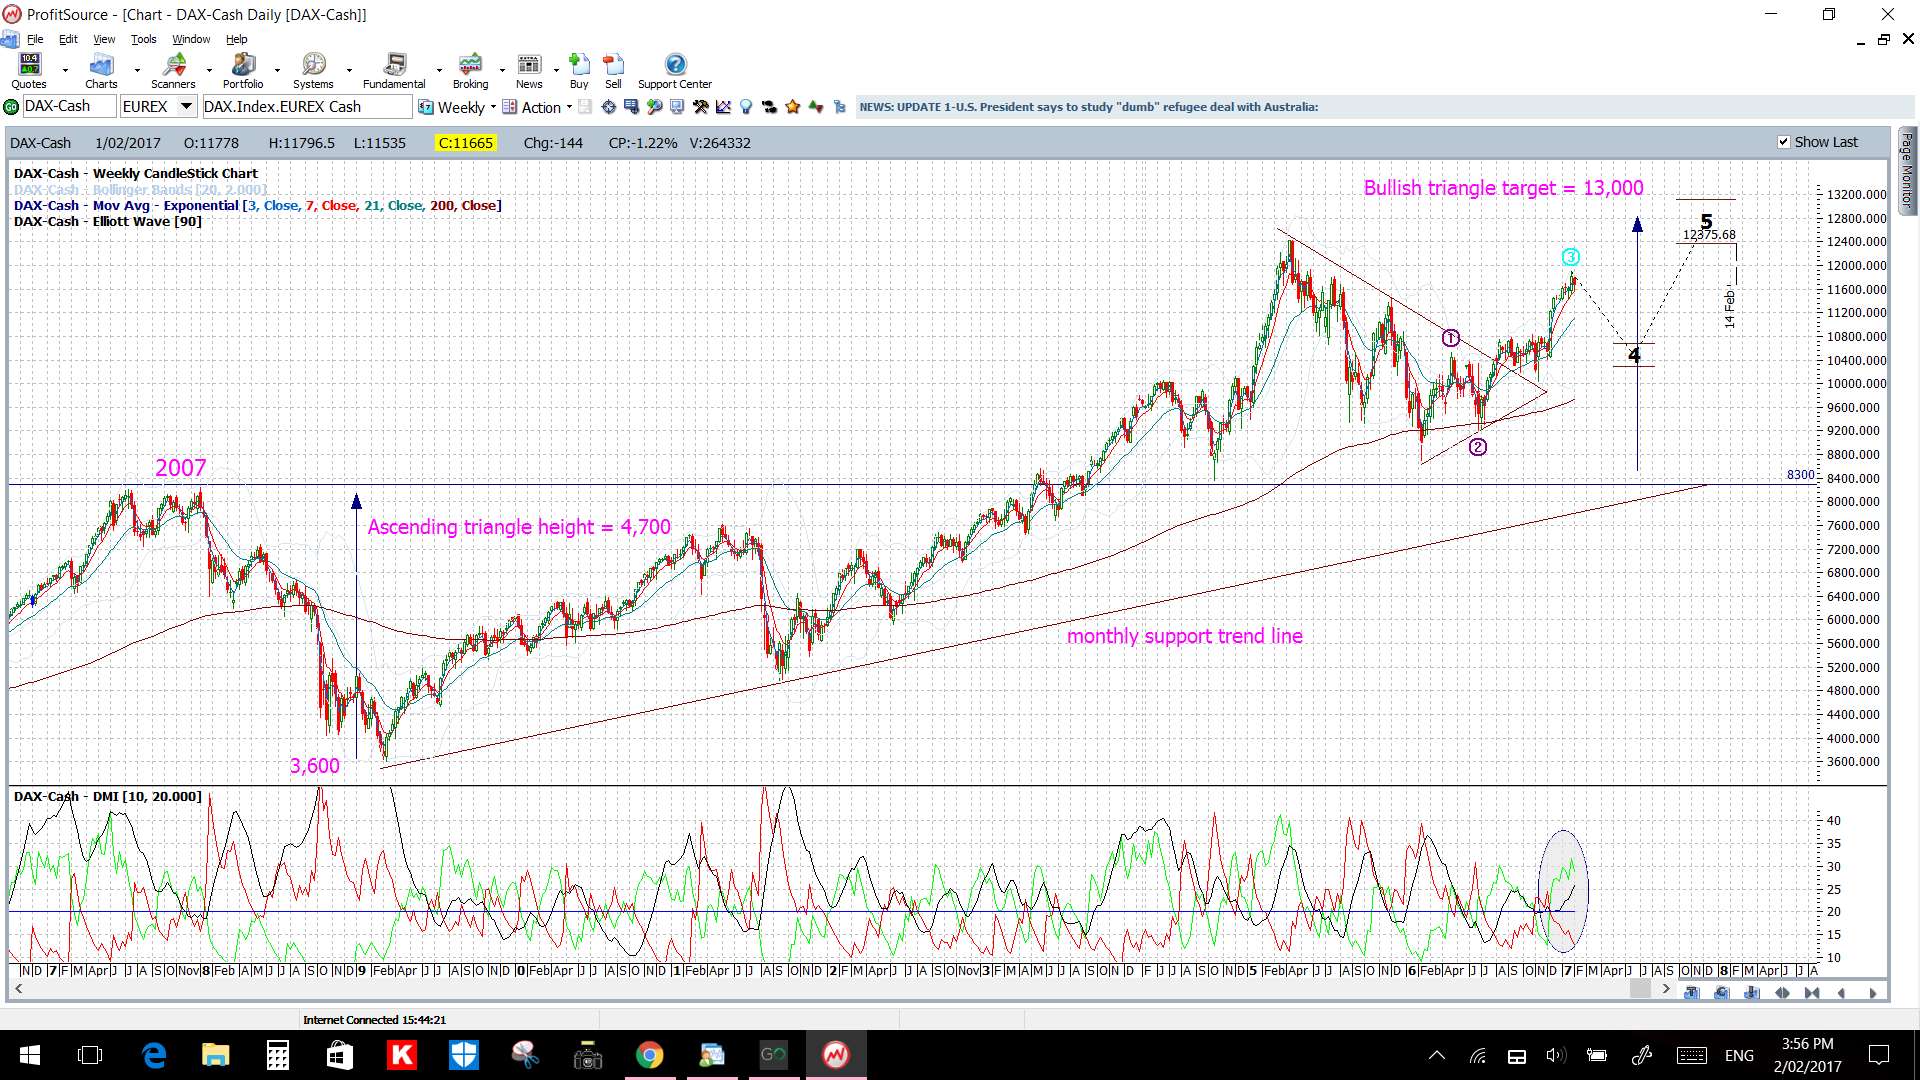
DAX weekly: the weekly chart shows bullish momentum with the ADX and +DMI both above the 20 threshold:
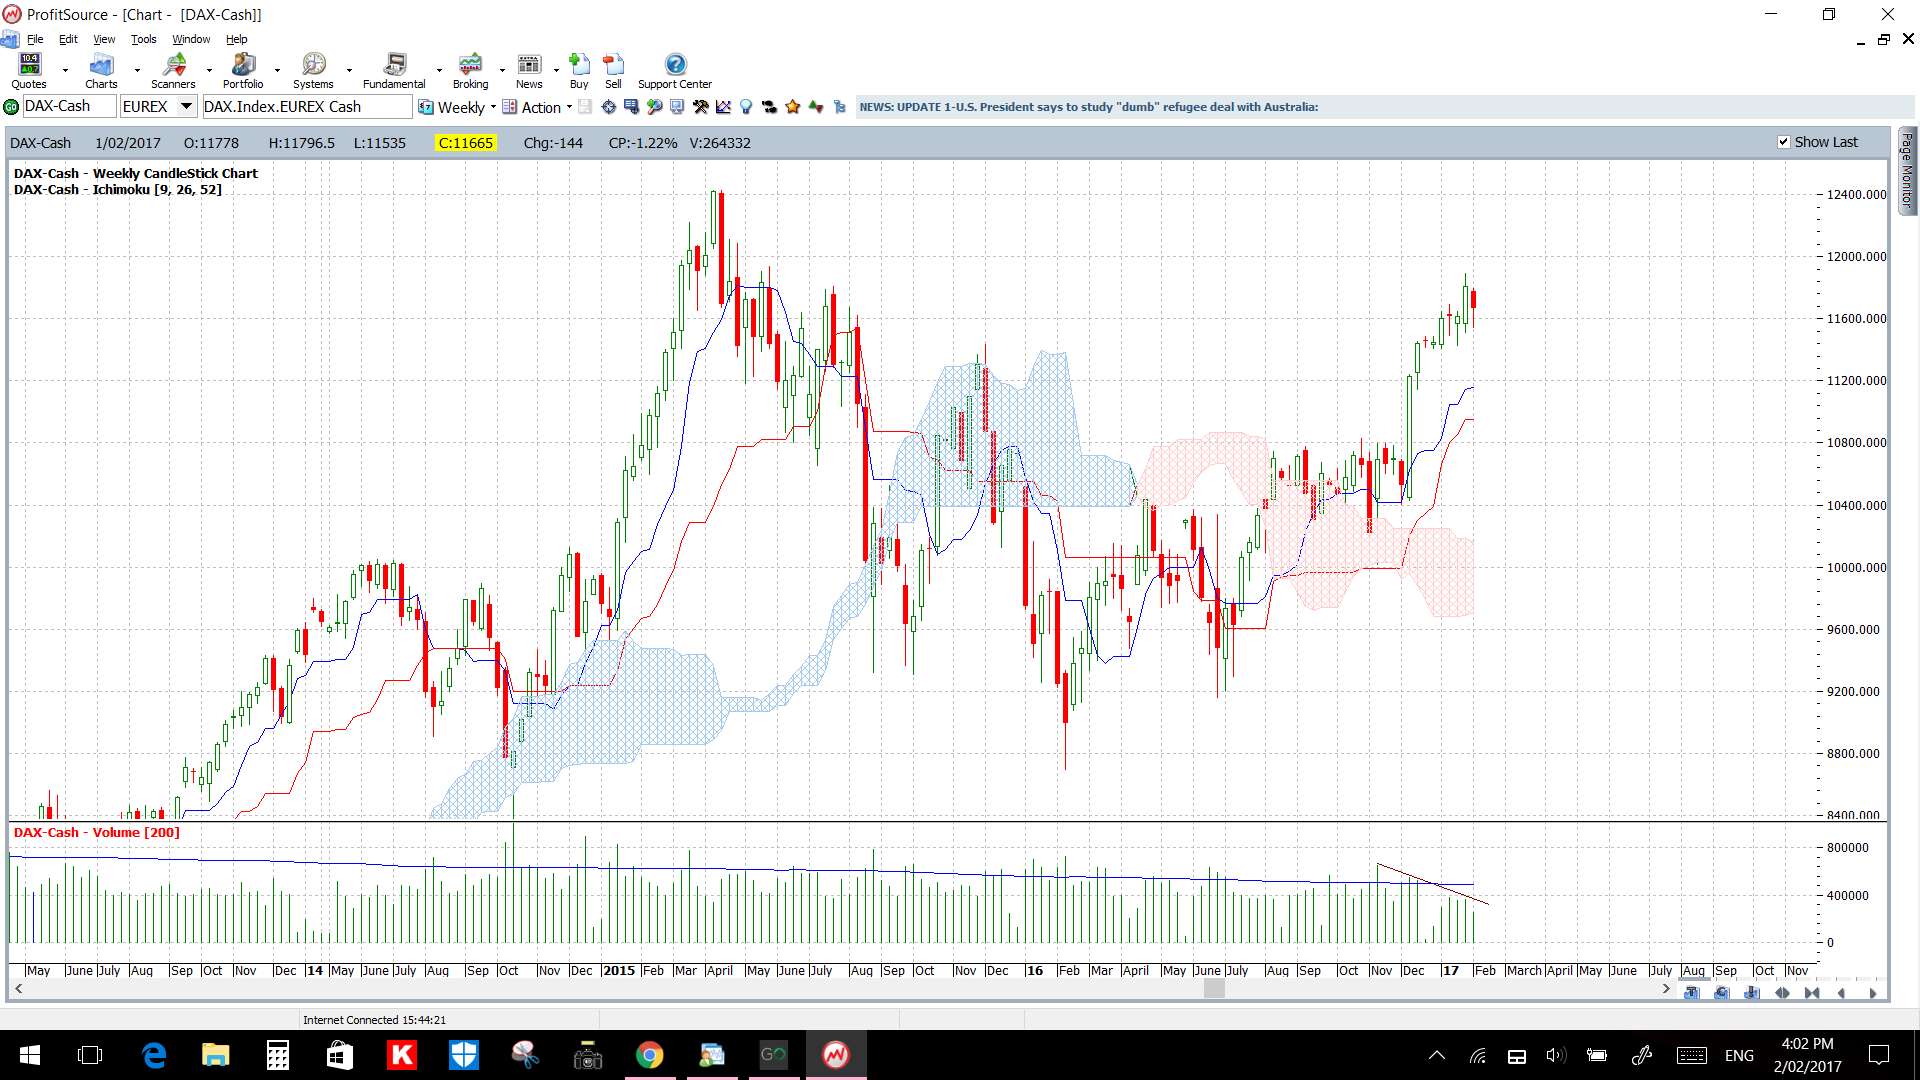
DAX weekly Cloud: the DAX is trading above the weekly Cloud but note how Volume has been on the decline:
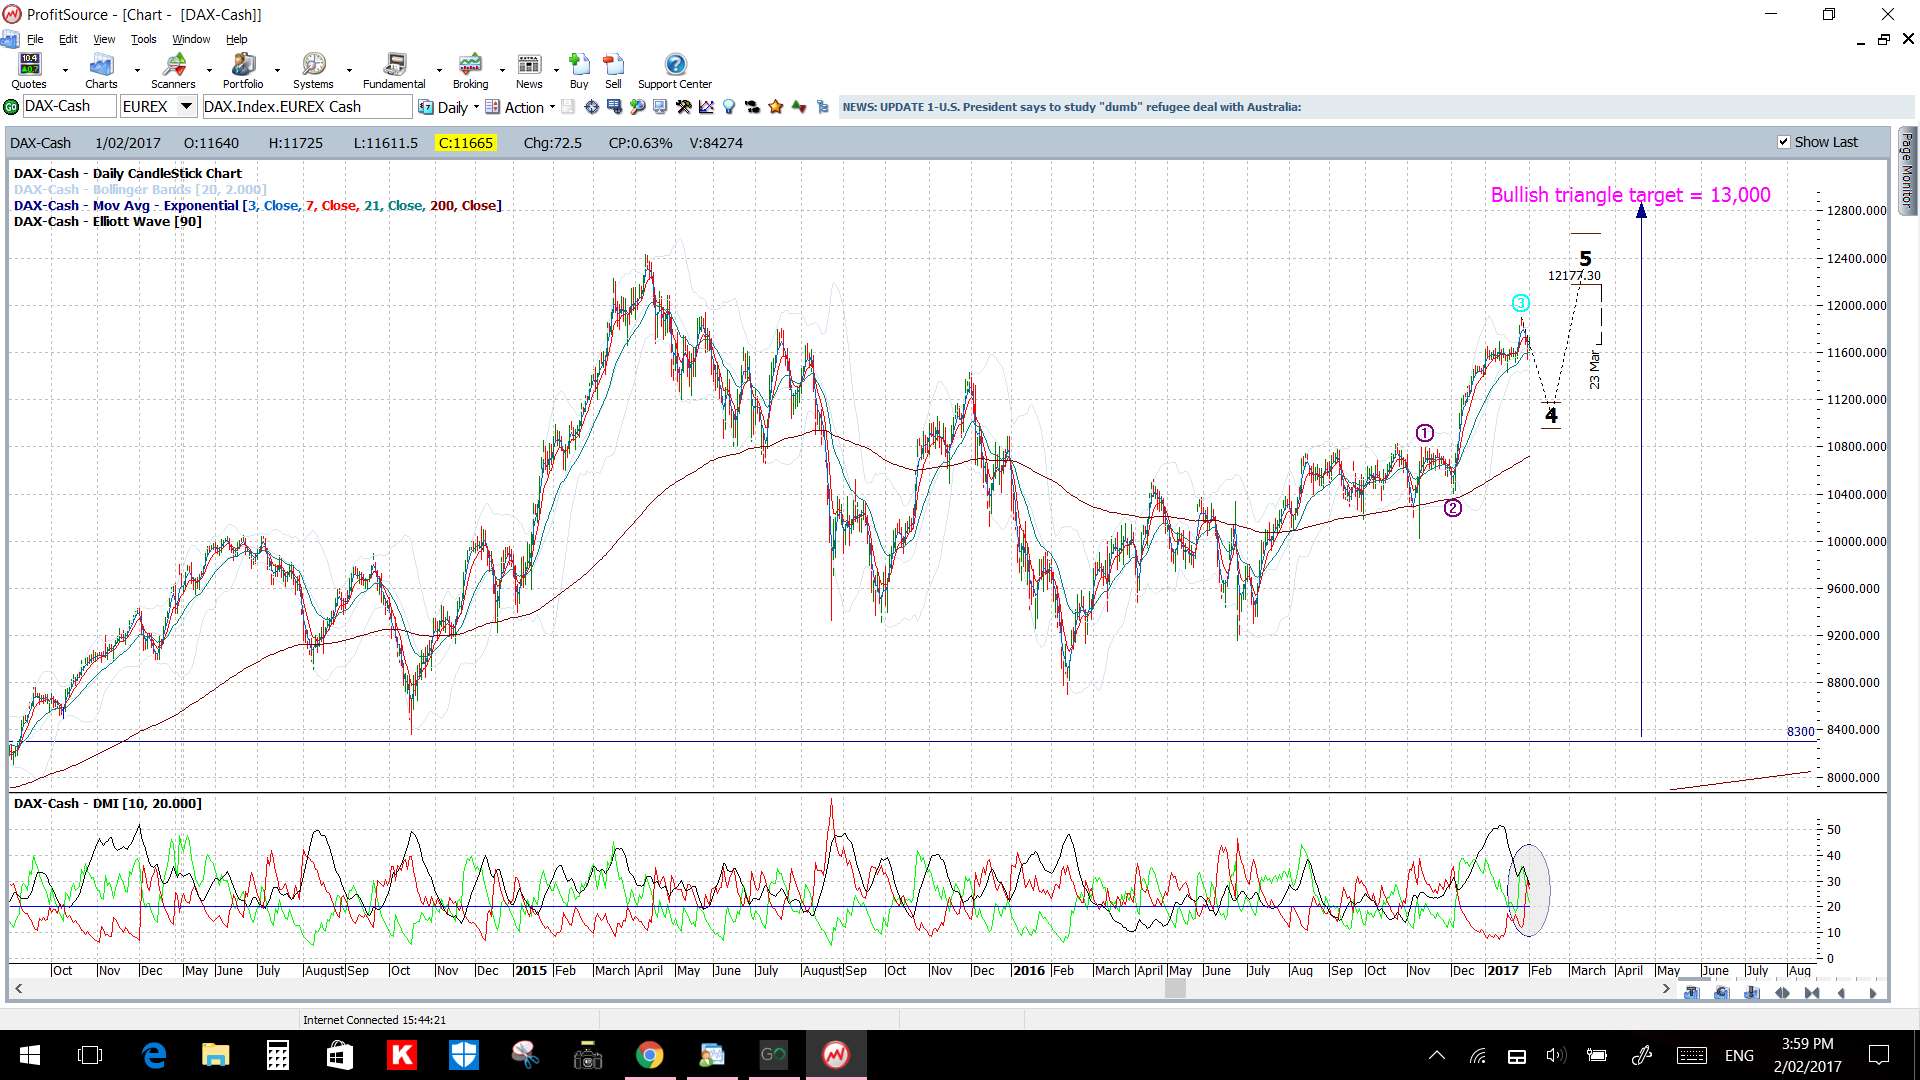
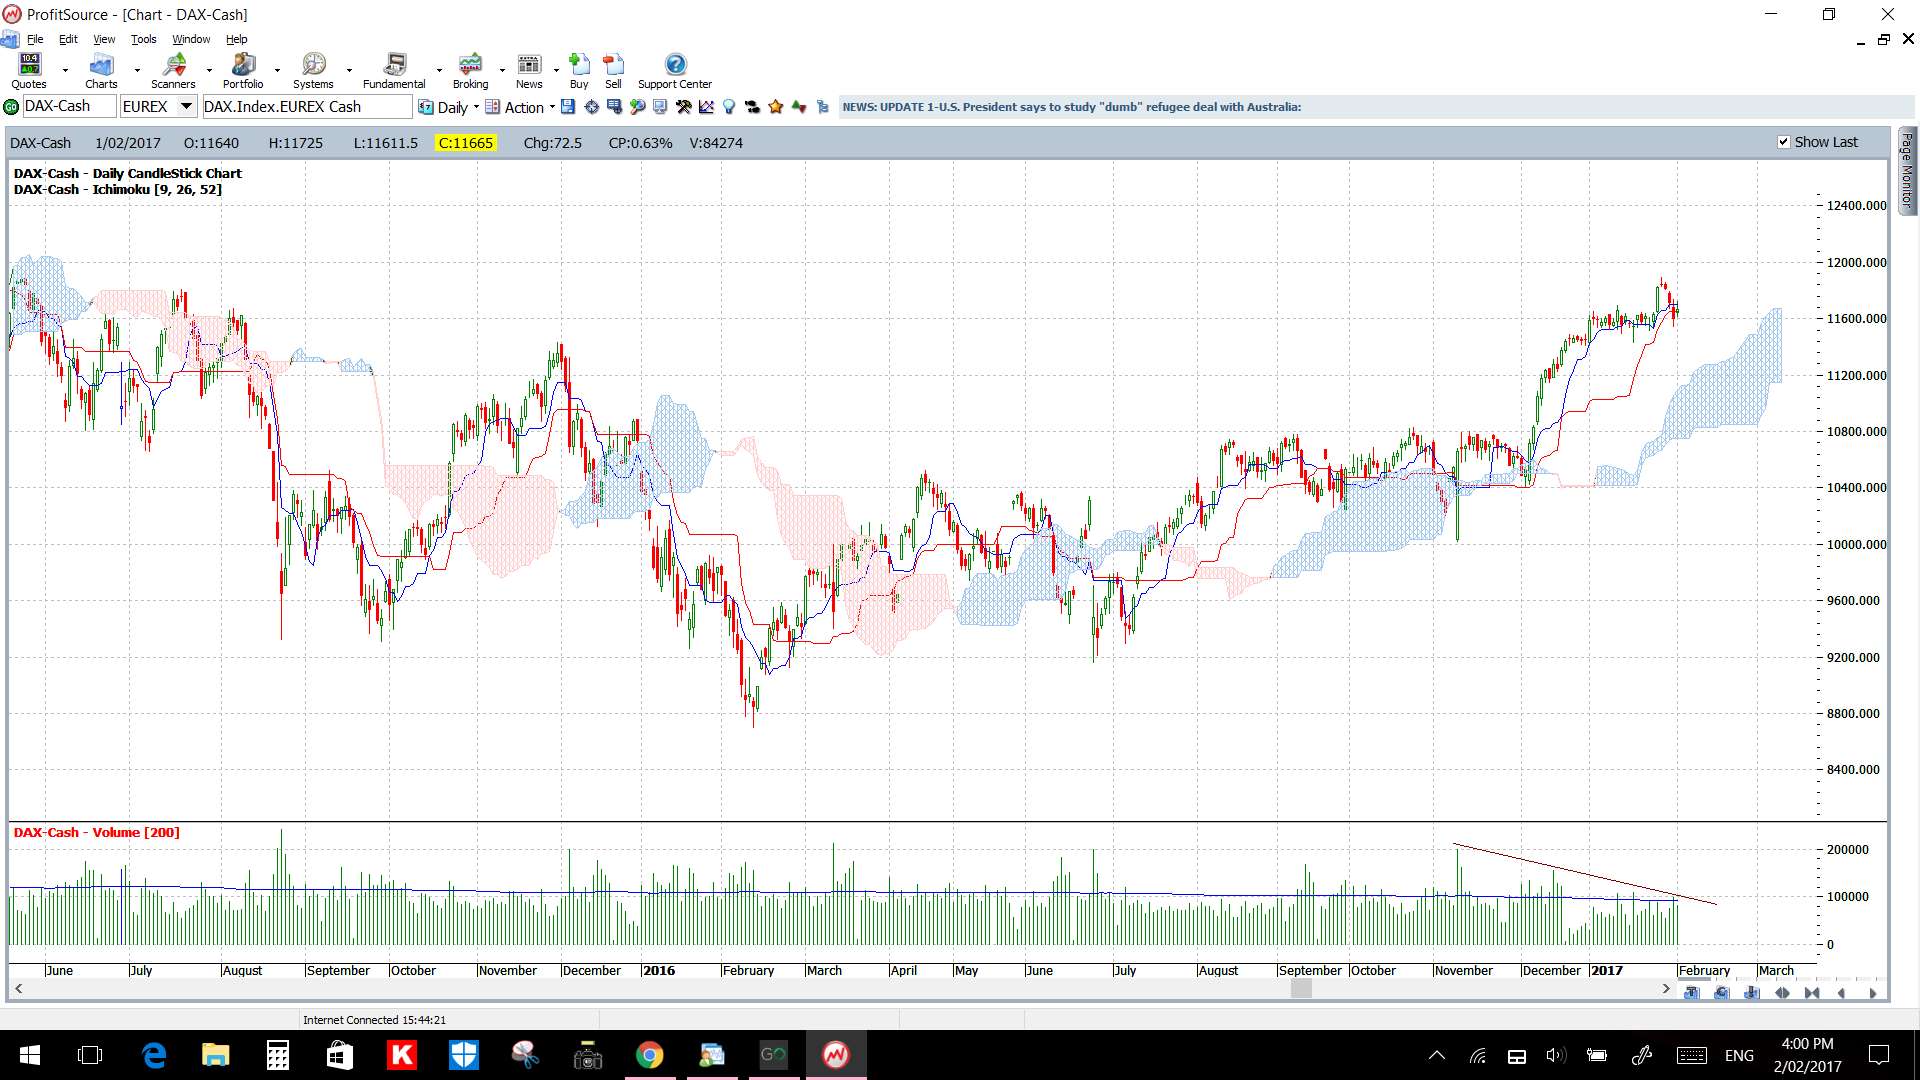
DAX daily: price action over the last two years has been pretty choppy. Note how the ADX has essentially been on the decline for much of this new year:
DAX daily Cloud: price is above the Daily Cloud but Volume here has been on the decline too:
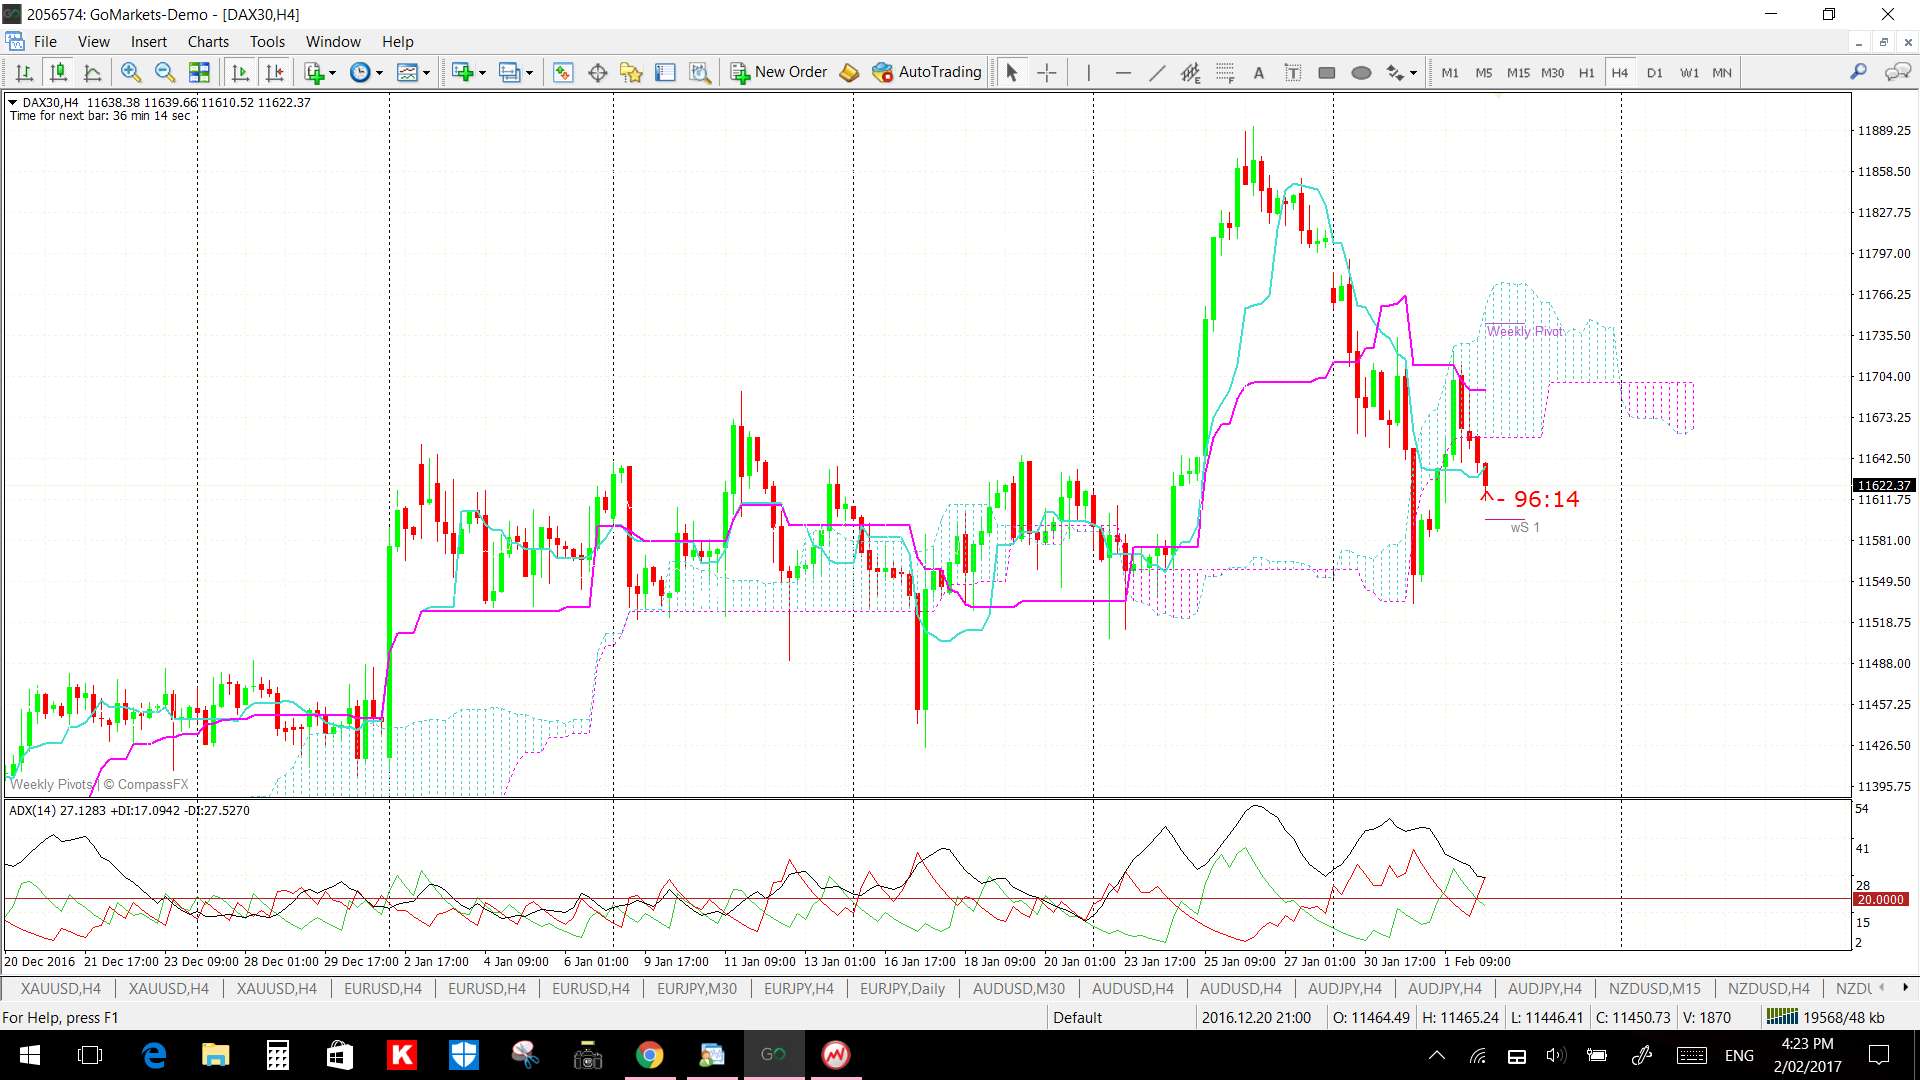
DAX 4hr: the 4 hr chart shows a triangle in play suggesting some recent consolidation so watch for any momentum-based trend line breakout:
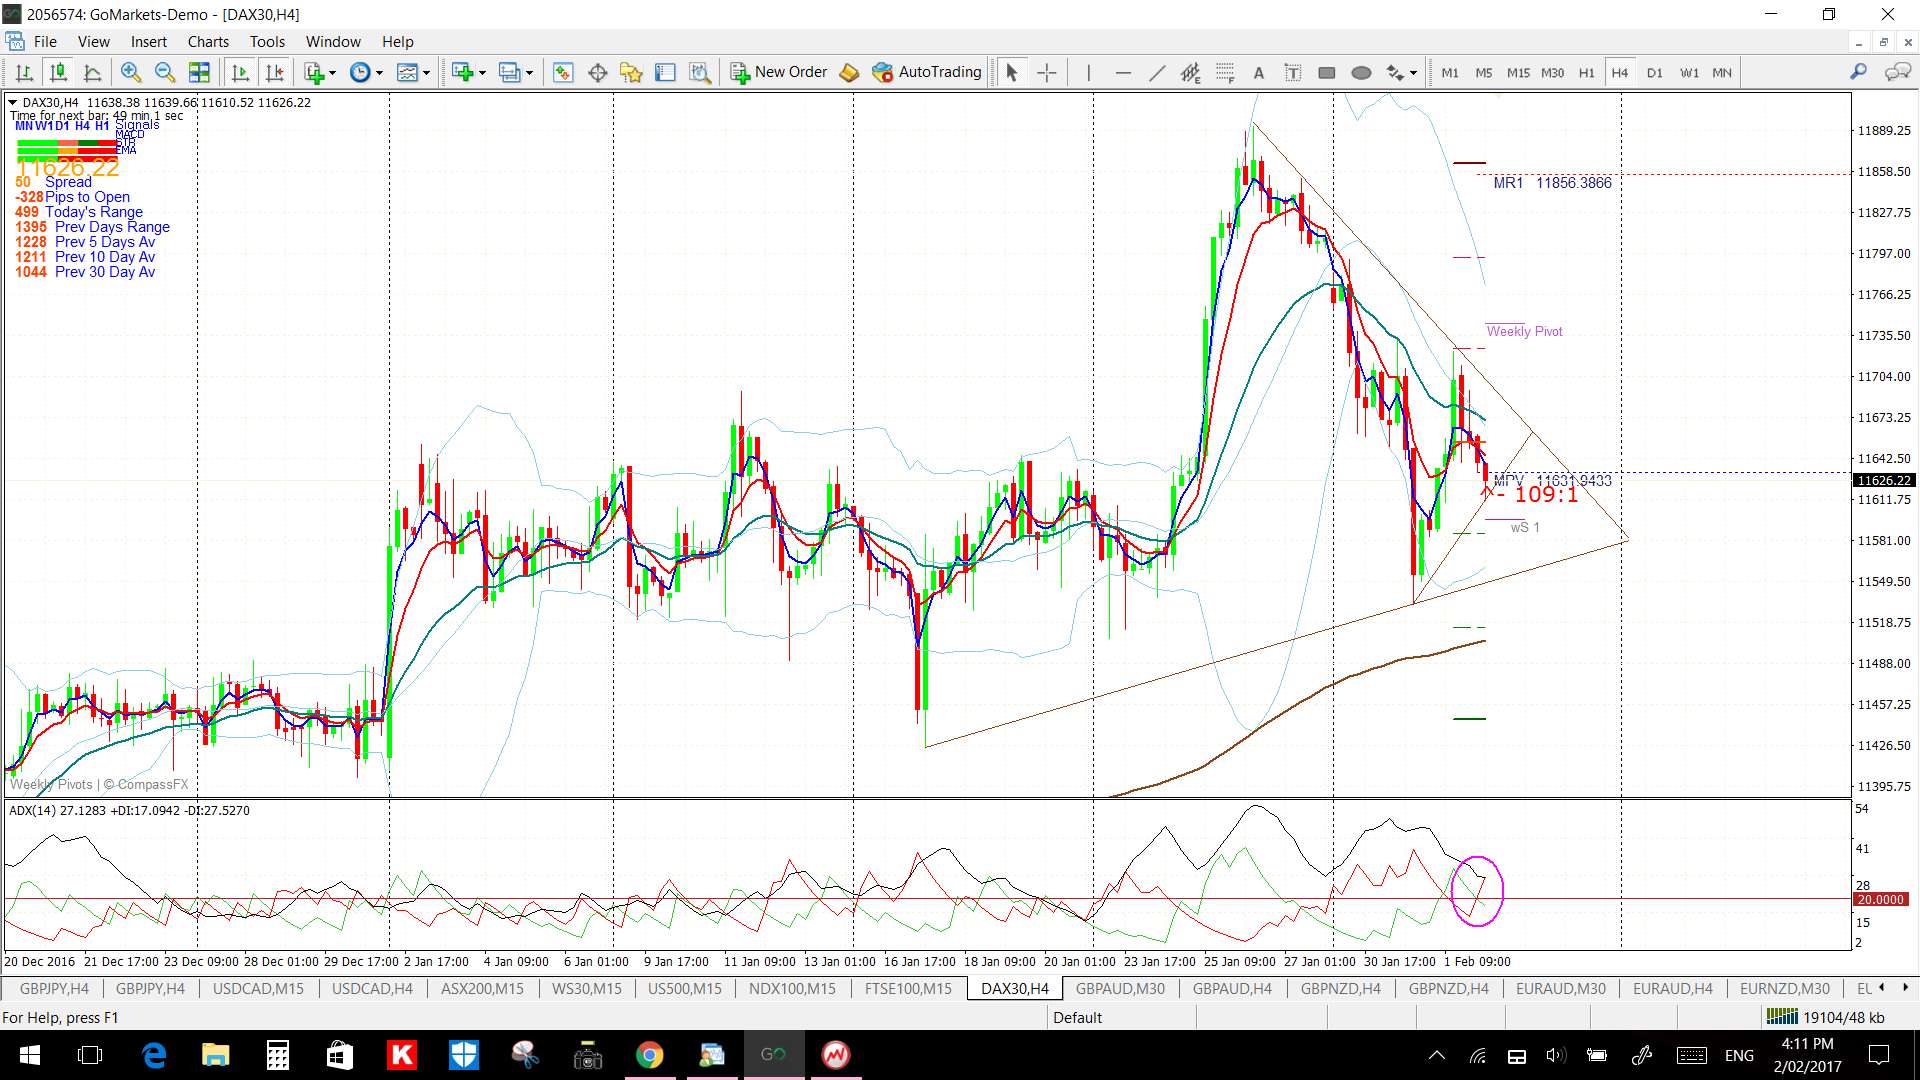
DAX 4hr Cloud: The DAX is below the resistance of the 4 hr Cloud which is short-term bearish:
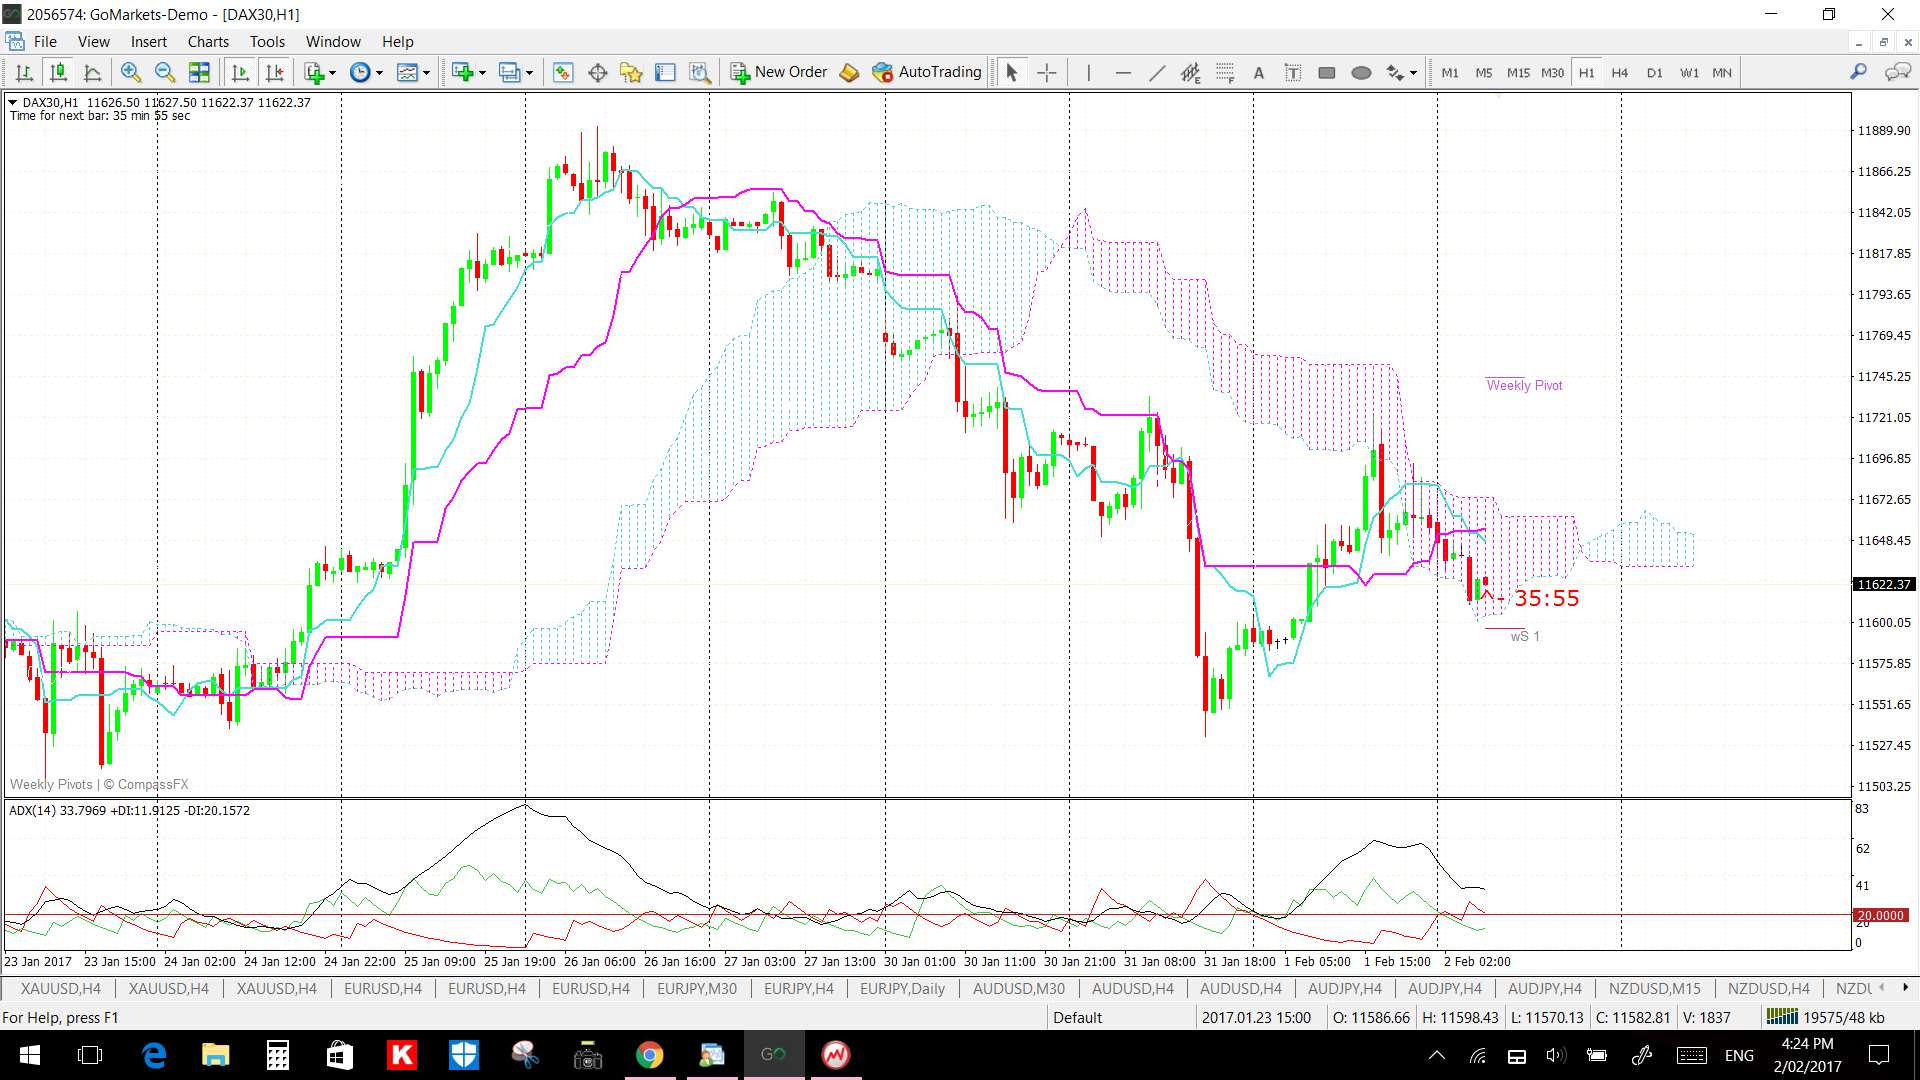
DAX 60 min: as mentioned above, keep an eye on the trend lines for any momentum-based breakout;
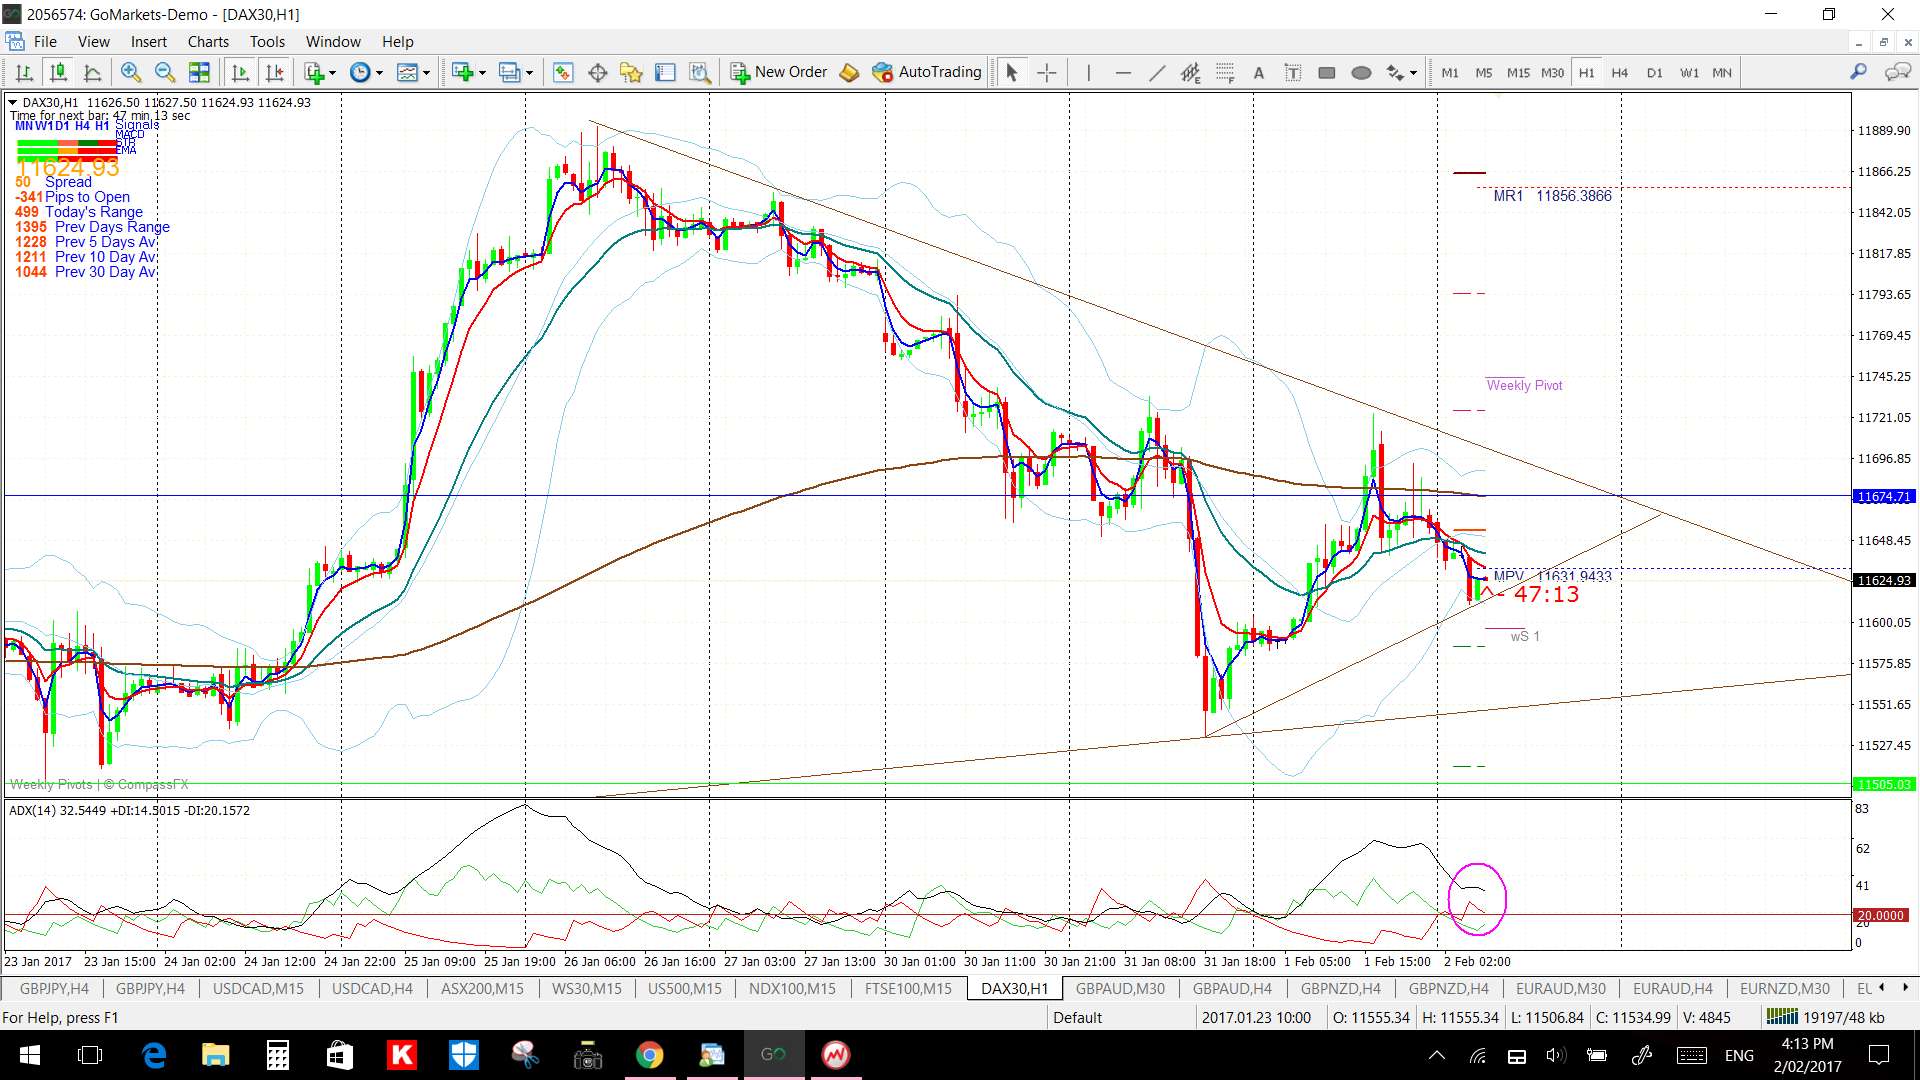
DAX 60 min Cloud: the DAX is in the 60 min Cloud so watch for any move out of this resistance zone:
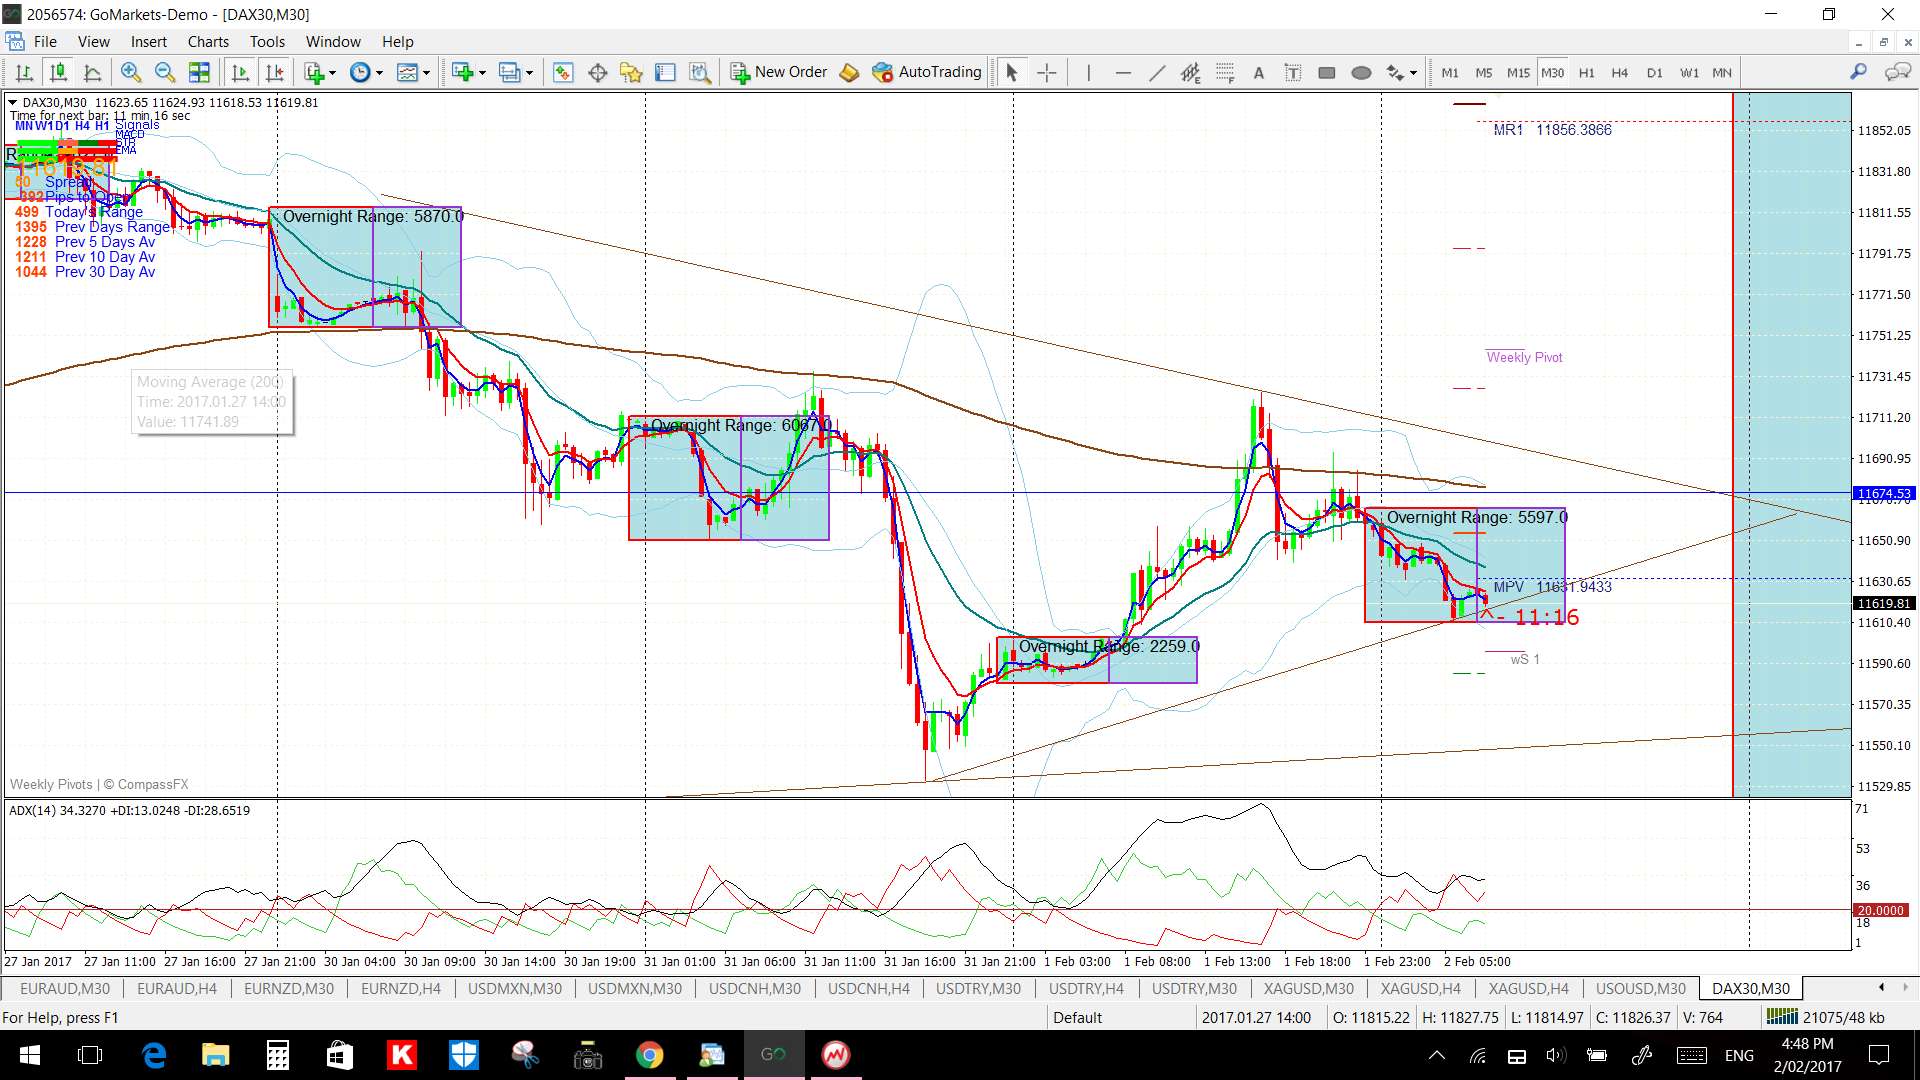
DAX 30 min: watch trend lines for any momentum-based breakout once market opens:
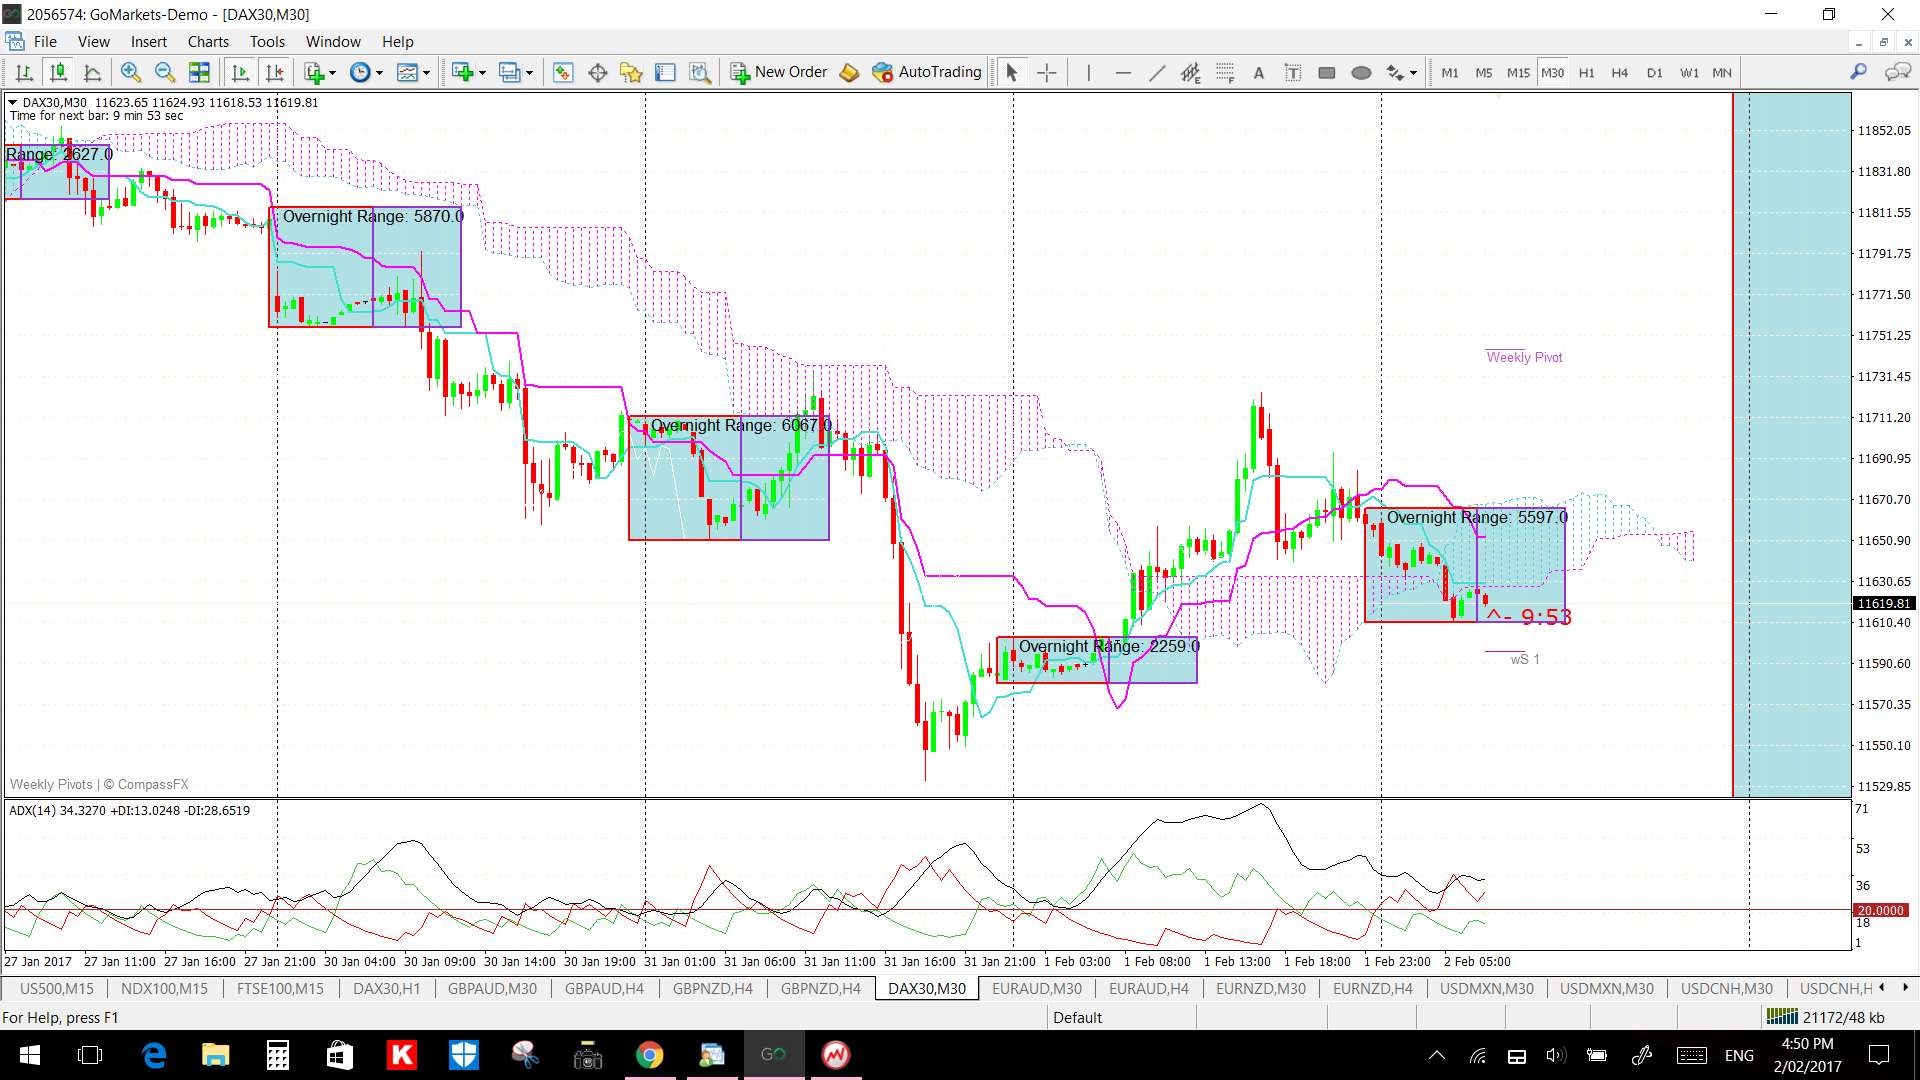
DAX 30 min Cloud: price is just below the 30 min Cloud which is bearish on this time frame too:
Summary: a trading bias on the DAX should be guided by the perspective and time frame of trading as summarised below:
Bullish bias: these bullish tones apply more to the longer-term time frame:
- a monthly-chart bullish ascending triangle b/o is in play.
- the weekly chart’s ADX and +DMI are > 20.
- price action is above the monthly, weekly & daily Cloud:
Bearish bias: these bearish tones apply more to the recent and shorter-term frame:
- price action is below the 4hr & 30 min Cloud and within the 60 min Cloud.
- price action is trading under a bear trend line from a recent 4hr triangle pattern.
Watch for momentum-based trend line breakouts to help gauge the next directional move.
The post The German DAX: my review. appeared first on Trade Charting.
The post The German DAX: my review. appeared first on www.forextell.com.