Last week: The French Presidential Election triggered a few gaps at market open last Monday but there were still plenty of trend line breakout trades that could have been harnessed for many pips. In fact, there were over 7,000 pips on offer from Forex and 860 points from stock index charts by using this method following charts that were posted here last weekend. The good news is that there are more trend lines to monitor in the coming ‘big data’ week and the charts are posted in this update: charts on Forex, Commodities and Stock Indices.
Successful breakout trades: These breakout trades were summarised in detail on Thursday but the final pip or point tally is outlined below:
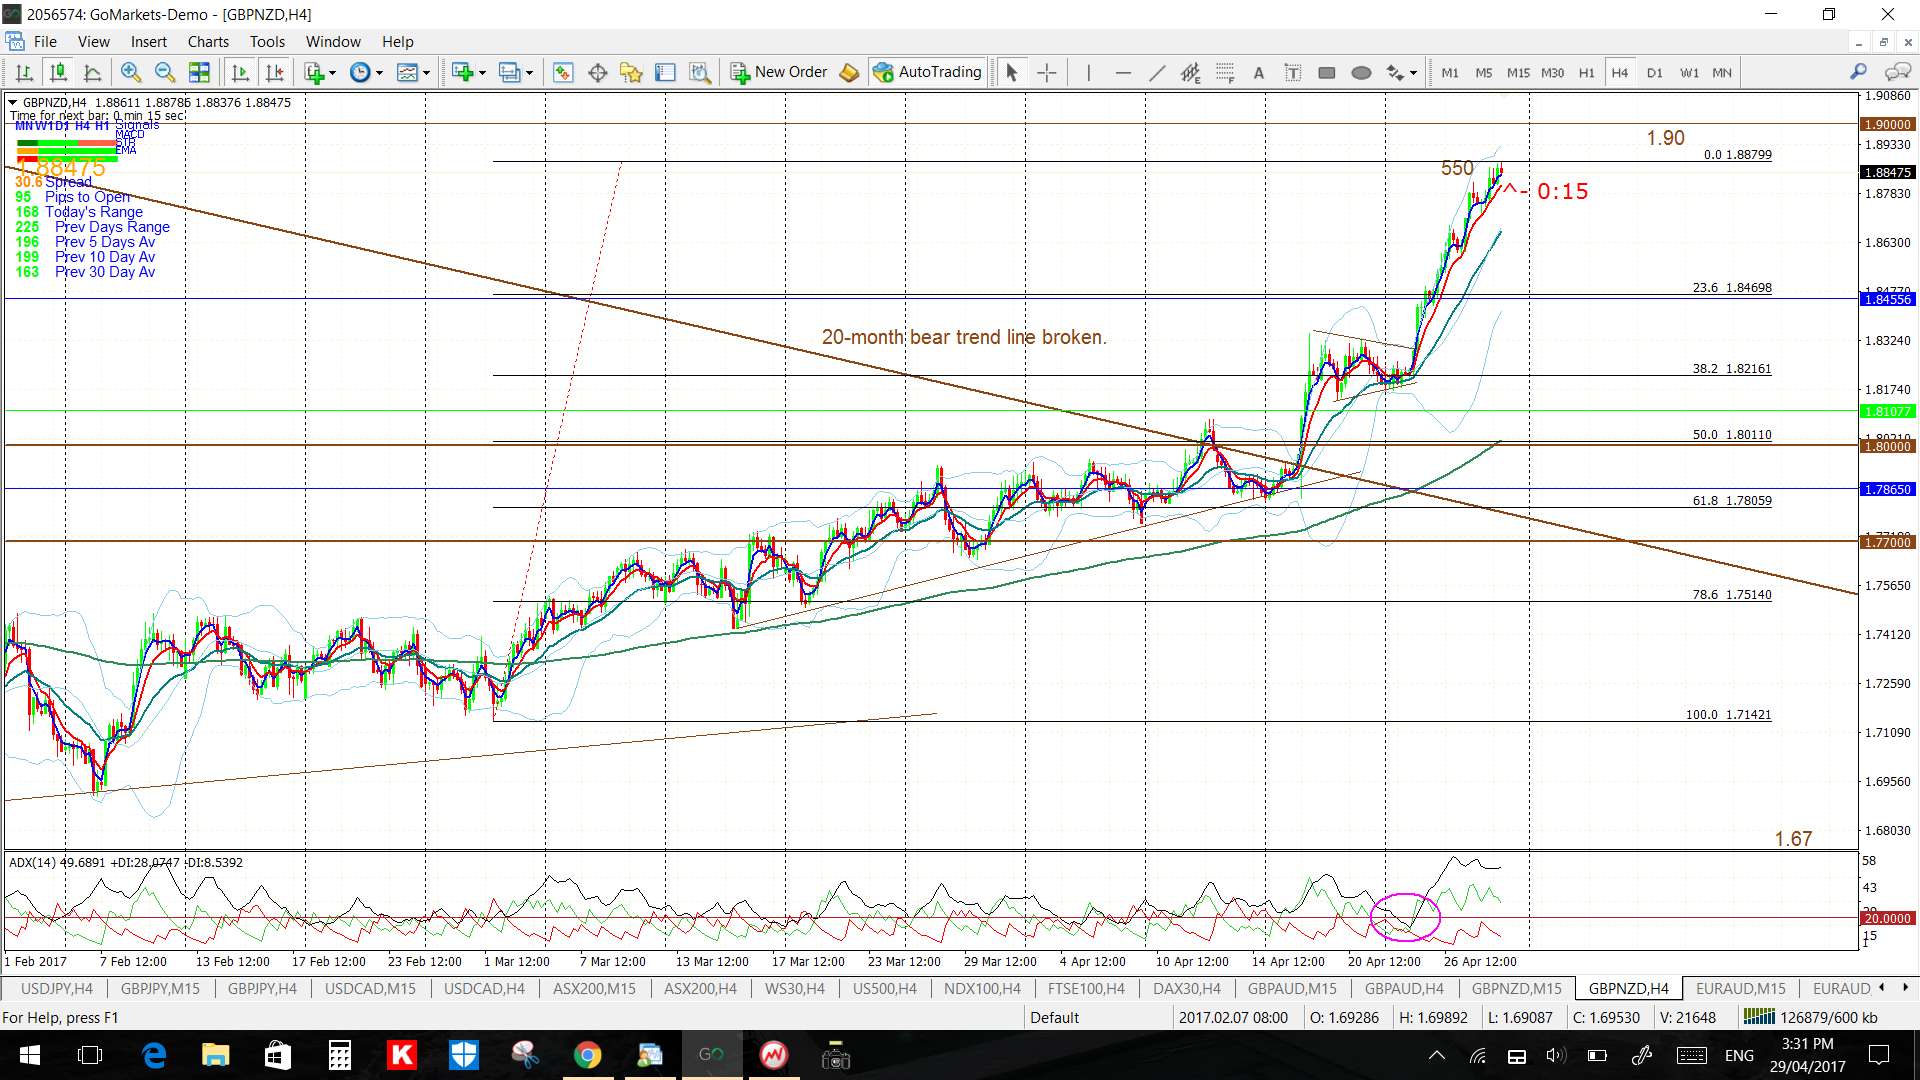
- GBP/NZD: 550.
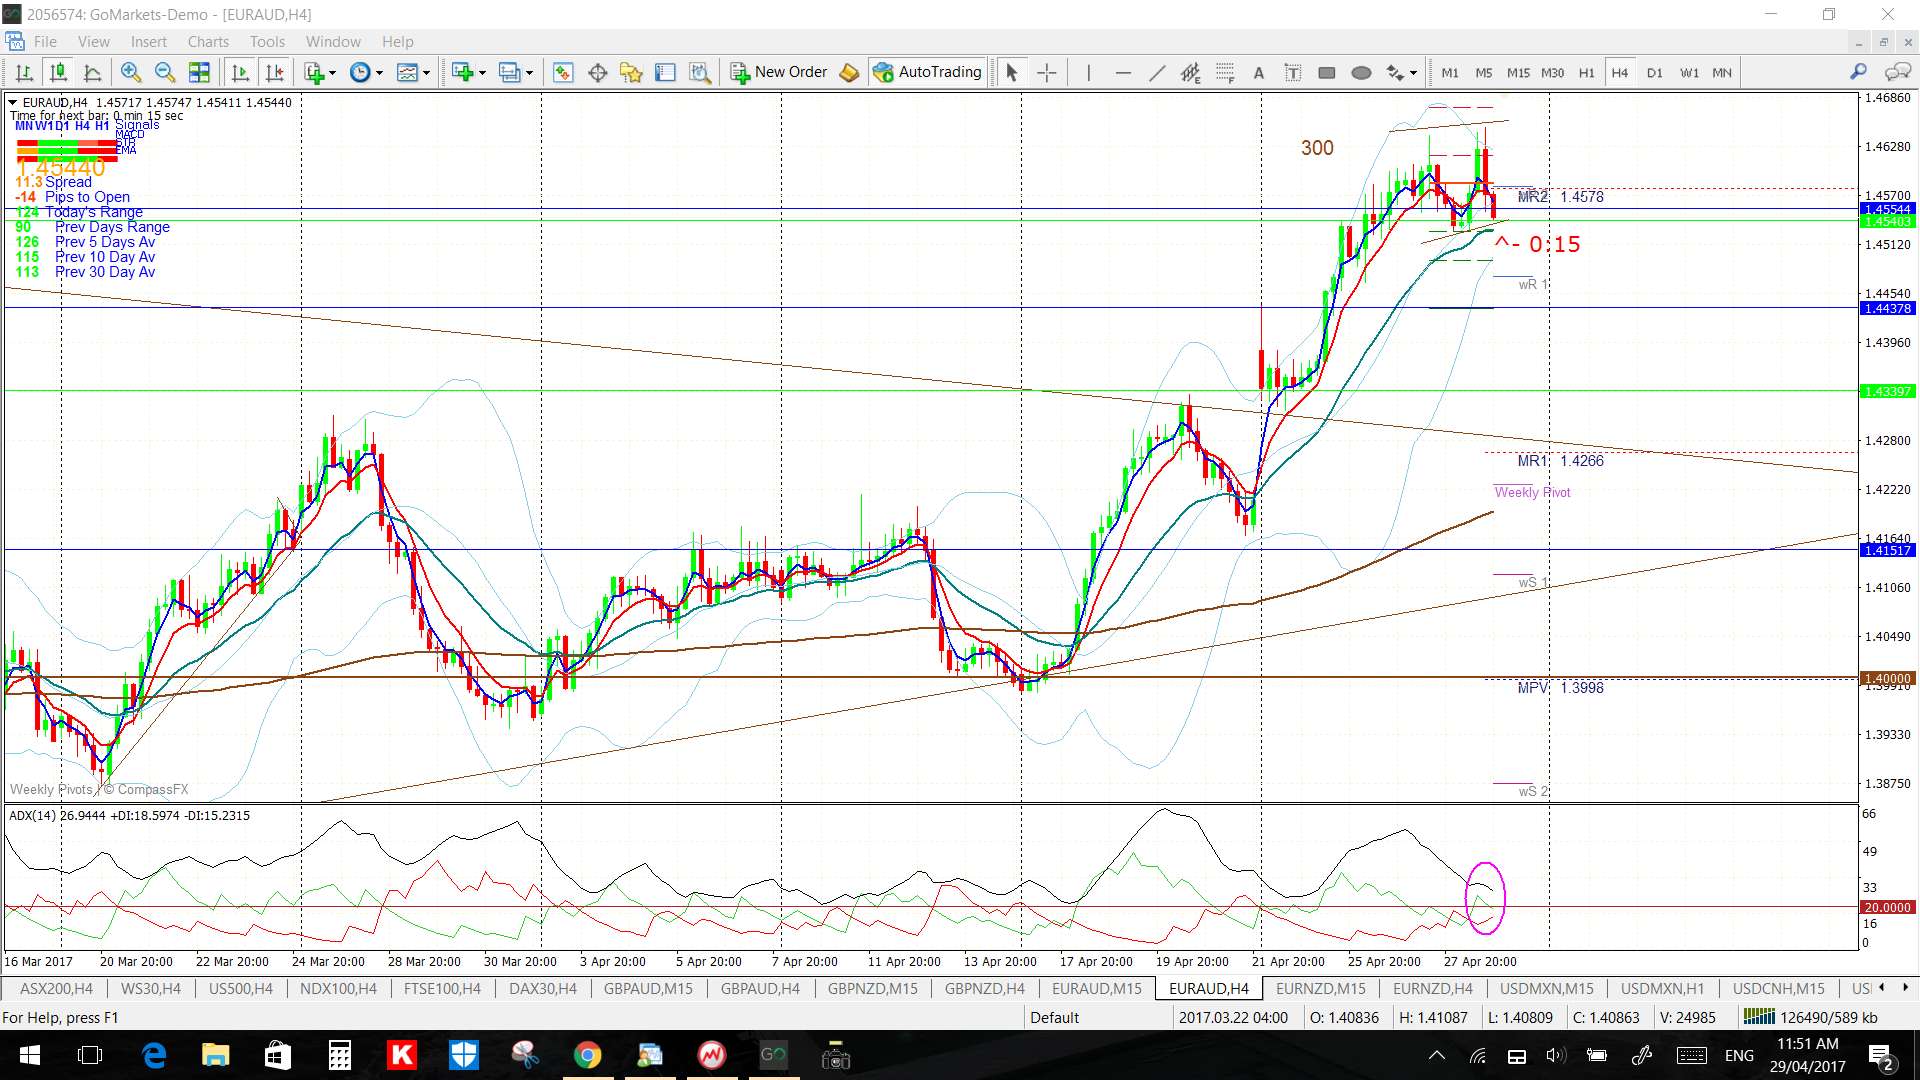
- EUR/AUD: 300.
- EUR/NZD: 500.
- USD/MXN: 4,500.
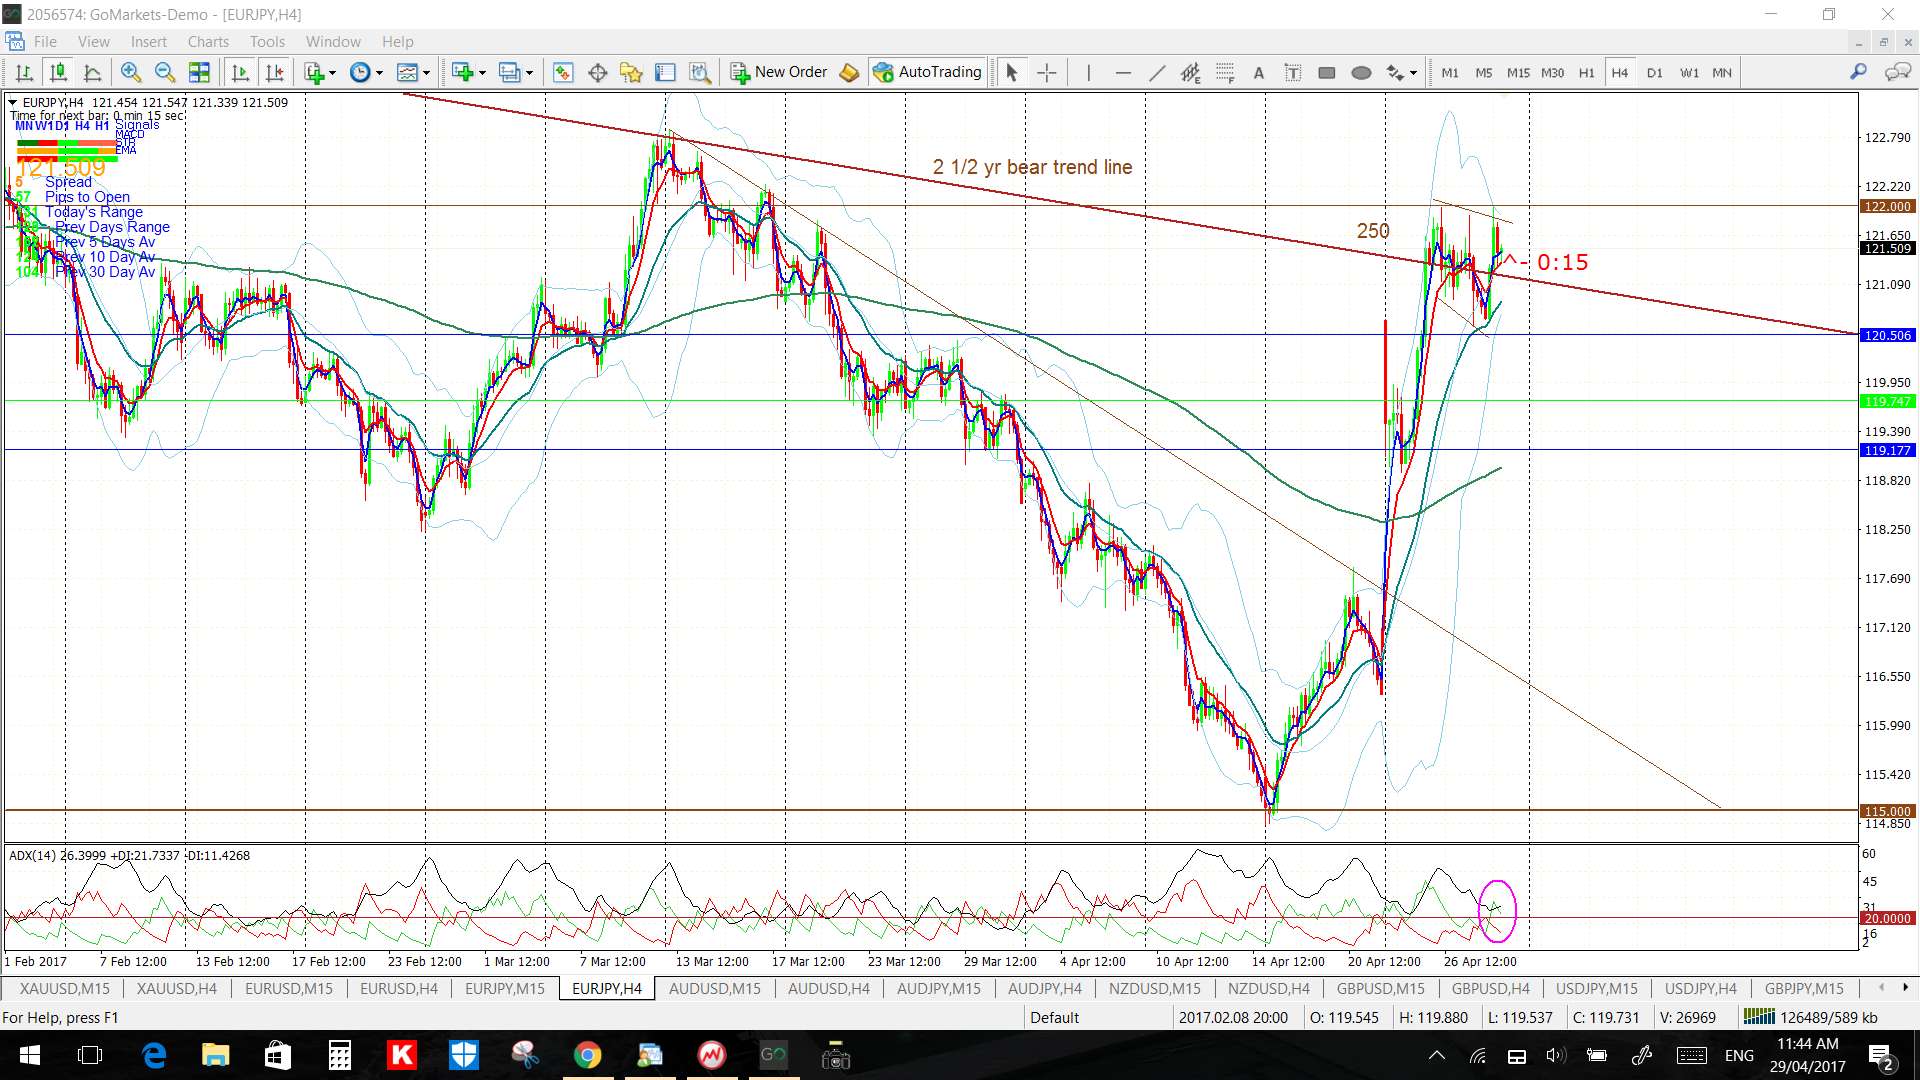
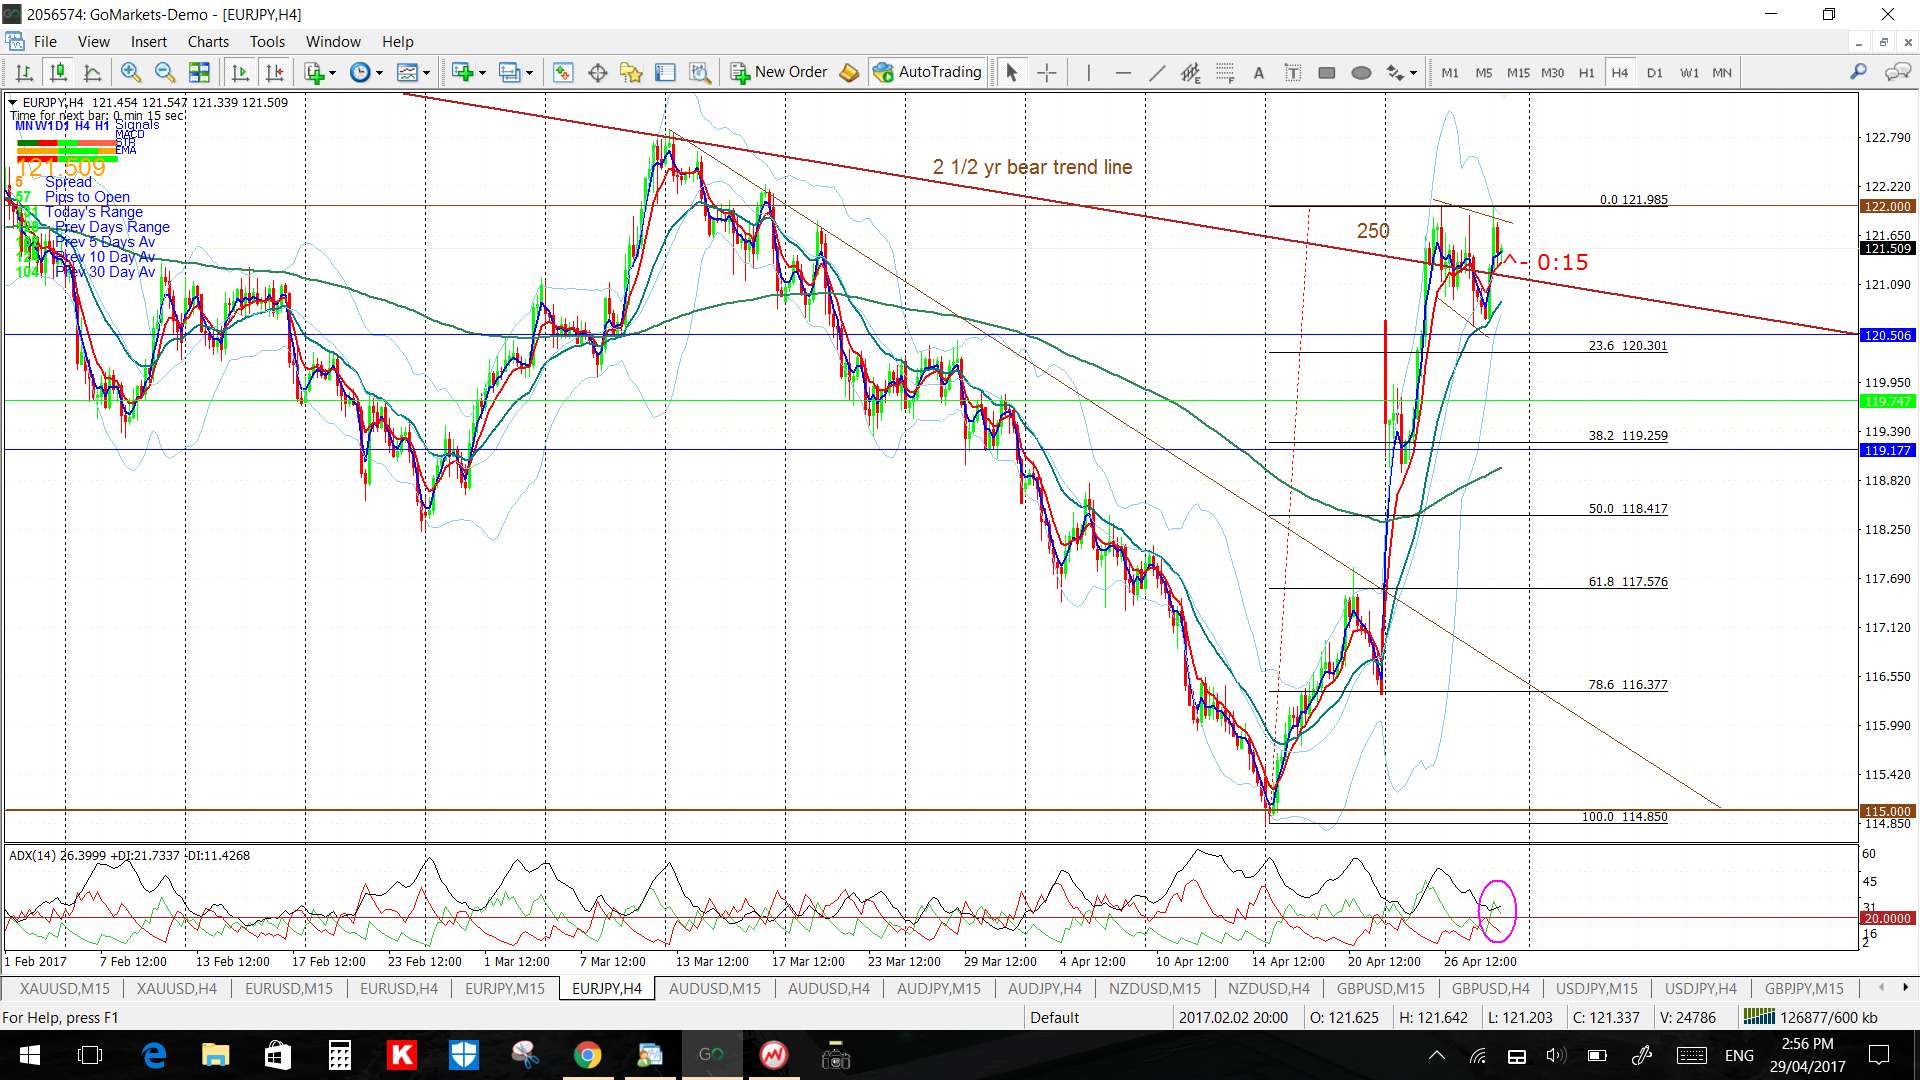
- EUR/JPY: 250.
- AUD/JPY: 100.
- USD/JPY: 190.
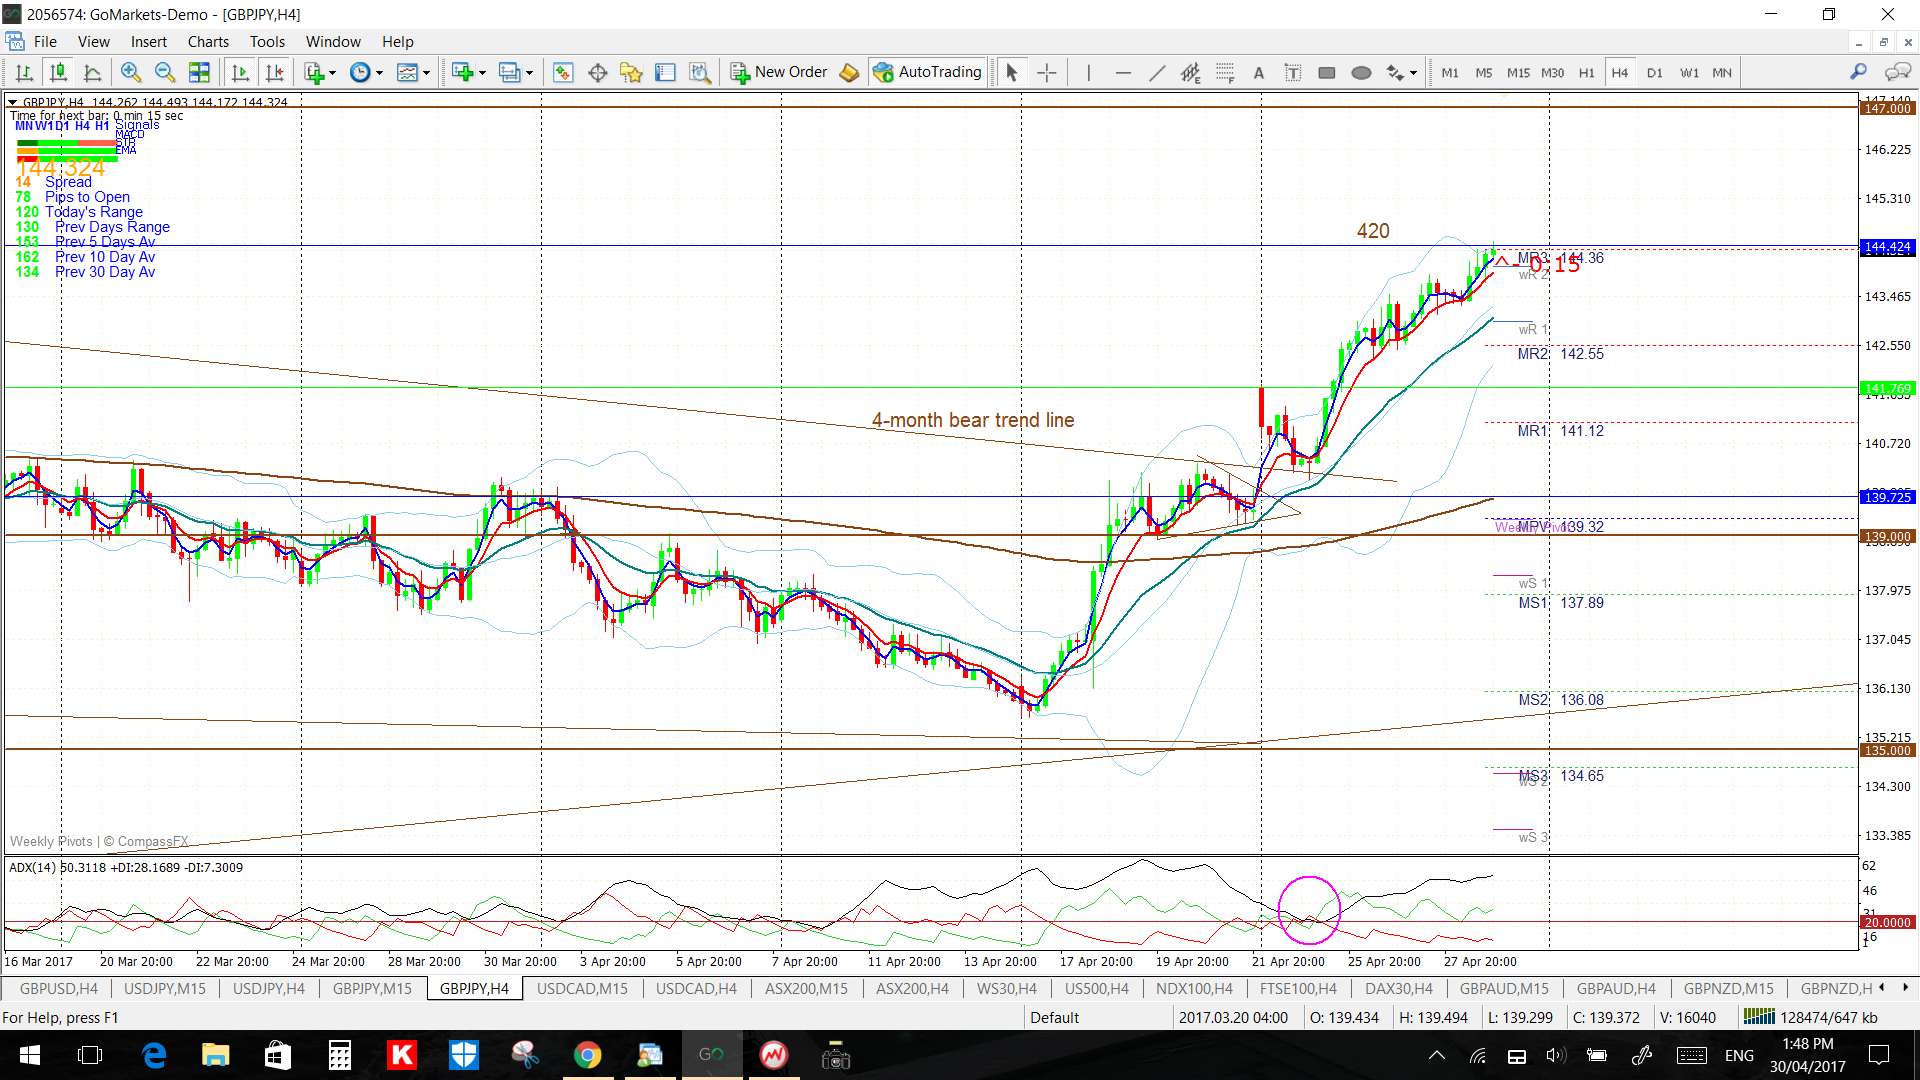
- GBP/JPY: 420.
- AUD/USD: 45.
- NZD/USD: 50.
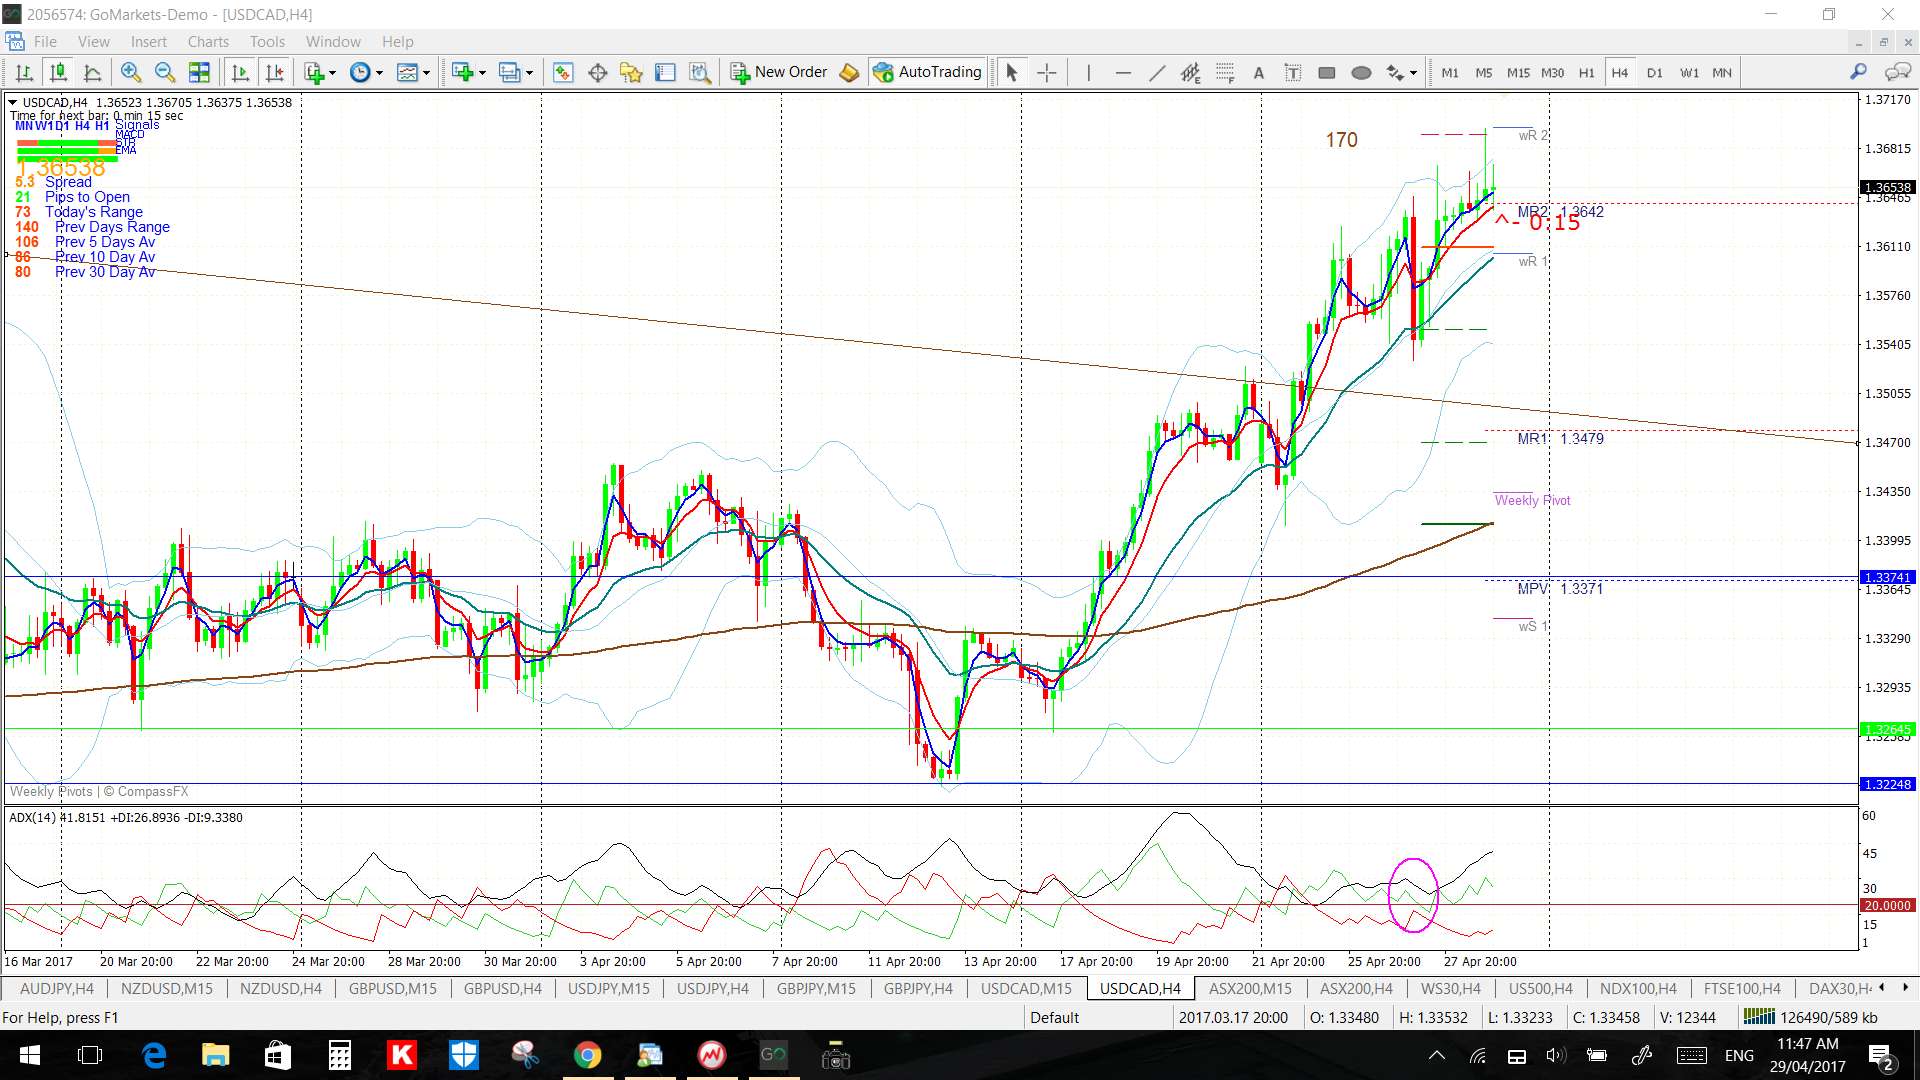
- USD/CAD: 170.
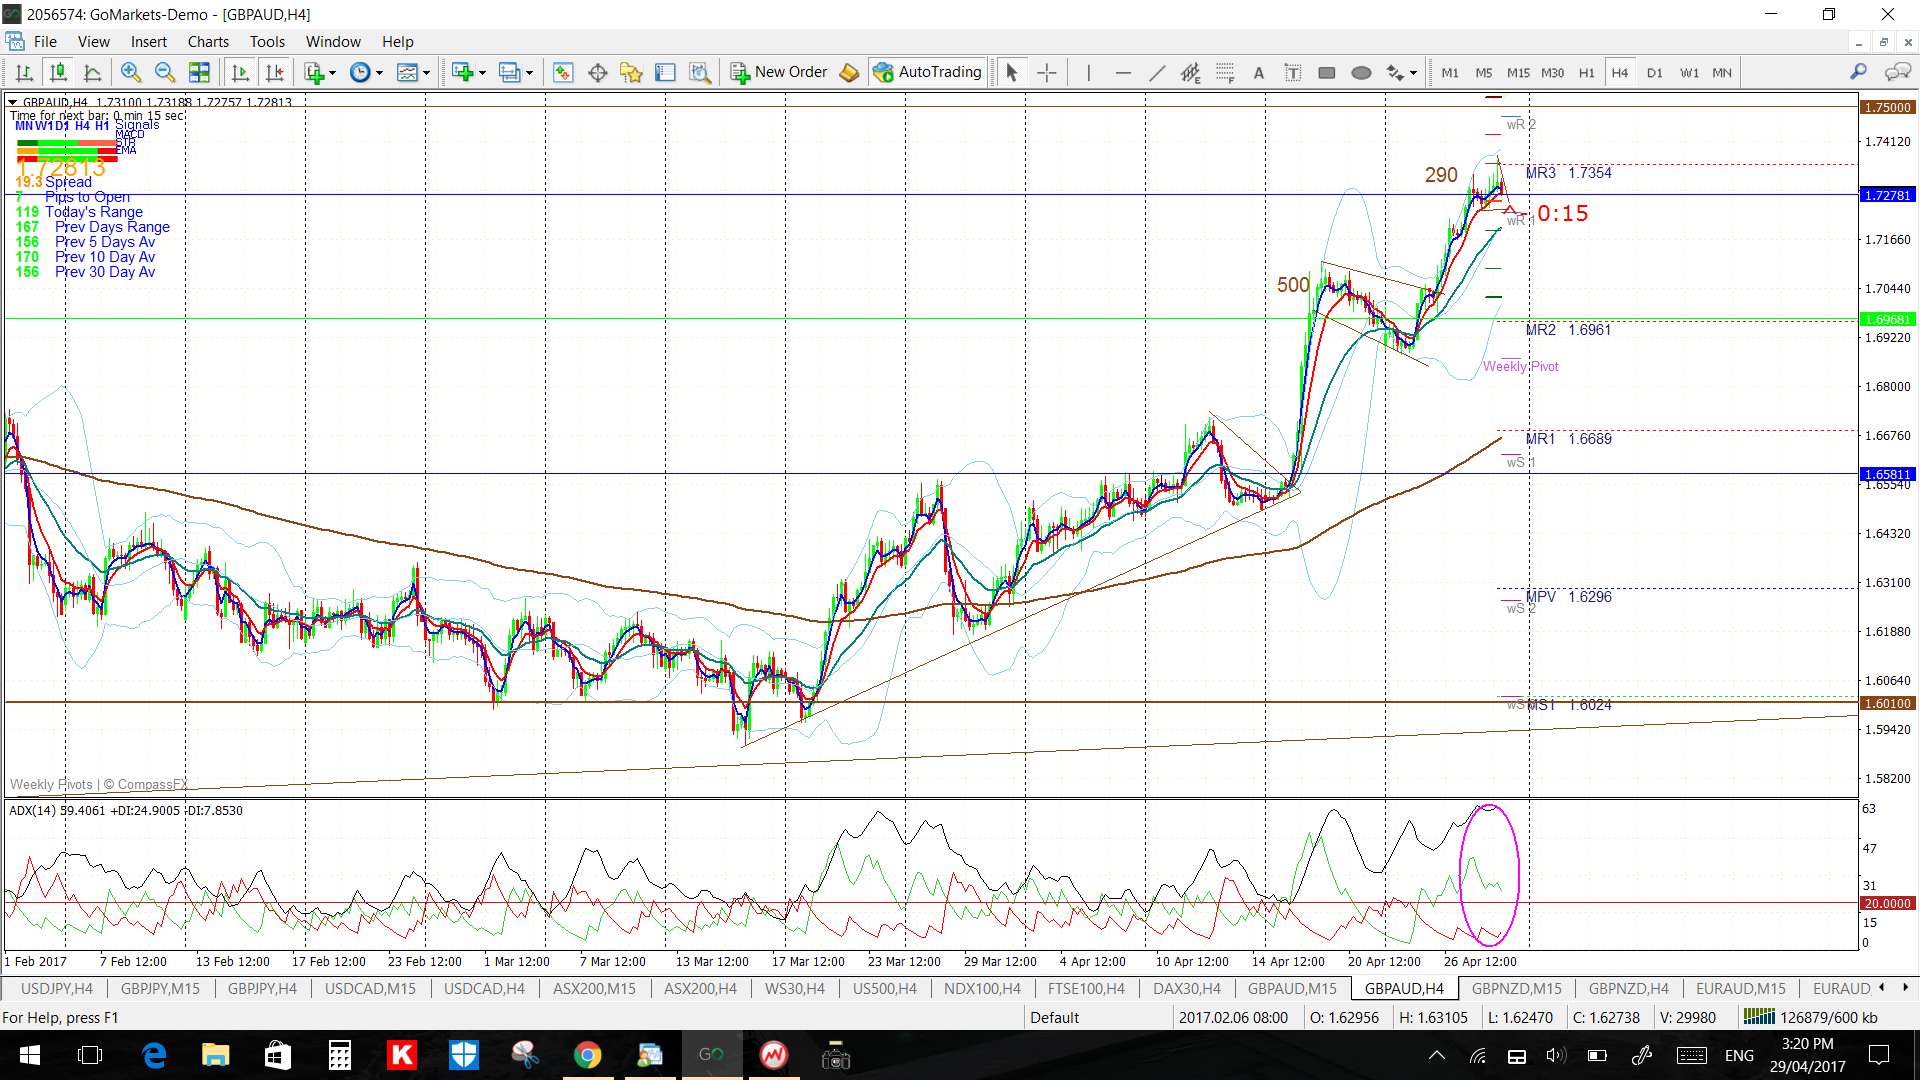
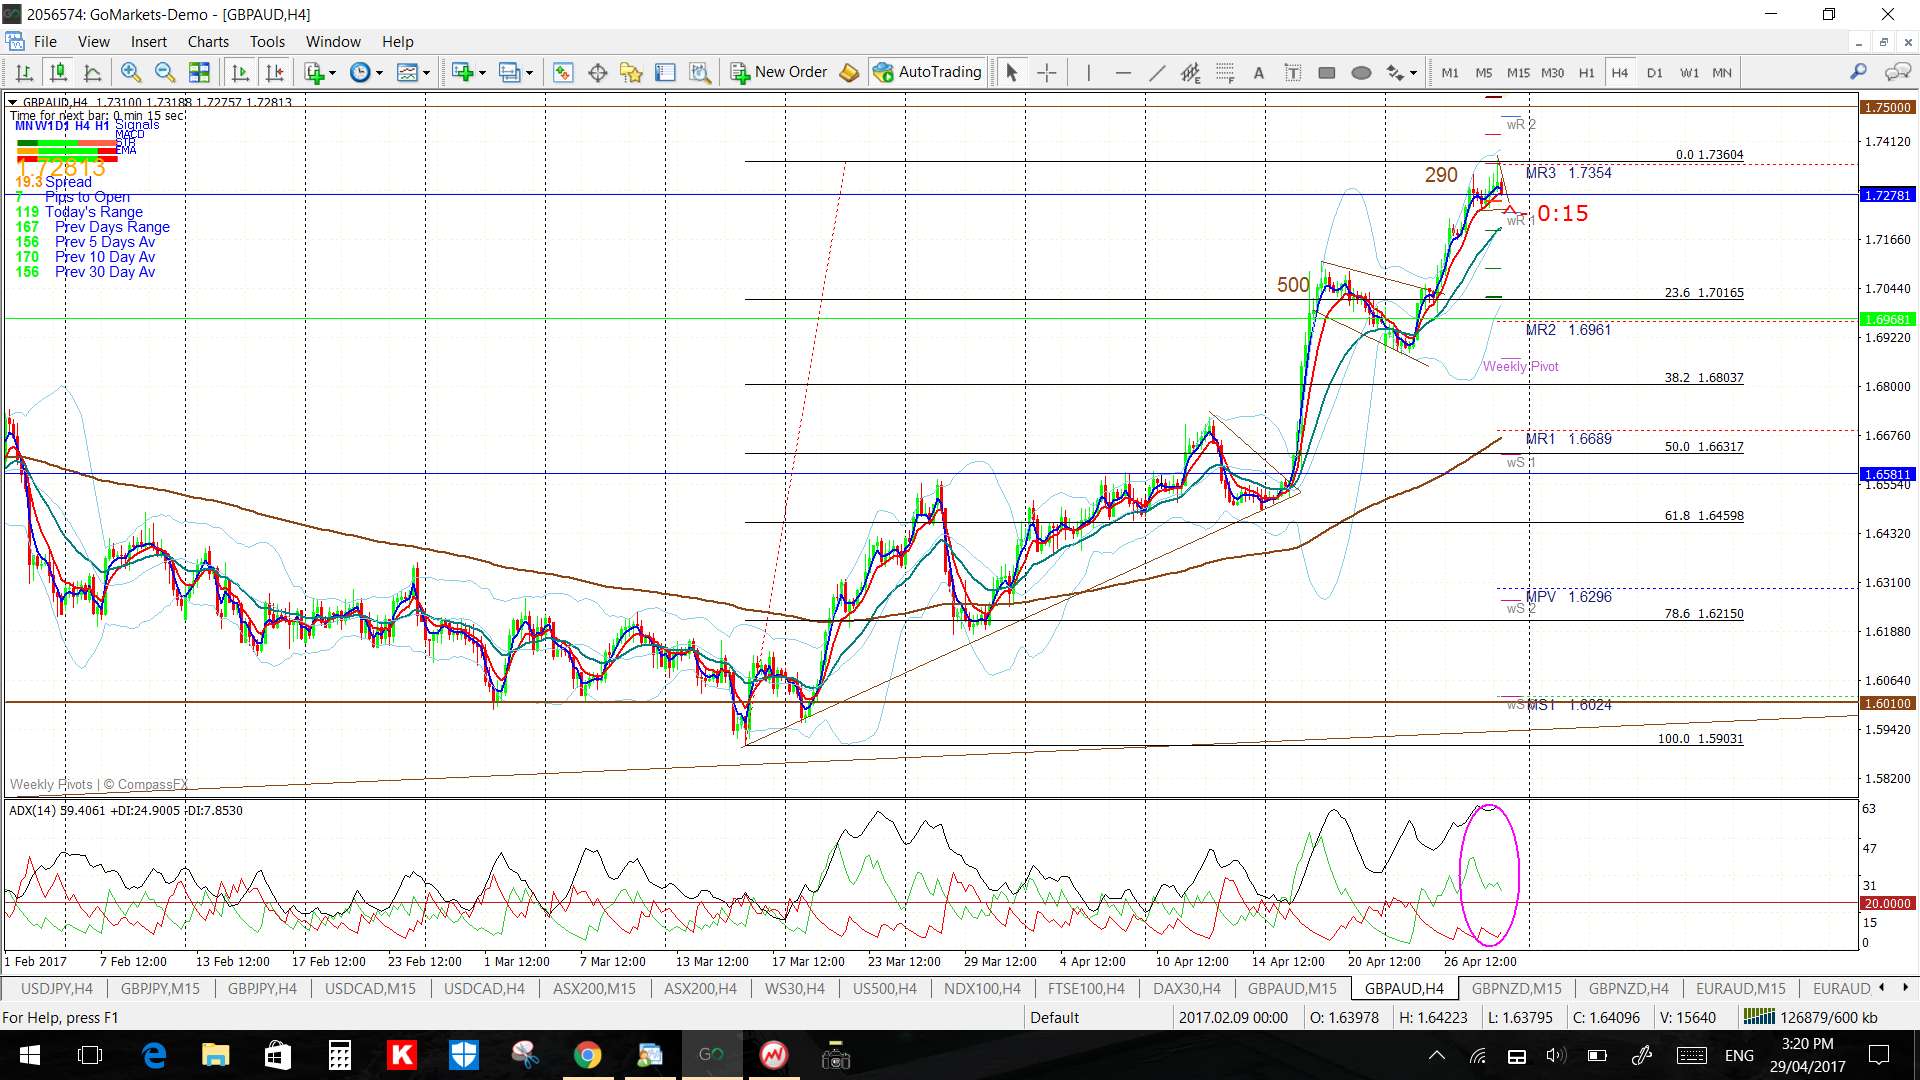
- GBP/AUD: 290.
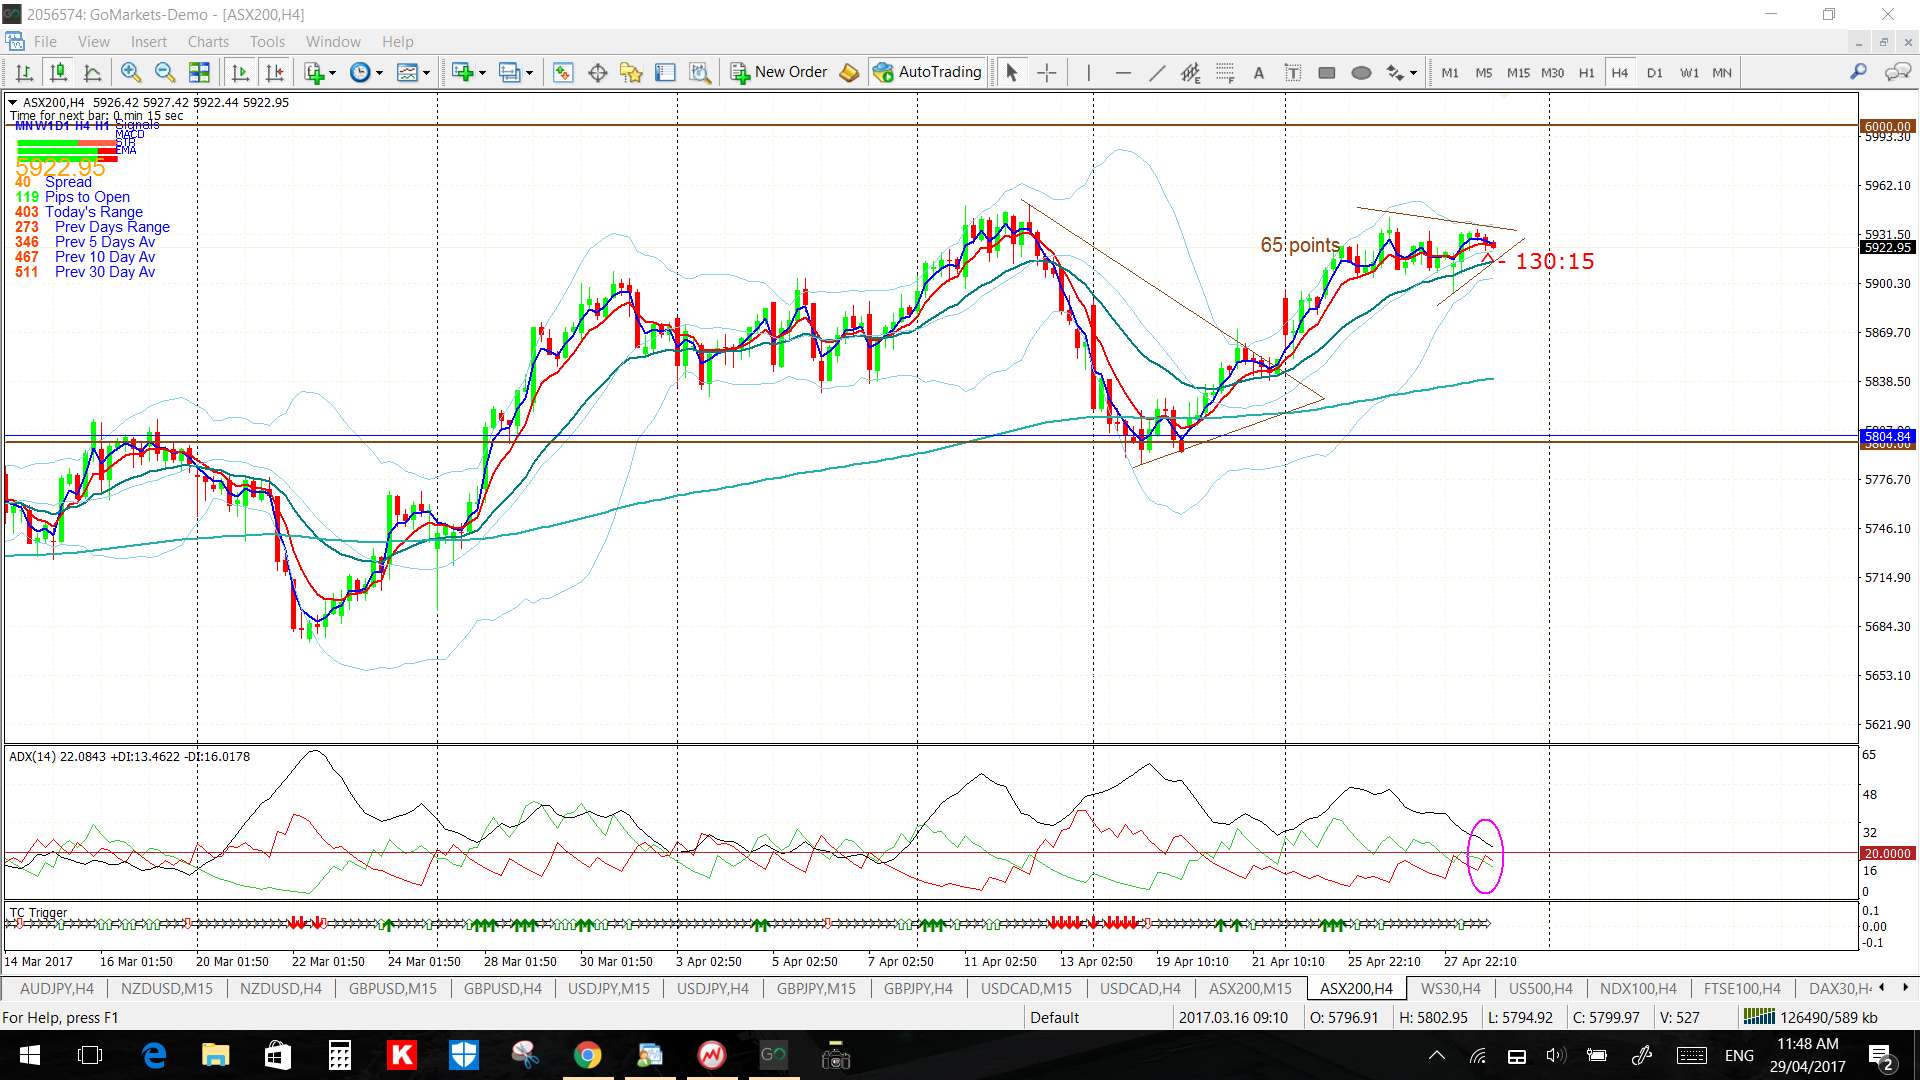
- ASX-200: 65 pts.
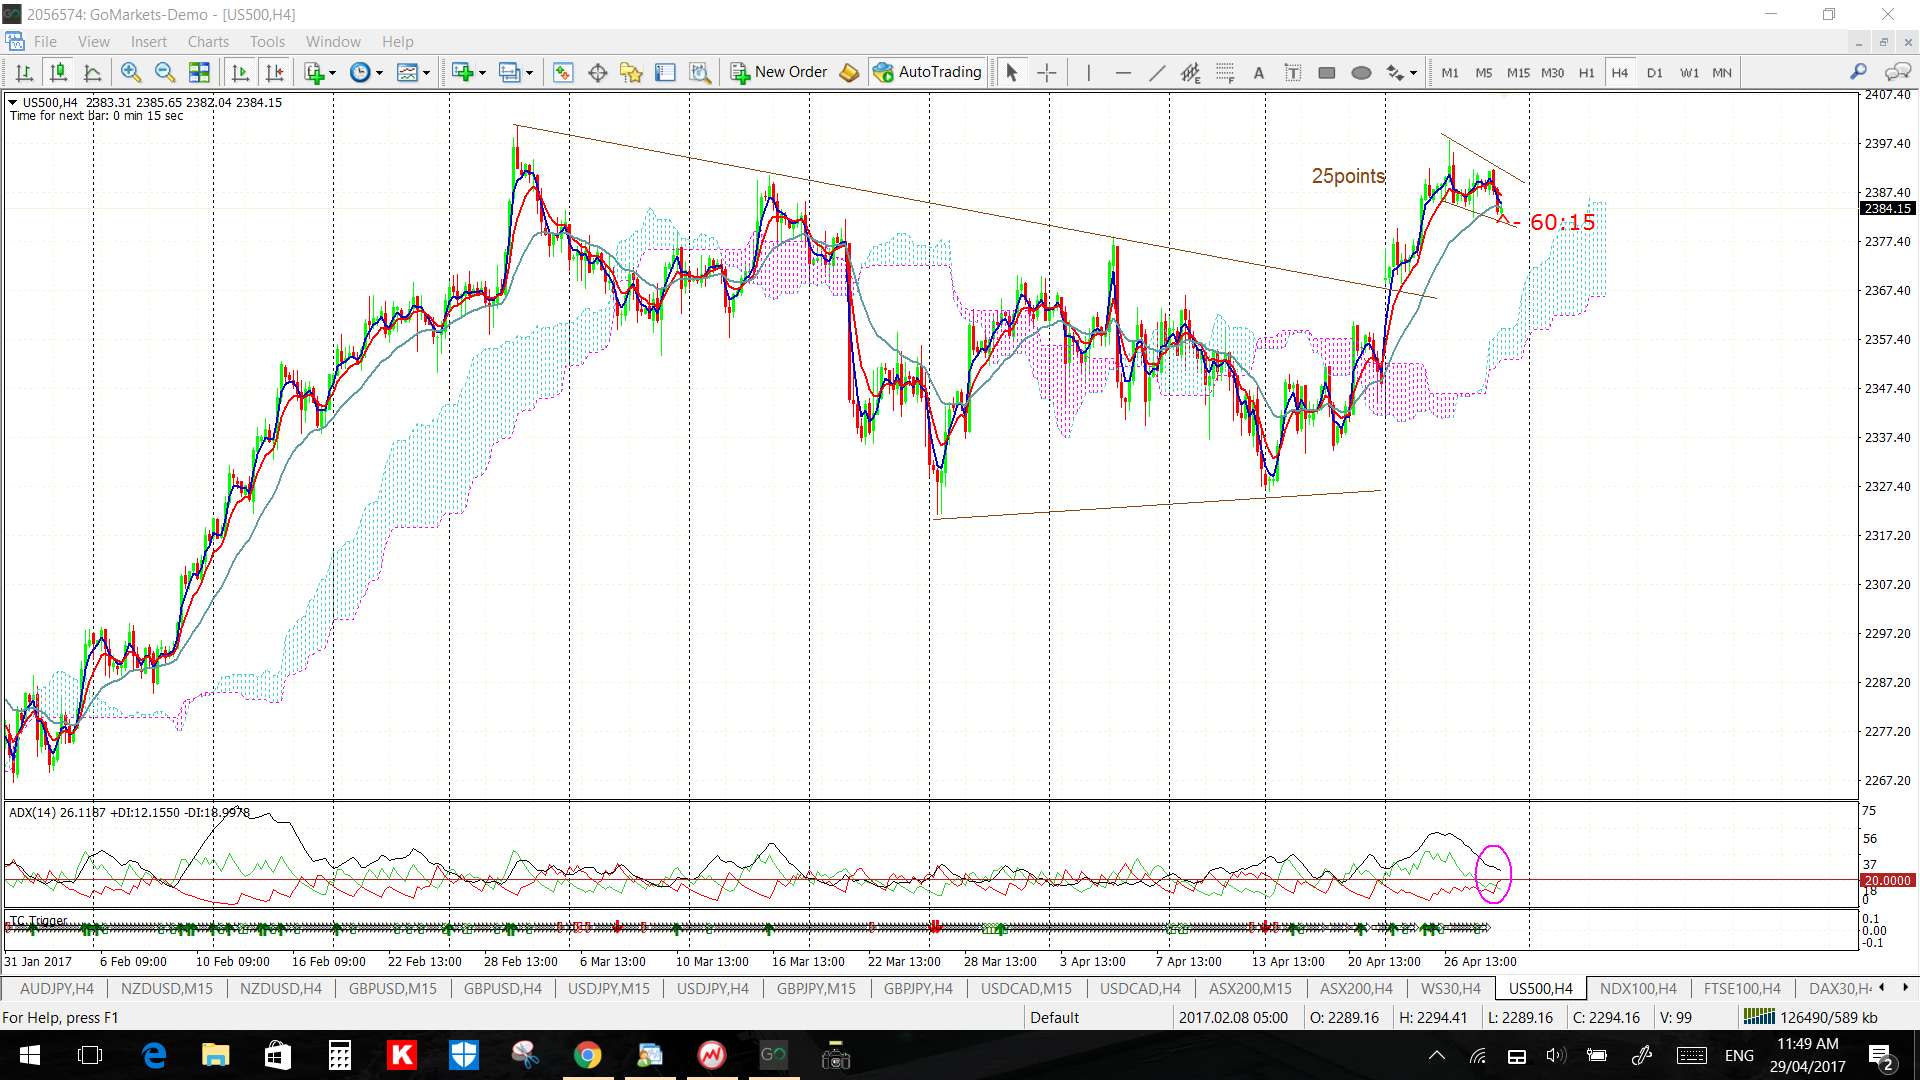
- S&P500: 25 pts.
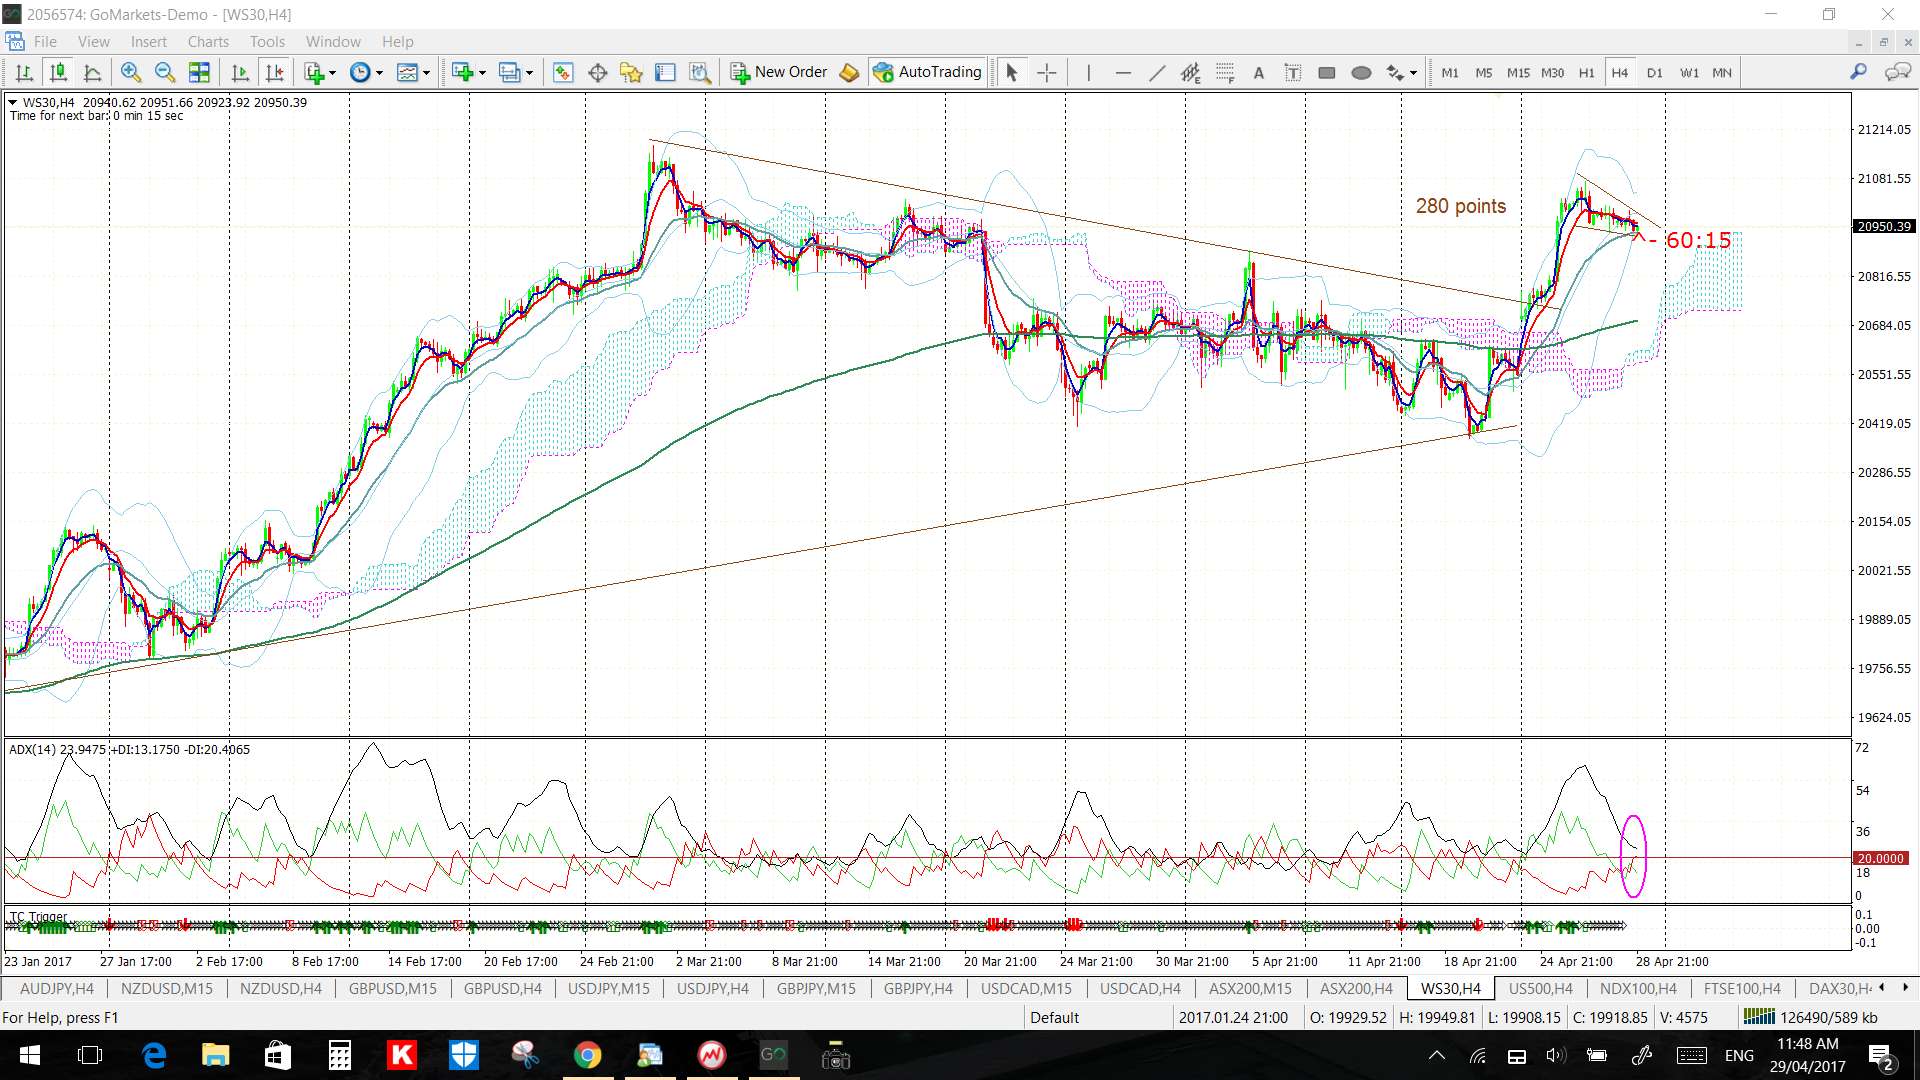
- DJIA: 280 pts.
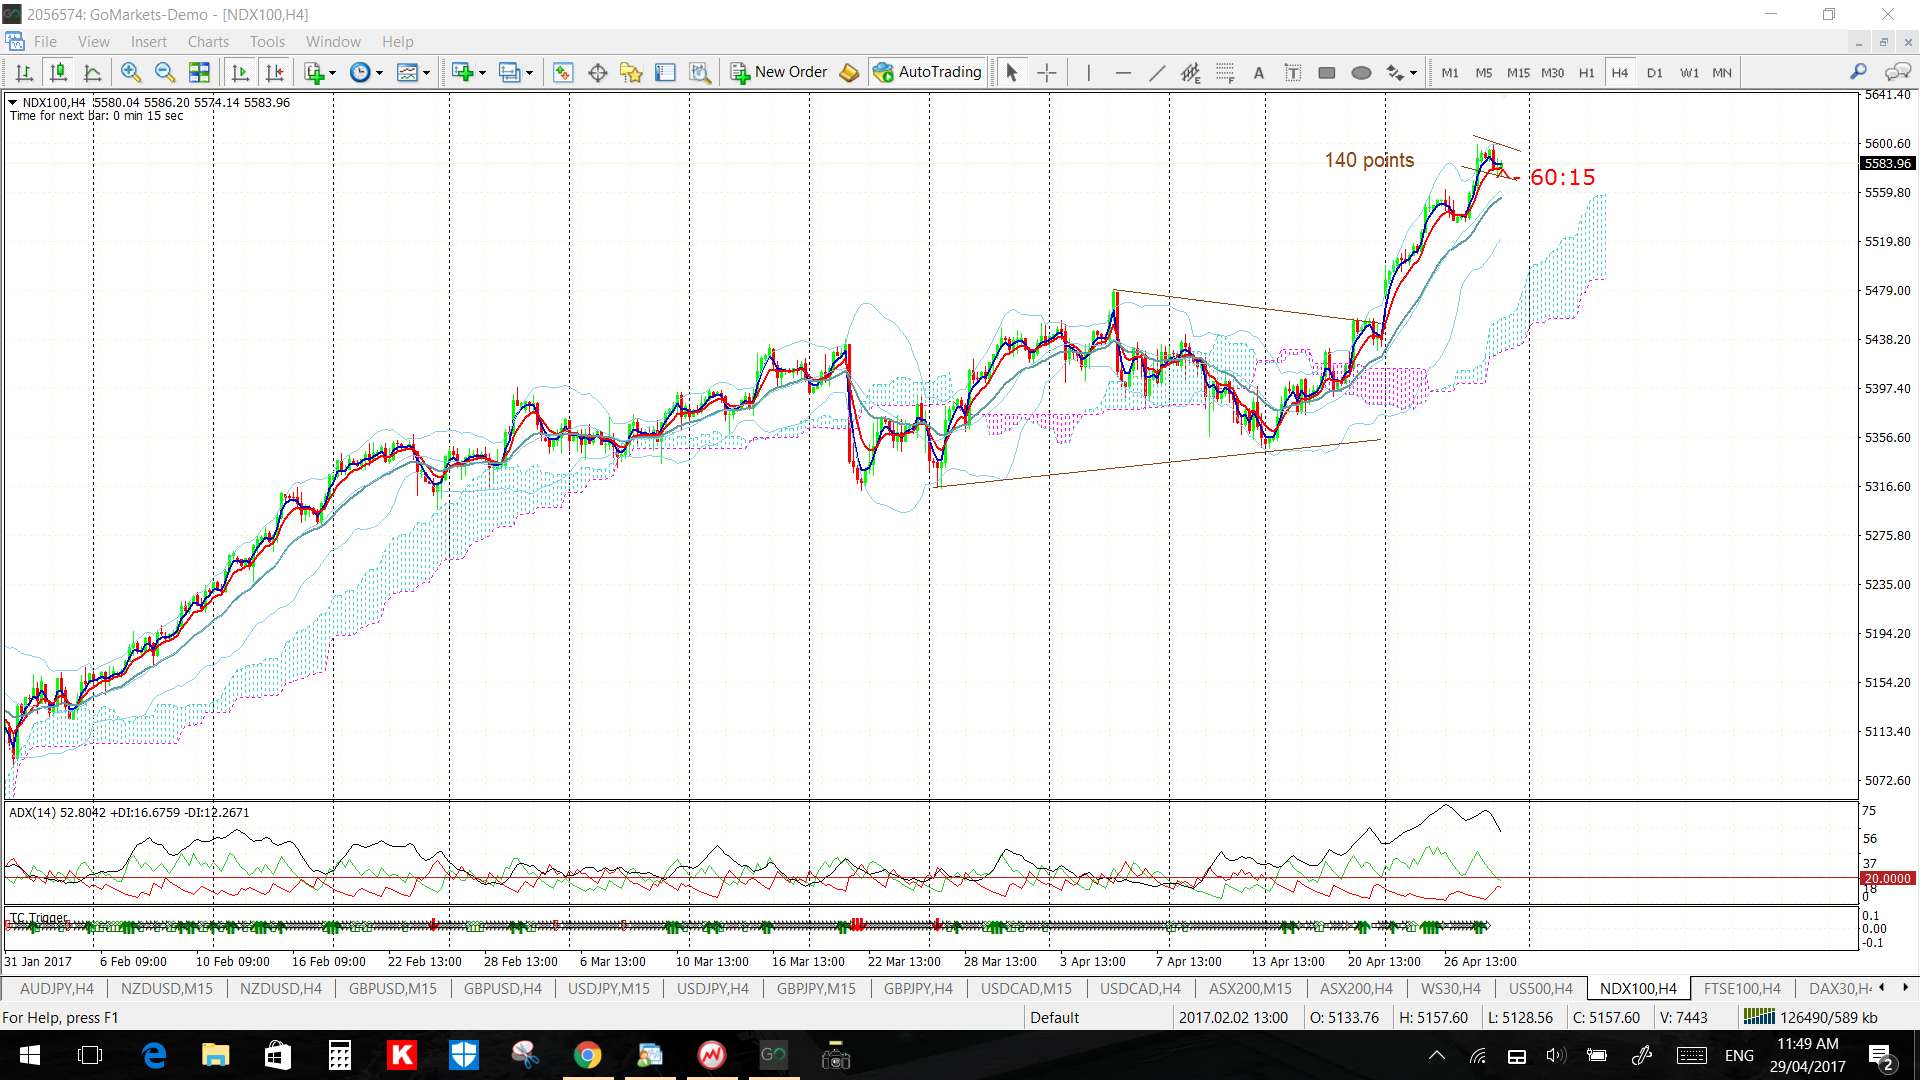
- NASDAQ-100: 140 pts.
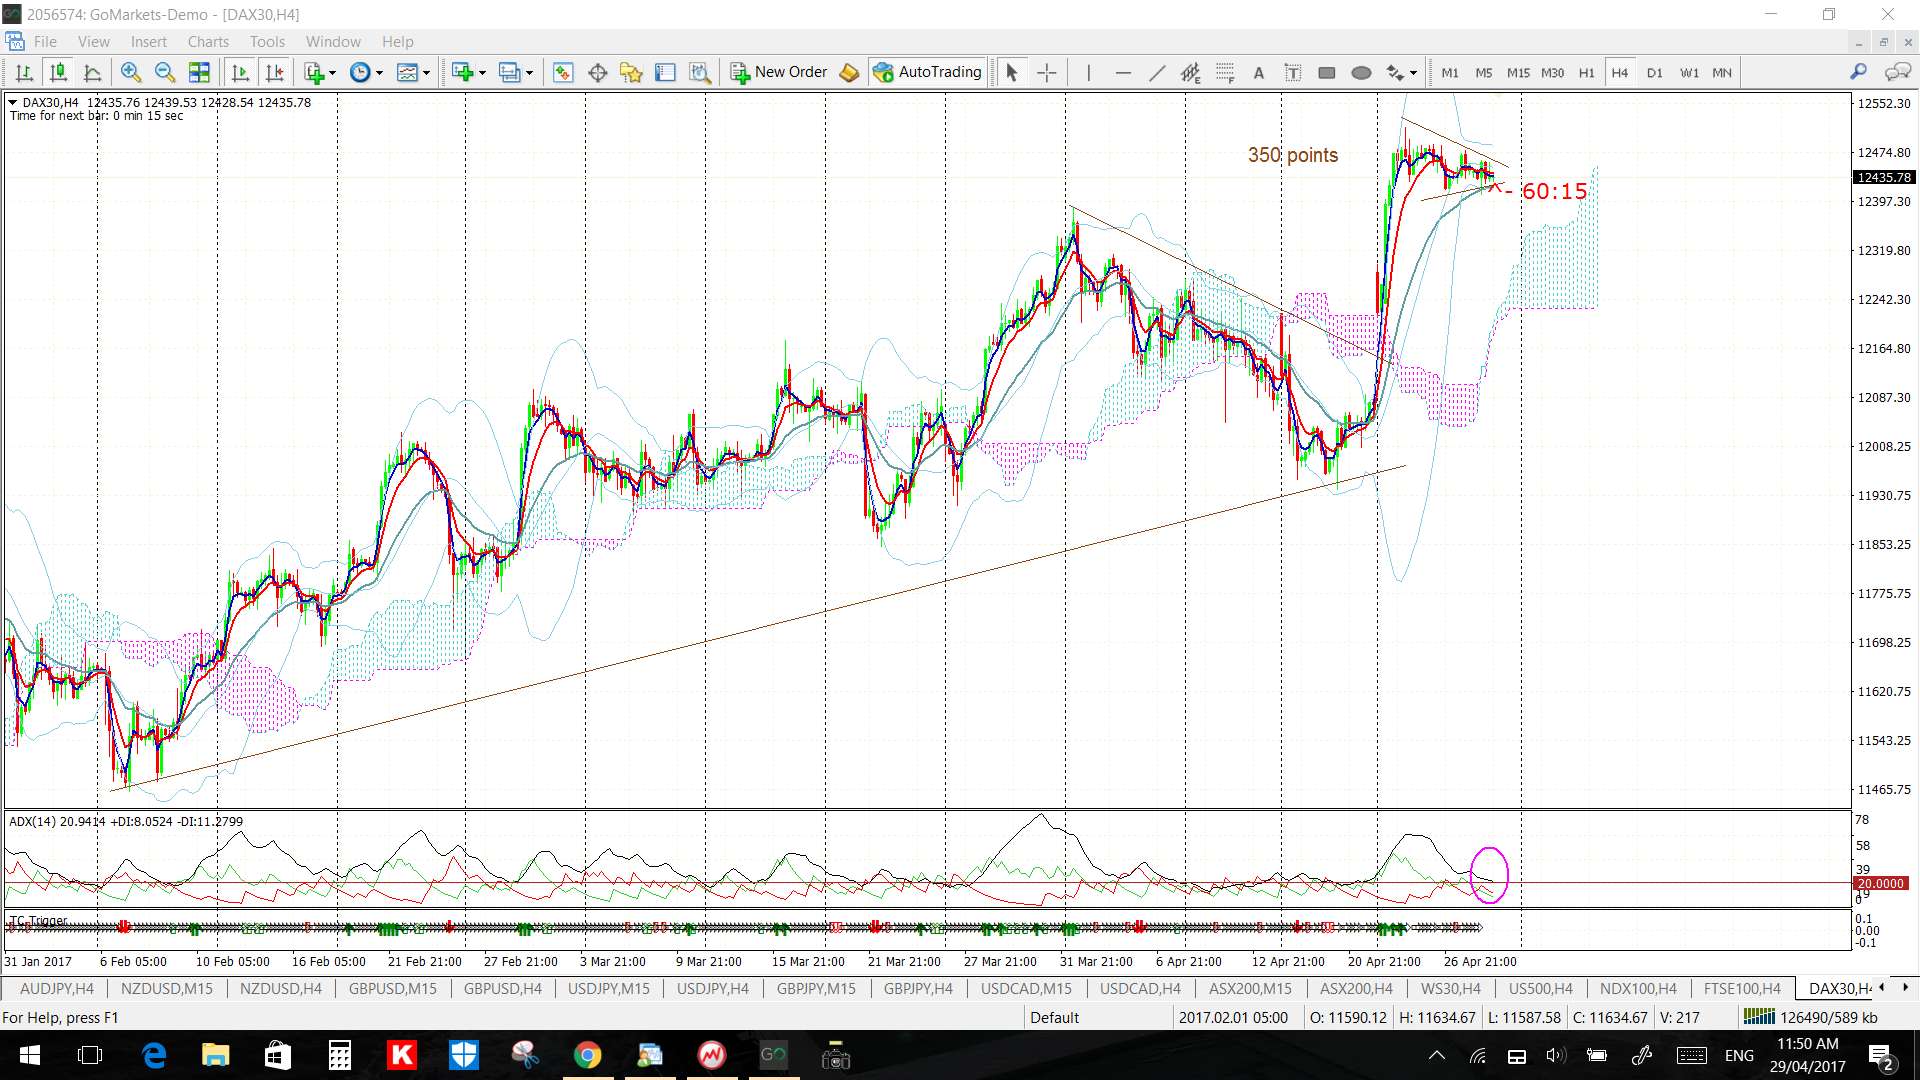
- DAX-30: 350 pts.
Next Week:
- US$: The US$ remains weak, below the key 100 level and hovering above a 3-year support trend line and the success, or otherwise, at this support will be important for many FX pairs. There is a lot of data to potentially impact the US$ this week to get thins going with ISM Non-Manufacturing & Manufacturing PMIs, Trade Balance, FOMC and NFP. An FX update can be found through this link.
- TC + TL lessons: there were two great examples of using trend line breakouts along with new TC signals to harness pips and I have summarised these in a new page on my site that can be found through this link.
- New month: next week marks the start of a new month so watch for new pivots.
- Central Banks: The RBA (AUD) updates interest rates on Tuesday and FOMC (USD) on Wednesday.
- GBP: The GBP pairs I monitor are shaping up with more interest for me as one pair, the GBP/NZD, has just broken a multi-month bear trend line and the others, GBP/JPY, GBP/AUD and GBP/USD, have similar trend lines in their midst. It seems that Brexit related news might not be as much of a worry now in the light of other global events; with Syria, North Korea and the French Elections as just a few.
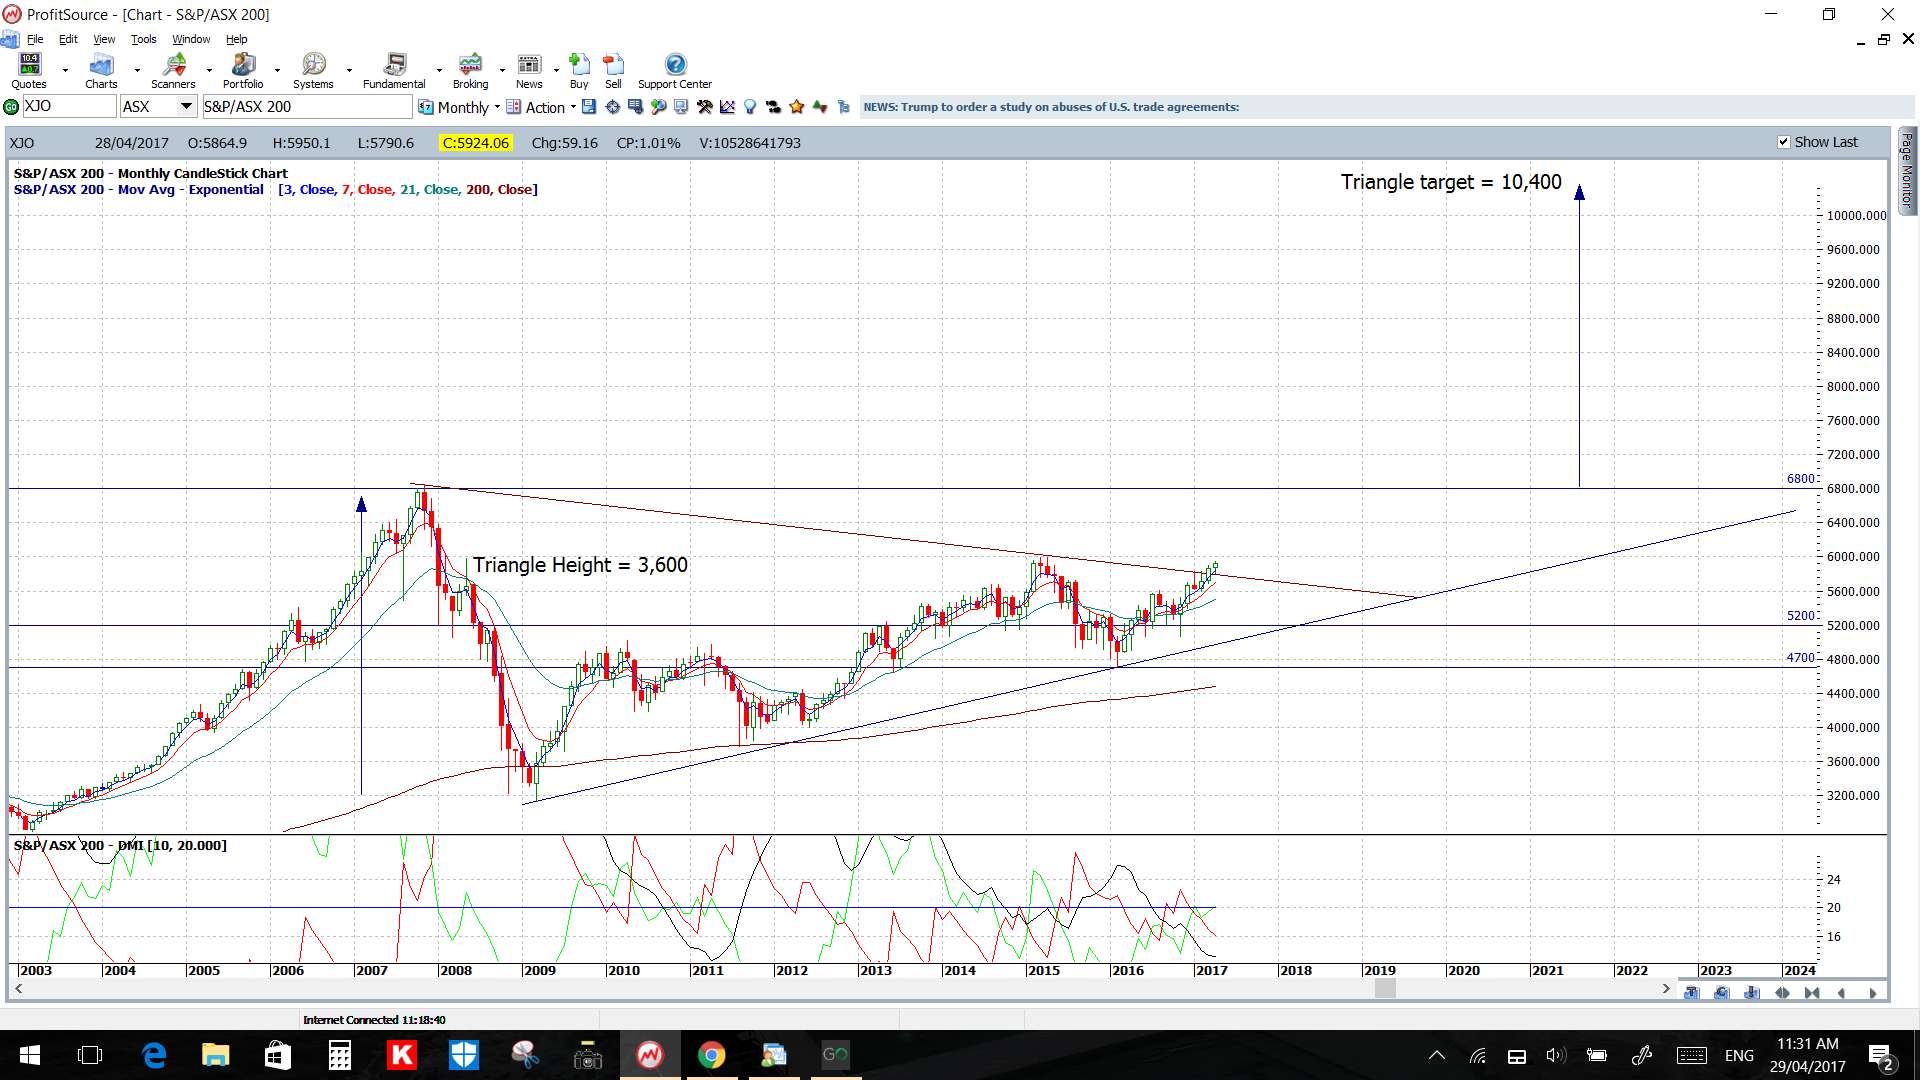
- ASX-200: the ASX-200 monthly chart’s bullish triangle breakout is progressing nicely (chart later). FWIW: the S&P500, DJIA, DAX, NASDAQ and NASDAQ-100 all closed higher for the month but the FTSE and TSX closed lower.
- NAFTA: was being debated again over the w/e so watch for impact on the MXN and CAD pairs.
- French Election: there is little time to relax as the final French Presidential Election is on next weekend so watch for more market gaps after this event.
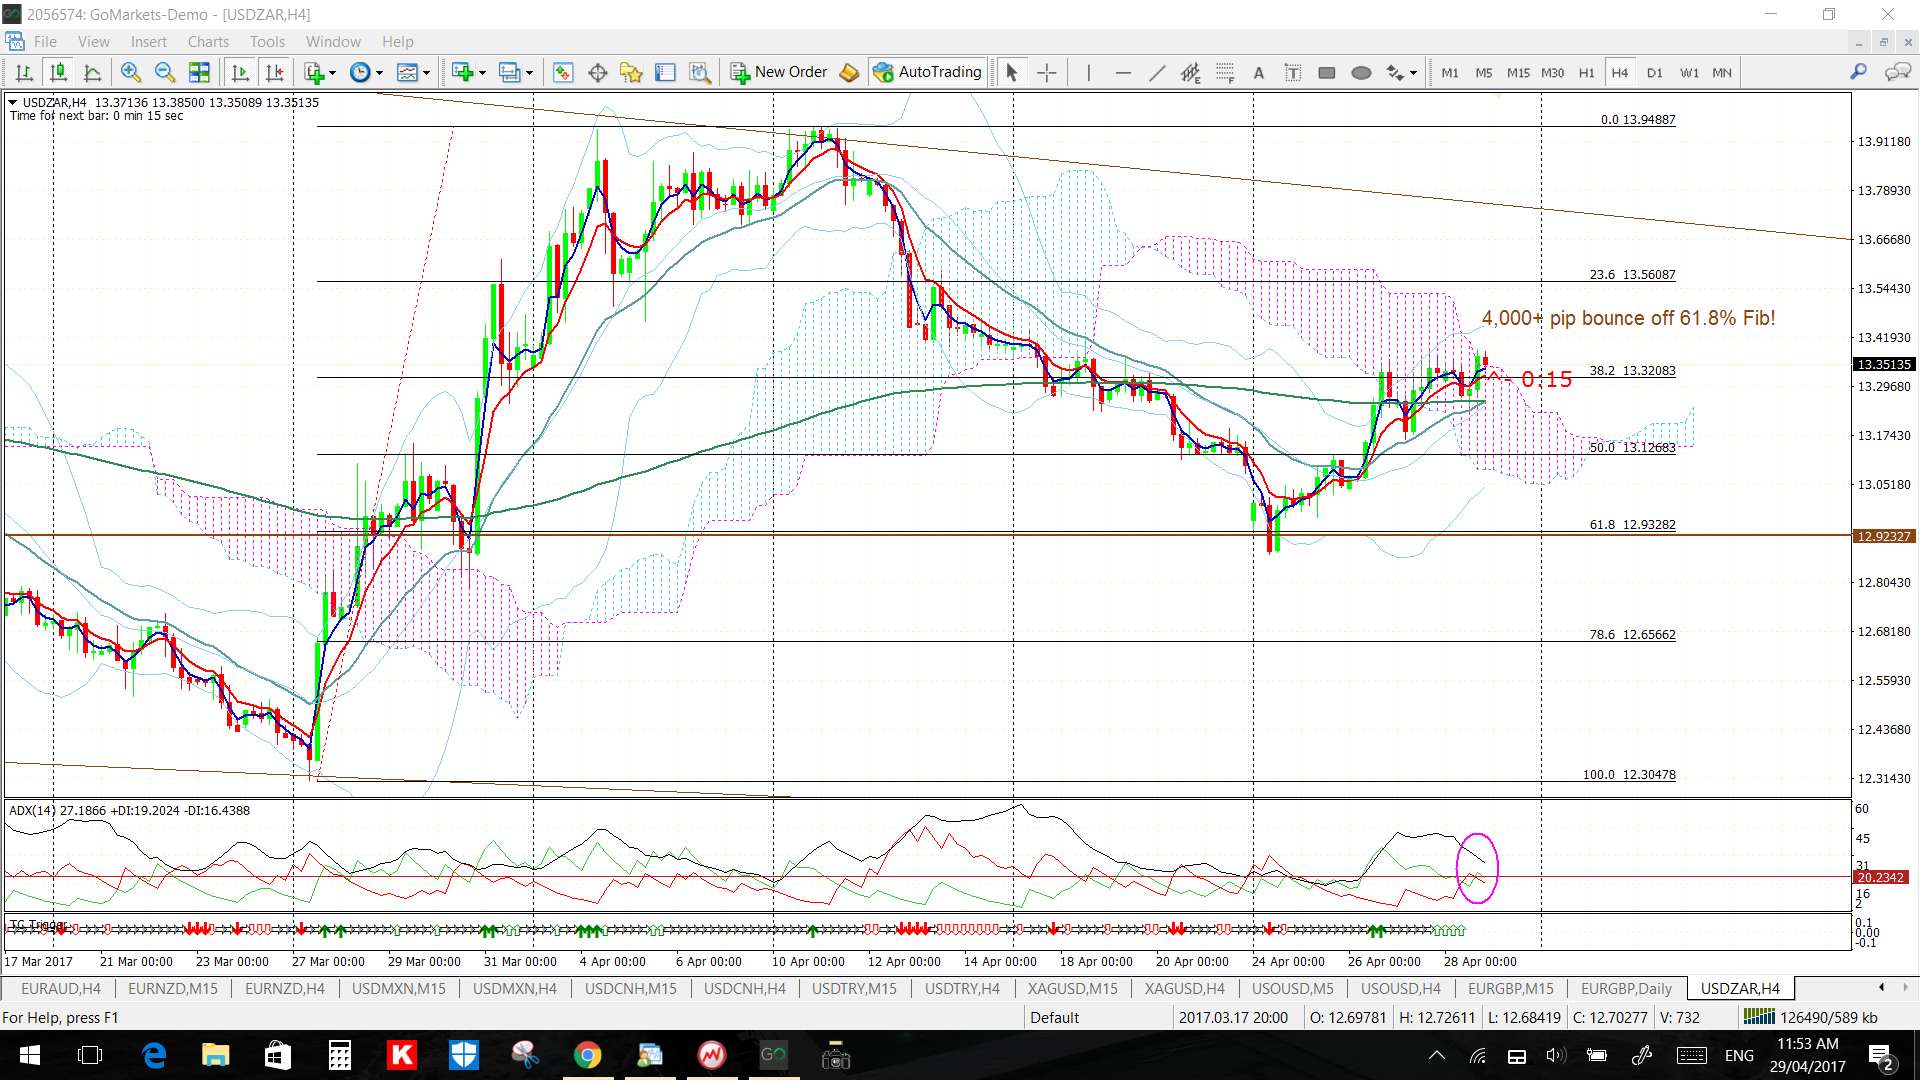
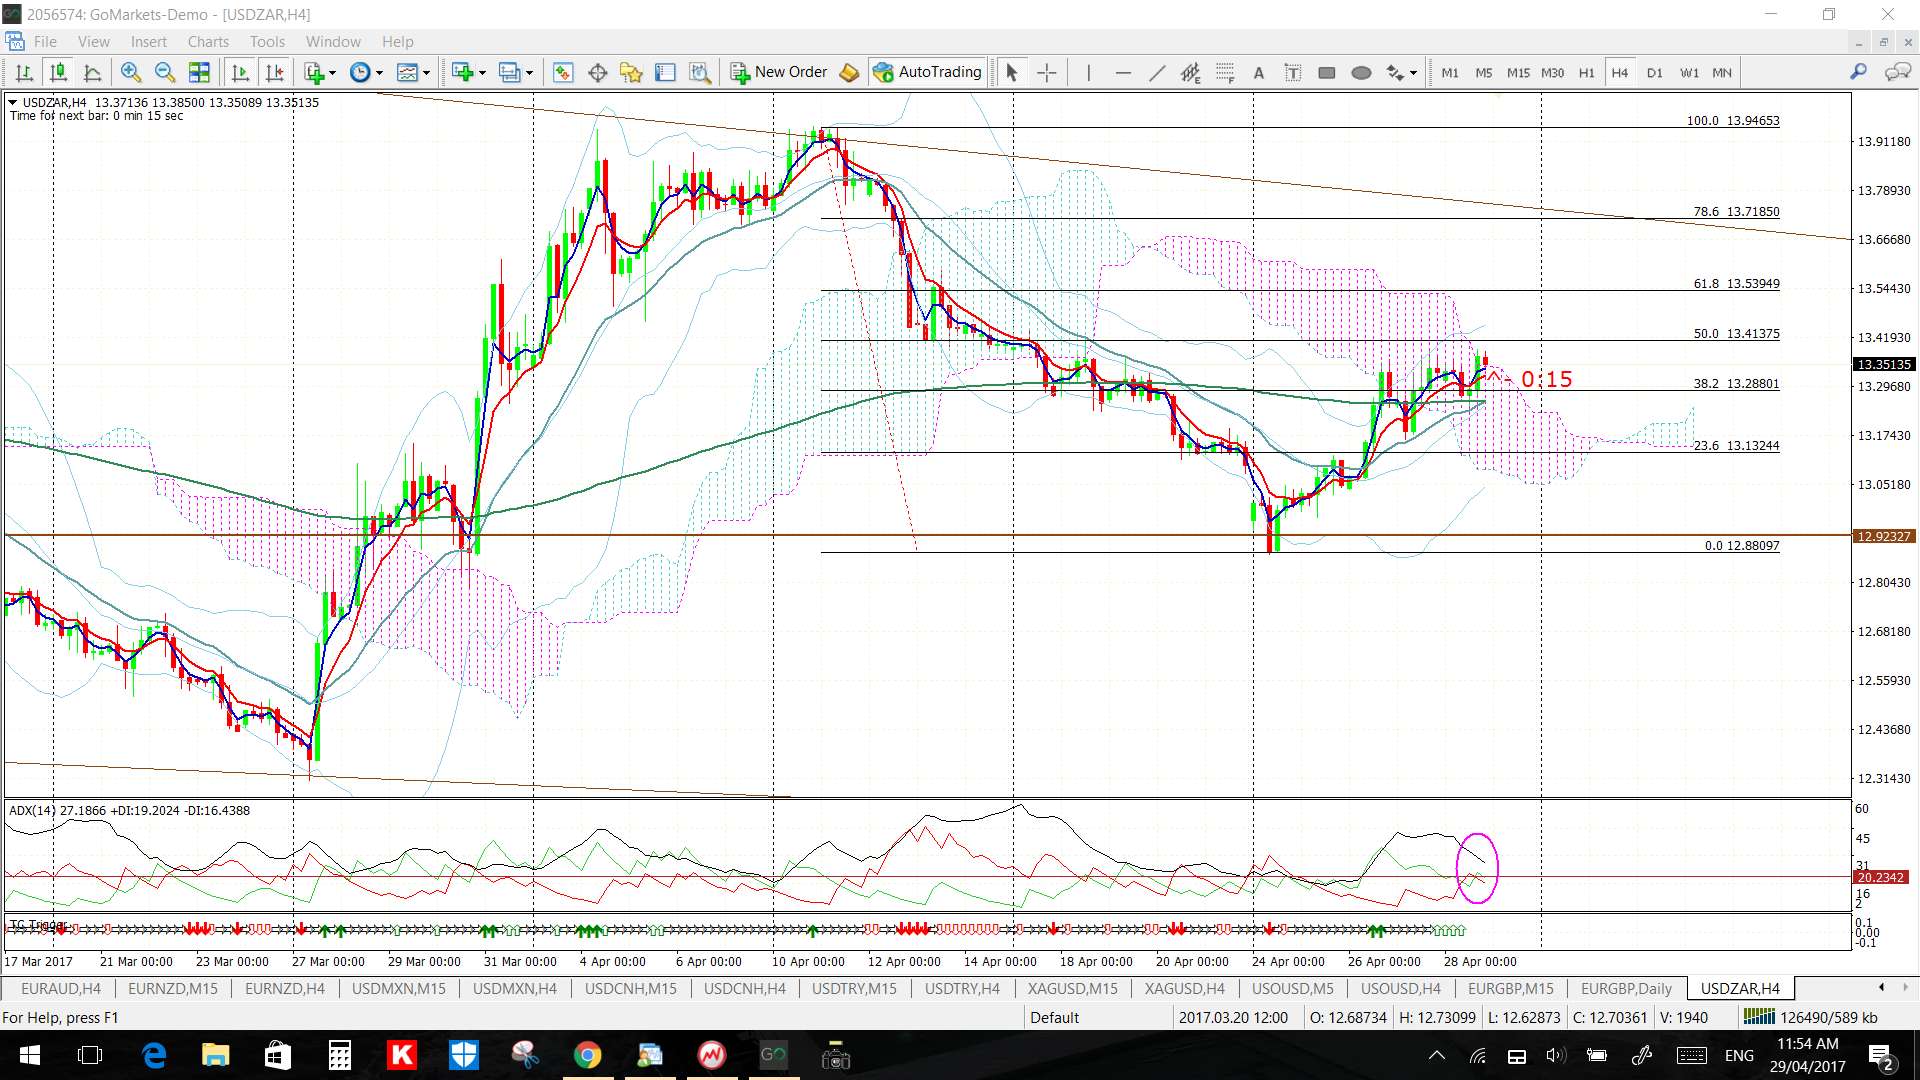
- Fibonacci: I have updated my Fibonacci page to include the contribution this week from the USD/ZAR:
- Away: I am away from next Sat 6th until Sun 14th and so updates will be brief and few during this period.
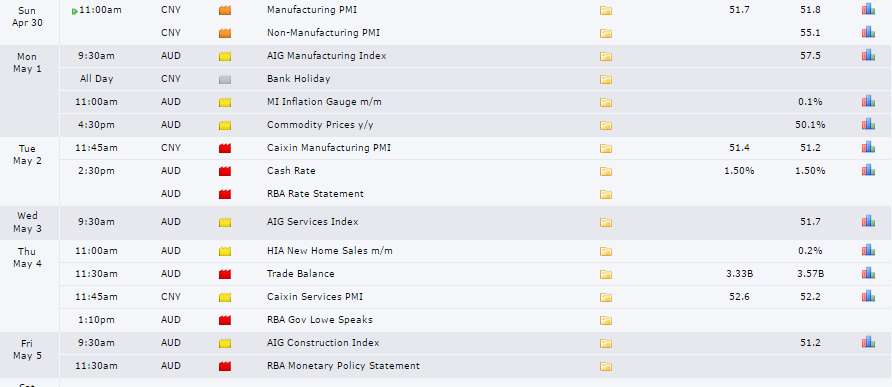
Calendar:
- Sat 29th: President Trump’s 100th Day.
- Sun 30th: CNY Manufacturing & Non-Manufacturing PMI: these came in a bit weaker so may trigger some AUD weakness.
- Mon 1st: Bank Holiday: CNY, EUR, GBP. USD Treasury Secretary speaks & ISM Manufacturing PMI.
- Tue 2nd: CNY: Caixin Manufacturing PMI. AUD RBA Cash Rate. GBP Manufacturing PMI. NZD GDT Price Index data.
- Wed 3rd: NZD Employment data. JPY Bank Holiday. GBP Construction PMI. USD ADP NFP, ISM Non-Manufacturing PMI & FOMC.
- Thurs 4hr: JPY Bank Holiday. AUD Trade Balance & RBA Gov Lowe speaks. GBP Services PMI. CAD Trade Balance & BoC Gov Poloz speaks. USD Weekly Unemployment Claims.
- Fri 5th: PY Bank Holiday. AUD RBA Monetary Policy Statement. CAD Employment data. USD NFP & Fed Chair Yellen speaks.
- Sun 7th: French Presidential Election.
Forex:
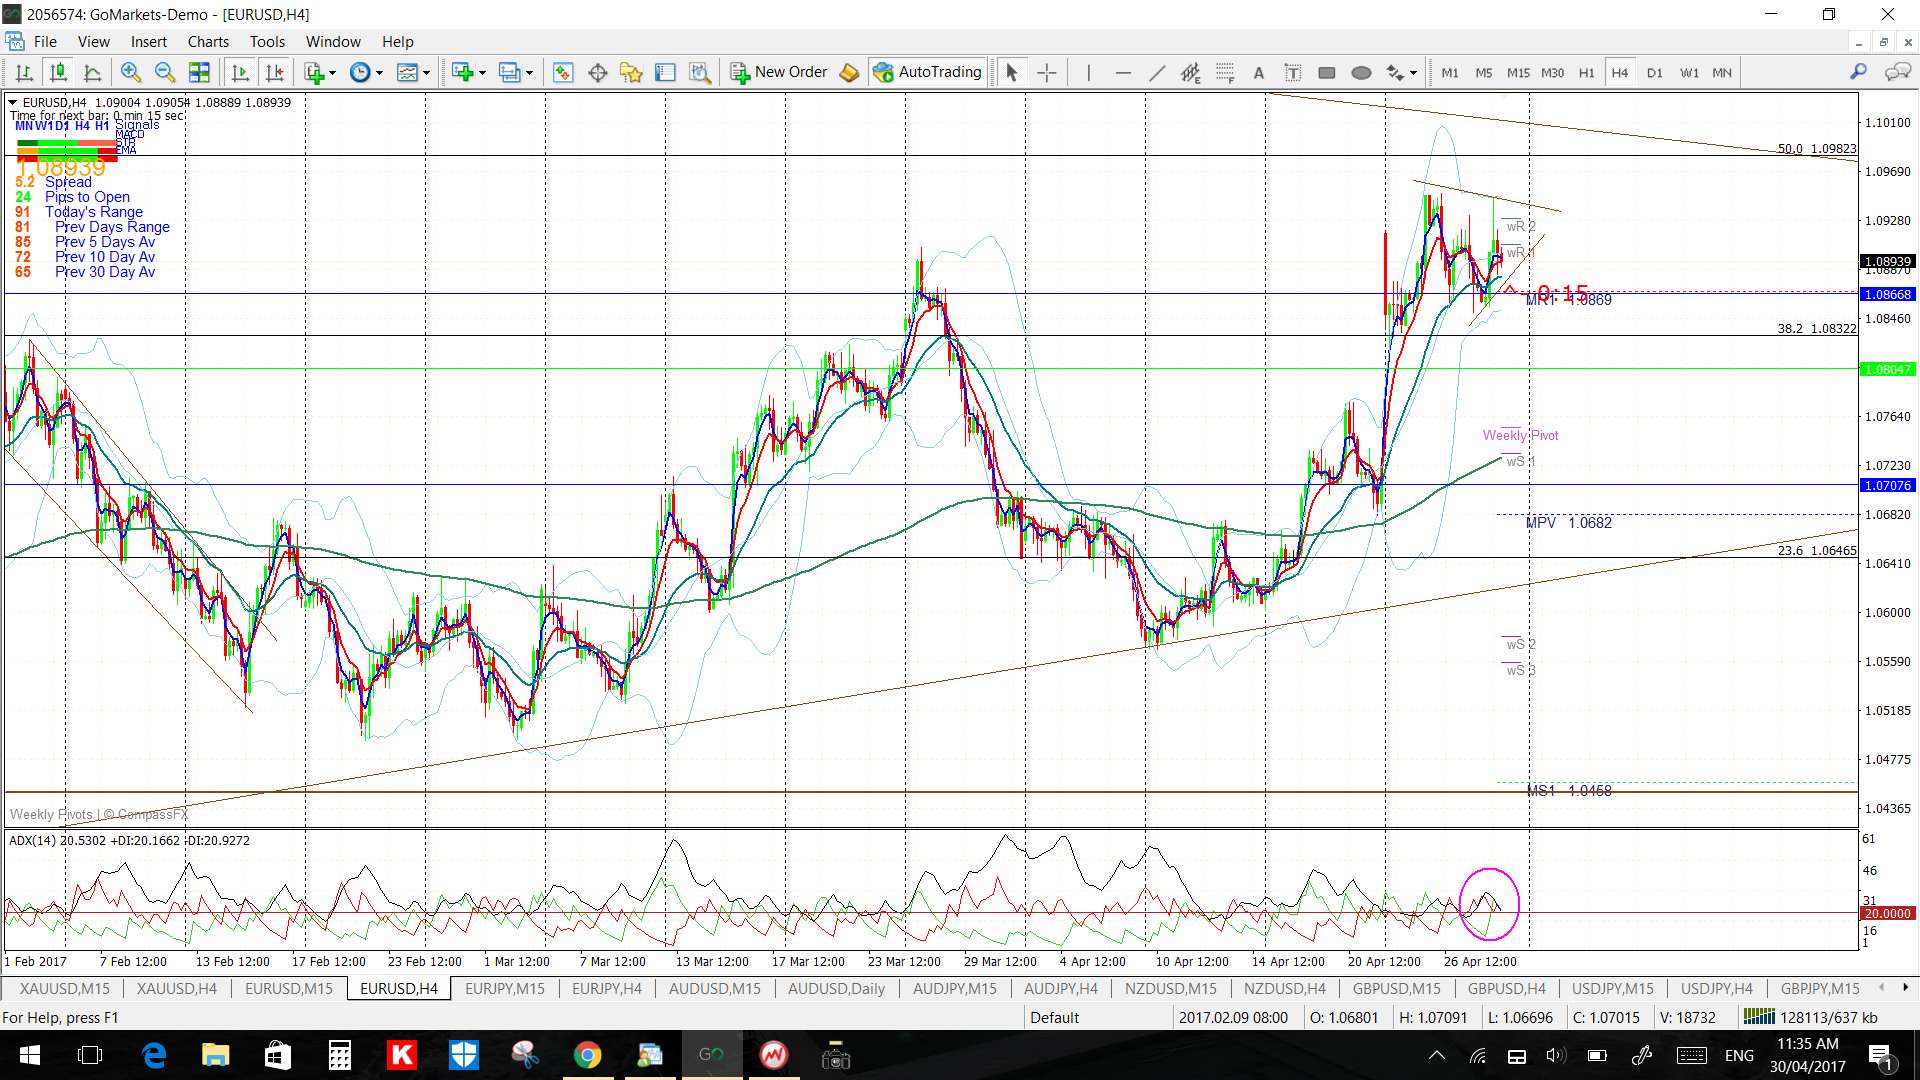
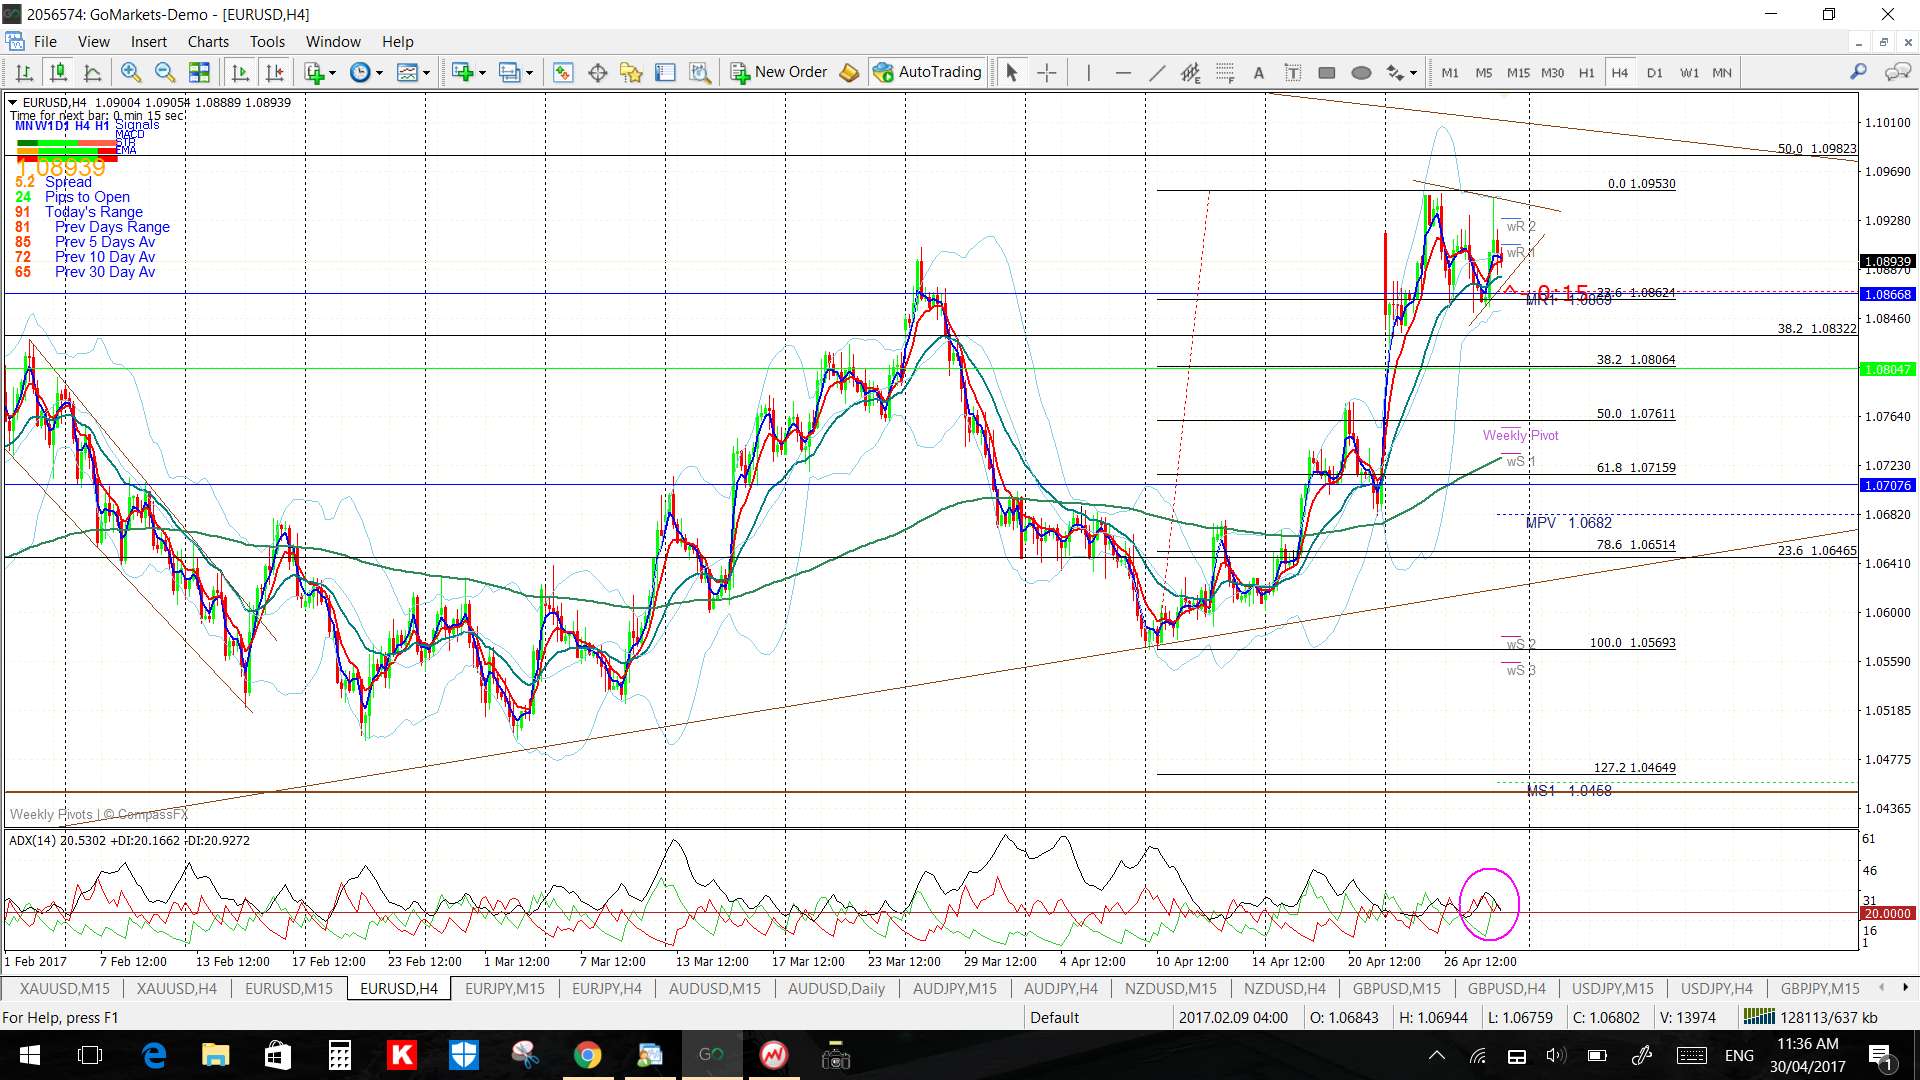
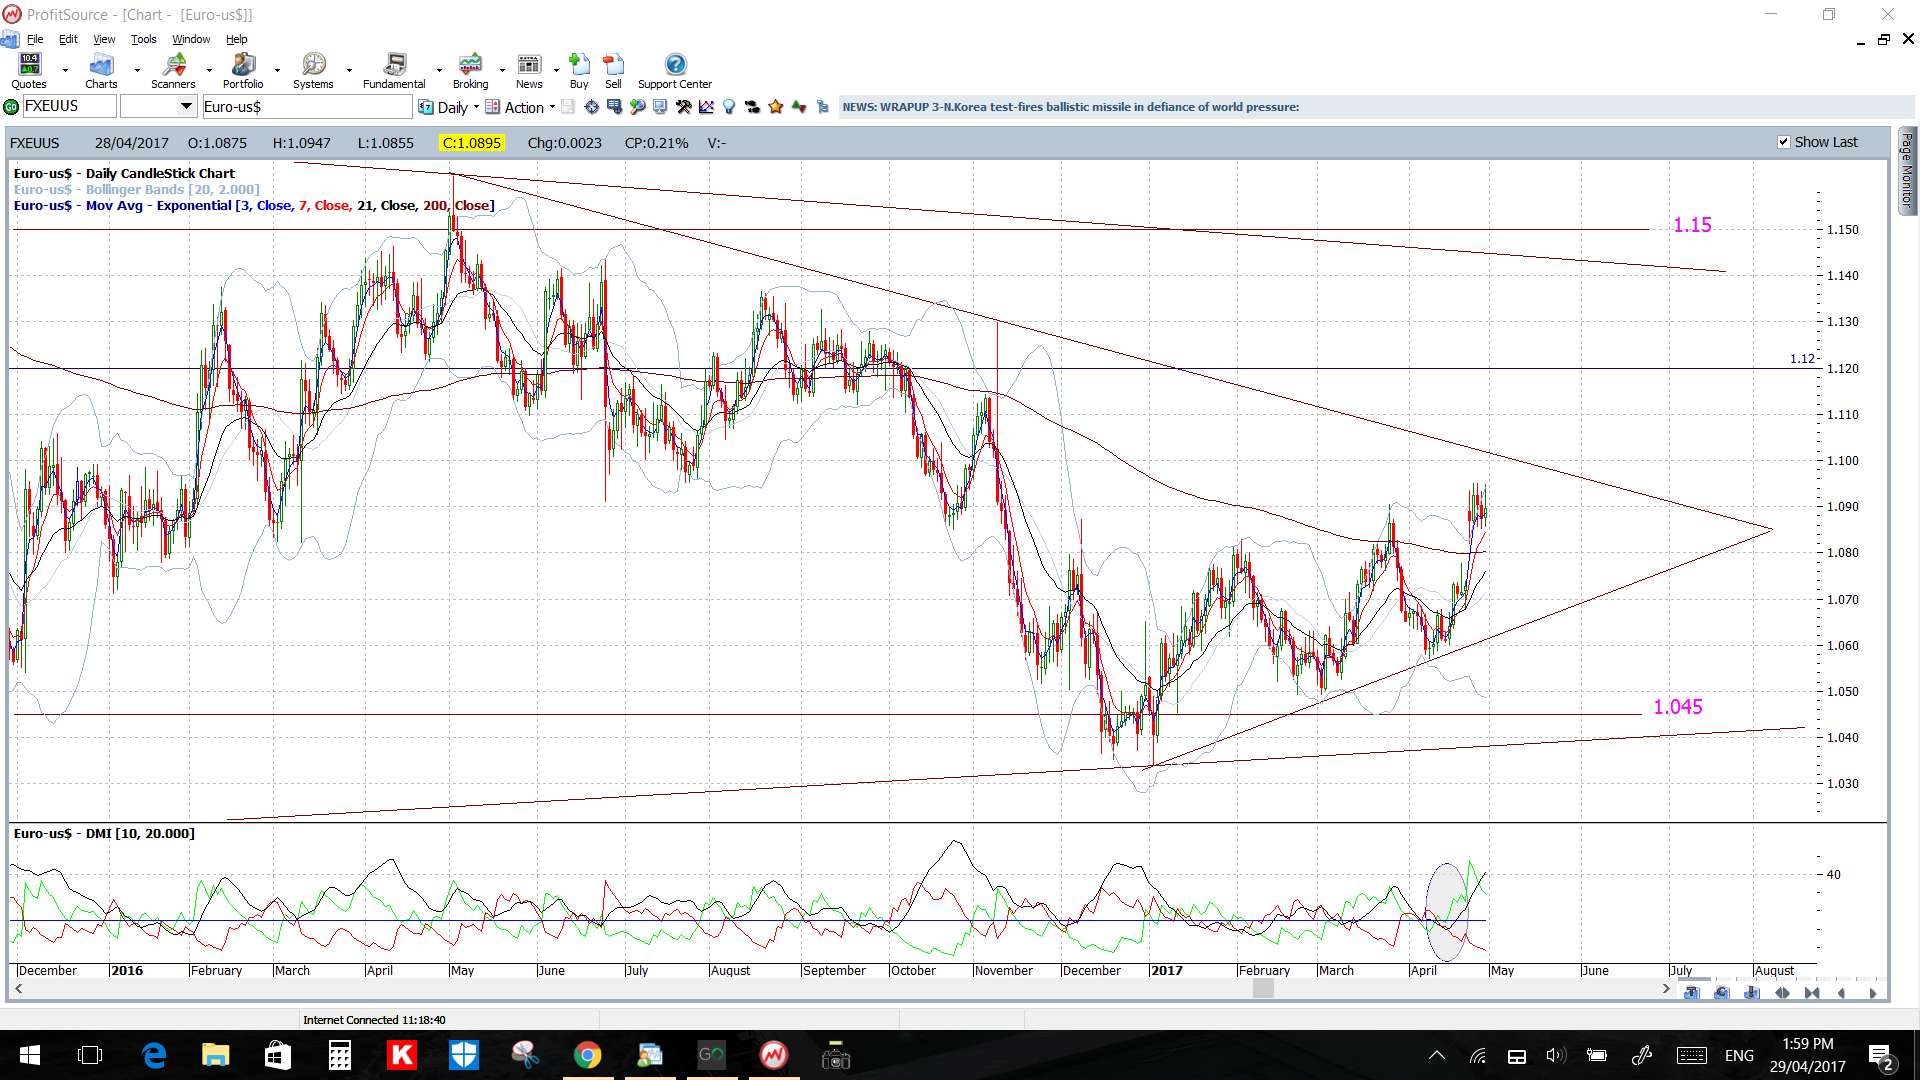
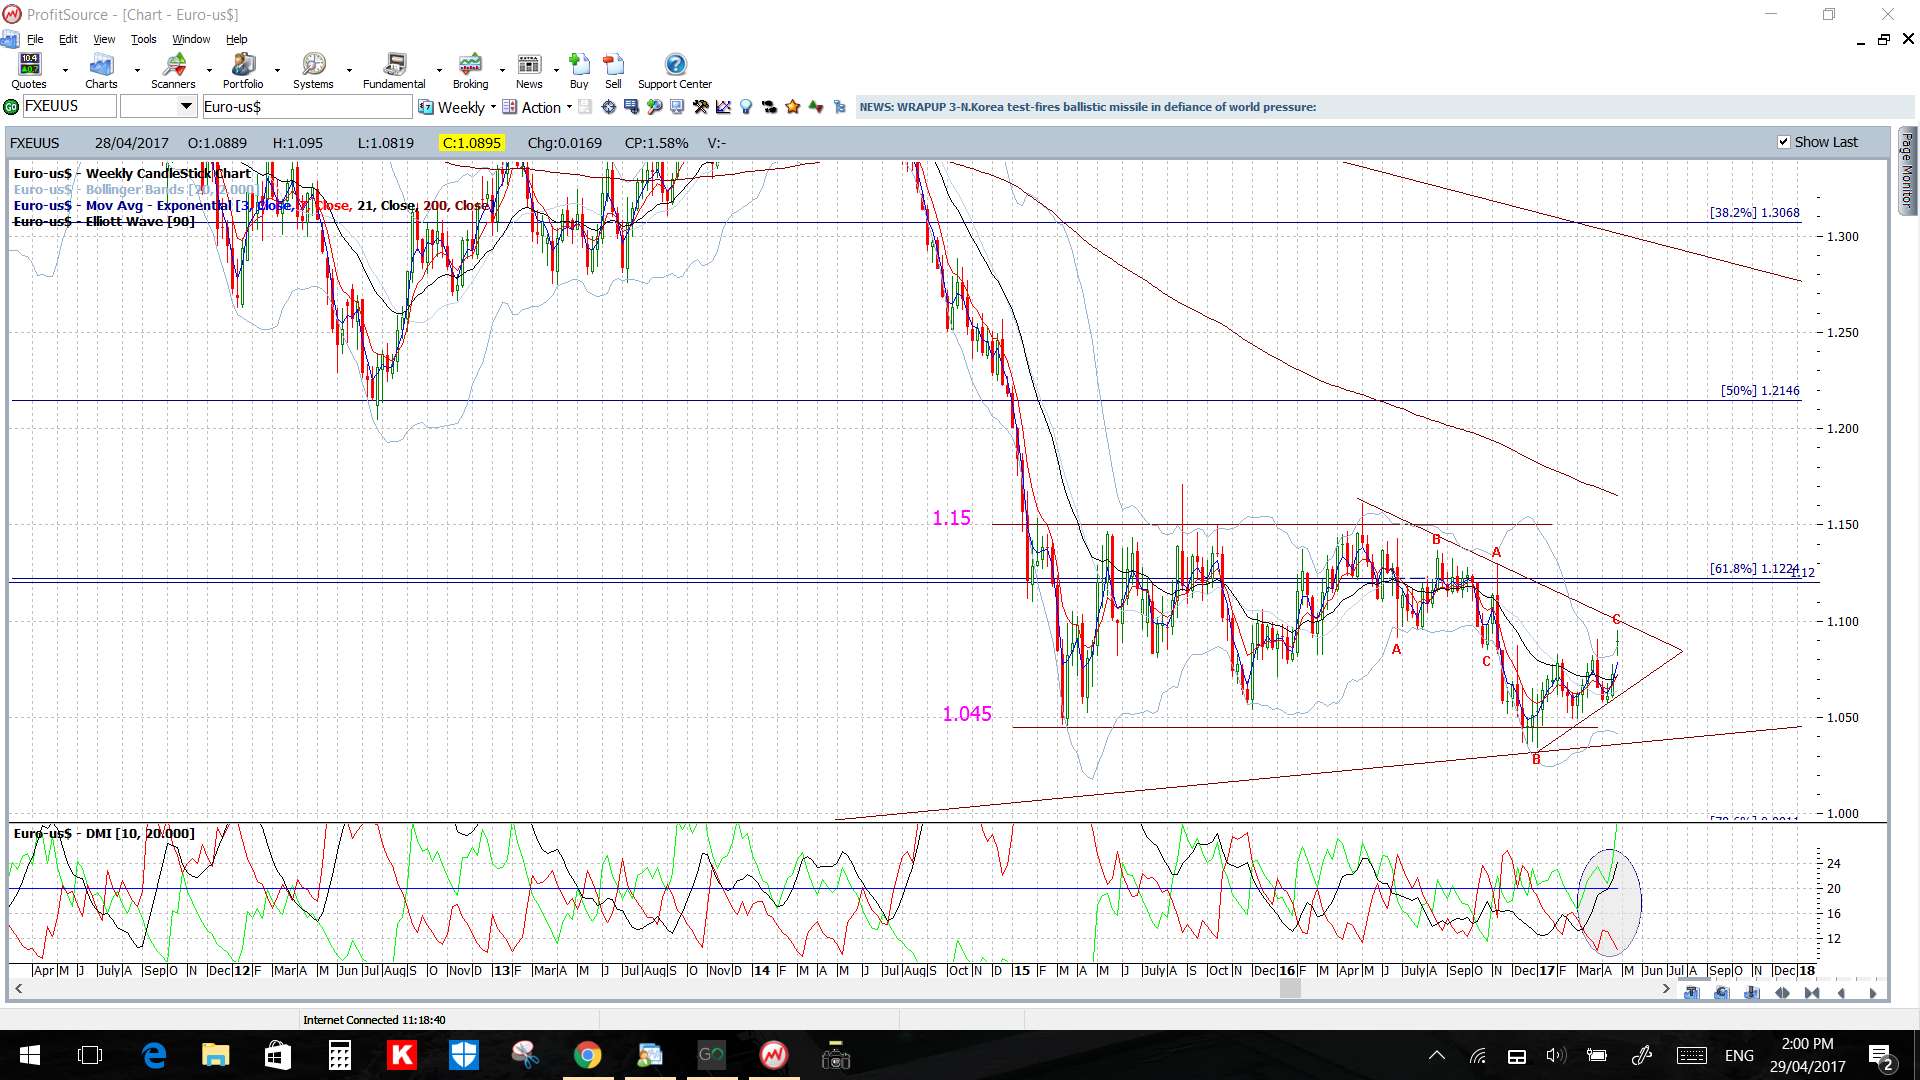
EUR/USD: Price gapped higher to open for the week, and this has not been filled, but price then consolidated sideways for the rest of the week. This has formed a triangle on the 4hr chart and this sits within a larger daily/weekly chart triangle; the latter being worth up to 700 pips according to technical breakout theory:
- Any bullish breakout from this 4hr triangle would bring this daily triangle into focus as it is only about 100 pips above current price.
- Any bearish break would have me look to the 4hr chart’s Fib levels for potential targets.
Price is above the 4hr and daily Cloud.
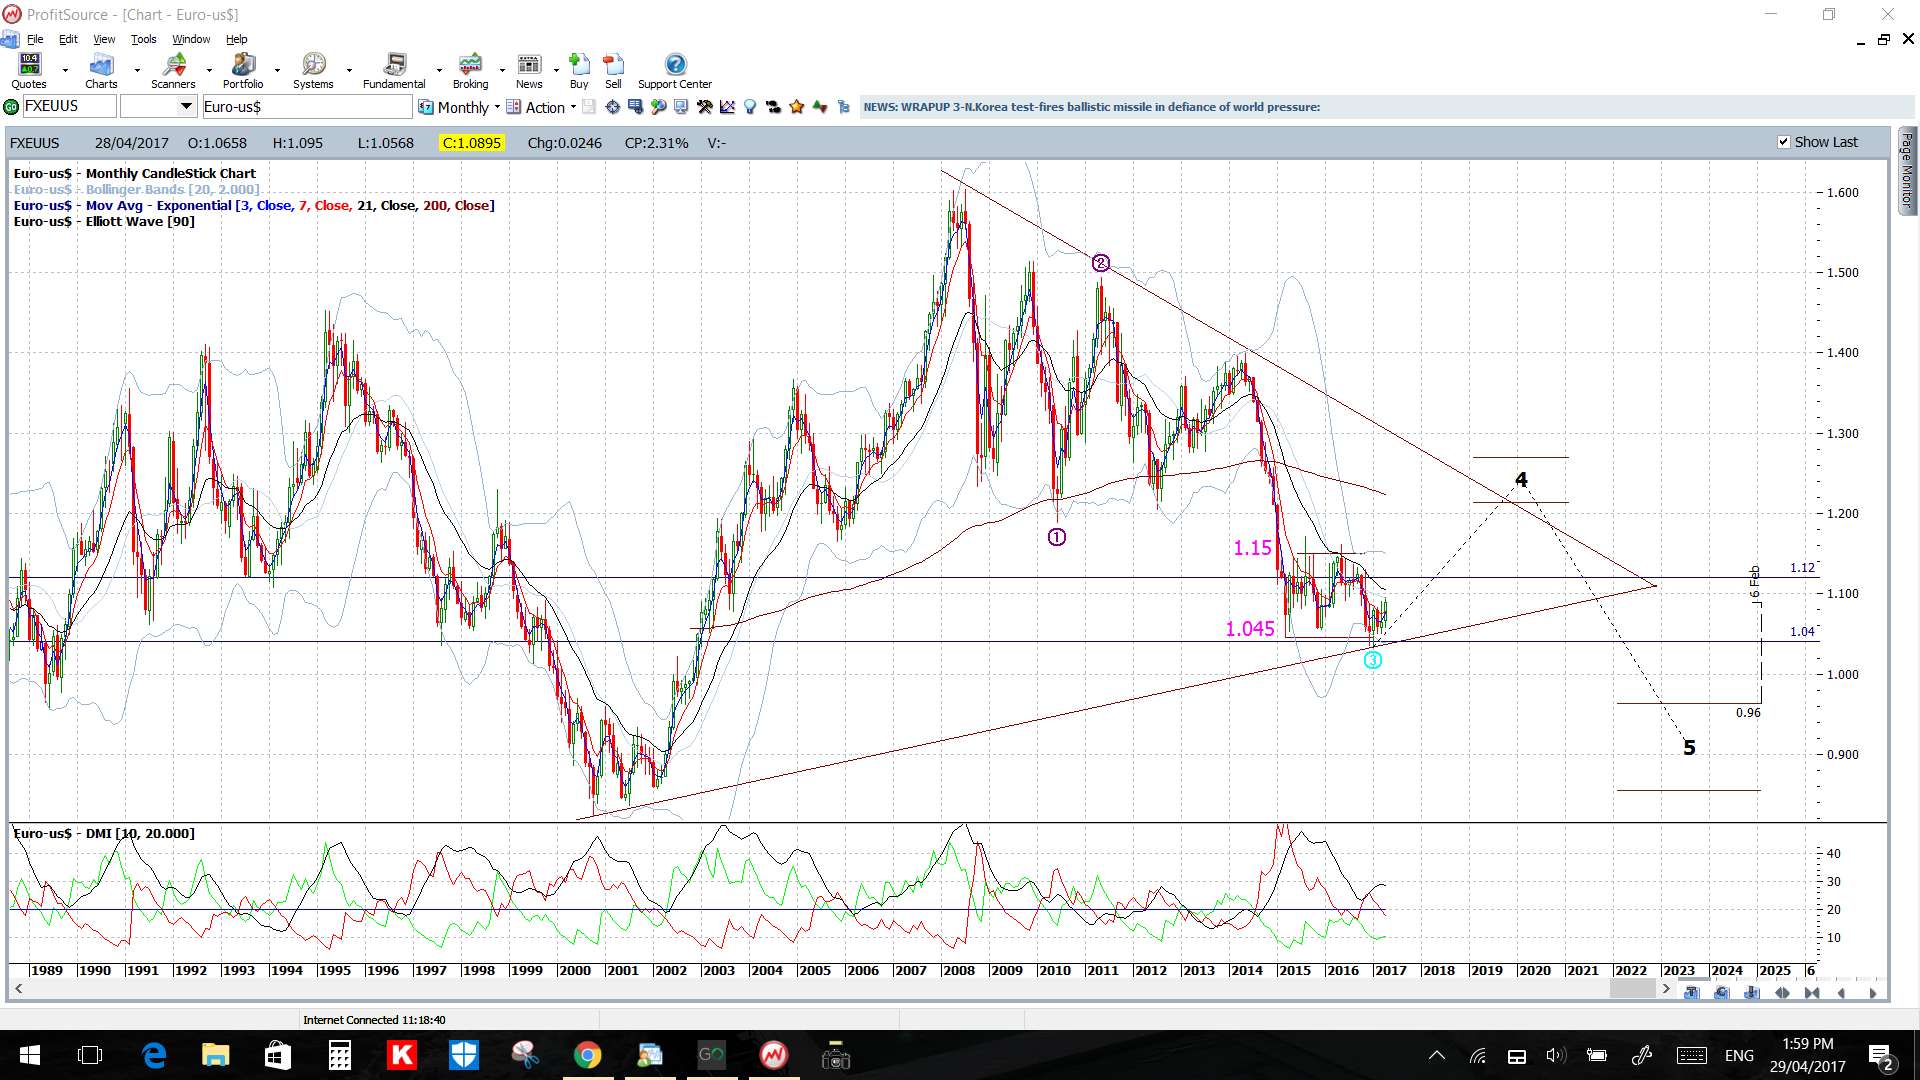
The weekly candle was a bearish coloured Doji but the monthly candle was bullish.
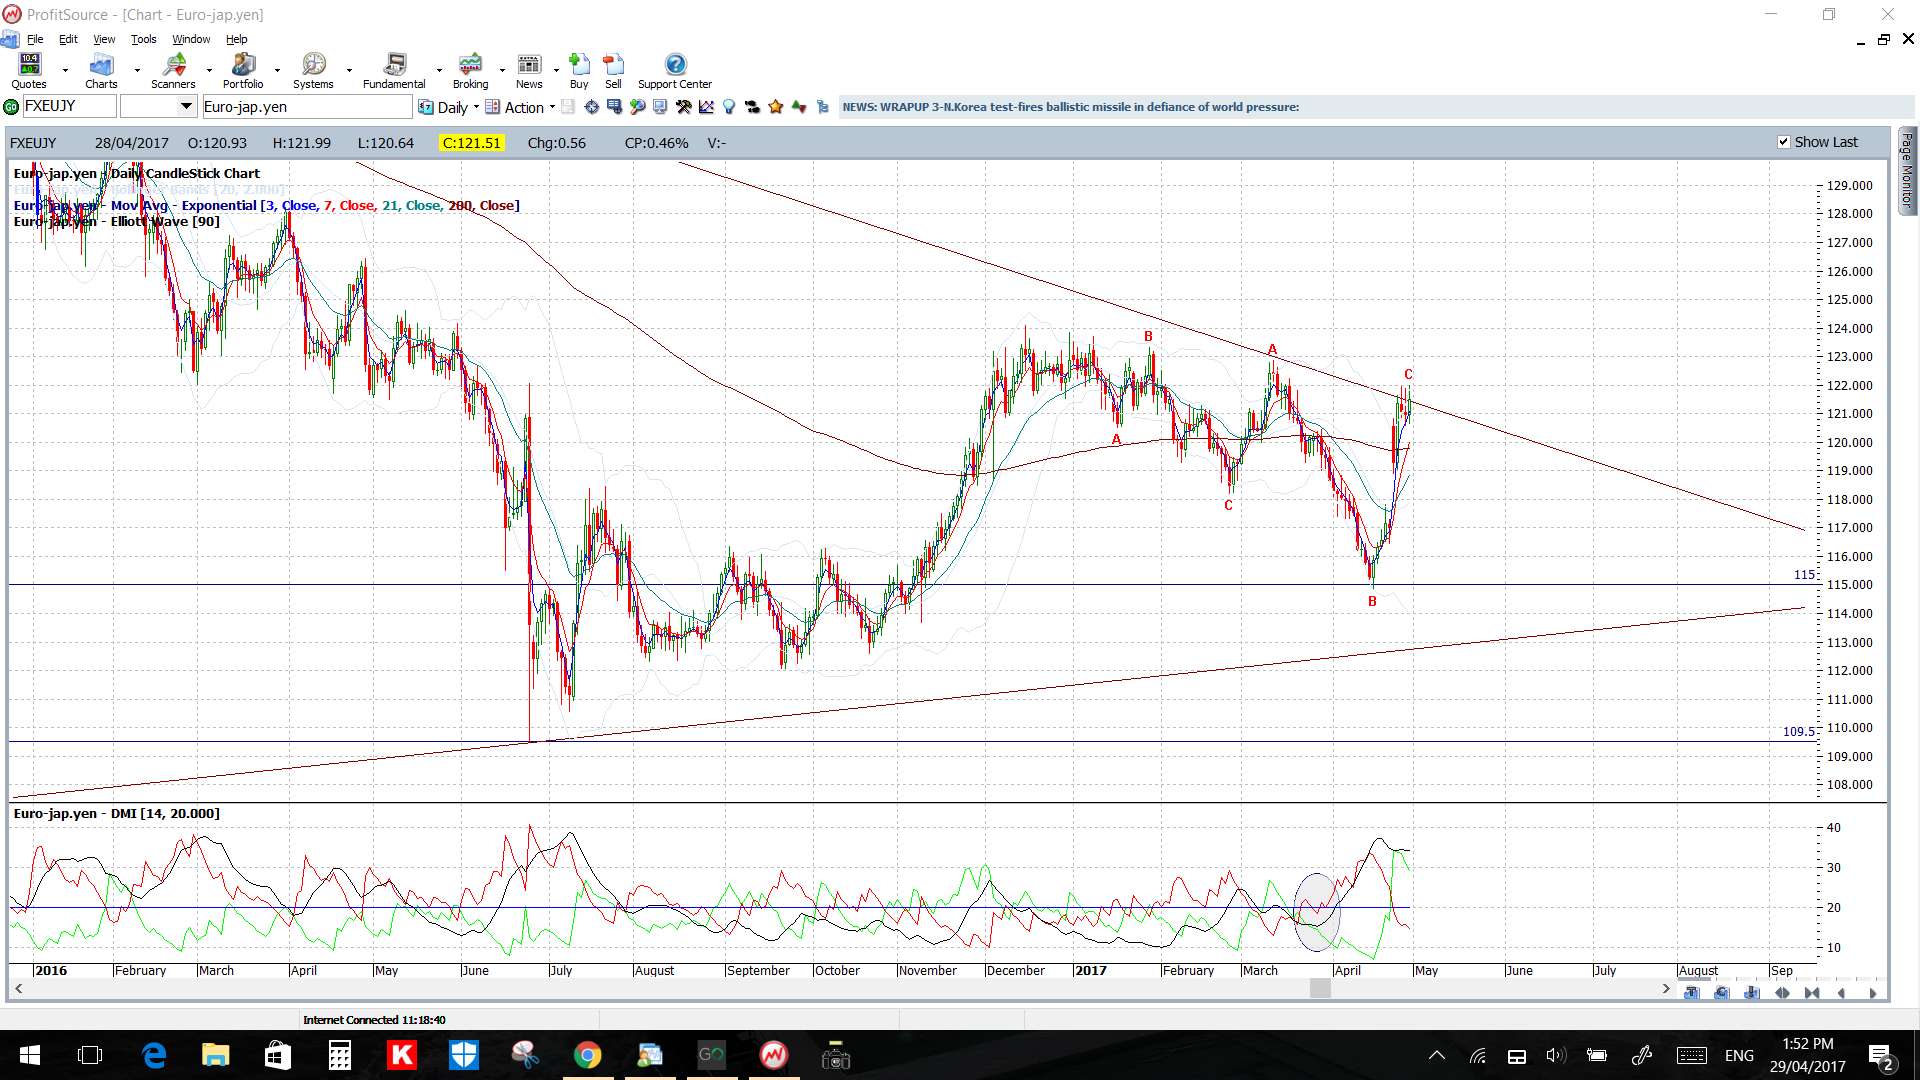
EUR/JPY: The EUR/JPY rallied up to a 2 1/2 year bear trend line early last week but then consolidated there within a Flag to see out the week. This move came after a gap on Monday and a break of a 6-week trend line that I’d had in focus and this gap has not been filled.
This Flag near the 2 1/2 year bear trend line is the region to keep in focus next week:
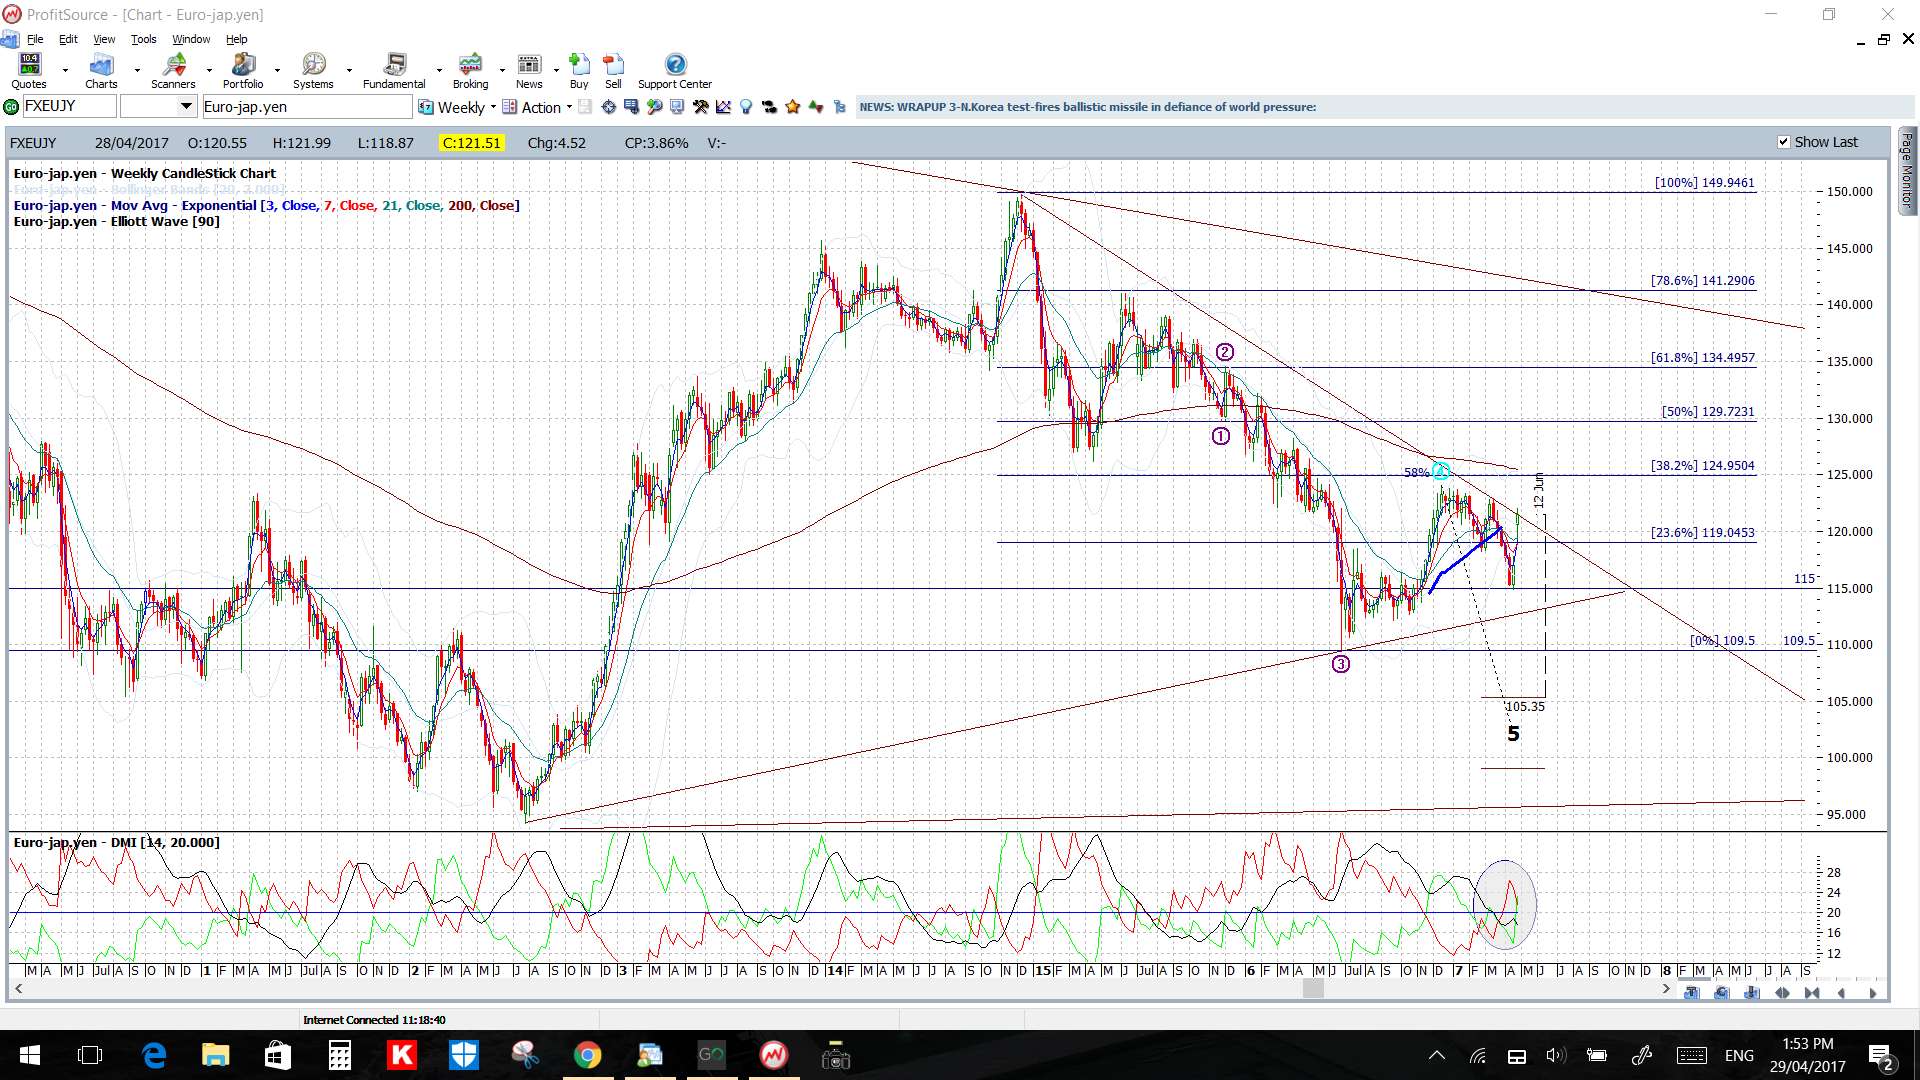
- any bullish continuation would have me looking to the weekly chart’s 61.8% fib as this is up near previous S/R at 135.
- any bearish pullback would have me watching the 4hr chart’s Fib levels as potential targets.
Price is above the 4hr and daily Cloud.
The weekly and monthly candles were bullish.
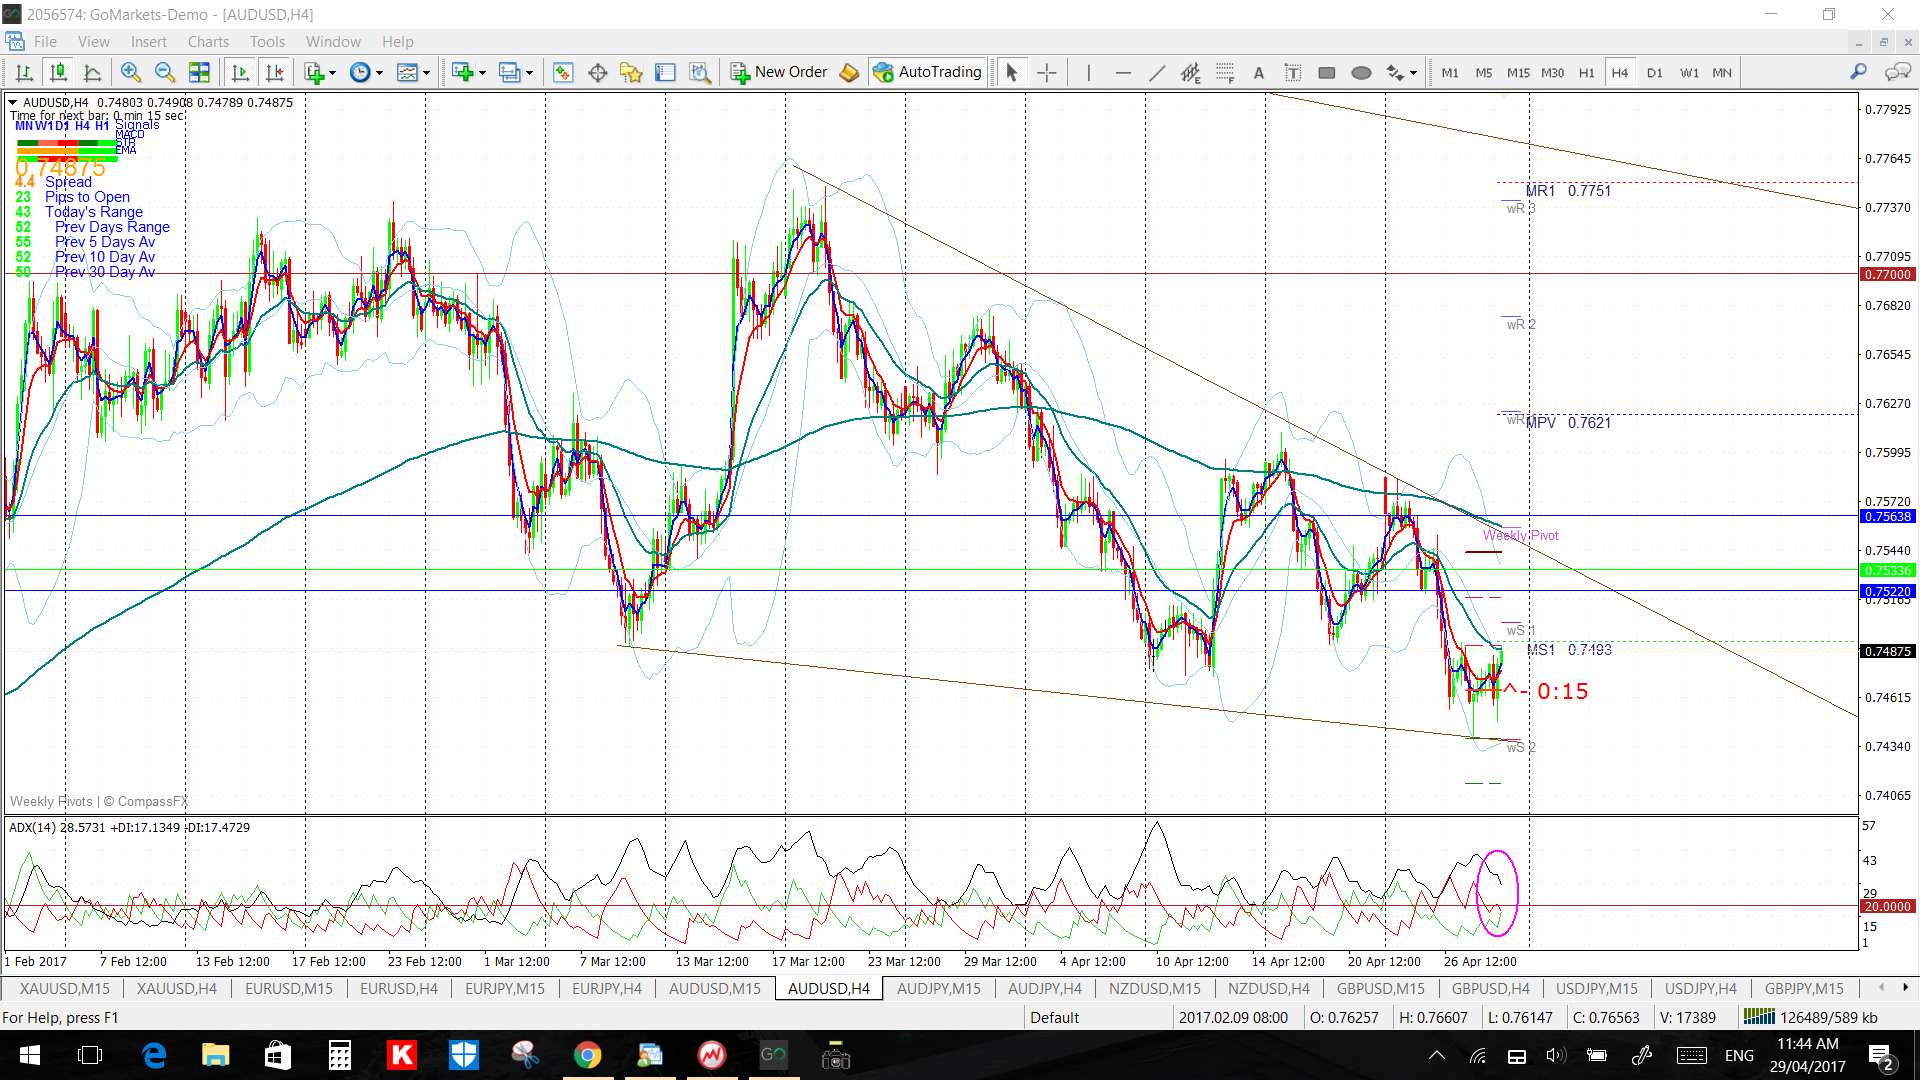
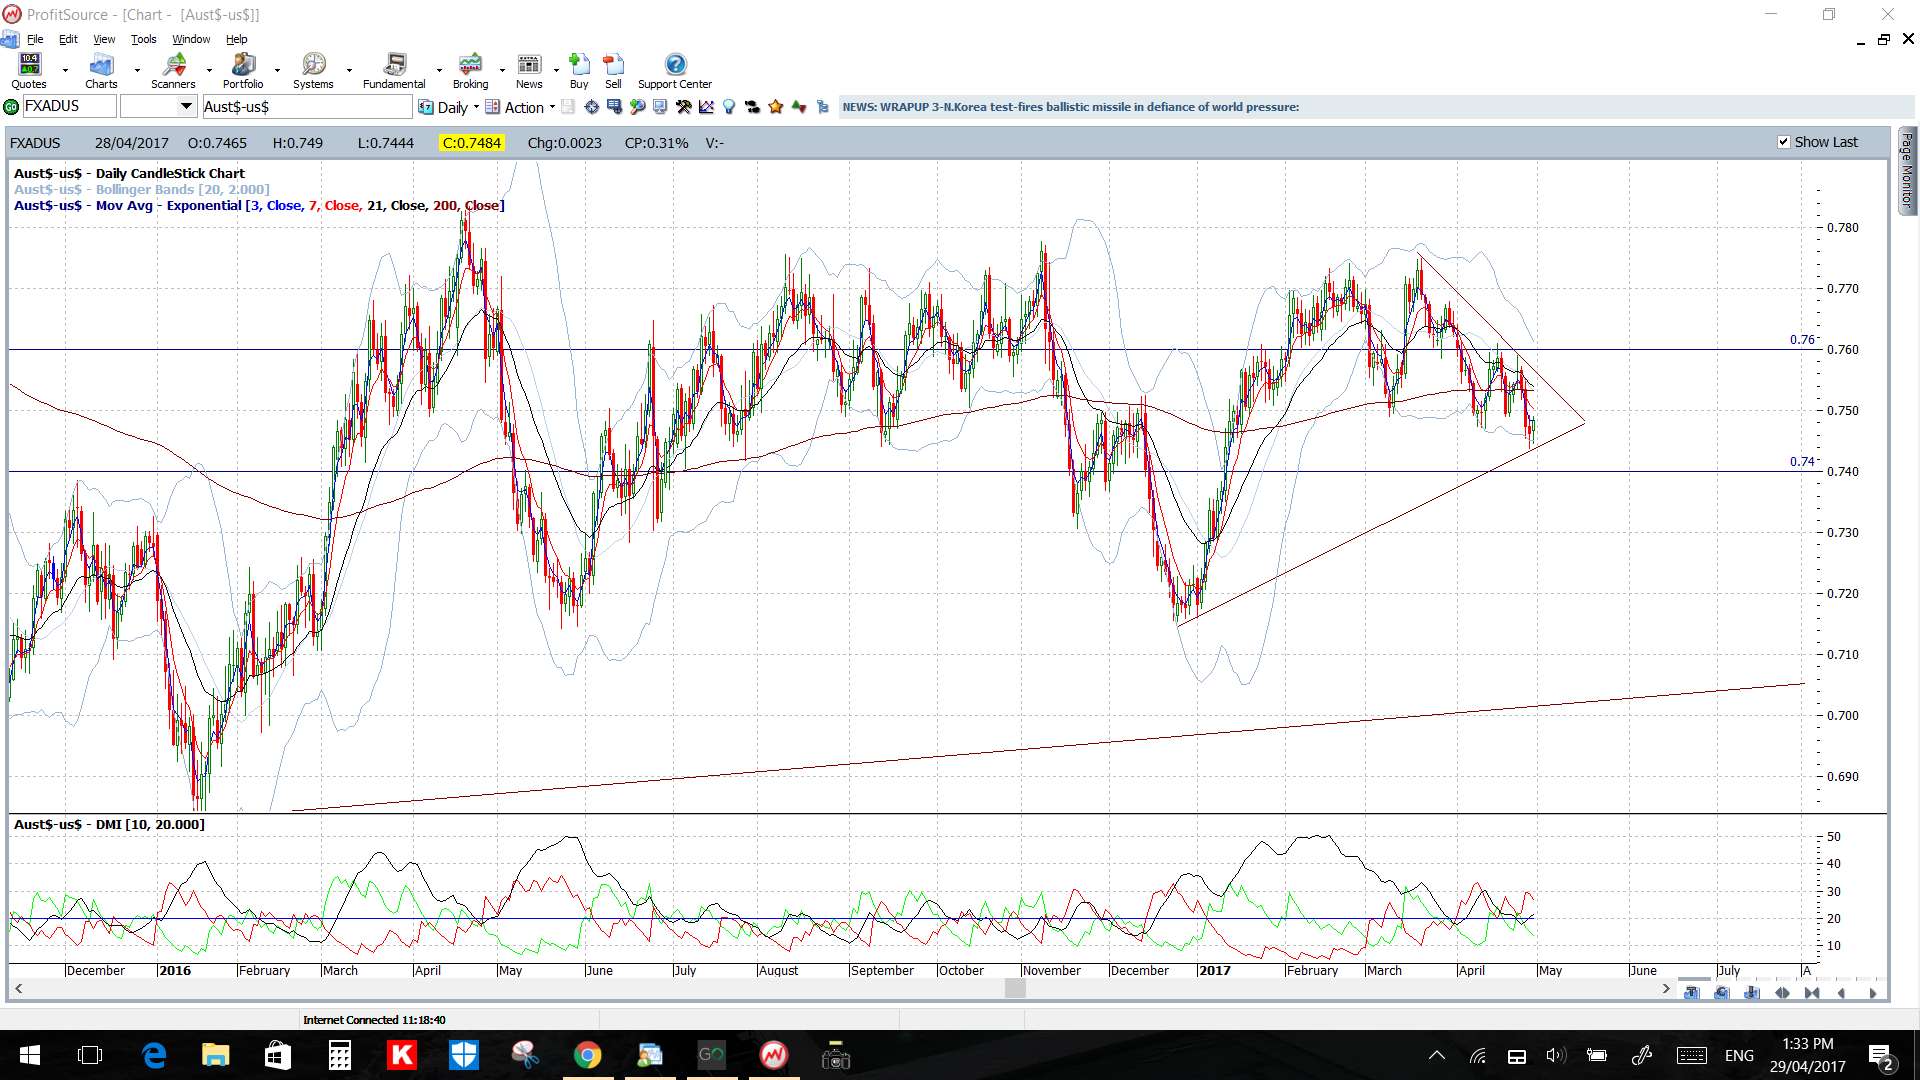
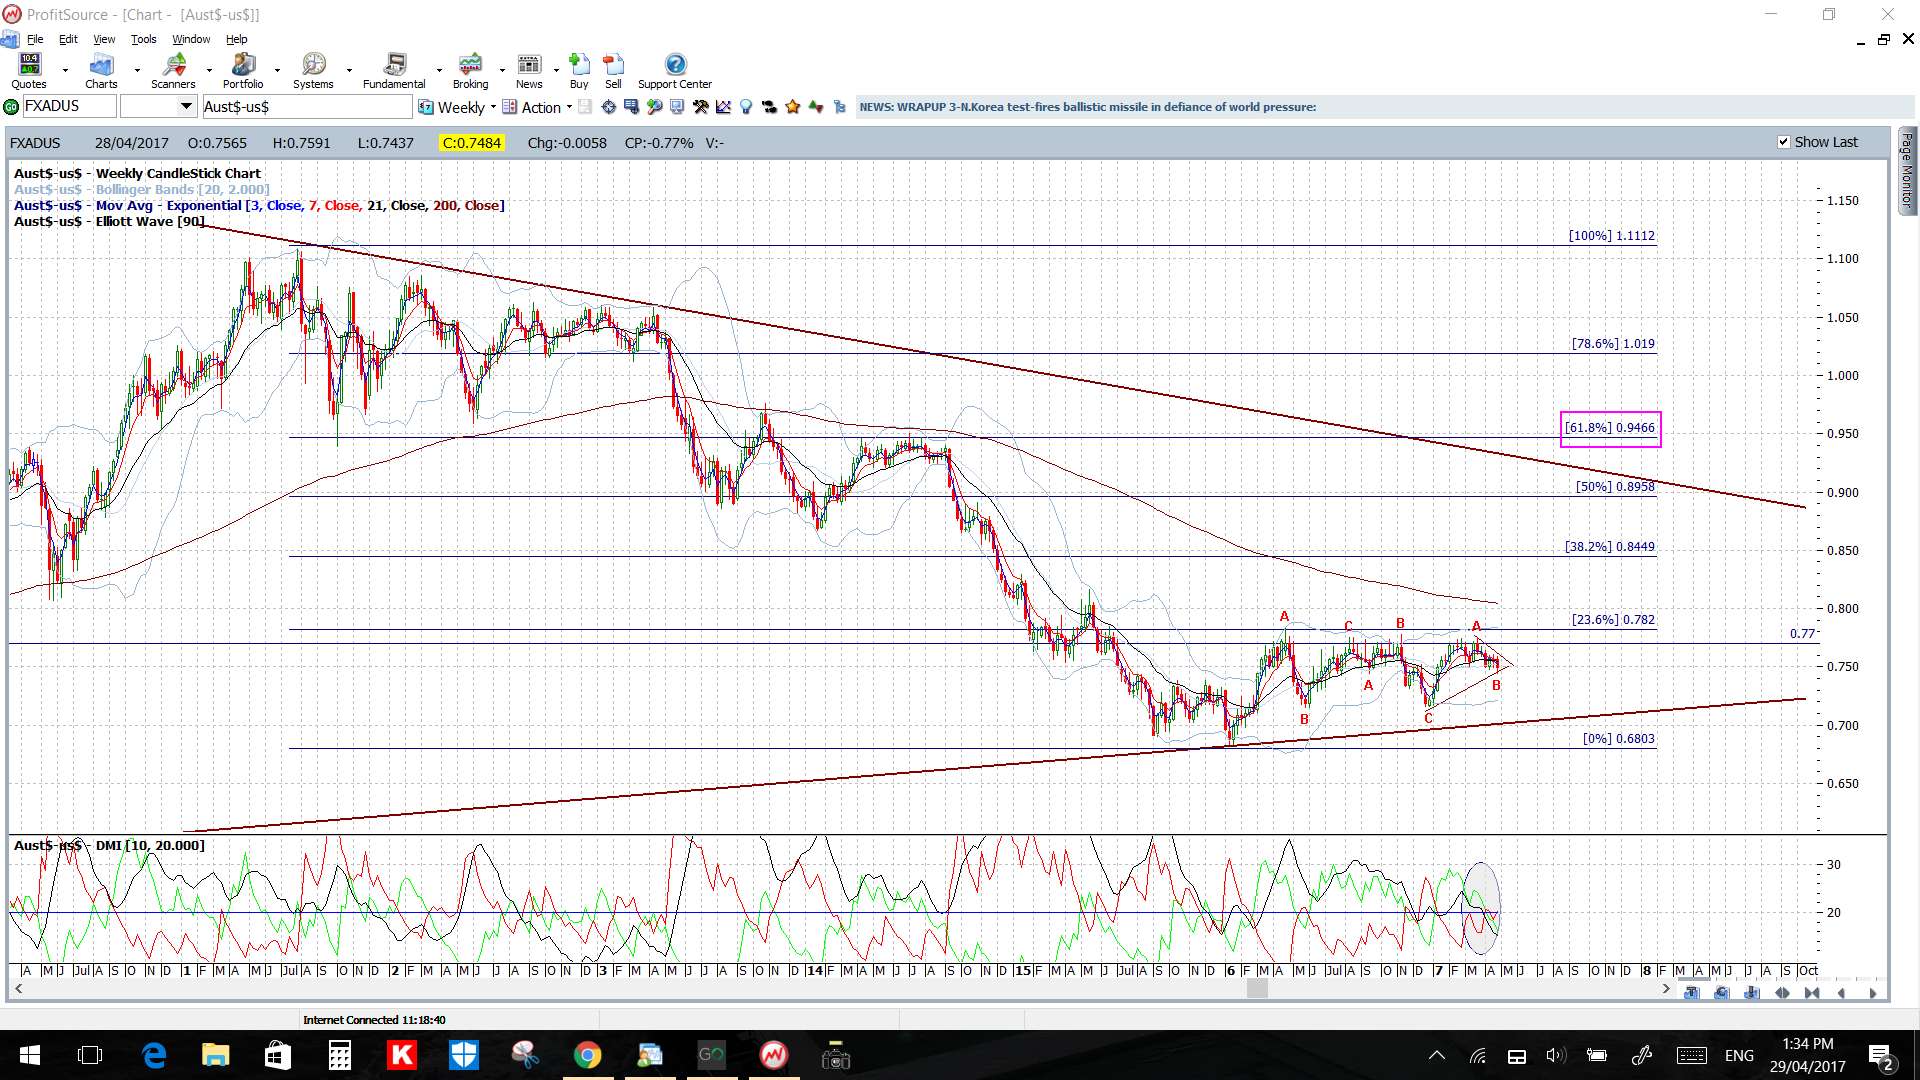
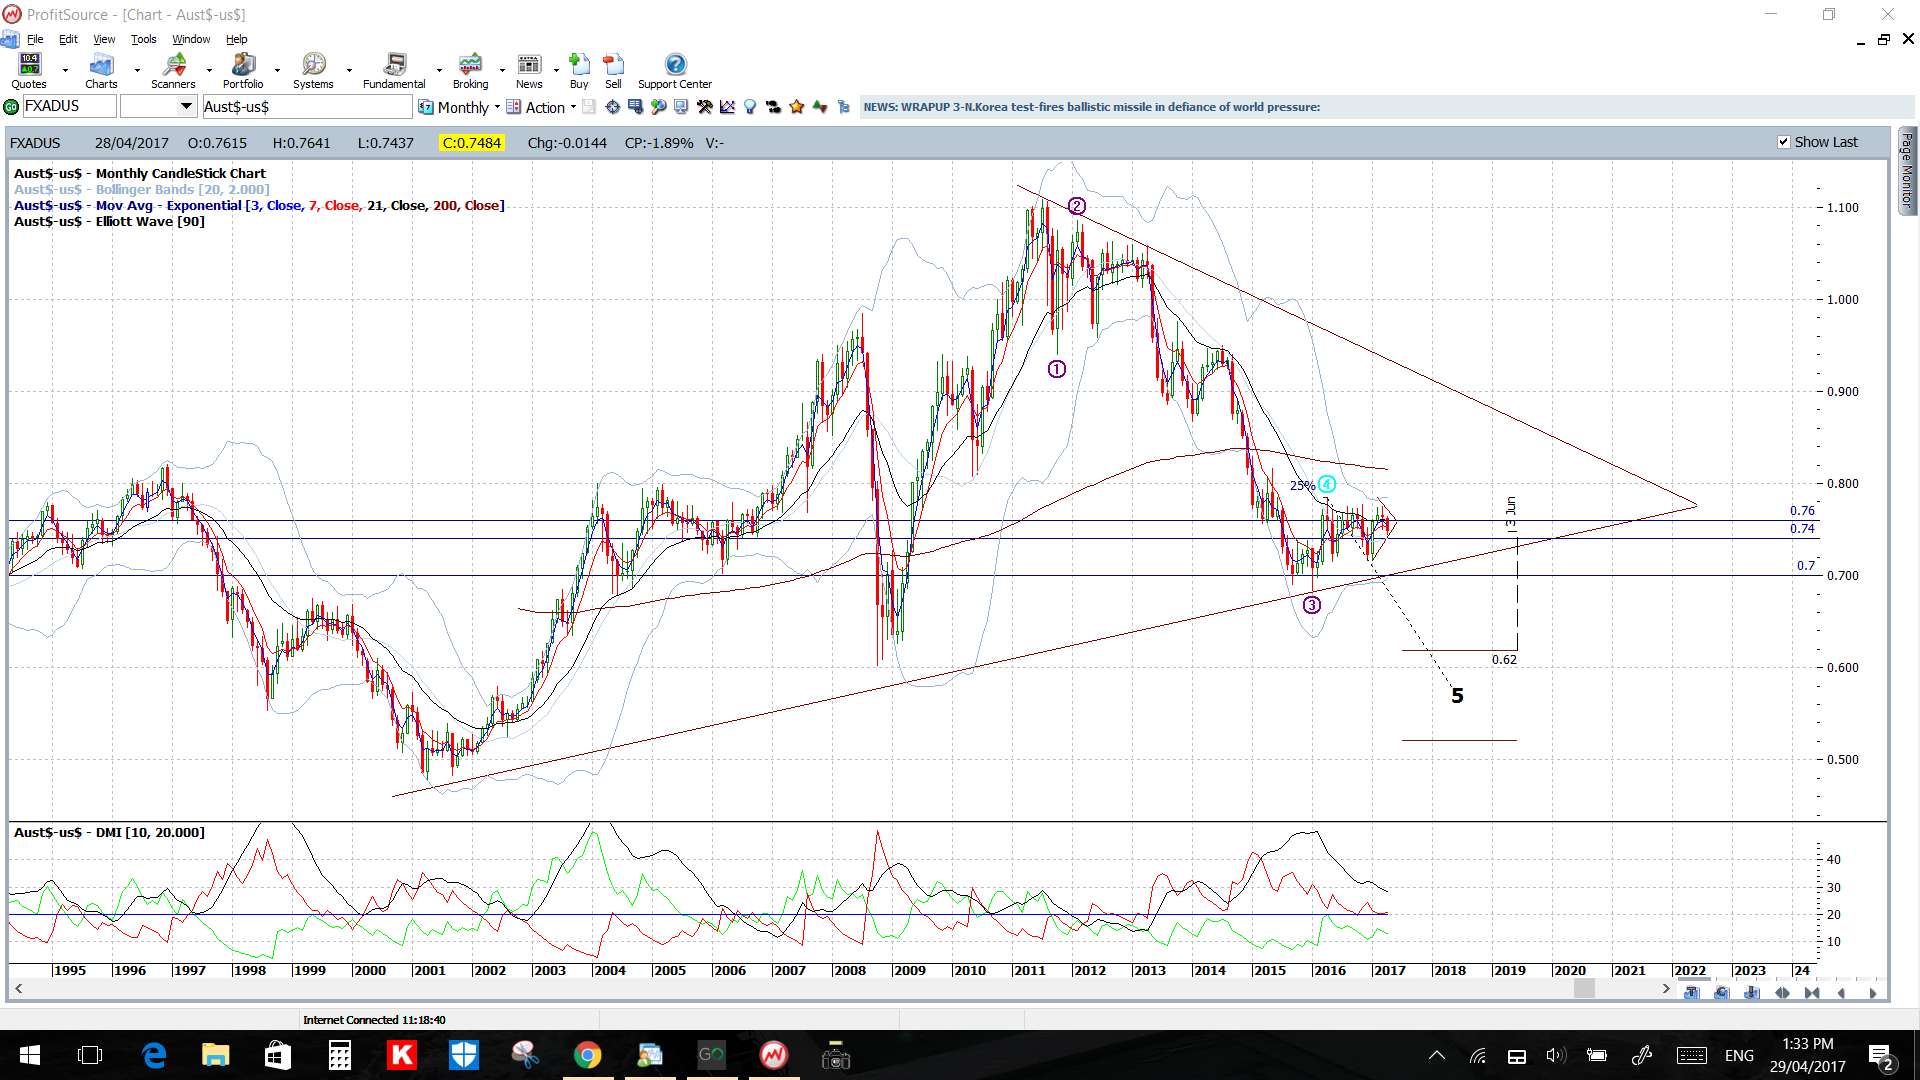
AUD/USD: Price action looks to be in a bullish descending wedge on the 4hr chart that is set within a triangle on the daily giving traders trend lines to watch for any make or break activity. It is worth keeping in mind that the daily chart triangle is worth up to 500 pips.
Price is below the 4hr and daily Cloud.
The weekly and monthly candles were bearish.
Weekend CNY data was a bit soft and so may dampen AUD$ enthusiasm but watch also for impact from midweek CNY data as well as the RBA rate update and all of the USD data:
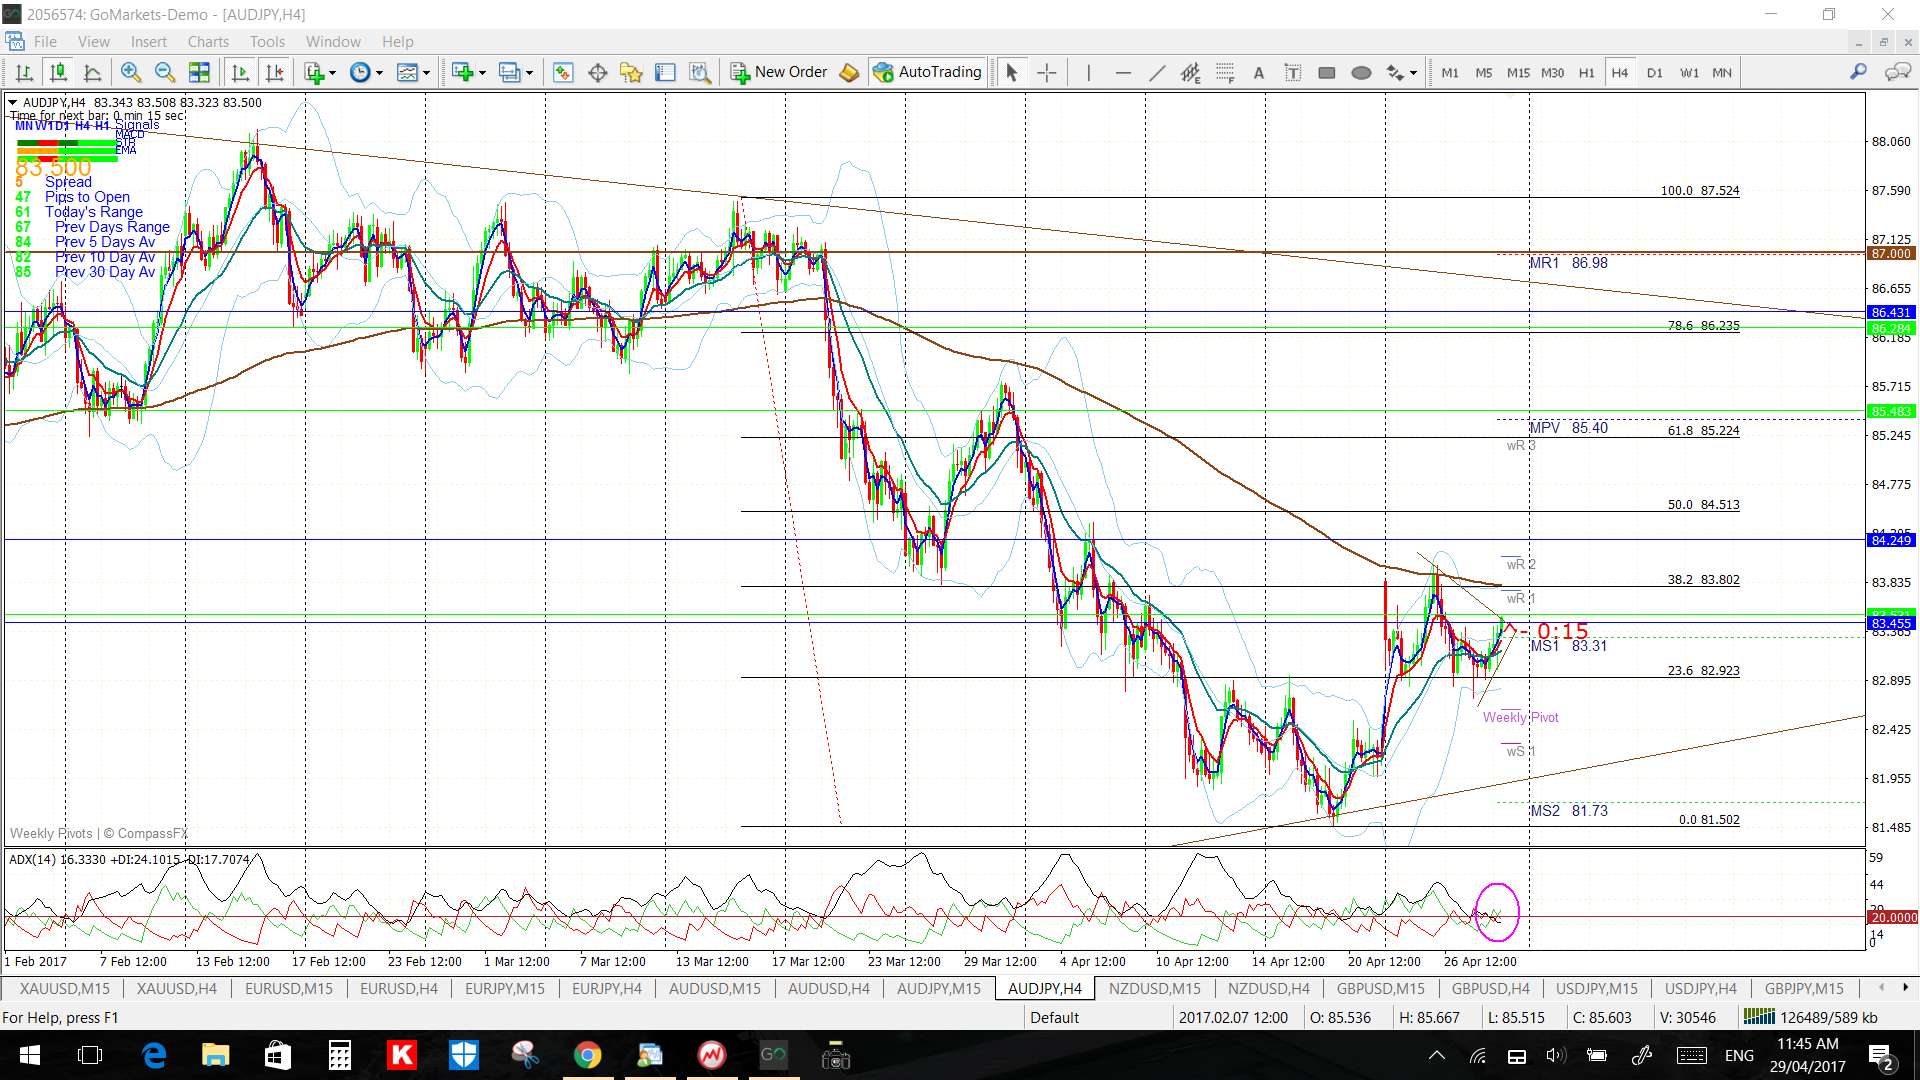
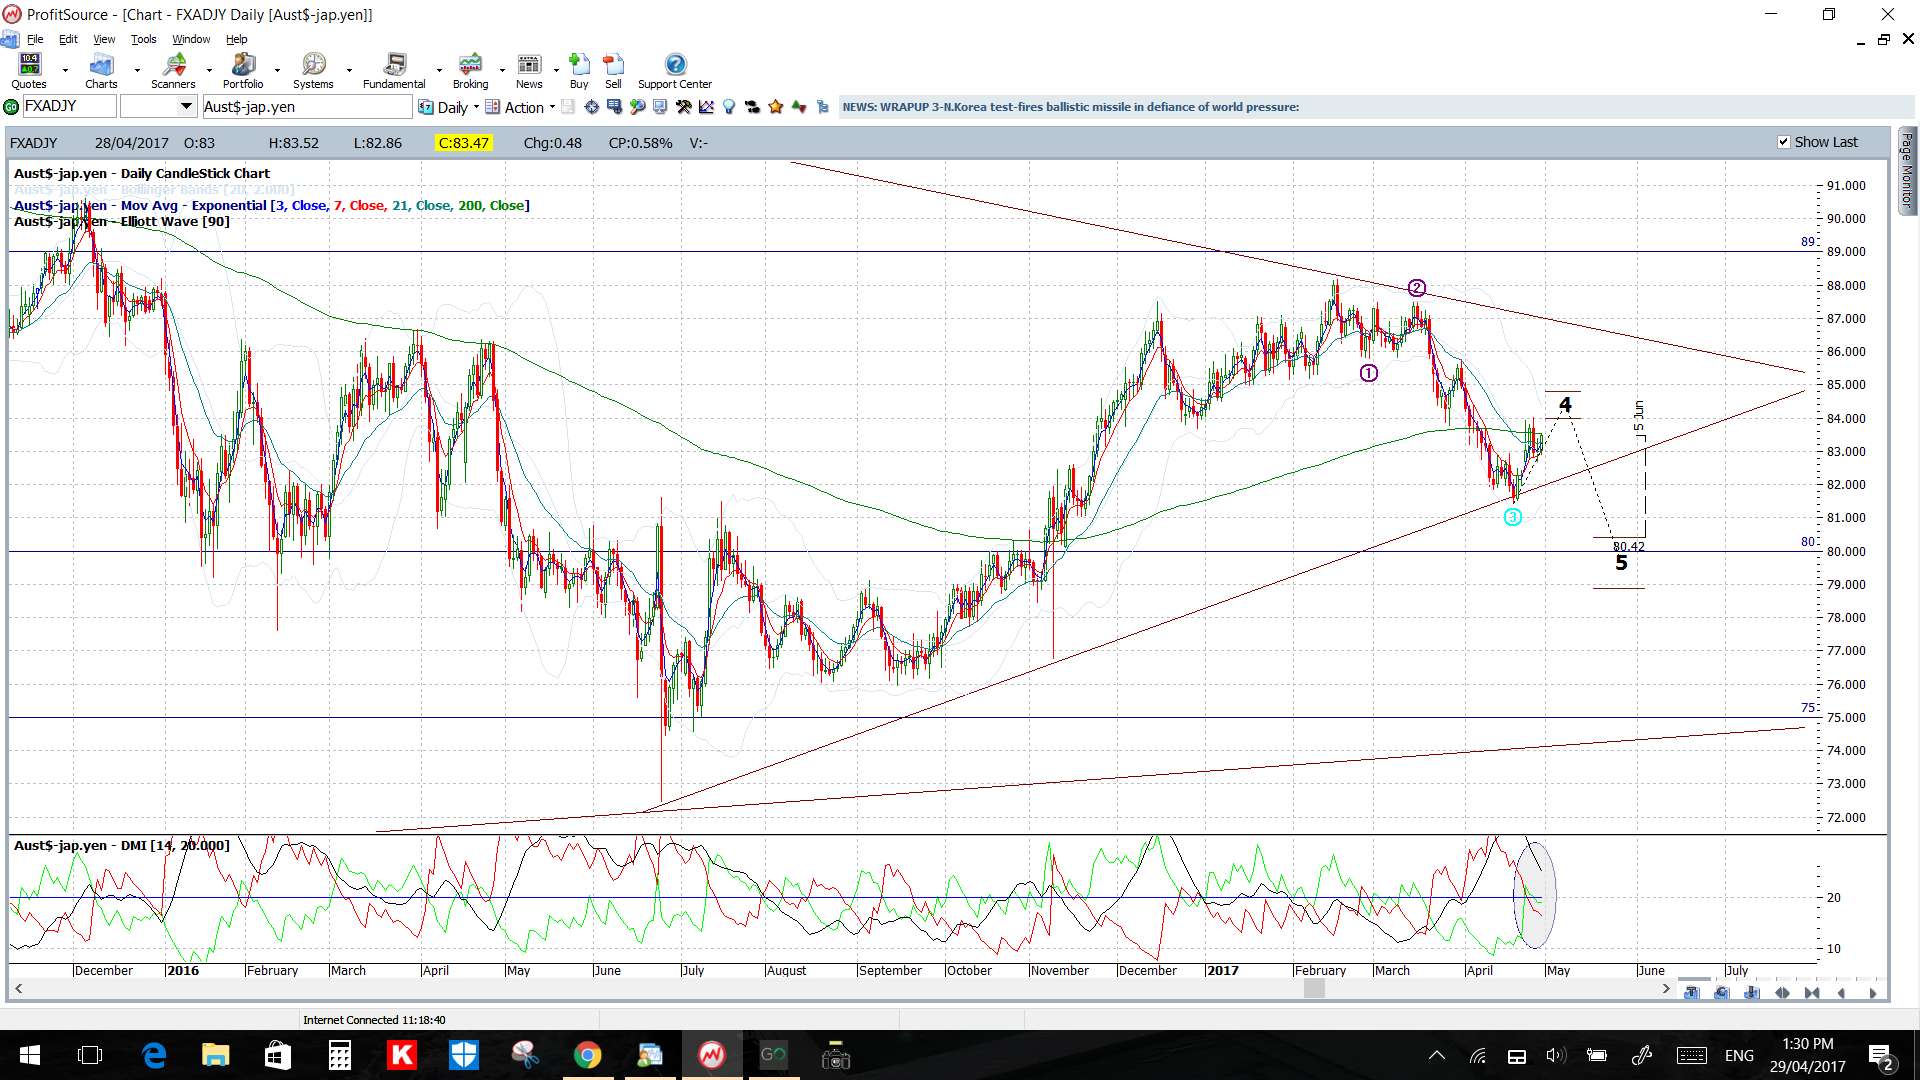
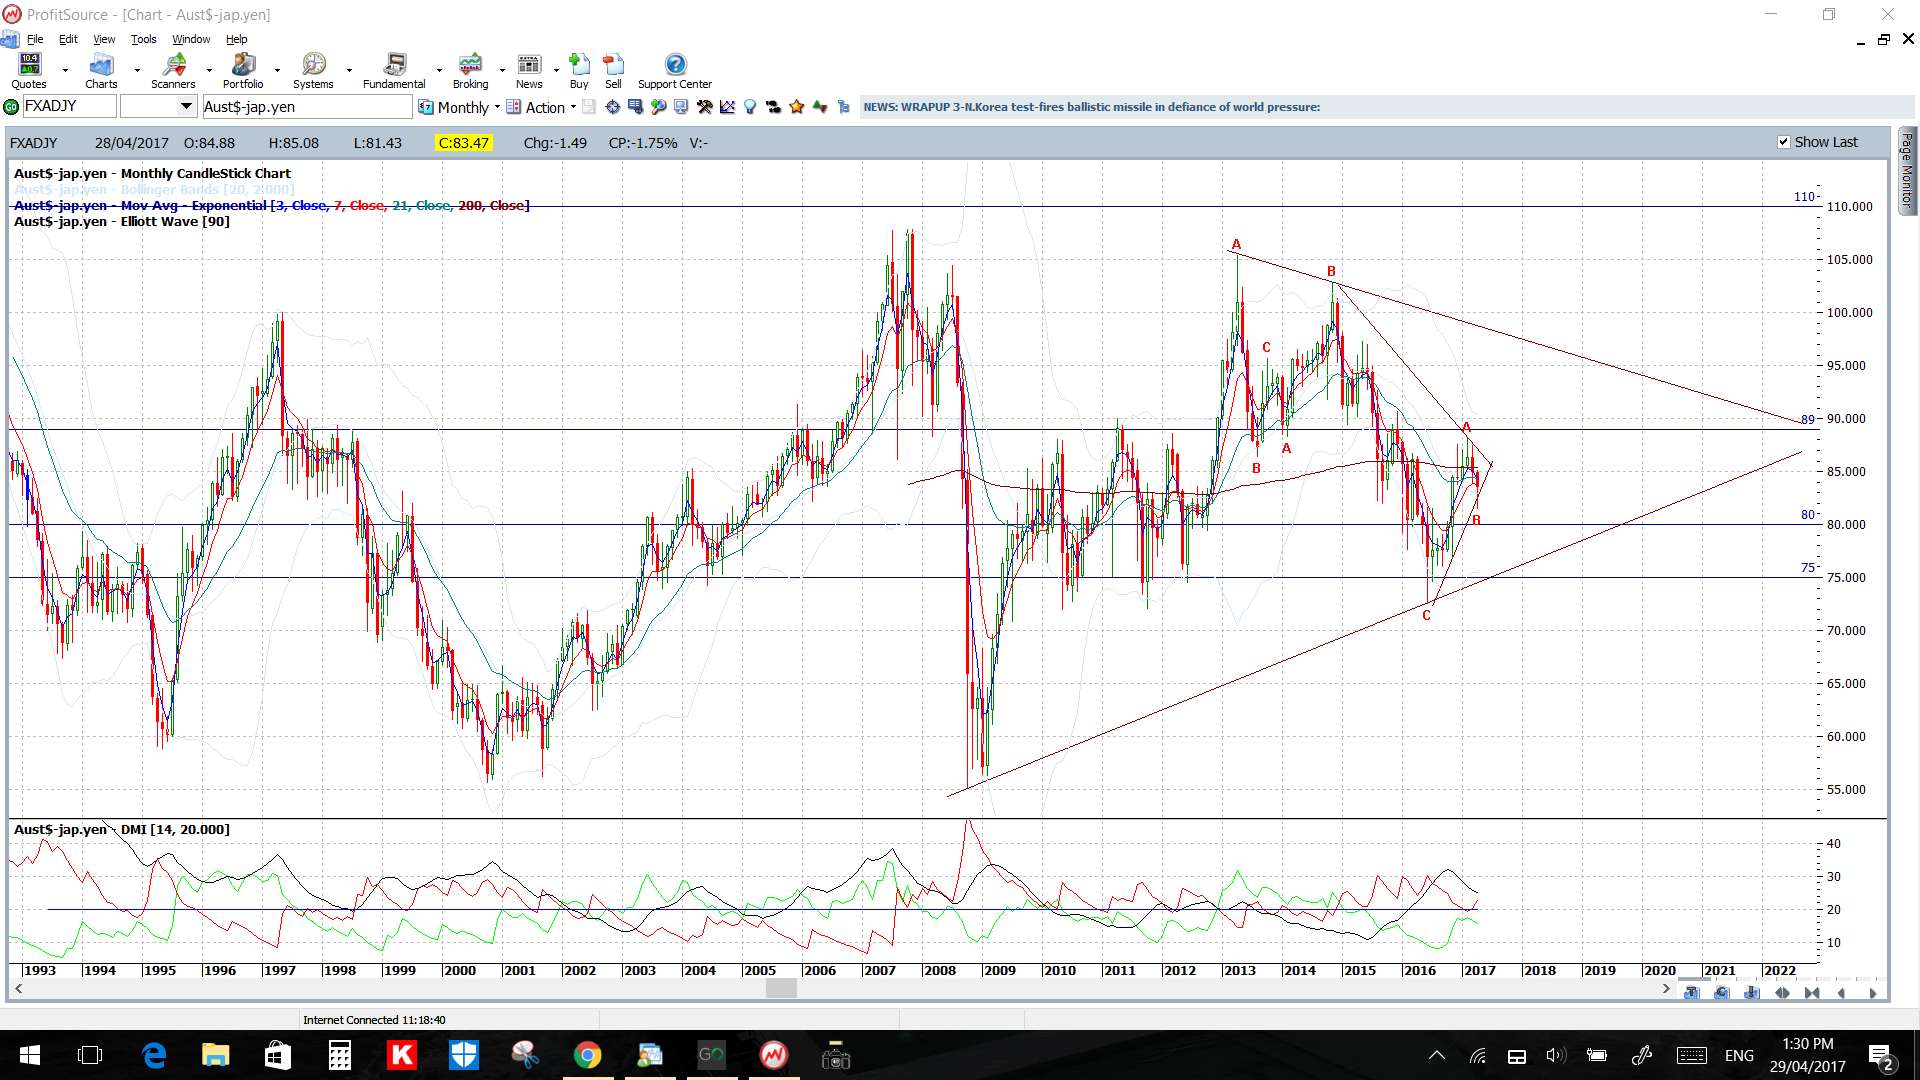
AUD/JPY: Price gapped higher to open for the week, and this has not been filled, but like some other pairs, it then chopped sideways for the rest of the week forming up a new triangle on the 4hr chart to monitor. This is set within the larger triangle on the daily giving traders plenty of trend lines to watch for any make or break activity. It is worth keeping in mind that the daily chart triangle is worth up to 2,000 pips.
Watch the 4hr triangle trend lines for:
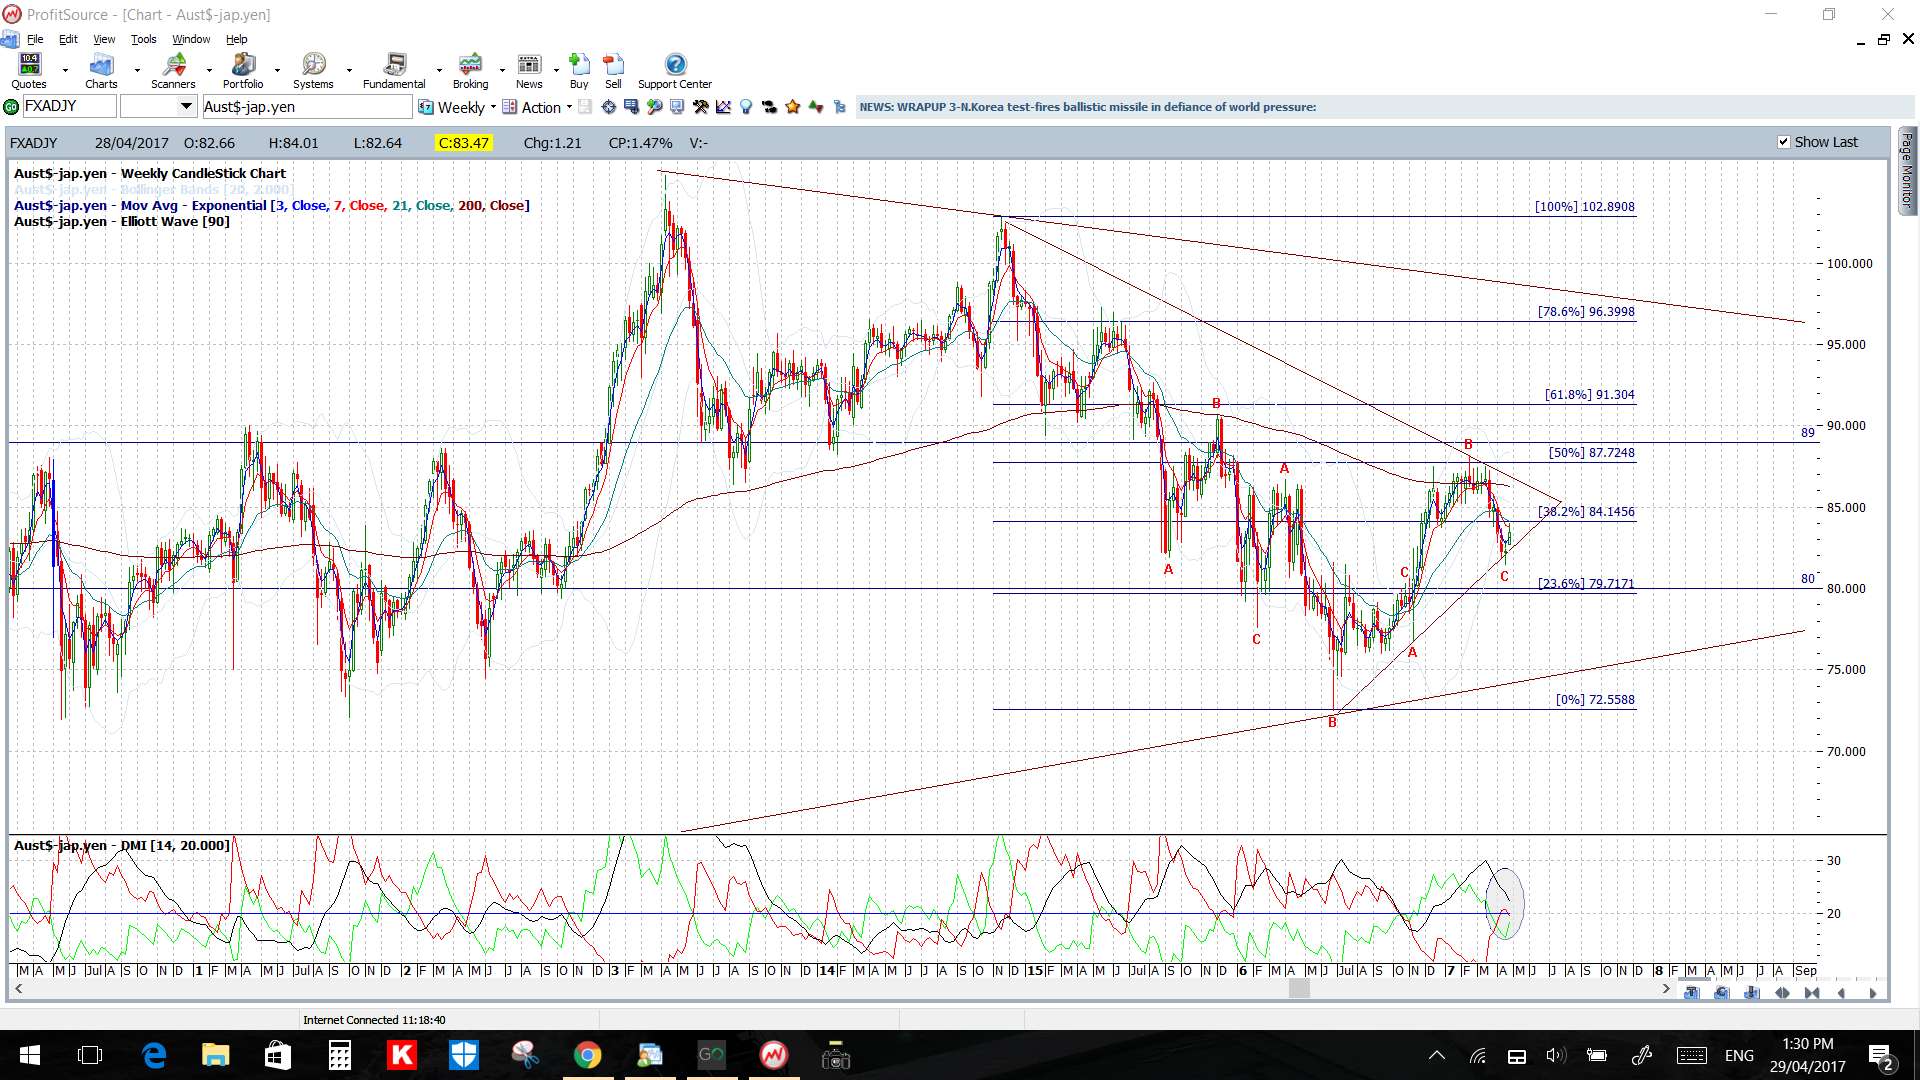
- any bullish breakout to possibly target the 61.8% fib up near 85.
- any bearish breakout to possibly target the daily chart triangle’s support trend line near 82.
Price is above the 4hr but below the daily Cloud.
The weekly and monthly candles were bearish.
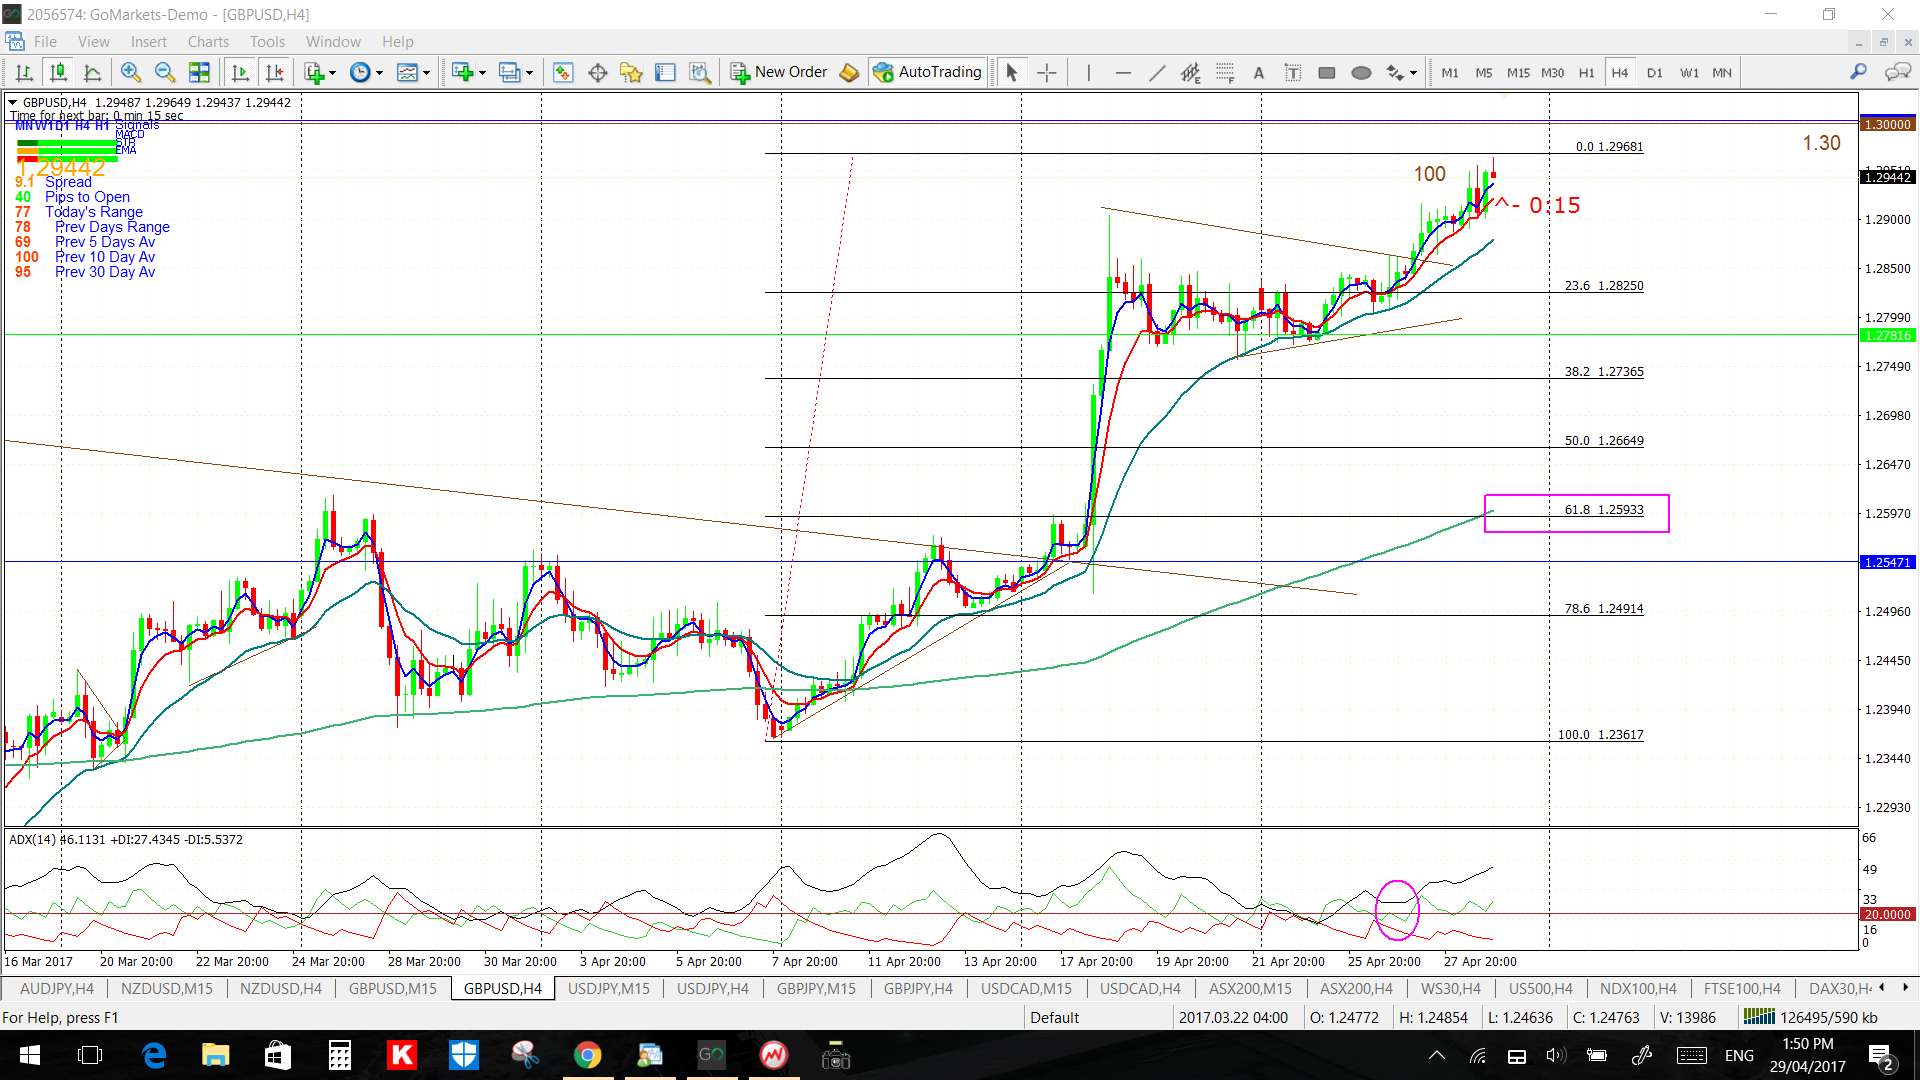
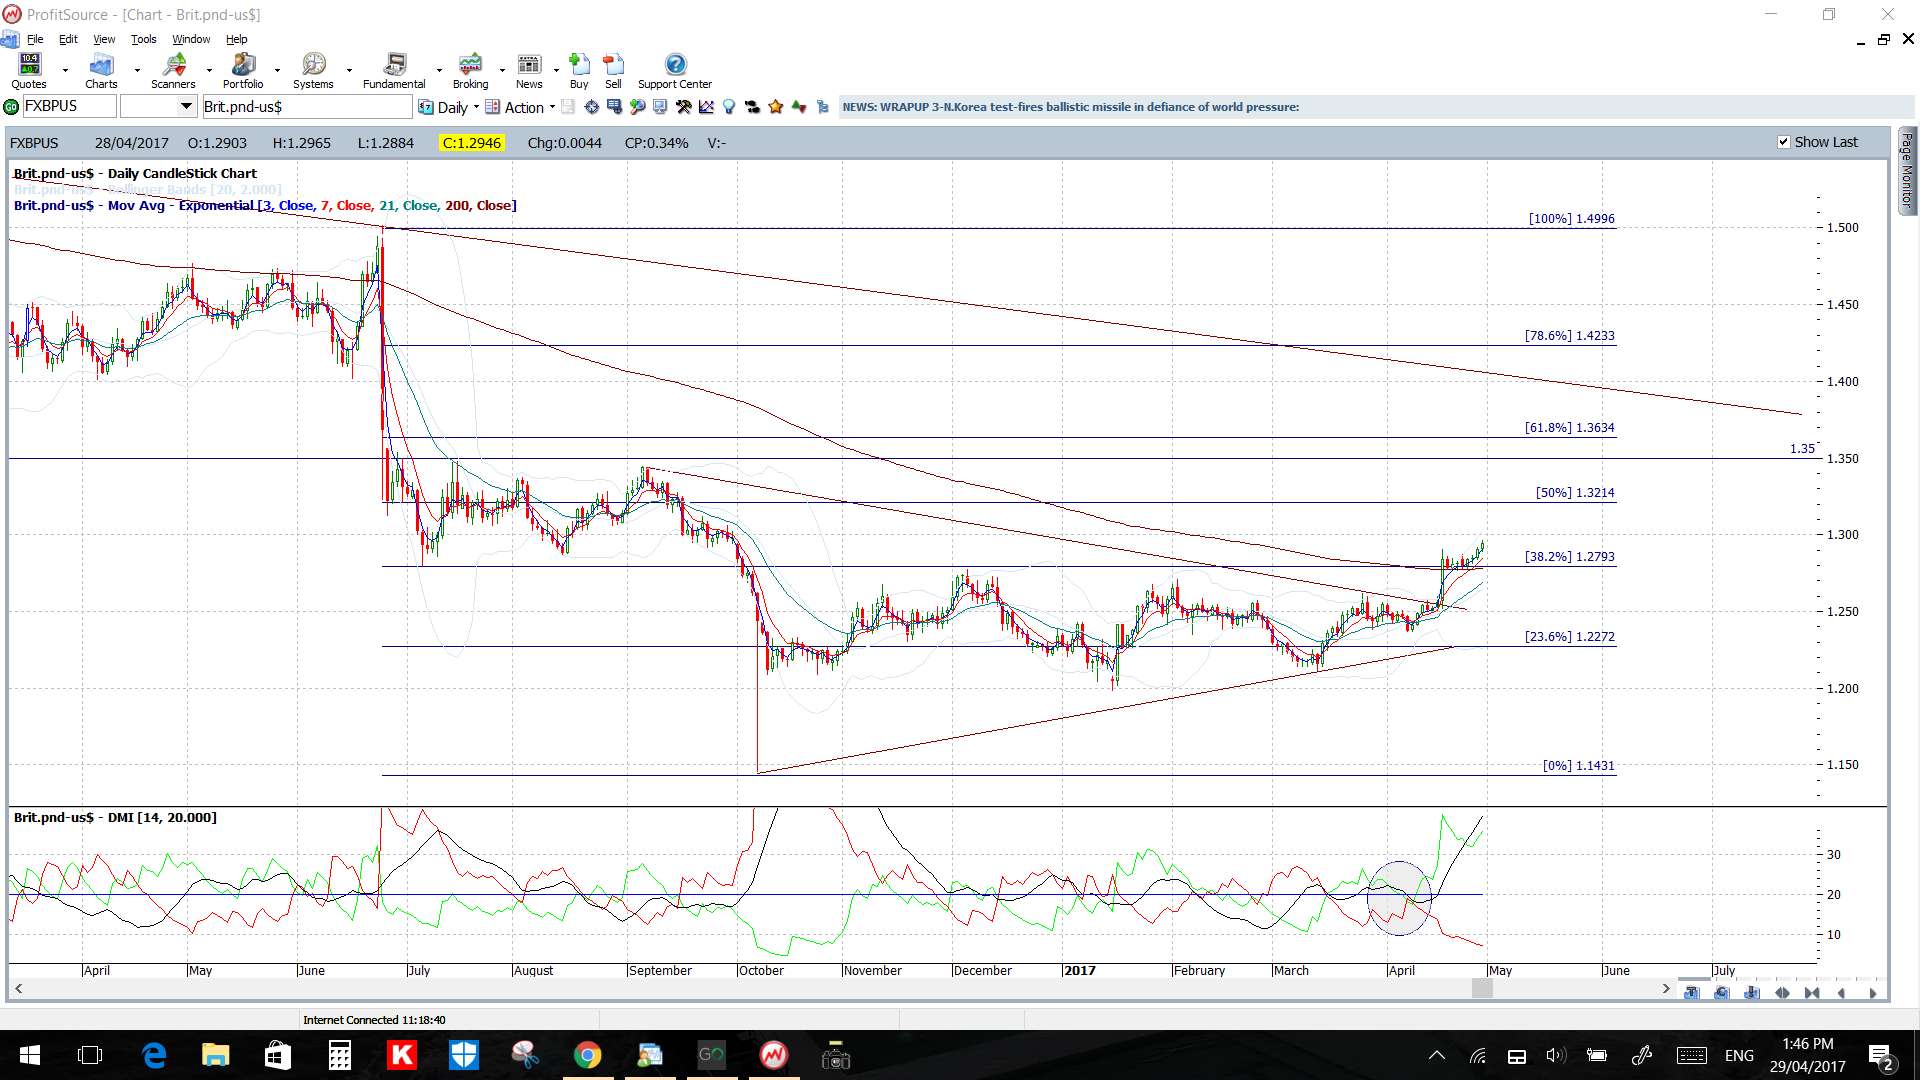
GBP/USD: Price broke up and out of a small 4hr chart triangle this week and closed the week just below the 1.30 S/R level. Watch this 1.30 level for any make or break activity:
- a bullish break: then 1.35 would come into greater focus as it is the daily chart’s 61.8% fib.
- a bearish break: any rejection of 1.30 would bring the 4hr chart’s 61.8% fib, near 1.26, into focus.
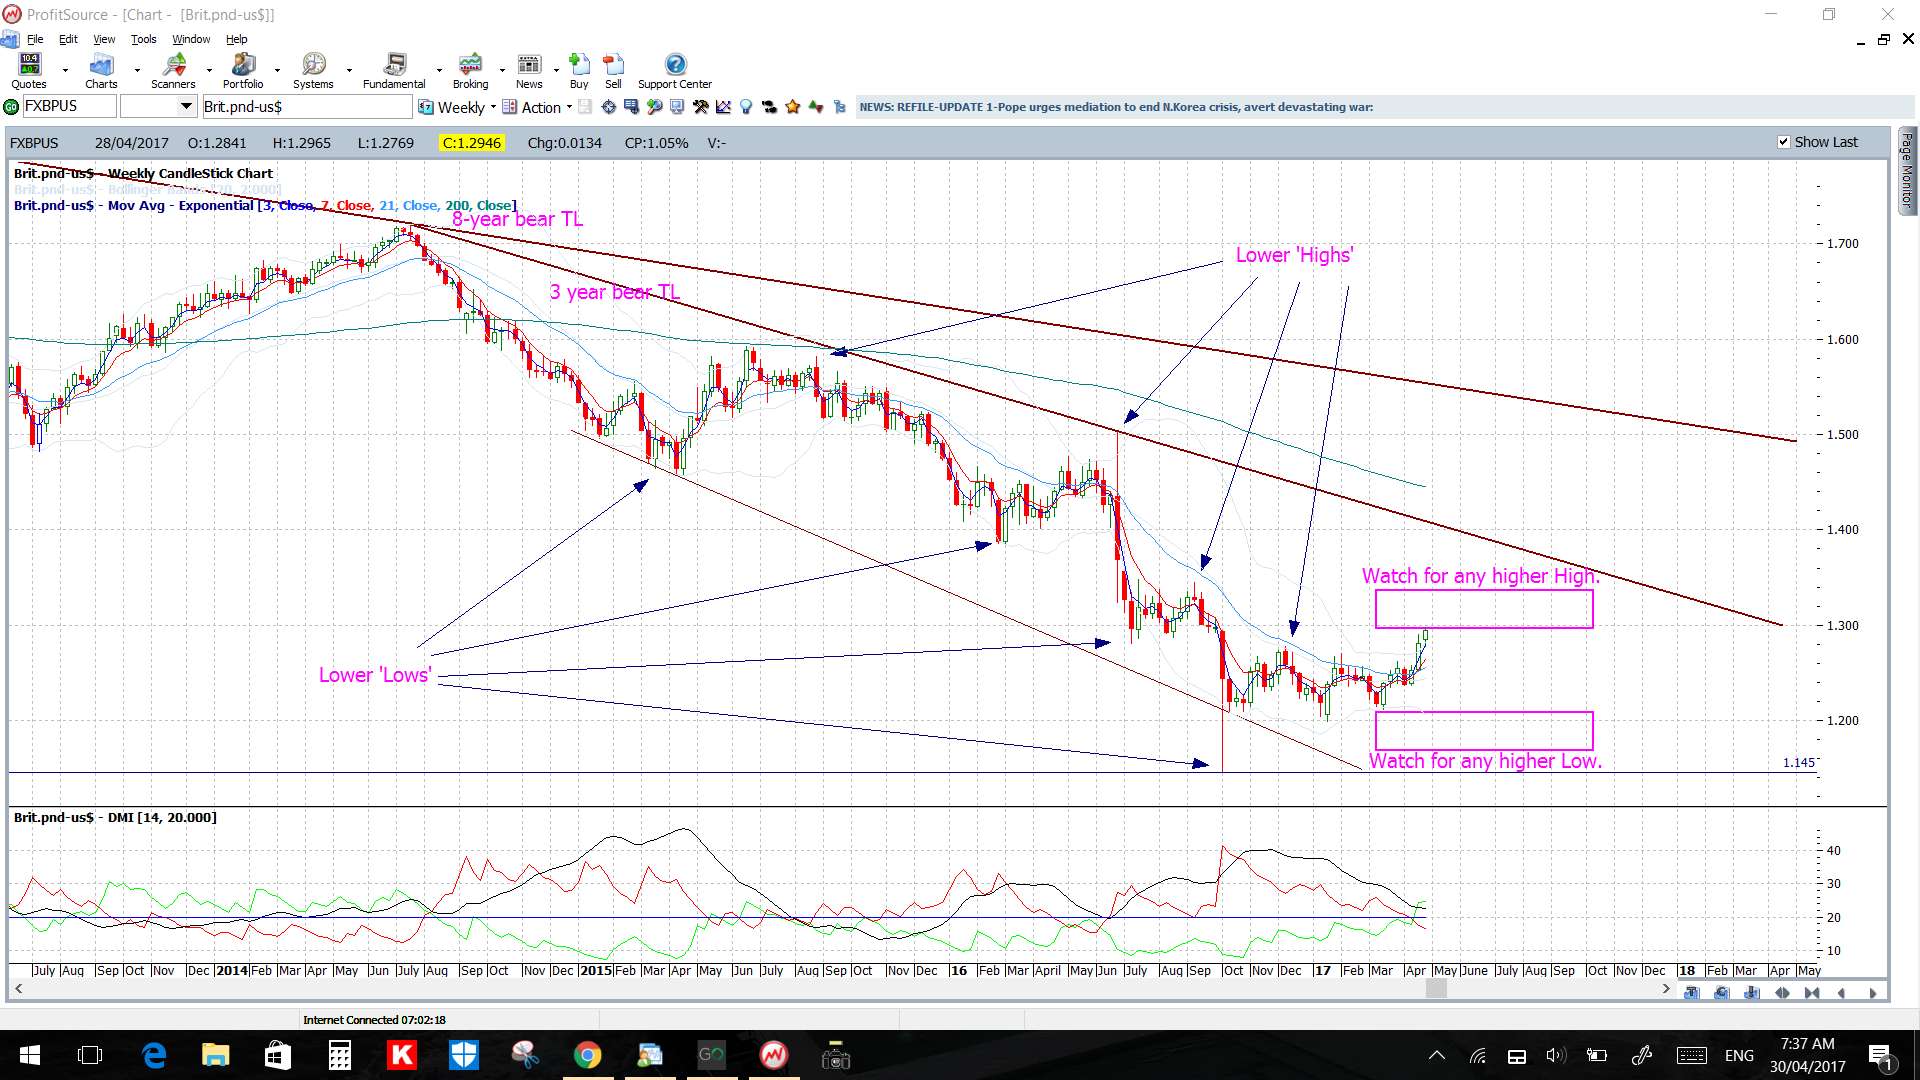
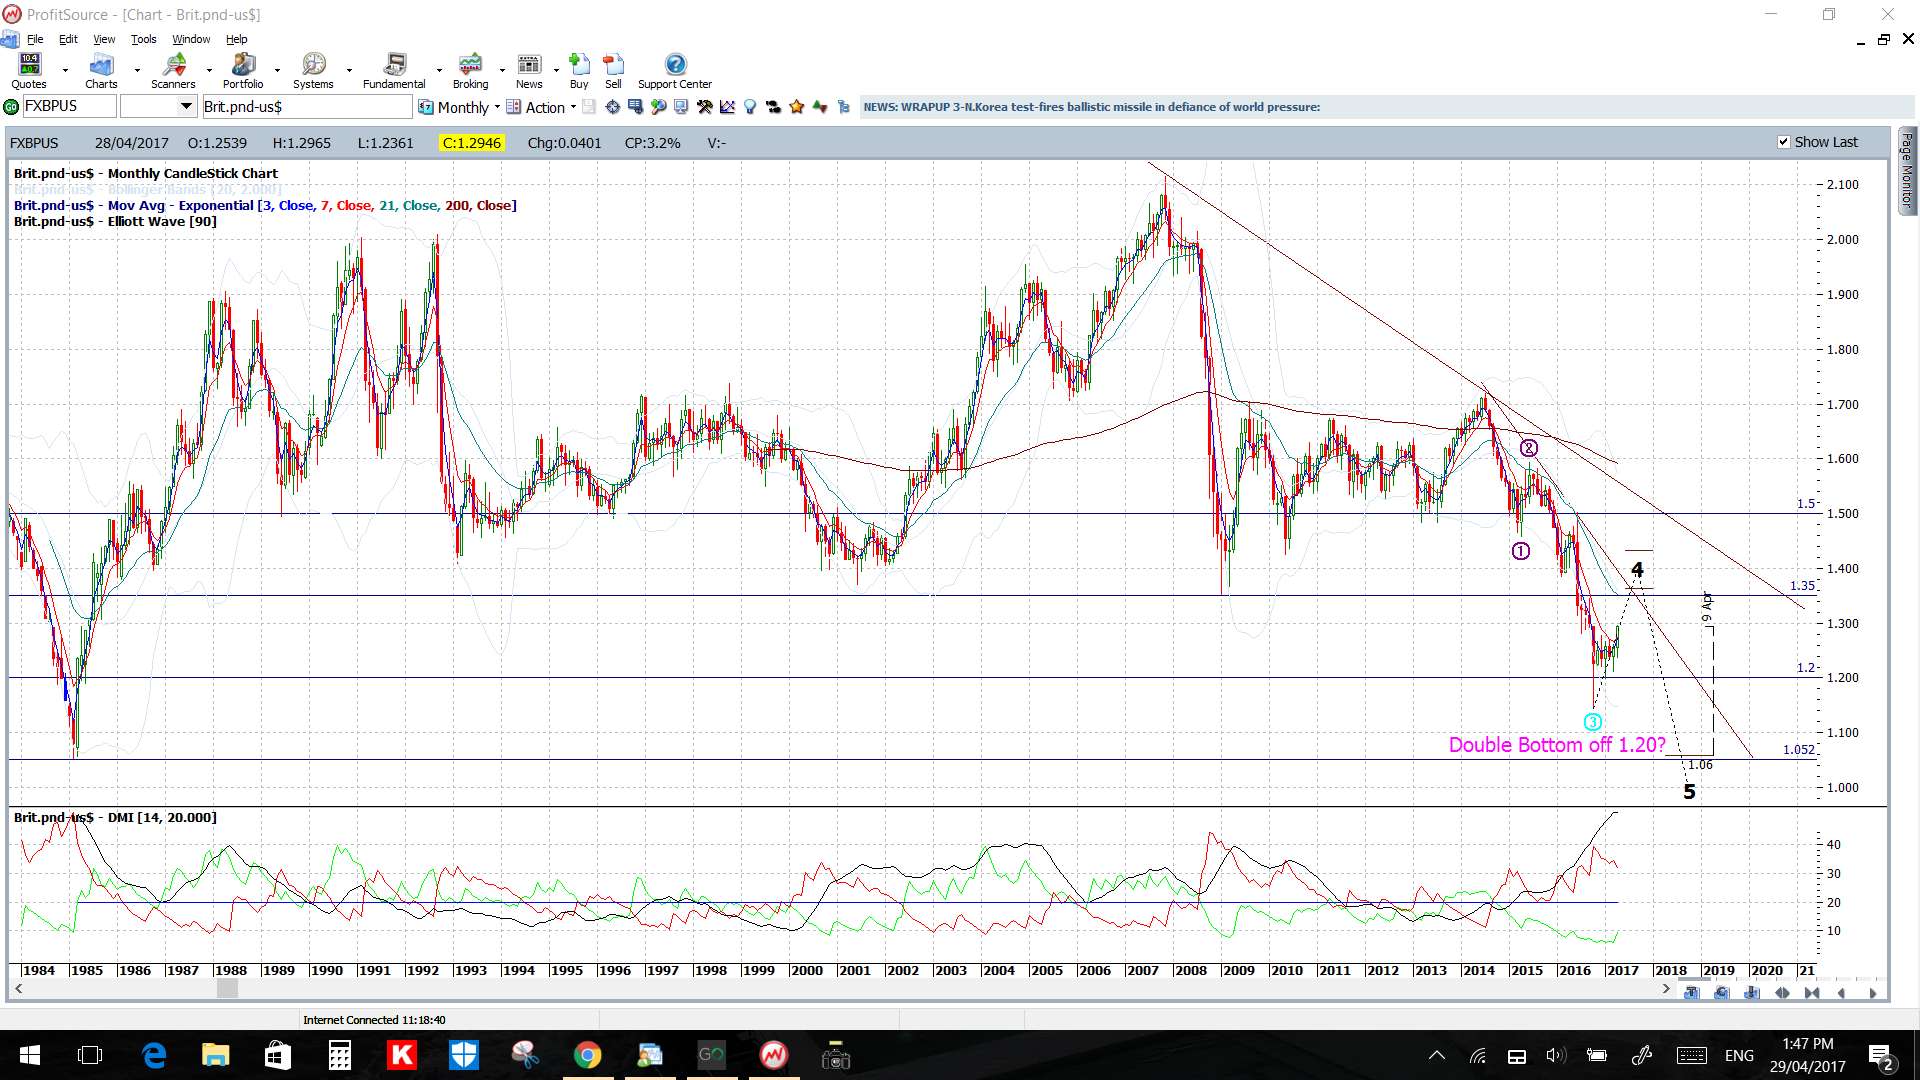
Keep in mind that the weekly chart’s bear trend line has been in play for almost 3 years now and is about 1,000 pips away near the 1.40 level.
Price is above the 4hr and daily Cloud.
The weekly and monthly candles were bullish.
There is GBP Manufacturing, Construction and Services PMI to monitor as well as all of the USD data.
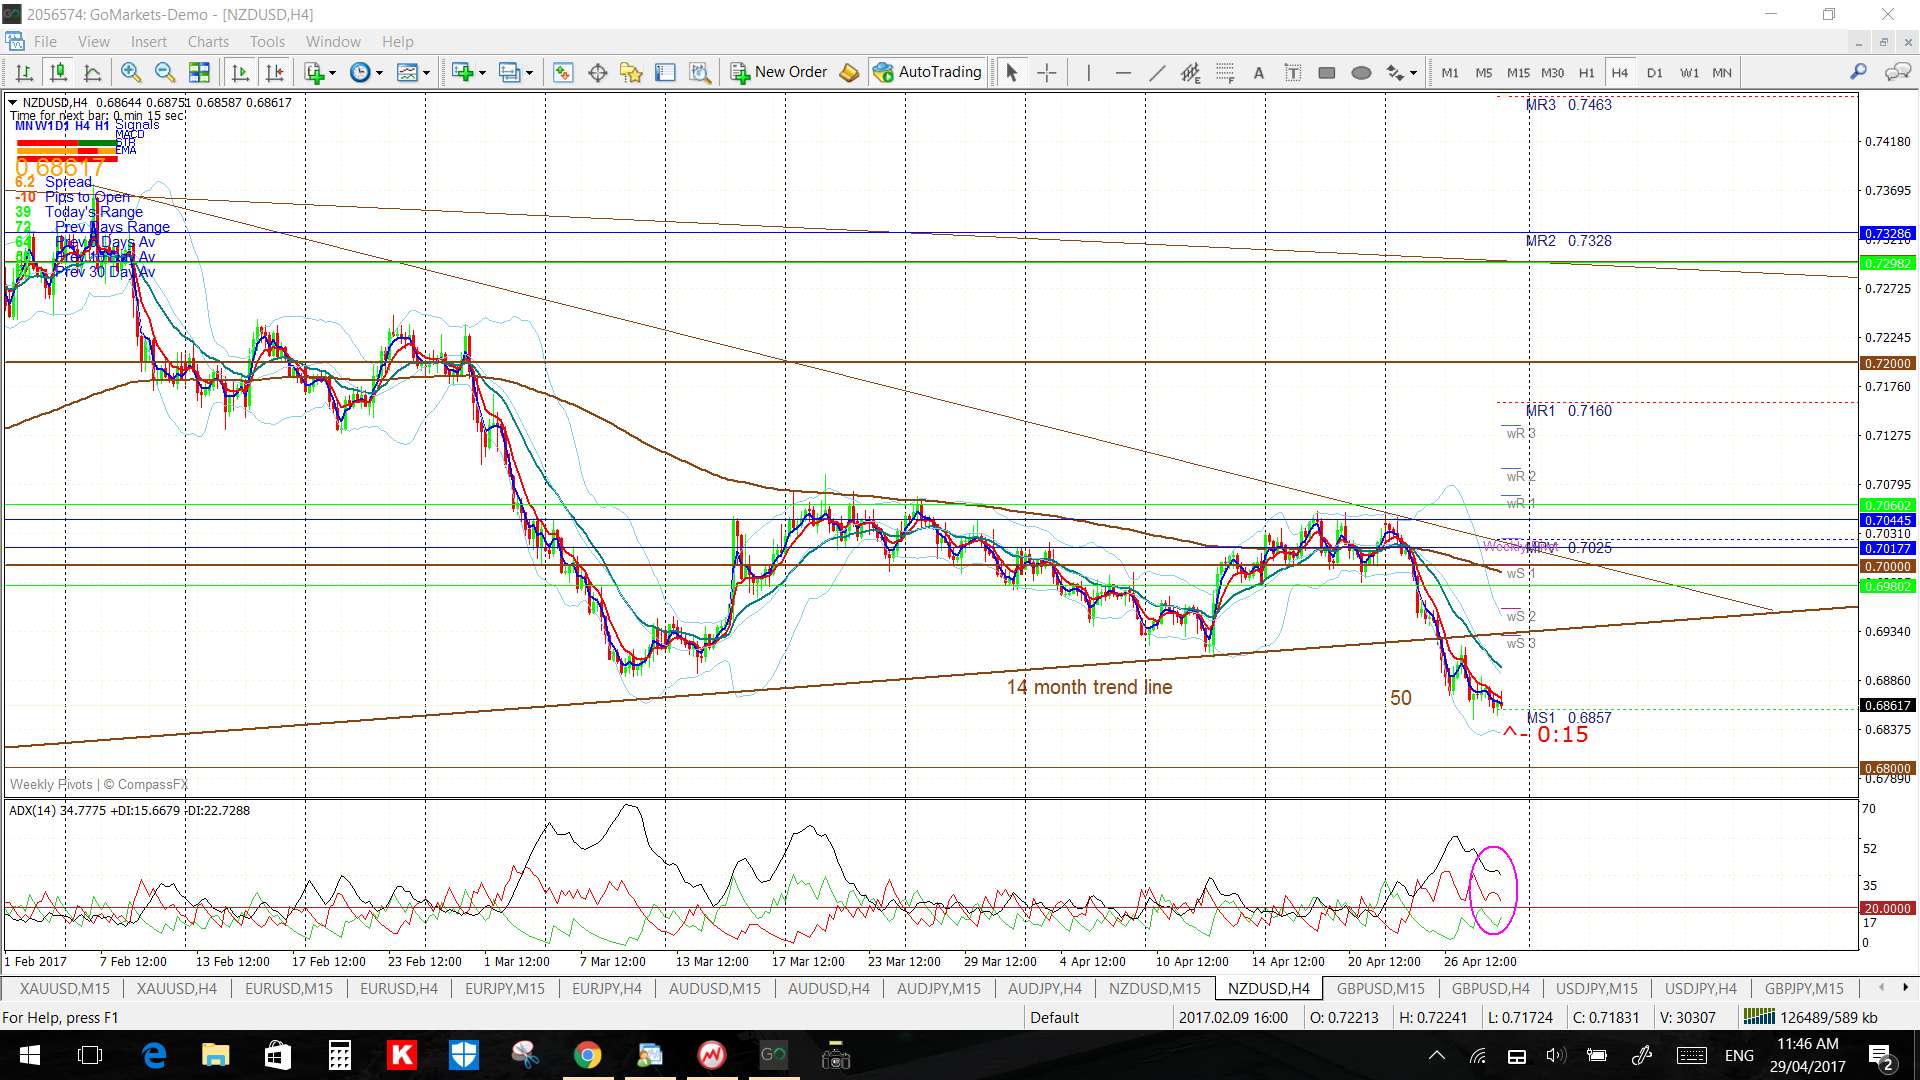
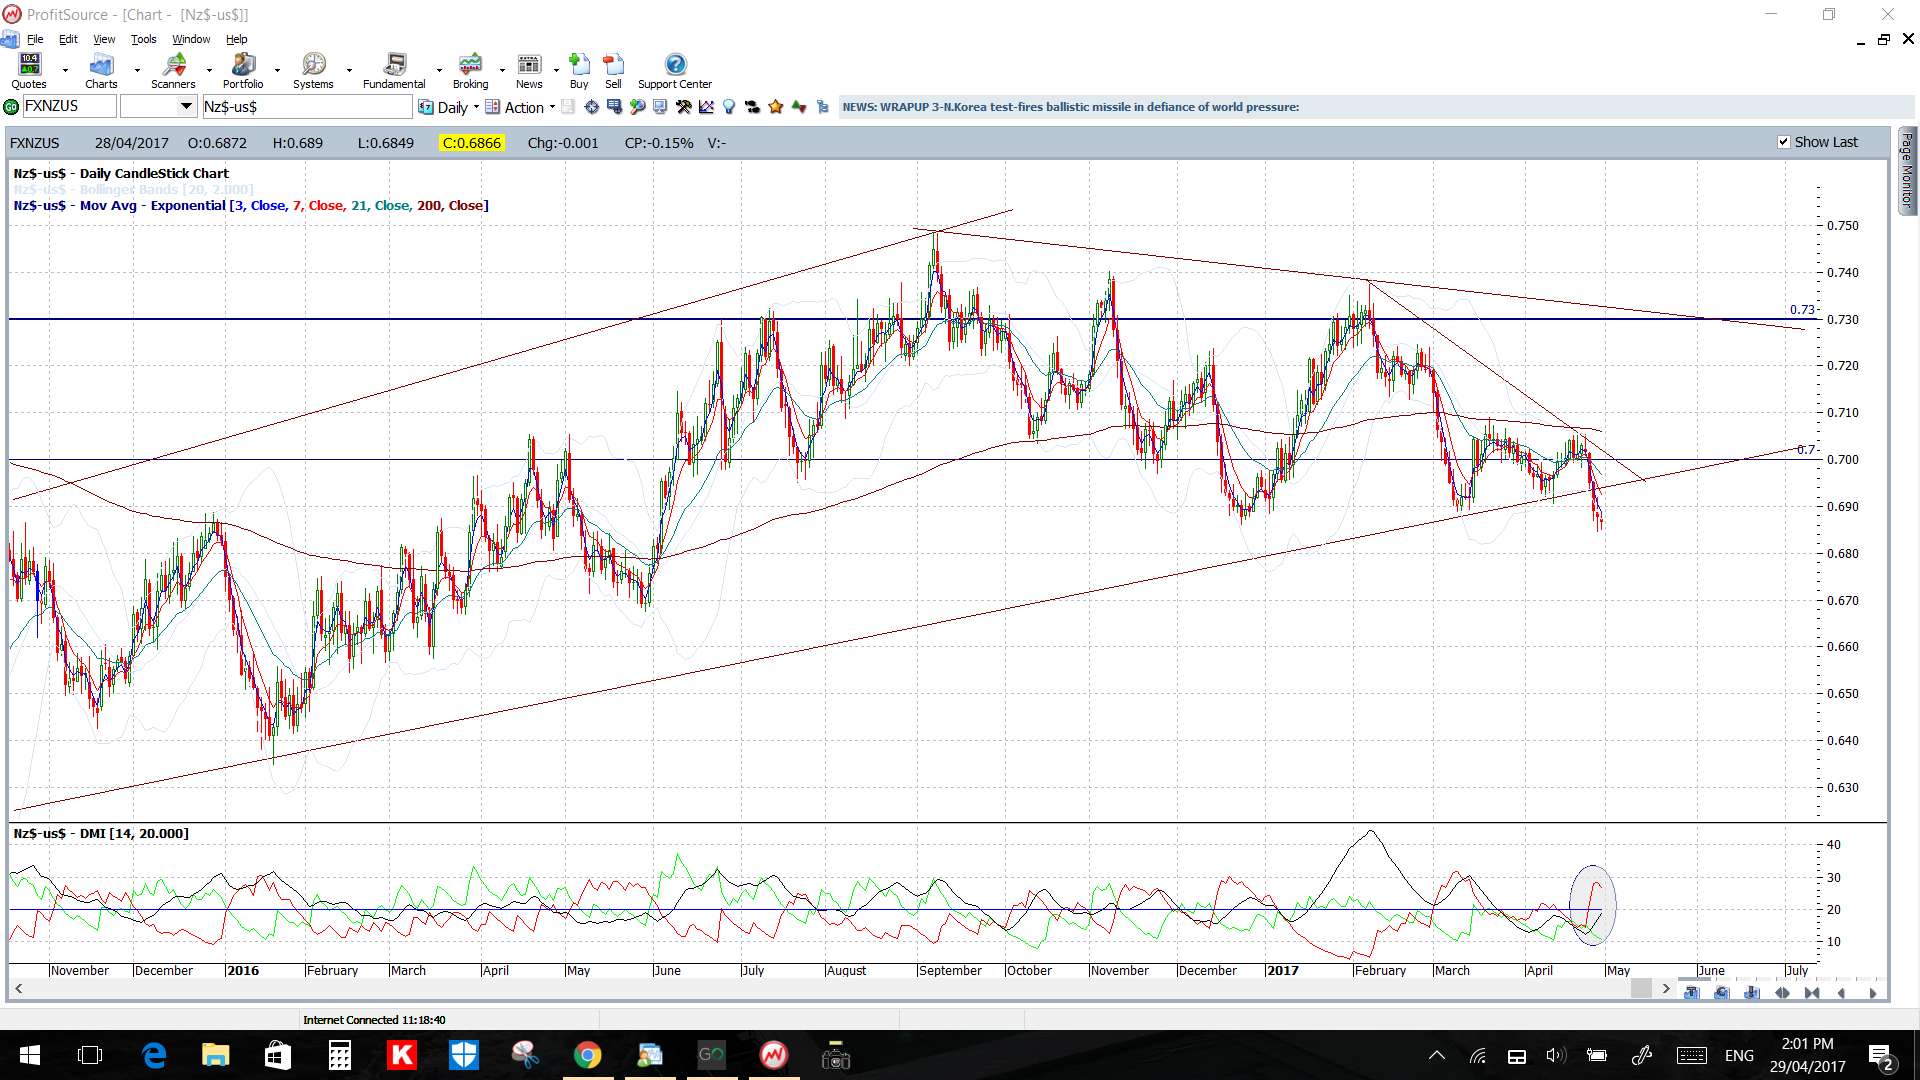
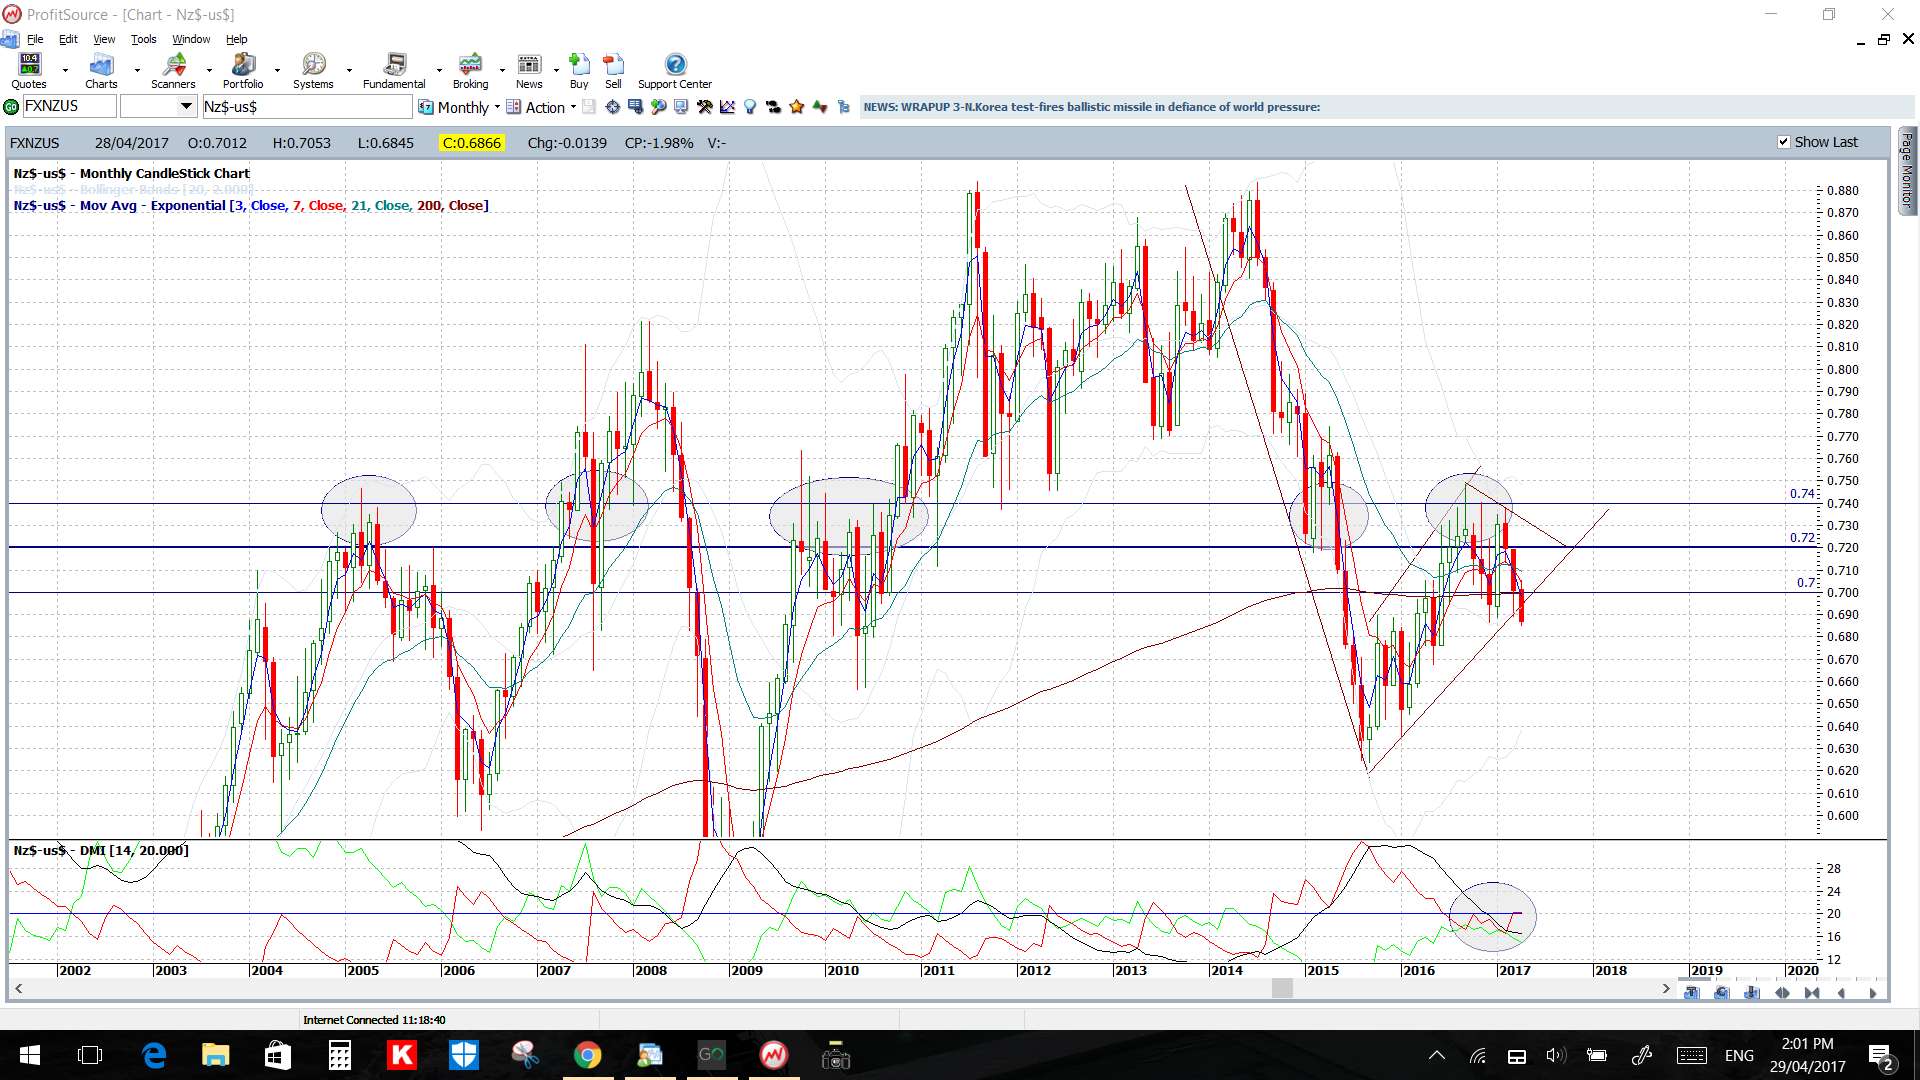
NZD/USD: The Kiwi has broken below a major monthly support trend line again so I’ll be watching for any bearish follow-through.
Price is below the 4hr and daily Cloud.
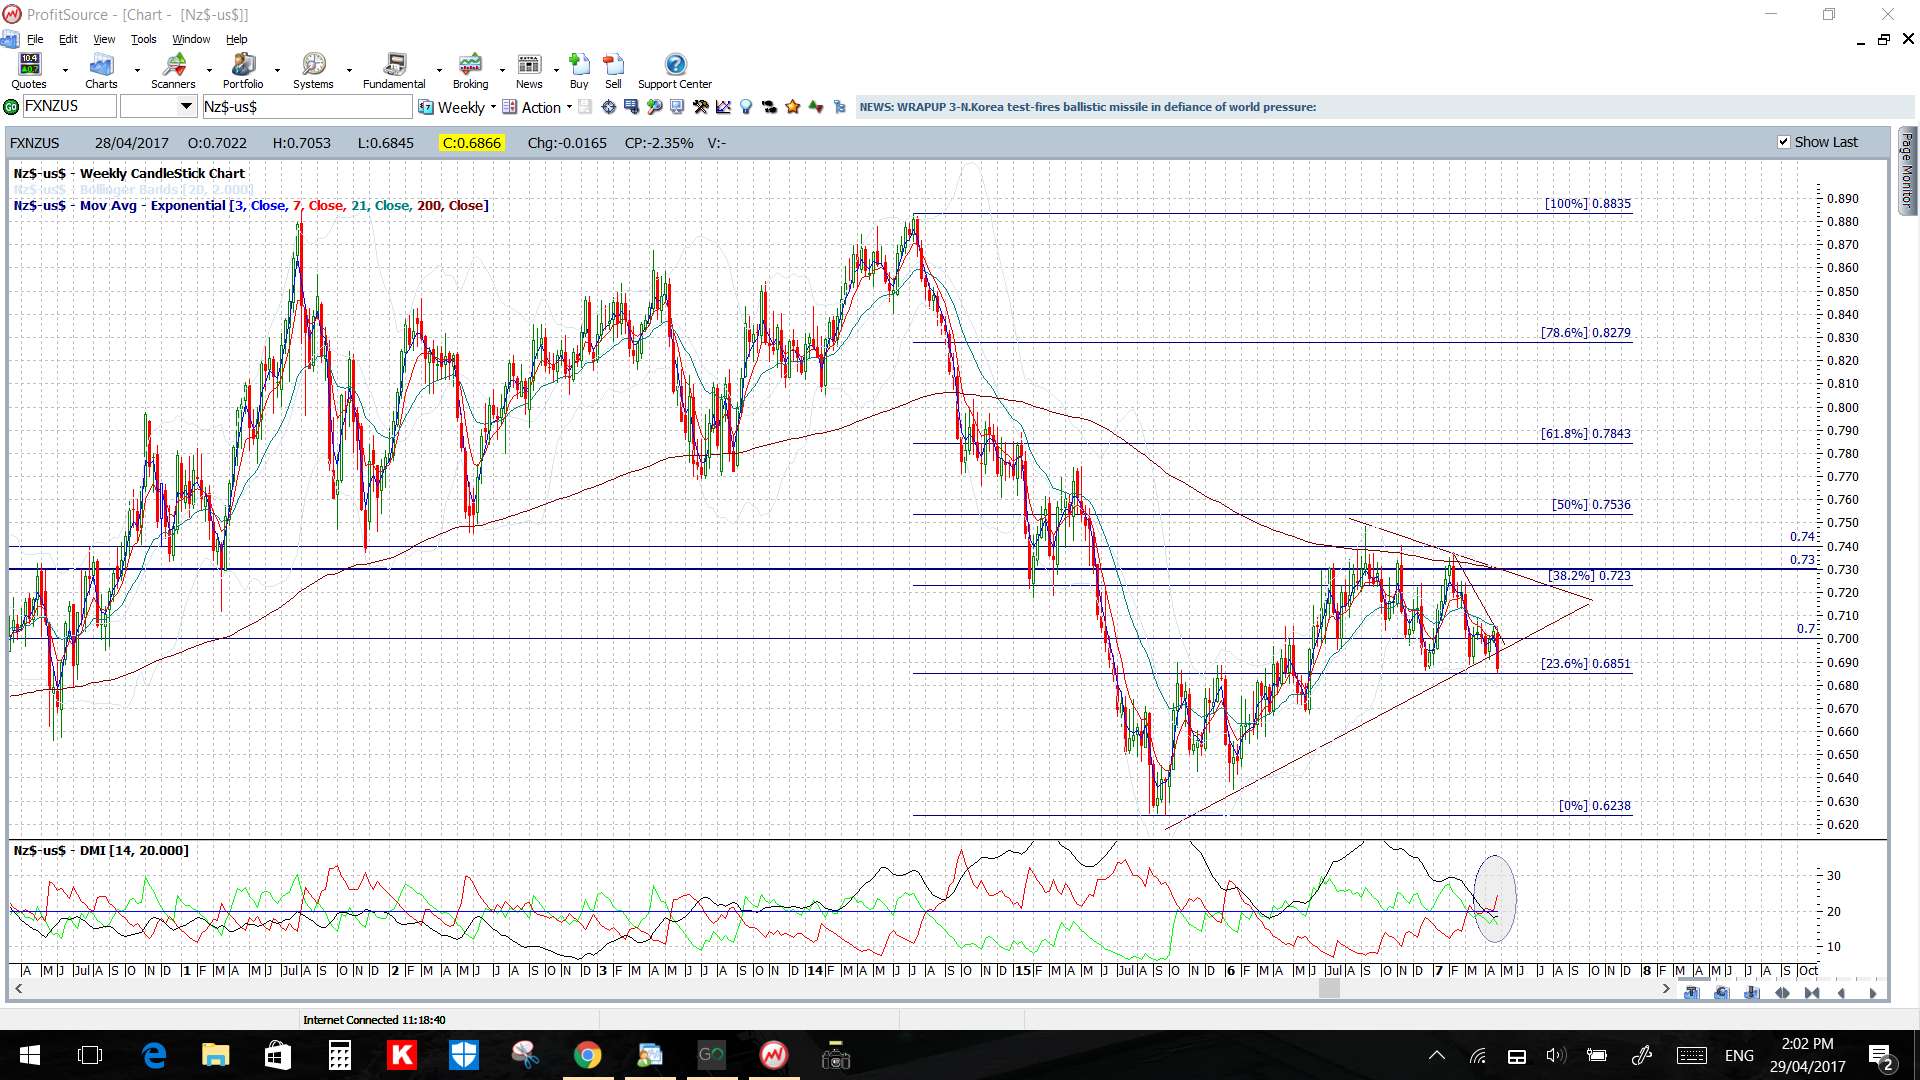
The weekly and monthly candles were bearish.
There is NZD Employment data to monitor this week as well as all of the CNY and US data.
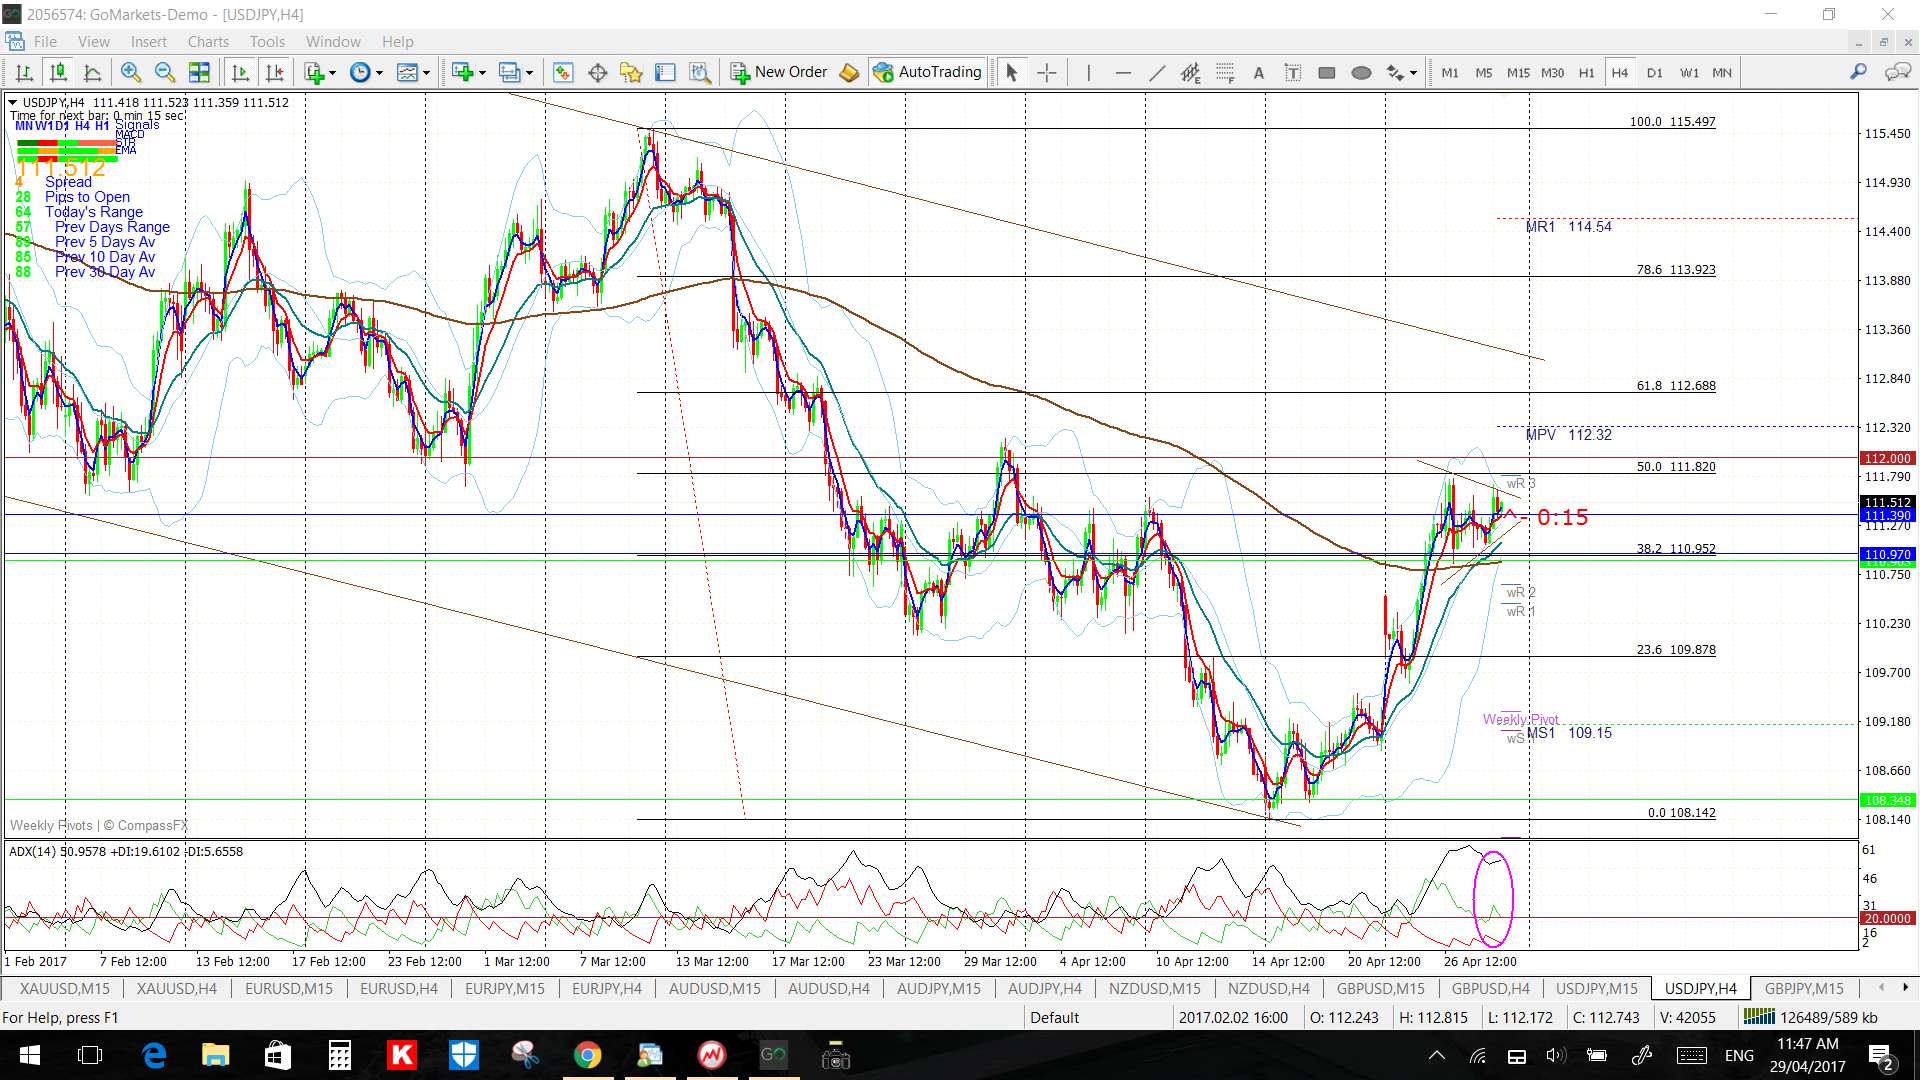
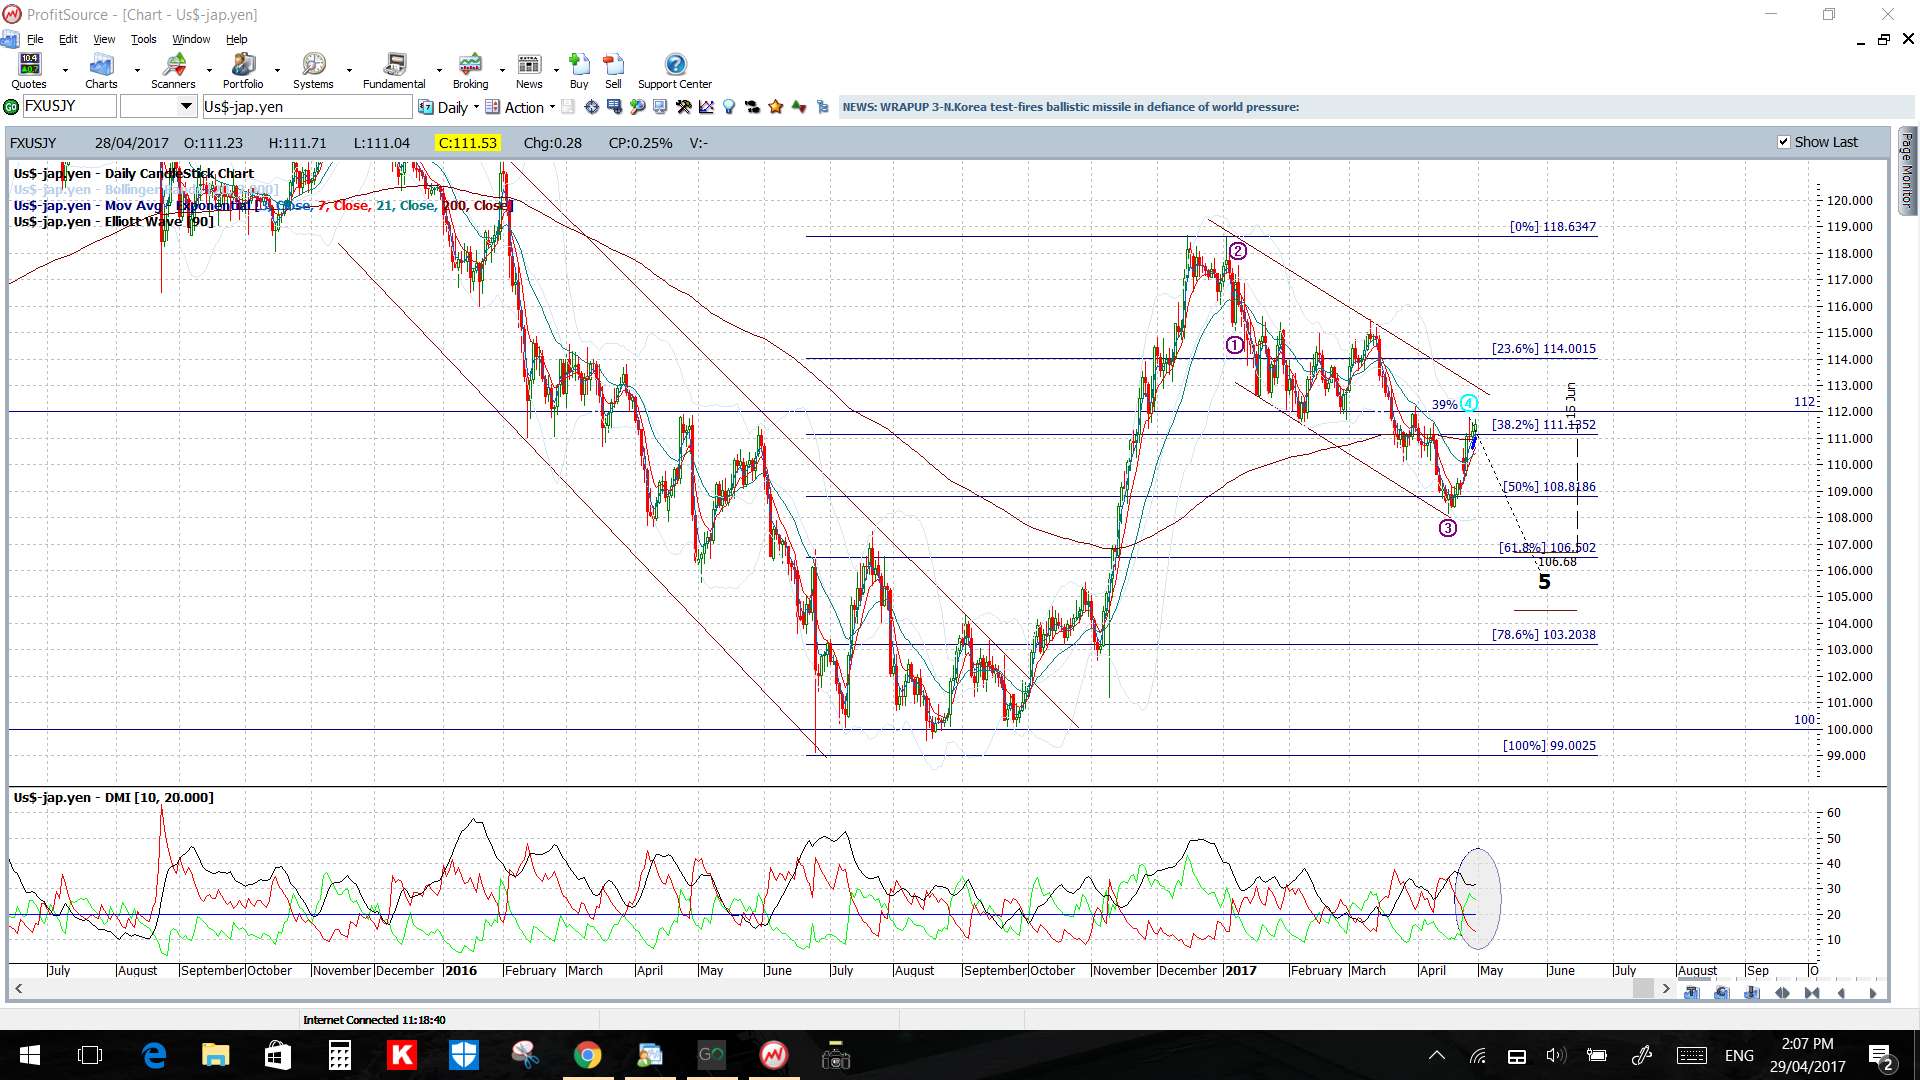
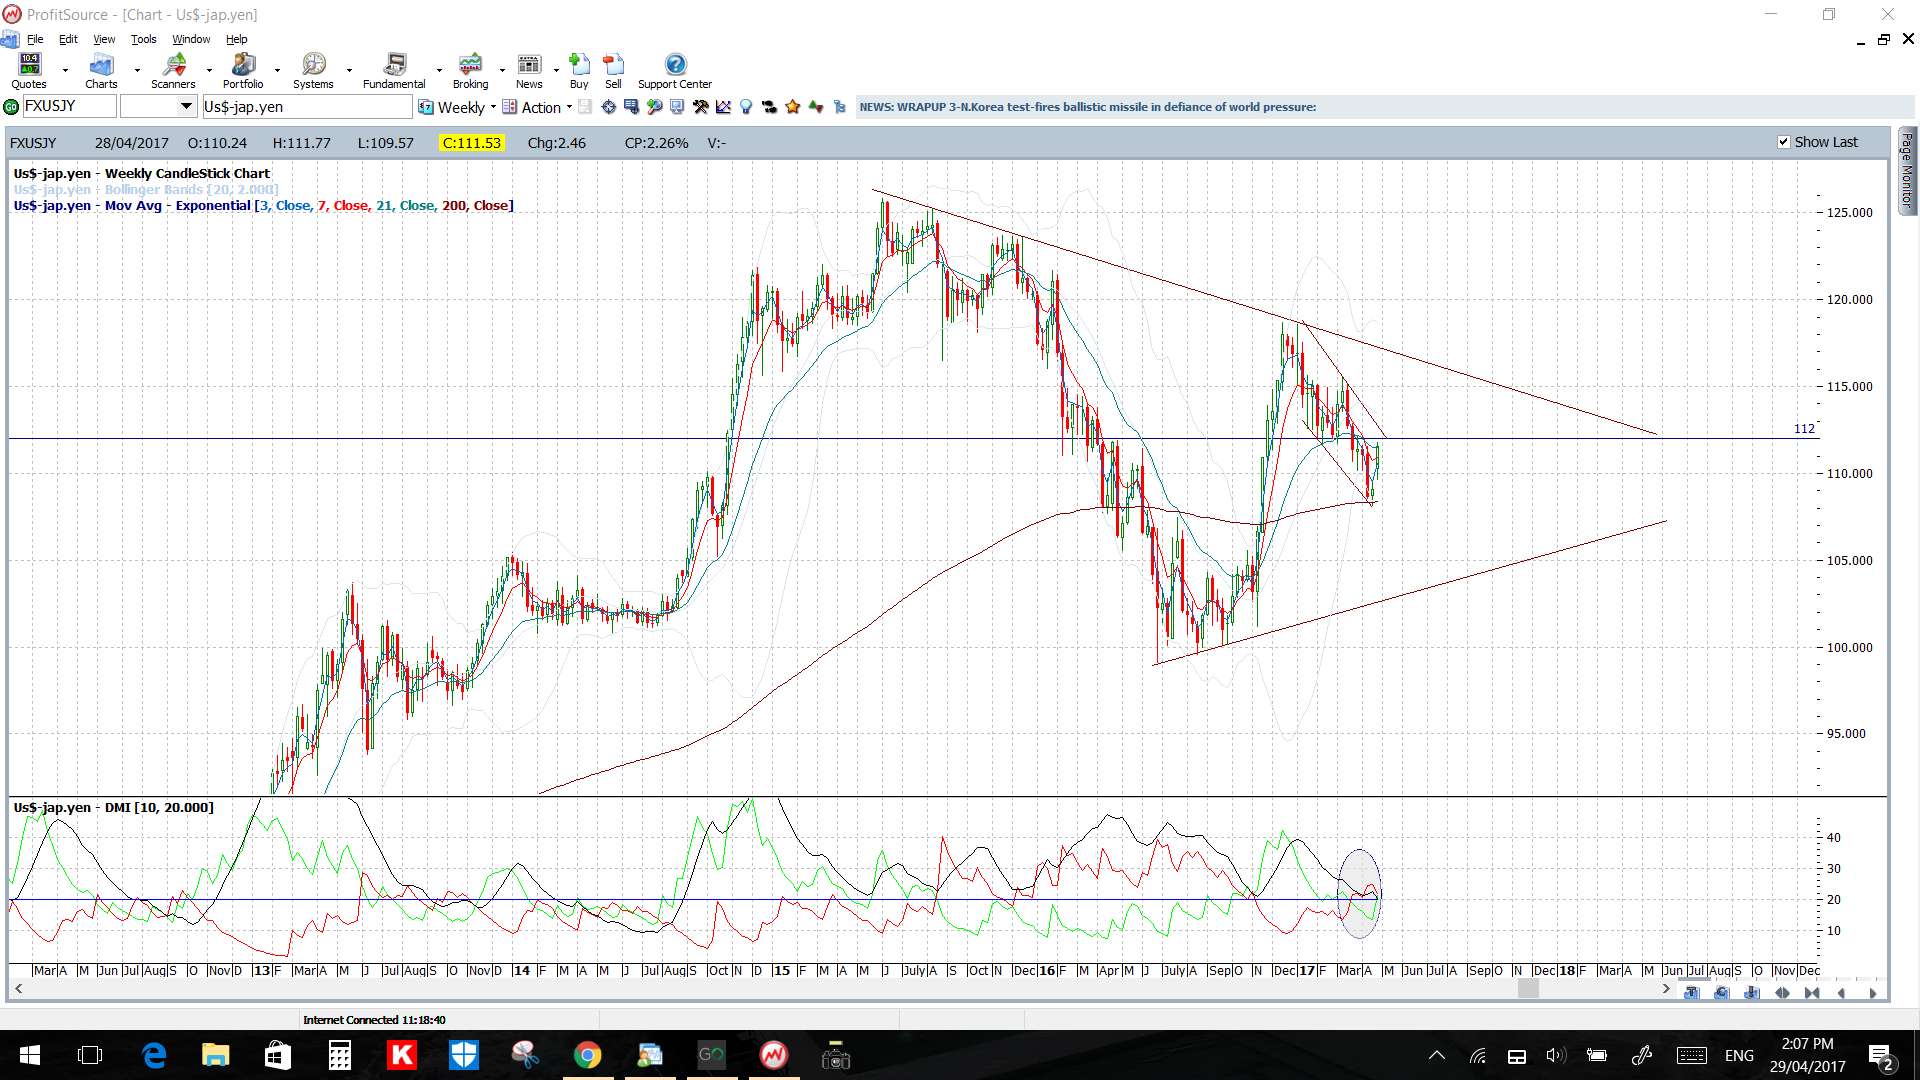
USD/JPY: Price gapped higher to open for the week, and this has not been filled, but price action slowed towards the end of last week forming a triangle on the 4hr chart that is set within the daily chart’s descending trading channel. These patterns are giving traders trend lines to watch for any make or break activity:
- a bullish 4hr chart triangle breakout would bring the 112 and upper Channel trend lines into focus.
- a bearish 4hr chart triangle breakout would bring the lower Channel trend line back into focus
Price is above the 4hr but below the daily Cloud.
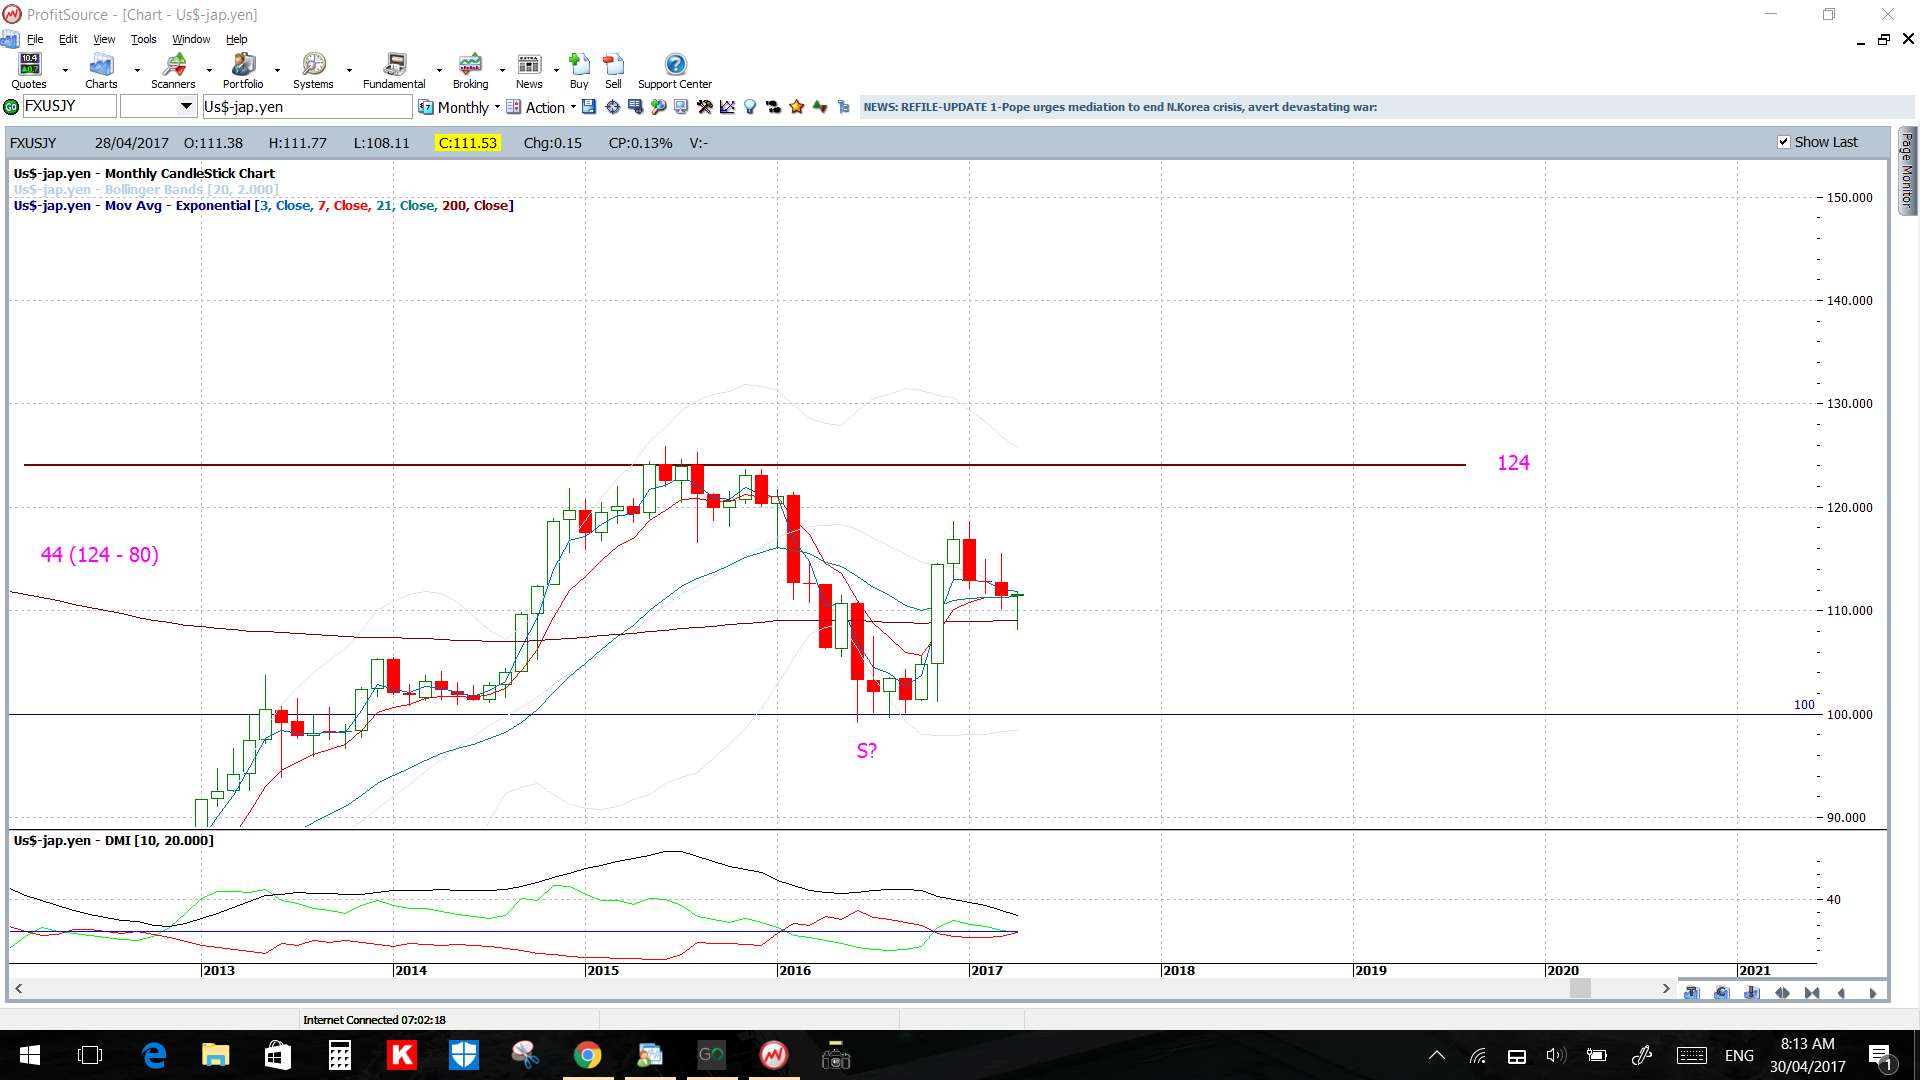
The weekly candle was bullish. The monthly candle formed what looks like a bullish-reversal ‘Hammer’ candle above 110 support:
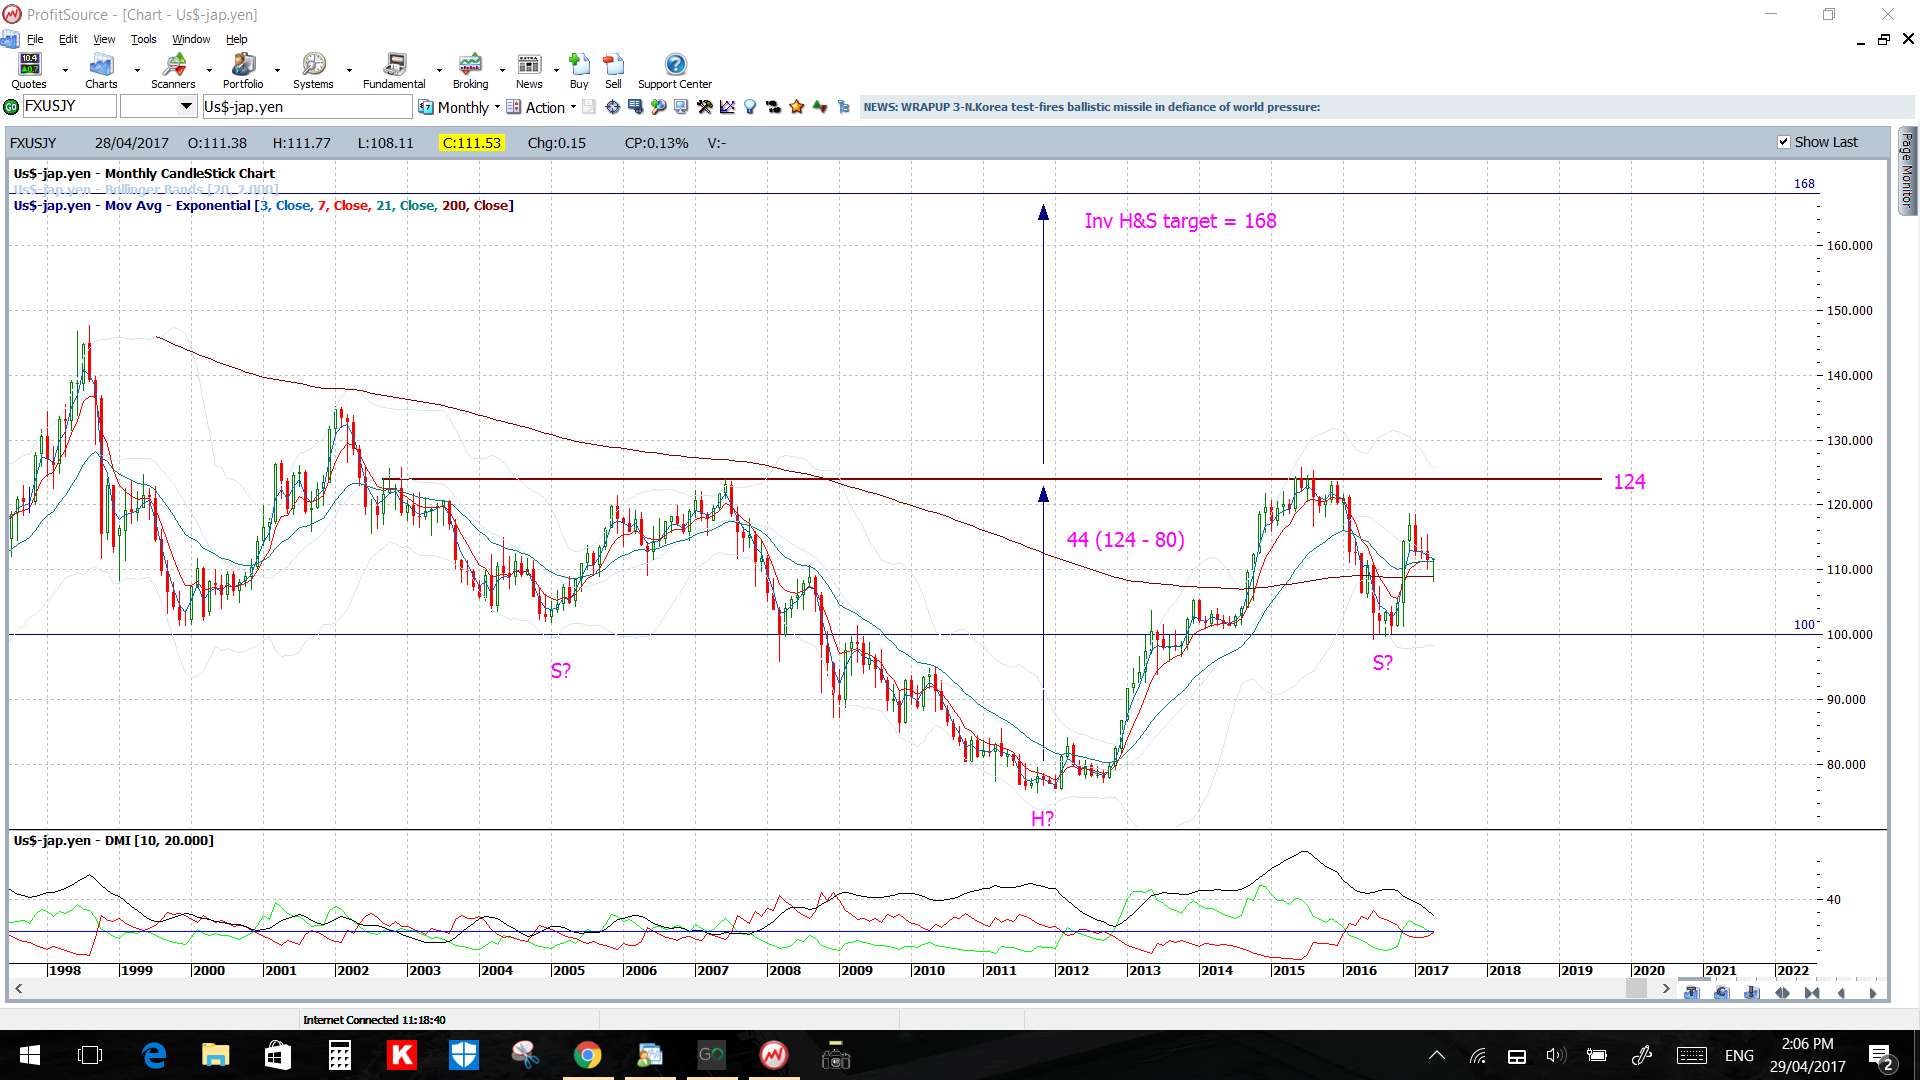
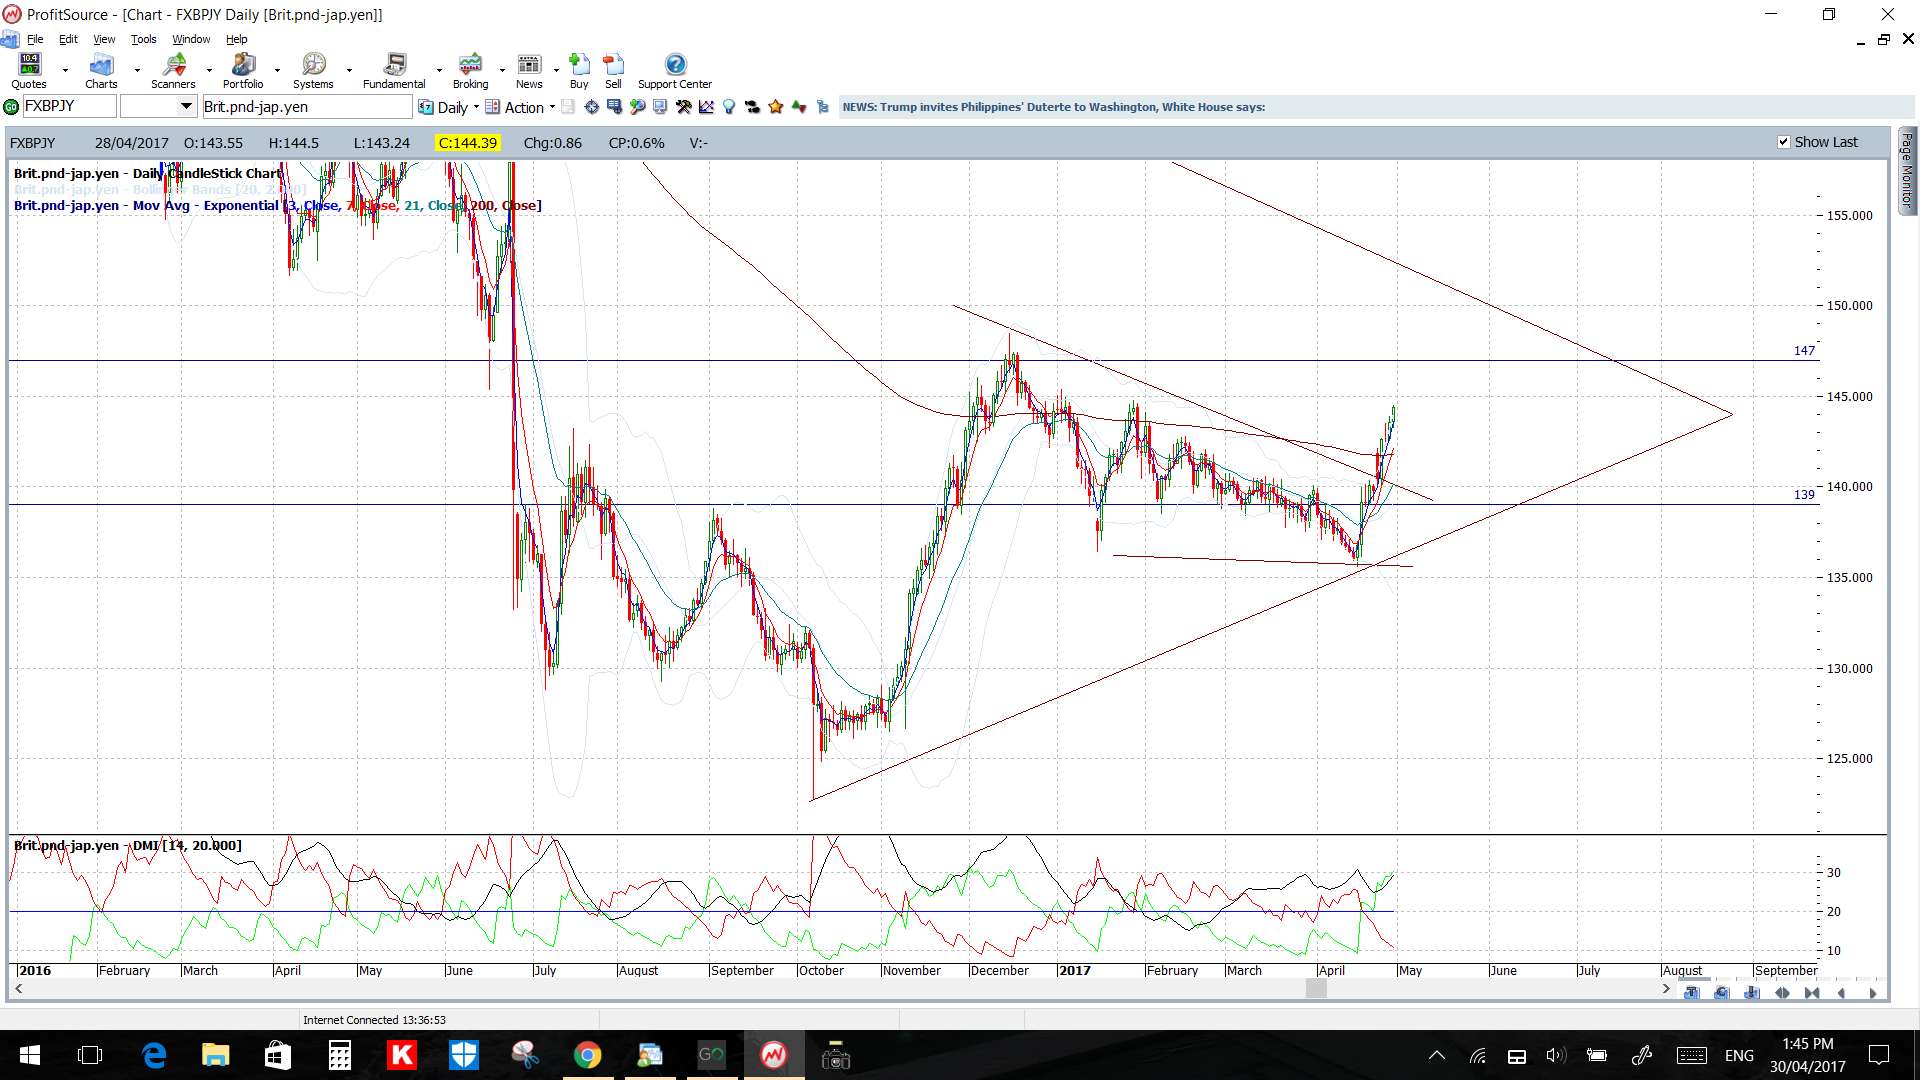
GBP/JPY: Price gapped higher to open for the week and this gap move took the GBP/JPY up through a 4-month bear trend line. The gap has not been filled but the broken trend line region was tested again before a continuation move that went on to give 420 pips.
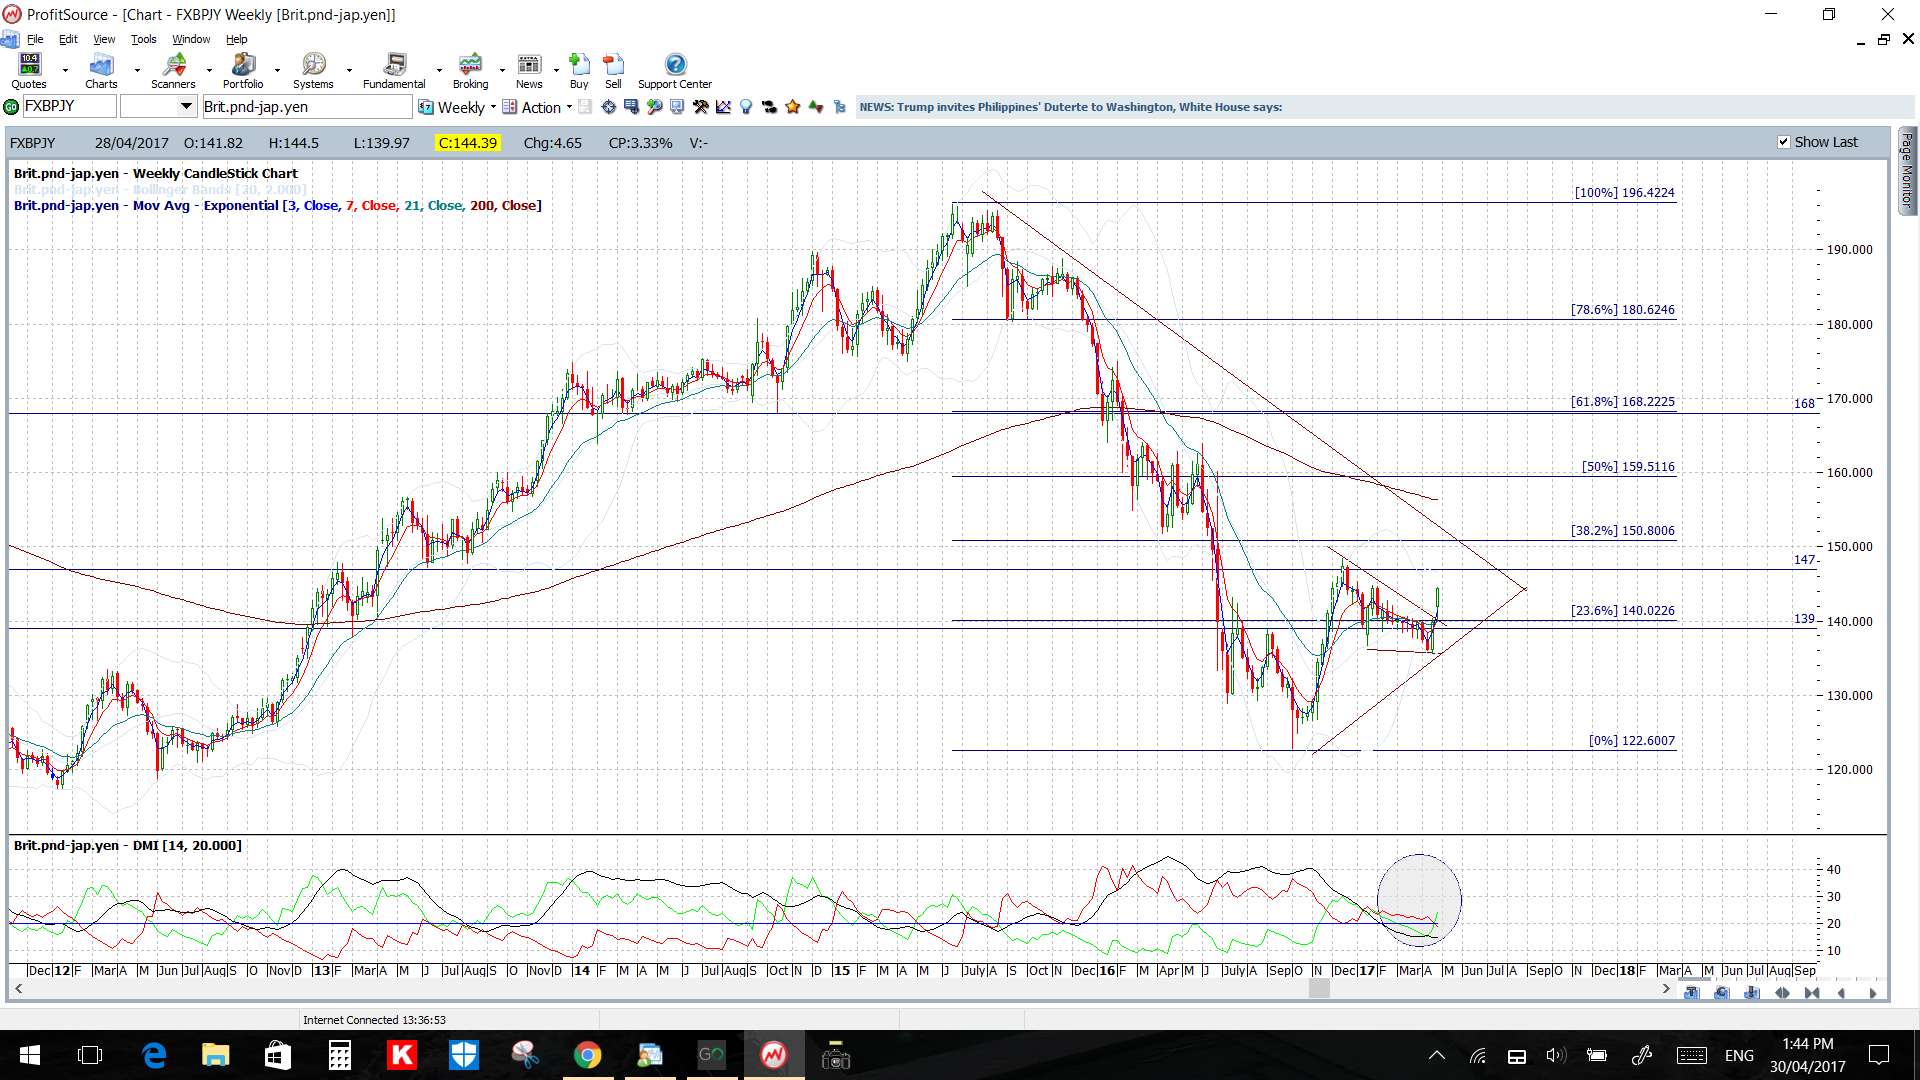
The main story here is that there finally seems to have been a decisive bullish breakout from the 4-month trading channel that I’ve been stalking and this is bringing some previous S/R levels back into focus:
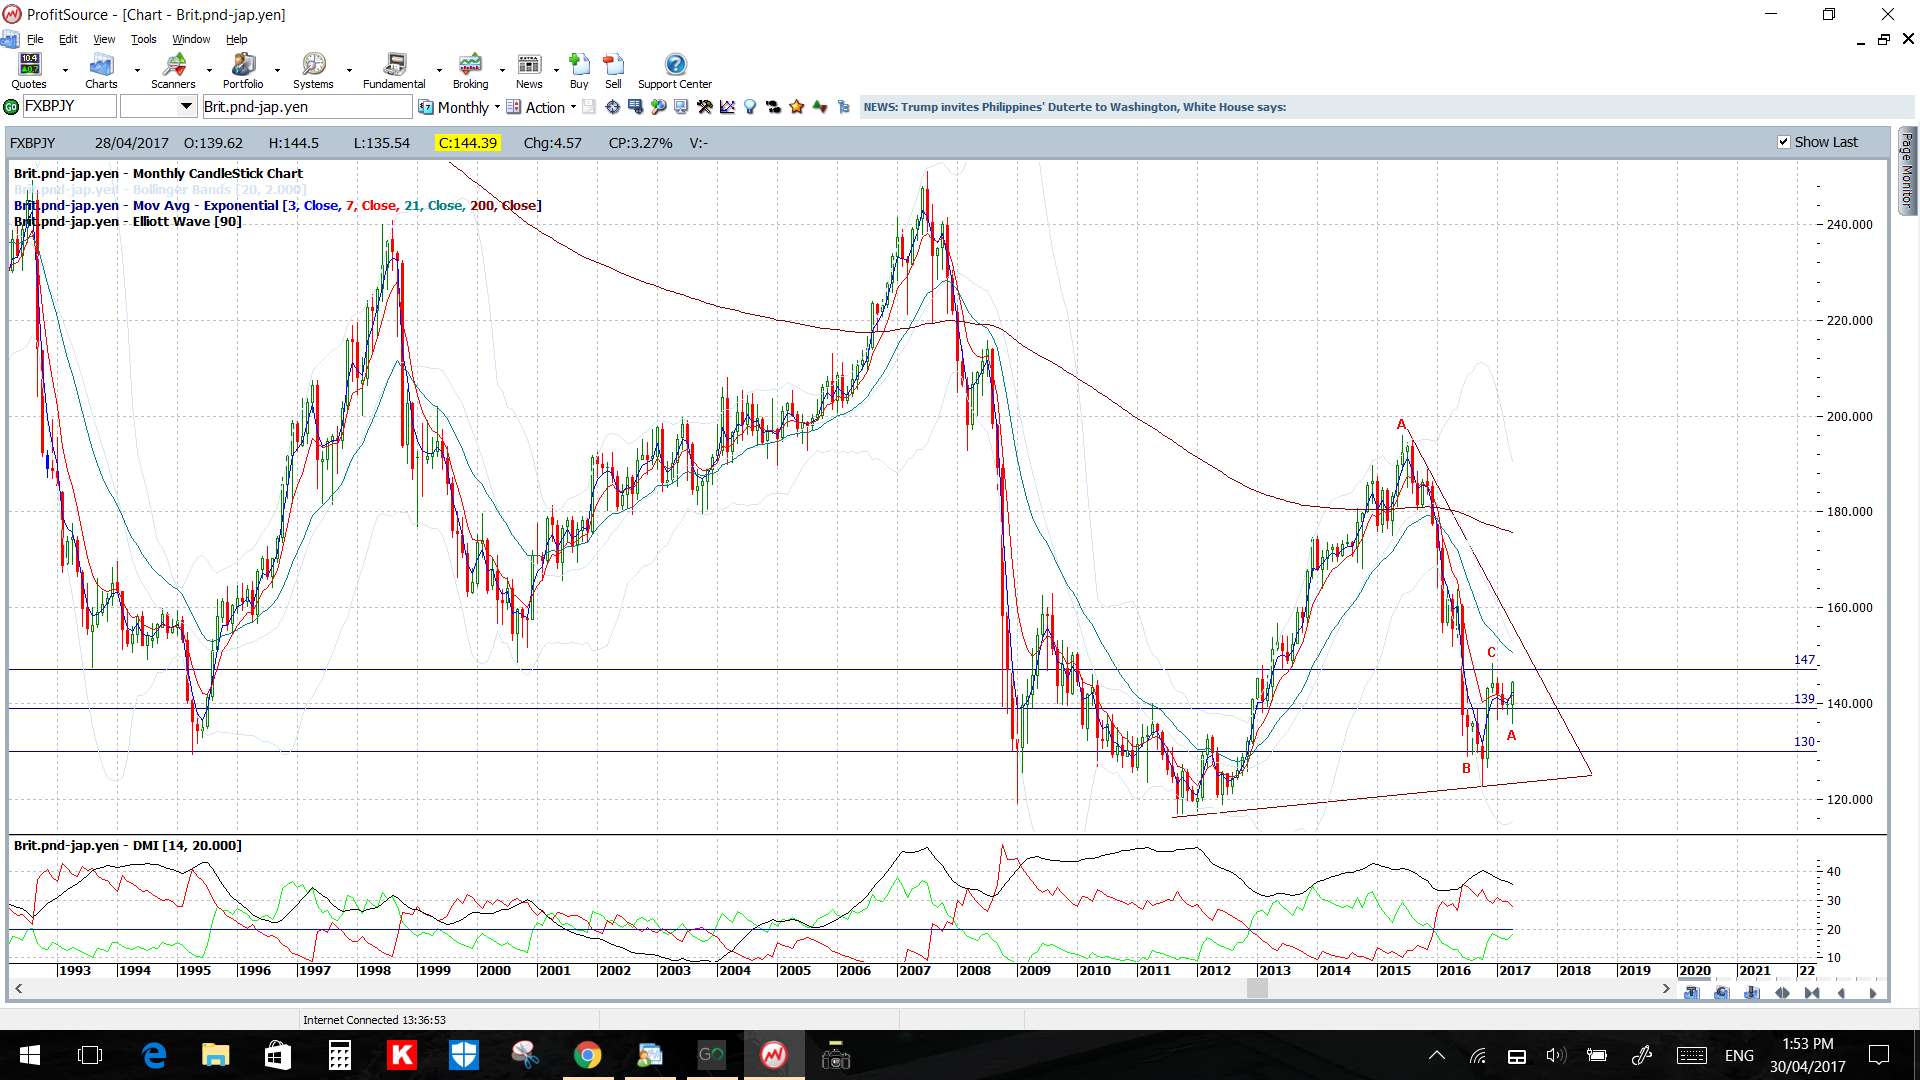
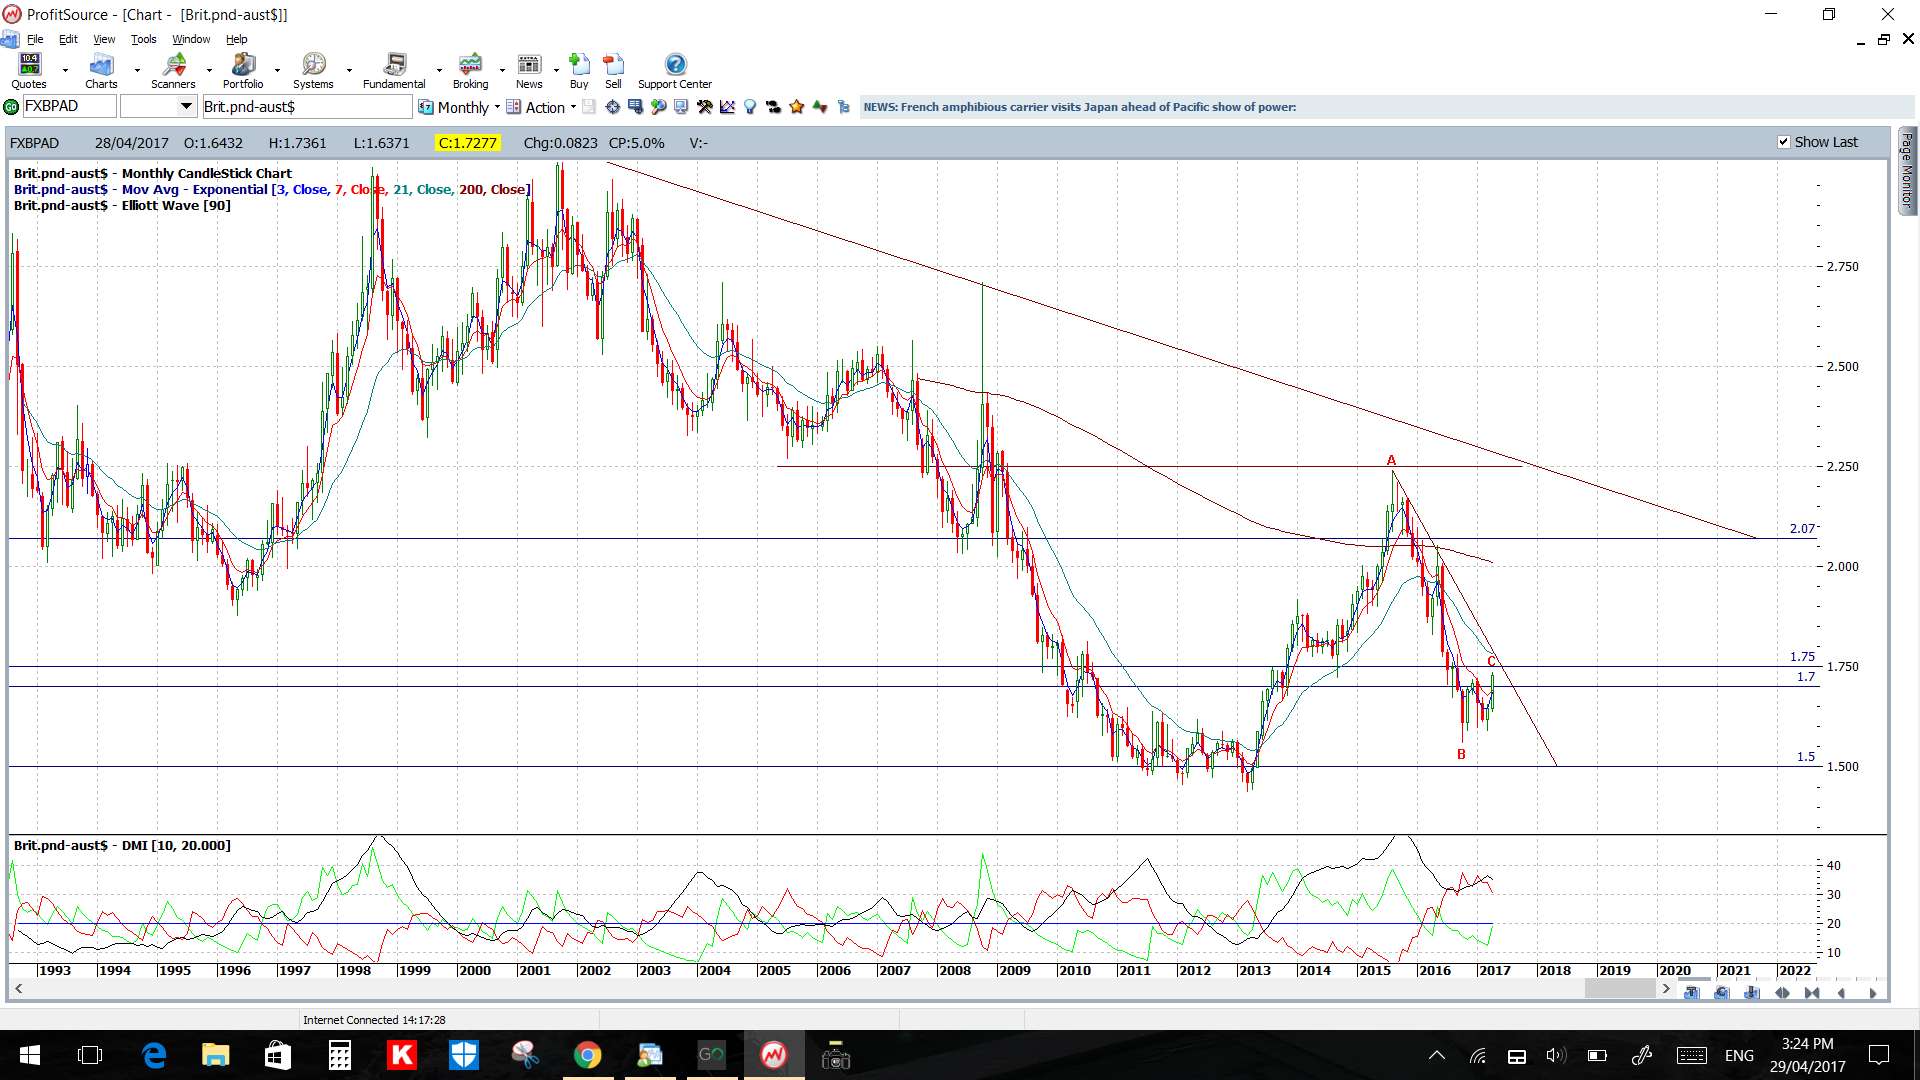
- 147: this is long term S/R and is 250 pips above current price so I’m watching for any test of this key level (see monthly chart).
- 168: this is also previous S/R and happens to be the weekly chart’s 61.8% Fibonacci so might be a target in any continuation move (see weekly chart).
Note the revised triangle trend lines on the monthly/weekly/daily charts. This will bring another bear trend line into focus if the there is any bullish break up through the 147 level.
Price is above the 4hr and daily Cloud.
The weekly and monthly candles were bullish.
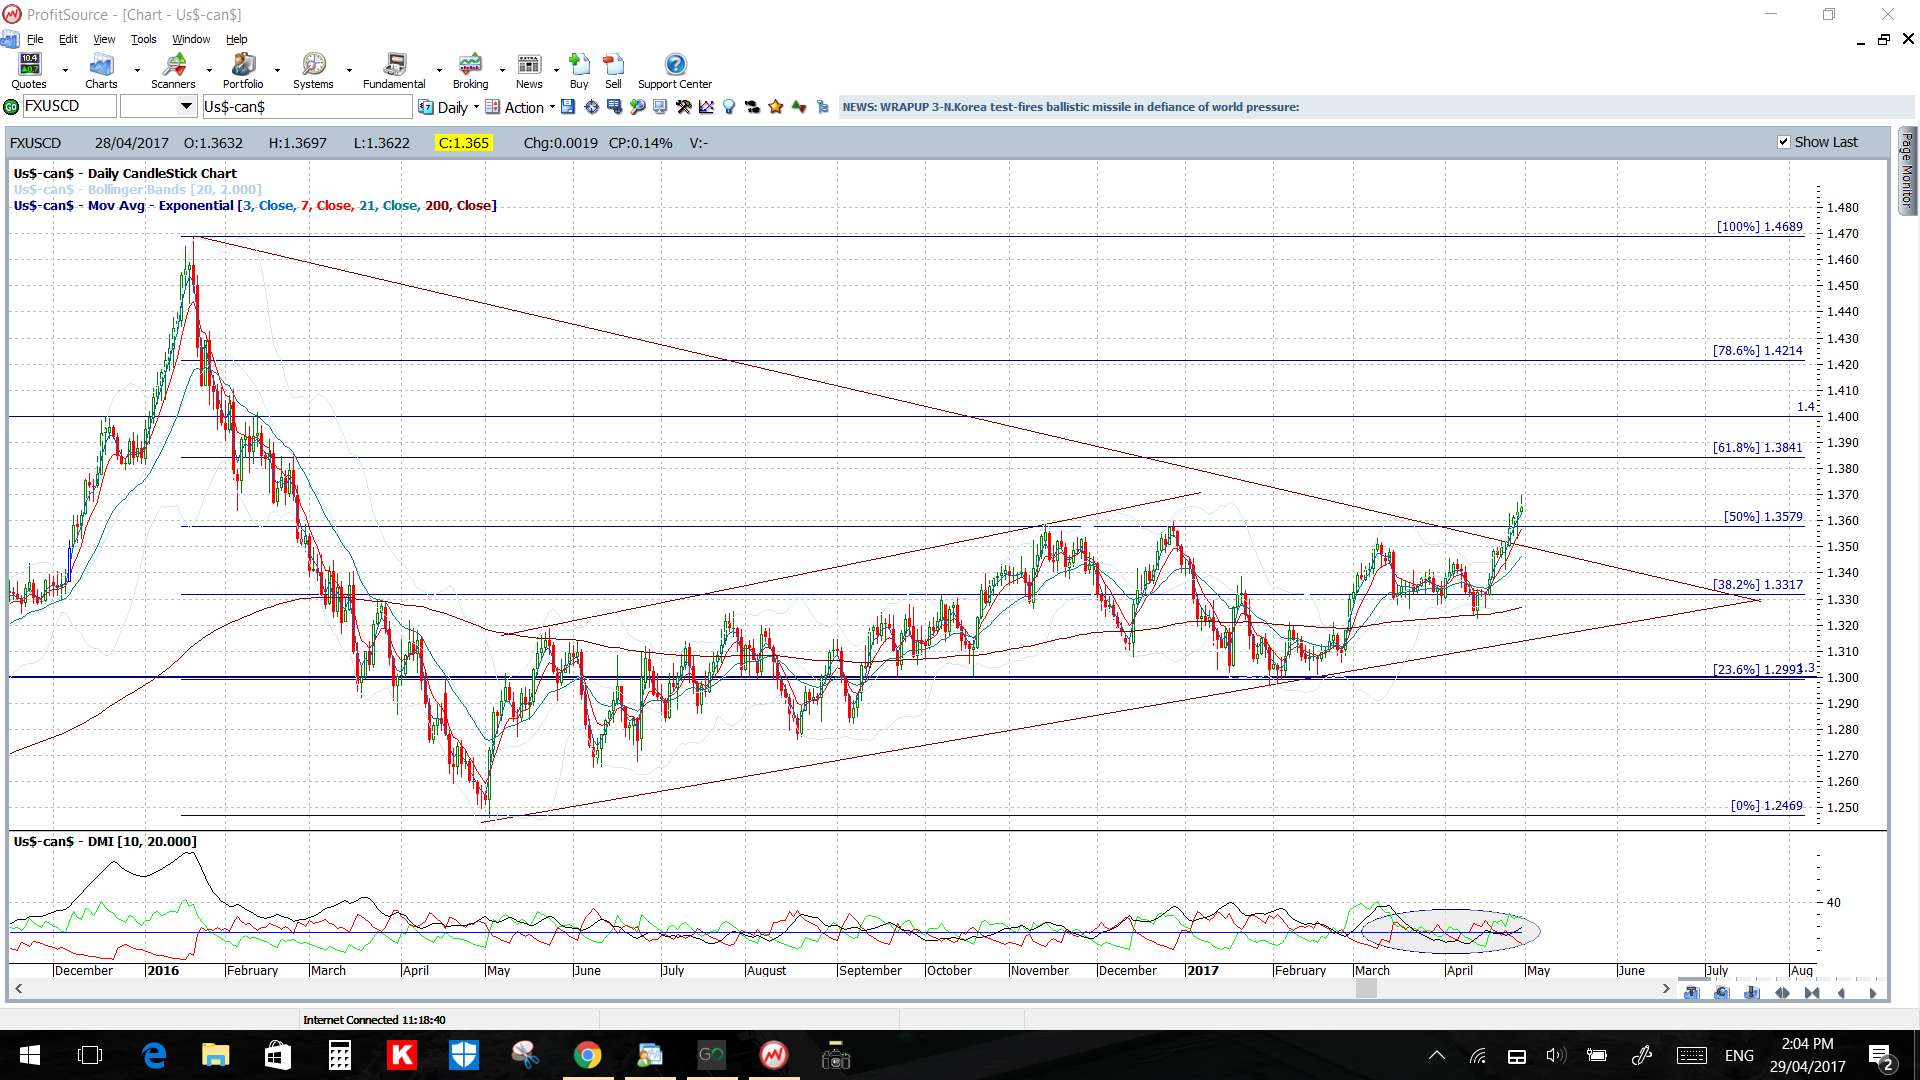
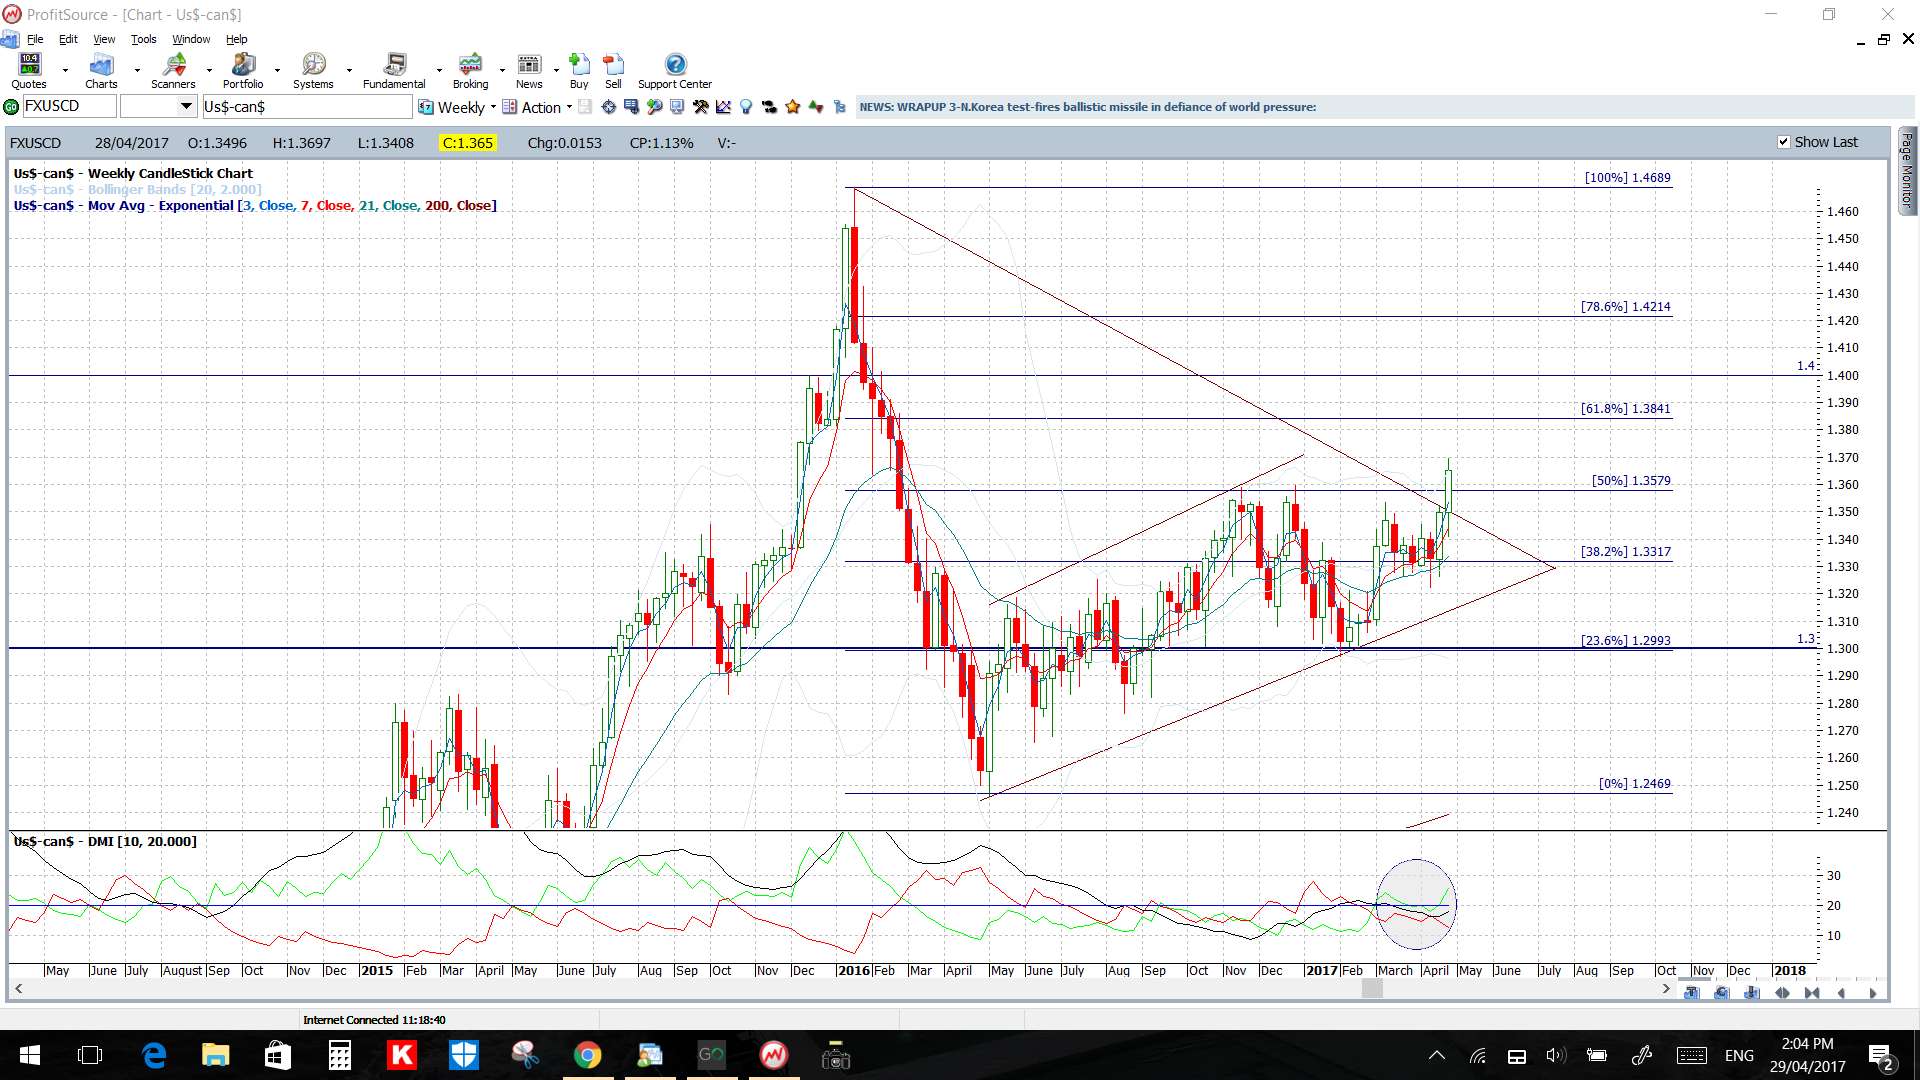
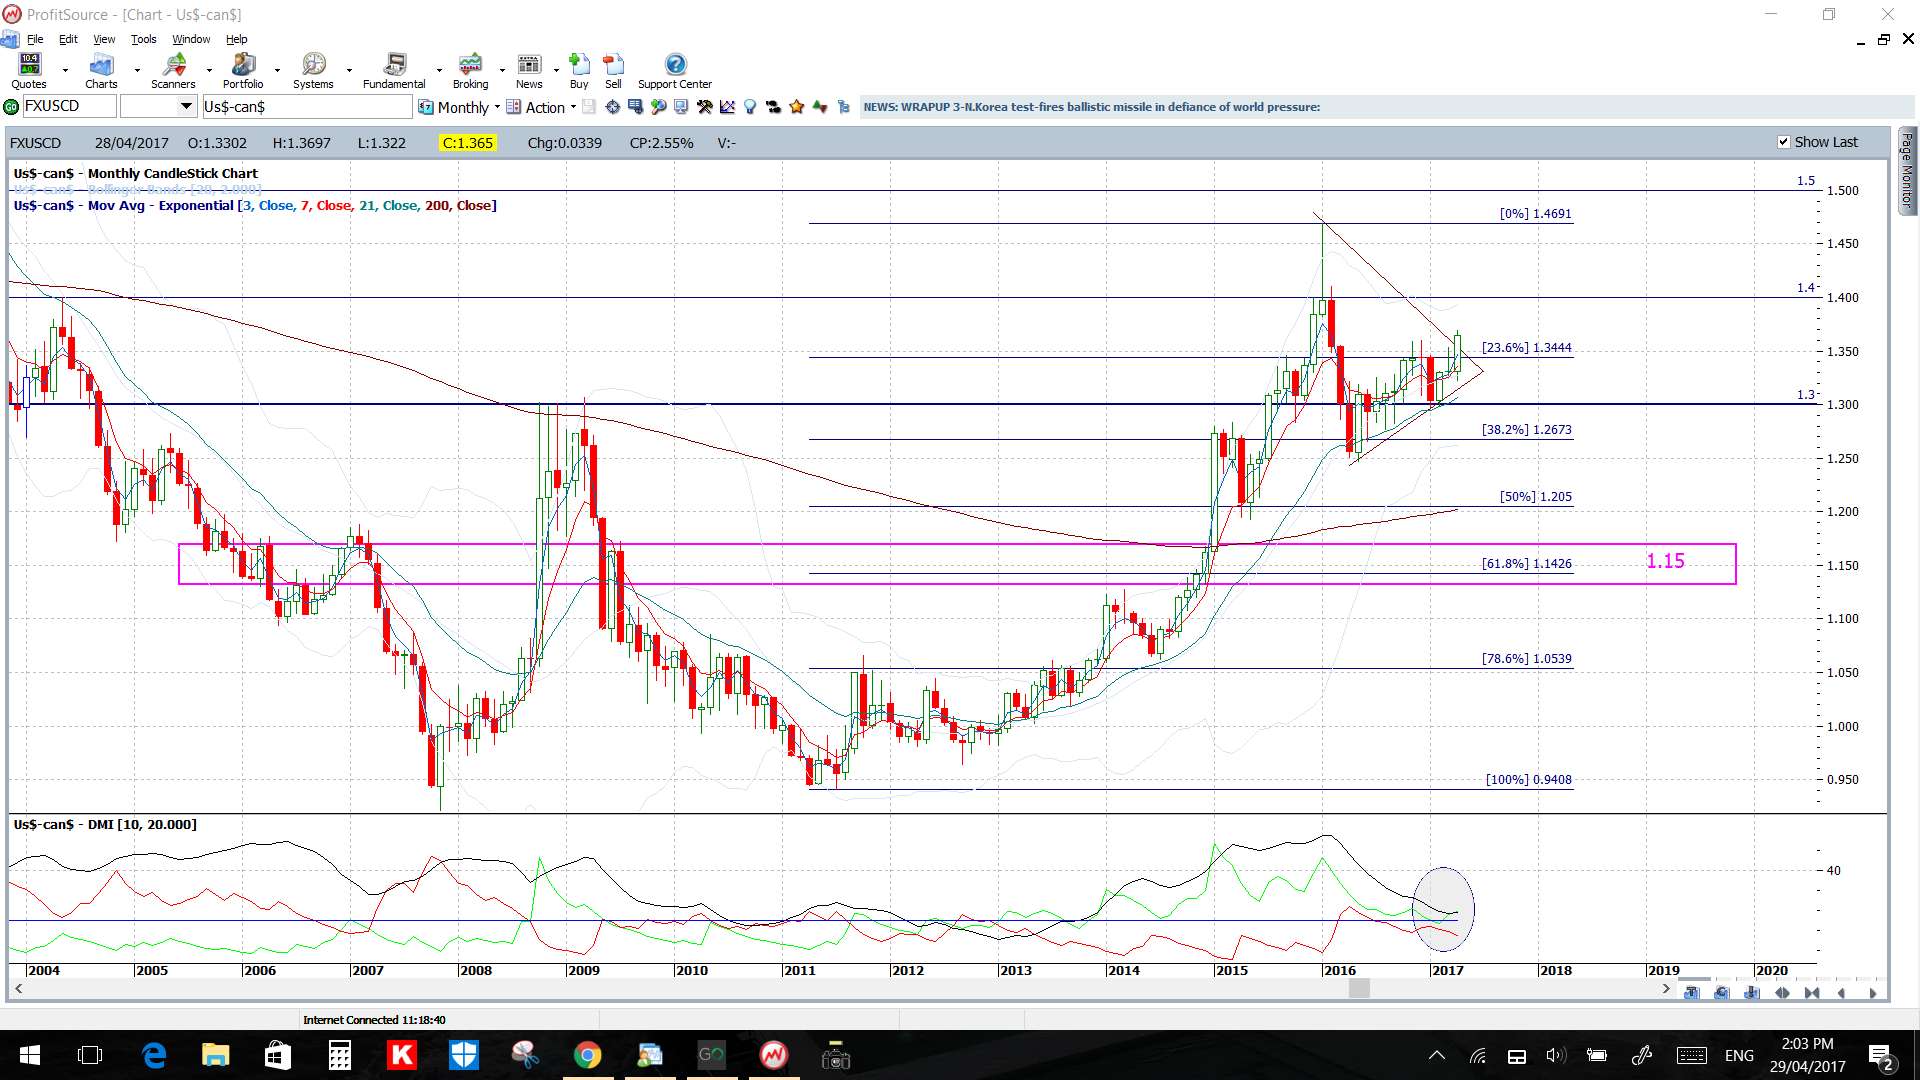
USD/CAD: The monthly bear trend line has been broken again but I remain cautious here in case the US$ breaks below its key support trend line AND Oil bounces up from its support trend line.
I do note though that the 1.40 region is long-term S/R and is up near the 61.8% Fibonacci of the weekly chart’s swing low move. So if there is any bullish continuation then I would expect this region could be a target. The 1.30 S/R level below would be the focus of any sustained reversal move.
Price is above the 4hr and daily Cloud.
The weekly and monthly candles were bullish.
There is CAD Trade Balance and Employment data this week as well as impact from US data and the ongoing NAFTA debate.
GBP/AUD: This pair gave a great trend line breakout trade last week and the bullish move is now bringing the 1.75 S/R region back into focus. The 1.75 is about 180 pips above current price and I would expect this major level might be tested so watch this level for any make or breakactivity. Any bearish retreat from here would have me using the 4hr chart’s Fibonacci levels as a guide for potential pullback targets.
It is worth keeping in mind that price action is forming up within a triangle on the weekly time frame and the bear trend line above has been in play for over 20 months and technical breakout theory suggests the triangle would be worth 4,250 pips.
Price is above the 4hr and daily Cloud.
The weekly and monthly candles were bullish.
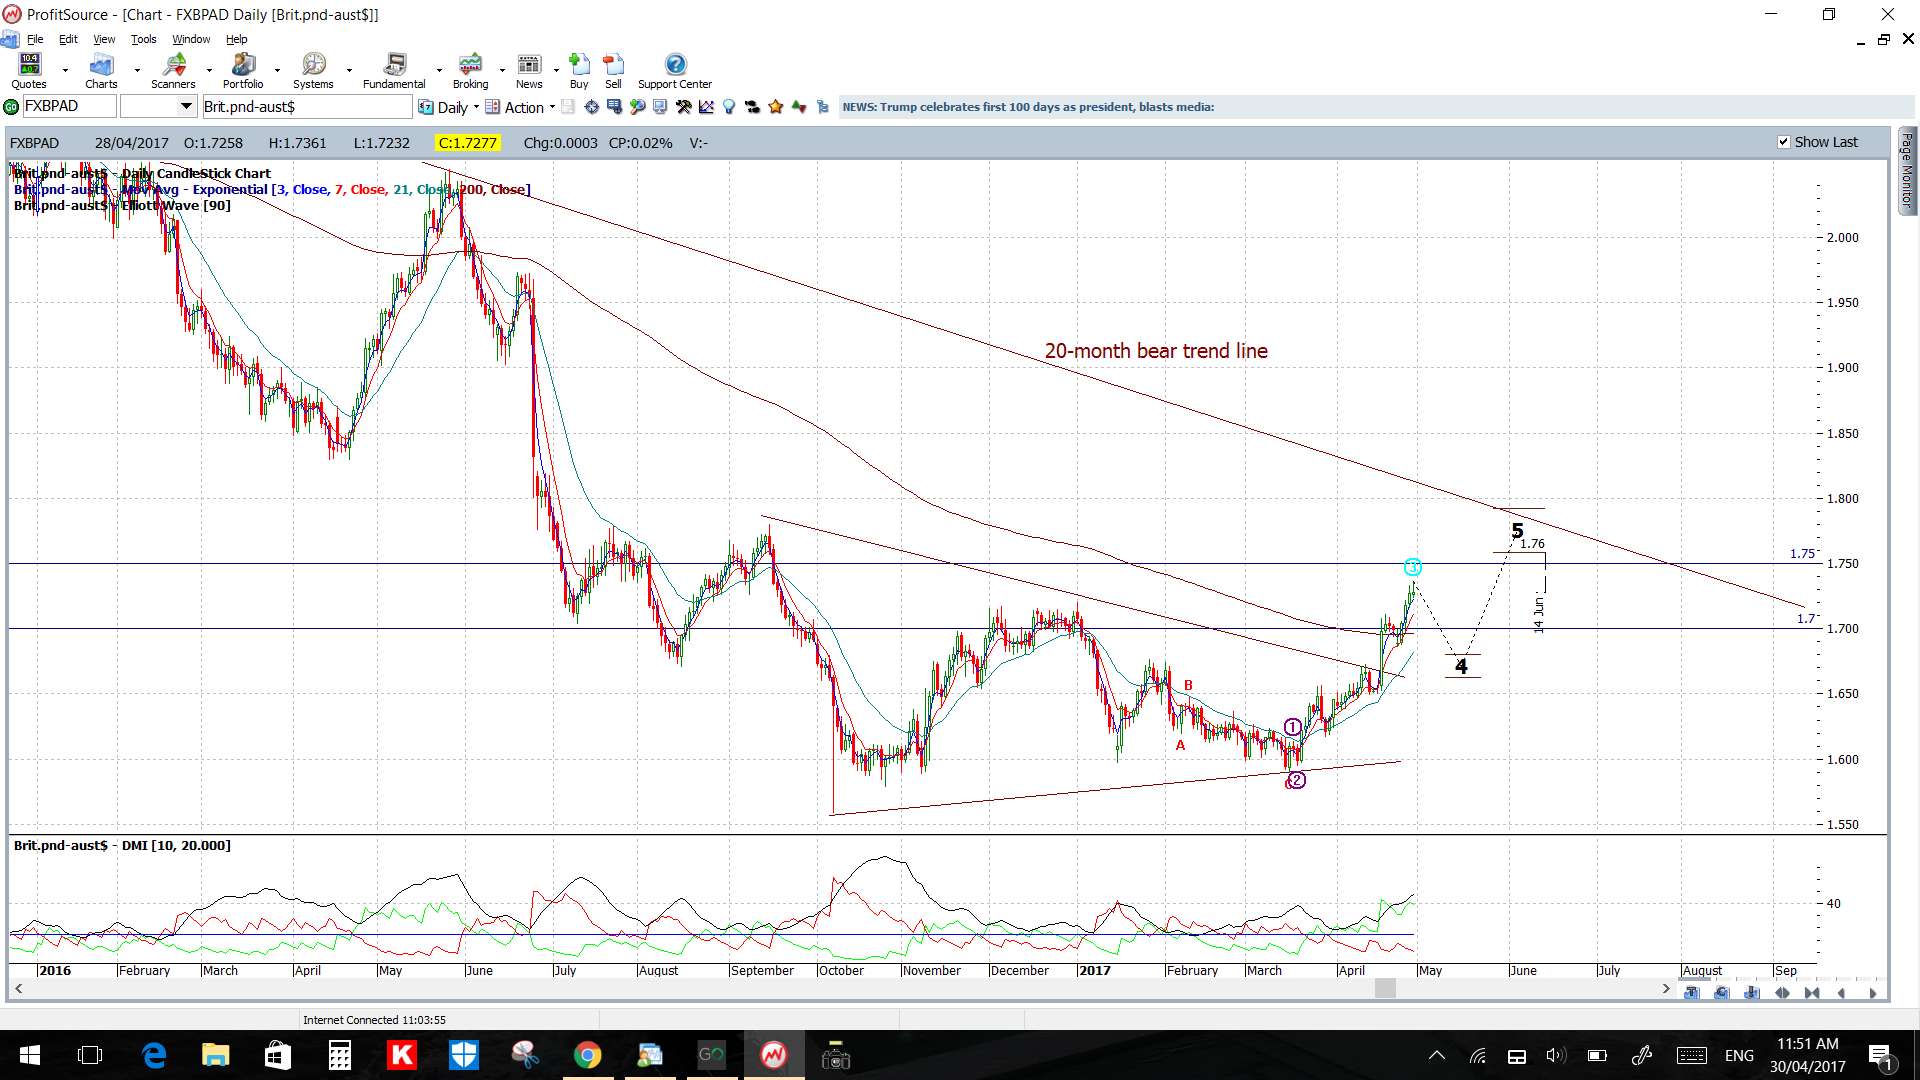
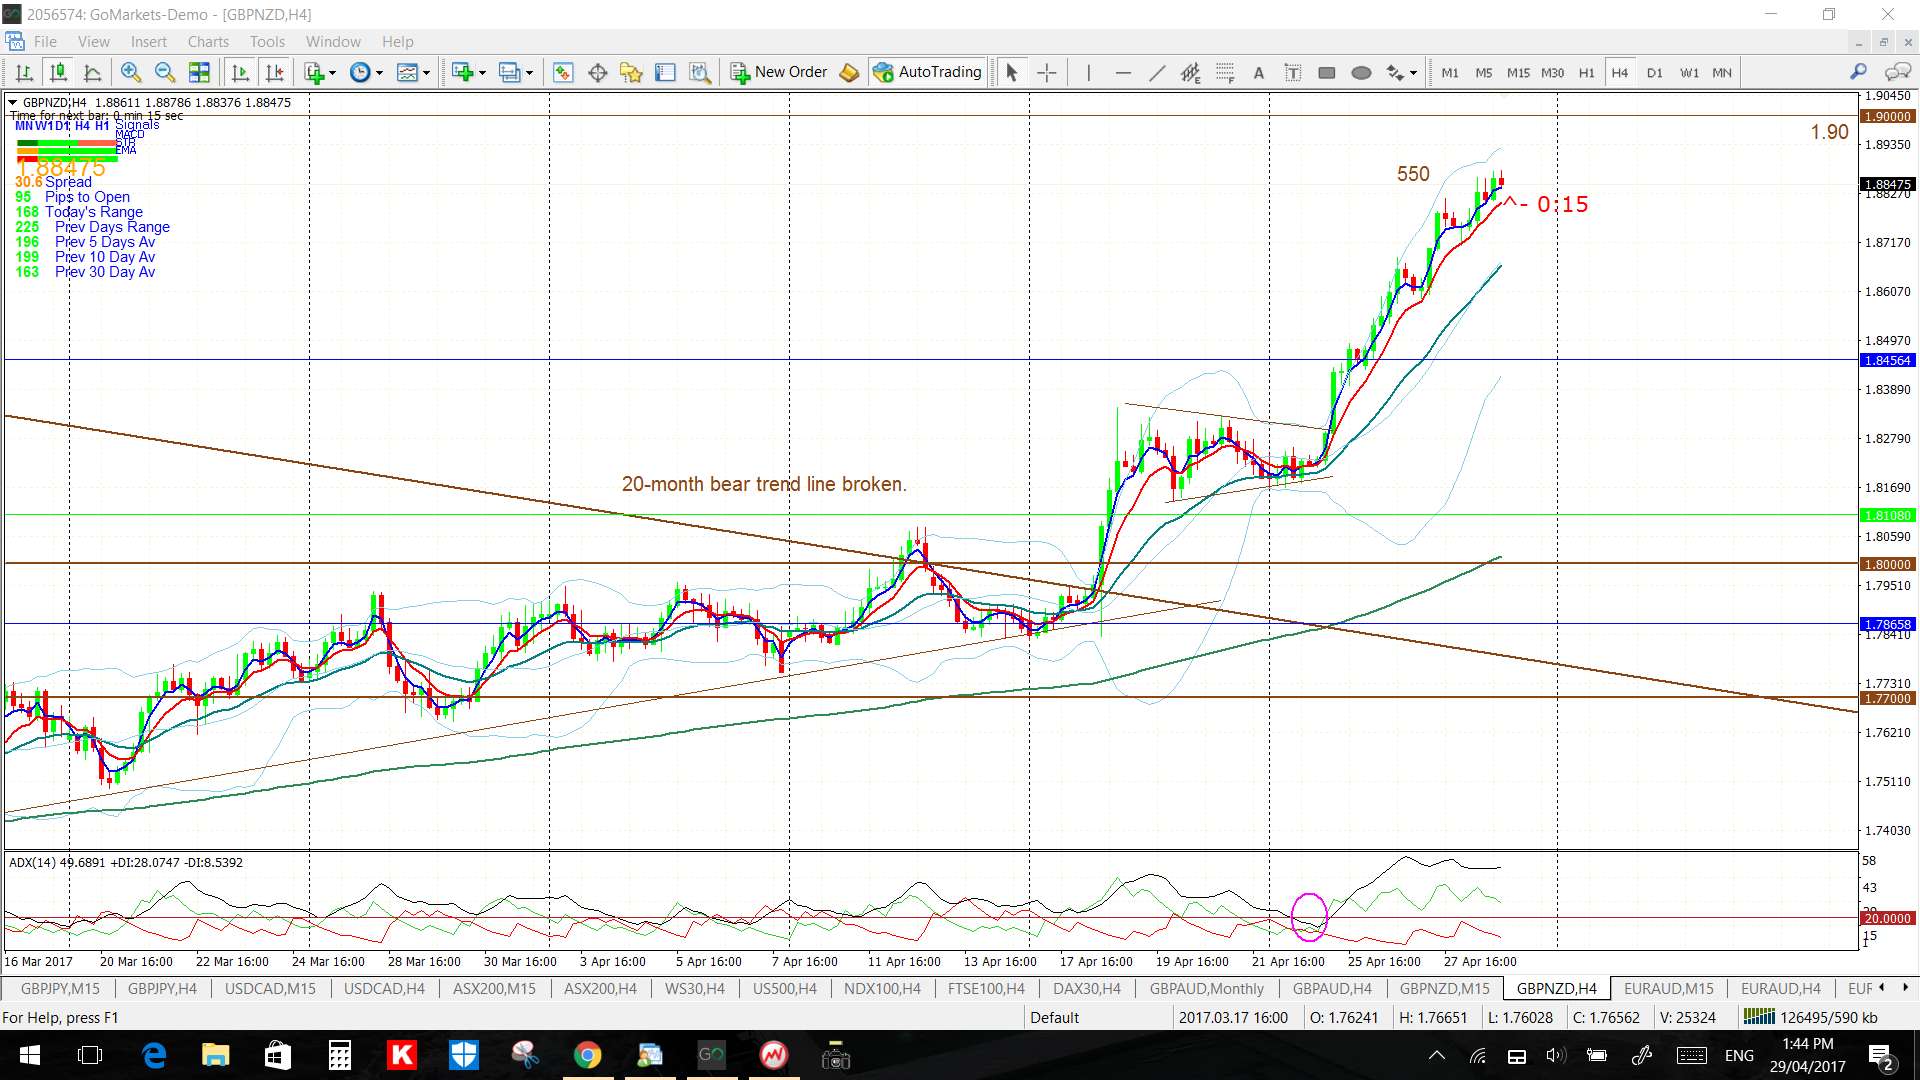
GBP/NZD: The GBP/NZD broke up through a 20-month bear trend line two weeks ago and this breakout move is now up by 950 pips. The obvious best trade here would have been to take this breakout and, then, to stick with it!
Like the GBP/AUD though, this pair gave another smaller, but also very good, 4hr chart trend line breakout trade last week and the overall bullish run has now brought the 1.90 S/R region back into focus. The 1.90 is about 130 pips above current price and I would expect this major level might be tested so watch this level for any make or break activity:
- Any bearish retreat from here would have me using the 4hr chart’s Fibonacci levels as a guide for potential pullback targets.
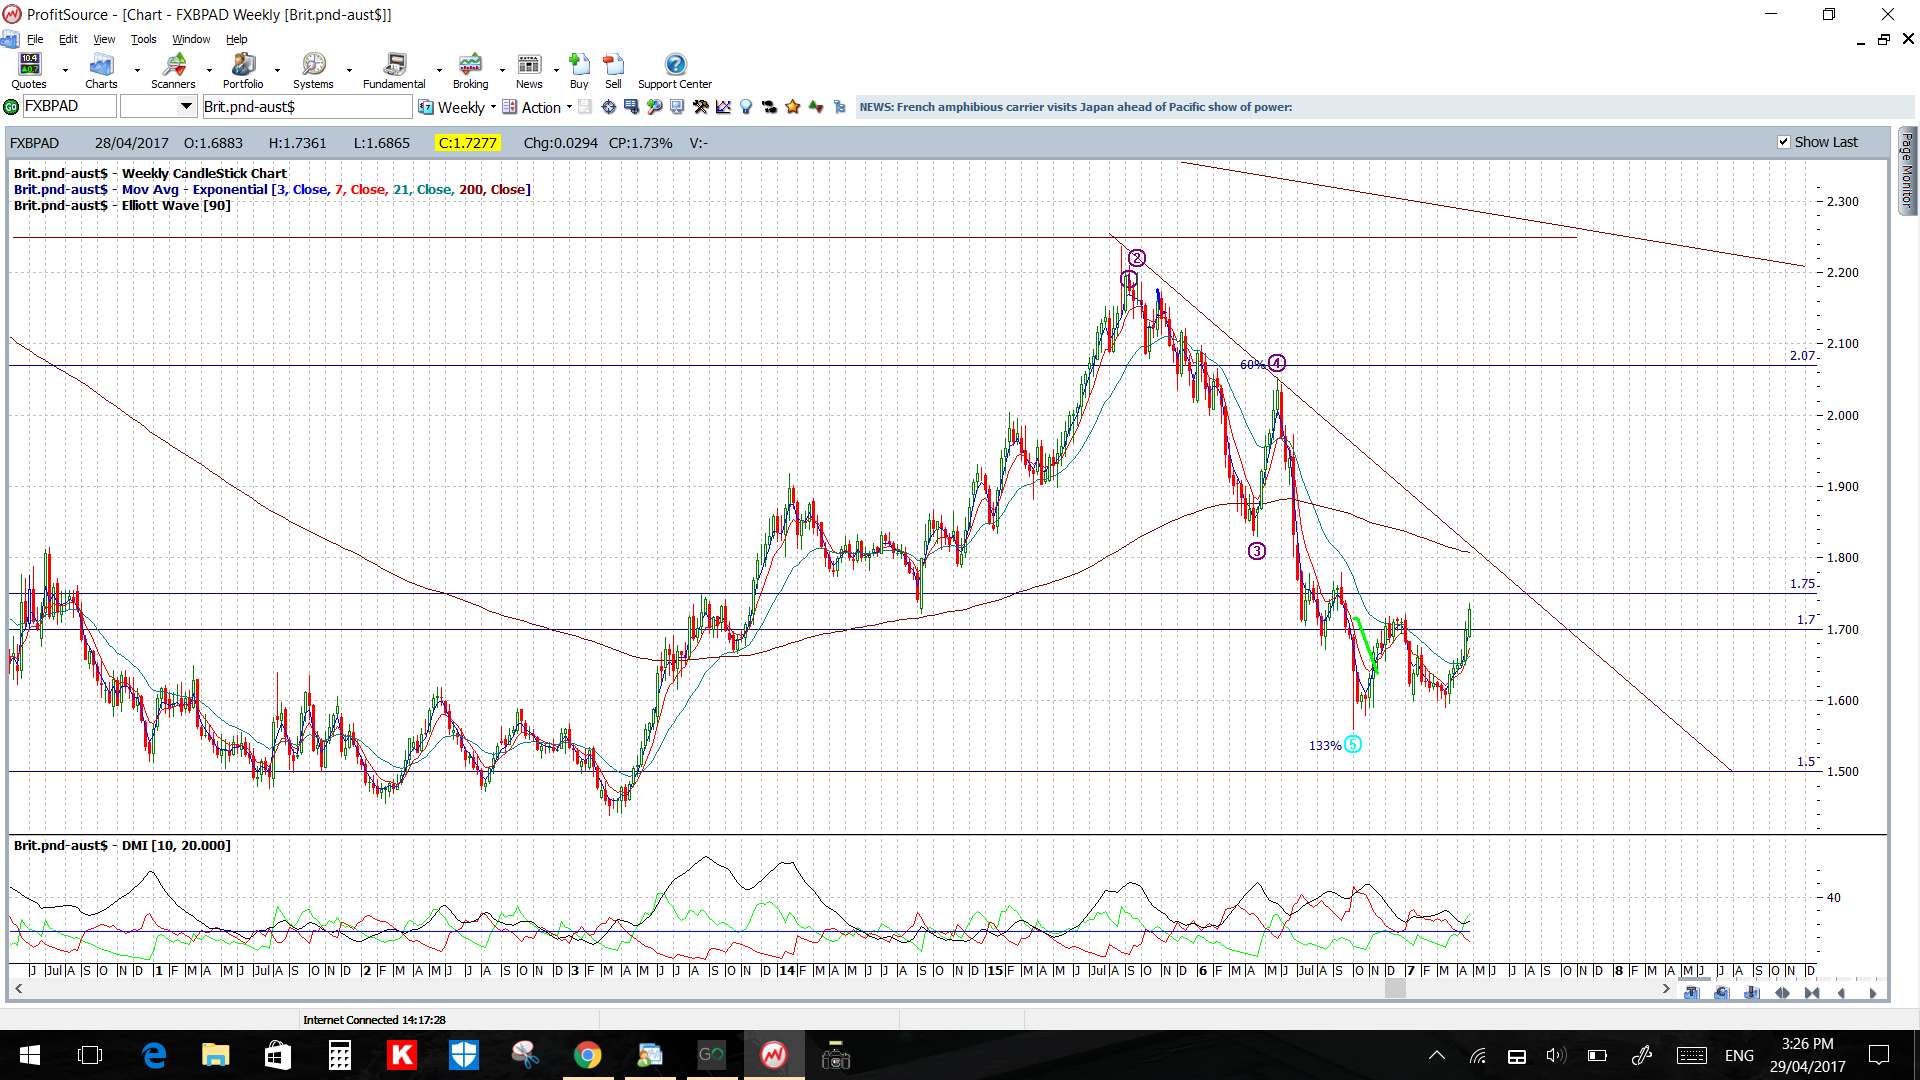
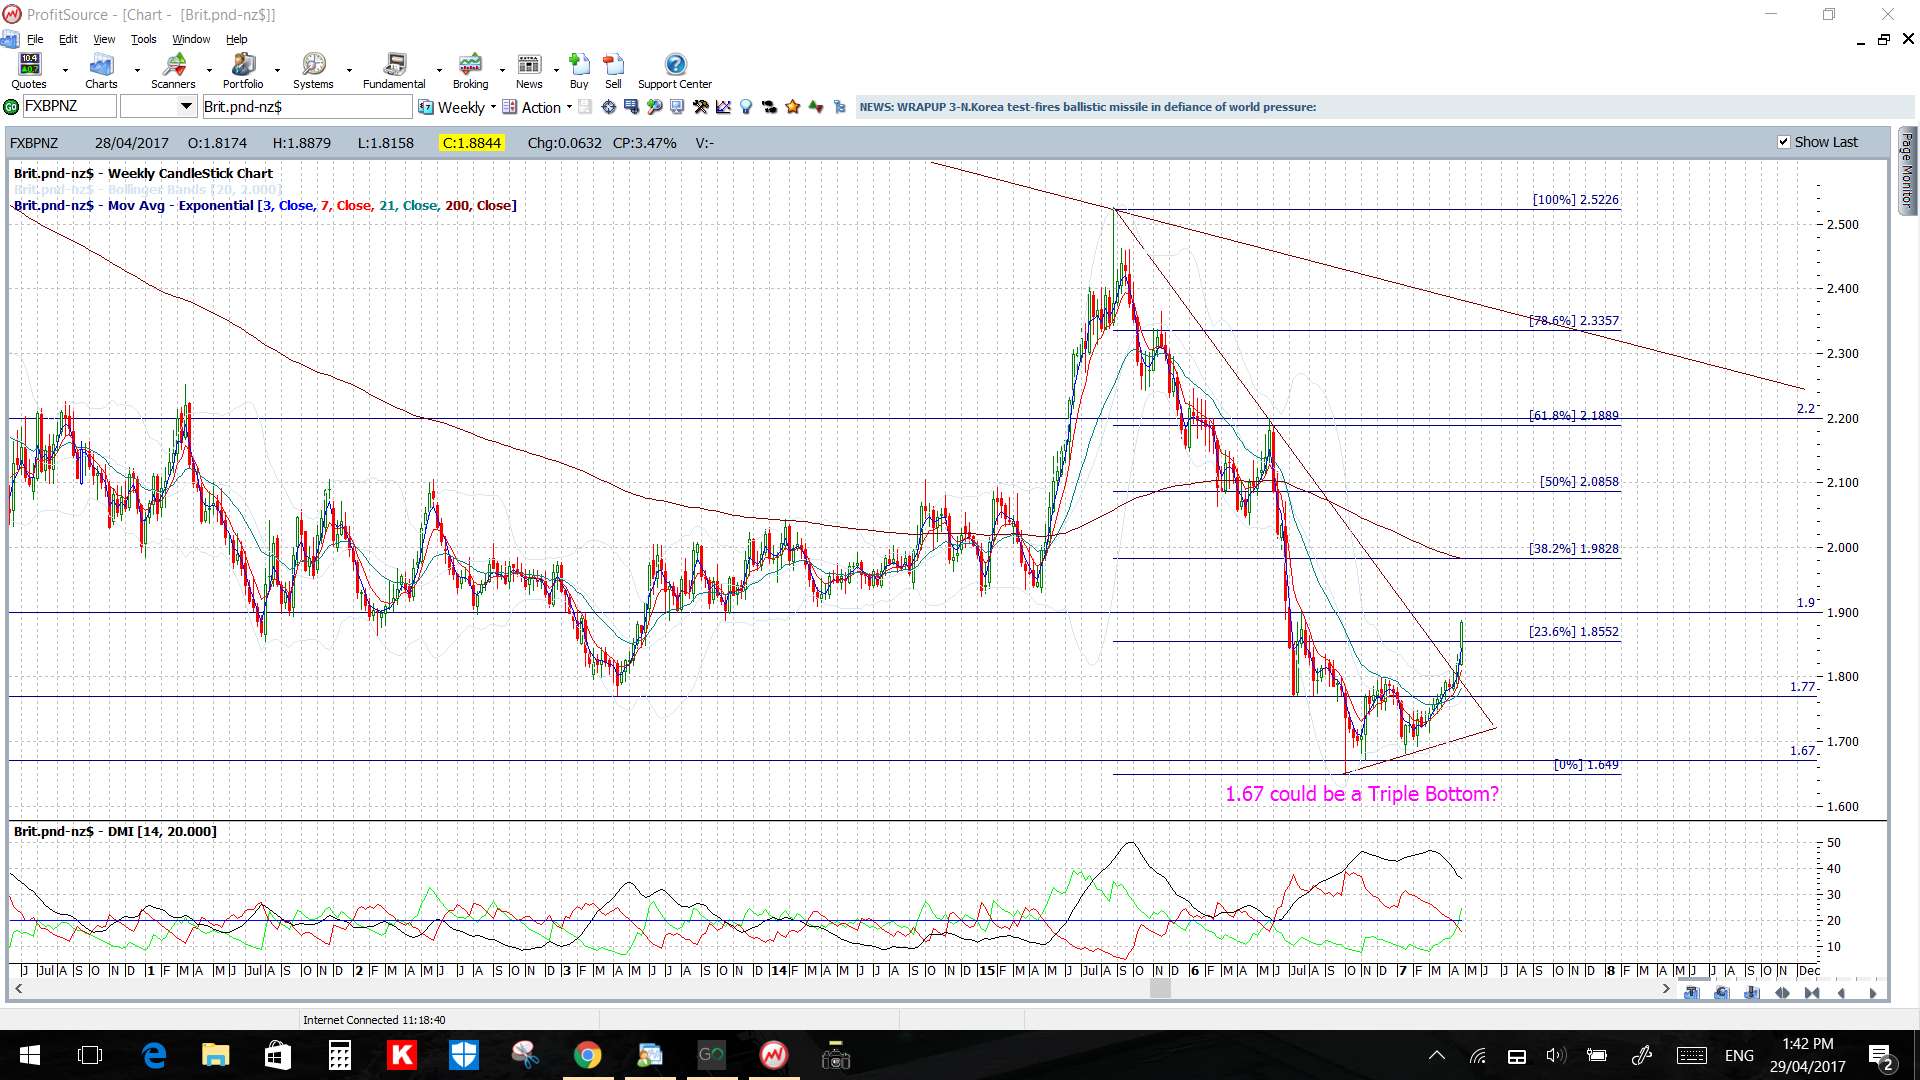
- Any bullish continuation above 1.90 would have me looking to the weekly chart’s 61.8% Fibonacci as this is near previous S/R of 2.20.
Price is above the 4hr and daily Cloud.
The weekly and monthly candles were bullish.
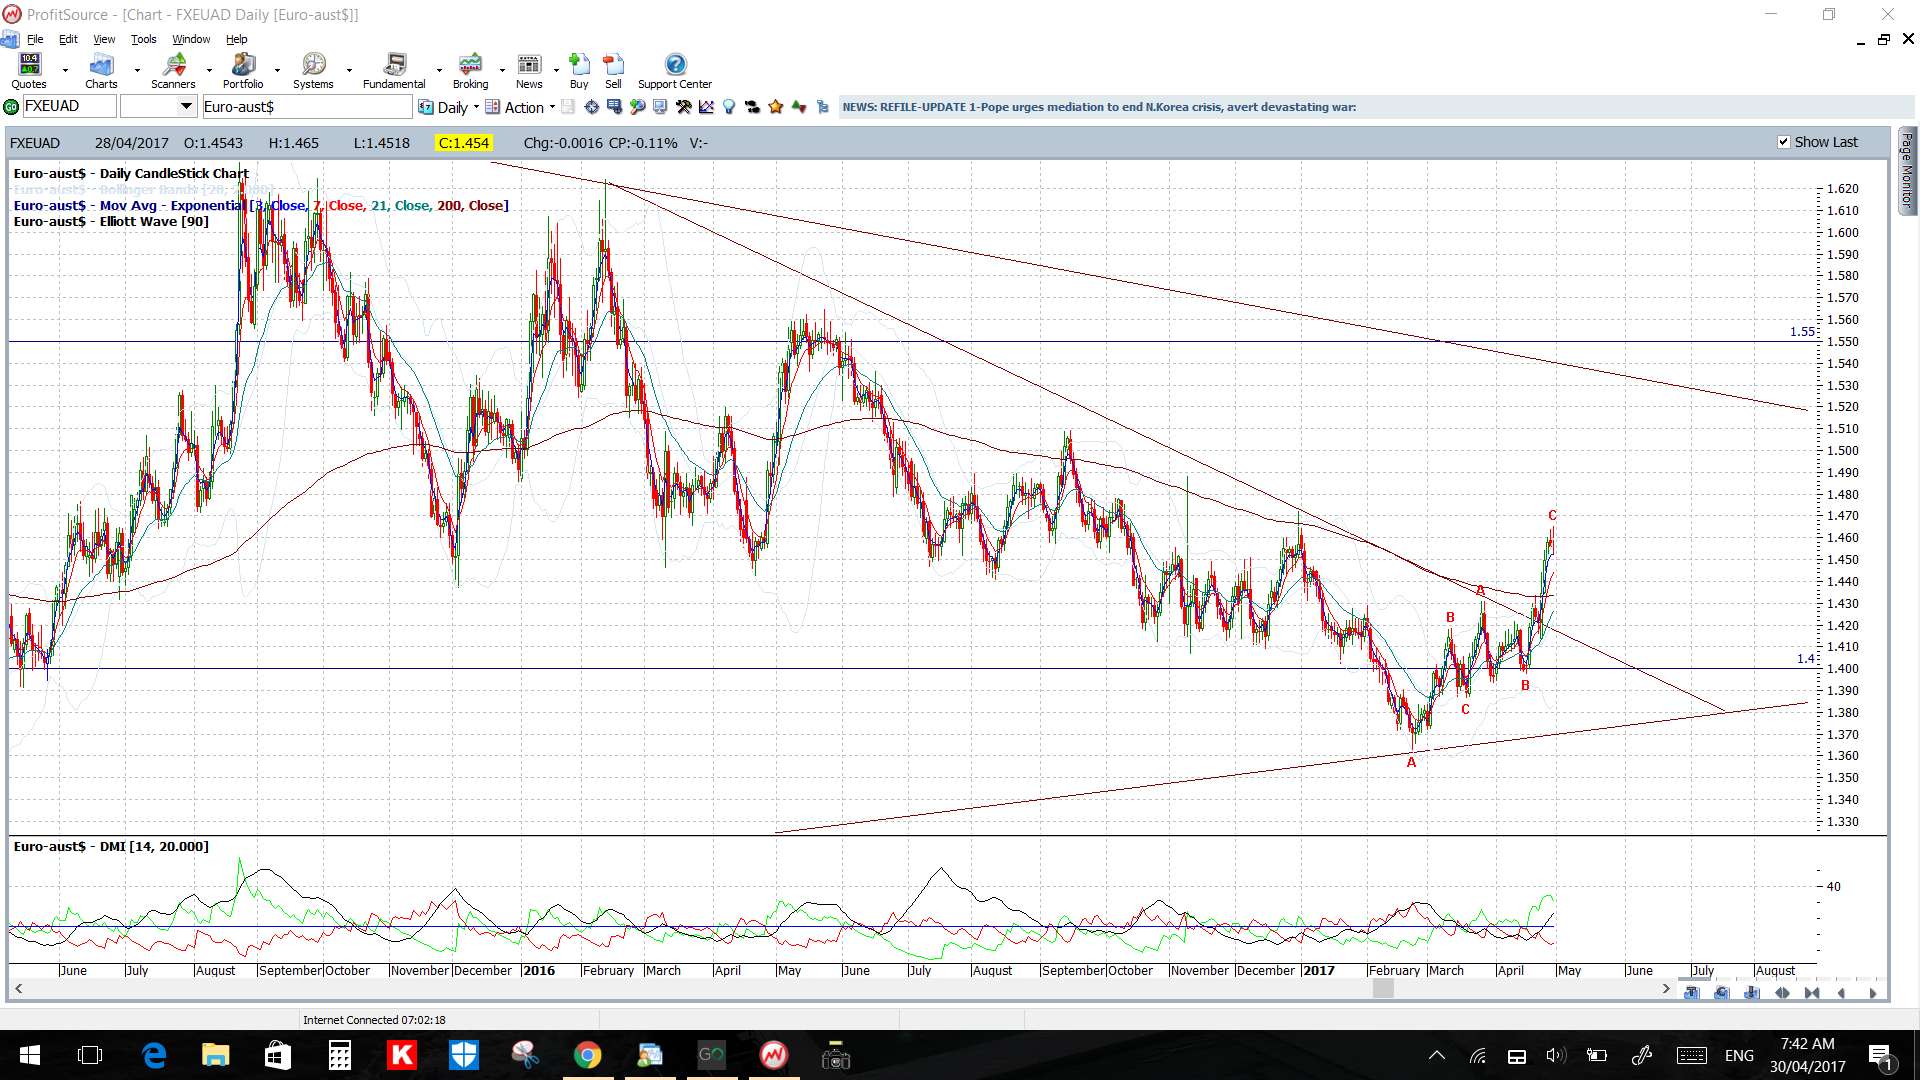
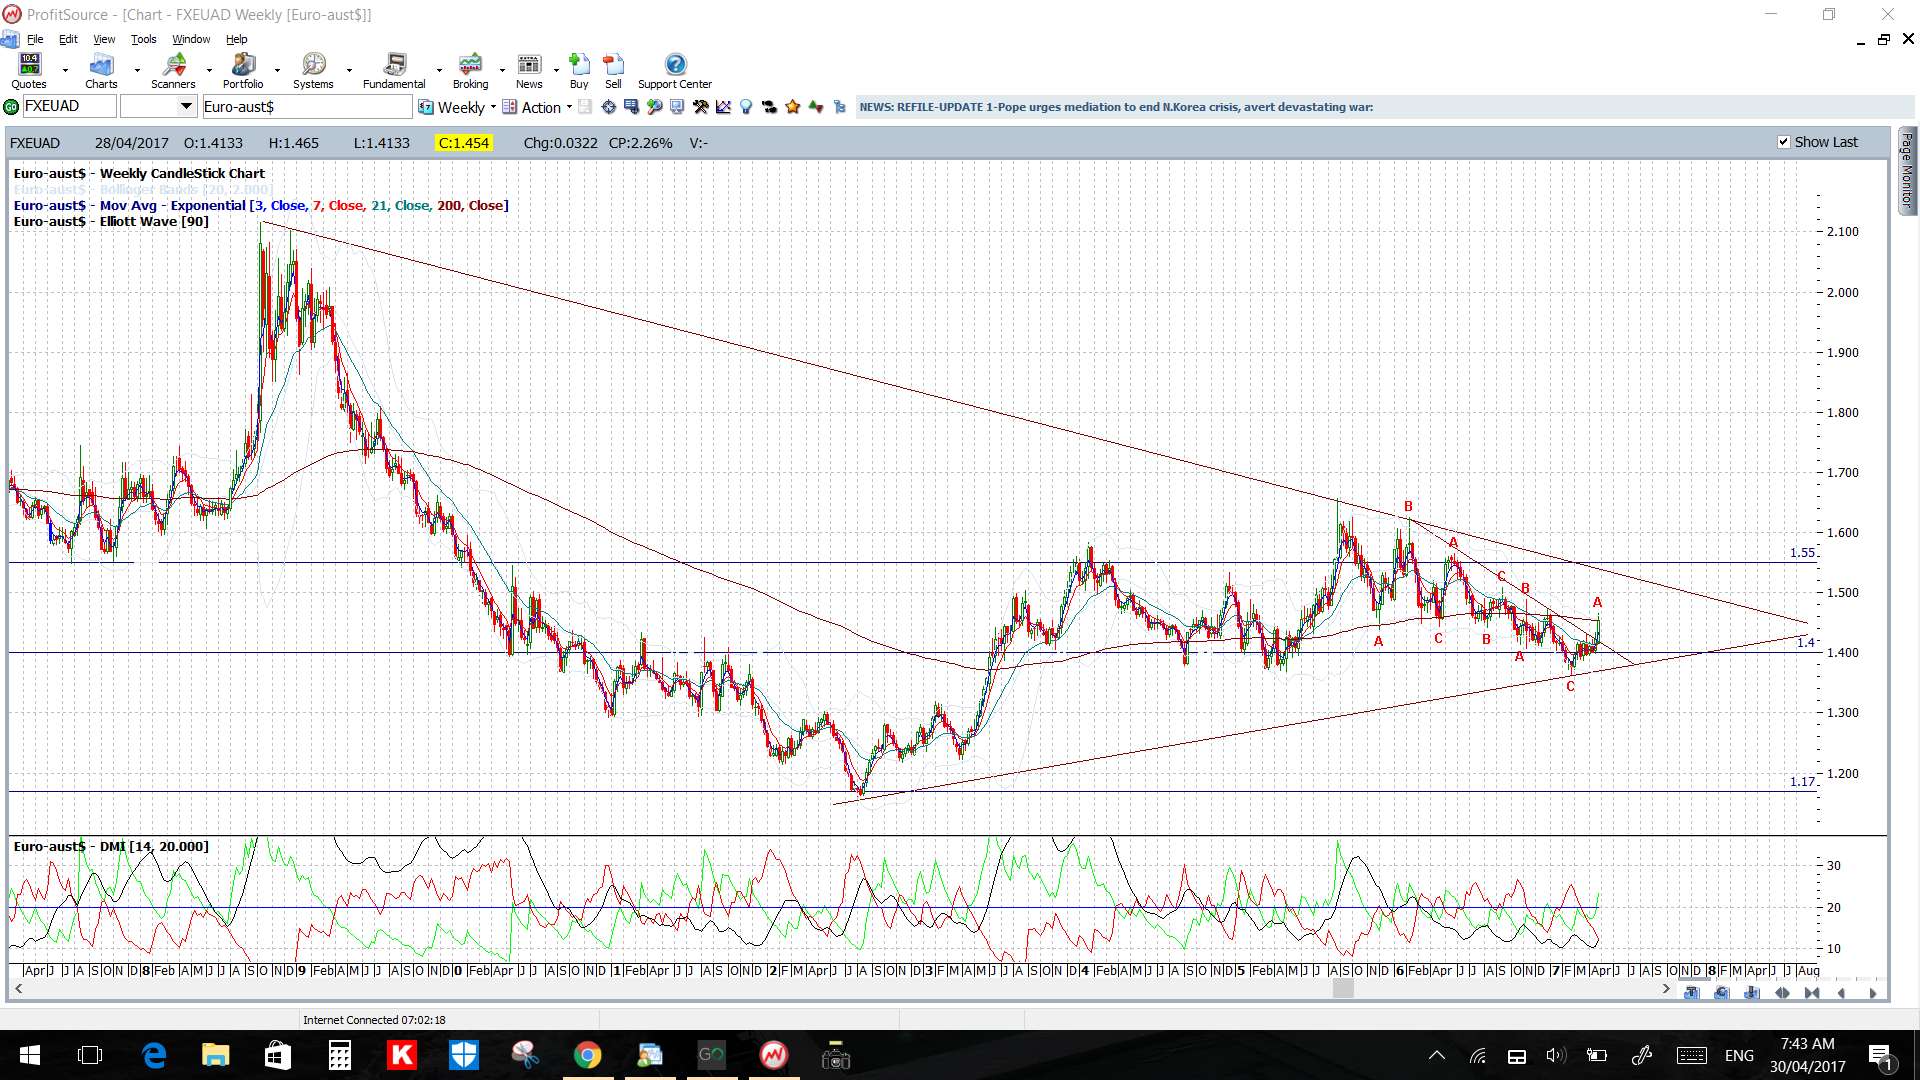
EUR/AUD: Price gapped higher to open for the week and this gap move took the EUR/AUD up through a 15-month bear trend line from the daily chart’s triangle. The gap has not been filled but the broken trend line region was tested again before a continuation move that went on to give 300 pips.
Price action slowed towards the end of the week so there is now a wedge on the 4hr chart to watch for any make or break activity.
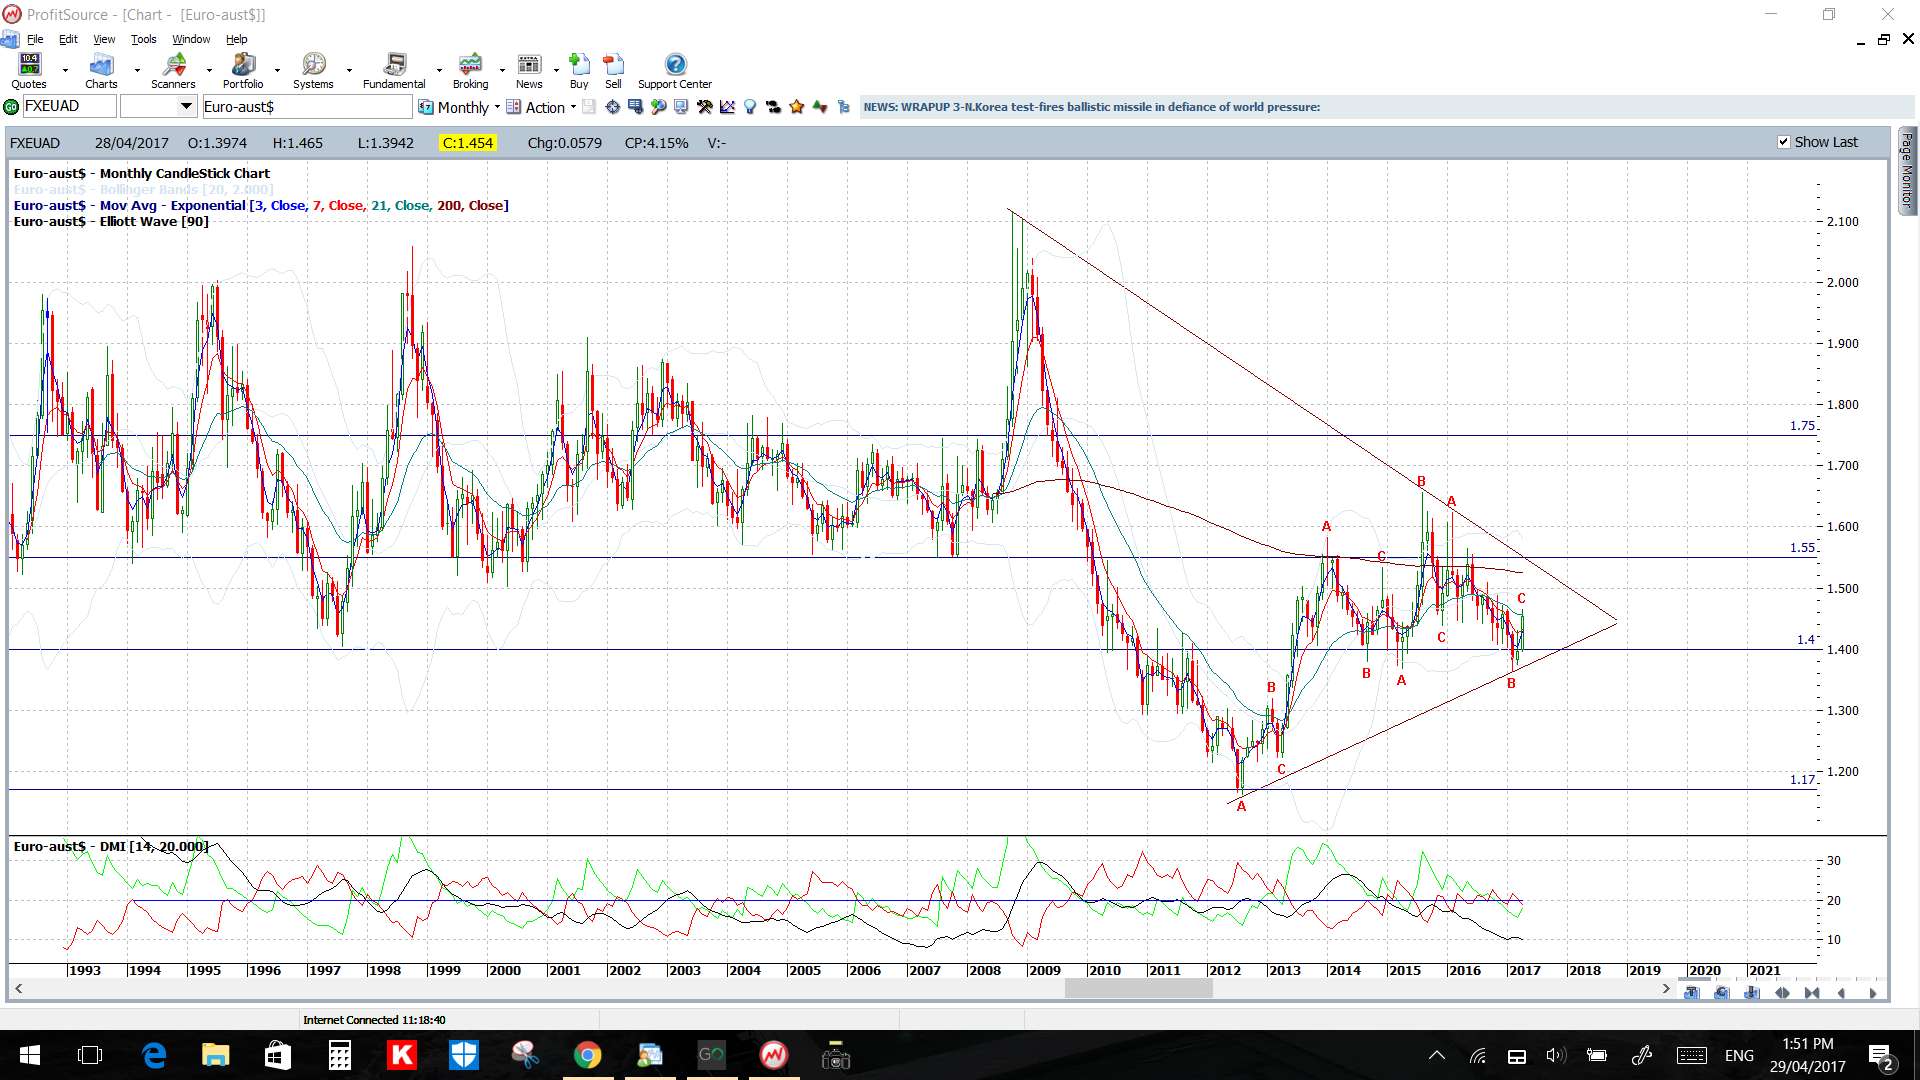
There is a larger triangle still in play on the weekly/monthly charts and price action is about 800 pips away from the upper trend line here. This trend line intersects near the long-term S/R region of 1.55 though and so it could prove to be quite attractive.
Price is above the 4hr and daily Cloud.
The weekly and monthly candles were bullish.
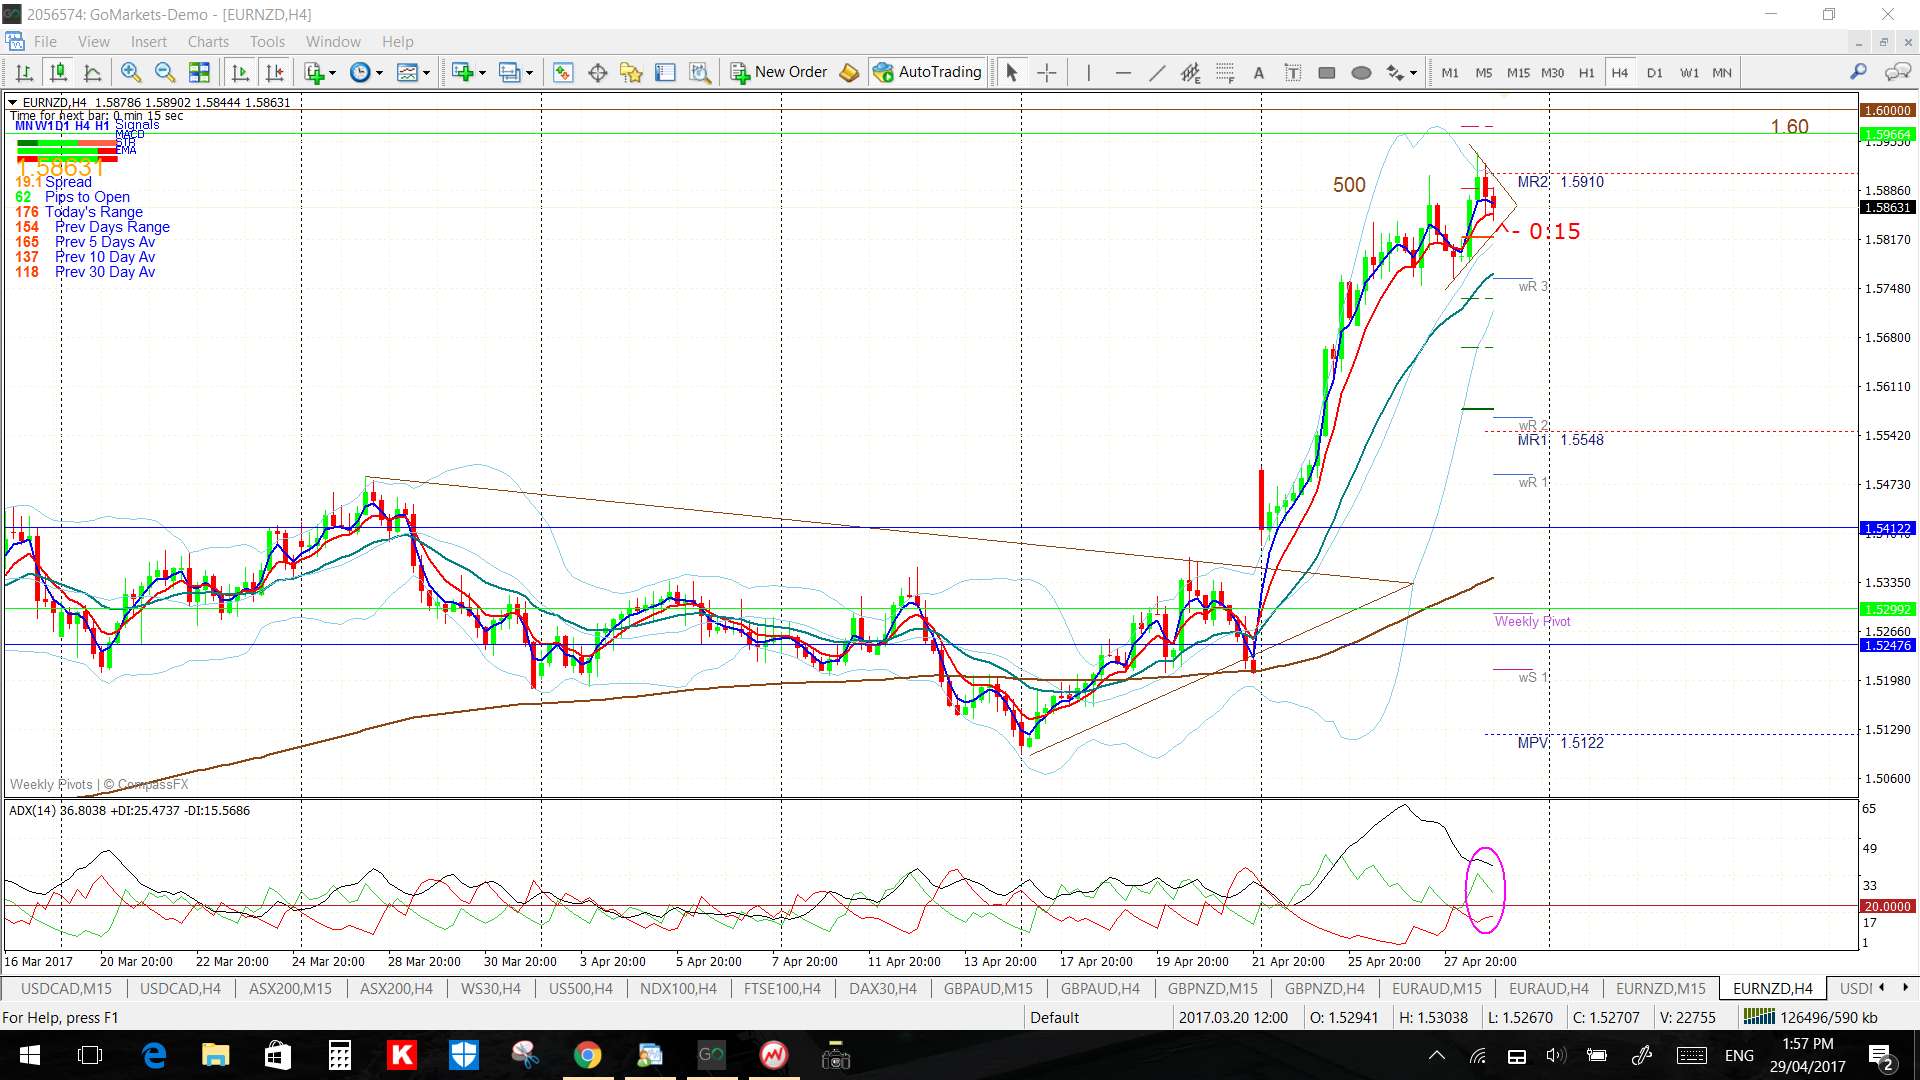
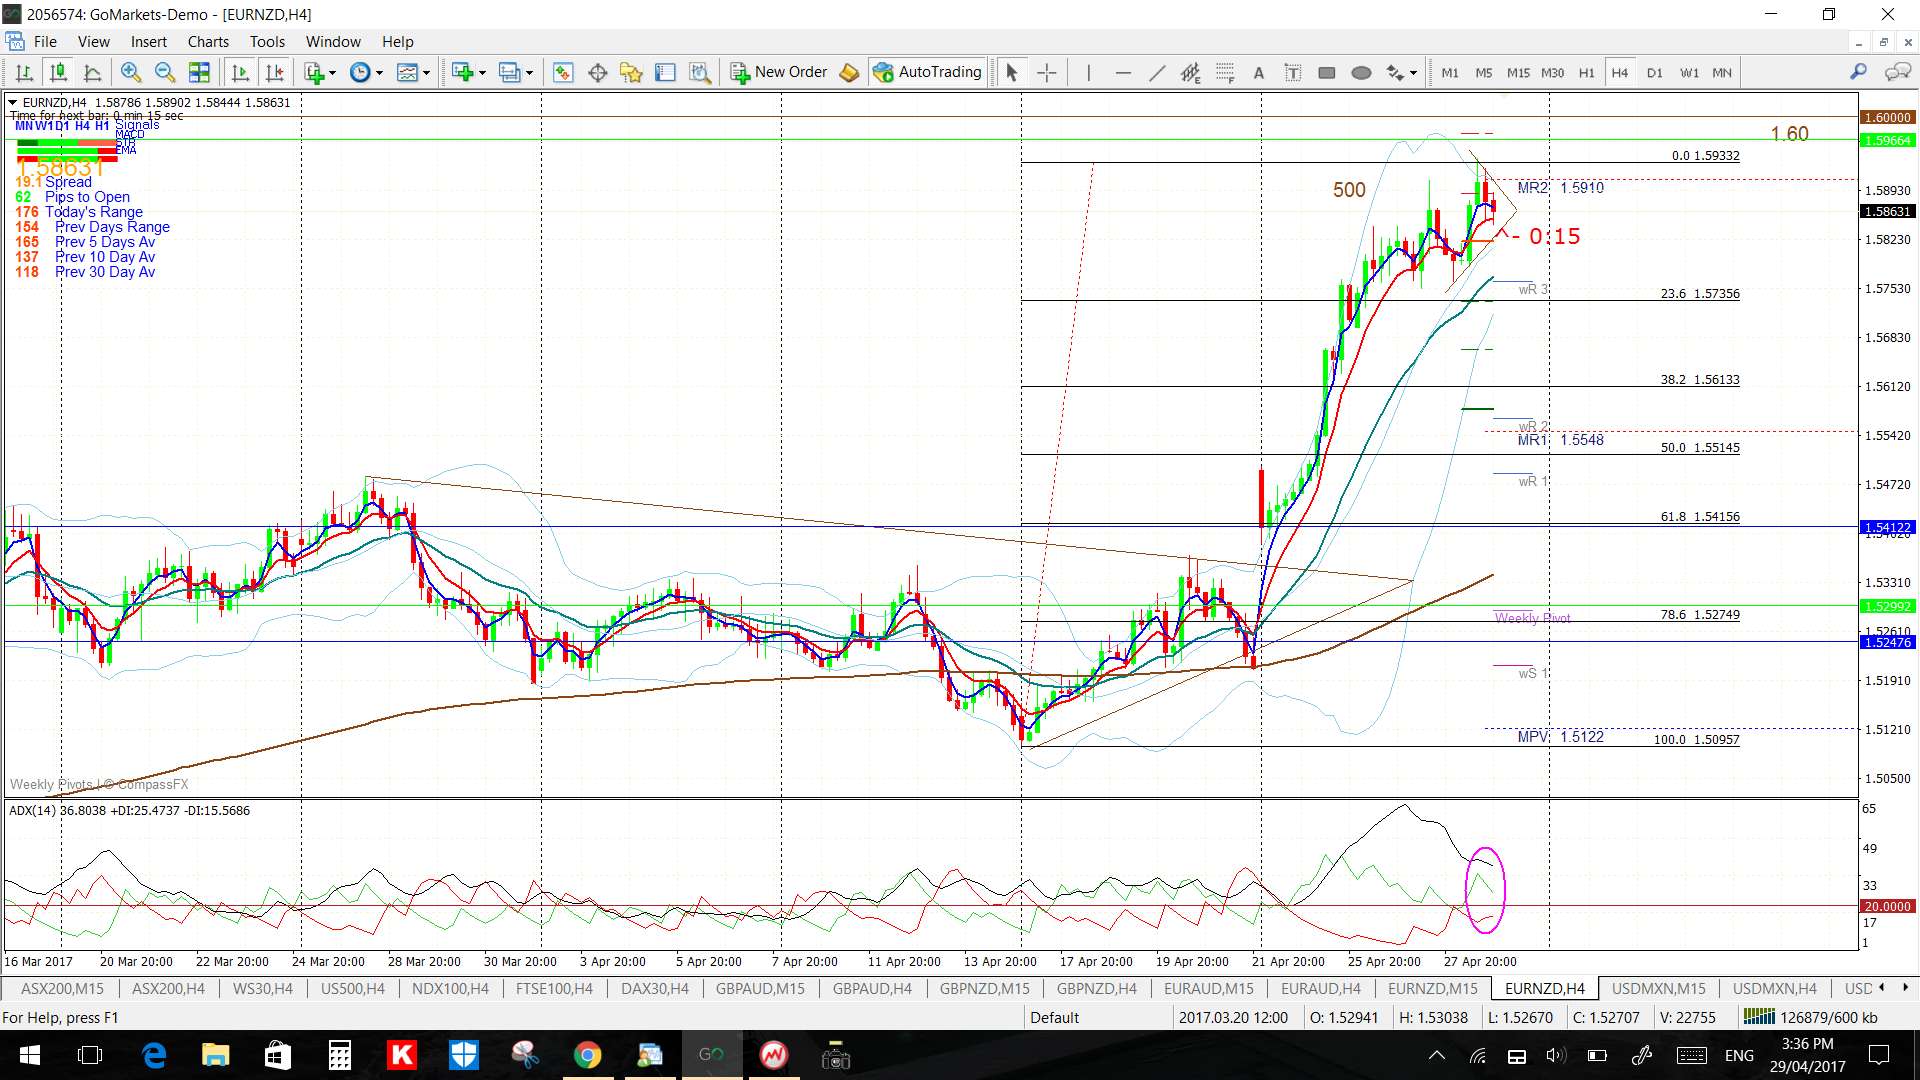
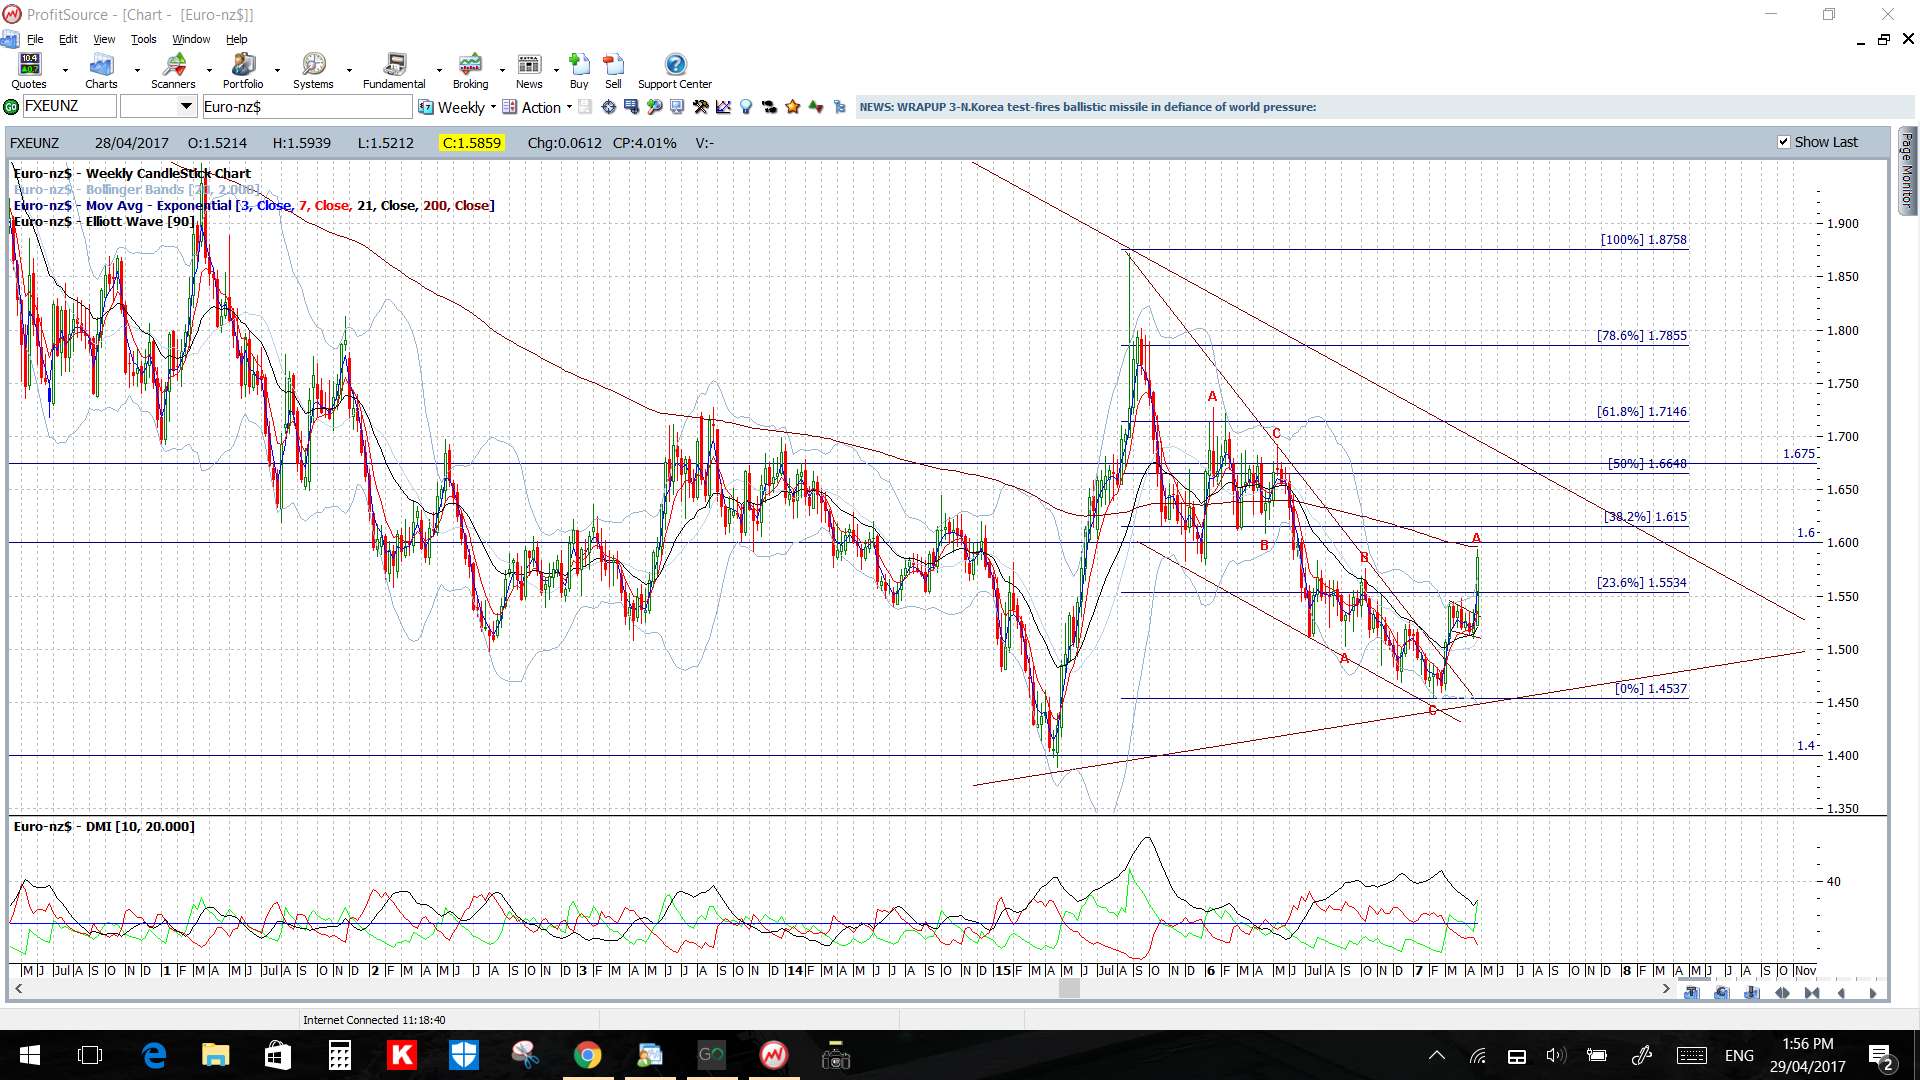
EUR/NZD: Like the EUR/AUD, price gapped higher to open for the week and this gap move took the EUR/NZD up through a 4-week bear trend line. The gap has not been filled but the broken trend line region was tested again before a continuation move that gave up to 500 pips.
Price action slowed towards the end of the week and formed a triangle consolidation pattern under the psychological 1.60 region so this will be the region to watch next week for any make or break activity:
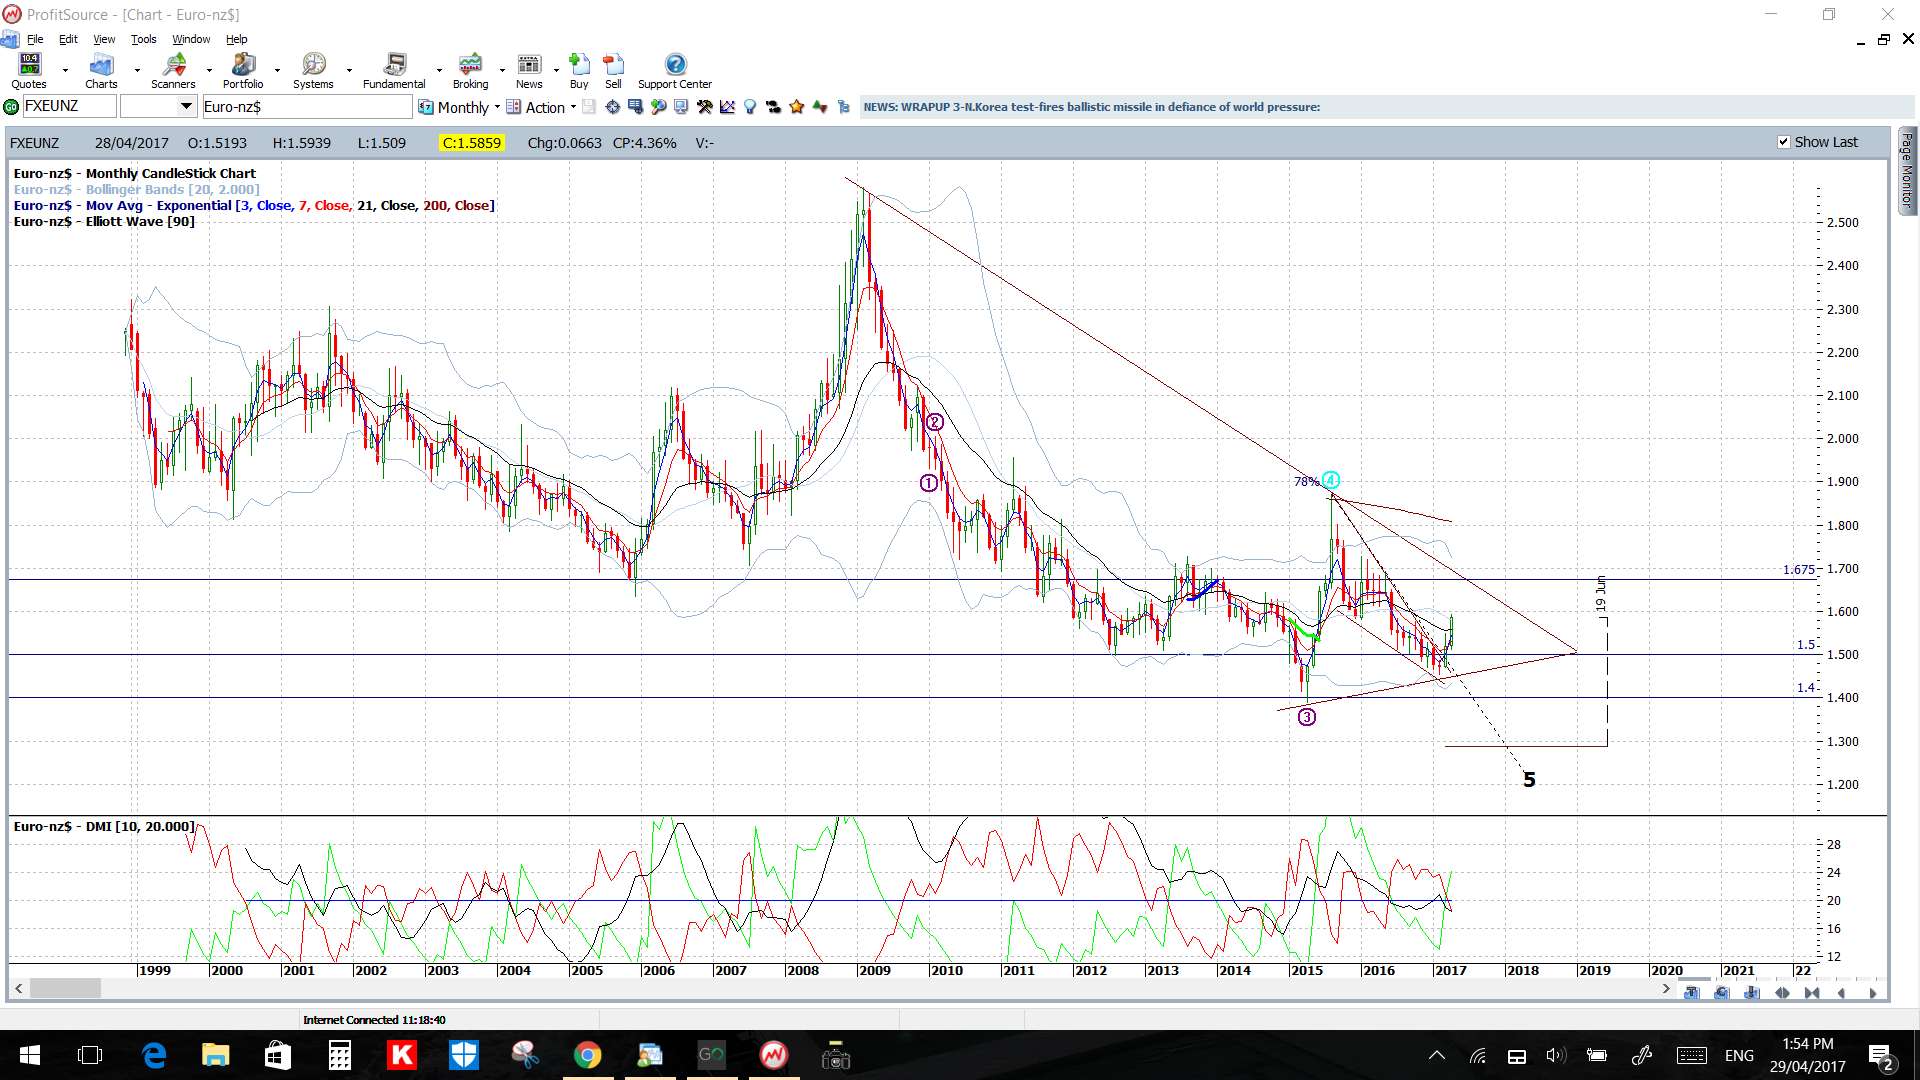
- Bullish continuation: above 1.60 would have me focus on the key 1.675 level that is about 800 pips above.
- Bearish respect: of 1.60 would bring the 4hr chart’s Fibonacci levels into focus as potential pullback targets.
Price is above the 4hr and daily Cloud.
The weekly and monthly candles were bullish.
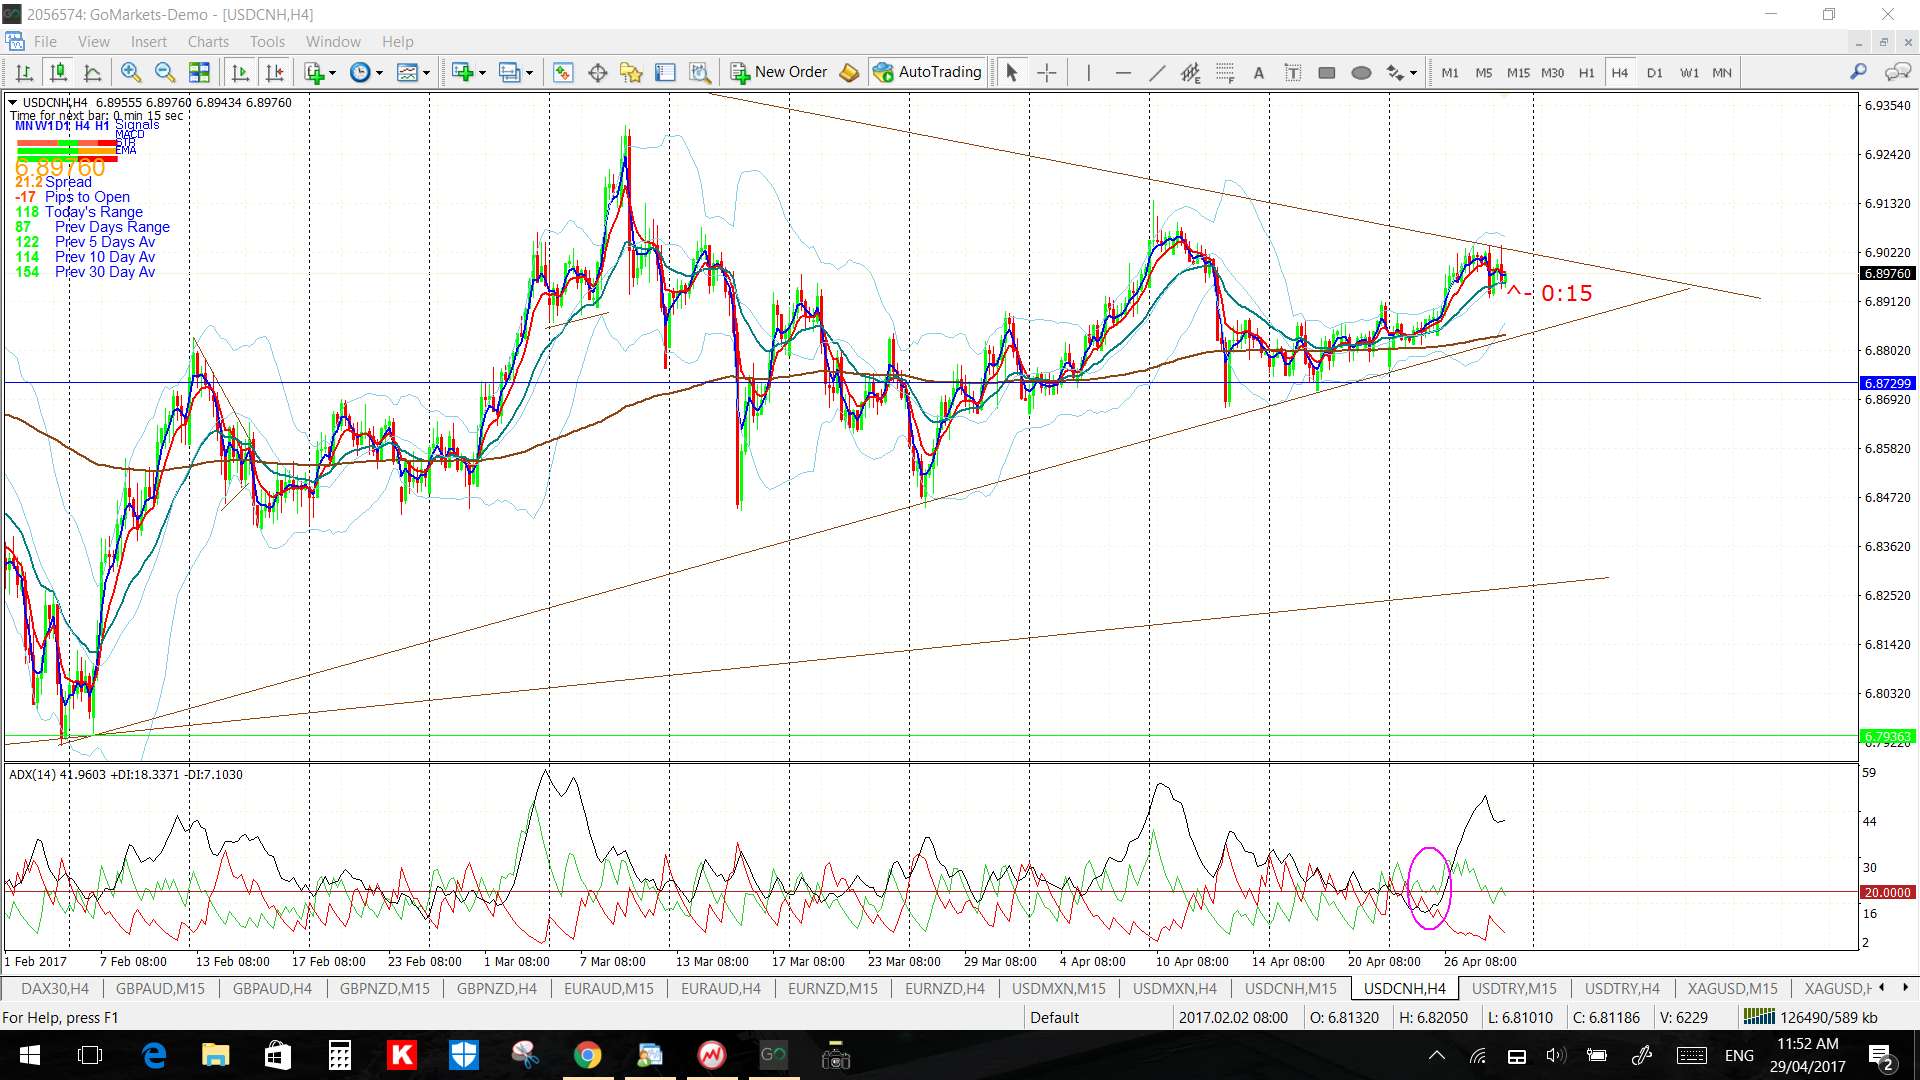
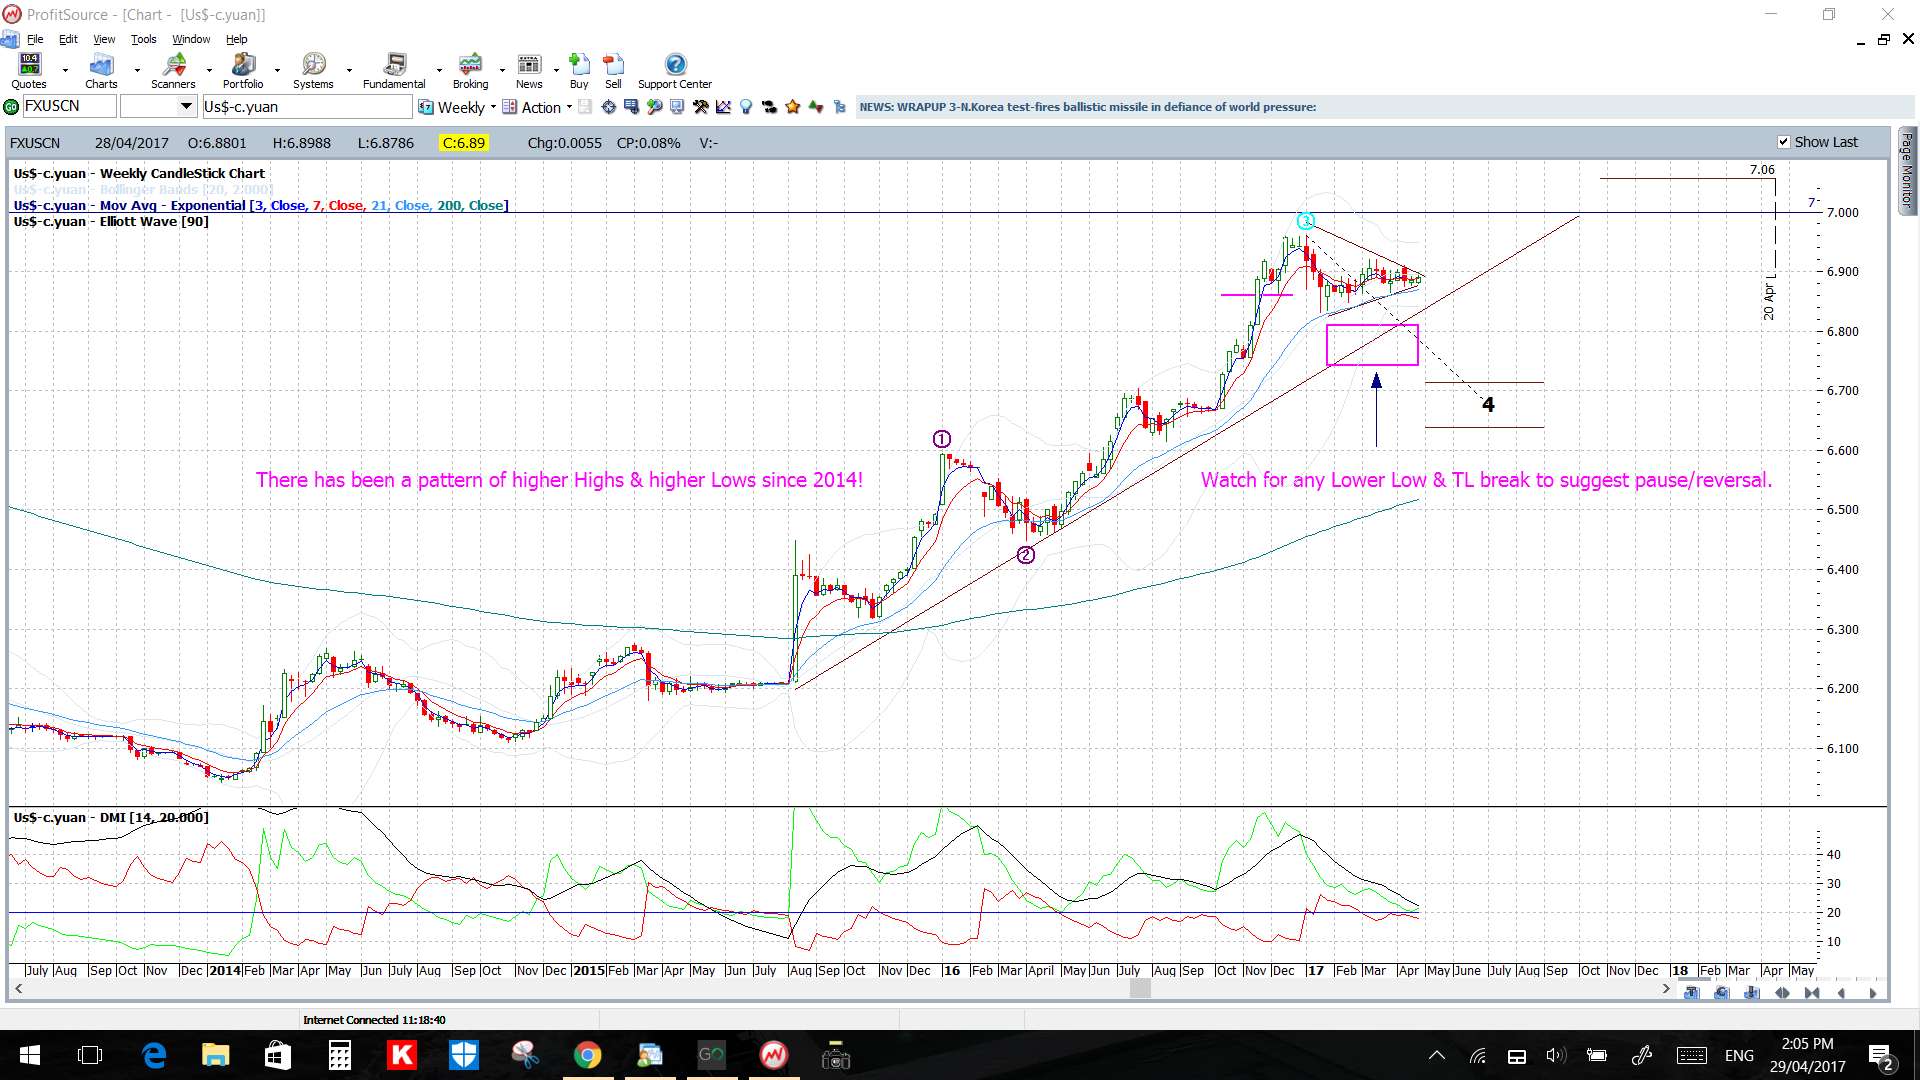
USD/CNH: Watch the 4hr chart’s triangle trend lines for any momentum-based trend line breakout:
- Any bearish move would bring the 2-year support trend line into focus.
- Any bullish move would bring the whole-number 7.0 into focus.
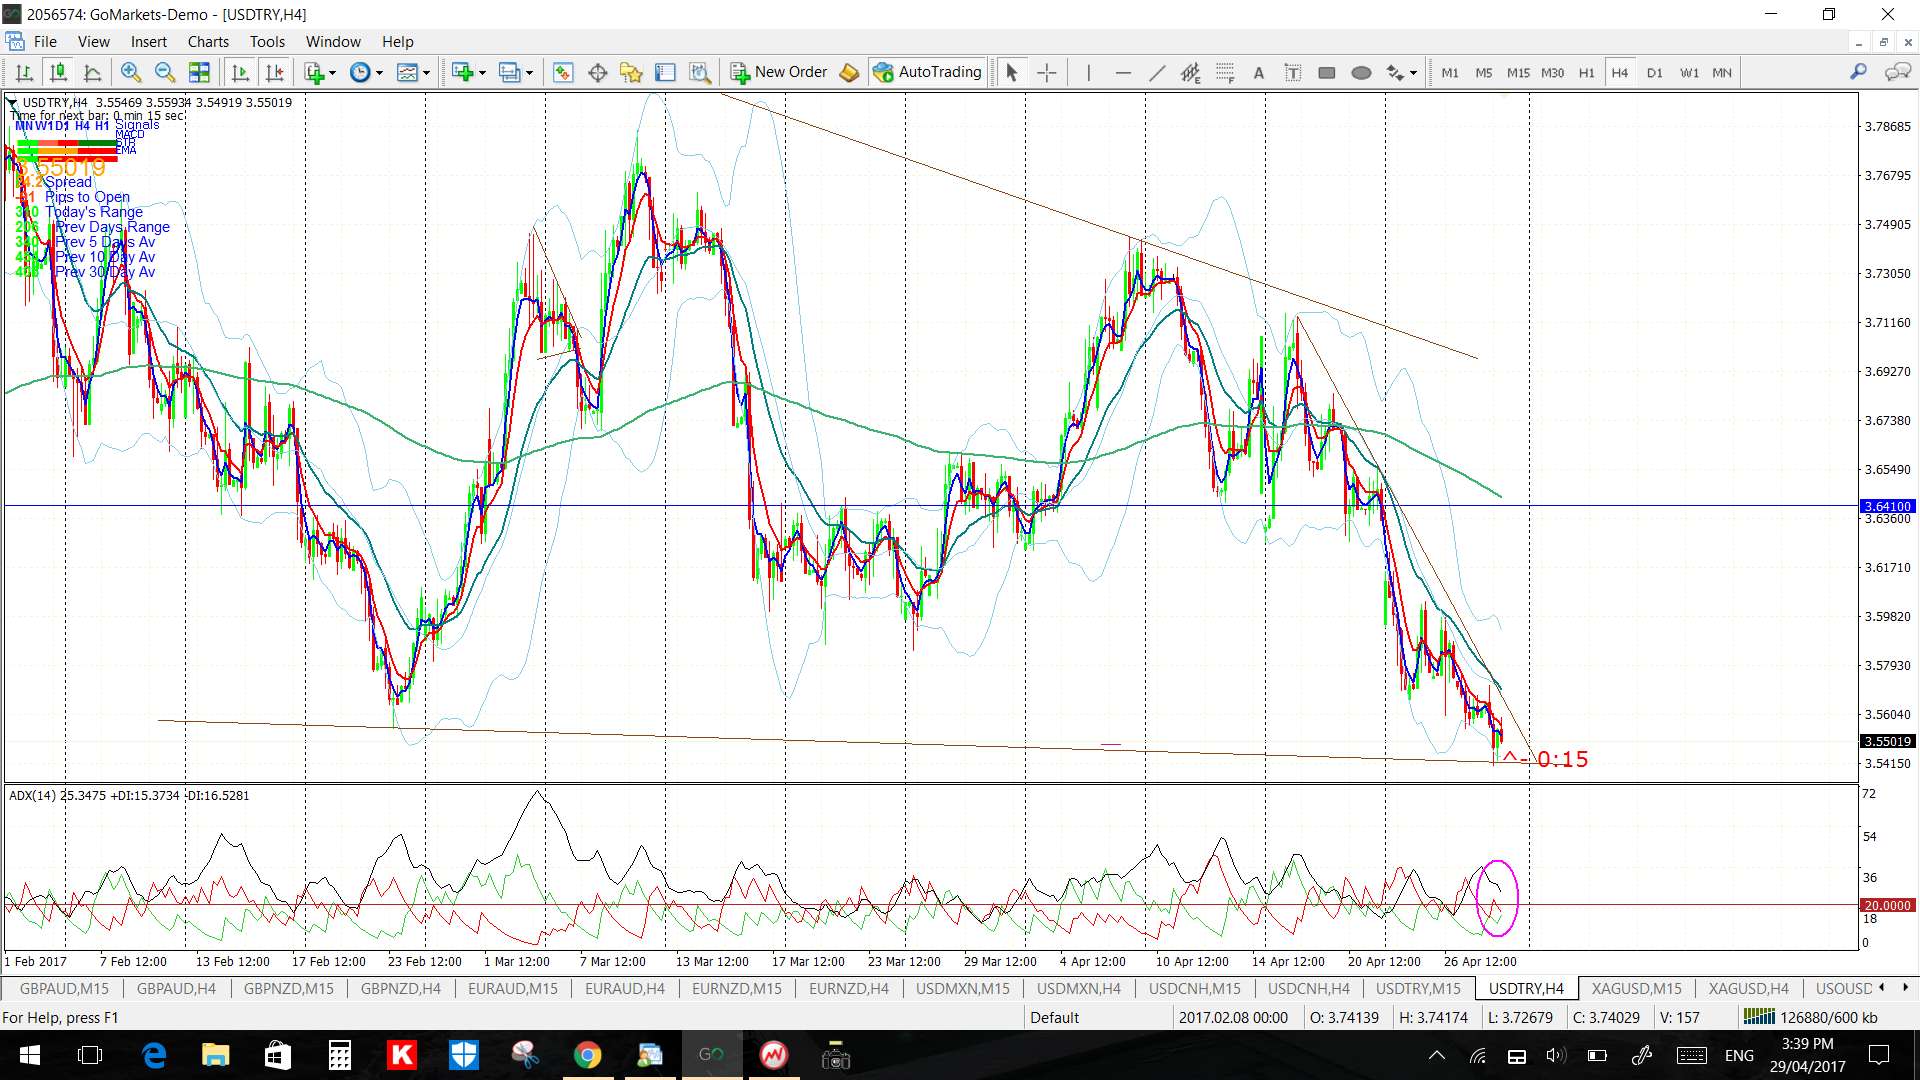
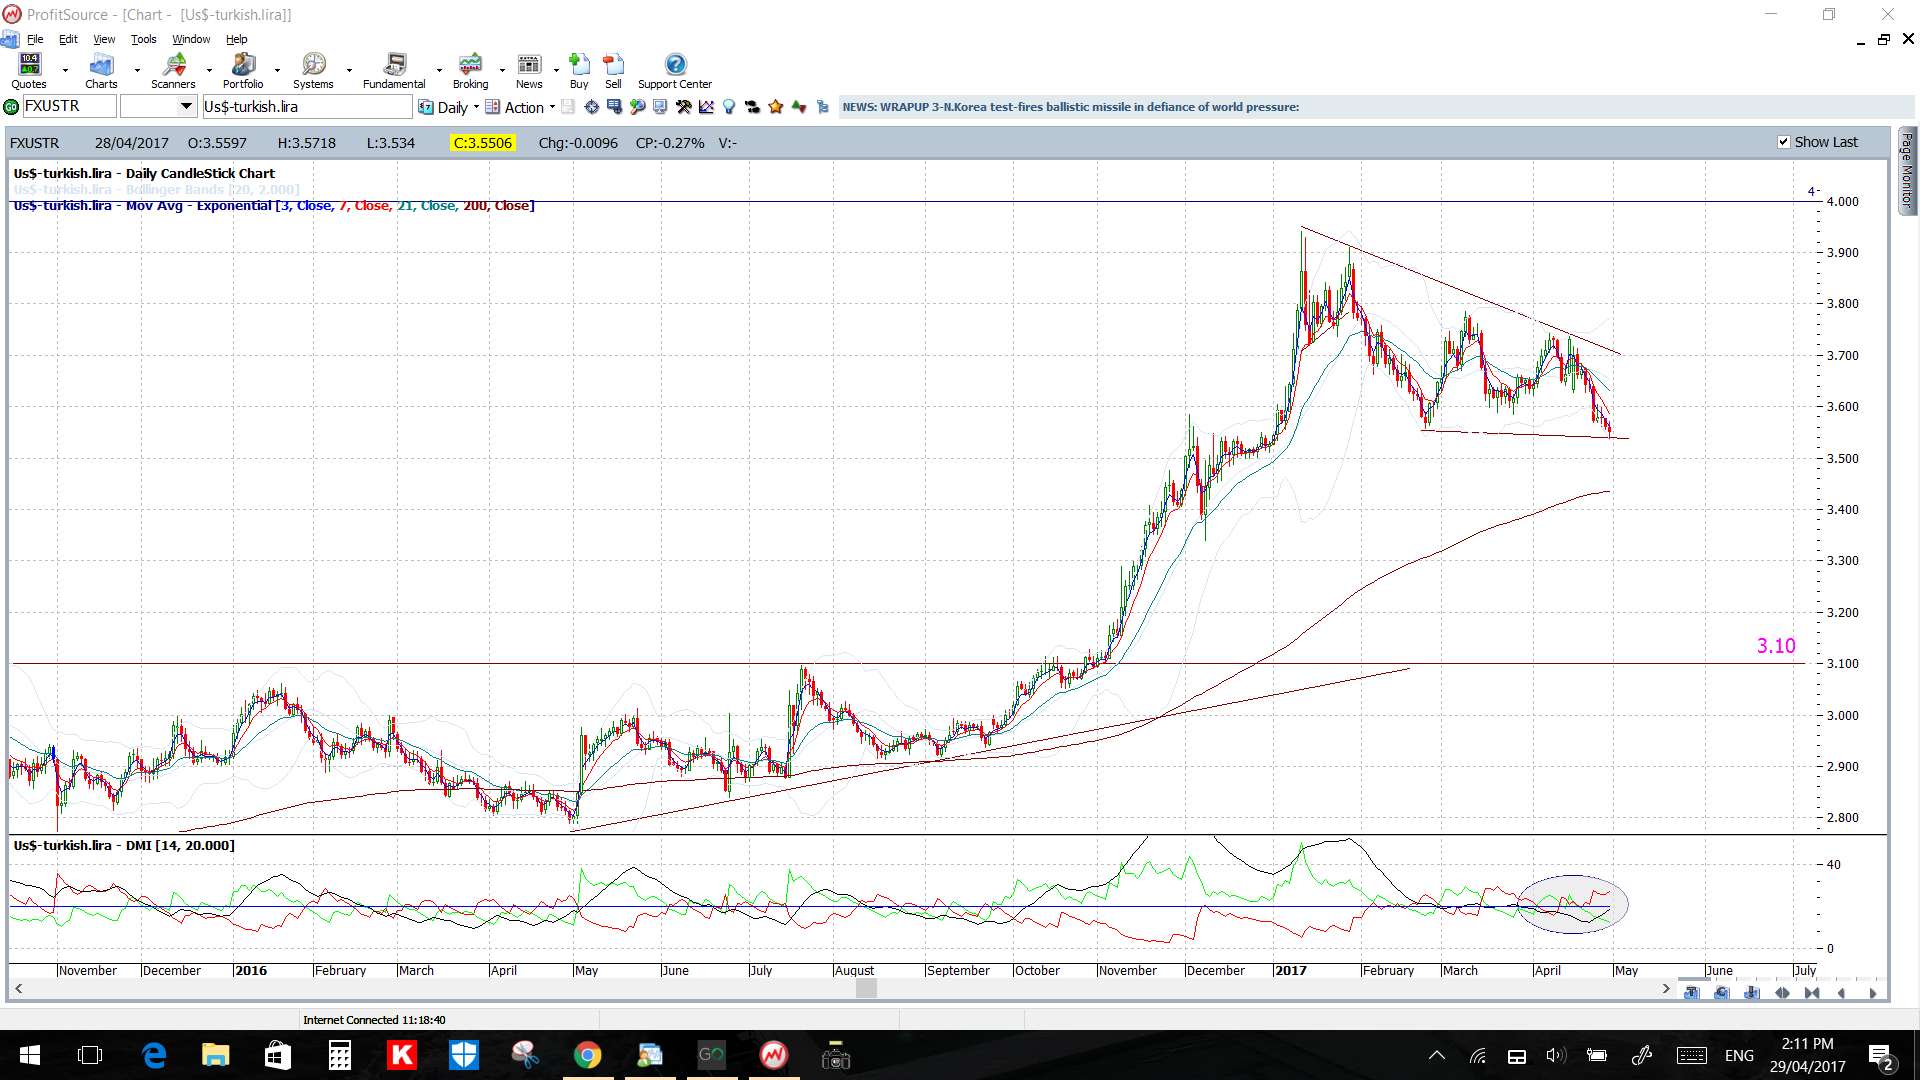
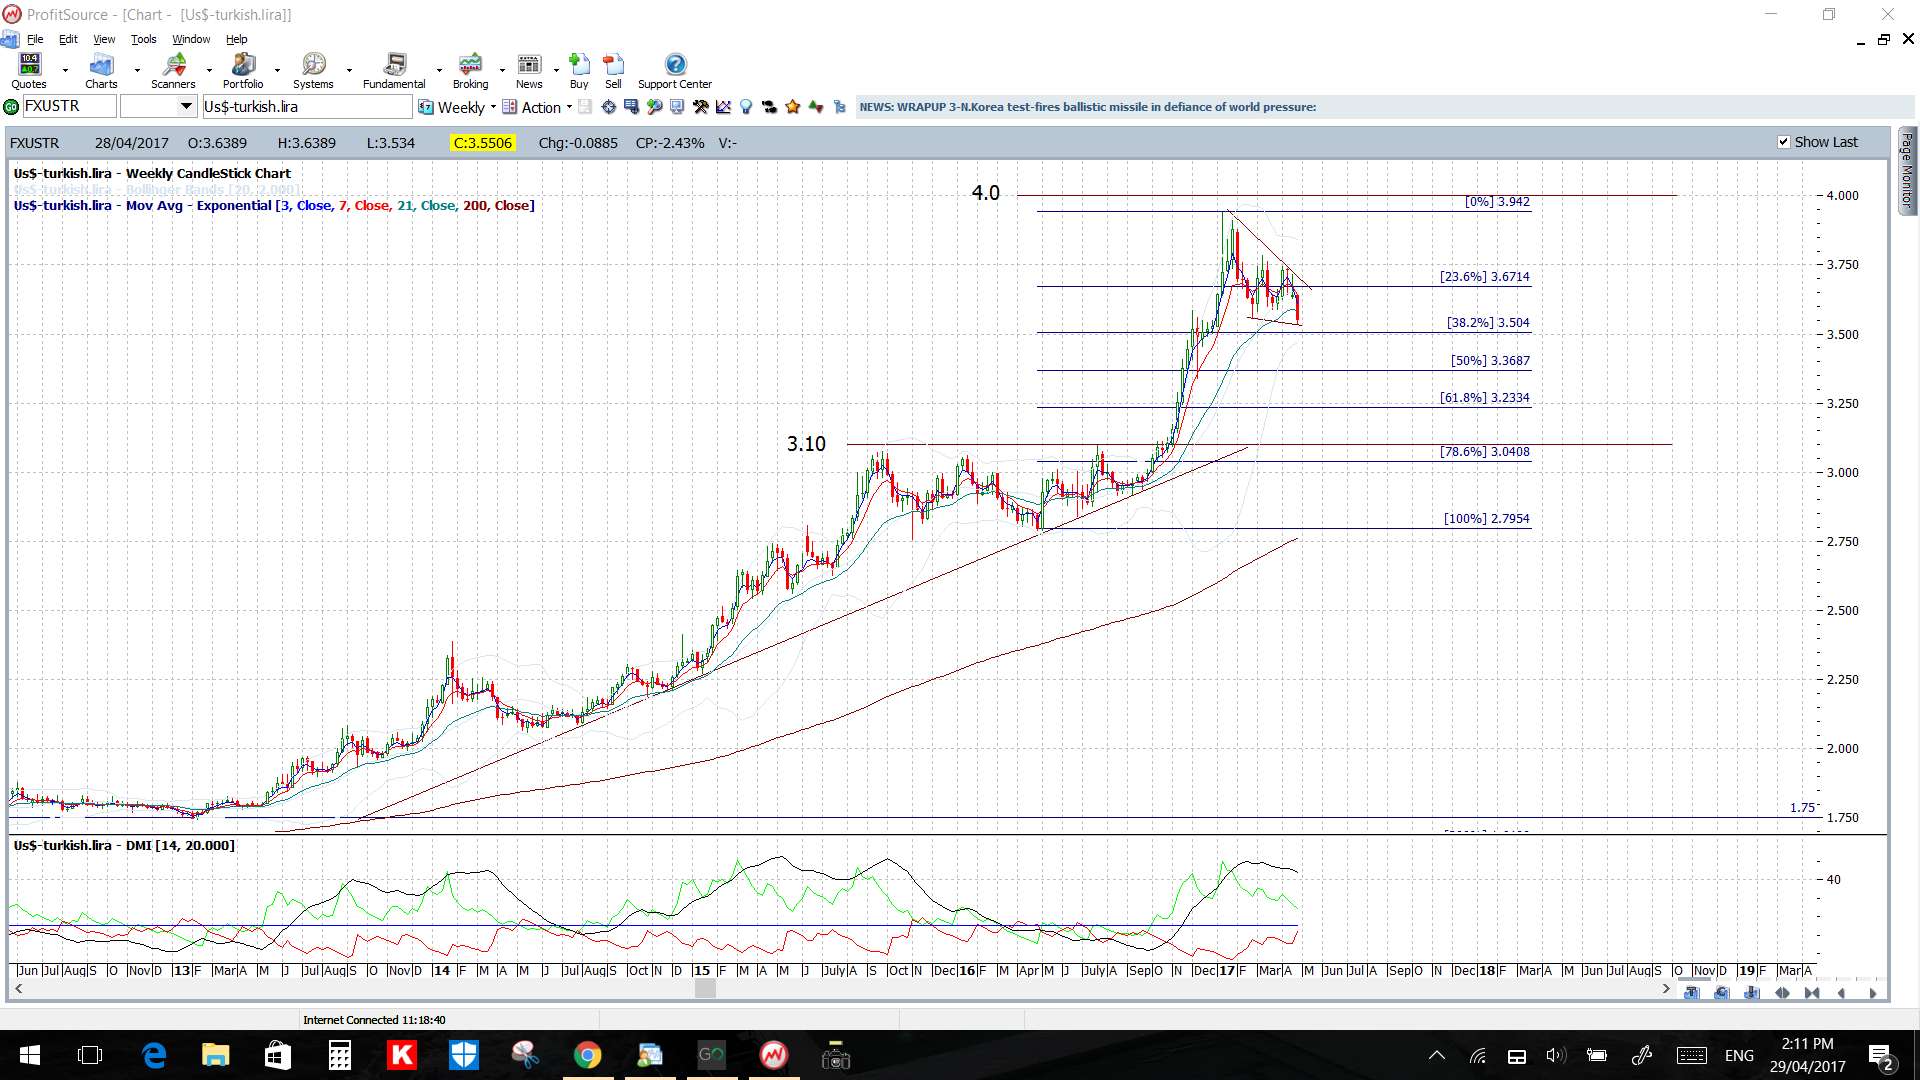
USD/TRY: Watch the 4hr chart’s triangle trend lines for any momentum-based trend line breakout:
- A bullish break would bring the 4.0 into greater focus.
- A bearish break would bring the 3.10 into greater focus.
USD/MXN:
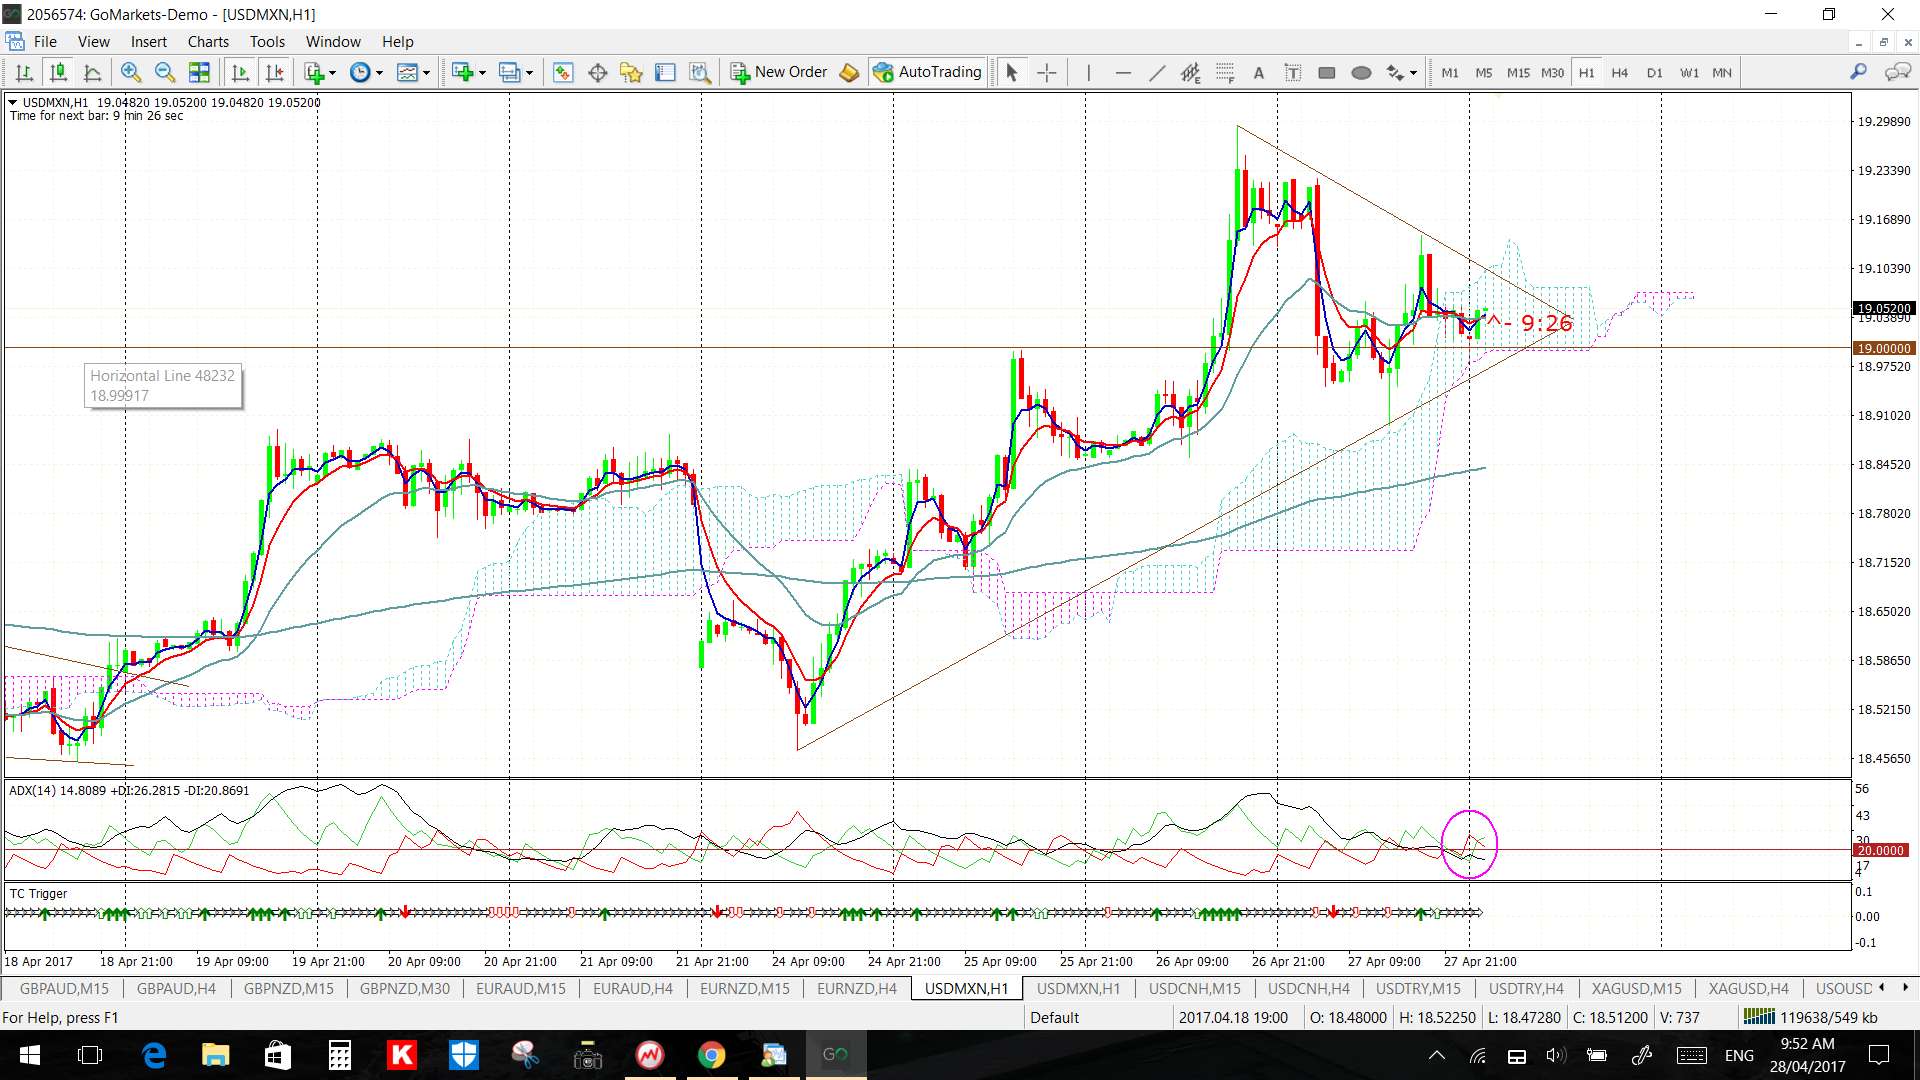
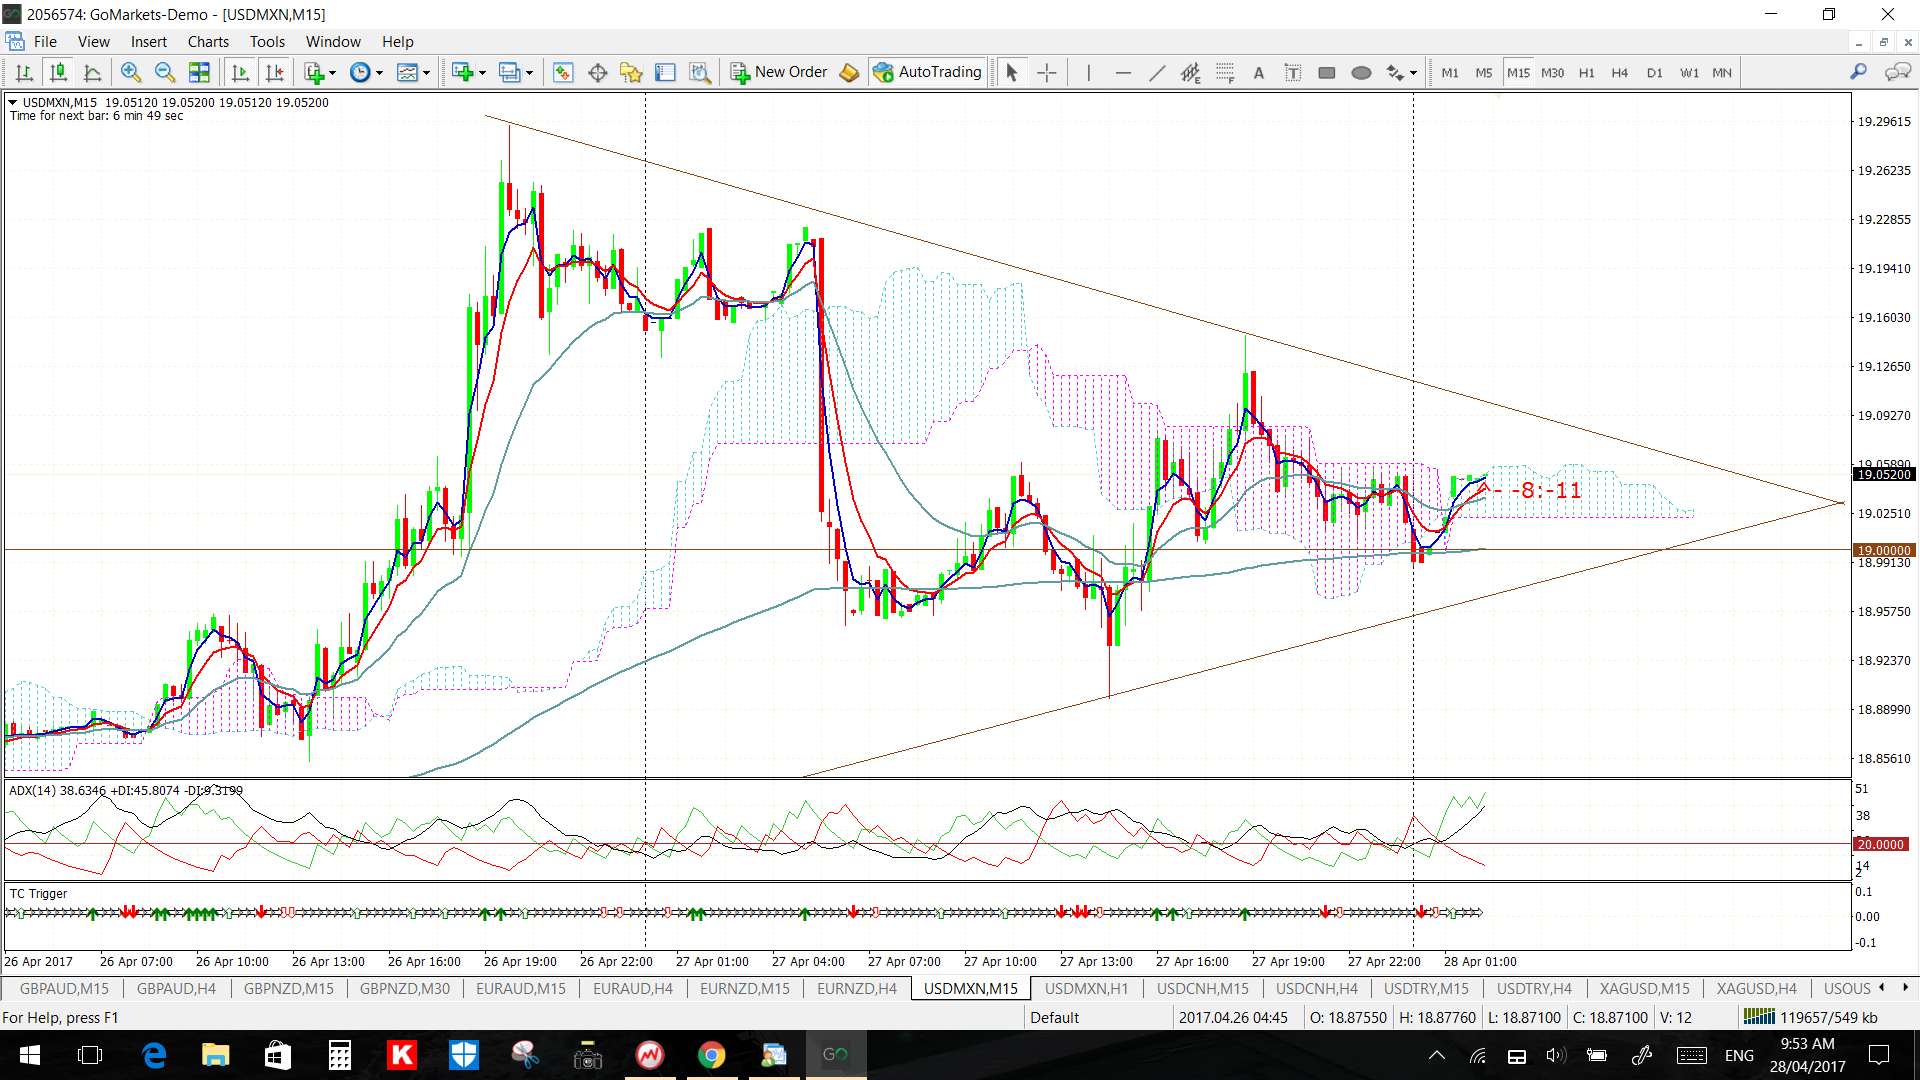
Just an update before I do the analysis for the week ahead. I’d Tweeted on Friday to watch the trend lines on the 60 min and 15 min charts during the US session for any breakout. These were the charts from that Tweet:
USD/MXN 60 min:
USD/MXN 15 min:
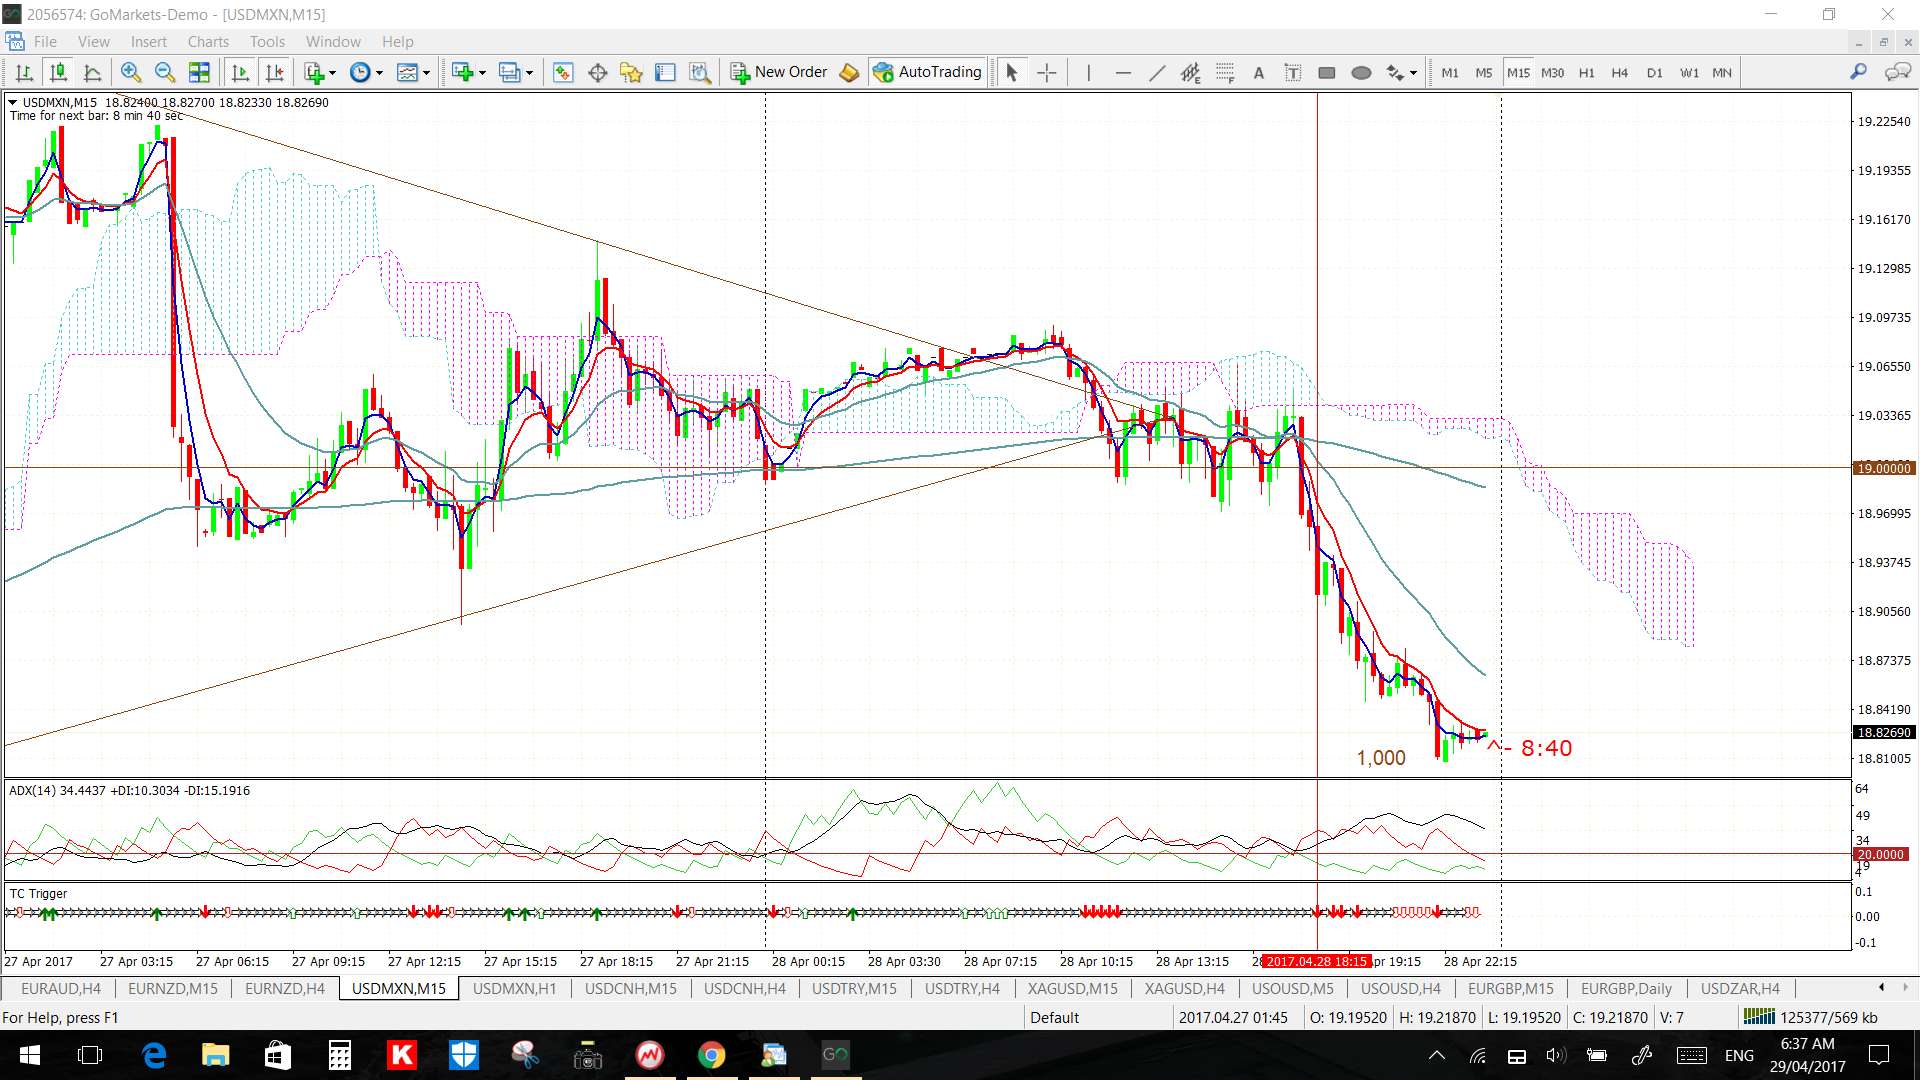
The following shot is of the 15 min chart taken the next day and note how there was a triangle trend line breakout and new TC SHORT signal that triggered during the US session for a move worth 1,000 pips! This methodology is proving to be a consistent and winning combination:
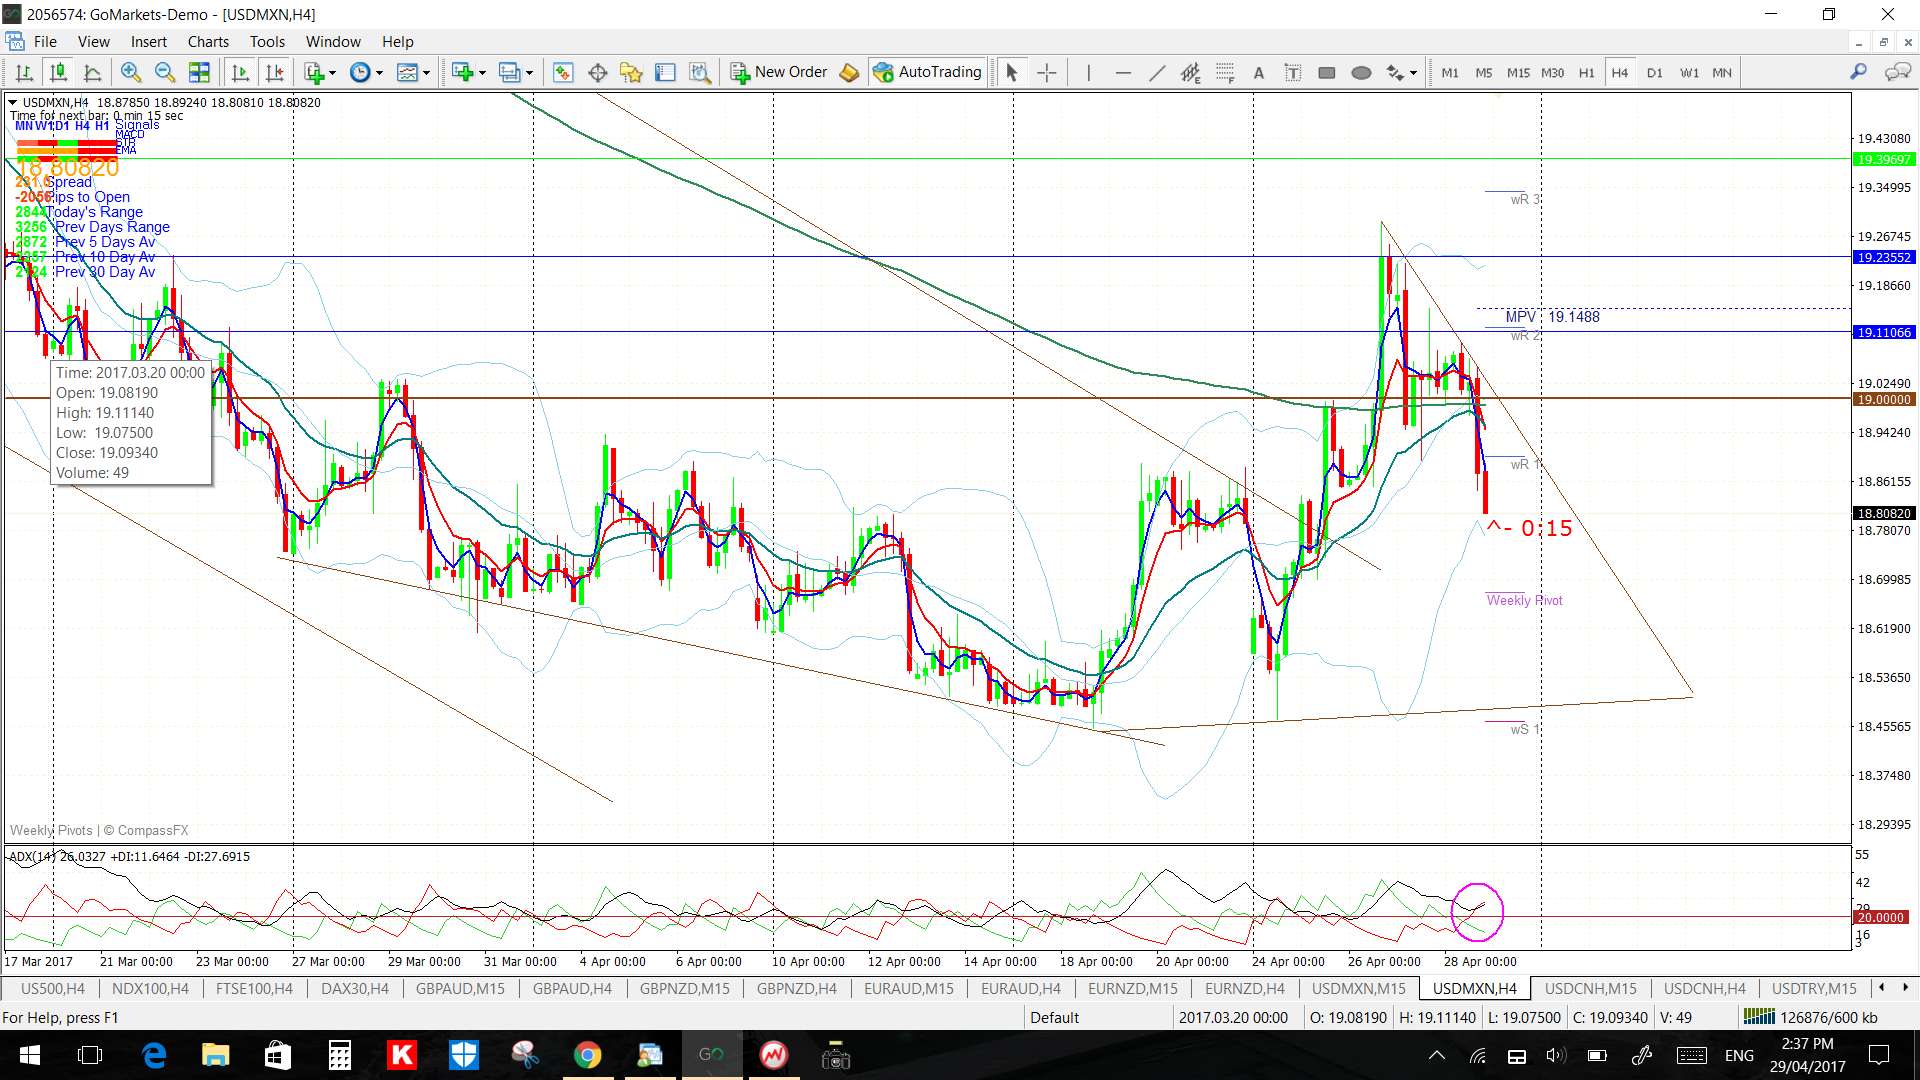
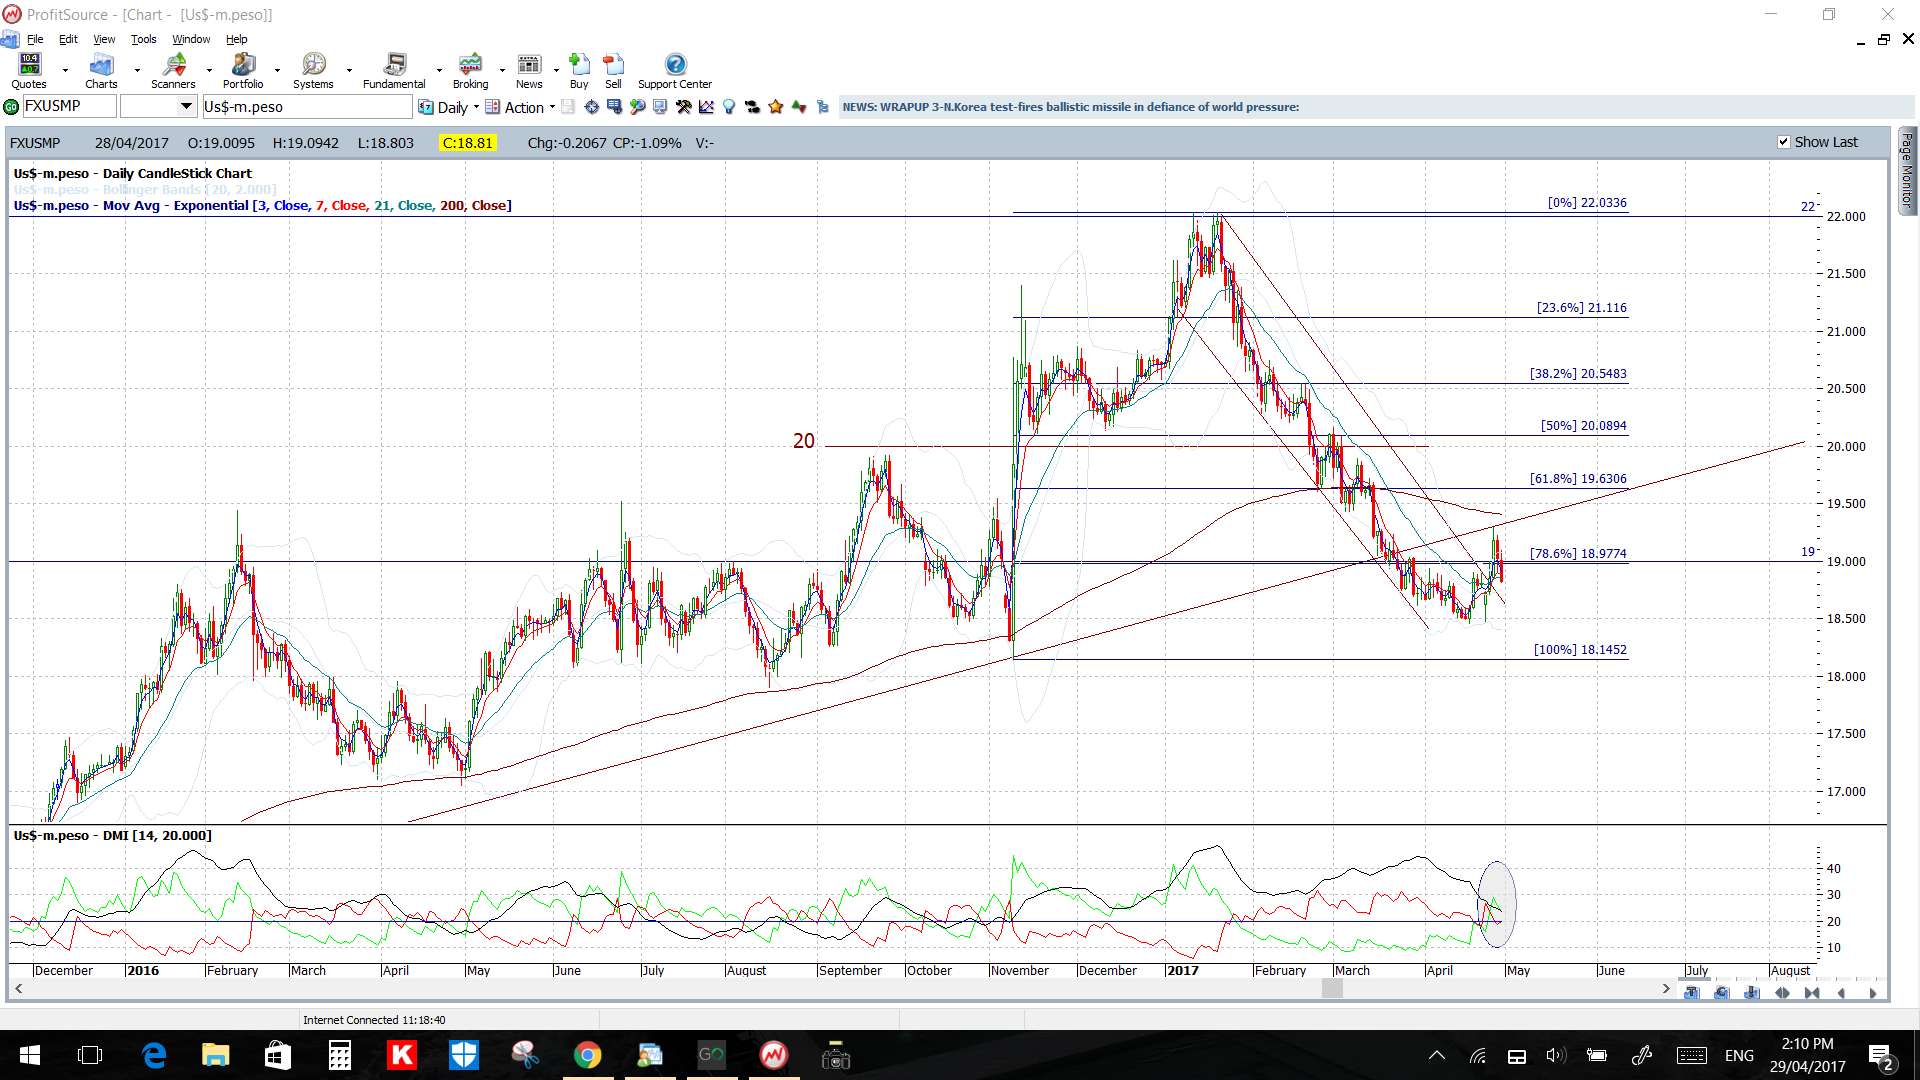
There are two main points to note for the USD/MXN in the coming week:
- the previously broken support trend line has been tested and rejected. This adds support to a bearish bias.
- the key 19 level has been tested and rejected again. This also adds support to a bearish bias.
- any further soothing NAFTA talk and procrastination about the border Wall might help to boost the MXN thereby keeping pressure on this pair.
- However, the 19 level remains a key psychological level and any new break back above this region would have to be read as bullish.
There is a new triangle of sorts on the 4hr chart to watch but weakness, as mentioned above whilst price is below 19, might prove to be the best move to stalk. Thus, watch the triangle trend lines for any momentum-based trend line breakout.
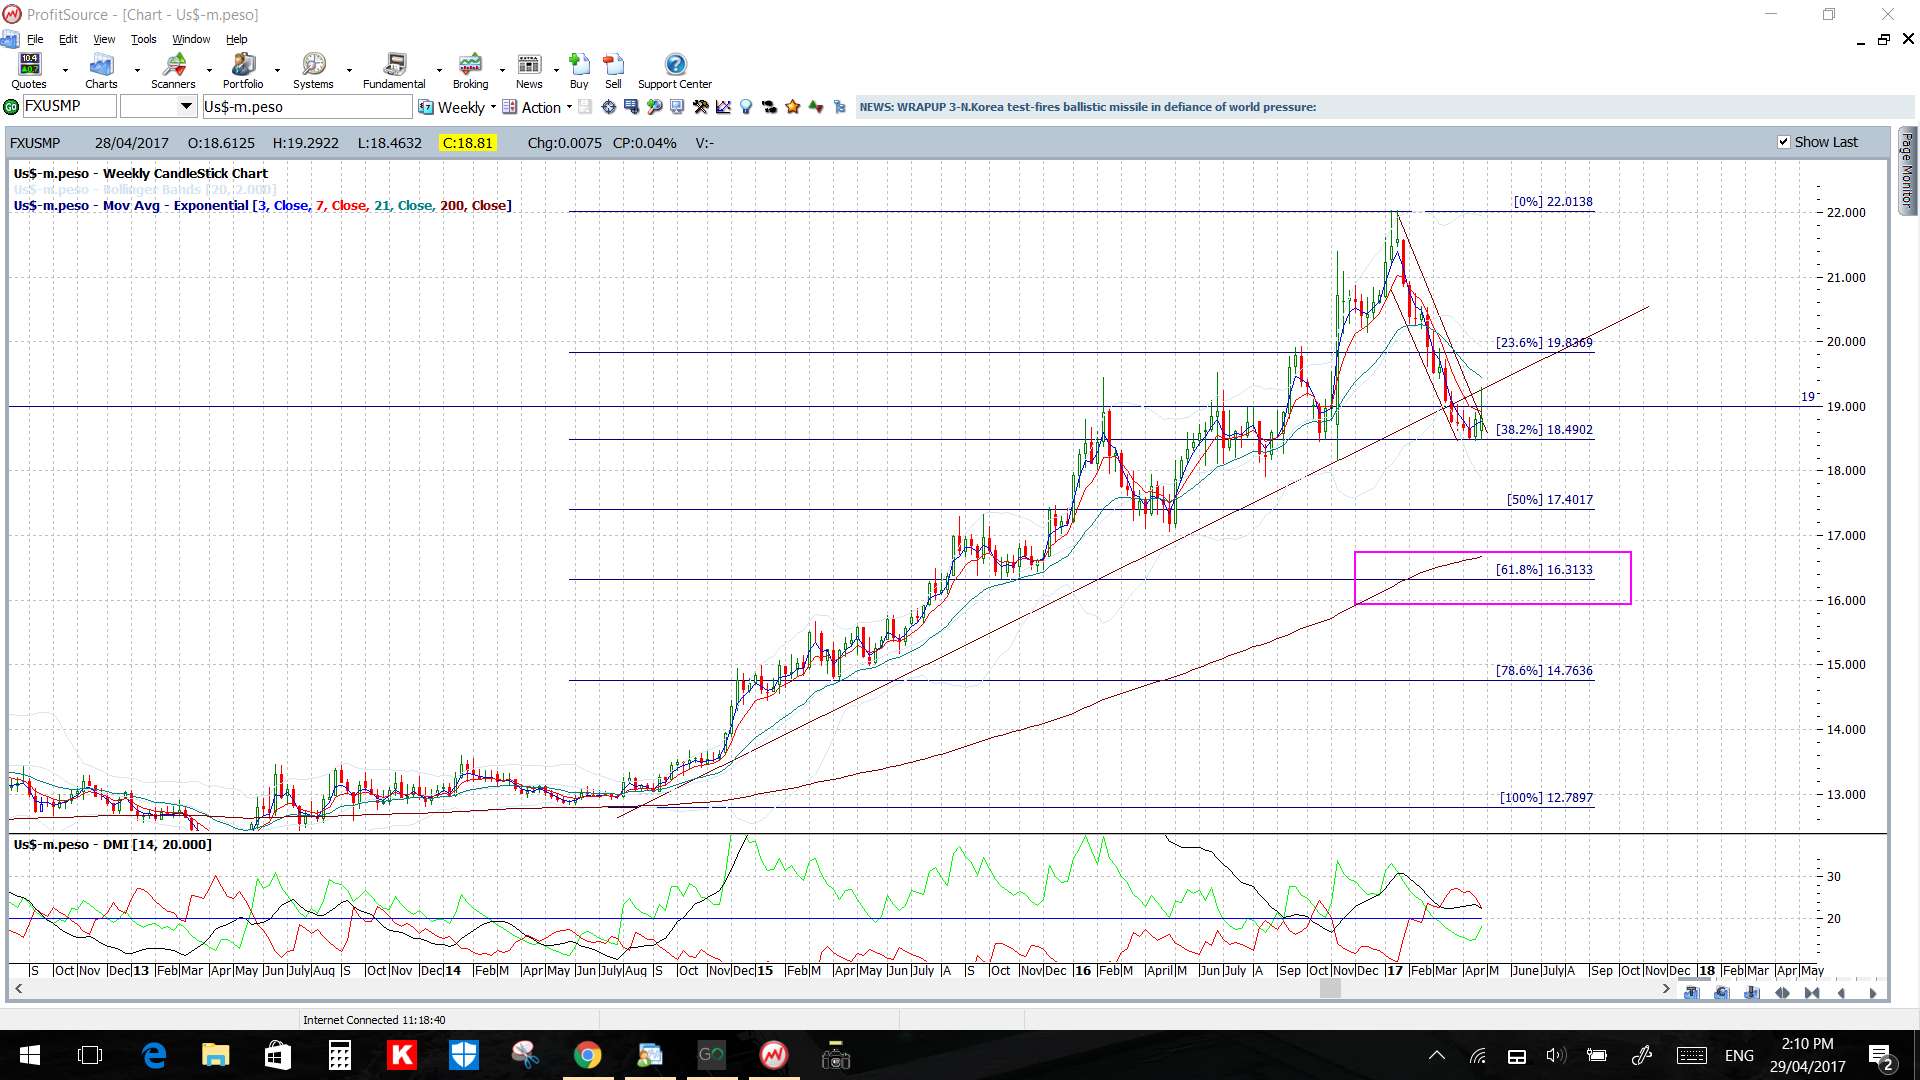
- a bearish triangle breakdown would bring the weekly chart’s 61.8% Fib region back into focus for the longer term move.
- any bullish breakout would bring the 19 level into sight again.
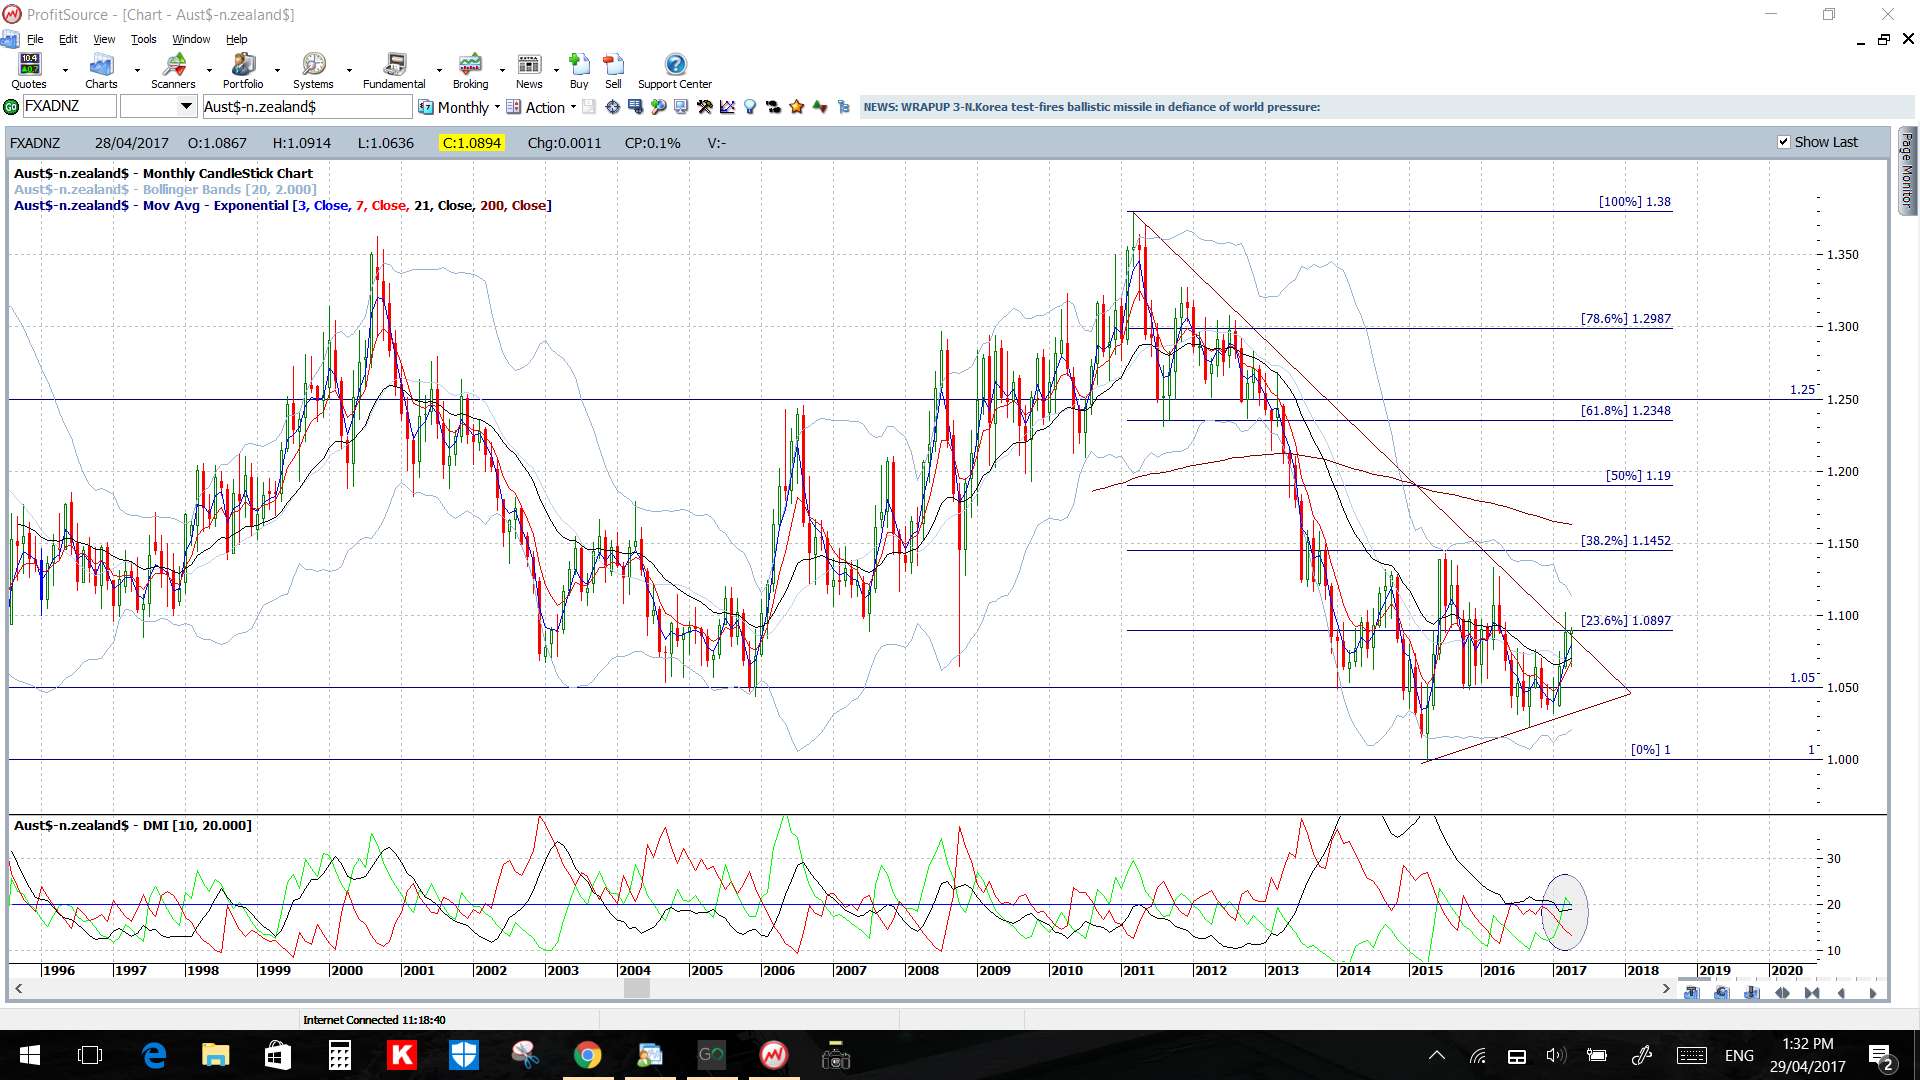
AUD/NZD monthly: there still hasn’t been a decisive move here as yet:
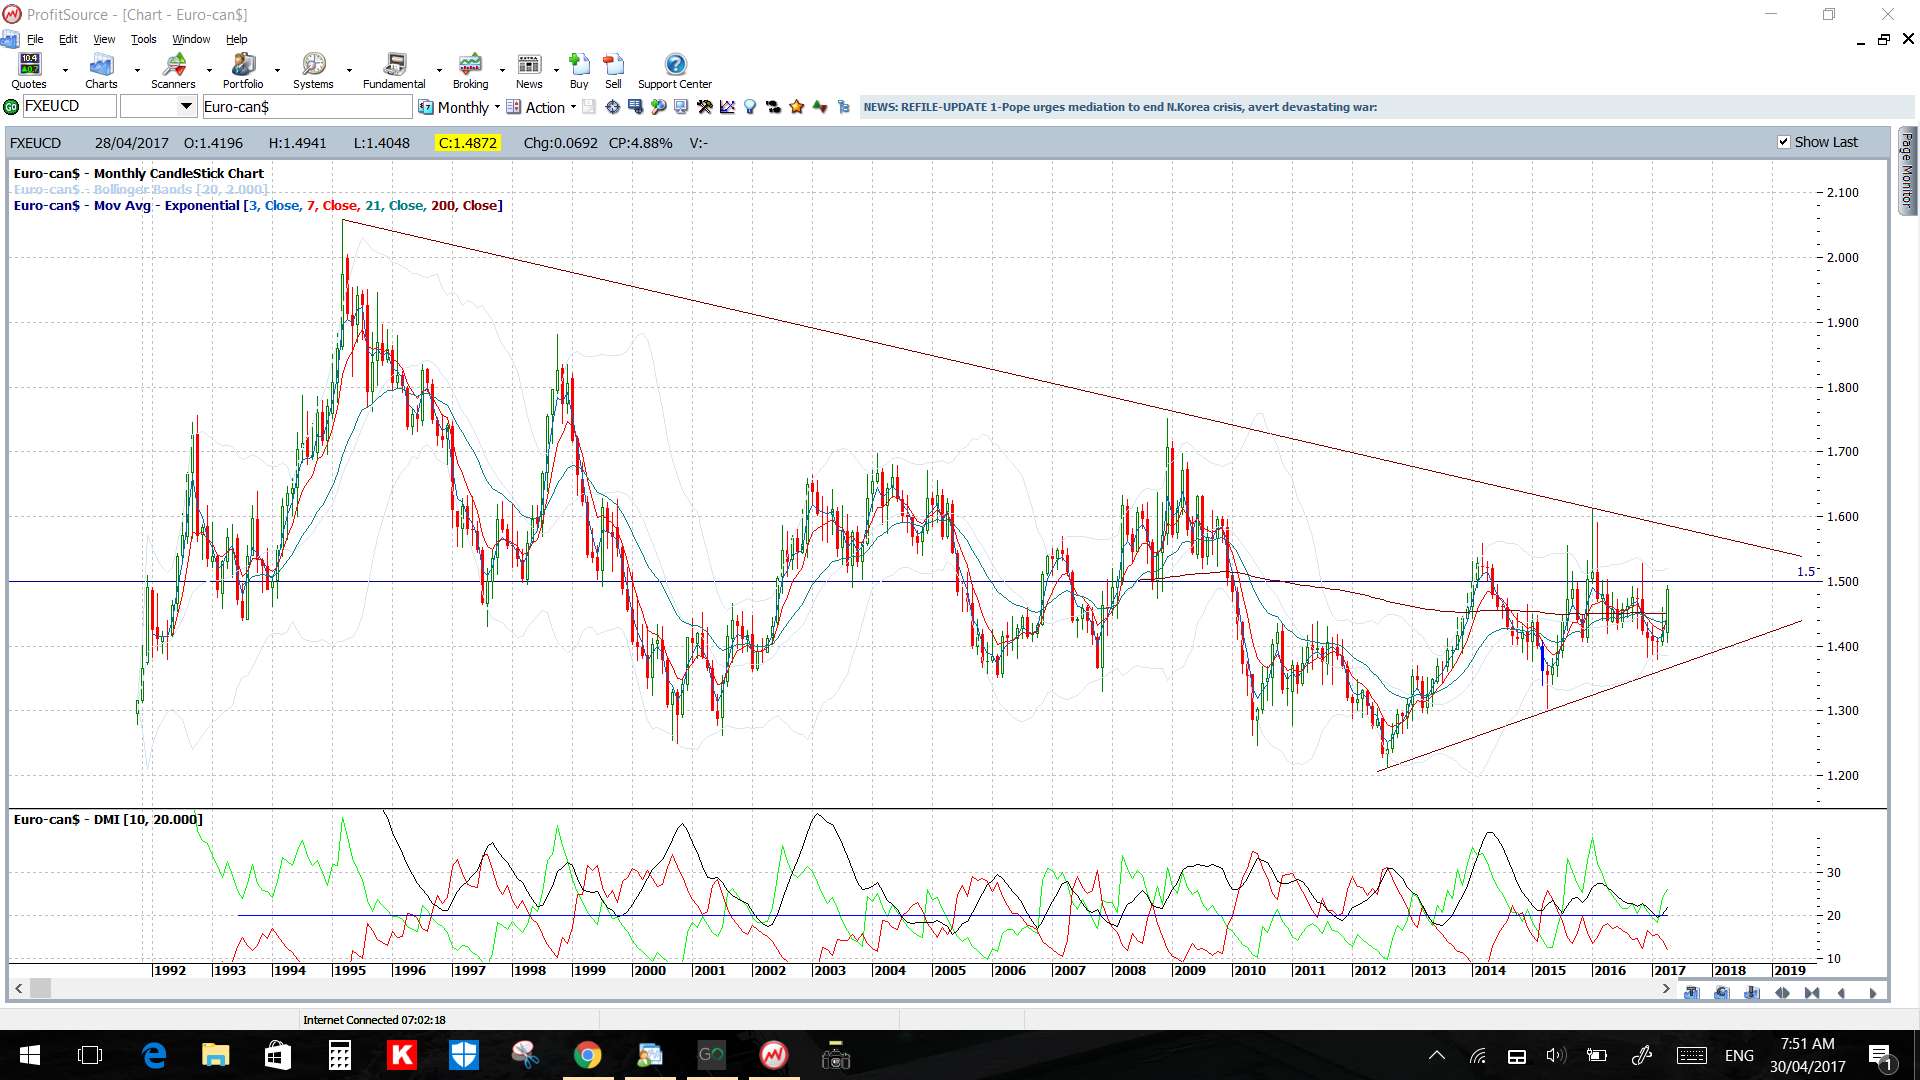
EUR/CAD monthly: I don’t monitor this pair but scrolled past this chart and it caught my eye due to the move back to 1.55:
USD/ZAR: this is my updated 4hr chart for this pair. Watch for any continuation back to the 61.8% fib near 13.55; some 2,000 pips away:
Commodites:
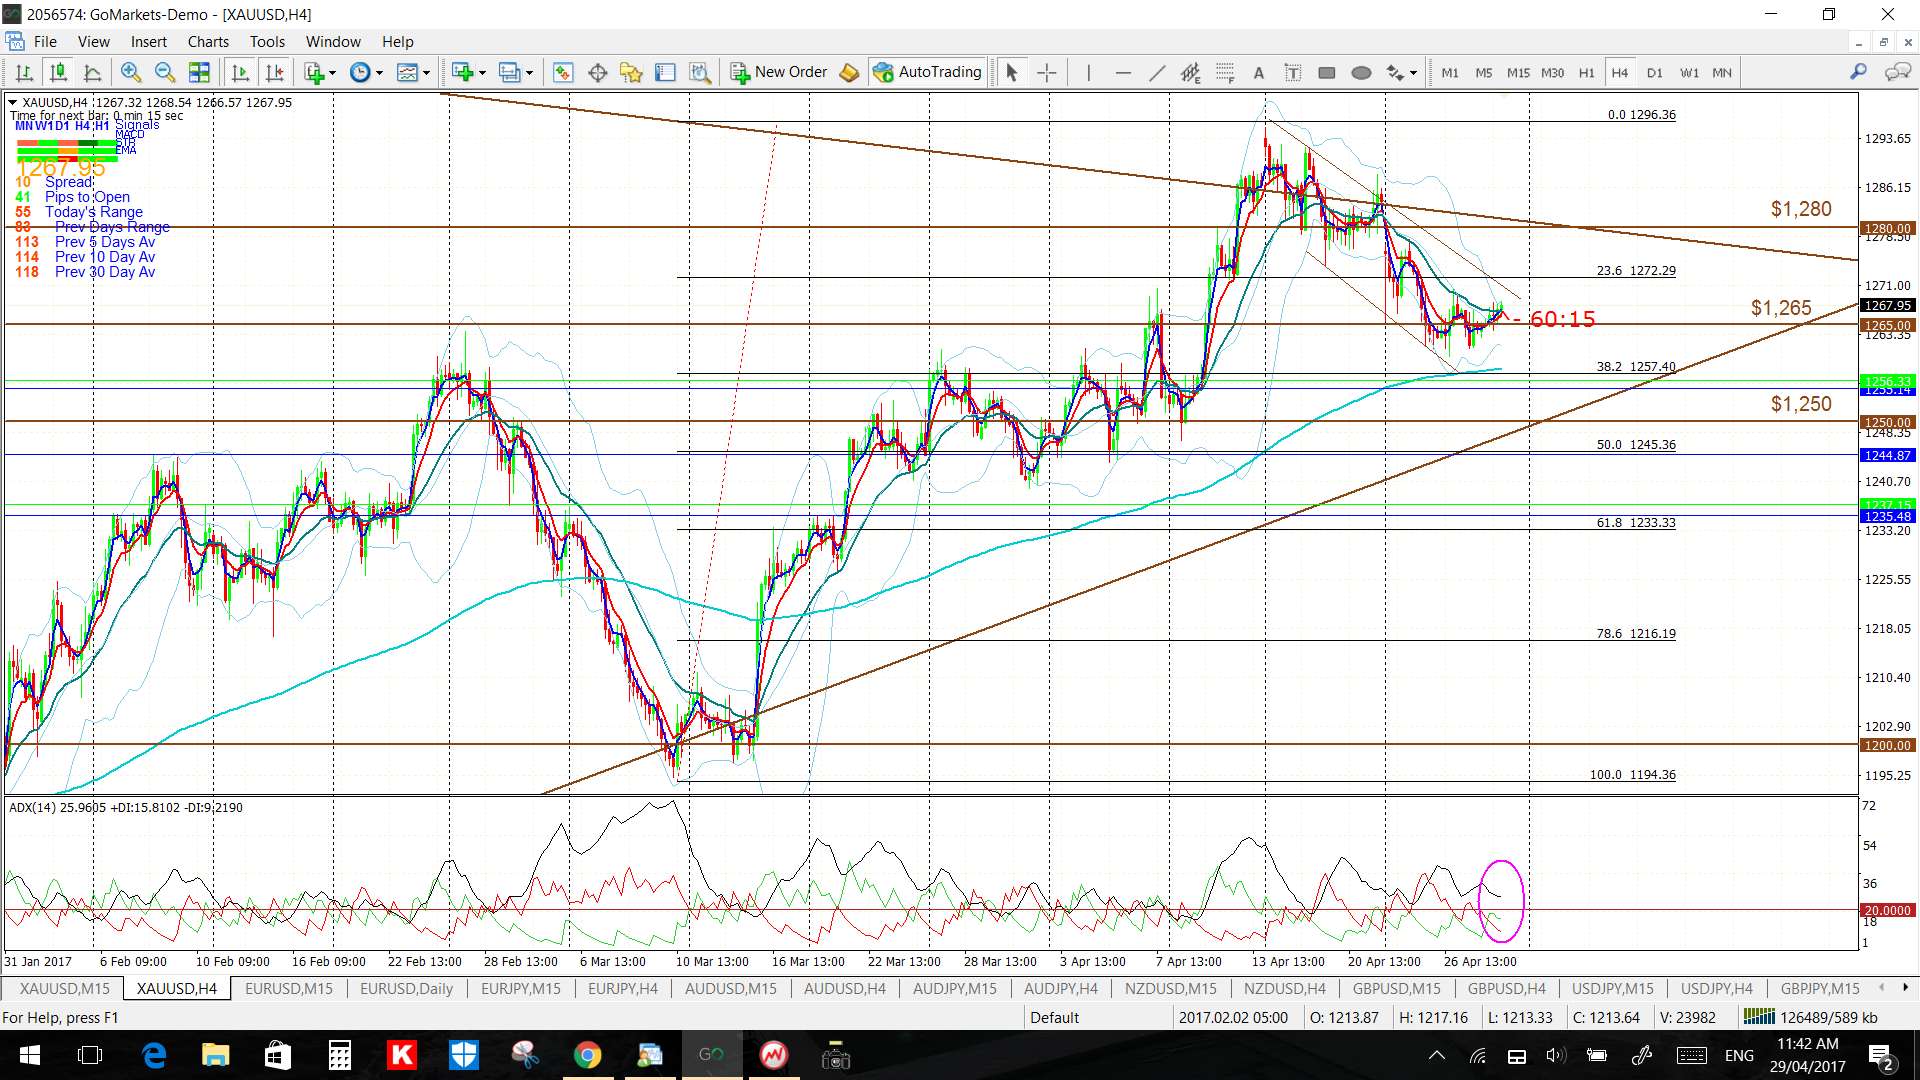
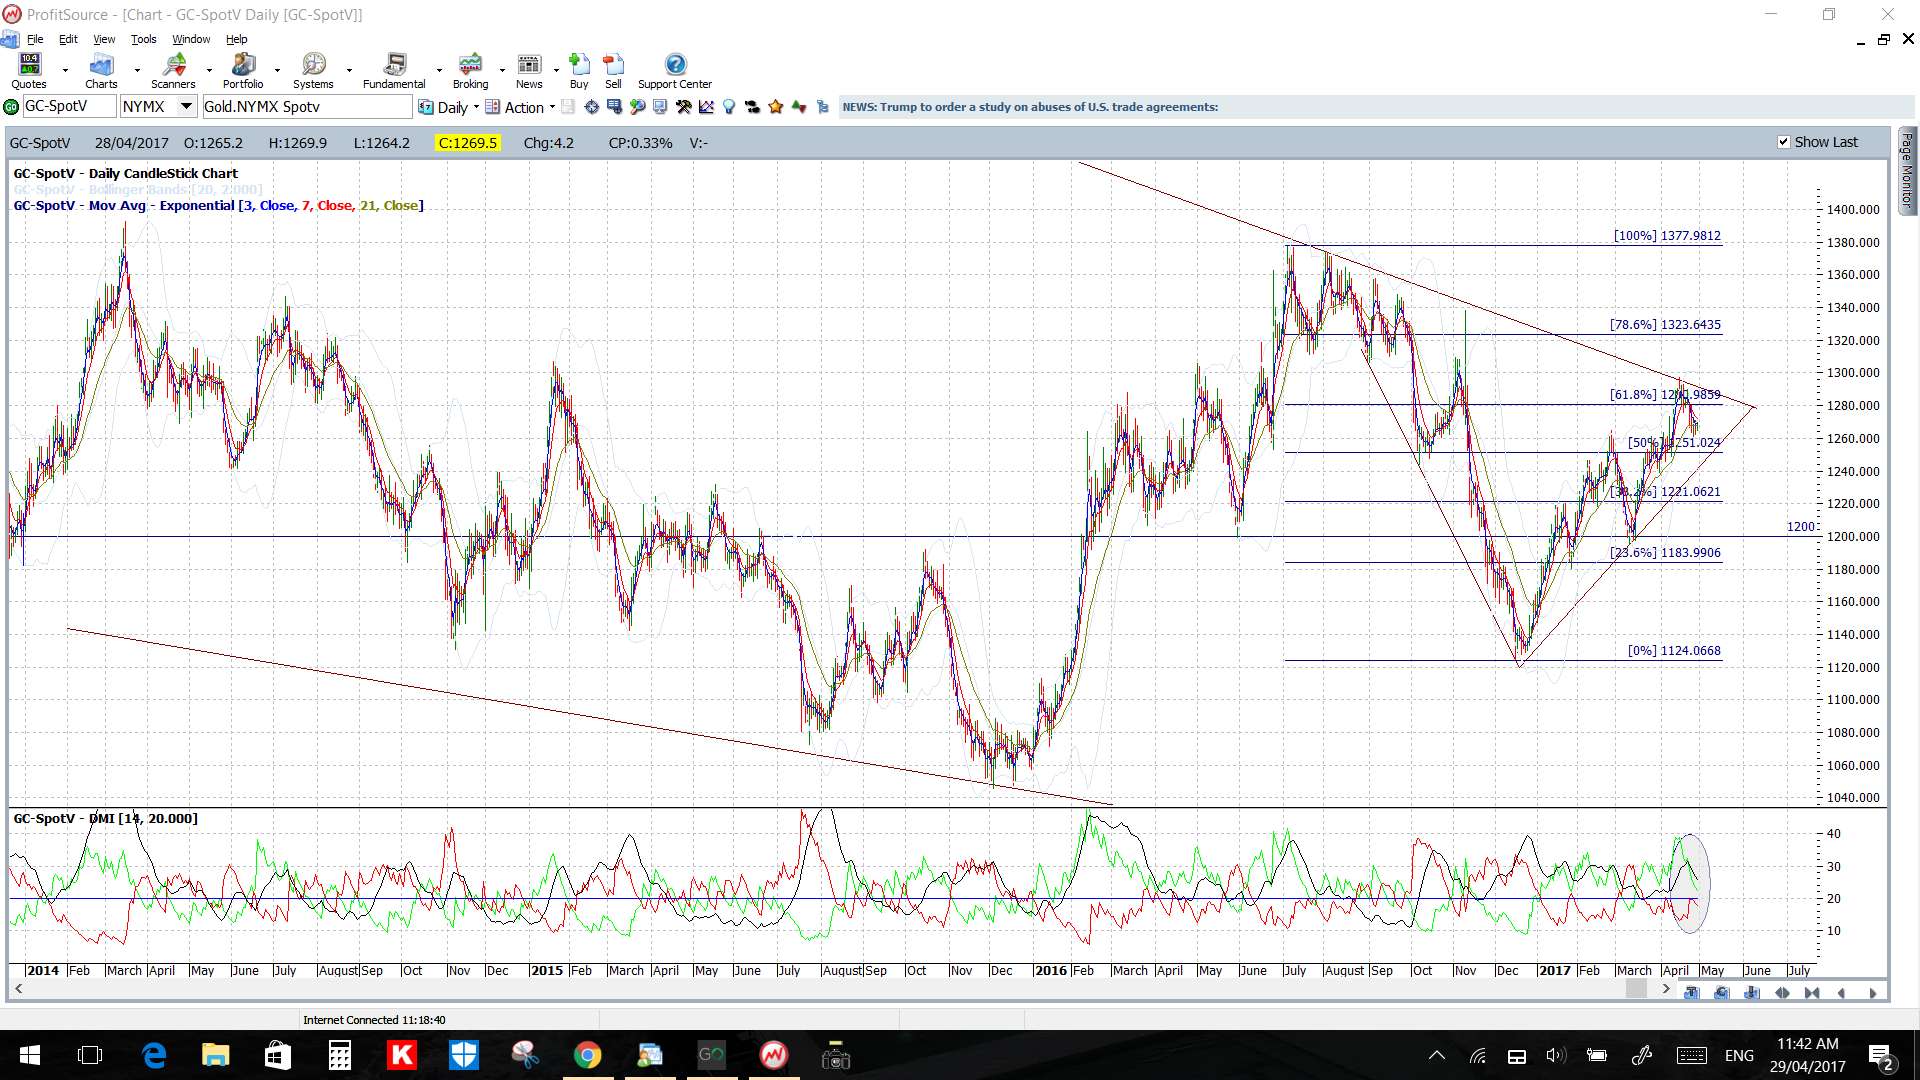
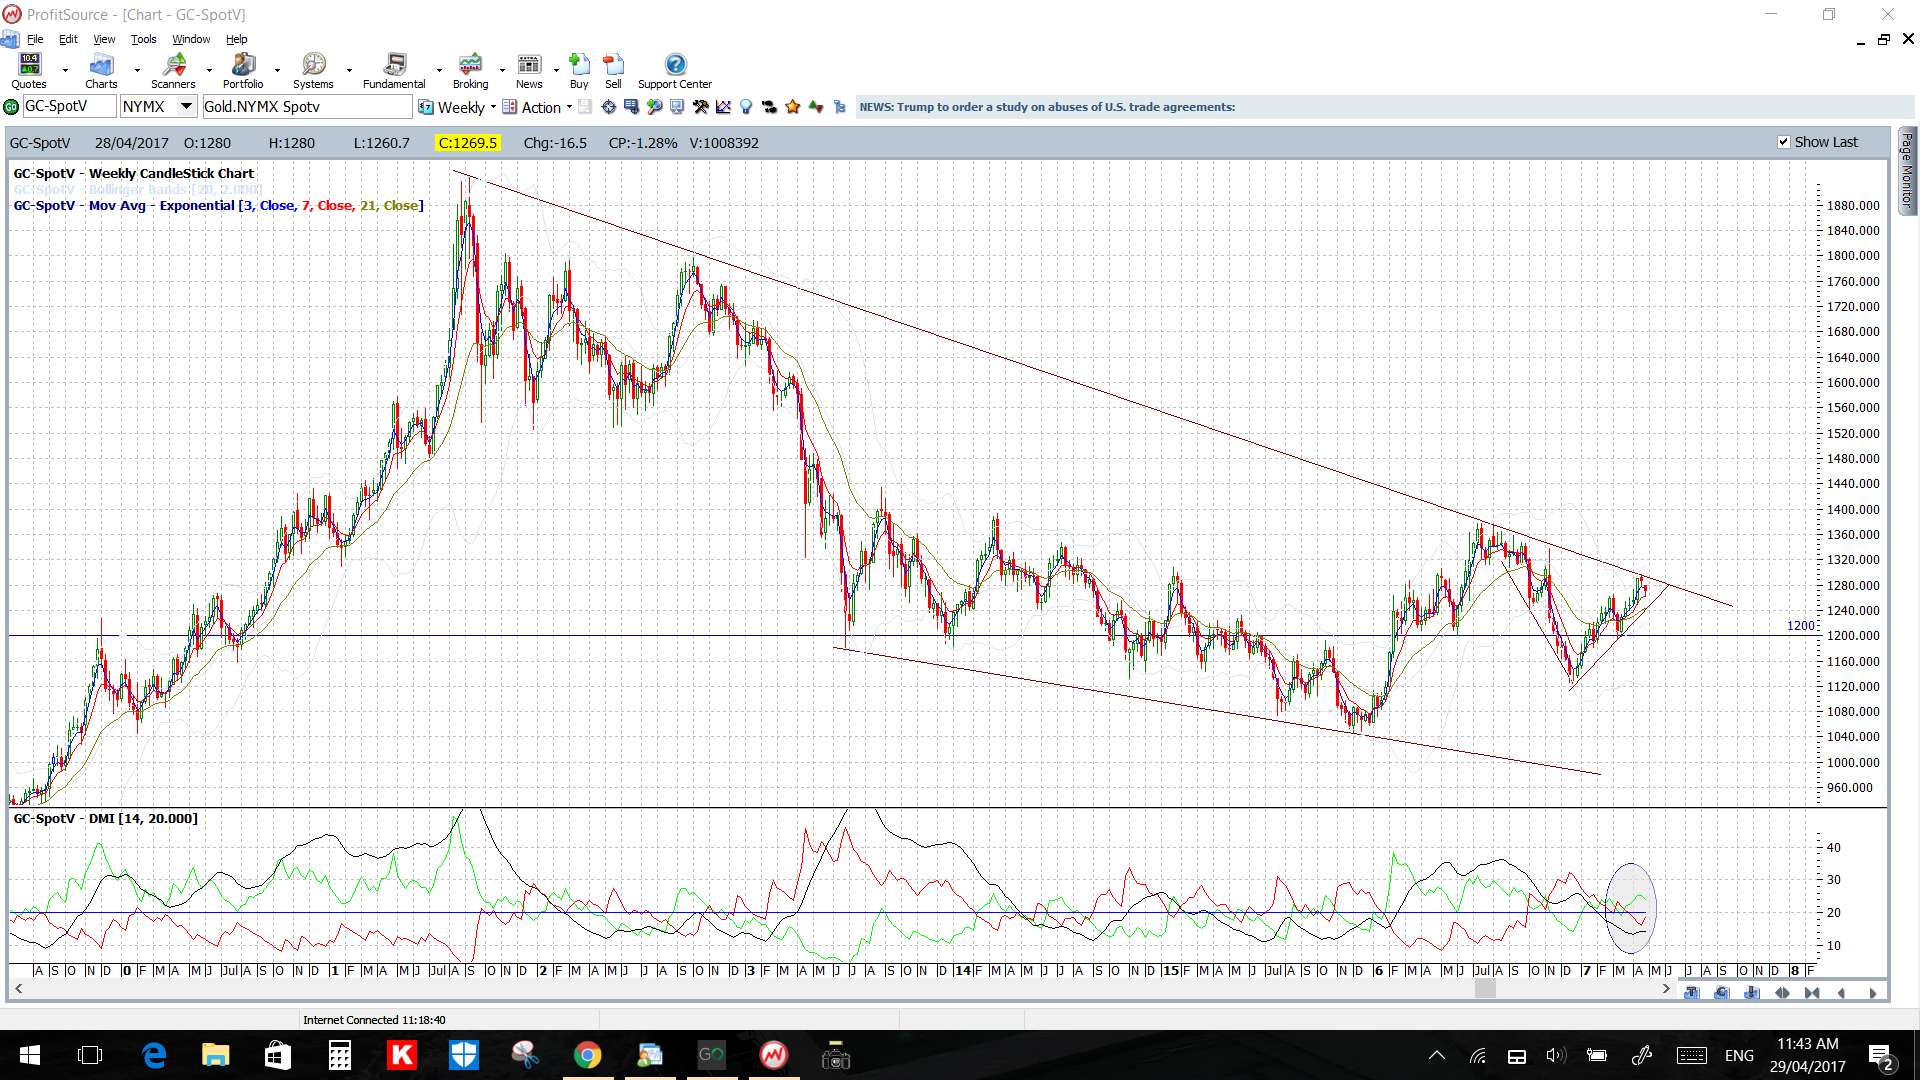
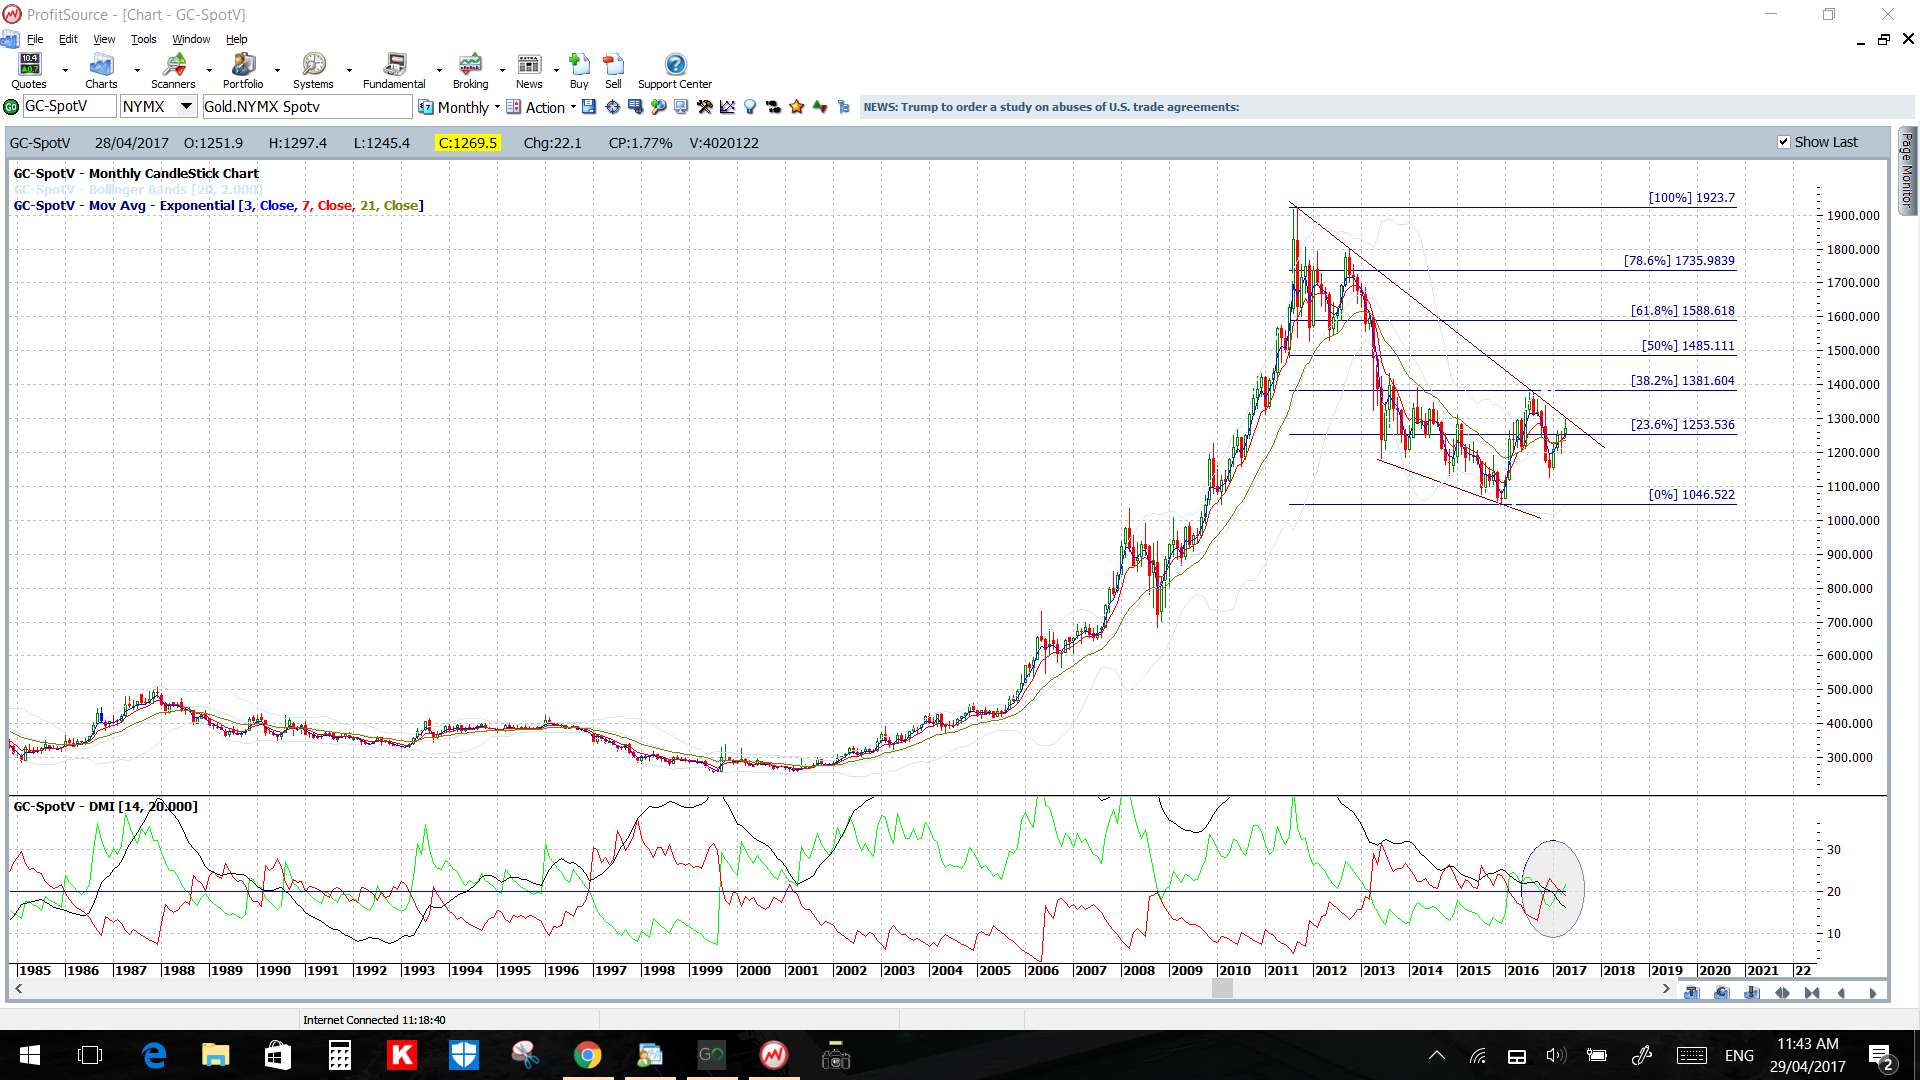
Gold: Gold, continues to consolidate under the 6-year bear trend line so watch these Flag trend lines for any momentum-based trend line breakout. Note how it held above the key $1,265 level and 4 1/2 month support trend line though.
- Any bearish break below the Flag and $1,265: would bring the 4 1/2 month support trend line, $1,250 and then 61.8% Fib near $1,235 into focus.
- Any bullish break above the Flag and $1,265: would bring the $1,280 and 6-year bear trend line into focus.
Price is below the 4hr Cloud but above the daily Cloud.
The weekly candle was bearish but the monthly candle was bullish.
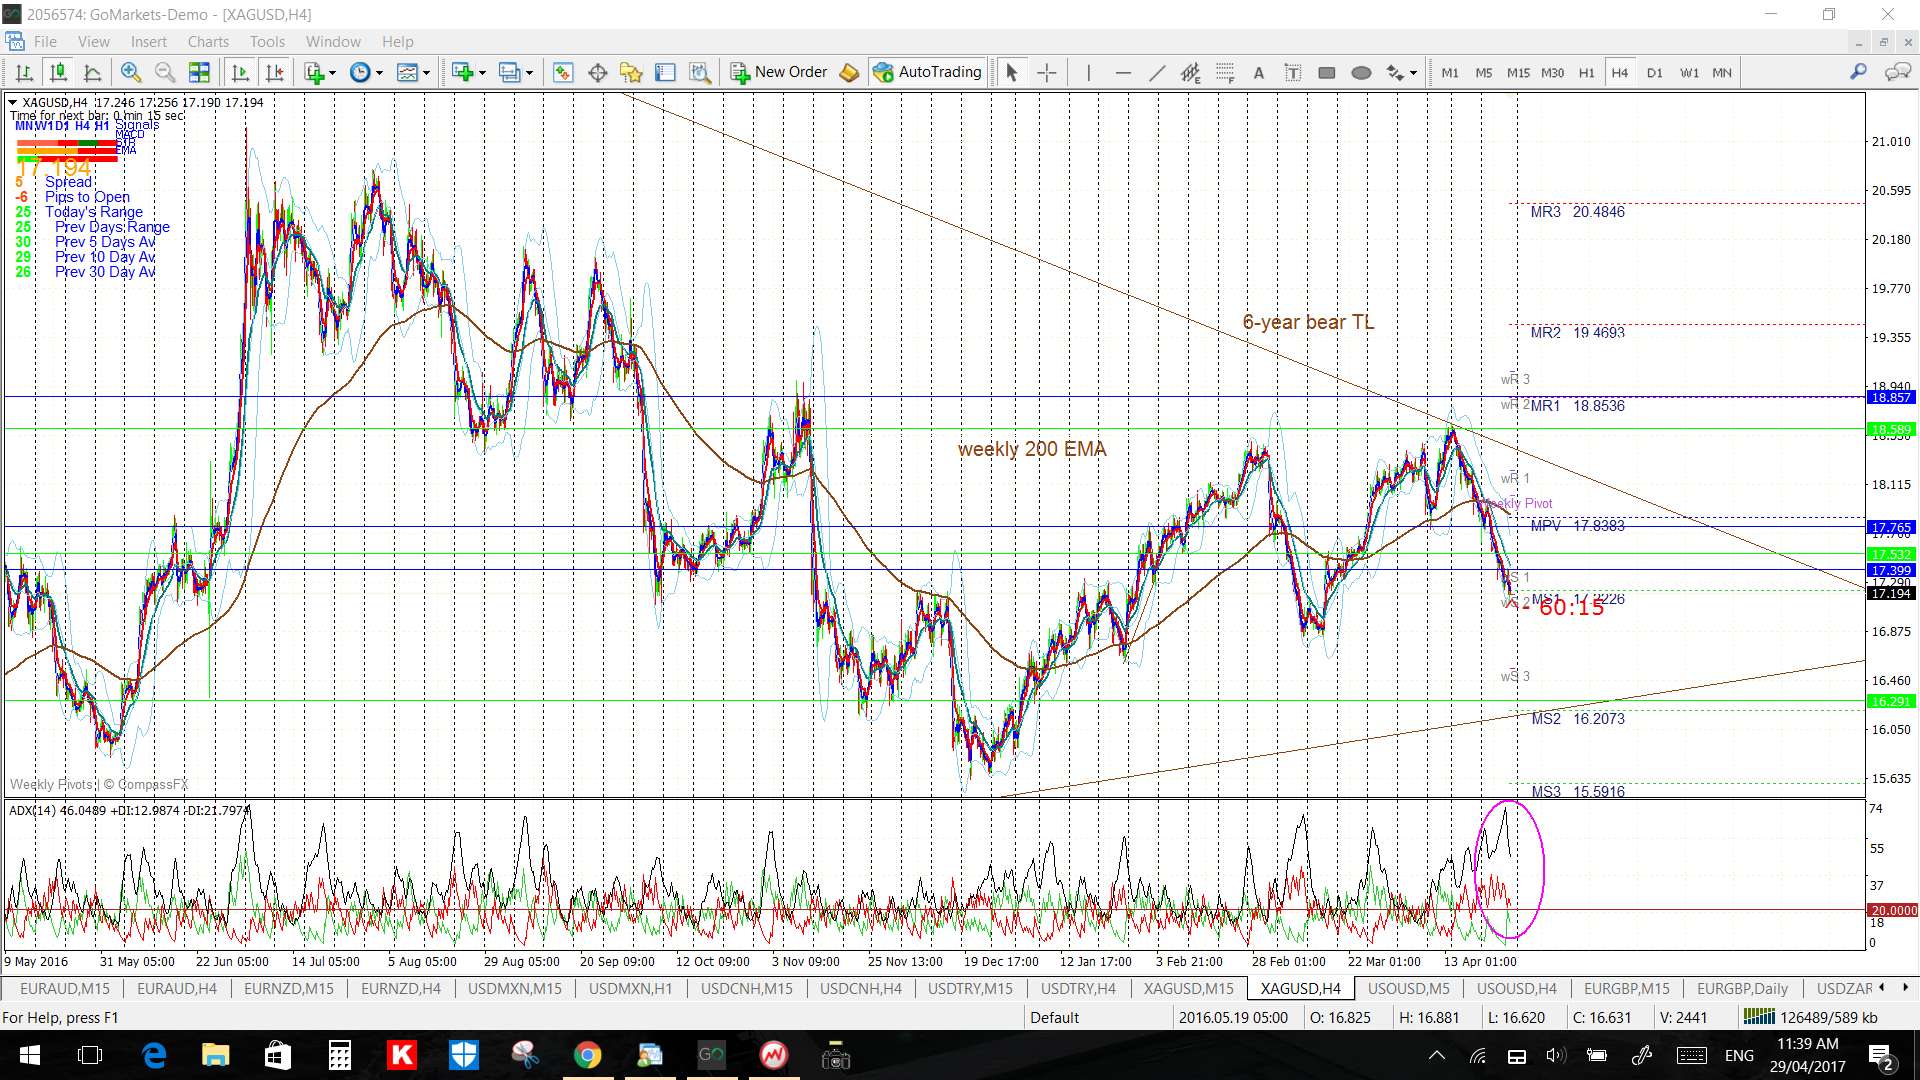
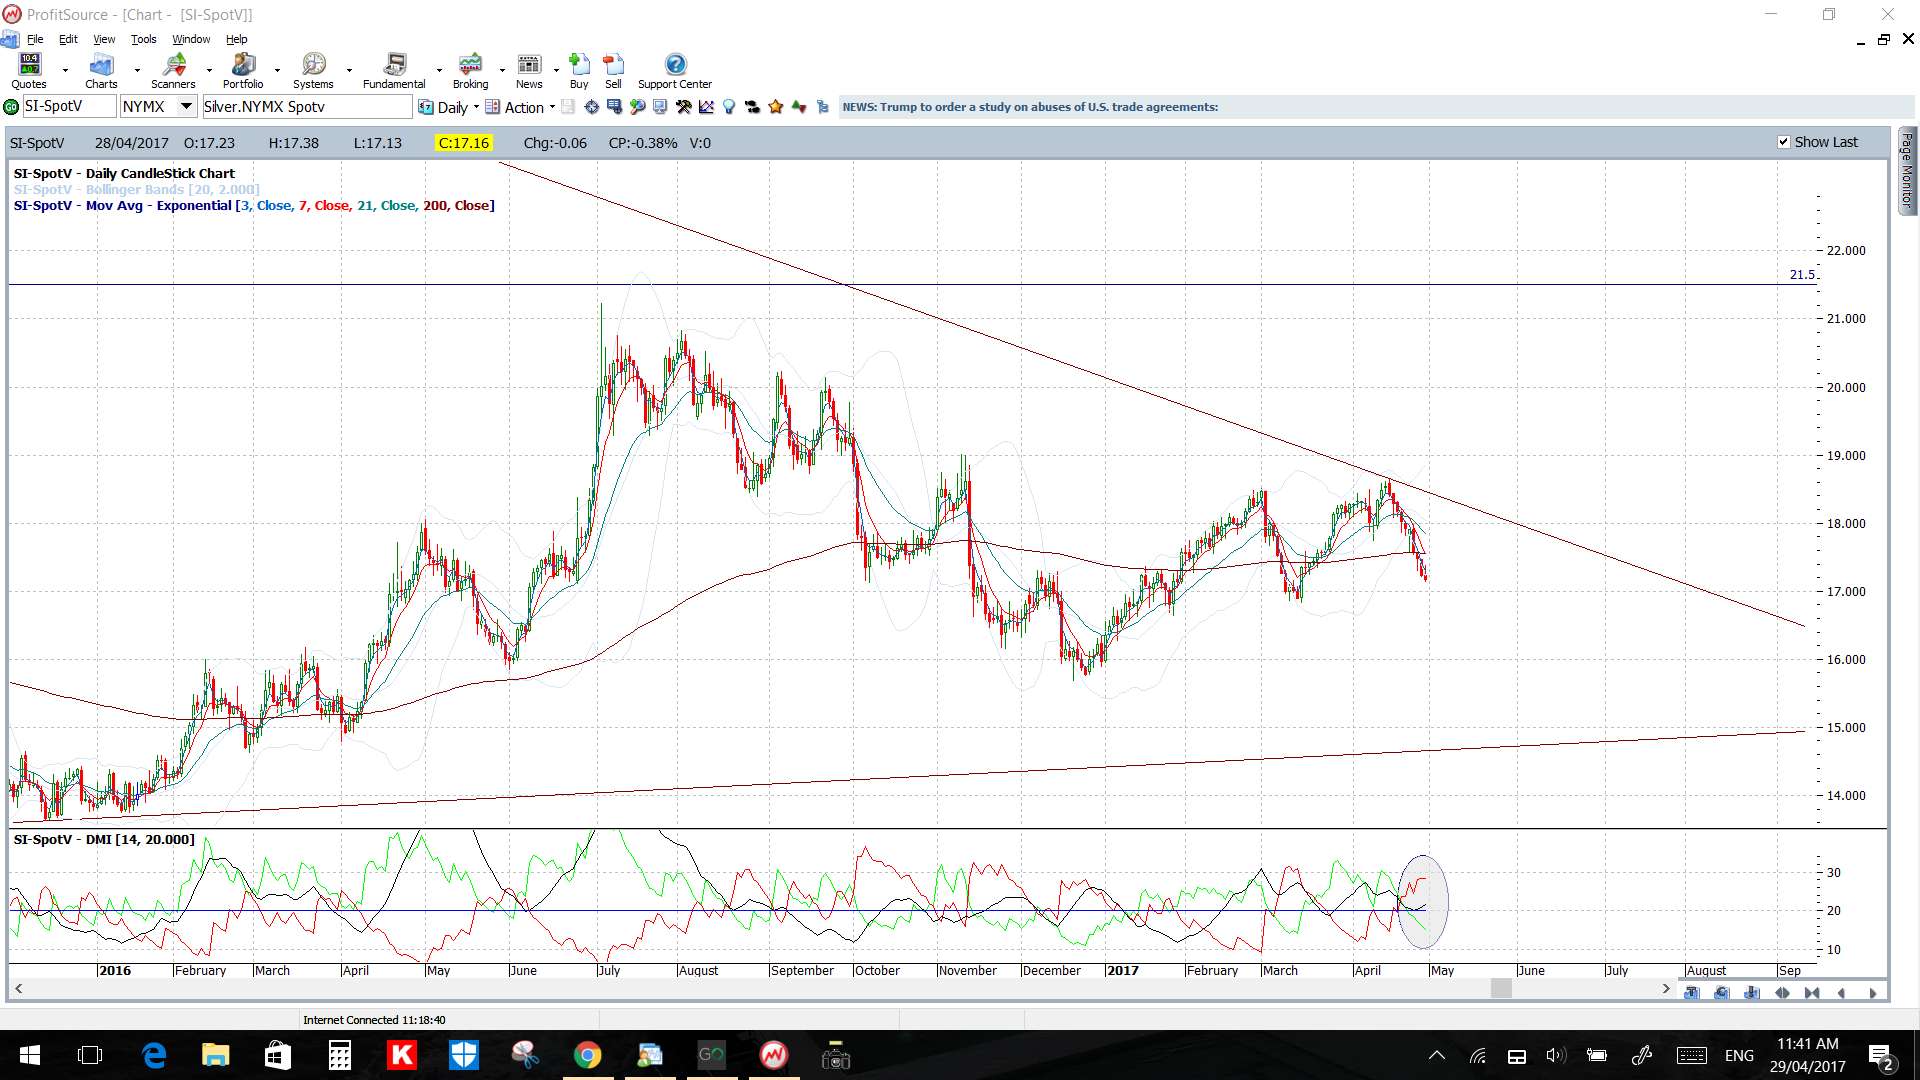
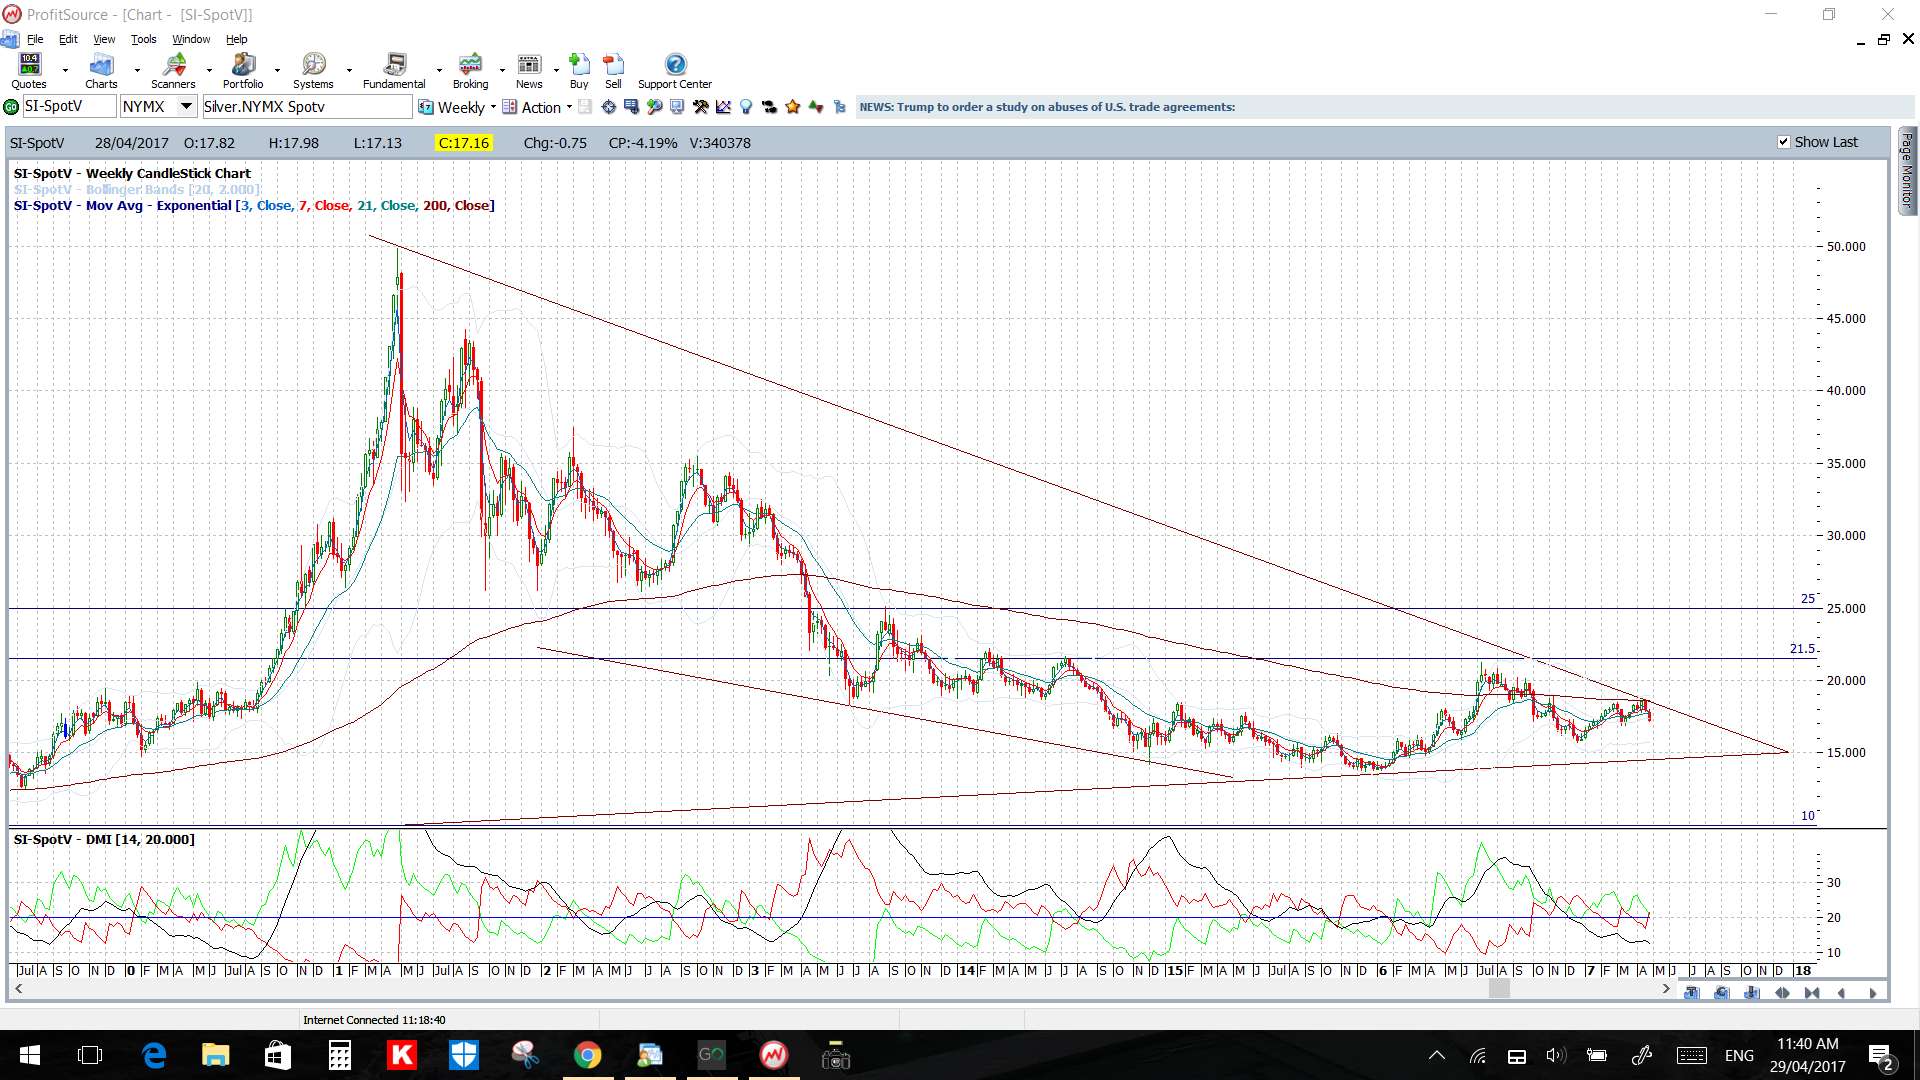
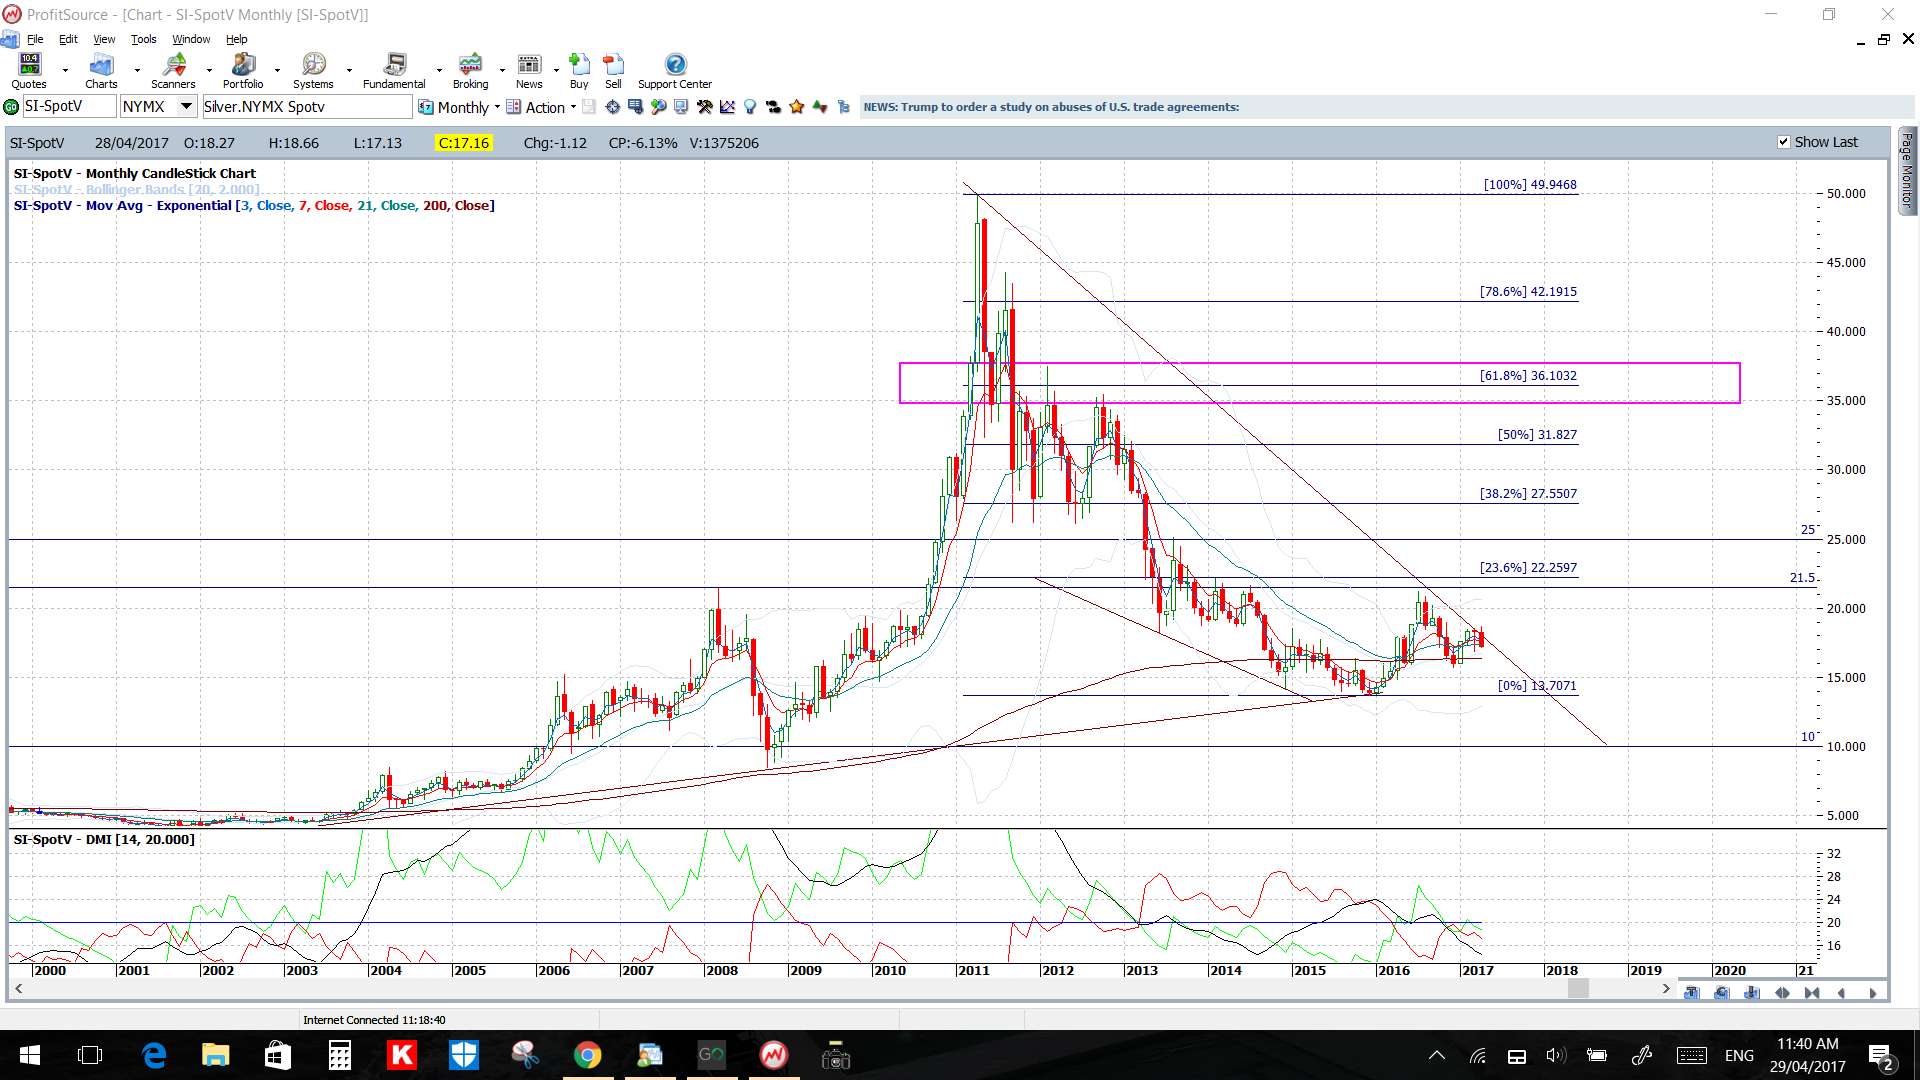
Silver: I’ve adjusted Silver’s 6-year bear trend line given the lack of any bullish follow-through. This has helped to form up a triangle on the 4hr chart giving traders trend lines to watch for any momentum-based breakout.
Price is below the 4hr and daily Cloud.
The weekly and monthly candles were bearish.
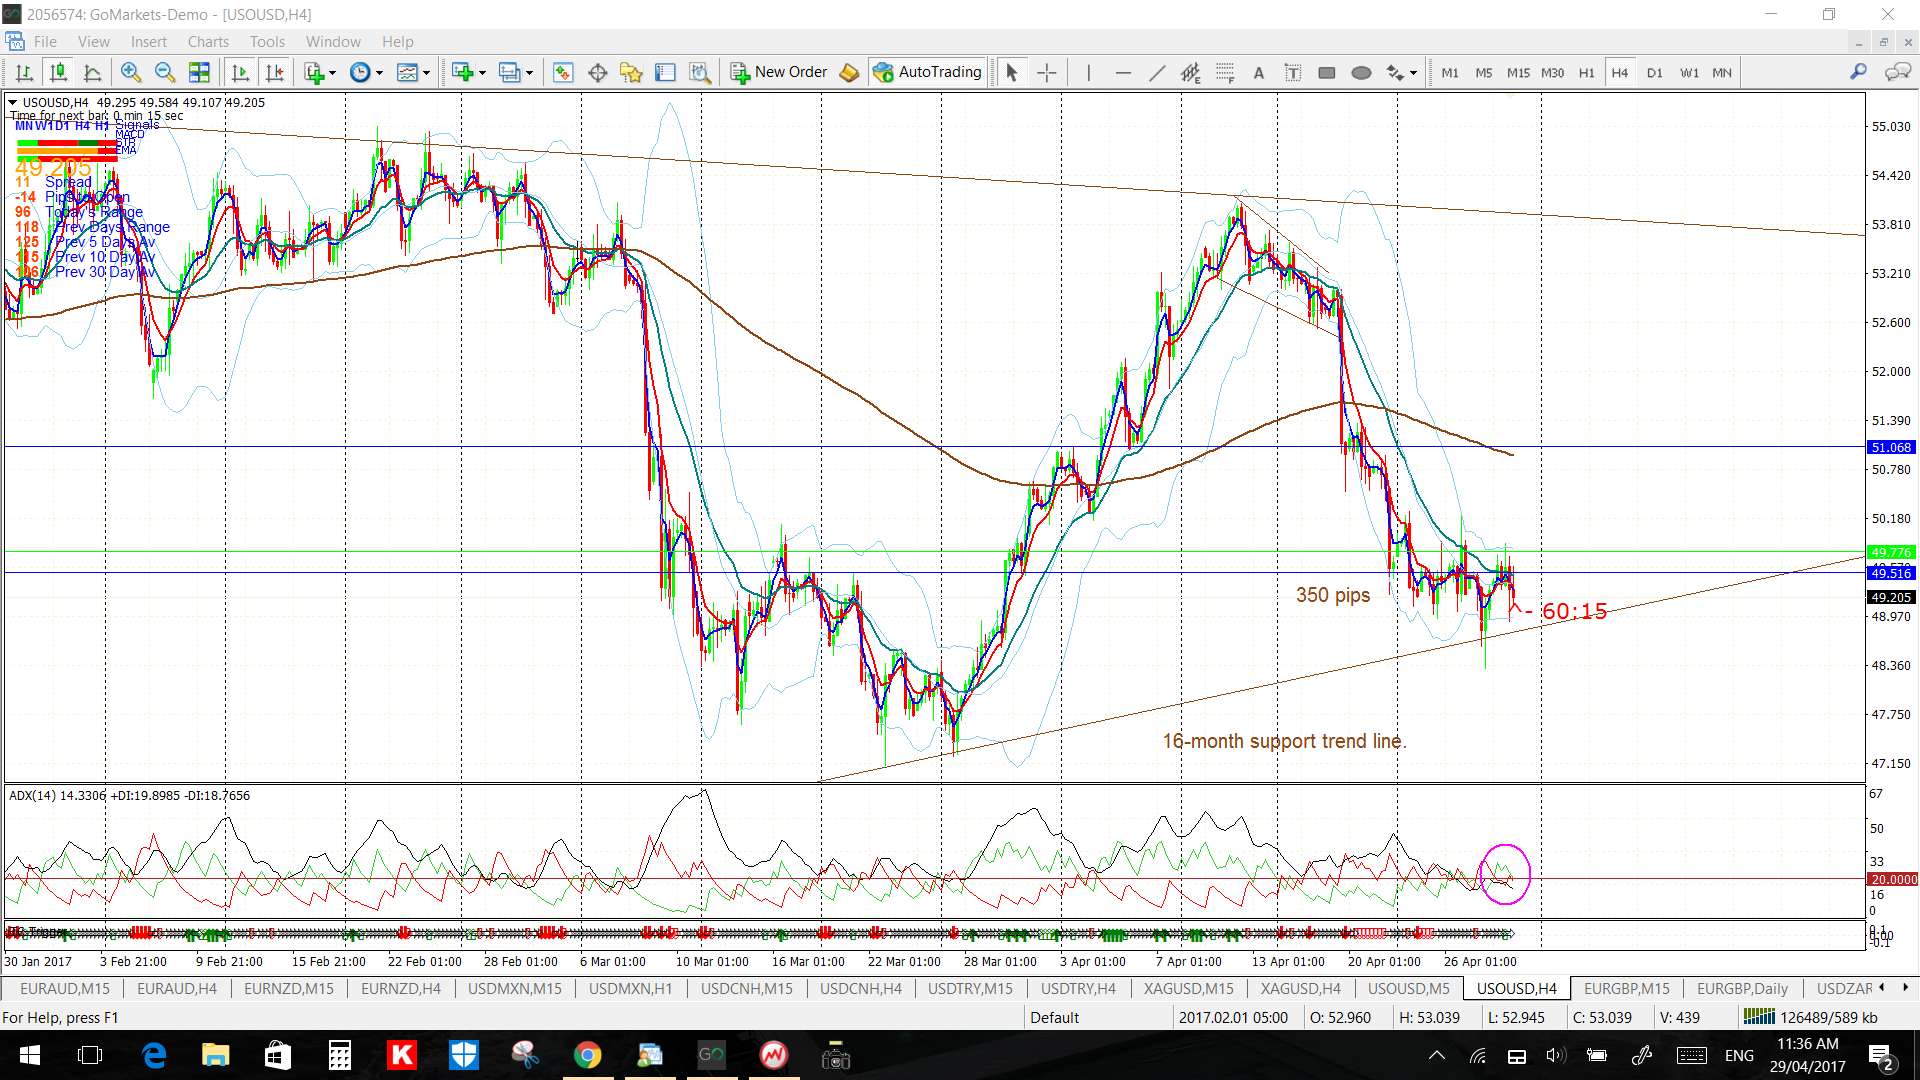
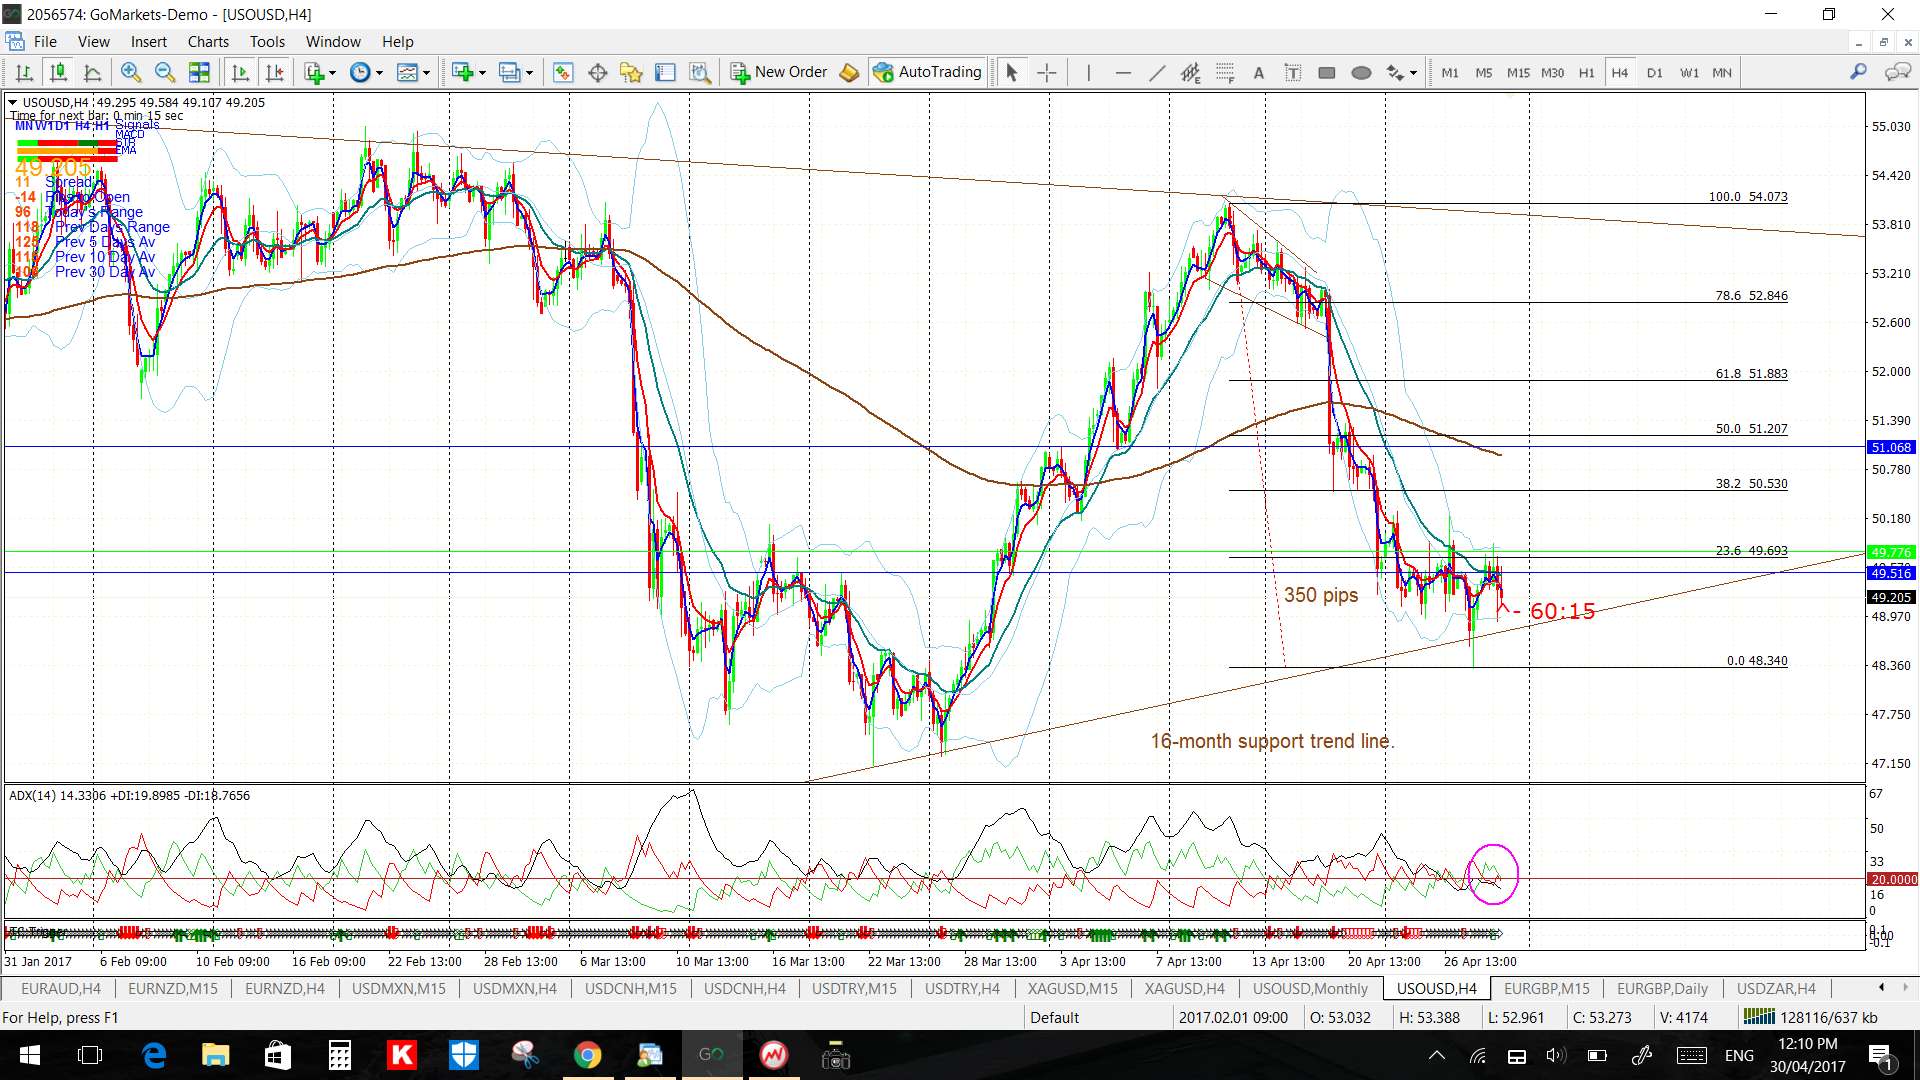
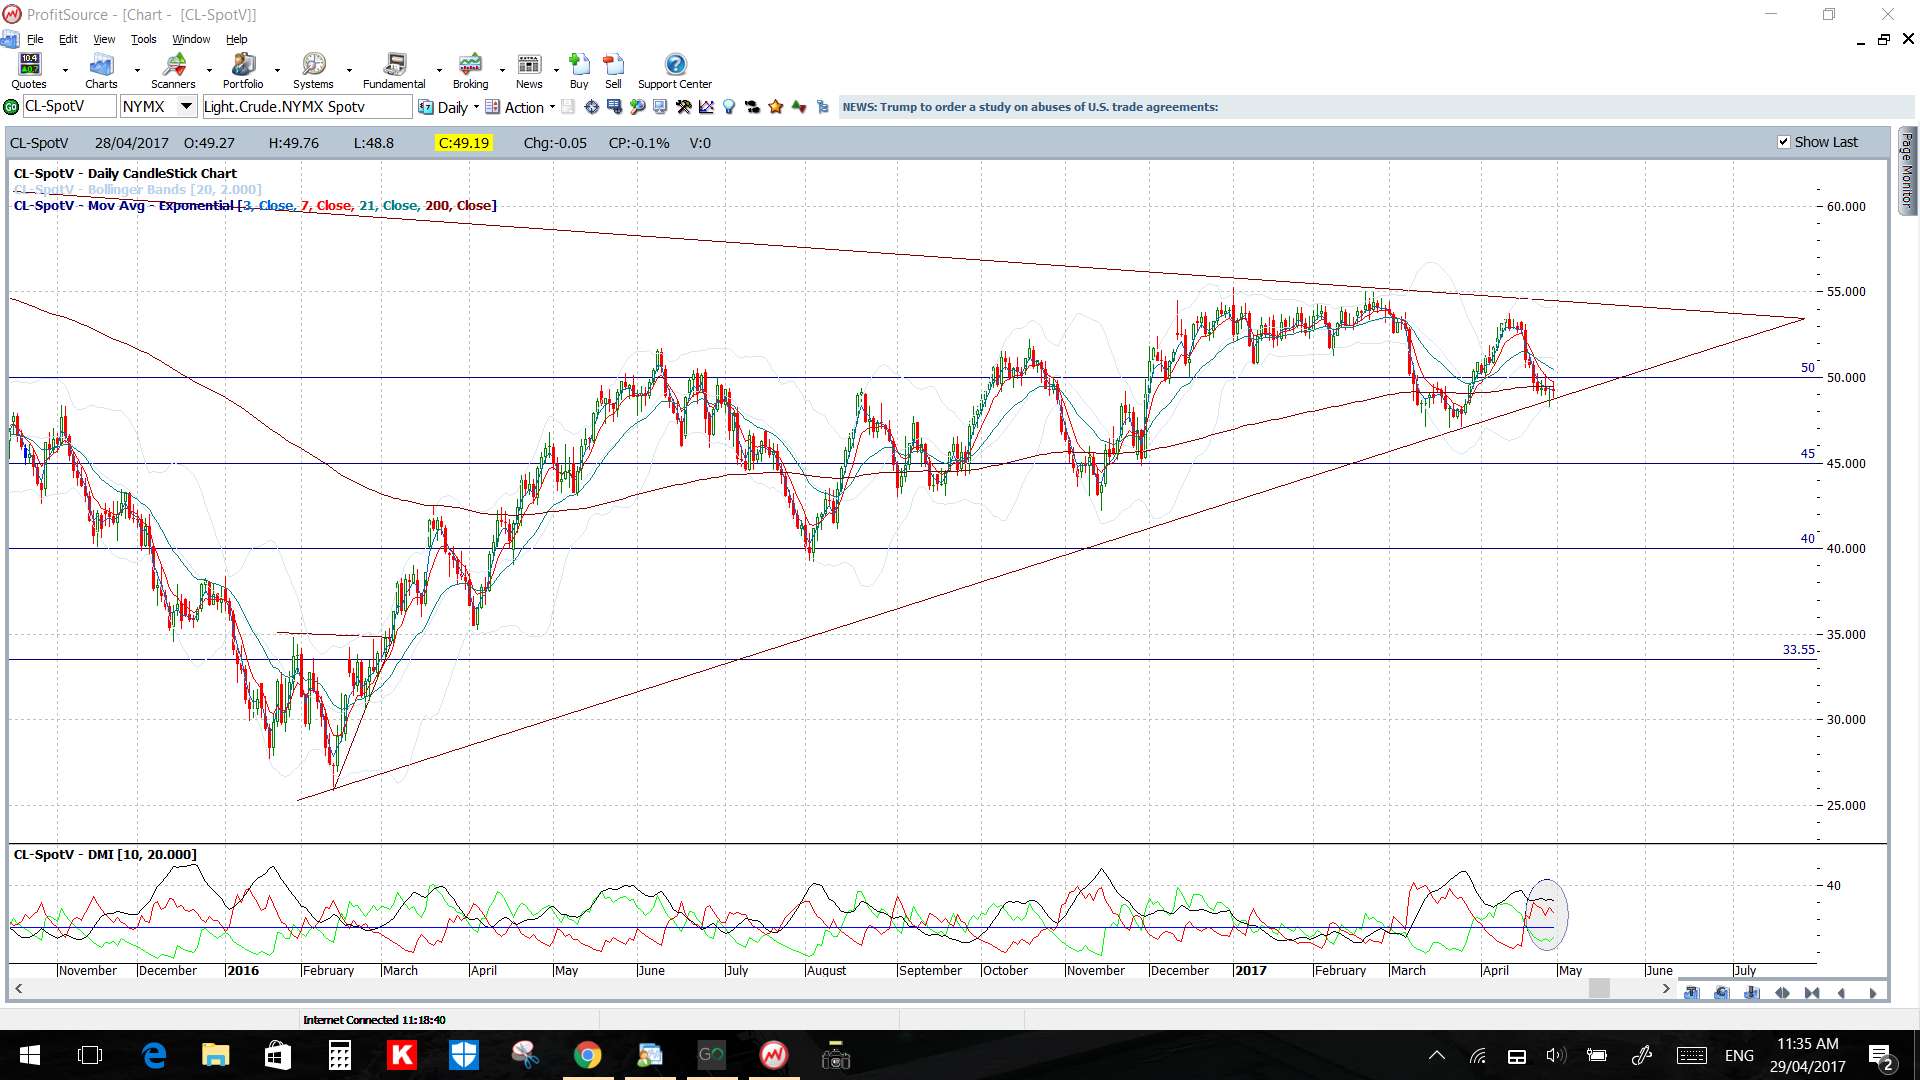
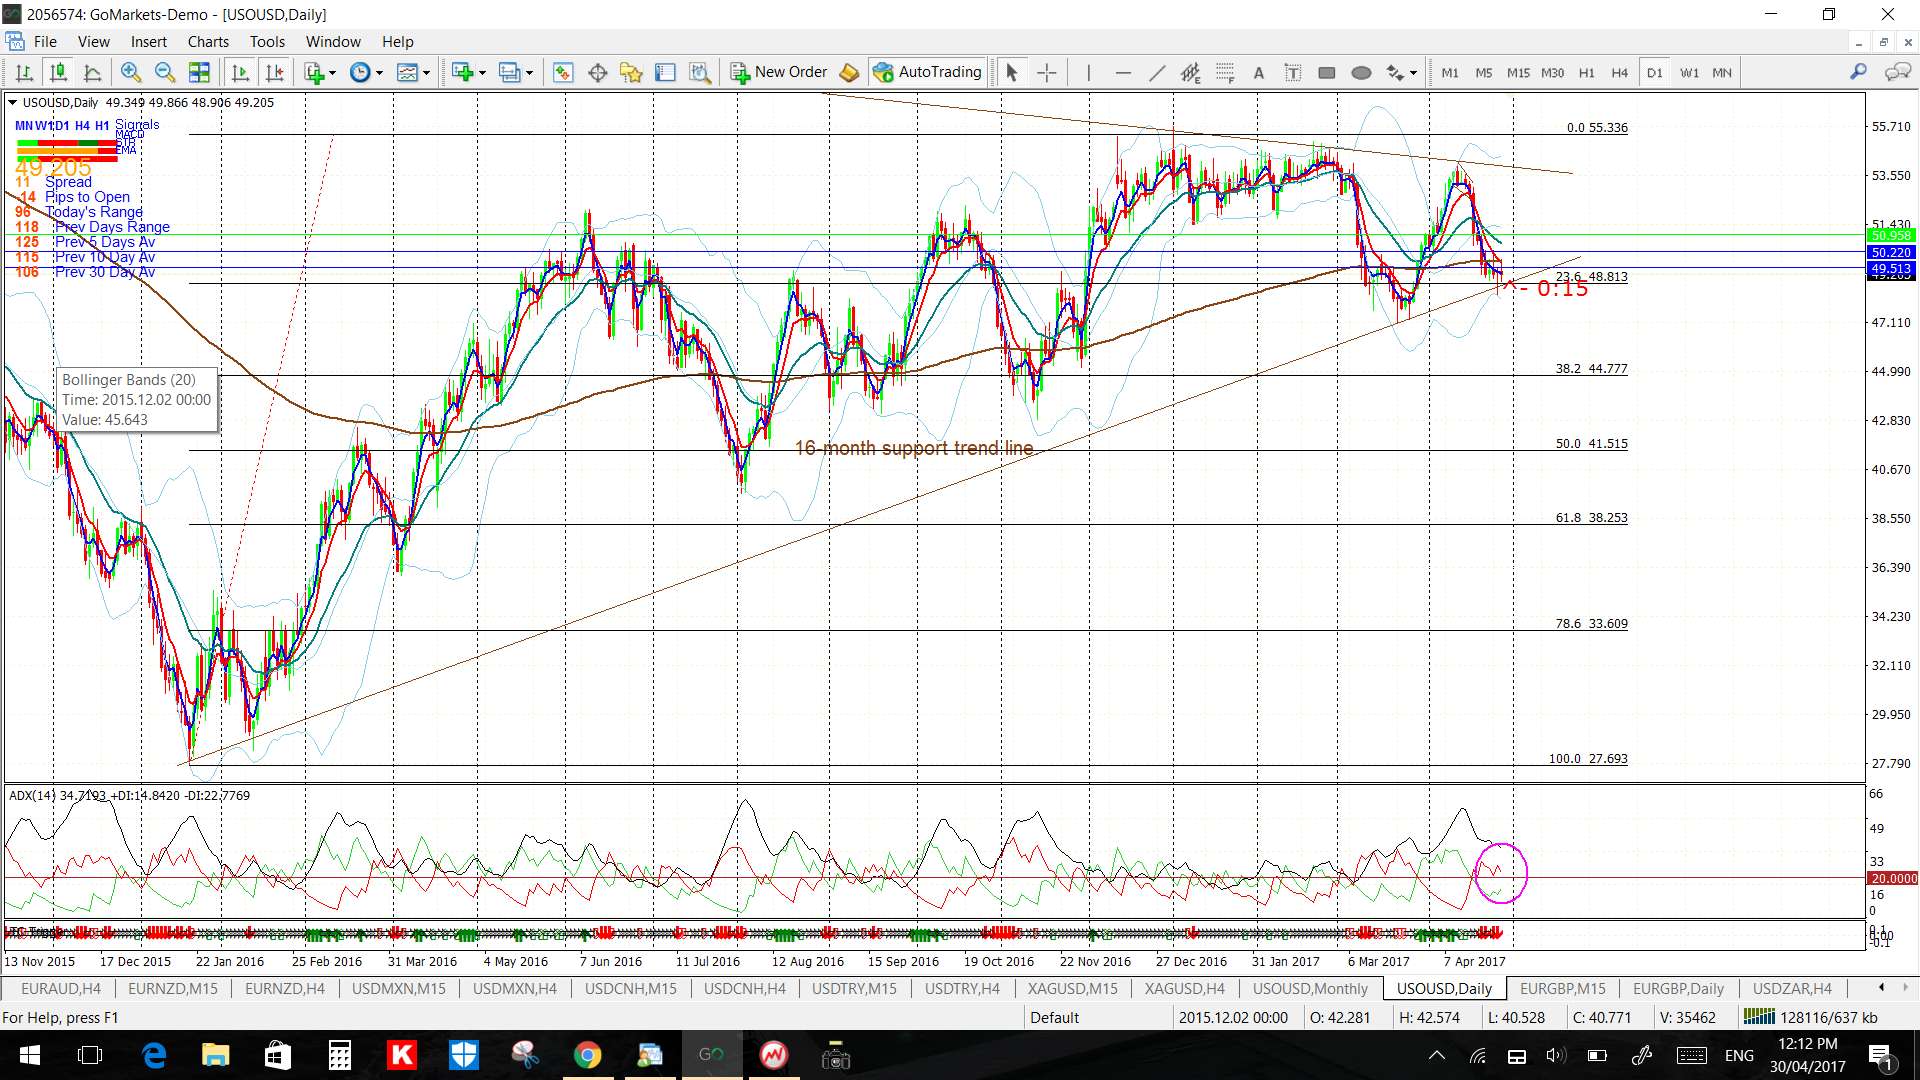
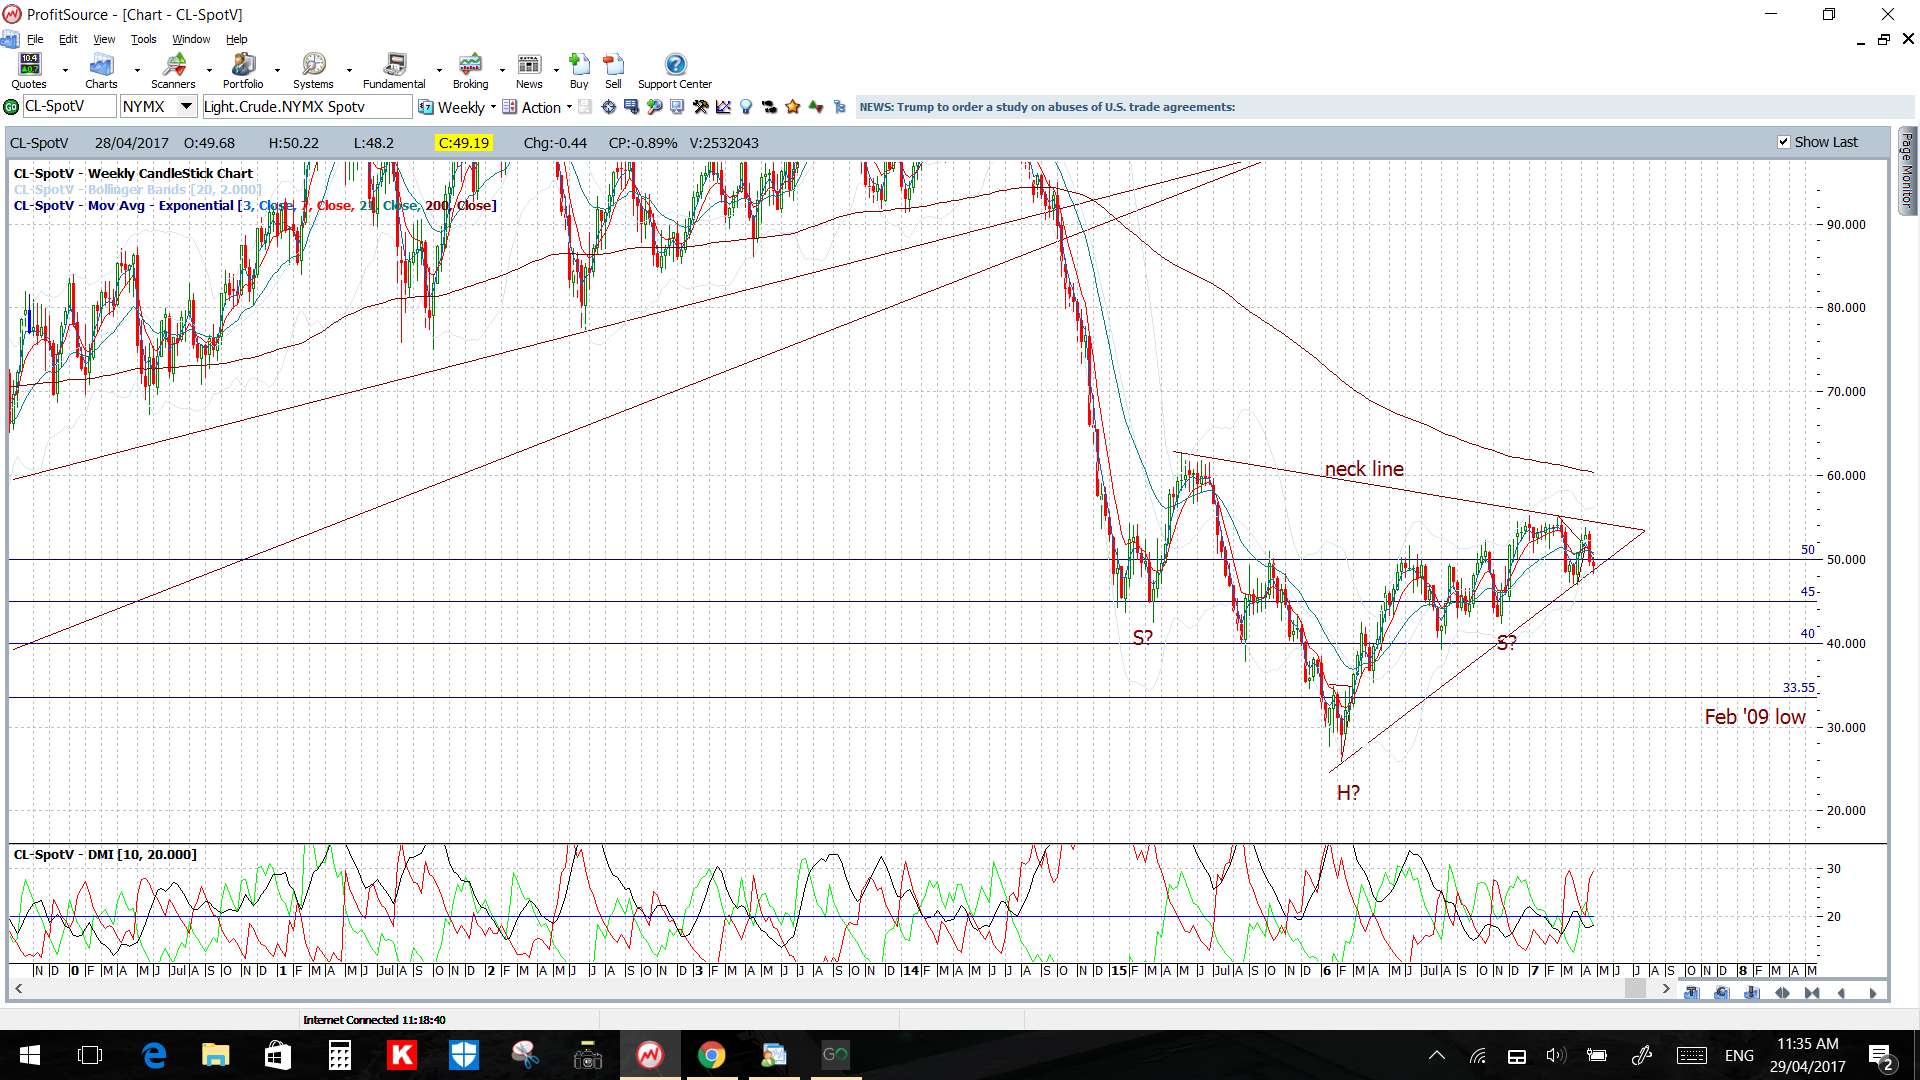
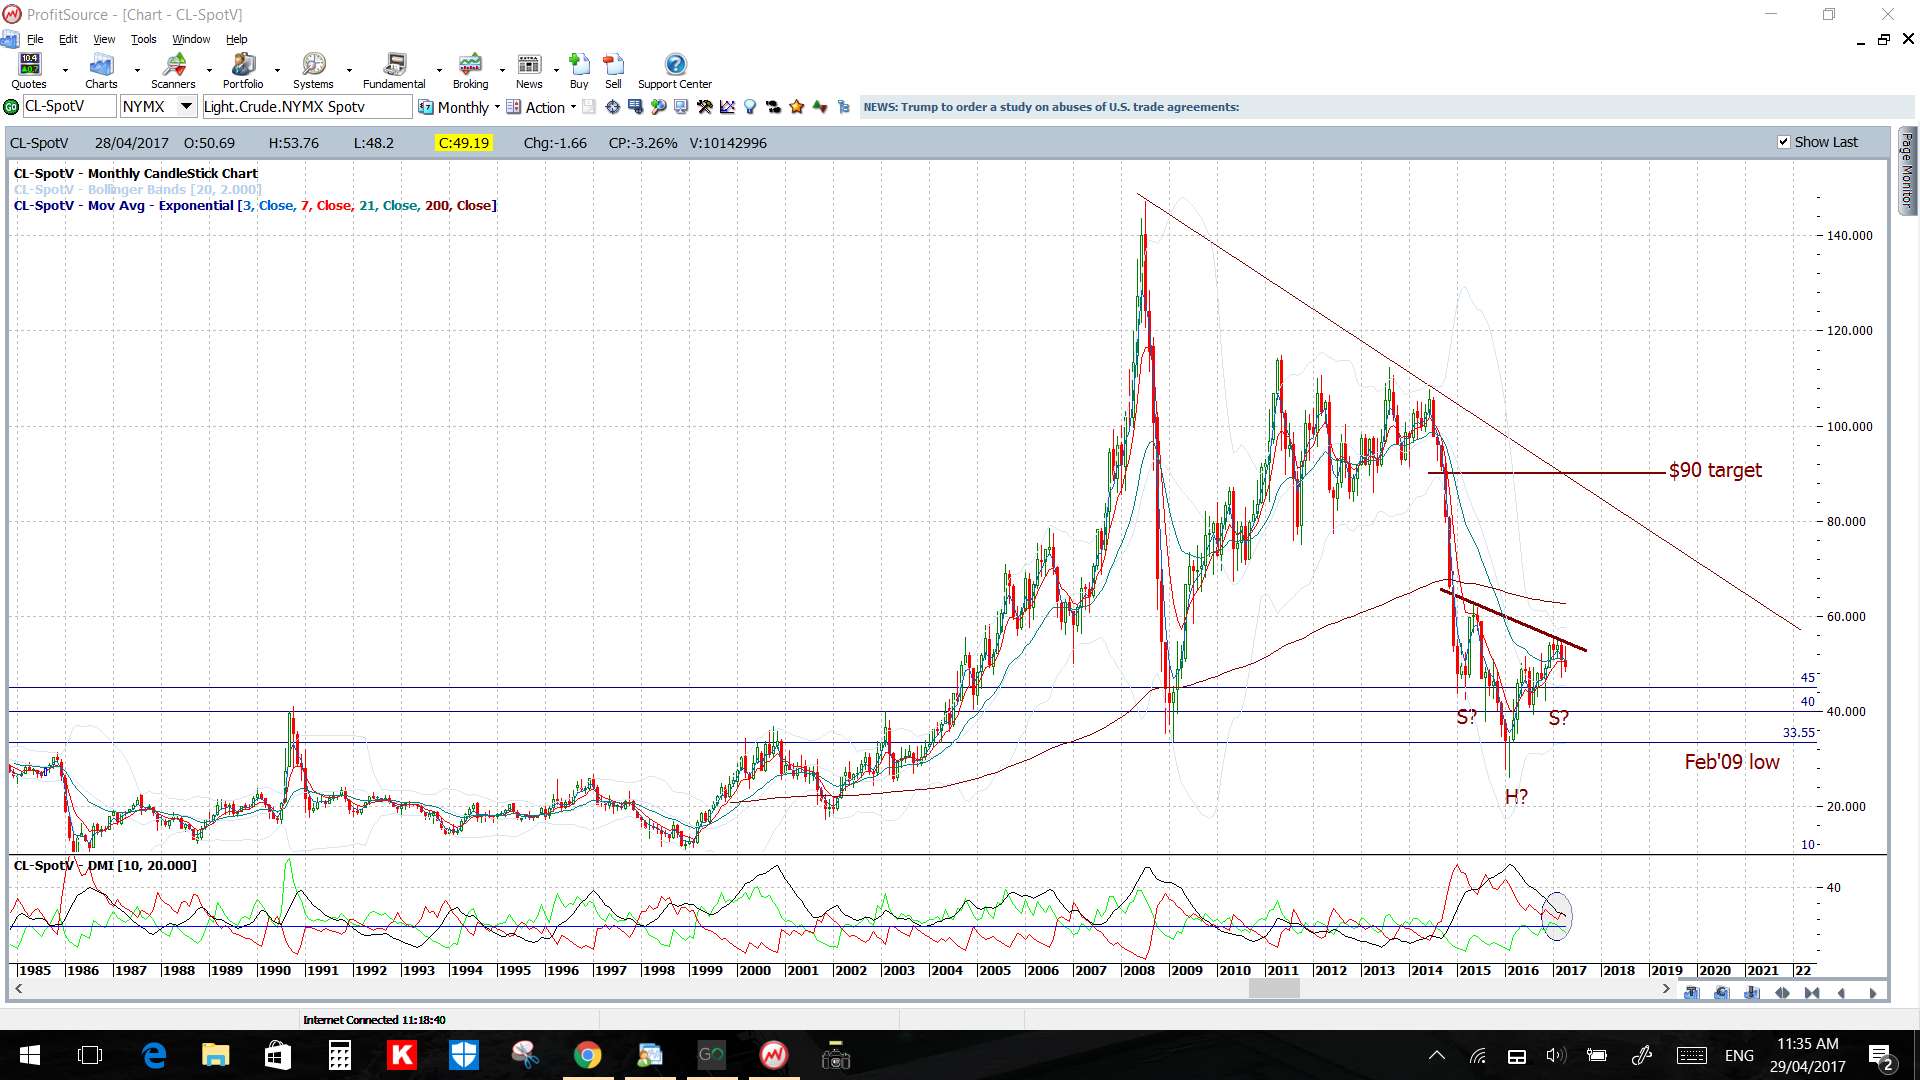
Oil: Oil is holding above a 16-month support trend line but this remains the region to watch for any make or break activity:
- any bounce would bring the 4hr chart’s 61.8% Fib near $52 into focus.
- any break would bring the daily chart’s 61.8% Fib near $38 into focus.
Price is below the 4hr and daily Cloud.
The weekly and monthly candles were bearish.
Stock Indices: The 4hr charts of the stock indices show various consolidation patterns so watch these for any momentum-based trend line breakout.
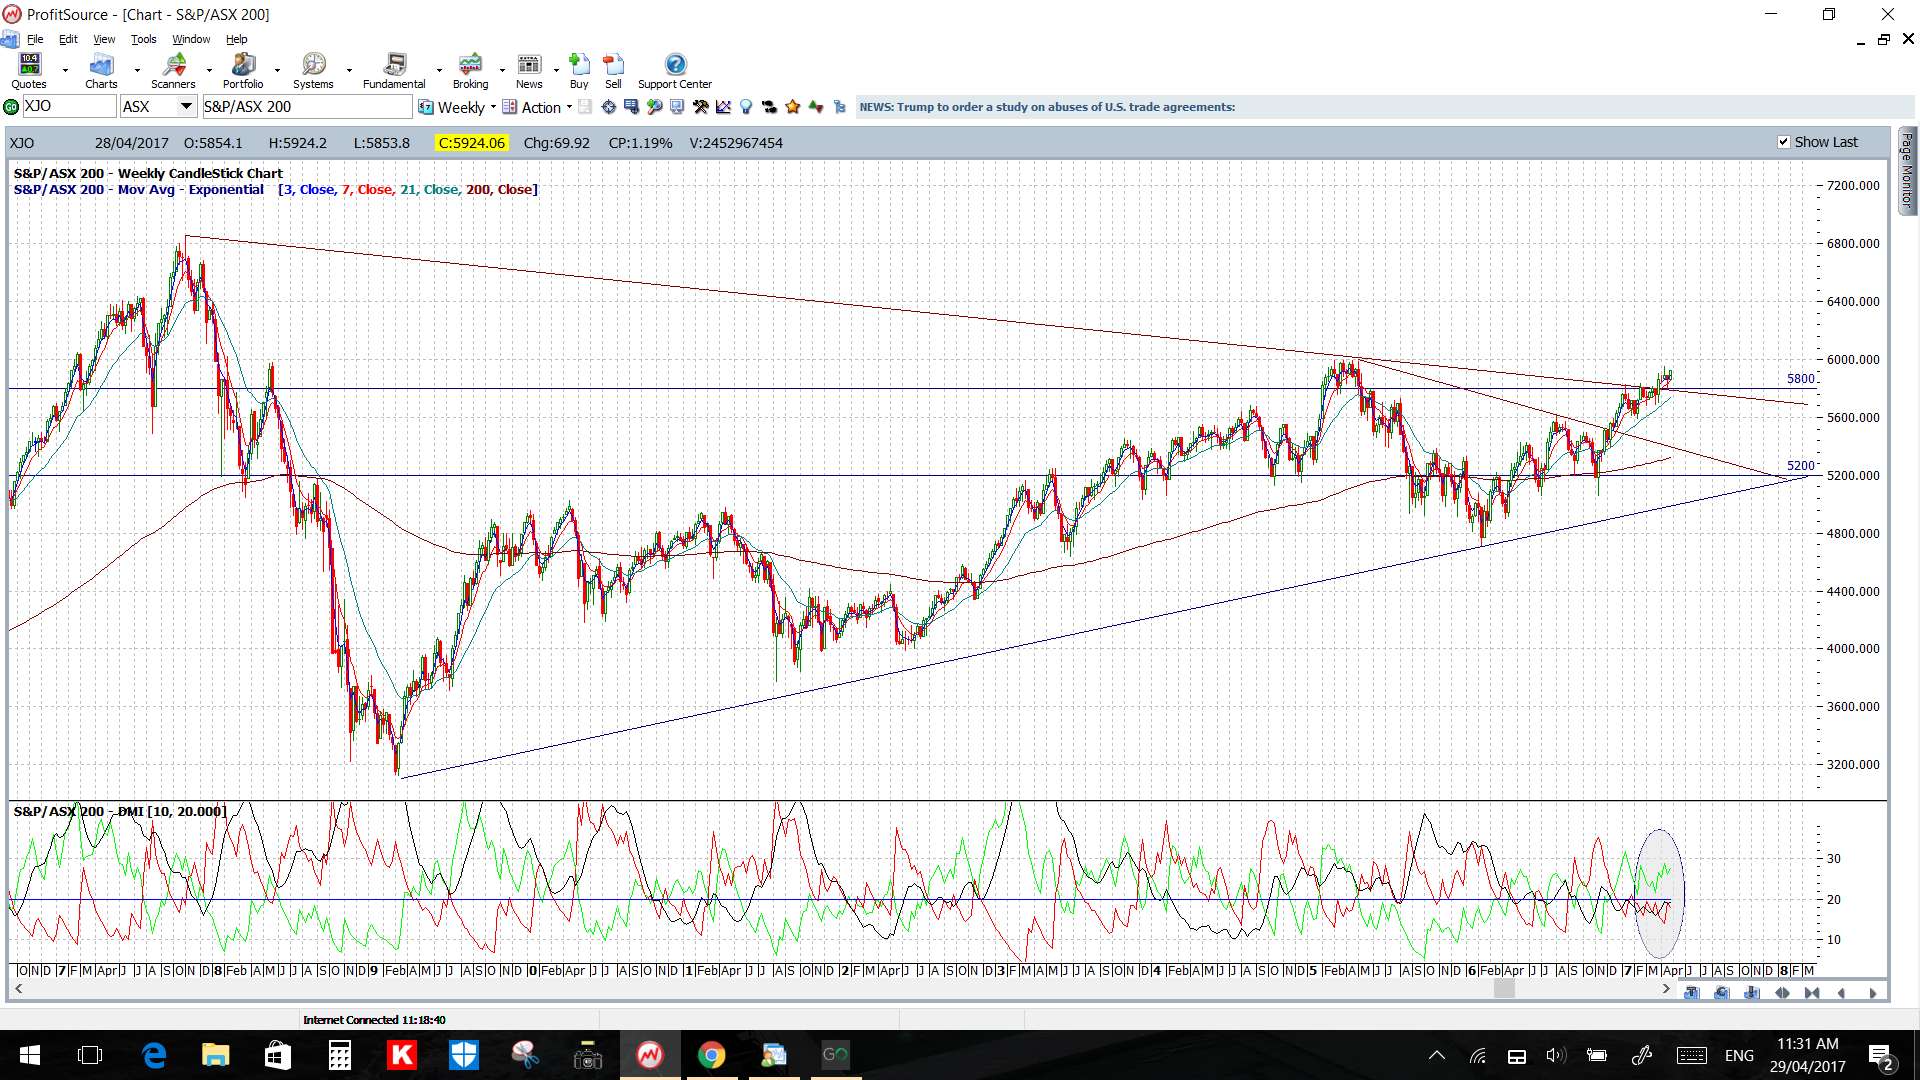
ASX-200: Price action has held above the triangle trend line and 5,800 S/R level. The next main level to watch is the psychological 6,000 level which is just above current price.
S&P500 4hr:
DJIA 4hr:
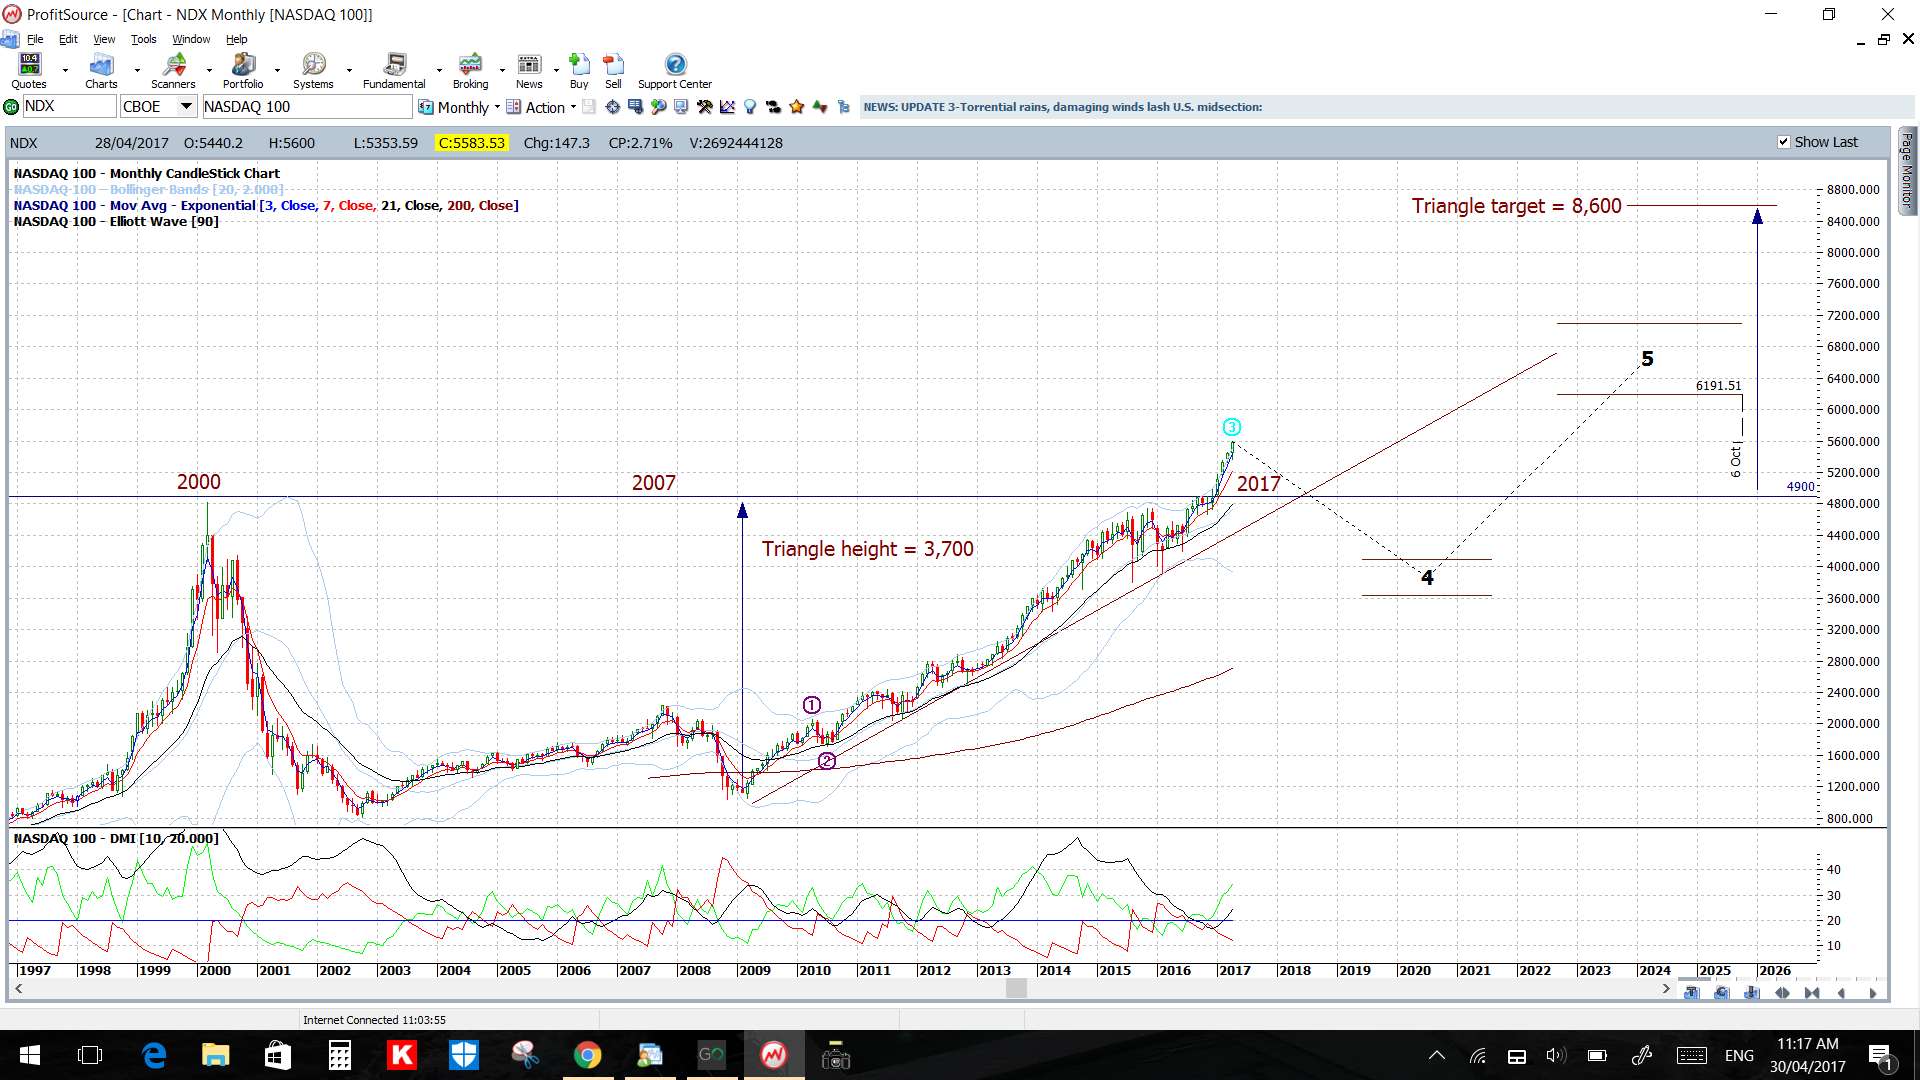
NASDAQ-100: this is looking rather bullish on the monthly time frame with the ascending triangle breakout that triggered earlier this year:
NASDAQ-100 monthly:
NASDAQ-100 4hr:
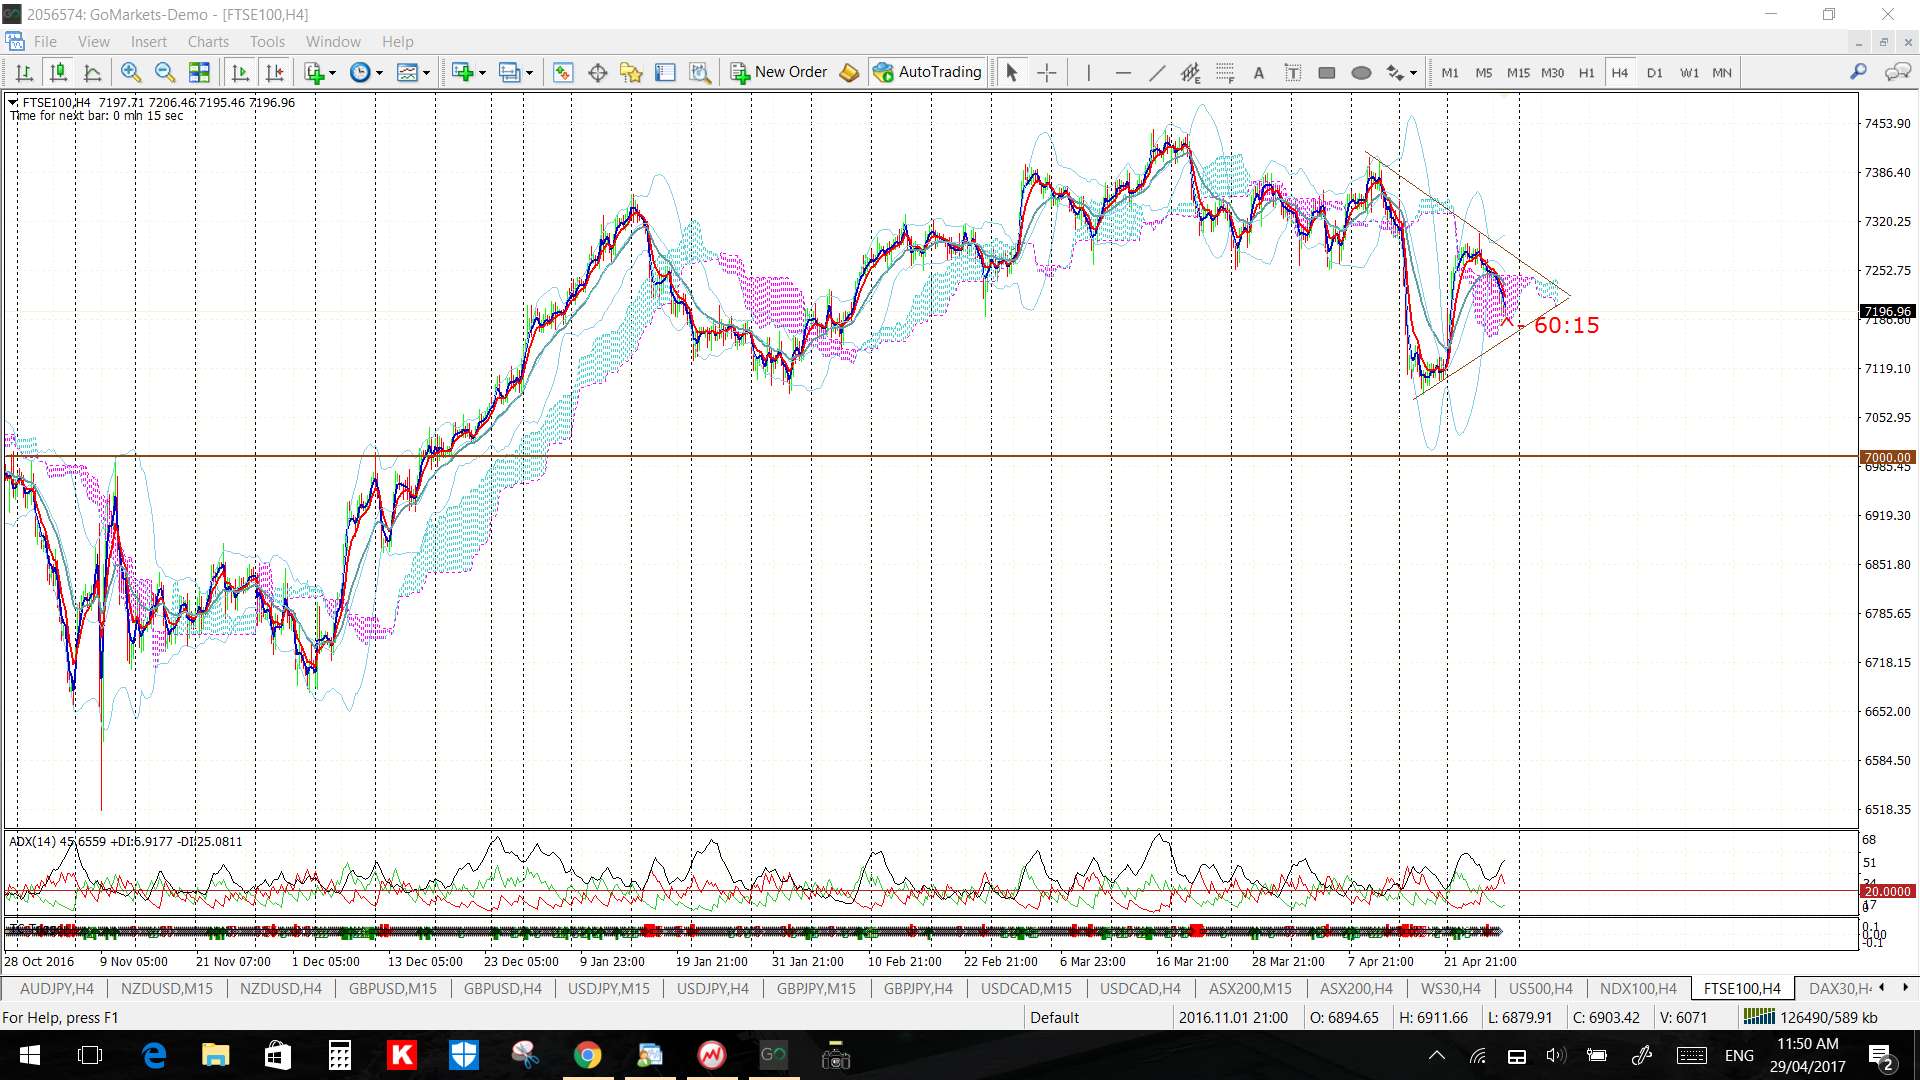
FTSE 4hr:
DAX-30 4hr: