Last week: It was slim pickings for momentum-based 4hr trend signals last week and the two noted TC gave mixed results: GBP/NZD = -50 and Kiwi = 60. Other technical signals have delivered pips though with a triangle breakout on the Cable delivering over 300 pips and one on the EUR/JPY also giving over 300 pips. However, the continued range-bound nature of the FX indices isn’t being too kind to longer-term TC signal trend trading but I’m hoping that the FOMC meeting on Sept 18th might bring an end to this lengthy period of consolidation. Here’s hoping anyway!
This week:
The US$ index and EURX are both still consolidating within weekly chart triangle patterns. NFP proved to be a mixed bag for the US$ with fewer jobs added but a fall in the unemployment rate and an increase in average hourly earnings. Unfortunately though, I suspect the US$ might continue to range trade until the next FOMC meeting that is set down for two weeks time on Thursday Sep 17th. An update on the FX Indices can be found through this link.
There is a lot of data again this week with three Central Banks reporting on interest rates, the BoC, RBNZ and BoE. There is also FOMC for US rates scheduled for the following week and, thus, Central Bank activity looks set to dominate market activity the next two weeks. Next week also brings Chinese Trade Balance and CPI data as well as Aussie Business Confidence and Unemployment data. Monday is a holiday in the USA and Canada though and so it might be a bit of a slow start to the week.
AUD: the AUD has been punished over recent sessions but there are local political factors feeding into this recent demise. Aside from this, and as mentioned above, there is a lot of high impact AUD-sensitive data to monitor this week.
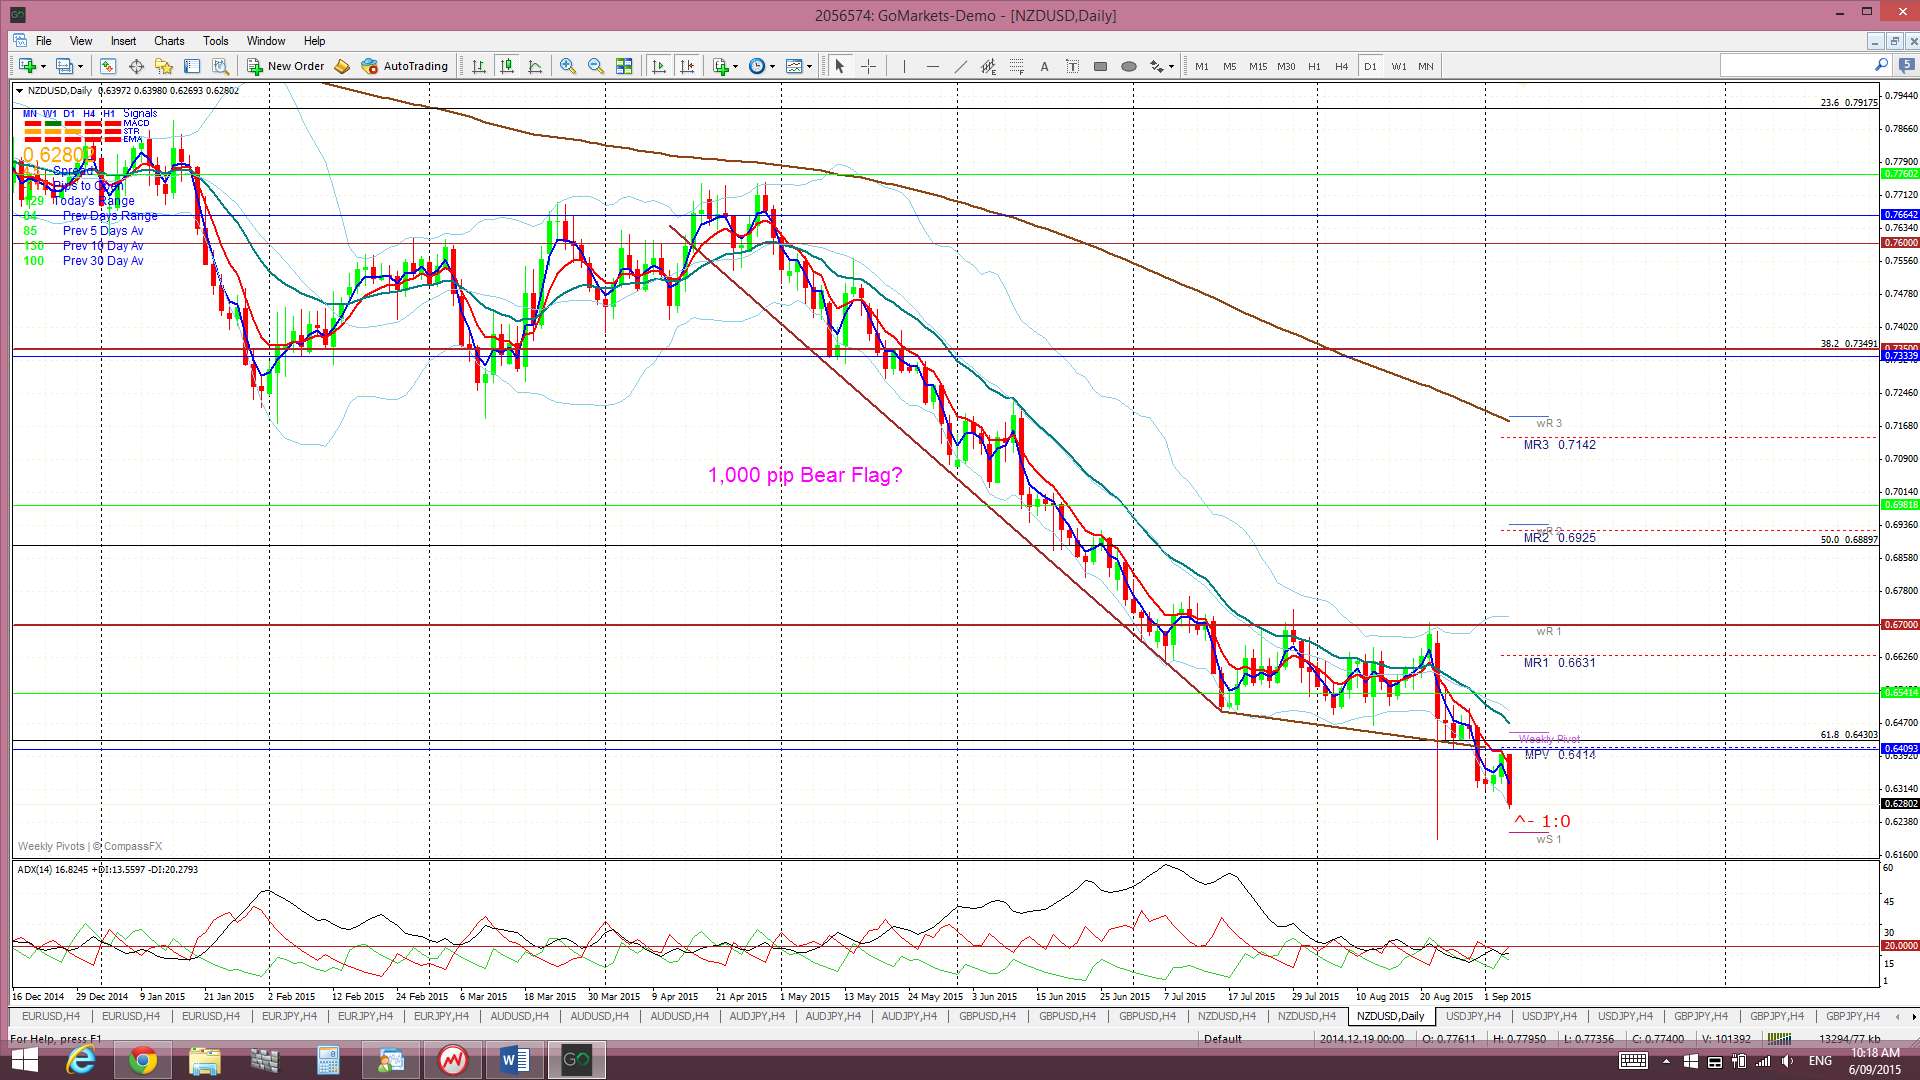
NZD/USD: could be about to start a 1,000 pip Bear Flag. Will the RBNZ kick start this move this week with their interest rate decision?
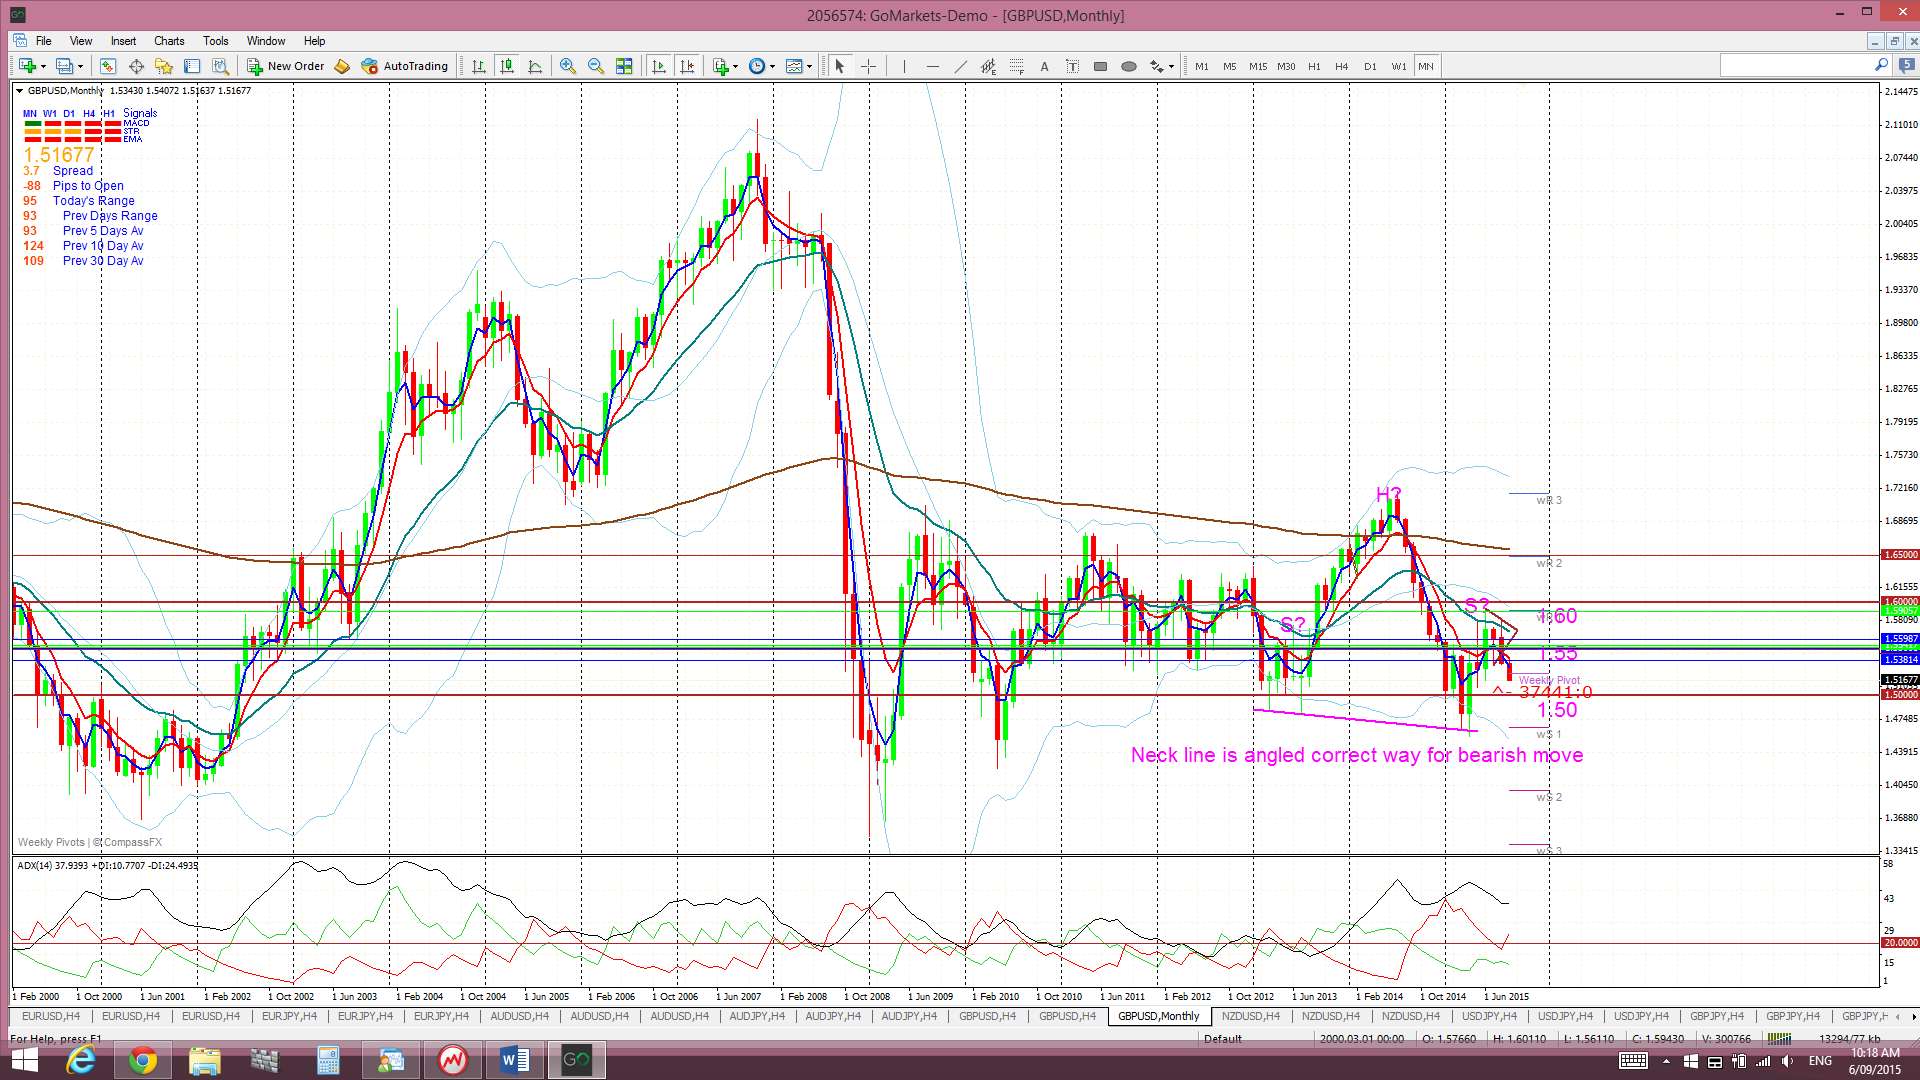
GBP/USD: the 1.50 level seems to be calling here.
USD/JPY and S&P500: I’m watching for any ‘Thelma and Louse‘ style activity with both of these.
Silver & Gold: both look bearish as they trade below key S/R levels however both a printing weekly-chart bullish reversal descending wedges.
I am away next w/e and will not be posting w/e updates.
Stocks and broader market sentiment:
Global stock indices closed lower for the week: S&P500, DJIA, NASDAQ, FTSE, TSX, Russell 2000 and DAX. Concern continues around issues of global growth, a perceived China slowdown and the timing of any US Fed rate hike.
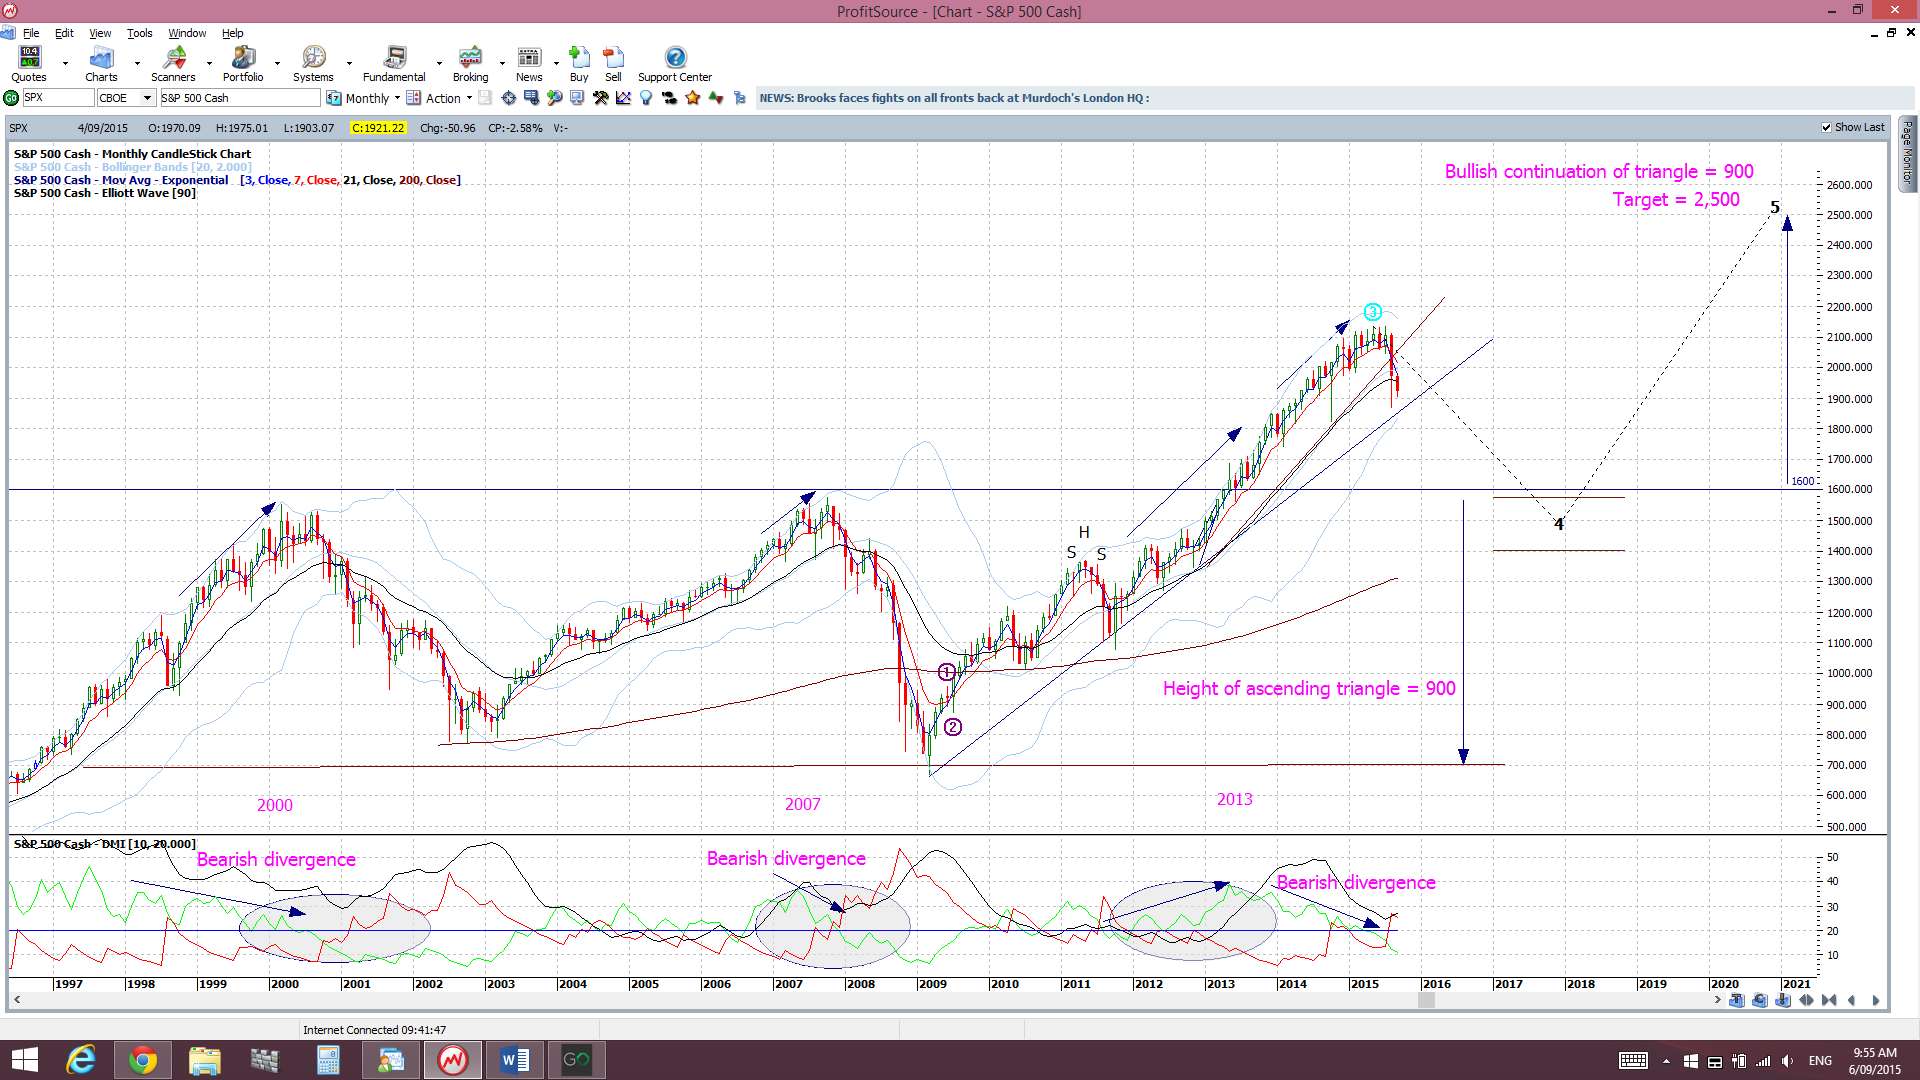
The S&P500 broke up through major 1,600 resistance in May 2013 following 13 years of consolidation and I have been looking for another test of this major breakout region ever since then. I have long stated that I won’t be entirely confident of any potential bullish continuation on this index until there is a test of this major region, as per the test back after the breakout from the previous period of consolidation (see chart below). I am wondering if this latest pullback might just offer up an opportunity to execute such a purge and test:

Thus, I continue to watch out for further clues as to any new momentum move, long or short though! In particular I’m looking out for:
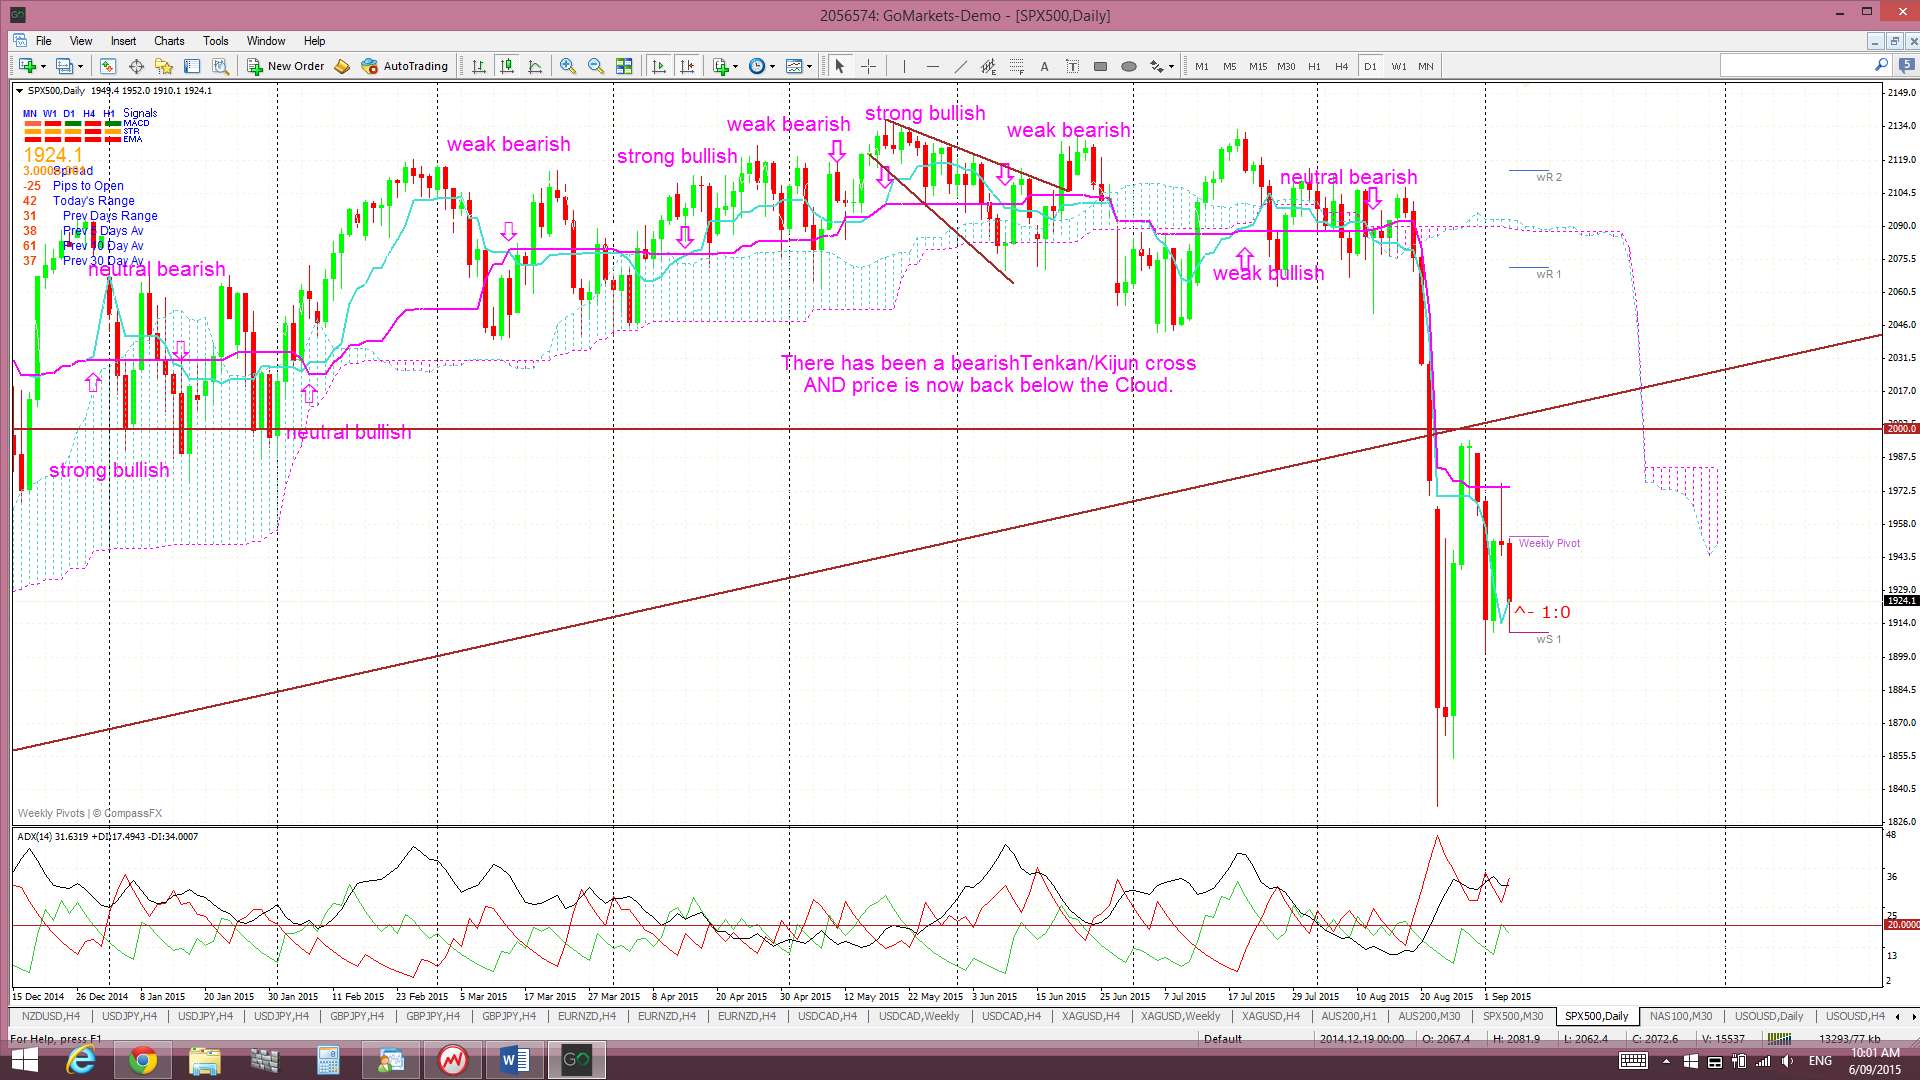
S&P500 daily chart: The index closed below the psychological 2,000 level and below daily trend line support but is holding above monthly support for now. However, I am looking for a deeper pullback to test 1,600.

Ichimoku S&P500 daily chart: a clear cross of the blue Tenkan-sen line below the pink Kijun-sen line. The bearish Tenkan/Kijun cross remains open but as this evolved IN the Cloud it is deemed a ‘NEUTRAL’ signal. Price is still below the Cloud:
Ichimoku S&P500 weekly chart: the weekly candle closed as a bearish candle and back below weekly Cloud:

S&P500 monthly chart: a break of the monthly support trend line. The monthly trend line remains intact but a break of this support level would suggest to me of a more severe pull back or correction. I am still seeing divergence on the monthly chart for now though and looking for a test of 1,600.
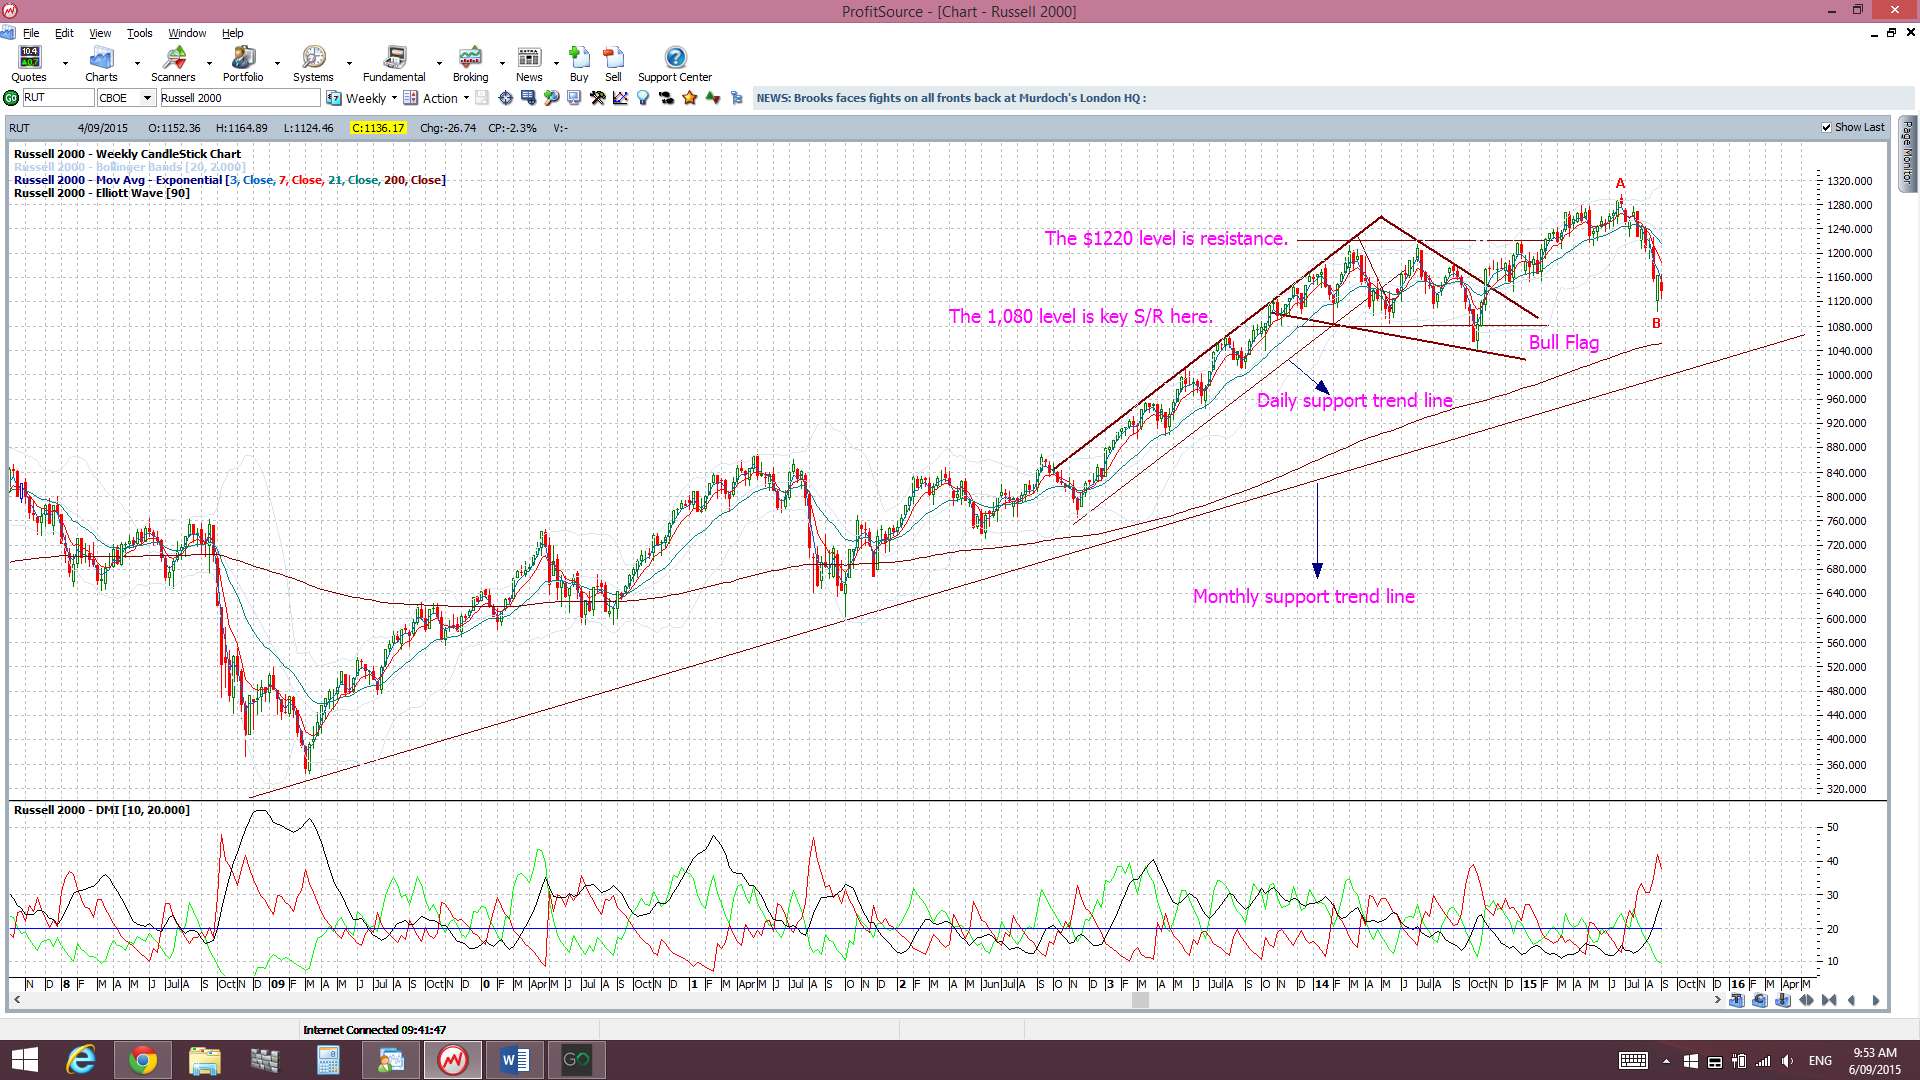
Russell 2000 Index: this small caps index is considered a US market ‘bellwether’ and has again closed the week below the key 1,220 level and with a bearish weekly candle.
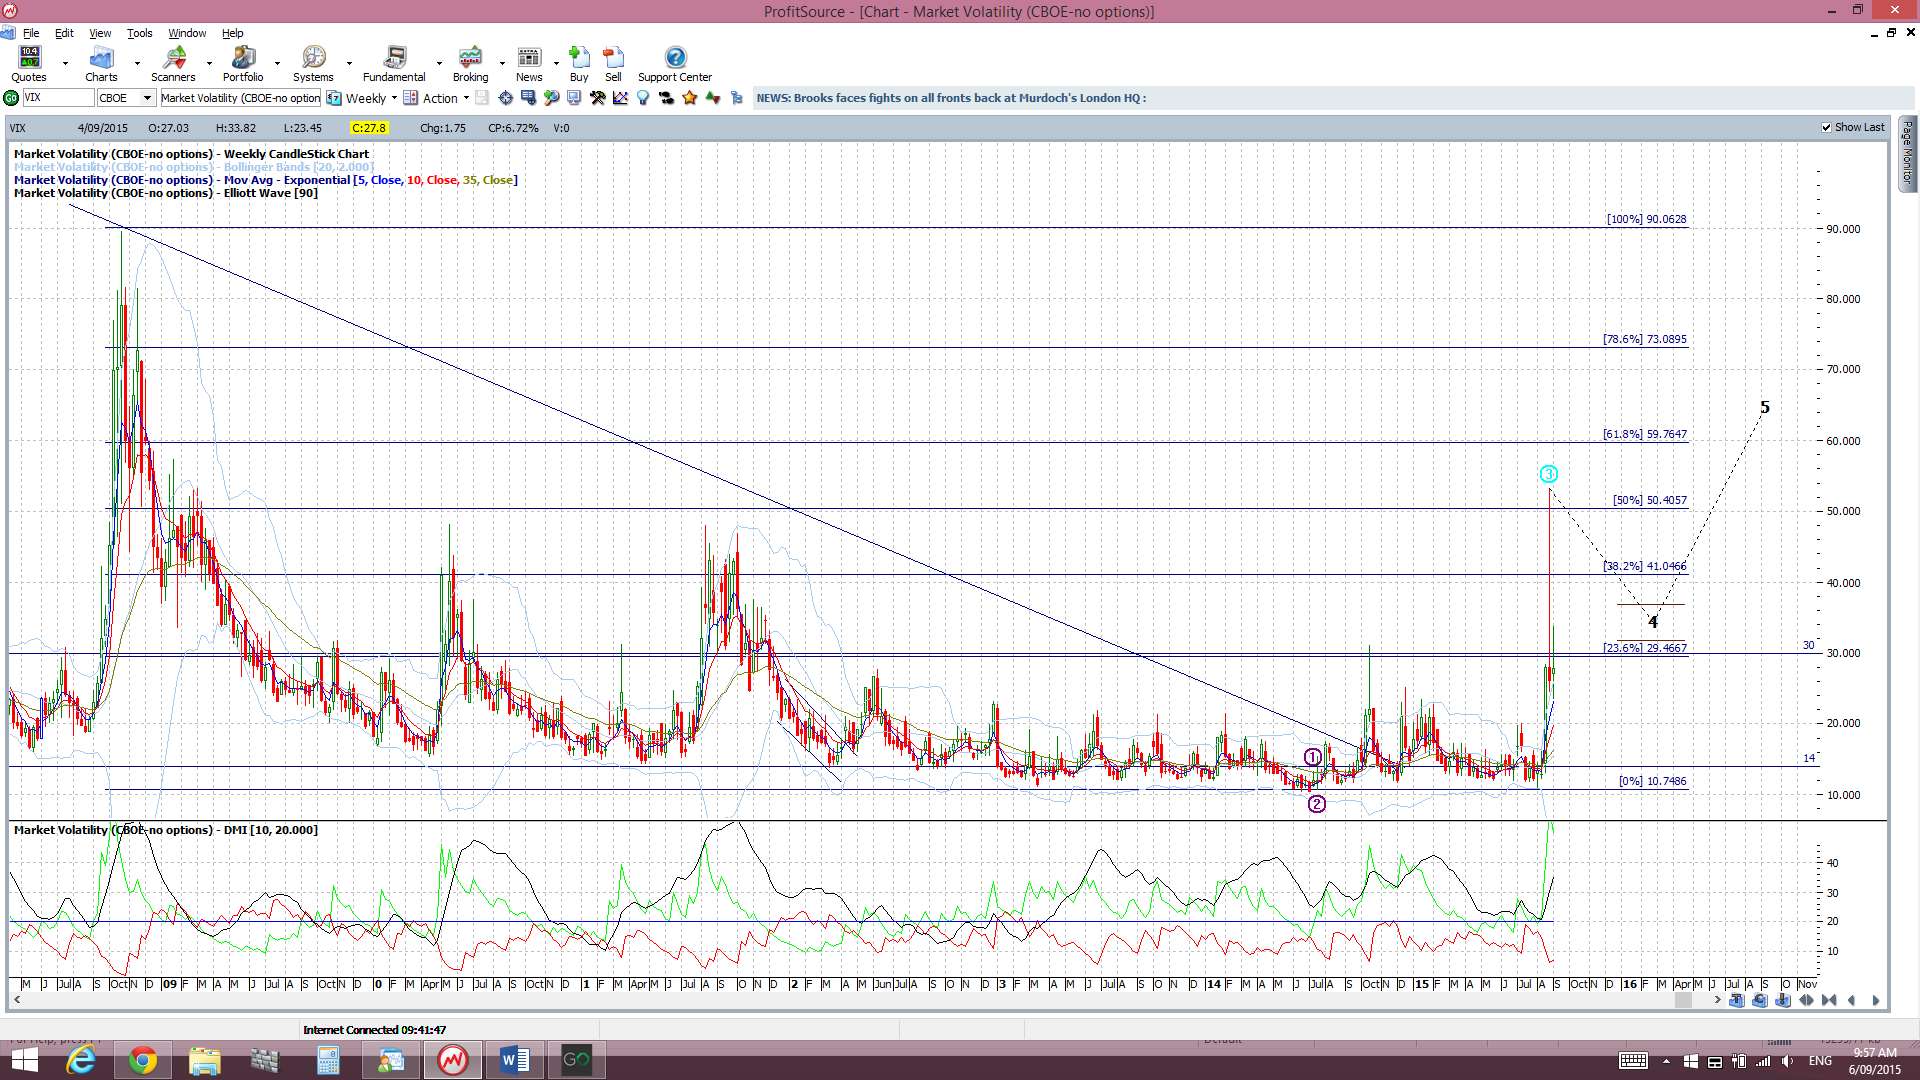
VIX Index: The ‘Fear’ index is below the 30 level but printed a bullish coloured ‘Spinning Top’ candle.
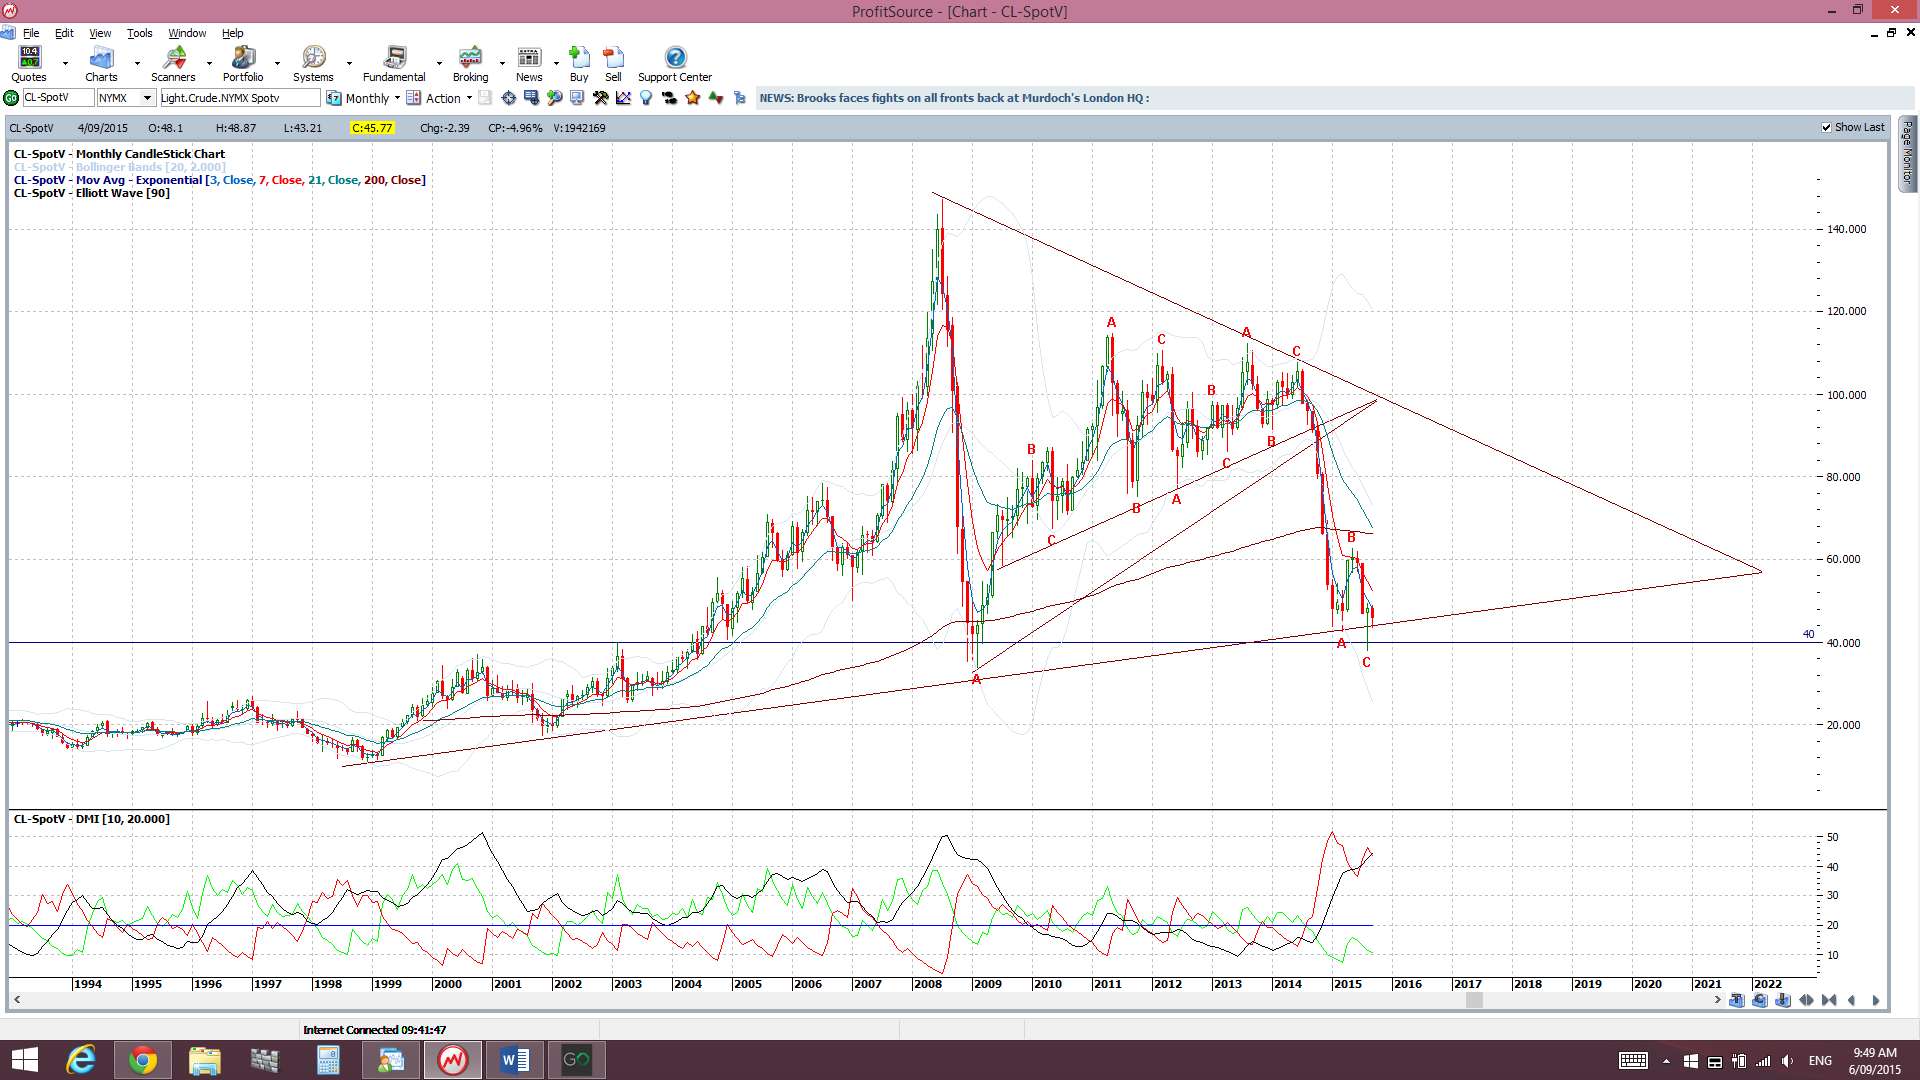
Oil: closed August by printing a bullish-reversal ‘Hammer’ candle off major $40 support but has not moved too much higher just yet. The weekly candle was a bullish coloured ‘Spinning Top’.

Trading Calendar Items to watch out for:
- Sat 5th: Day 2 G20 Meetings.
- Sun 6th: nil
- Mon 7th: USA / CAD holiday.
- Tue 8th: AUD NAB Business Confidence. CNY Trade Balance.
- Wed 9th: GBP Manufacturing Production. CAD Building Permits and BoC Rate statement.
- Thurs 10th: NZD RBNZ Monetary Policy, Rate Statement and Conference. AUD Unemployment data. CNY CPI. GBP Official Bank Rate & Statement. USD Unemployment Claims.
- Fri 11th: USD PPI & Prelim UoM Consumer Sentiment.
Forex:
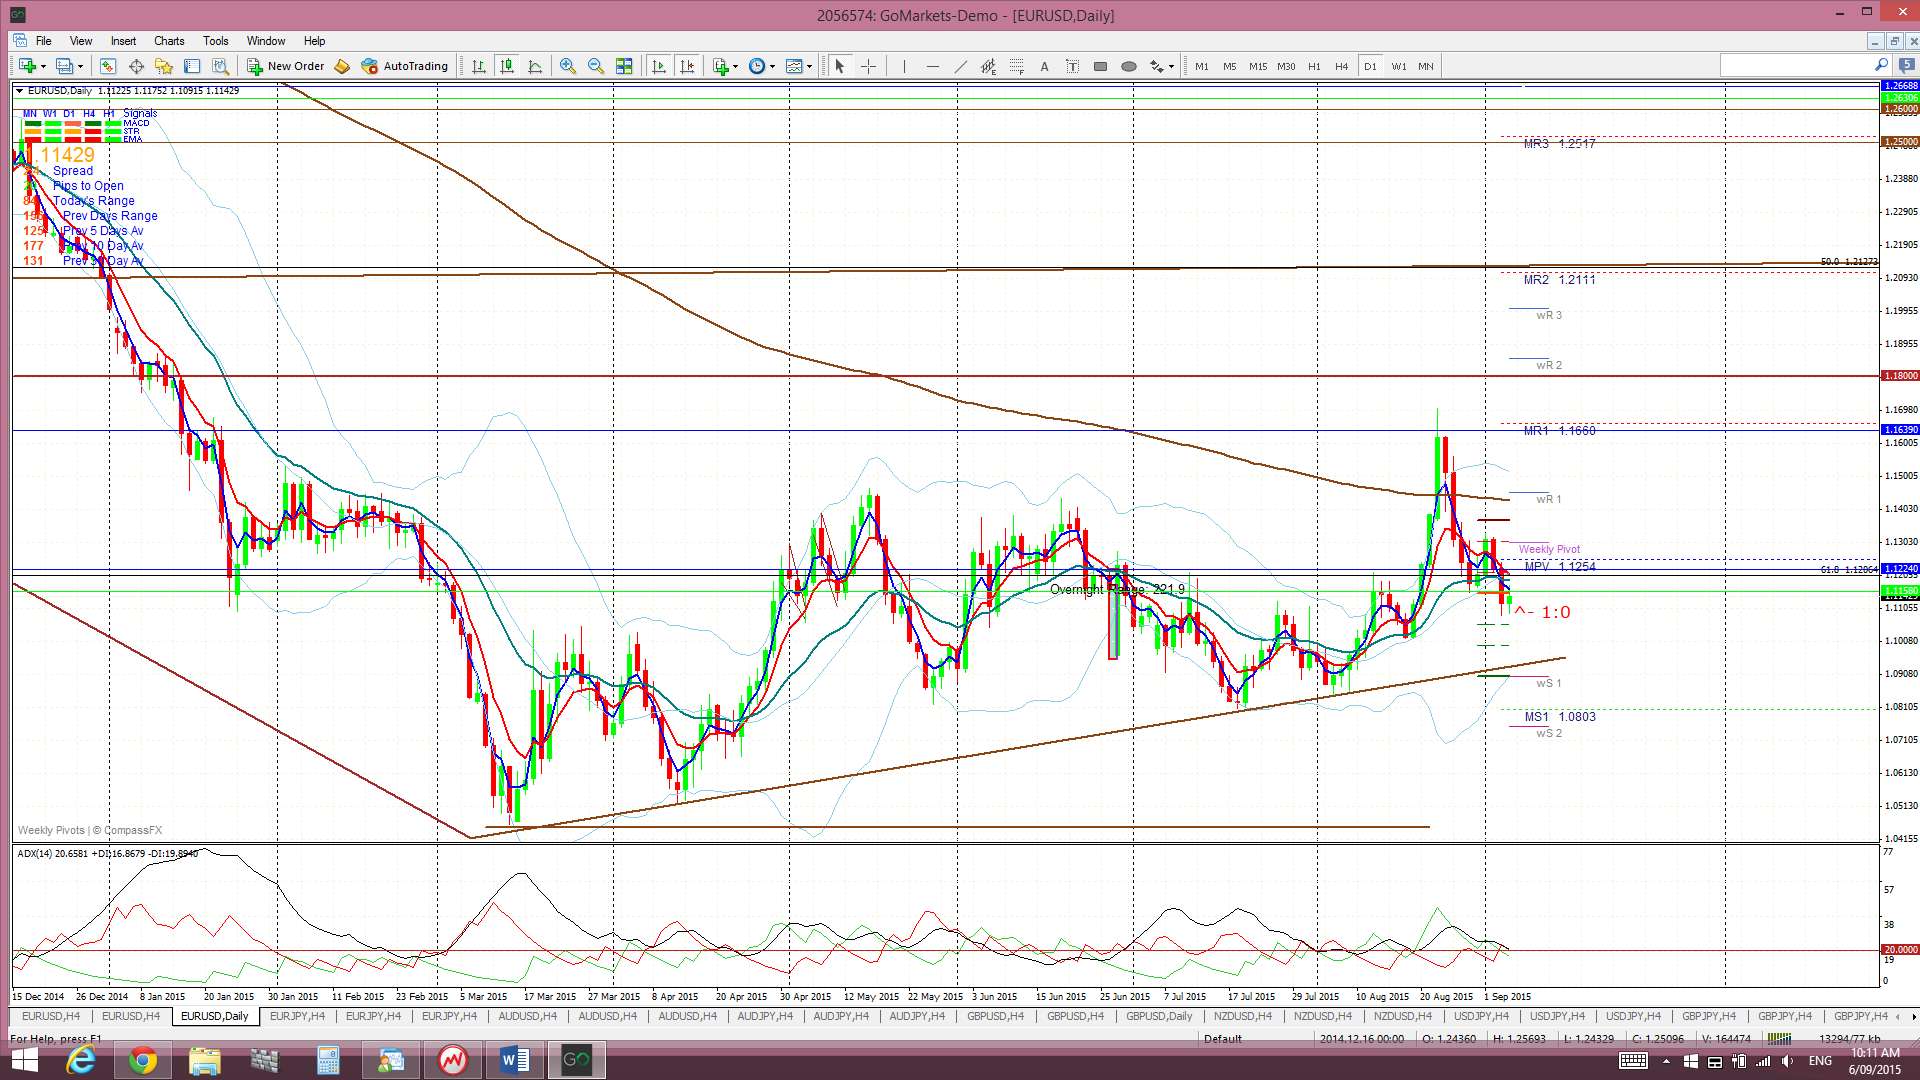
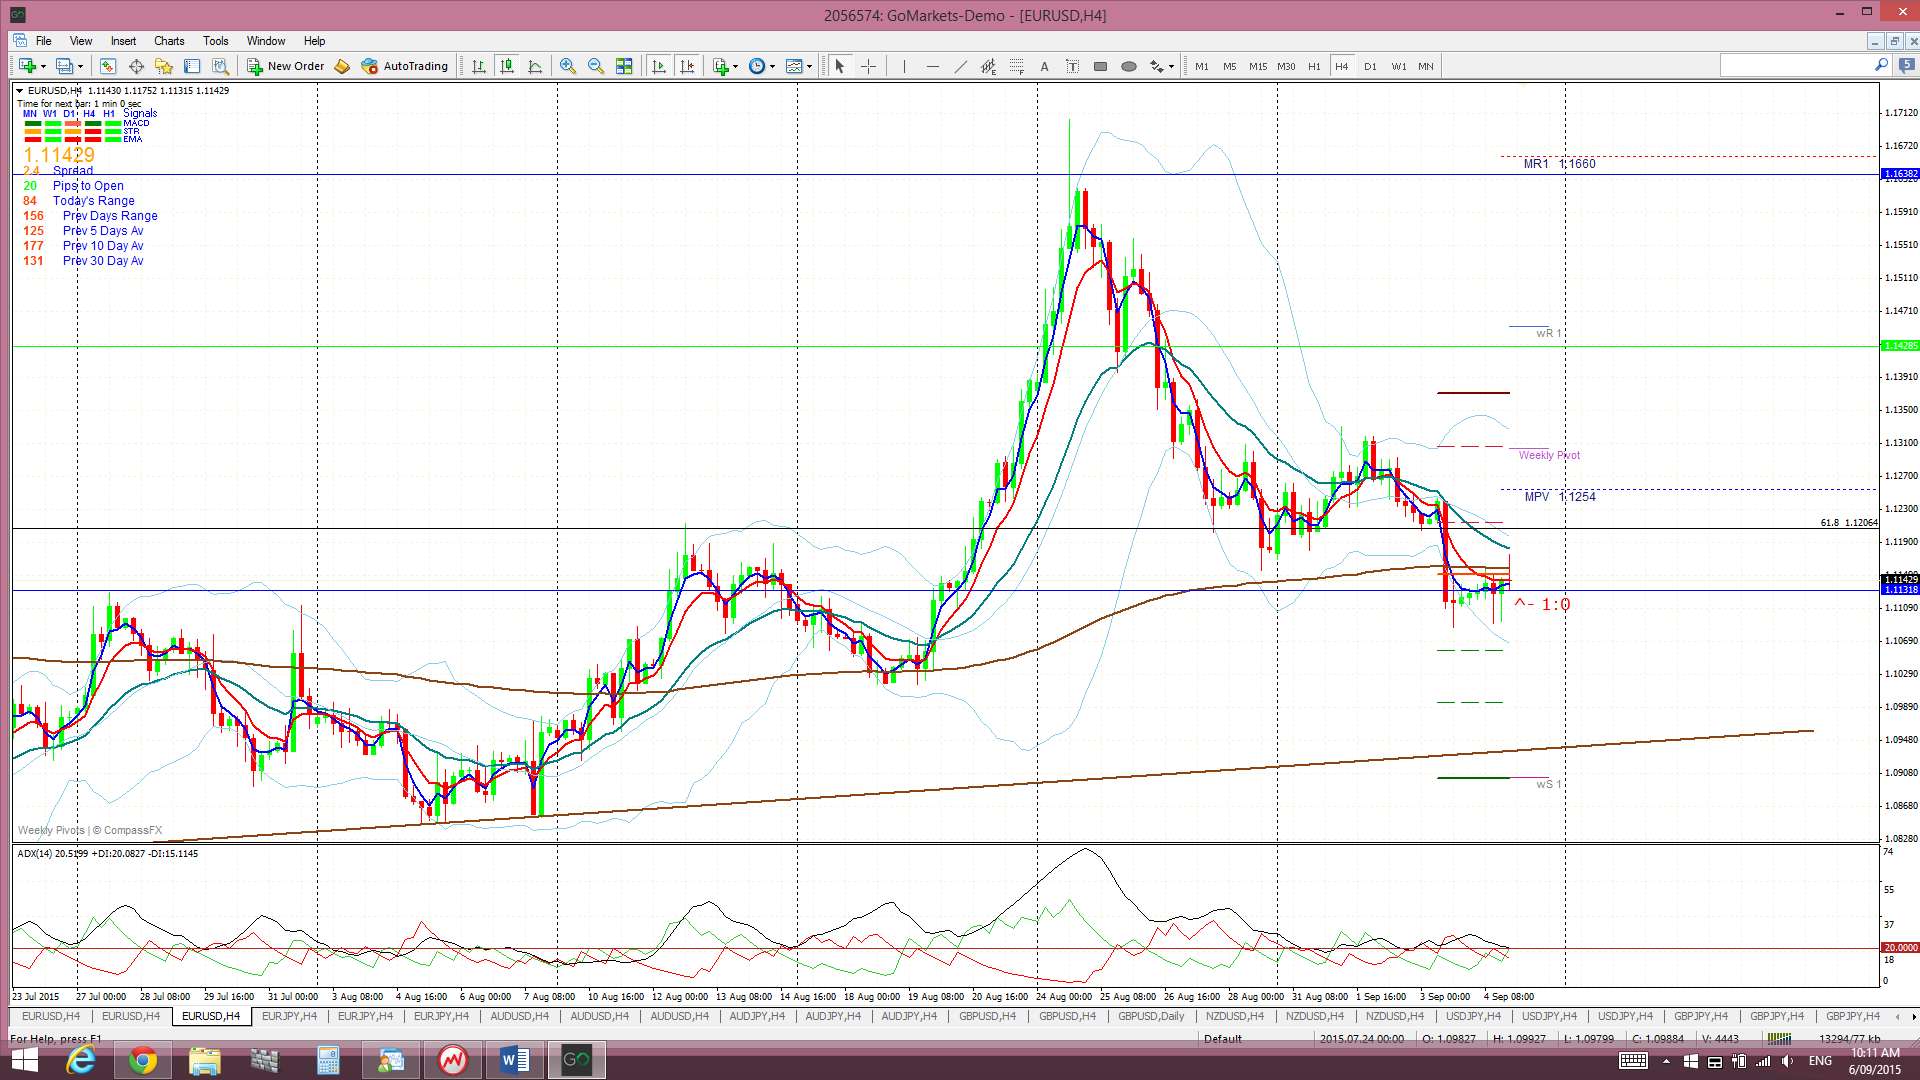
E/U: The E/U chopped sideways above 1.12 support to start last week following the pullback from the 1.18 region in the week before. Dovish ECB comments on Thursday though, and the thought of more QE, weakened the E/U and it slipped below the 1.12 support.
The 1.18 and 1.12 are key levels for the E/U:
- The 1.18 level is the baseline of the broken monthly-chart based triangle pattern.
- The 1.12 region is the 61.8% fib of the 2000-2008 swing high move.
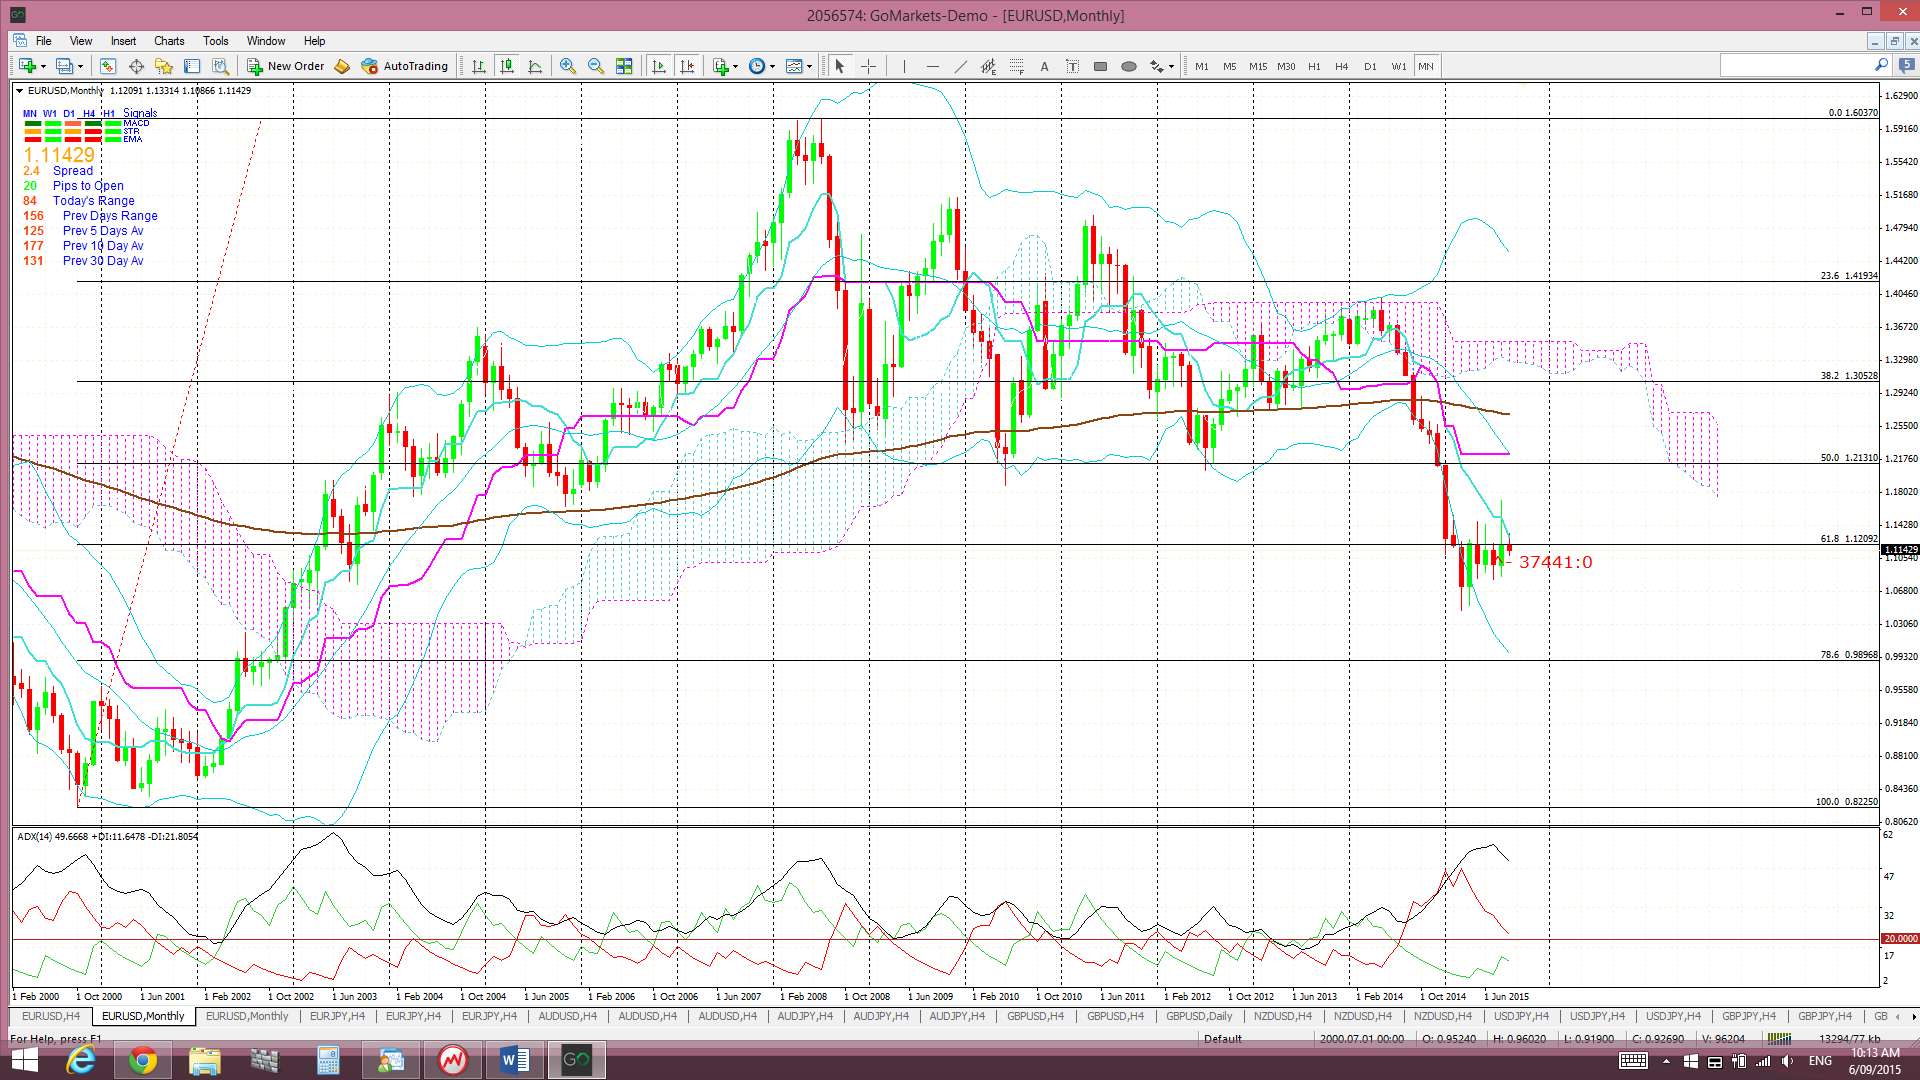
I had been looking for a test of this triangle baseline at 1.18 before further bearish follow through and we’ve had over 600 pips since the near-test of this region last week.
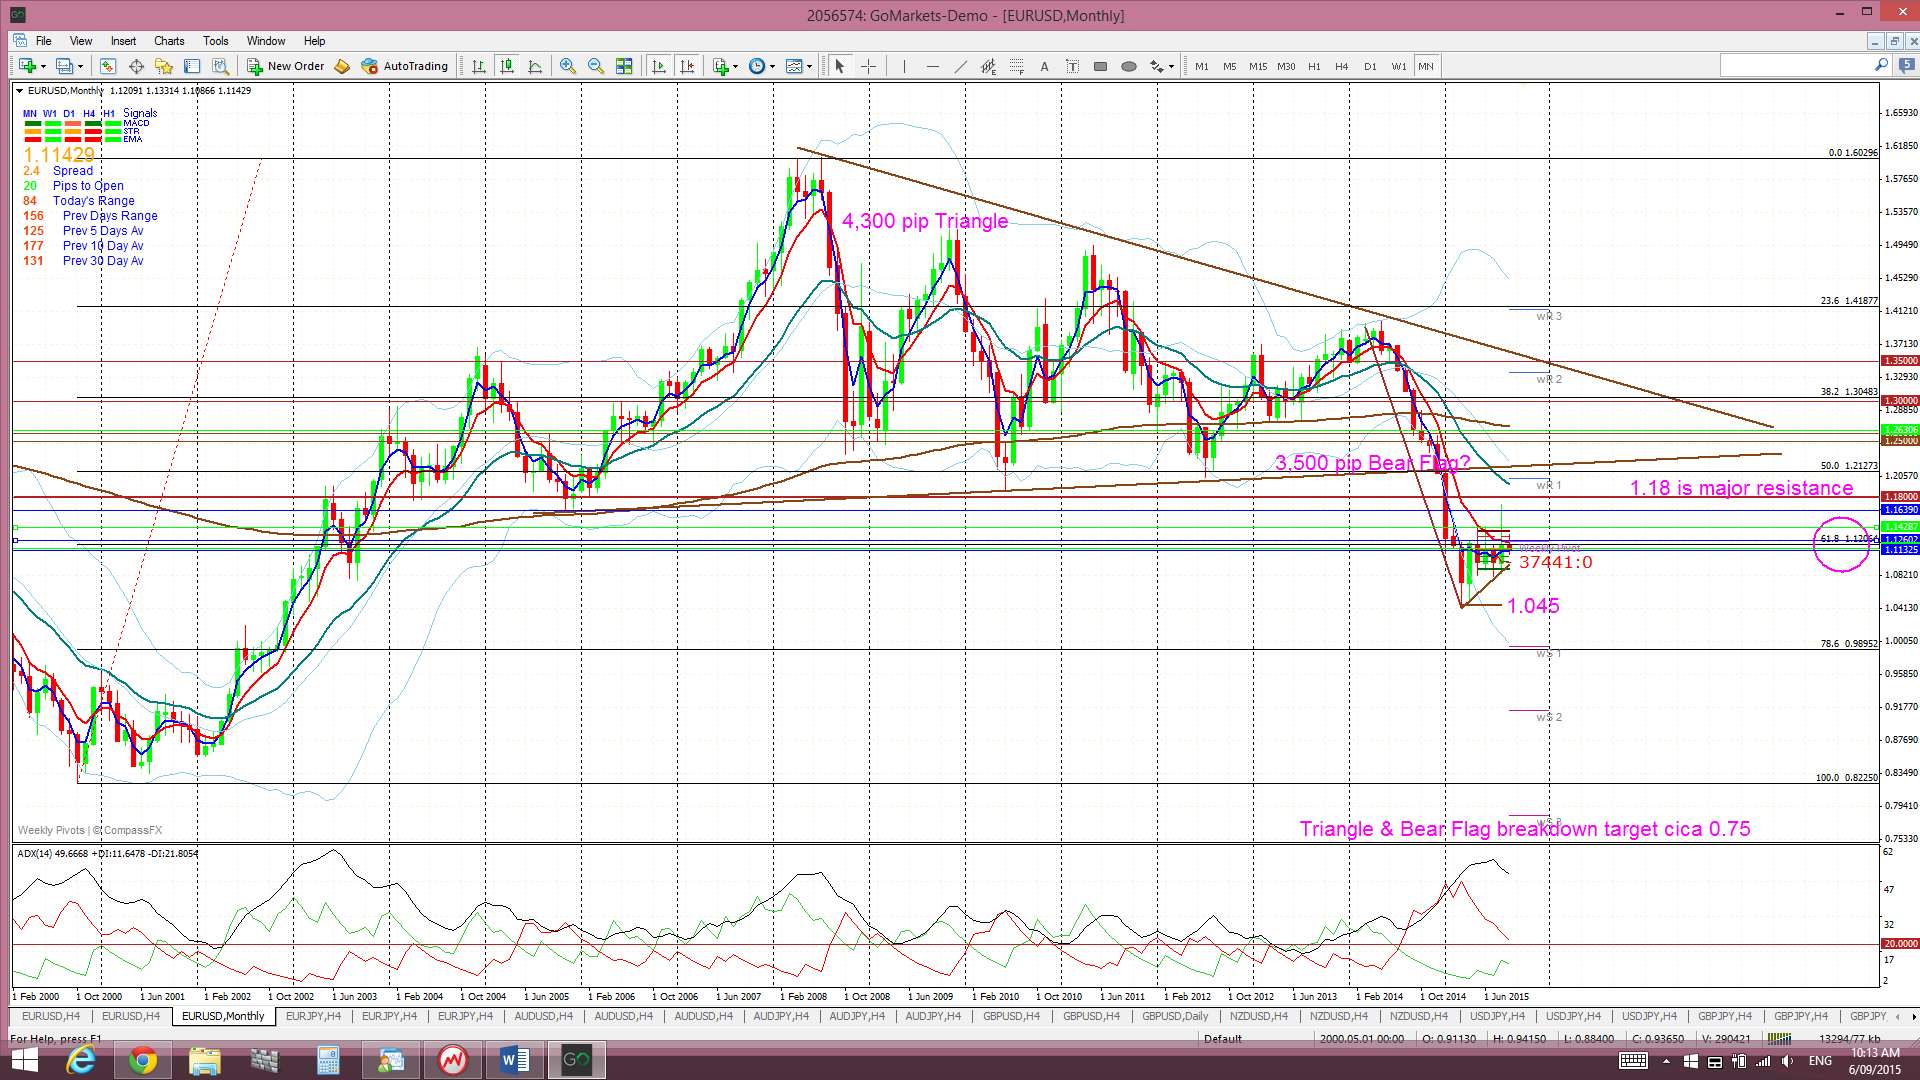
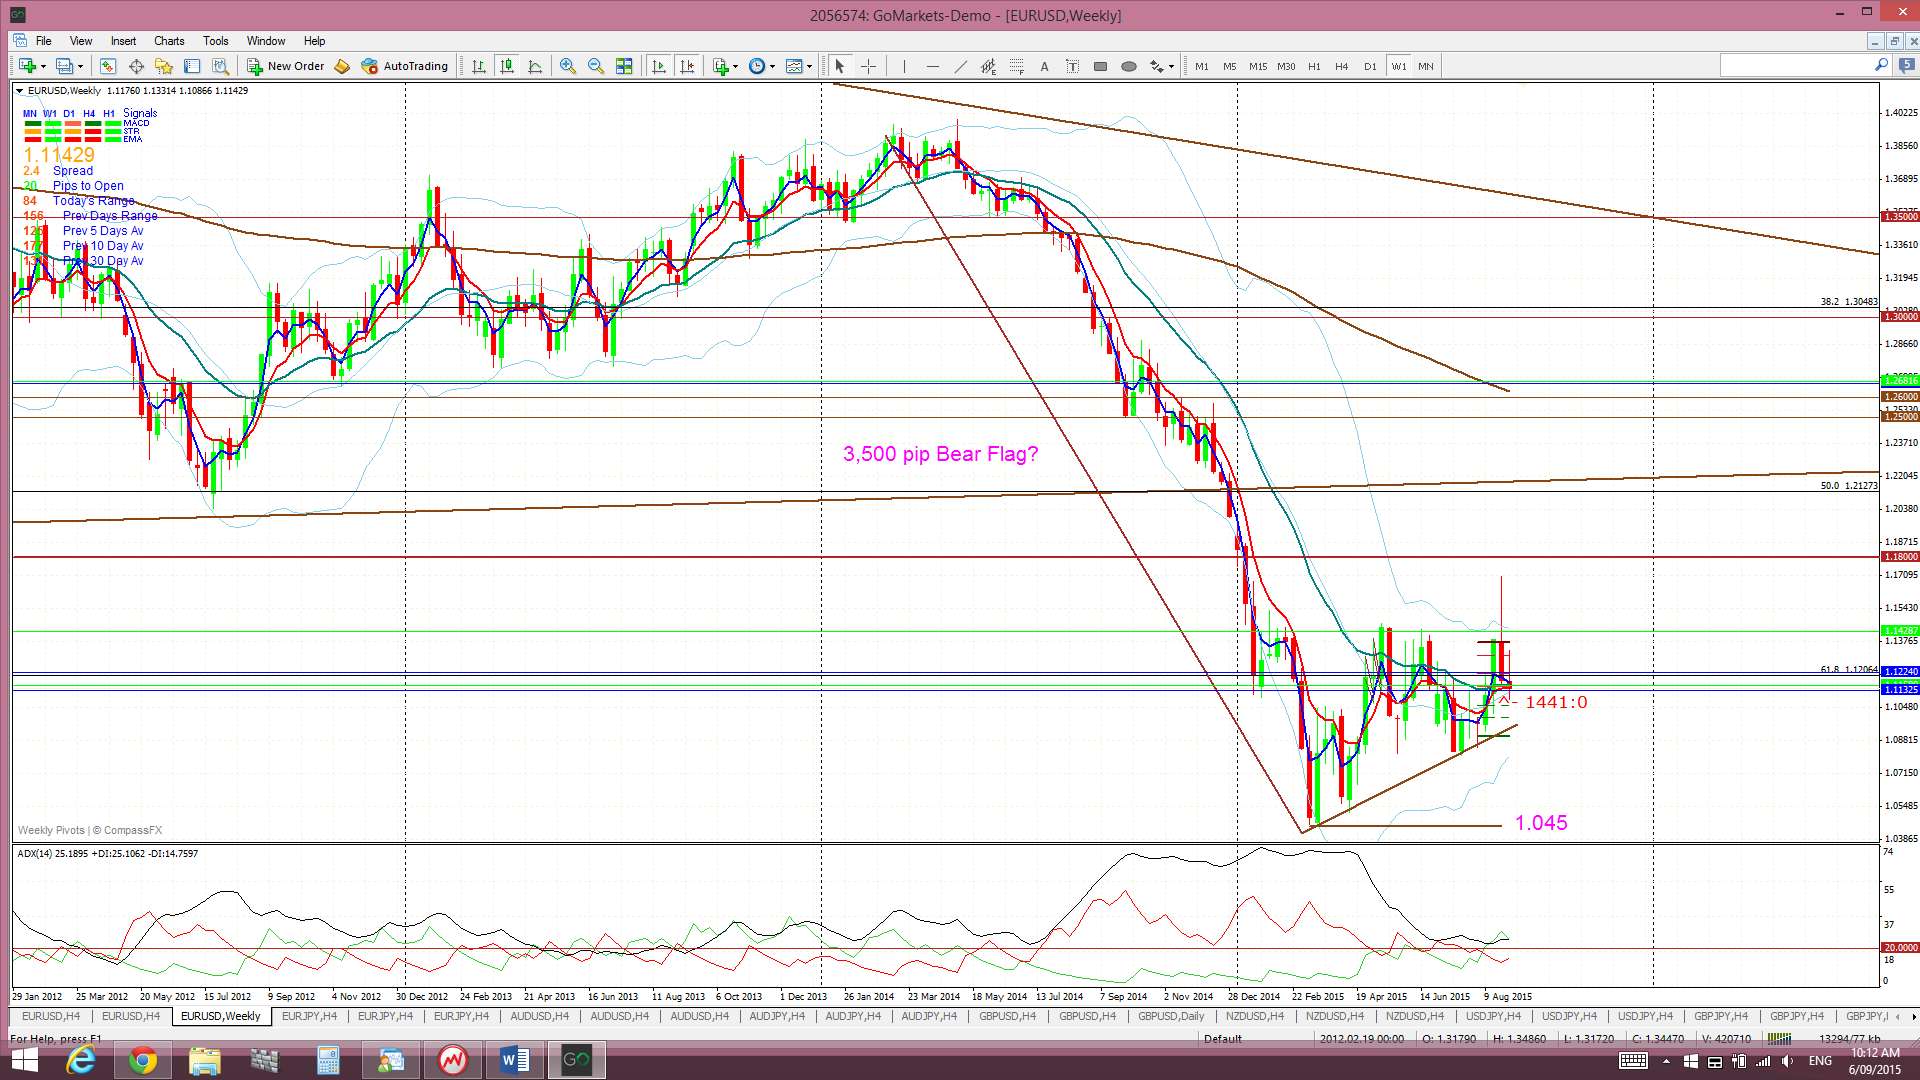
There is another technical pattern developing on the E/U, apart from this continuing monthly chart triangle breakdown, and this is a Bear Flag on the weekly chart. Traders still need to keep an eye on the weekly chart’s Flag trend lines:
- Any new trend line breakdown and continuation could signal the start of a weekly-chart Bear Flag breakdown worth up to 3,500 pips. Keep an eye on the lower flag trend line, and also the recent low down near 1.045, in case they offer up any support.
- Any breakout above the top trend line could signal a basing pattern here for the E/U, even if only temporary. I would then be looking for another test of the other major S/R zone at 1.18.
Descending triangle on the monthly chart: As mentioned above, there is still an overall bearish pattern in play on the E/U monthly chart: a 4,000 pip bearish descending triangle breakdown on the monthly chart. The descending triangle pattern is a bearish continuation pattern and has a base at around the 1.18 level. The height of this triangle is about 4,000 pips. Technical theory would suggest that the bearish breakdown of this triangle below 1.18 might see a similar move. It is worth noting that this would bring the E/U down near 0.80 / 0.75 and to levels not seen since 2000/2001!
Price is trading above the Cloud on the daily chart but below the Cloud on the 4hr, weekly and monthly charts.
The weekly candle closed as a bearish coloured ‘Spinning Top’ candle reflecting some indecision.
- I’m watching for any new TC signal on this pair, the 1.12 support level and the weekly chart’s Bear Flag trend lines.
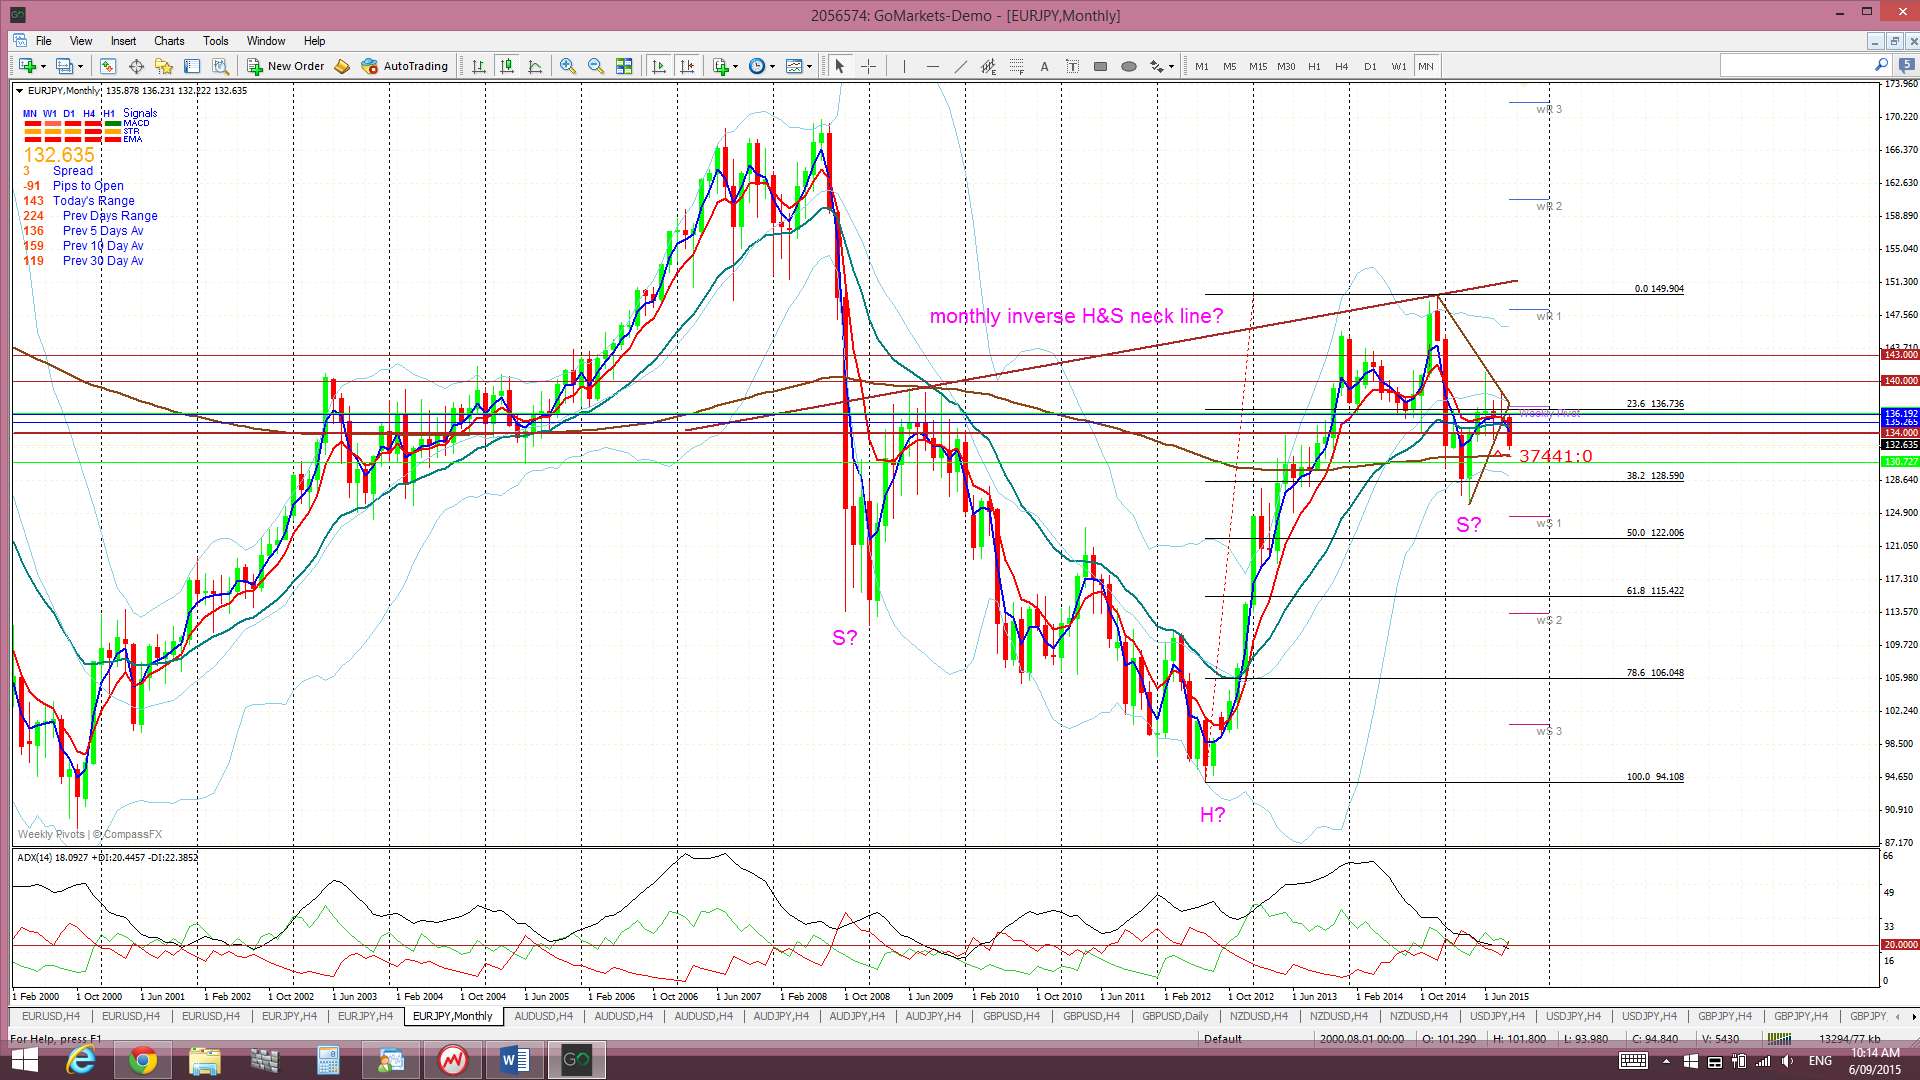
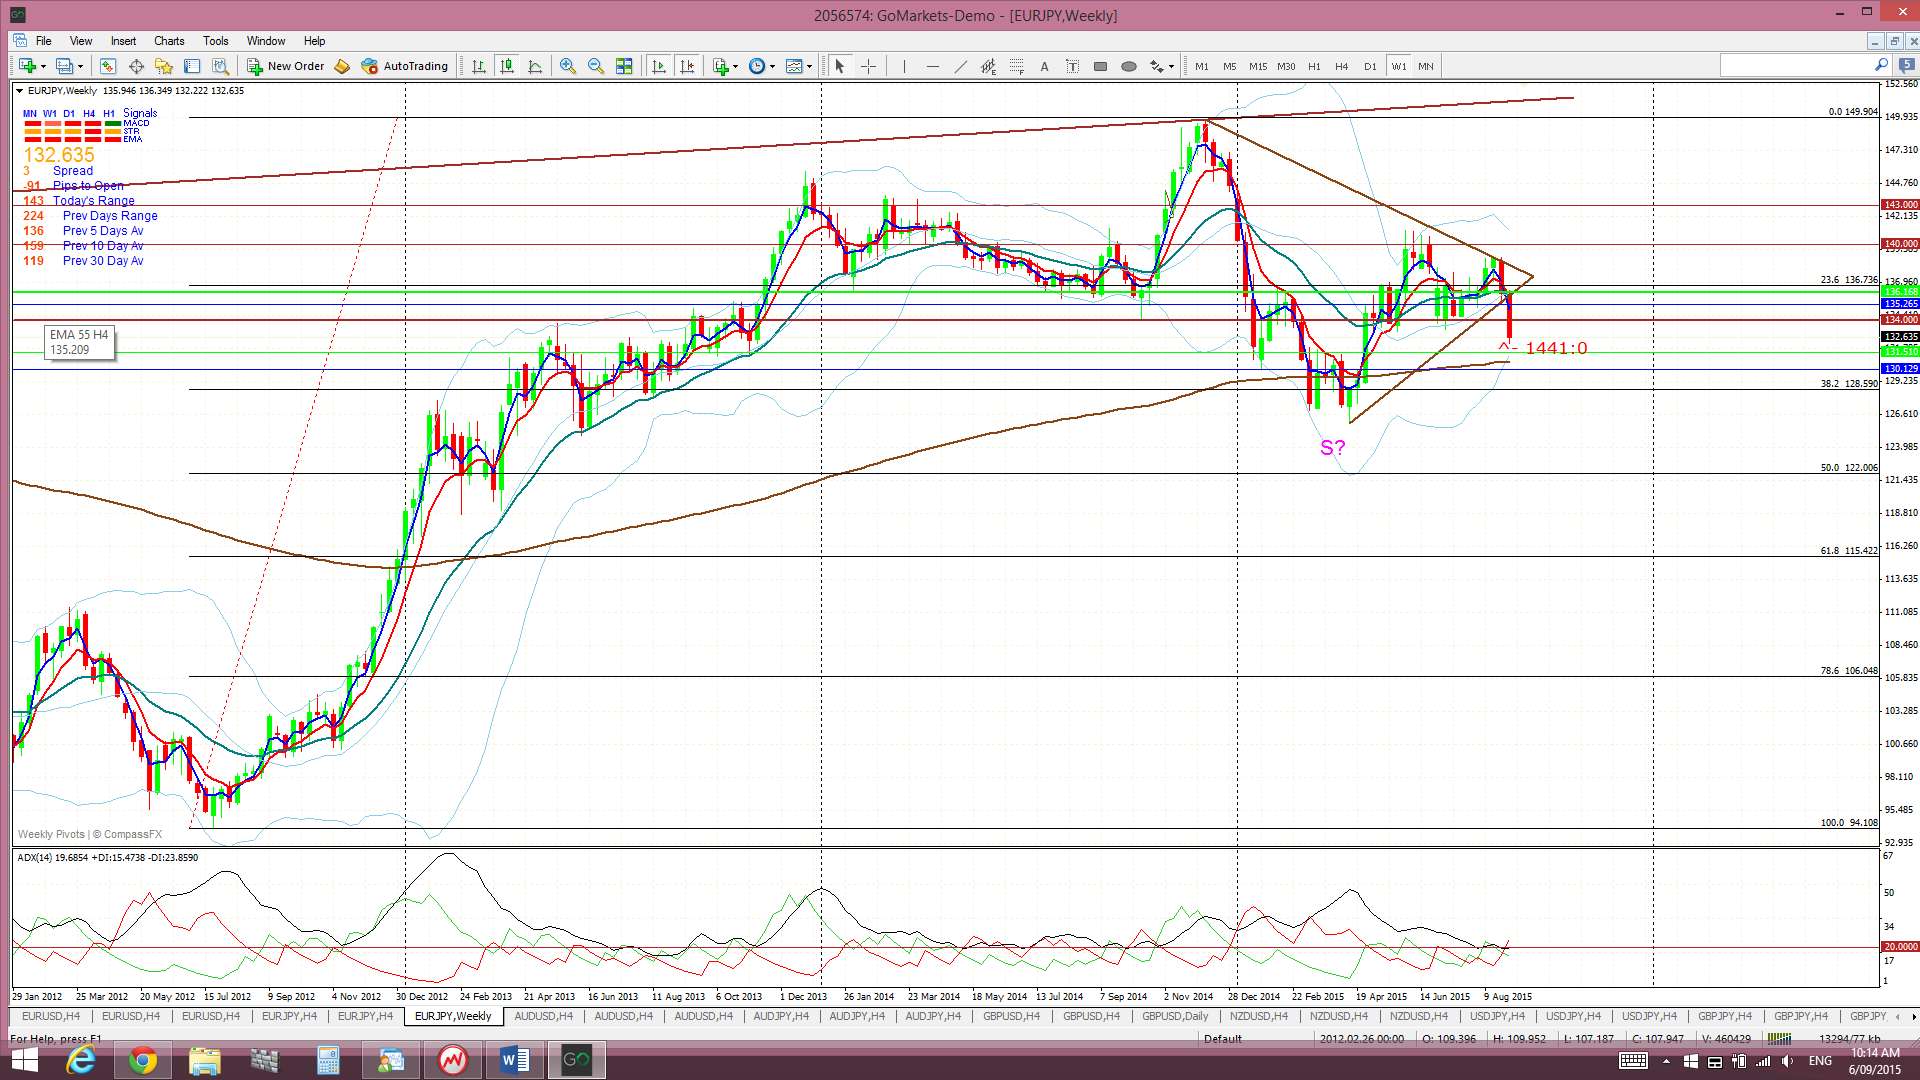
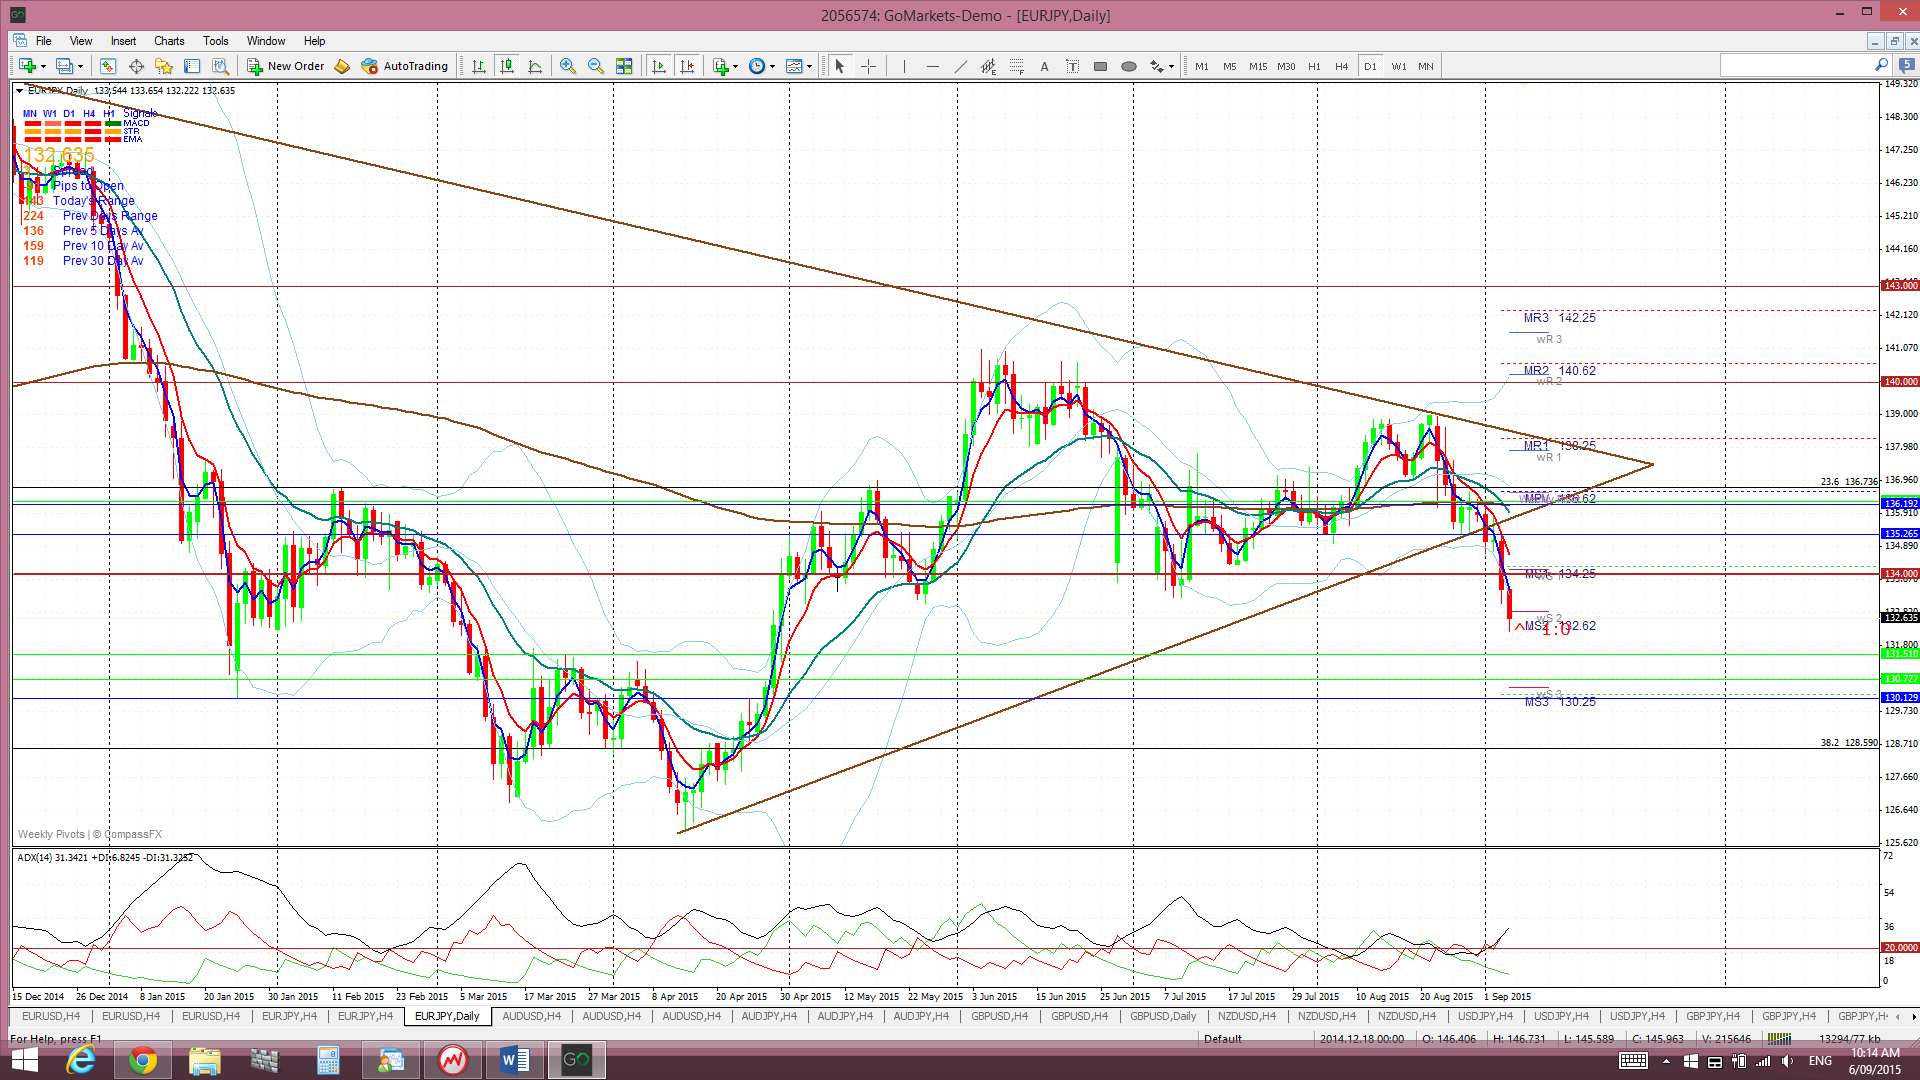
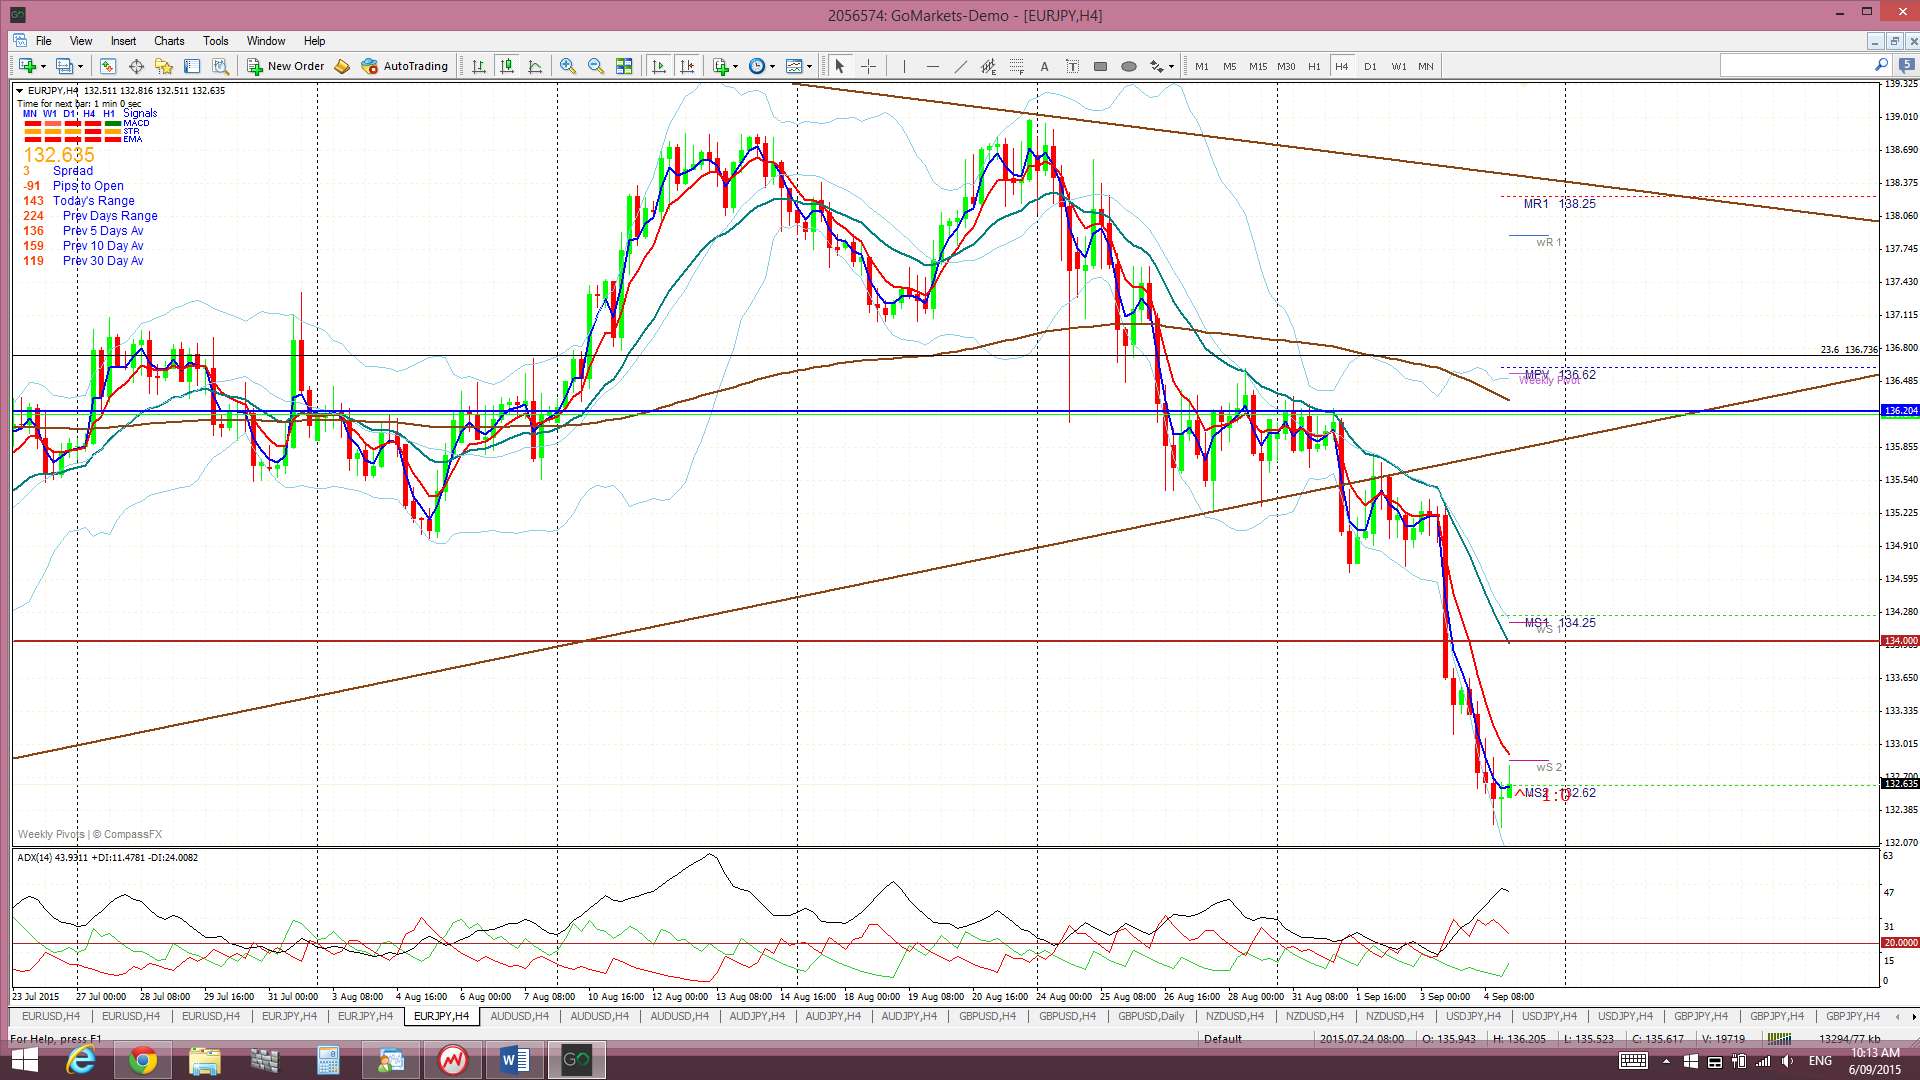
E/J: We finally got a clear breakdown from the daily-chart triangle pattern and this move has given up to 300 pips on its own! It was slow to get going but Thursday’s ECB got it moving along and it is now also back below the 134 S/R level.
I’m still seeing a potential bullish ‘inverse H&S’ pattern building on the monthly chart though.
Price is trading below the Cloud on the 4hr, daily and weekly charts but above the Cloud on the monthly chart.
The weekly candle closed as another bearish candle.
- I’m watching for any new TC signal on this pair and the 134 level.
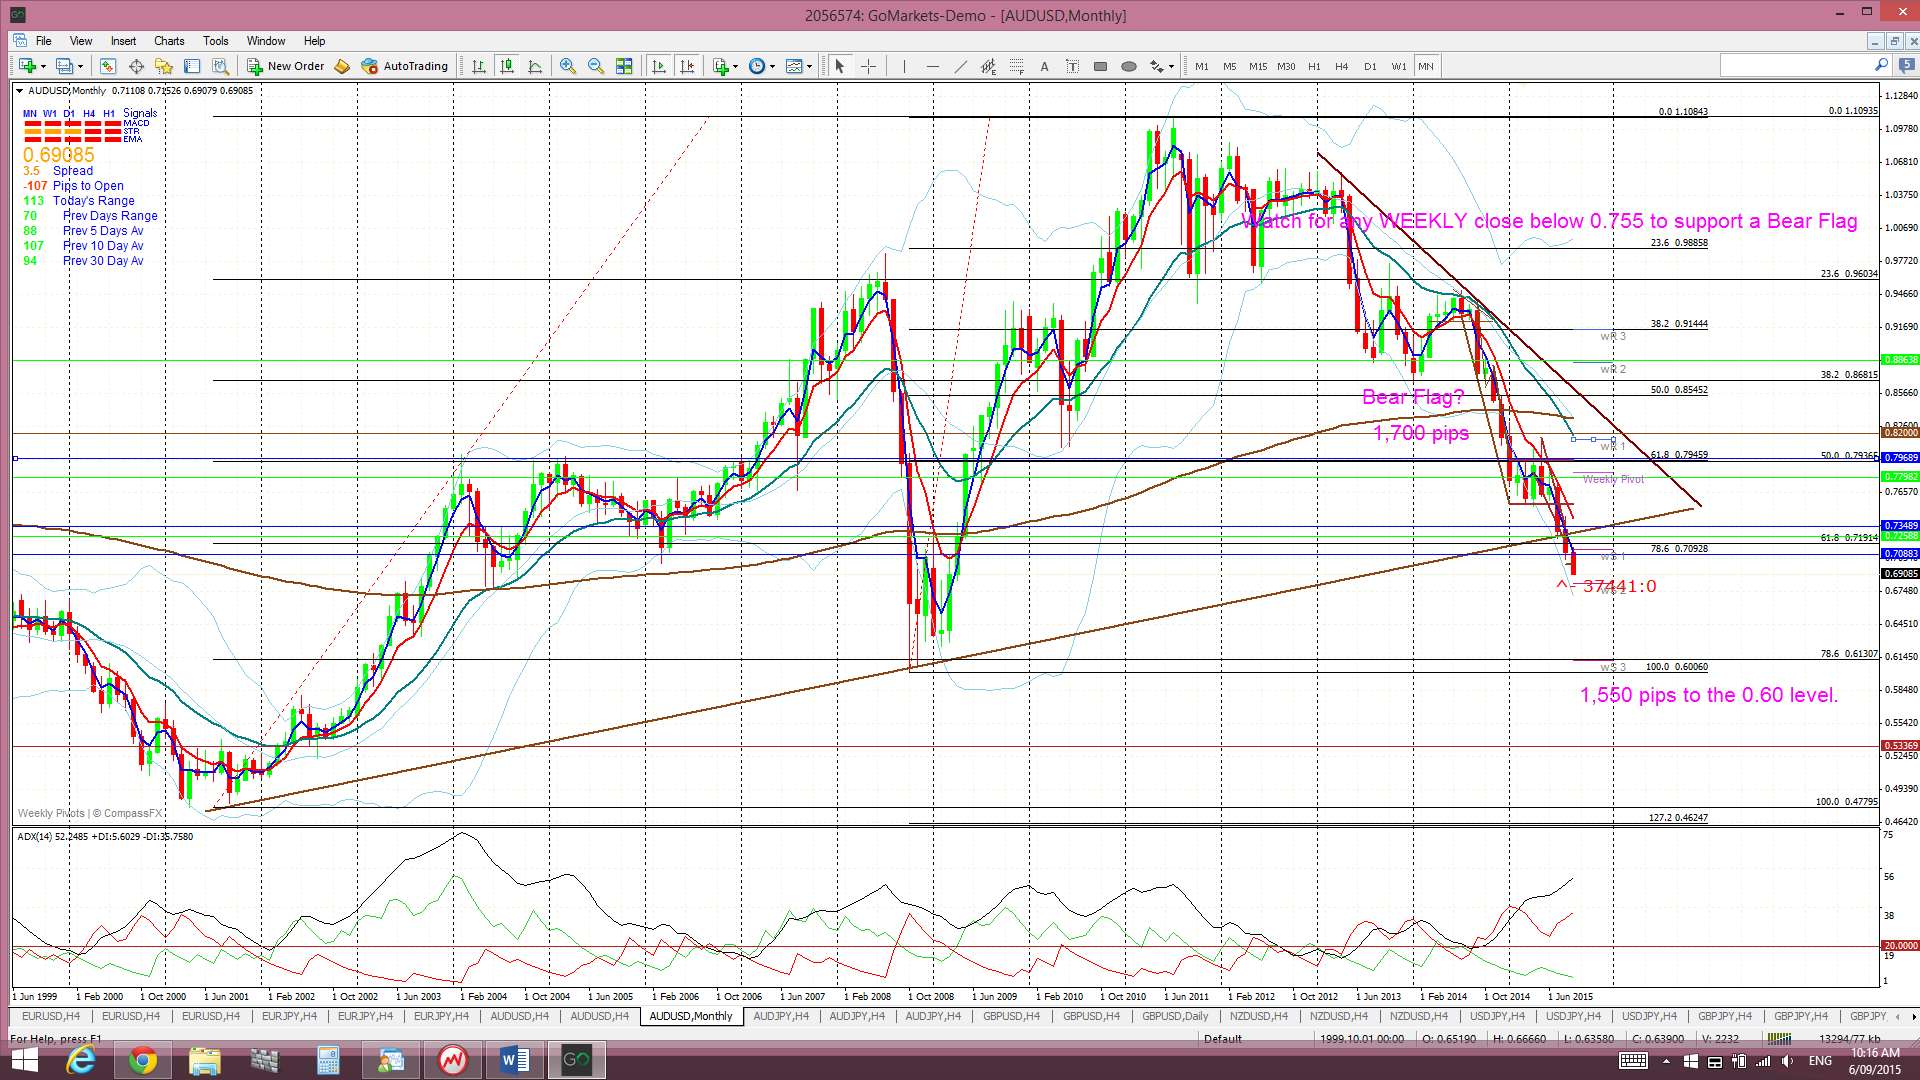
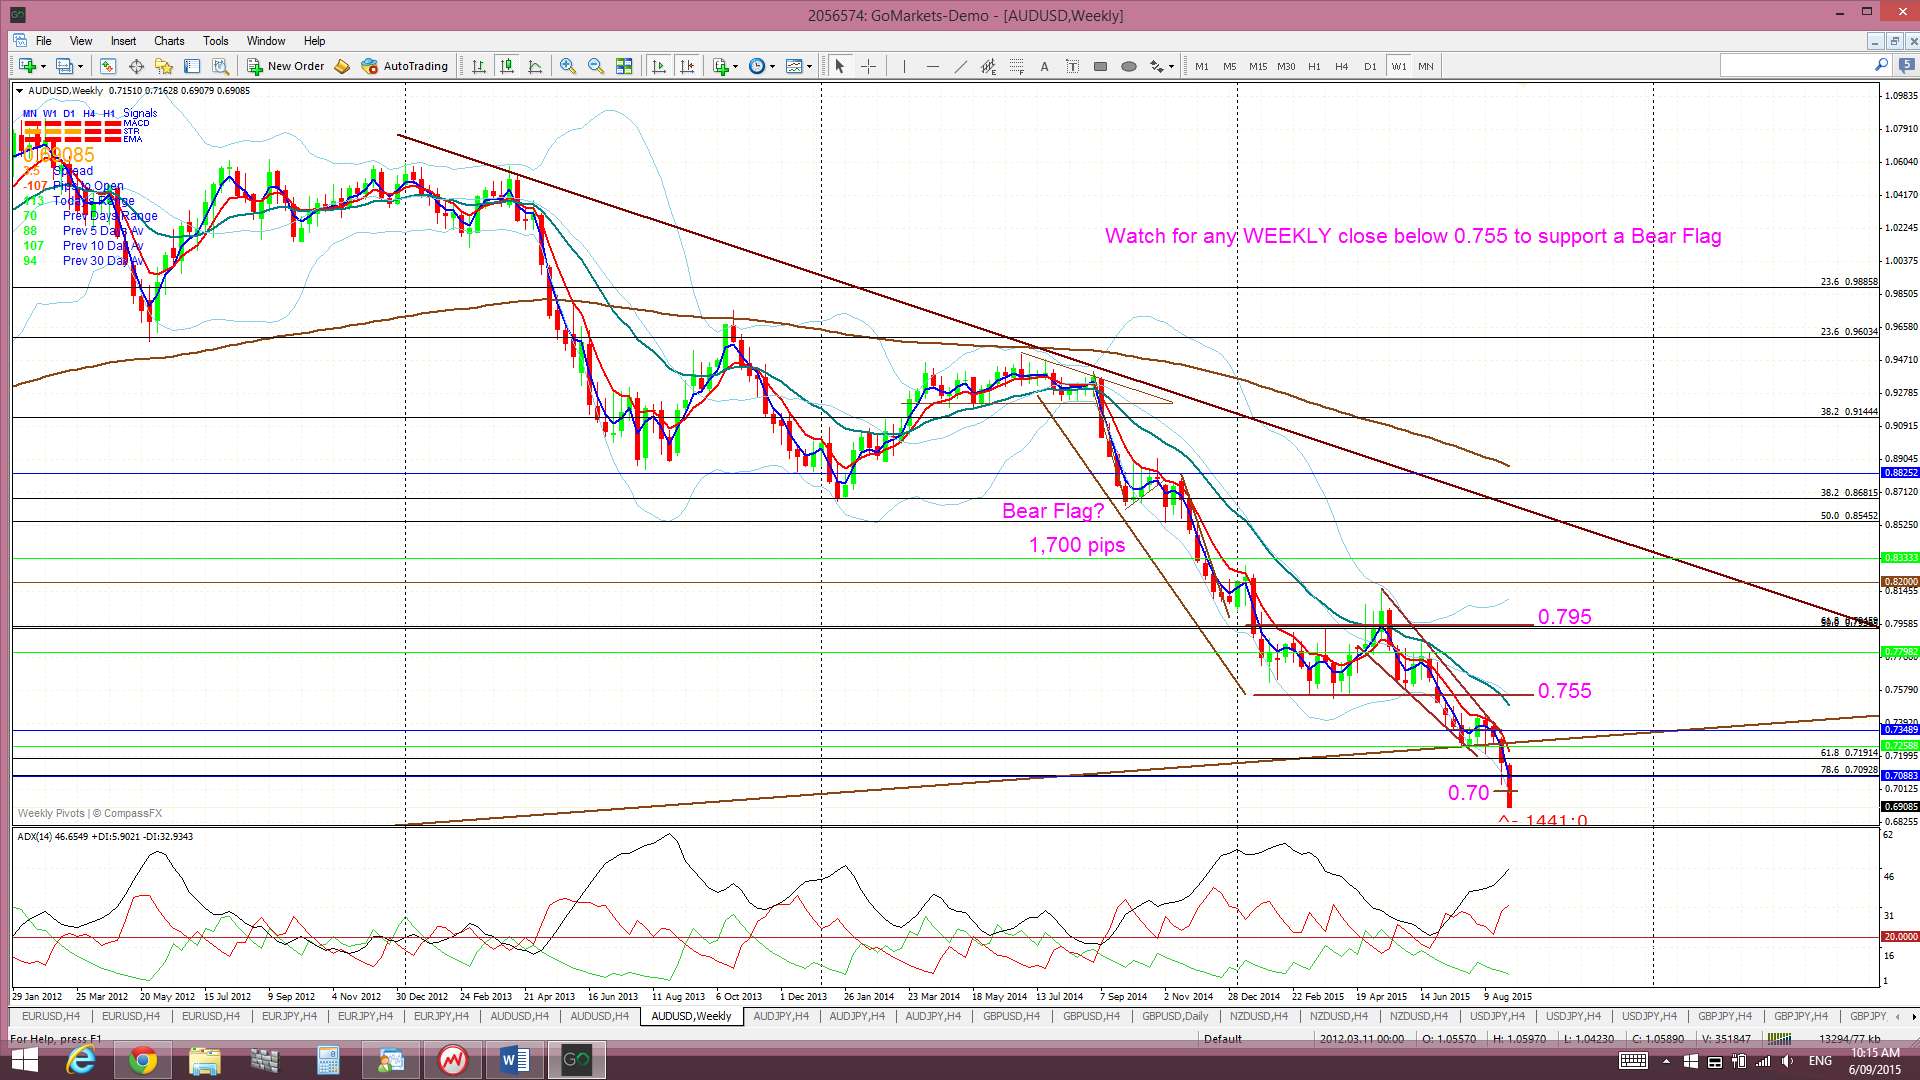
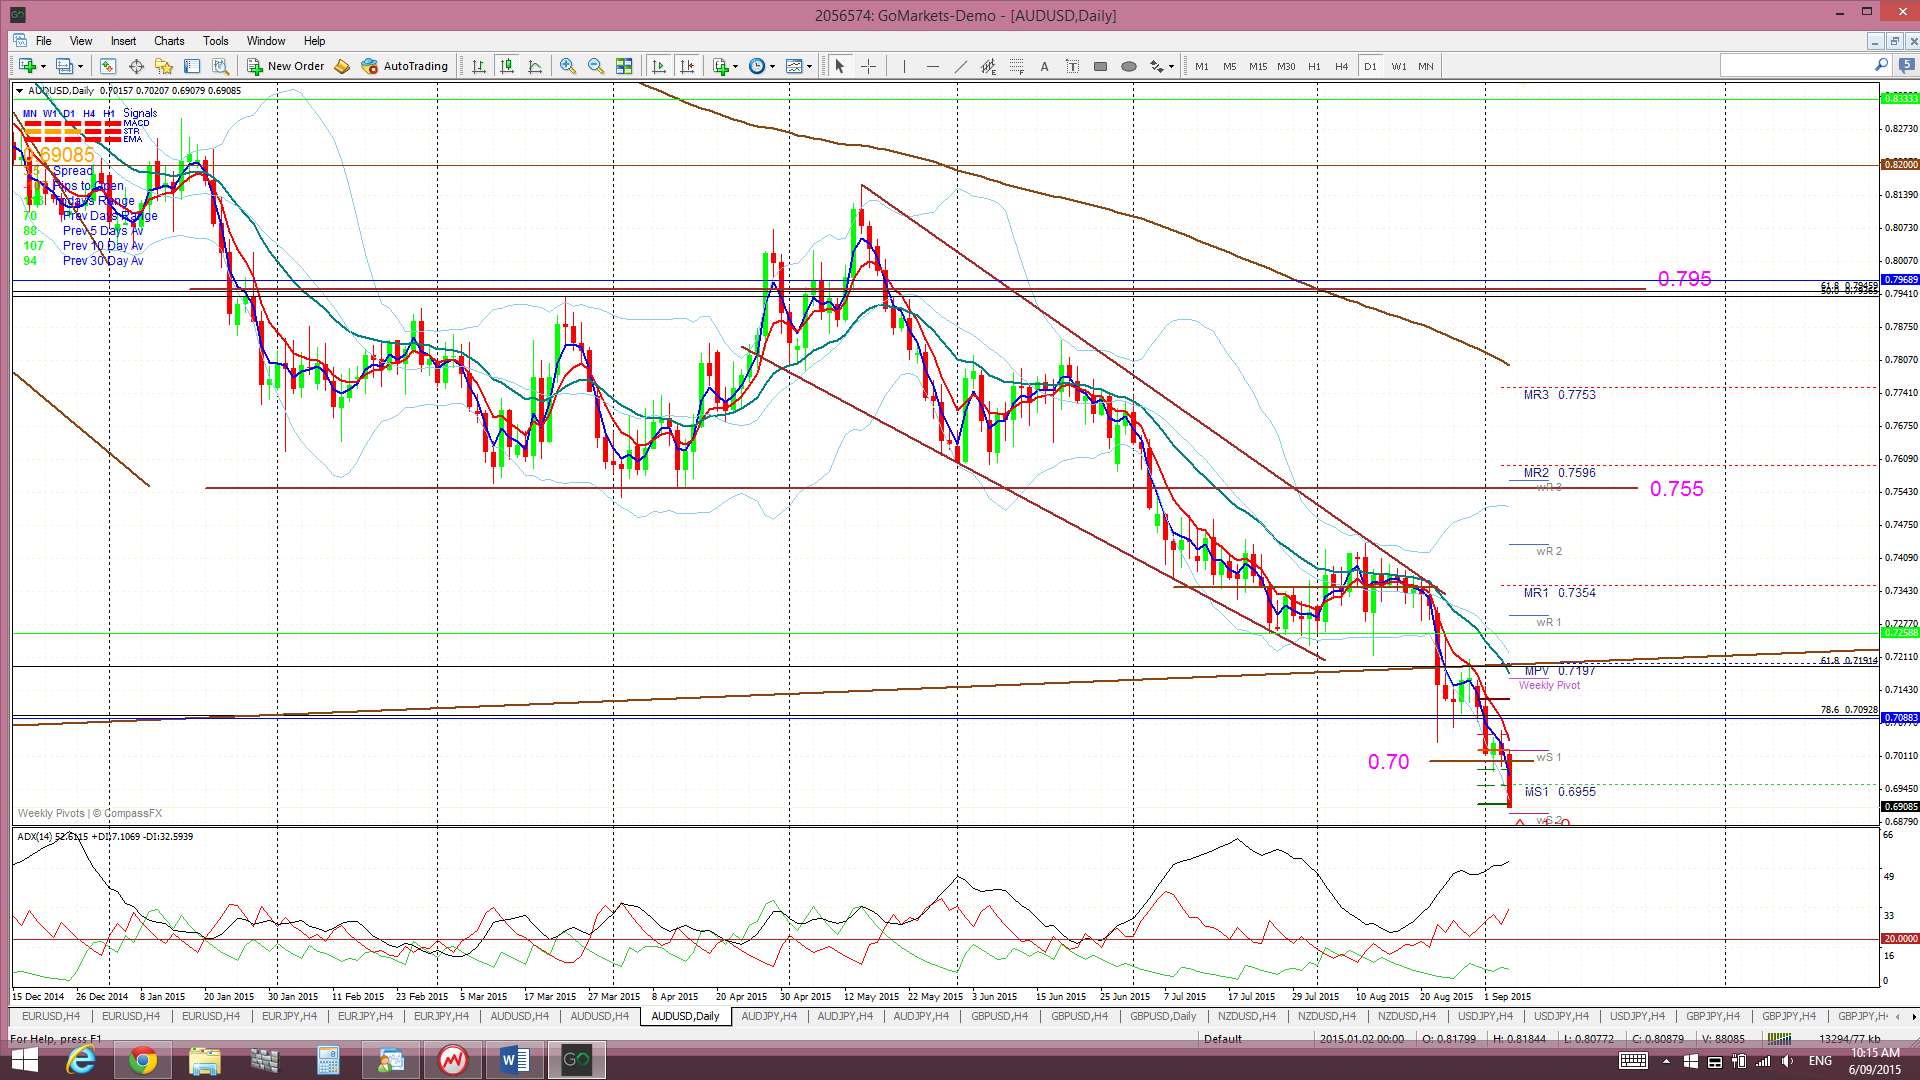
A/U: The A/U monthly candle closed below the long term support trend line and this was a bad way to start the week.
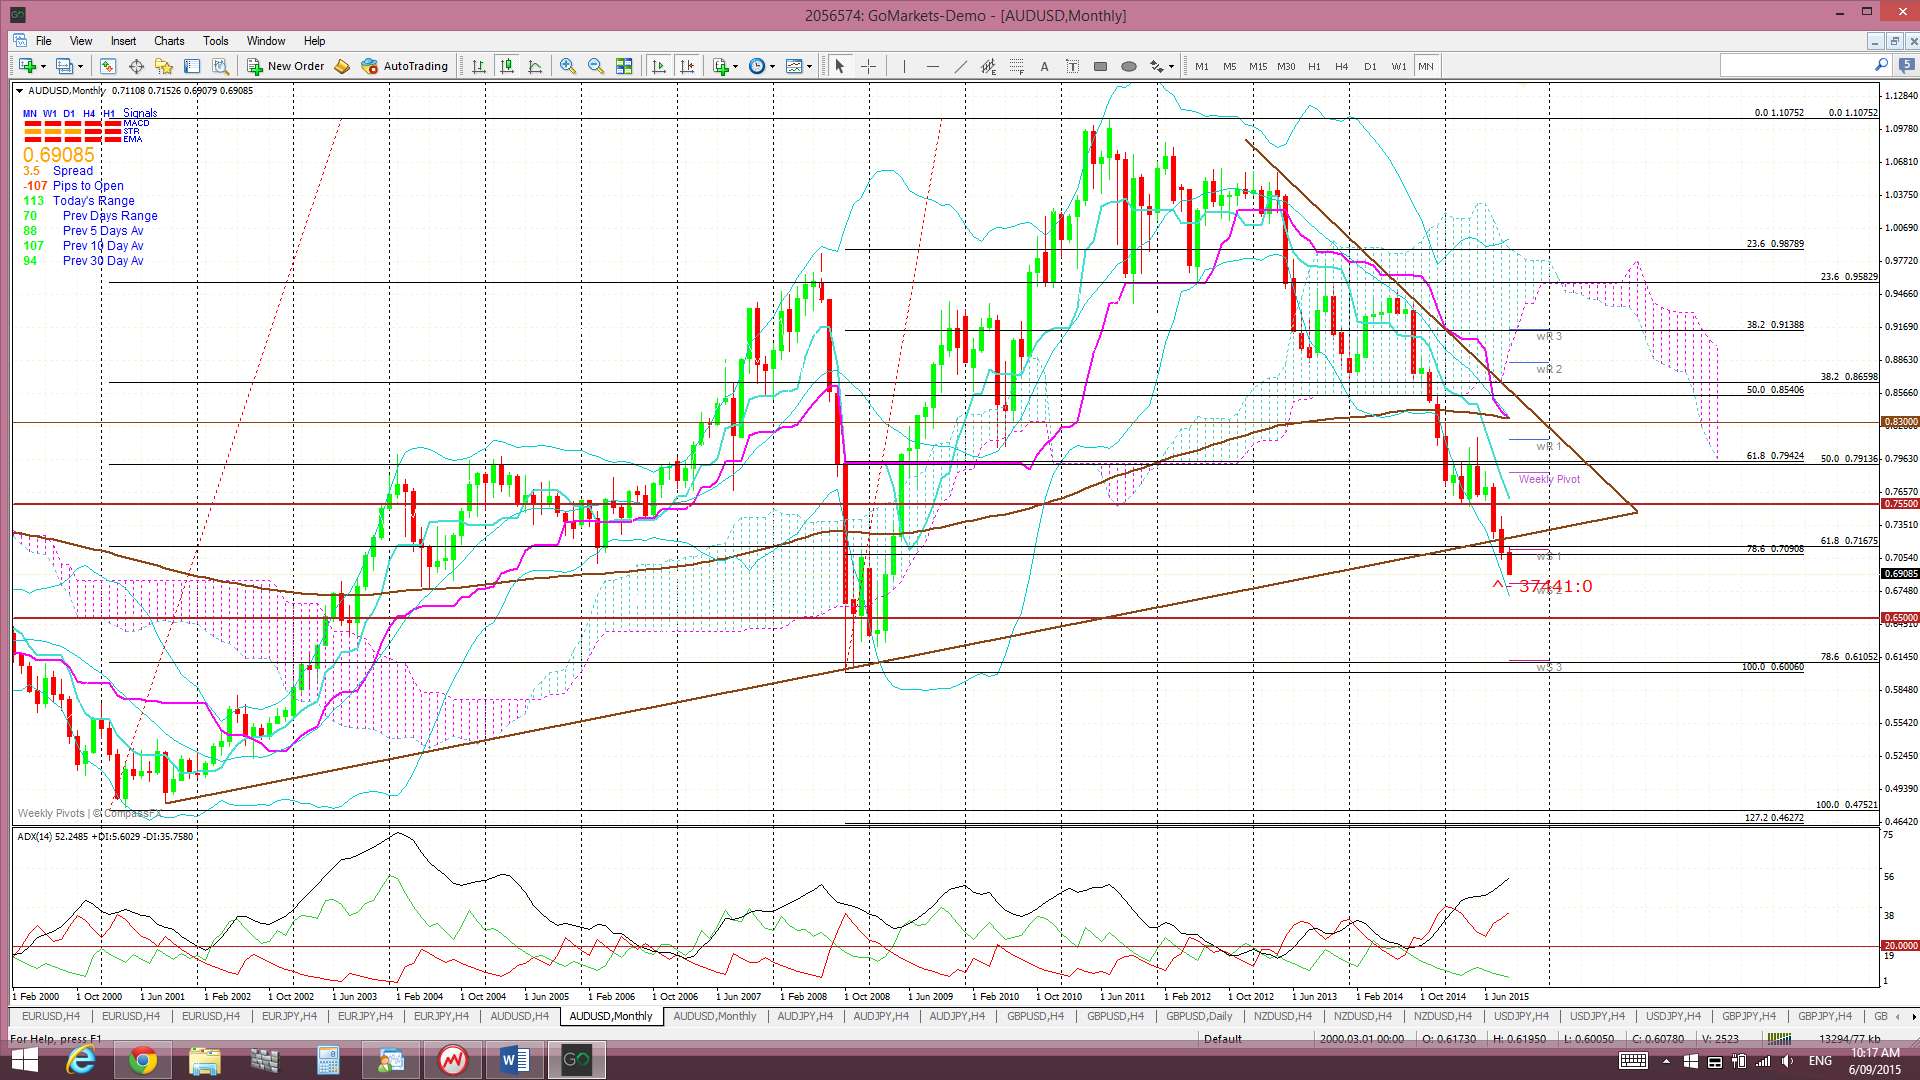
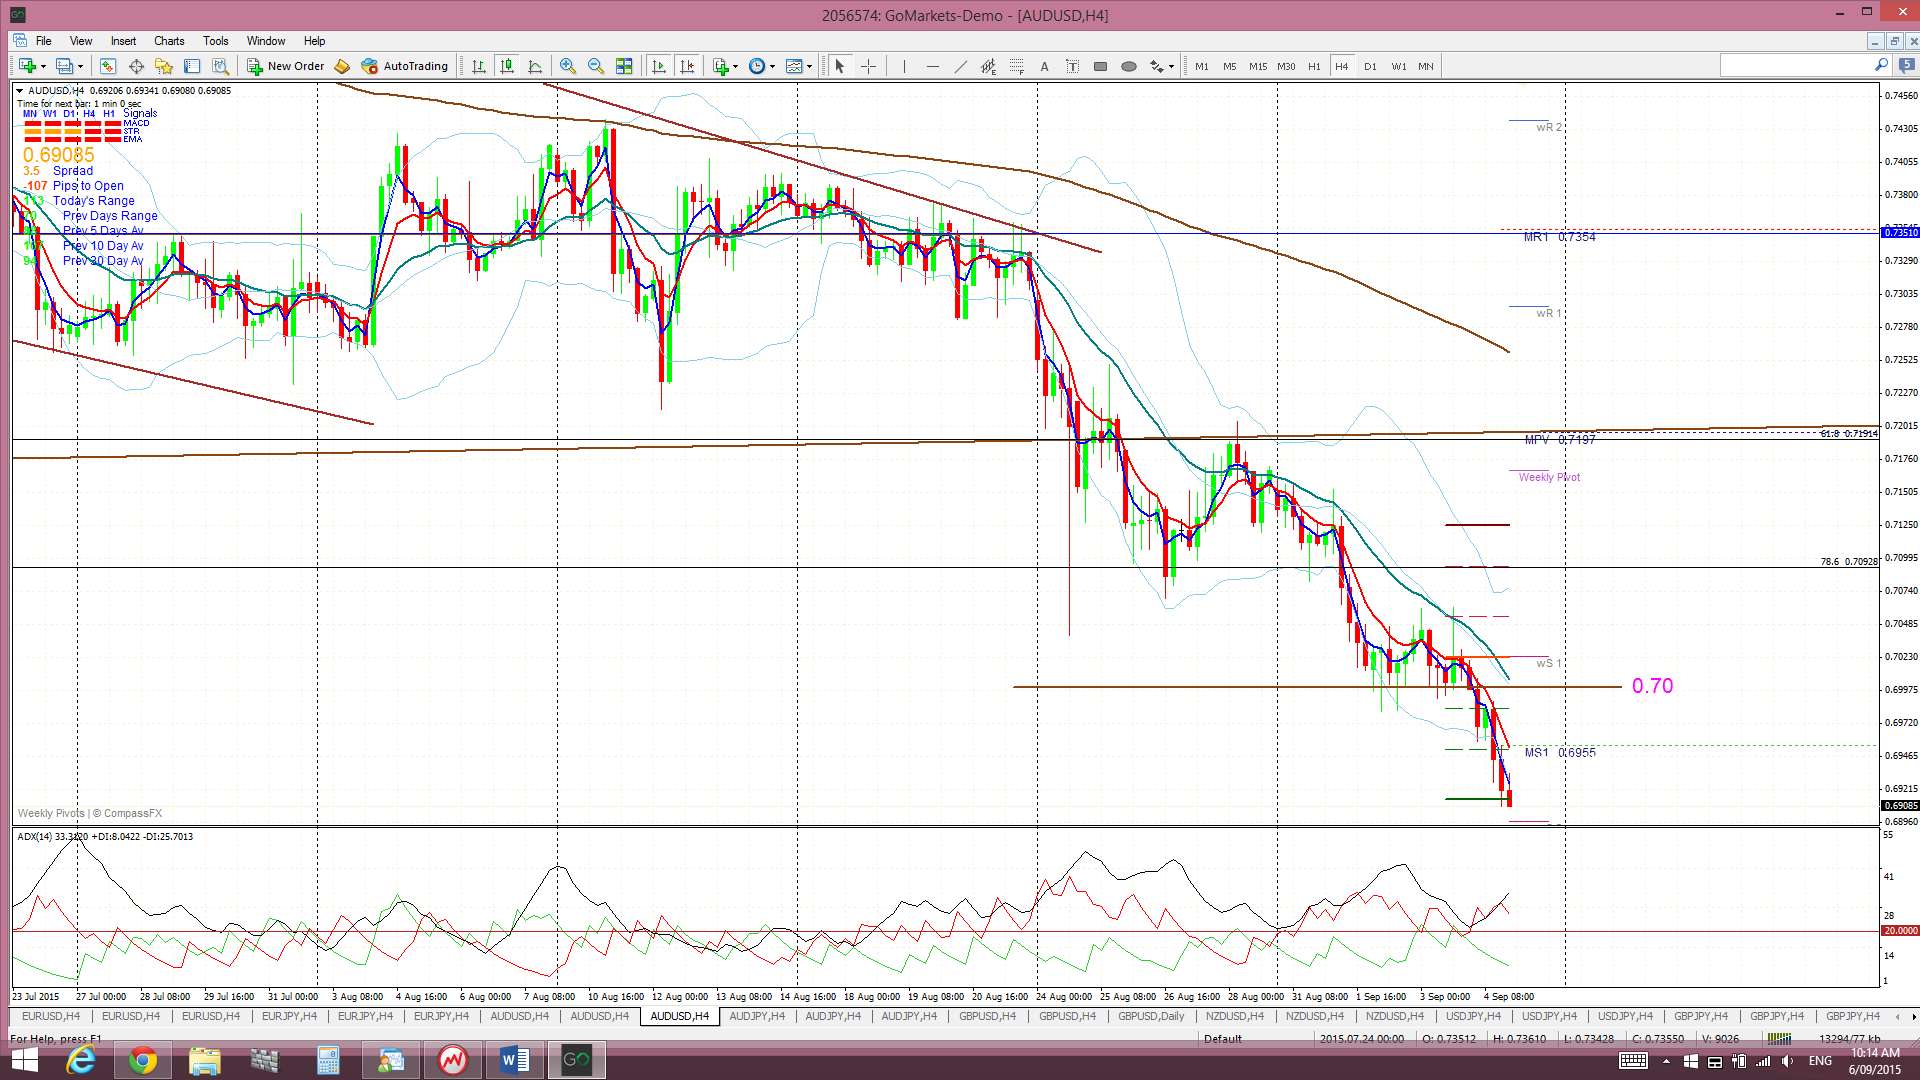
Some disappointing AUD data didn’t help much and the A/U eventually broke down below the last of three recent support levels; the final one being the 0.71 level which was near the 78.6% fib of the 2008-2011 swing high move. Price action subsequently tried to hold above the psychological 0.70 whole number level but this gave way during Friday’s Asian session and the A/U closed the week just above 0.69.
For those of you trying to understand this latest fall it is not just a factor of the perceived China slow down or the recent commodity rout. There is another significant factor feeding into this A/U fall and this stems from decreasing public confidence in the current ruling political party. There is broad based dissatisfaction with the current Government across a wide range of issues and the next couple of weeks might determine whether the current regime continues to reign in its current form. This is a ‘watch this space’ situation for sure! Any political change could trigger a relief rally in both the AUD and Aussie stock market.
Bear Flag: The Bear Flag was triggered with the hold and close below 0.755 and has now delivered up to 600 pips of a possible 1,700 pips.
Price is trading below the Ichimoku Cloud on the 4hr, daily, weekly and monthly charts.
The weekly candle closed as a large bearish candle.
It is a big week for the AUD with data this week: Tuesday brings AUD Business Confidence and CNY Trade Balance data. Thursday then brings AUD Unemployment and CNY CPI data. Watch how the A/U reacts around these key data items.
- I’m watching for any new TC signal on this pair and the 0.69 level.
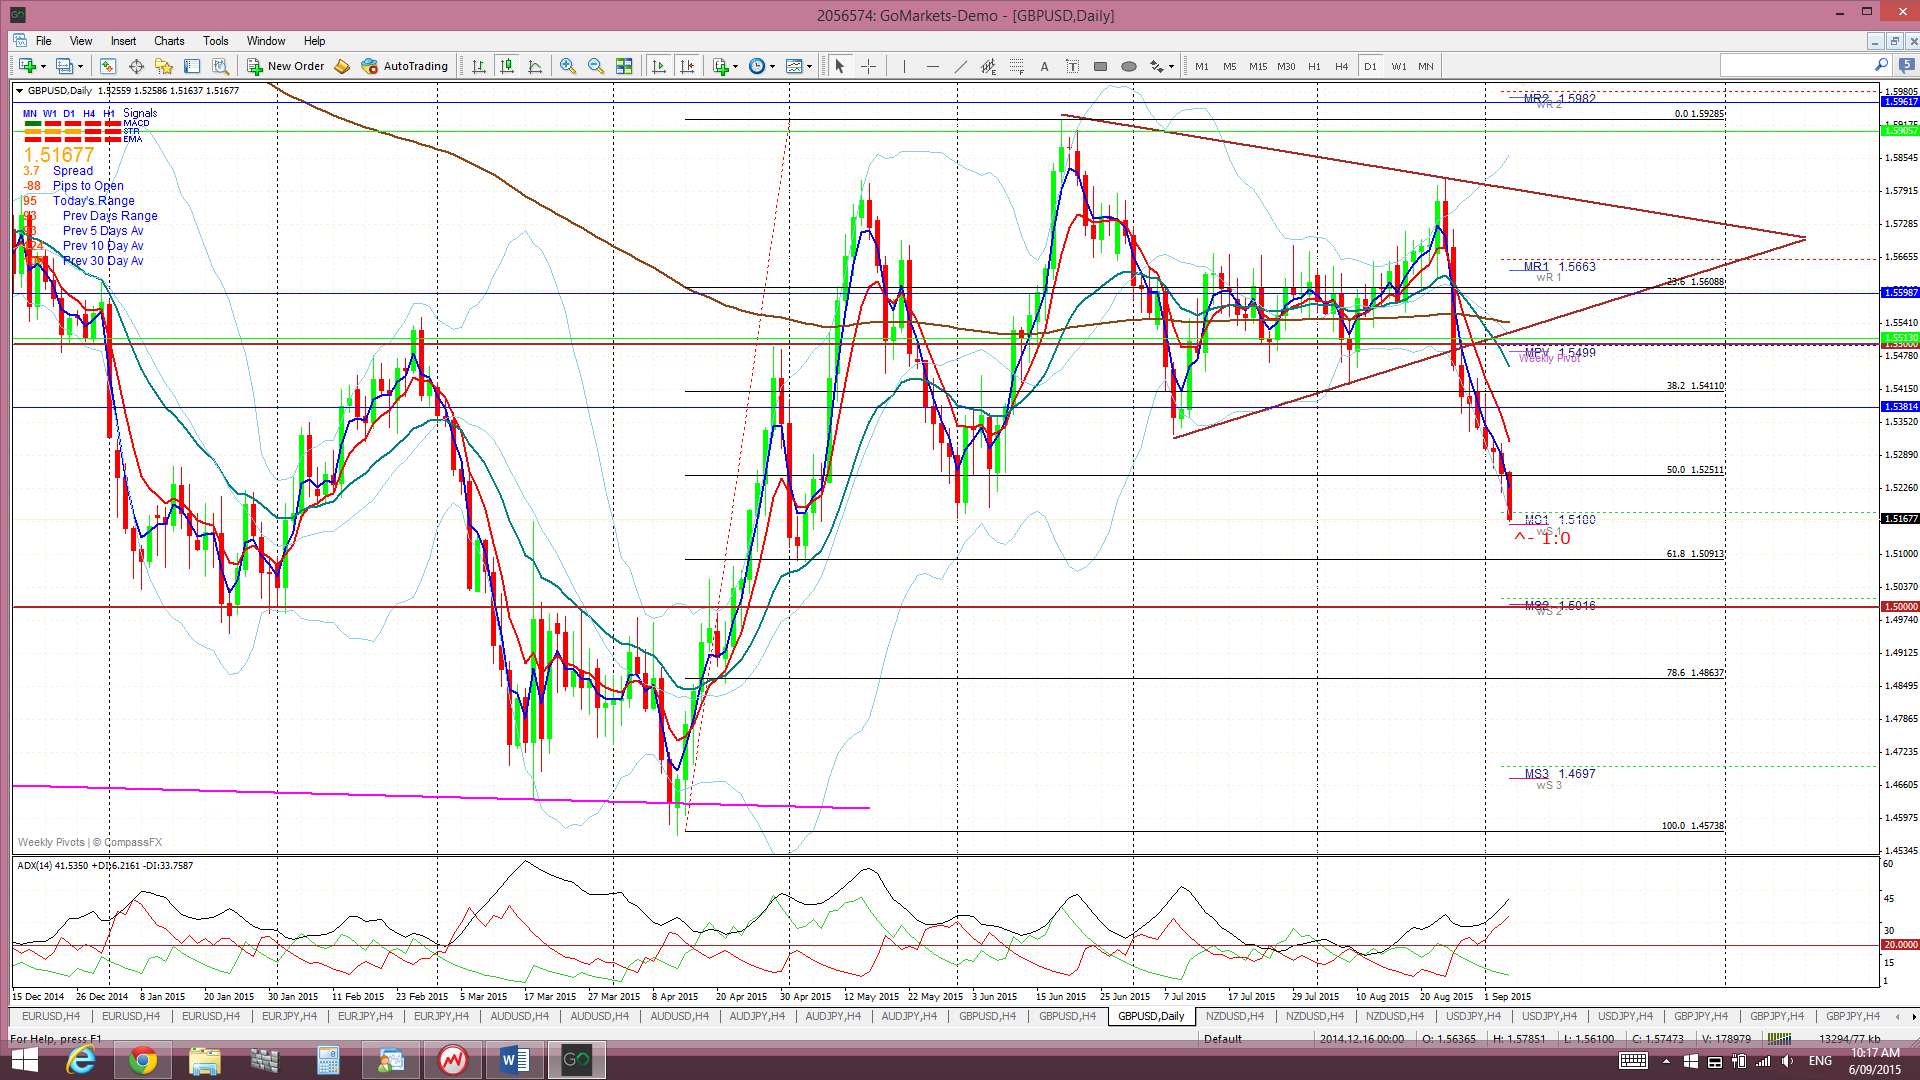
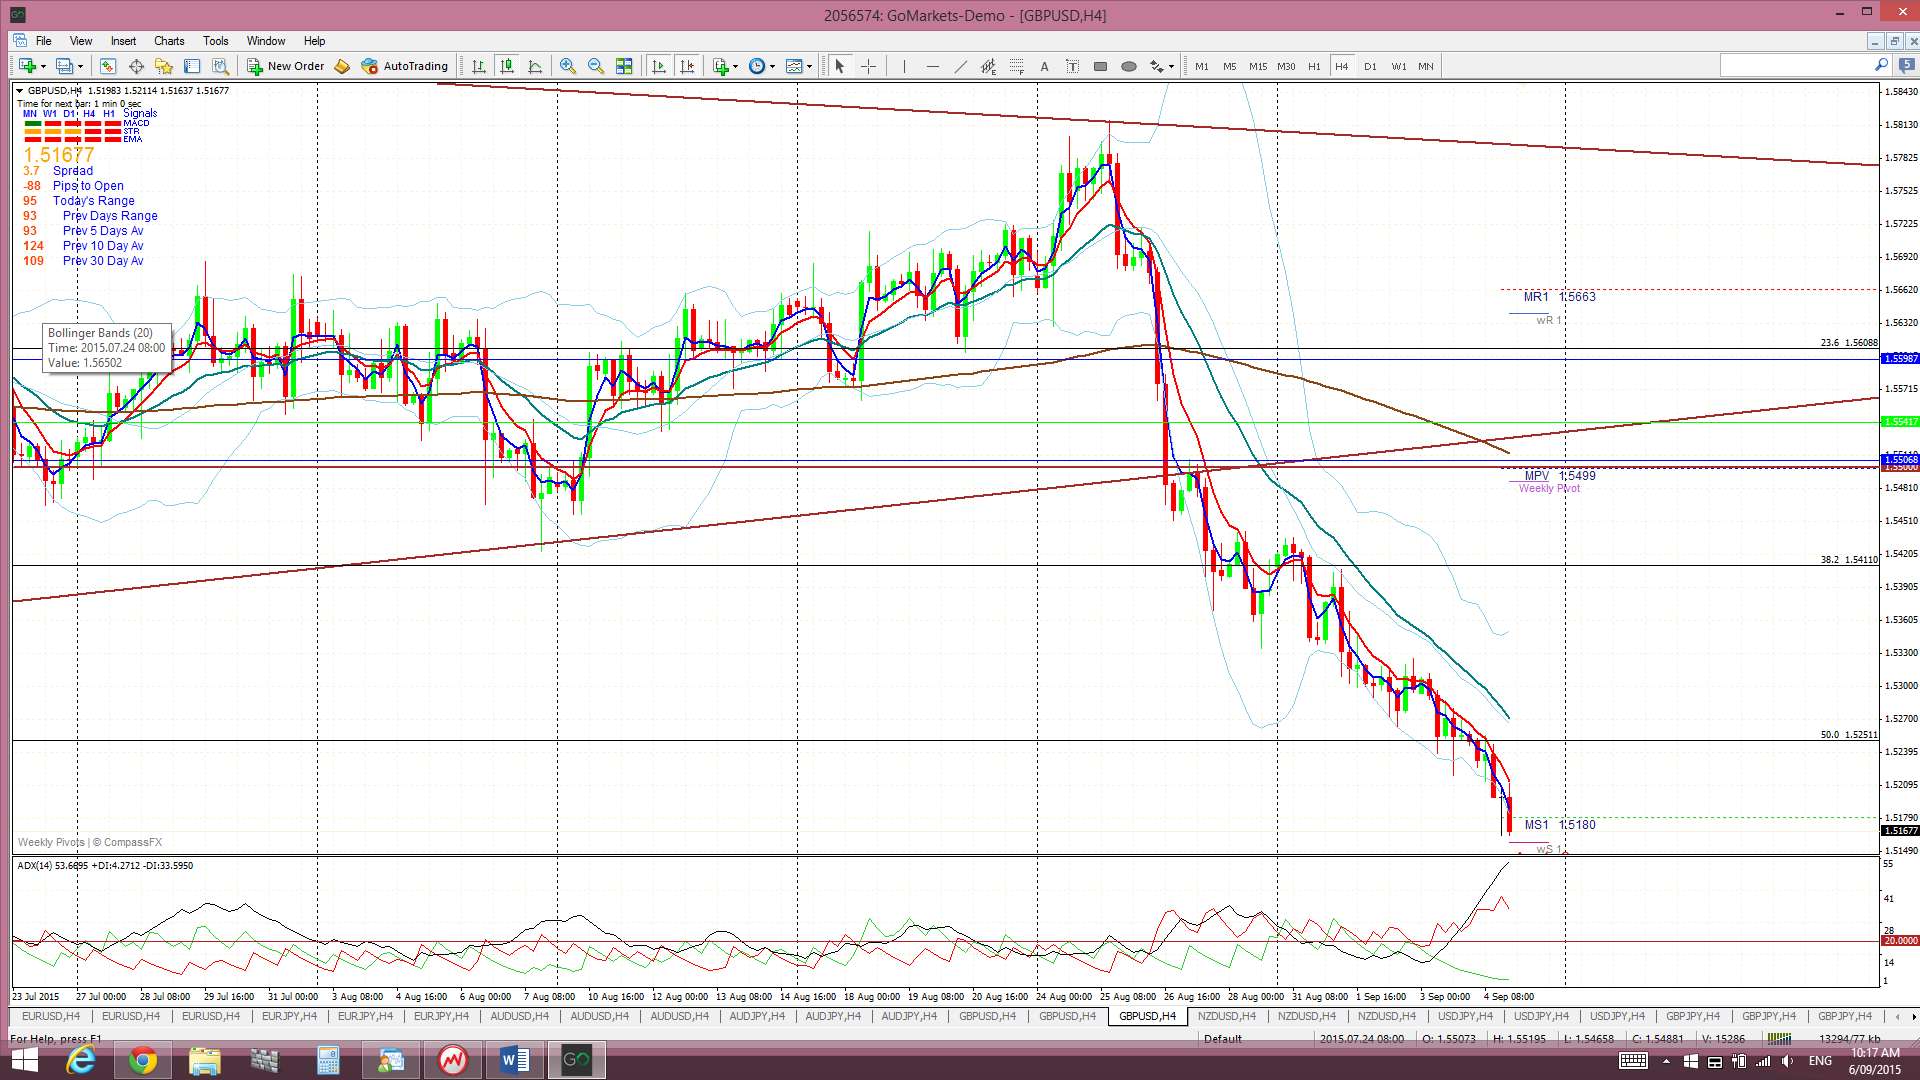
G/U: The Cable’s daily-chart based triangle breakdown continued last week and has now given up to 320 pips. The appearance of the daily chart does suggest, to me at least, that we might see the 1.50 level tested again.
Weekly chart H&S: There is still a possible bearish H&S pattern forming on the weekly chart but the failure to break below the ‘neck line’ is holding this pattern off the time being. The height of the pattern is about 2,400 pips and suggests a similar move lower with any break and hold below the ‘neck line’. I would consider that any close and hold back above 1.60 would void this pattern.
Price is trading below the Cloud on the 4hr, daily, weekly and monthly charts.
The weekly candle closed as a large bearish candle.
The main risk event for this pair in the coming week is the BoE interest rate decision on Thursday 10th.
- I’m watching for any new TC signal on this pair and the 1.50 level.

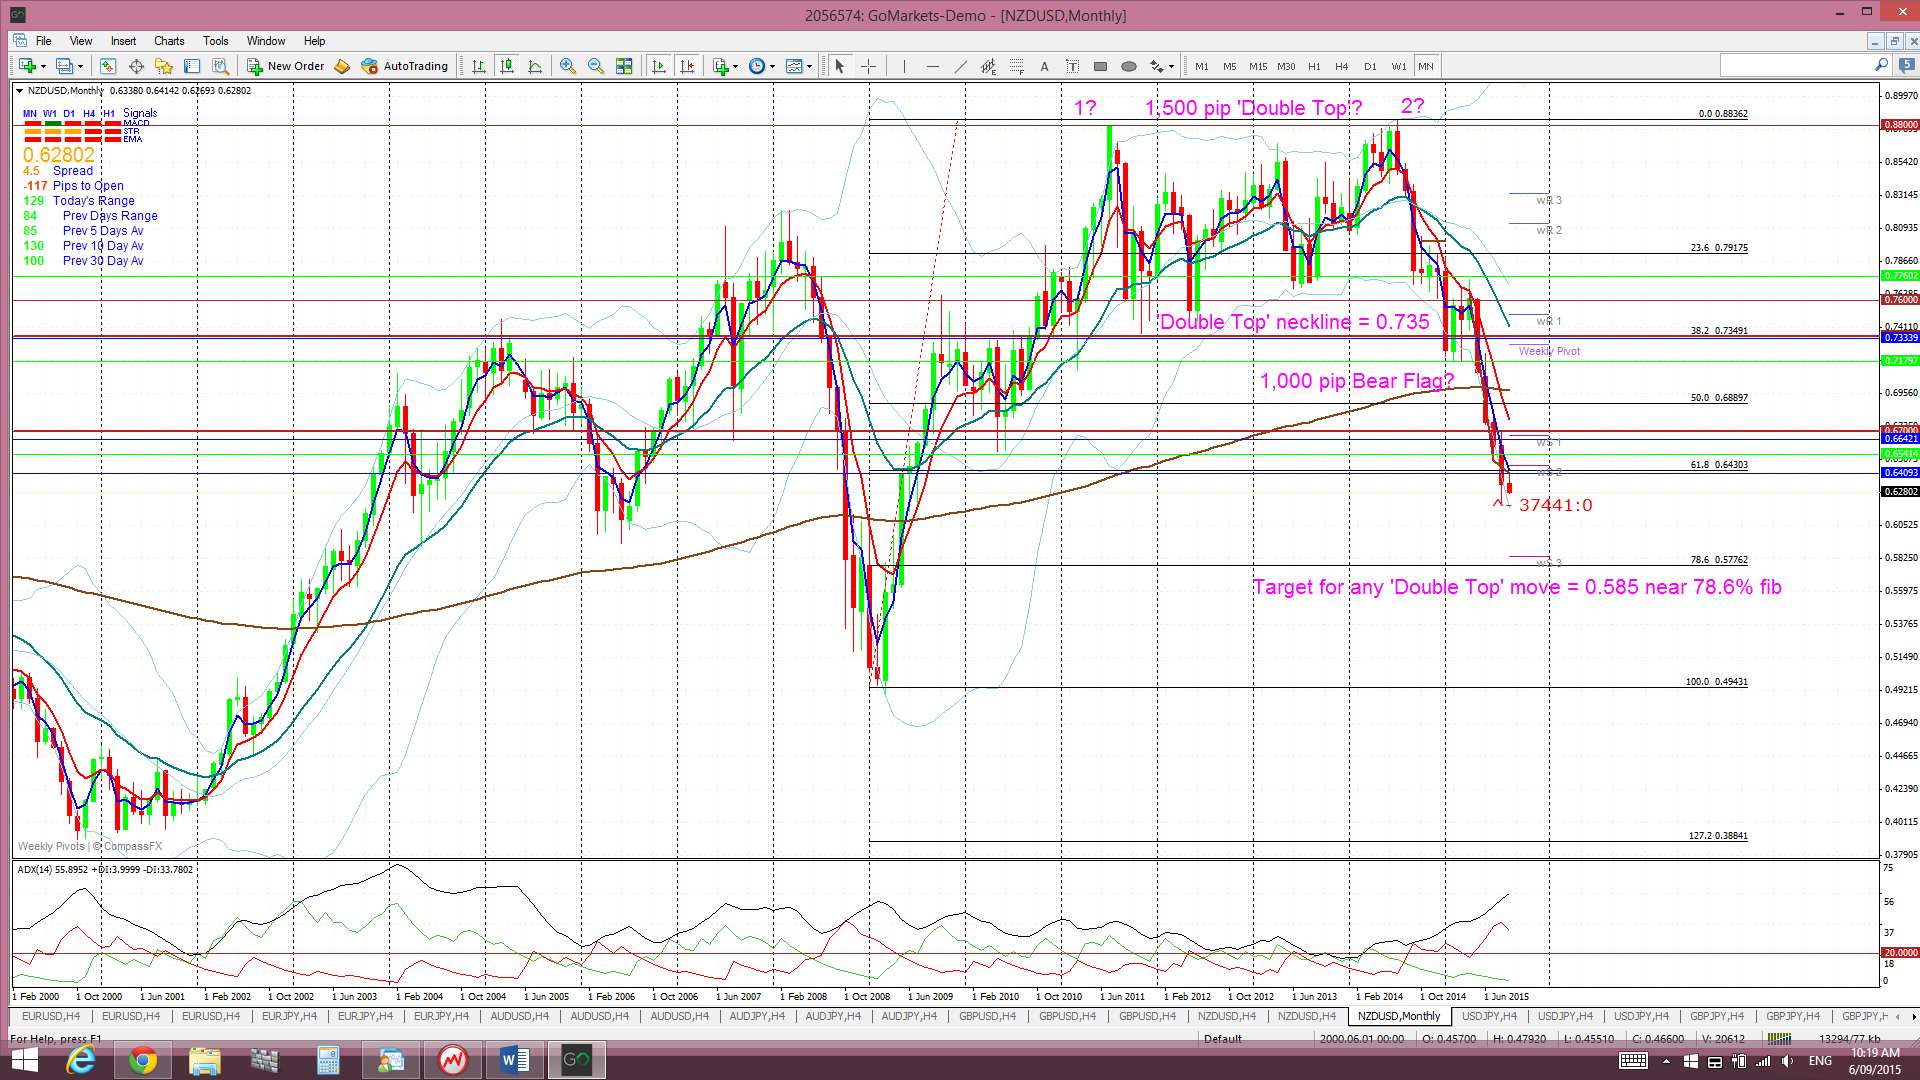
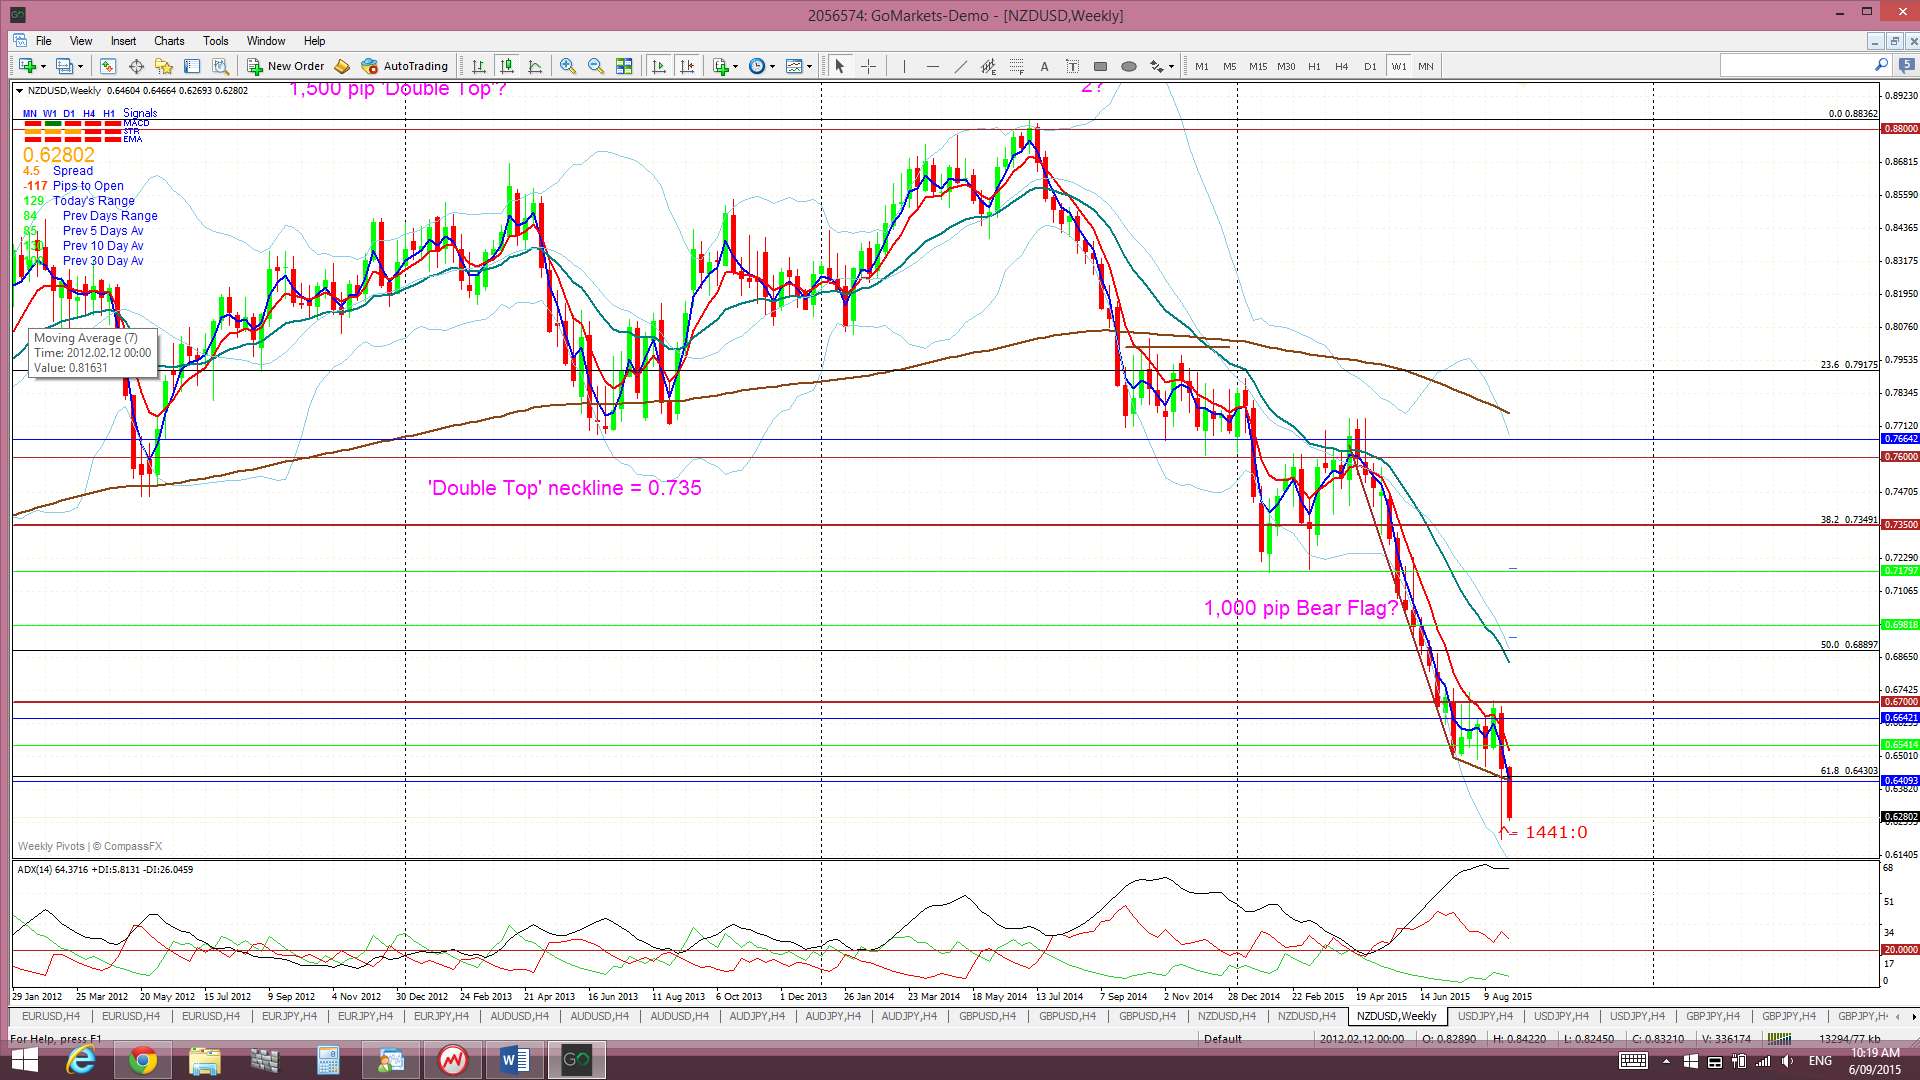
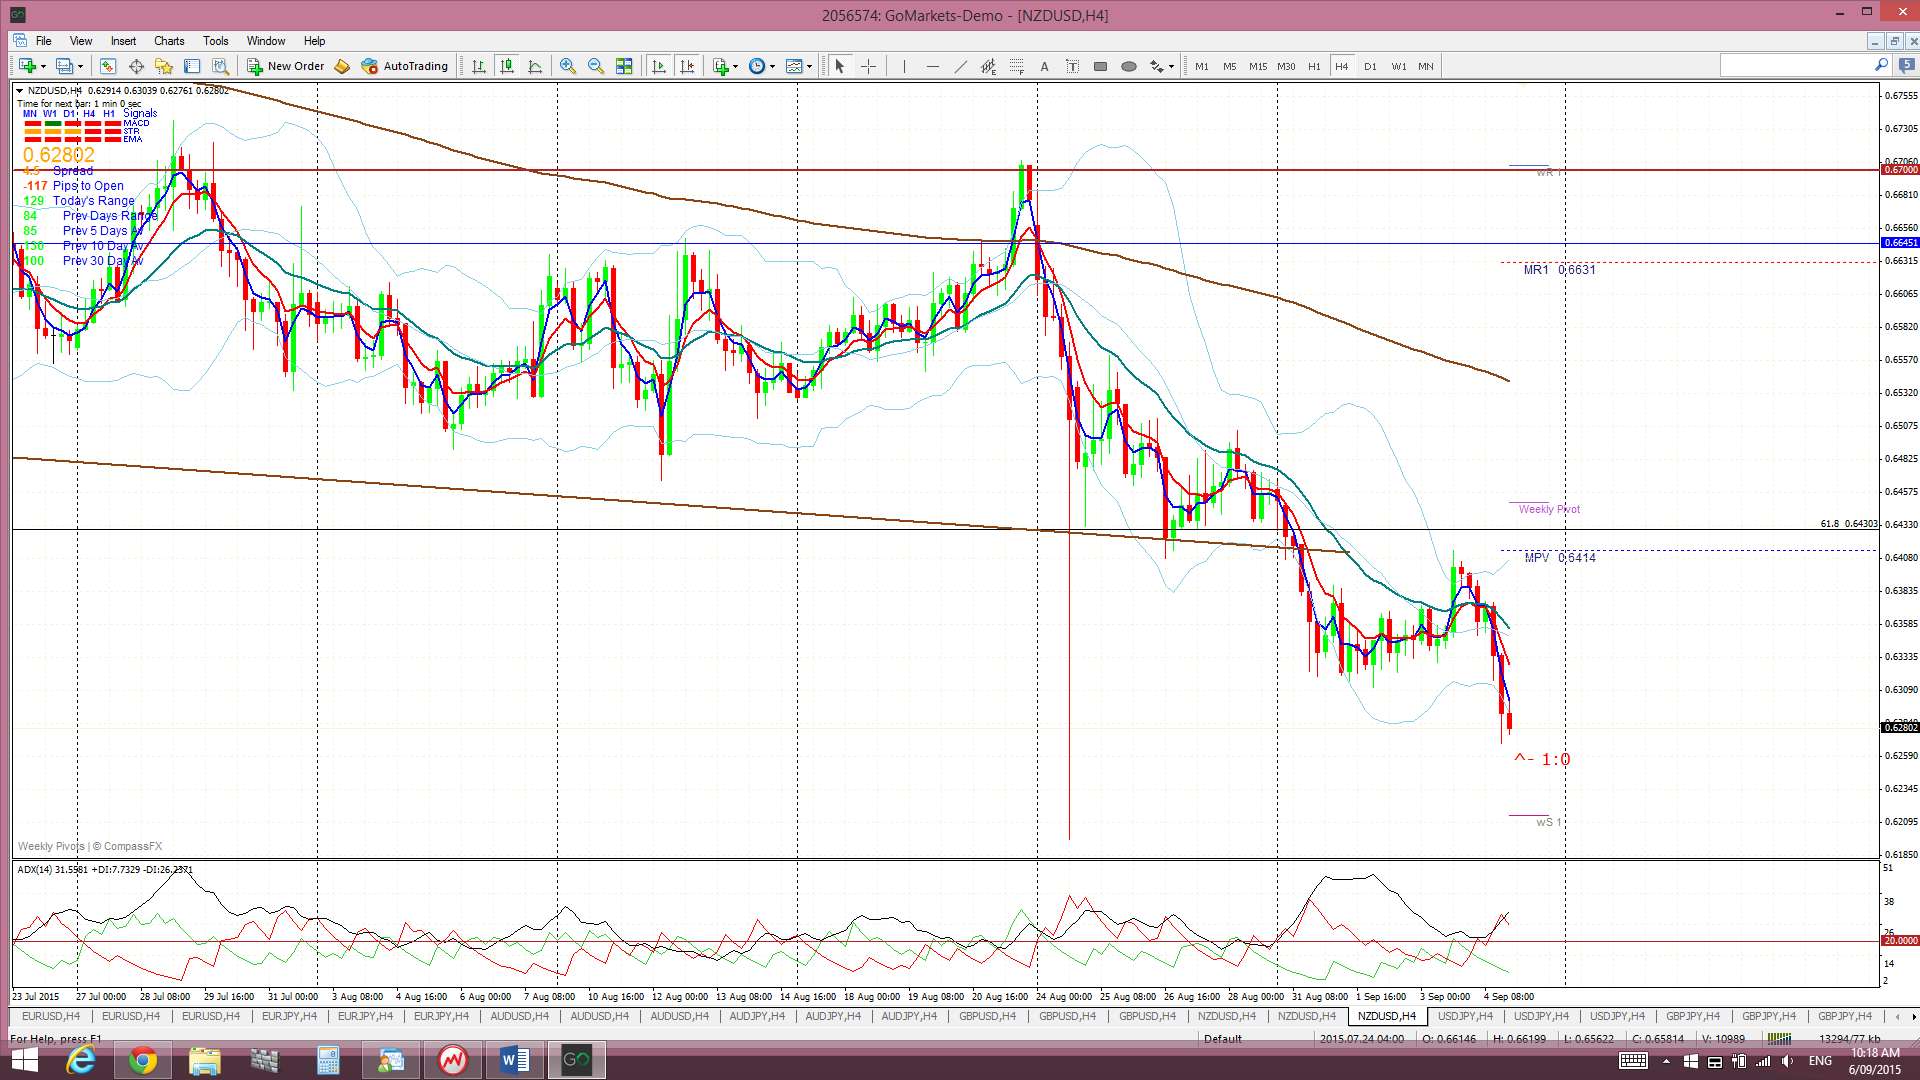
Kiwi: NZD/USD: The Kiwi has held up fairly well considering how some other pairs have fared although it has printed a daily, and now weekly, close below the Bear Flag’s bottom trend line and below the key 0.64 support region The 0.64 region being the 61.8% fib of the 2008-2011 swing high move. Traders will be watching to see the outcome of next week’s RBNZ interest rate decision and there could even be a test of this key 0.64 S/R region before any bearish follow through.
‘Double Top’ breakdown on Monthly chart? The monthly chart still reveals a possible ‘Double Top’ pattern with a neck line at 0.735. The monthly candle close below this level for January suggested a possible 2,000 pip bearish follow through move as this is the height of the ‘Double Top’. This bearish move has spiked to over 1,000 pips so far.
Price is trading below the Cloud on the 4hr, daily, weekly charts and monthly charts.
The weekly candle closed as another large bearish candle.
The main risk event for this pair in the coming week is the RBNZ interest rate decision on Thursday 10th.
- I’m watching for any new TC signal on this pair, the Bear Flag trend line and the 61.8% fib level near 0.64.
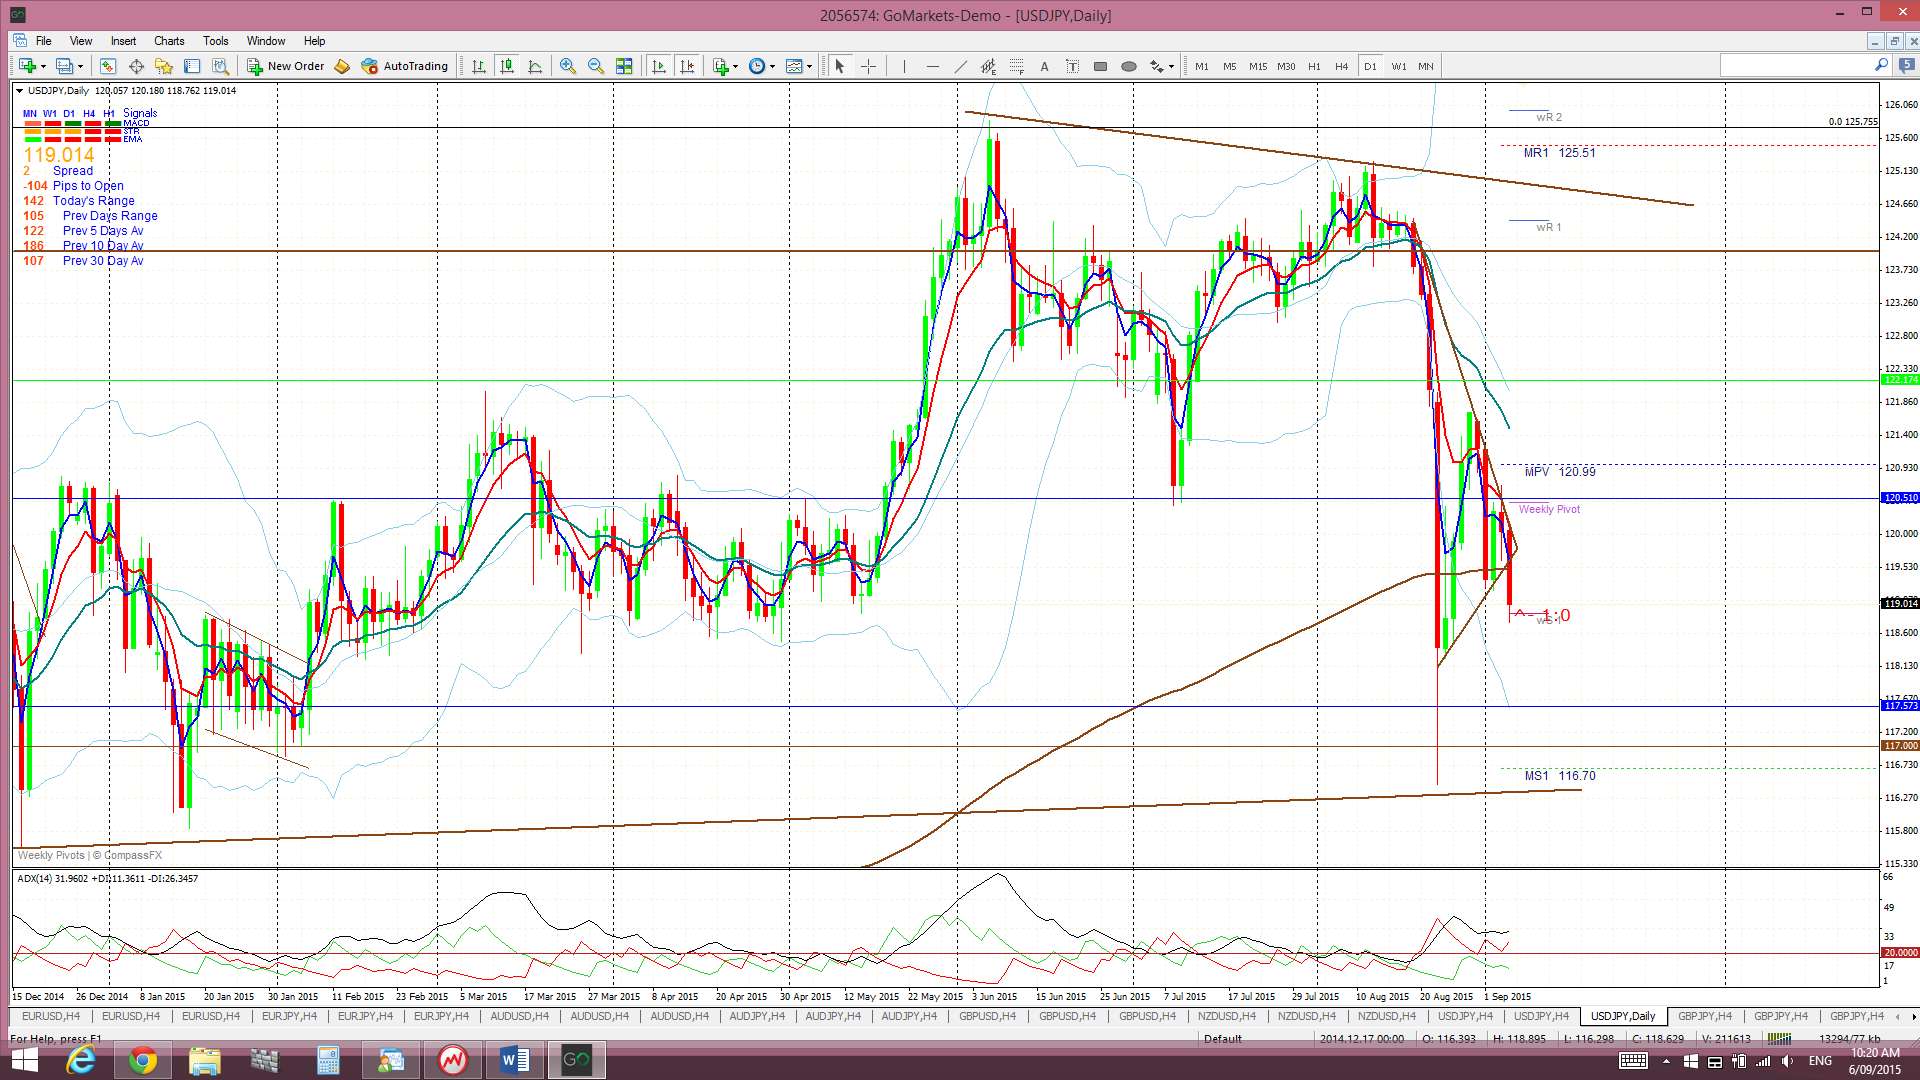
The Yen: U/J: The U/J chopped around to start the week and this price action had the pair consolidating into a triangle pattern on the 4hr chart. Price dipped below this triangle on Friday but hasn’t fallen too much further just yet.
Price is trading below the Cloud on the 4hr and daily charts but above the Cloud on the weekly and monthly charts.
The weekly candle closed as a large bearish candle.
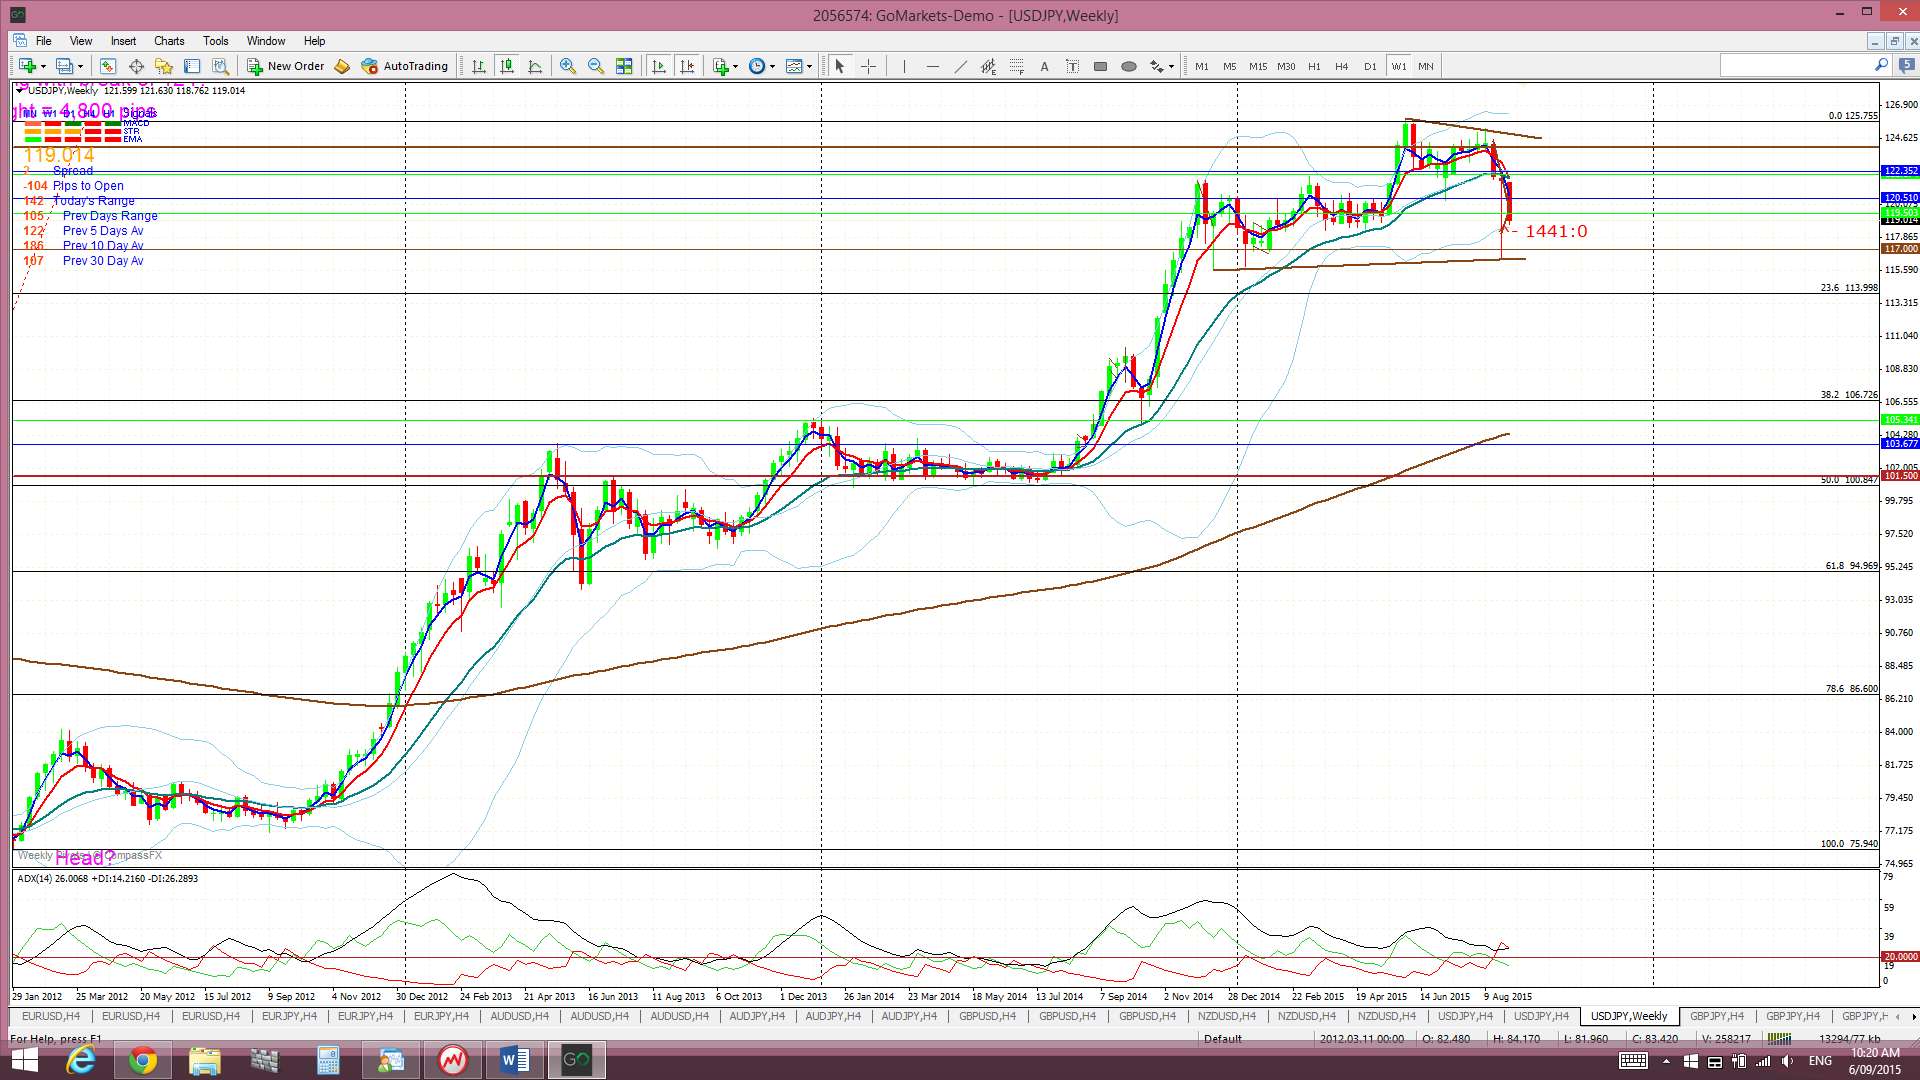
Monthly Chart Bullish Cup’ n’ Handle pattern: There looks to be a new bullish Cup ‘n’ Handle forming up on the monthly chart. The theory behind these patterns is that the height of the ‘Cup’ pattern is equivalent to the expected bullish move from the ‘handle’ breakout. The height of the Cup for the U/J weekly chart is around 4,800 ~ 4,900 pips. This may seem like a massive move but the longer term chart below shows this move to be reasonable as it would take the U/J up near the 50% fib of the 1985-2012 swing low move.
Thelma and Louise: this was a Hollywood movie about two friends who embarked on a road trip with disastrous consequences. I’m wondering if this theme is going to resonate with the USD/JPY and S&P500 over coming sessions. I’m looking for the S&P500 to possibly pullback to test the 1,600 key S/R level. Thus, for its stall-mate the USD/JPY, check out the 101.50 level on the monthly chart. Any U/J pullback down to 101.50, apart from helping to form up a huge ‘Handle’ for the bullish ‘Cup ‘n’ Handle’, would also help to develop a bullish ‘Inverse H&S’ pattern. Many have scoffed at a pullback to this region but it is the 50% fib of the major swing high move and, so, not totally out of the question. I could see this U/J move as being more probable though IF we do get the S&P500 continuing to pullback, possibly to test 1,600!
- I’m watching for any new TC signal.


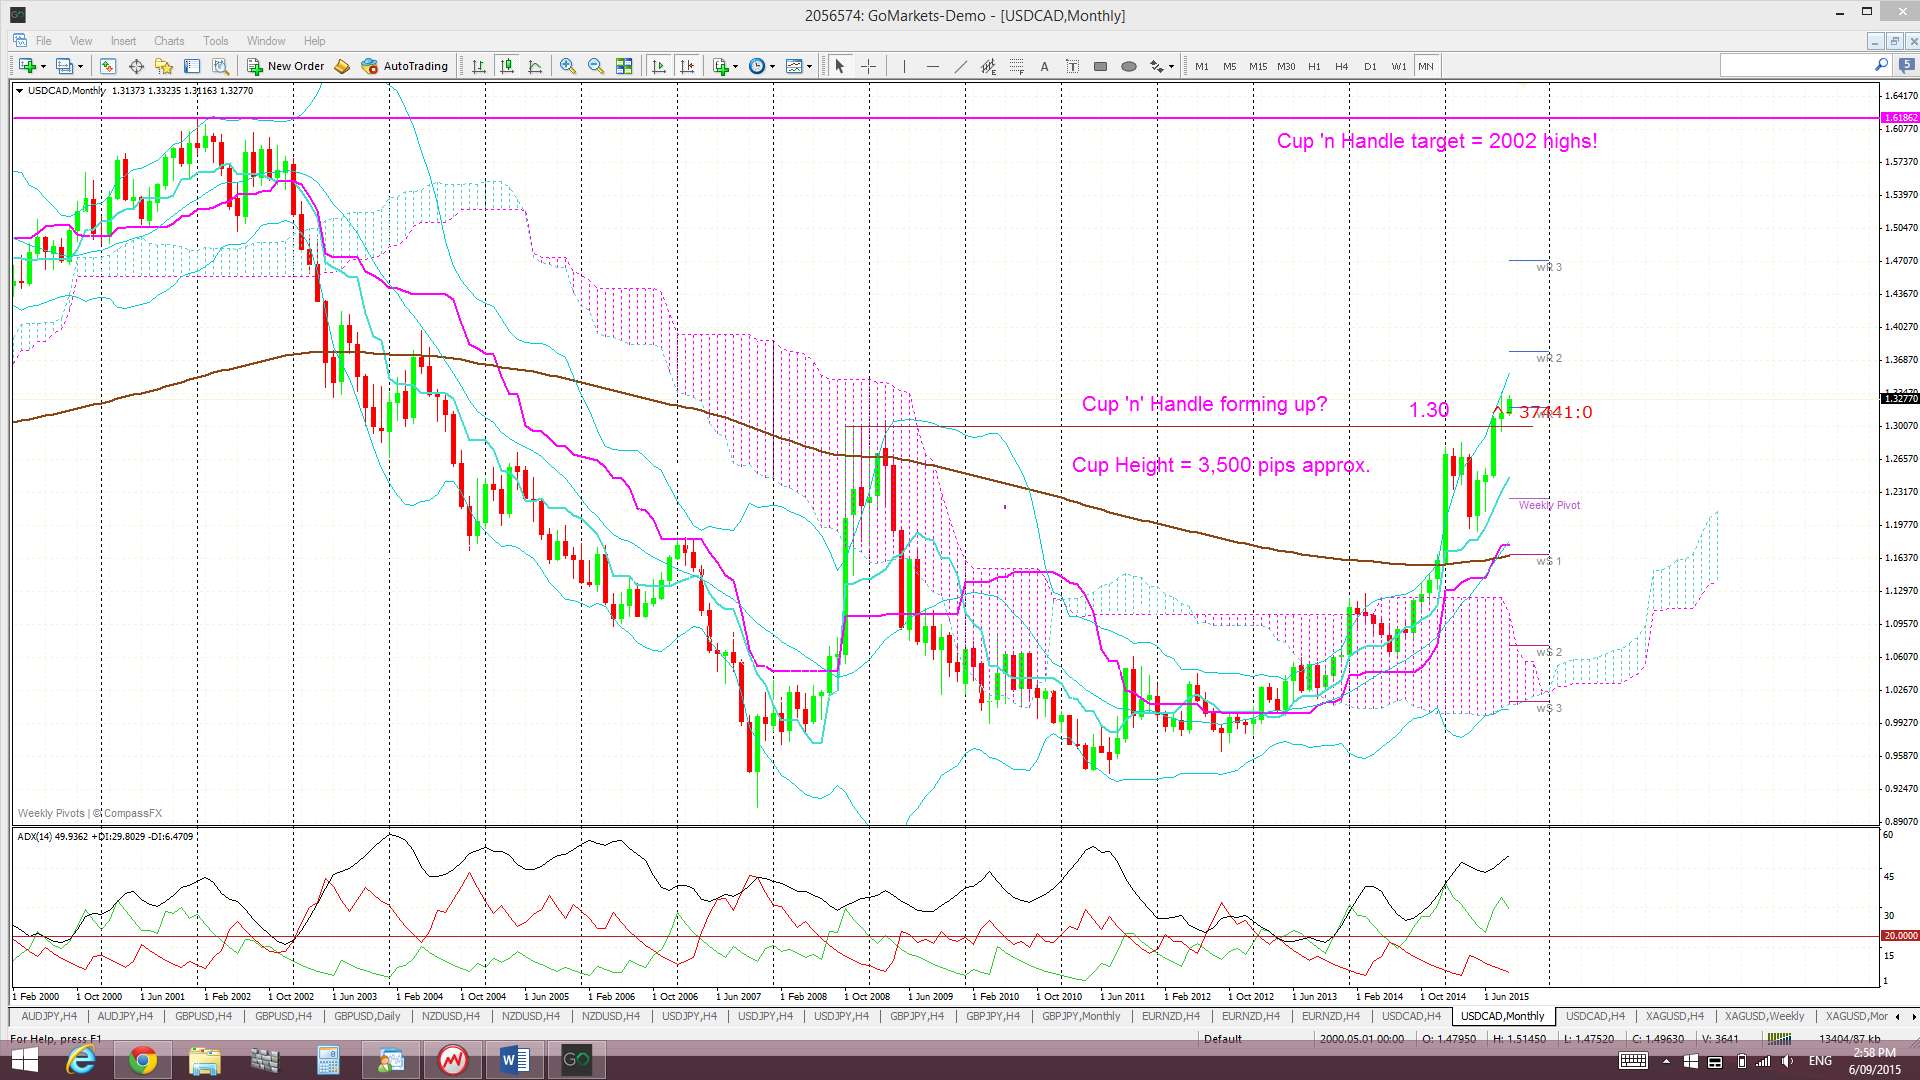
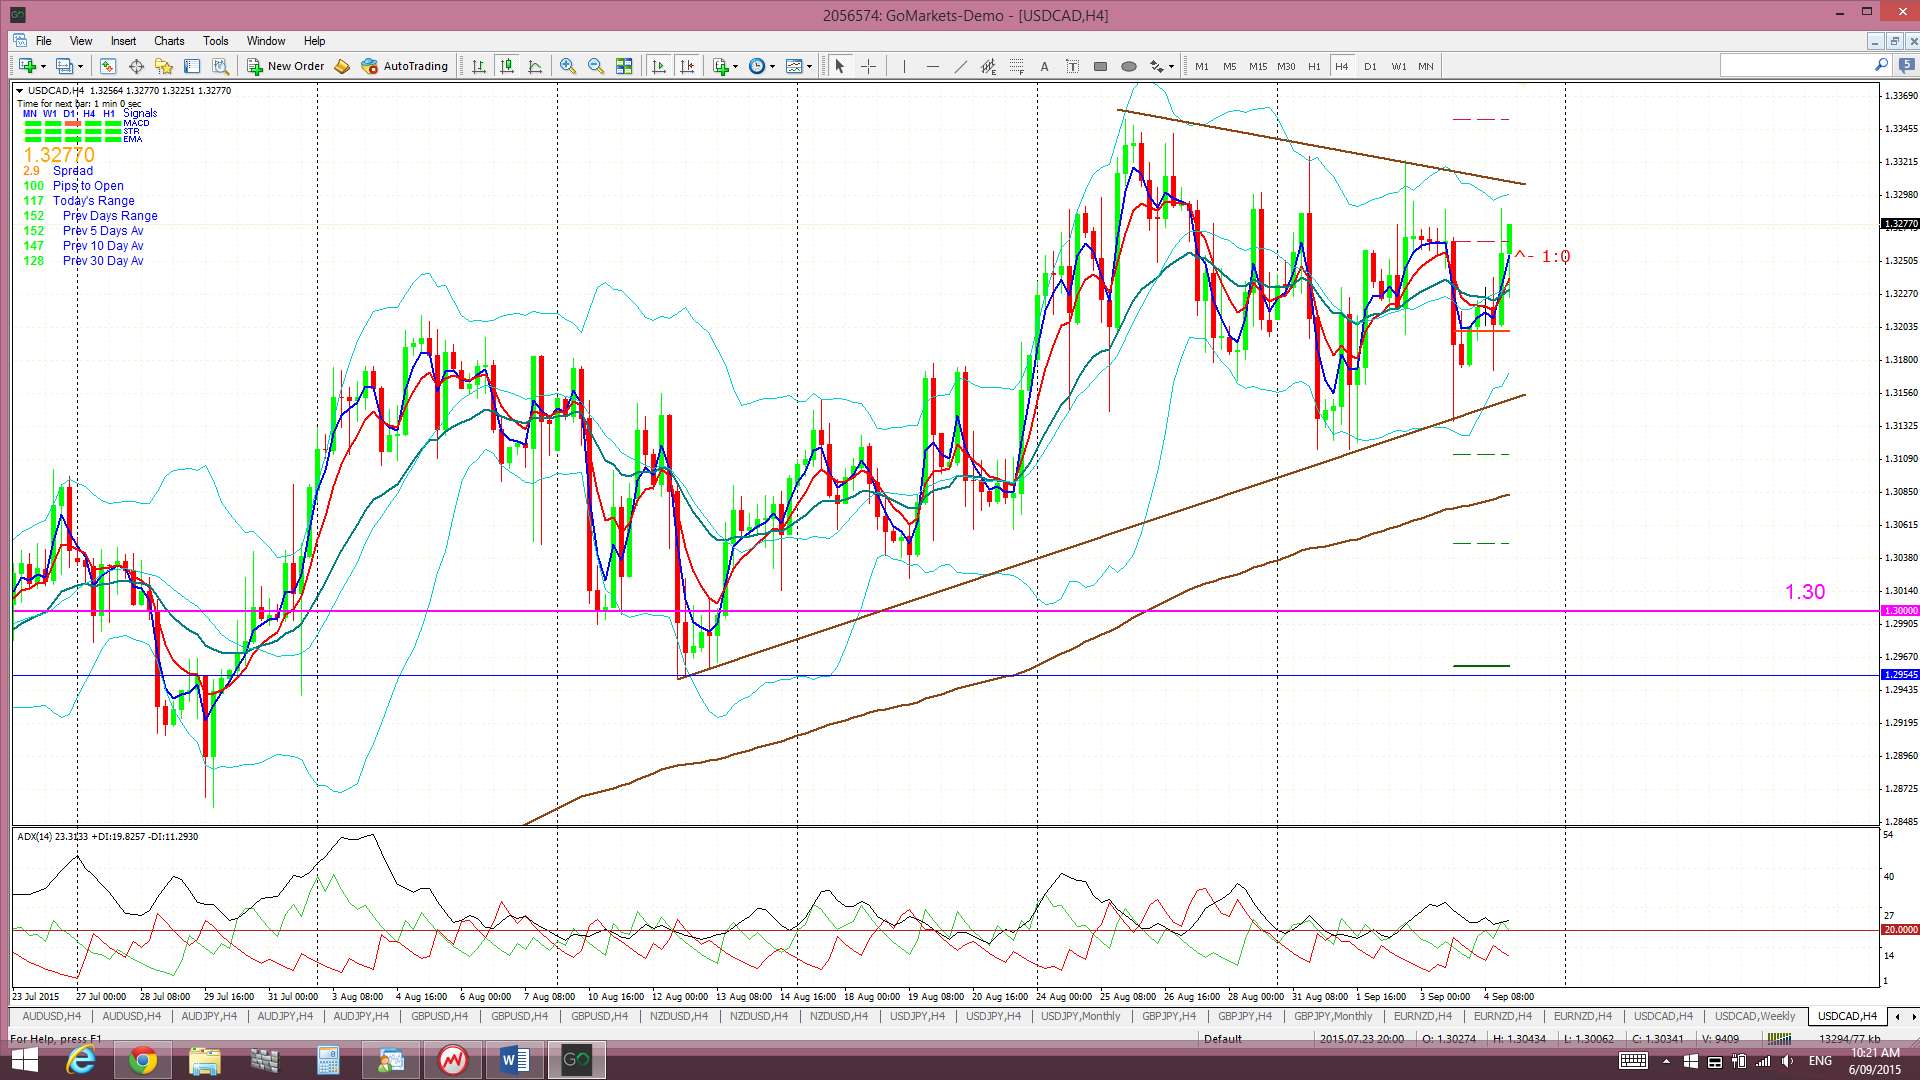
USD/CAD: USD/CAD price action has been rather choppy above the key 1.30 level for the last two weeks. The significance of this region can be best seen on the monthly chart. However I did manage to put a 4hr triangle on this on Friday and it remains trading within this pattern for now.
I’m still seeing a ‘Cup’ pattern on the monthly chart and this brings the potential of extended choppiness around this 1.30 region so as to create the ‘Handle’. However, any surprise BoC interest rate cut on Wednesday could see this pair continue to rally up from the broken 1.30 S/R level:
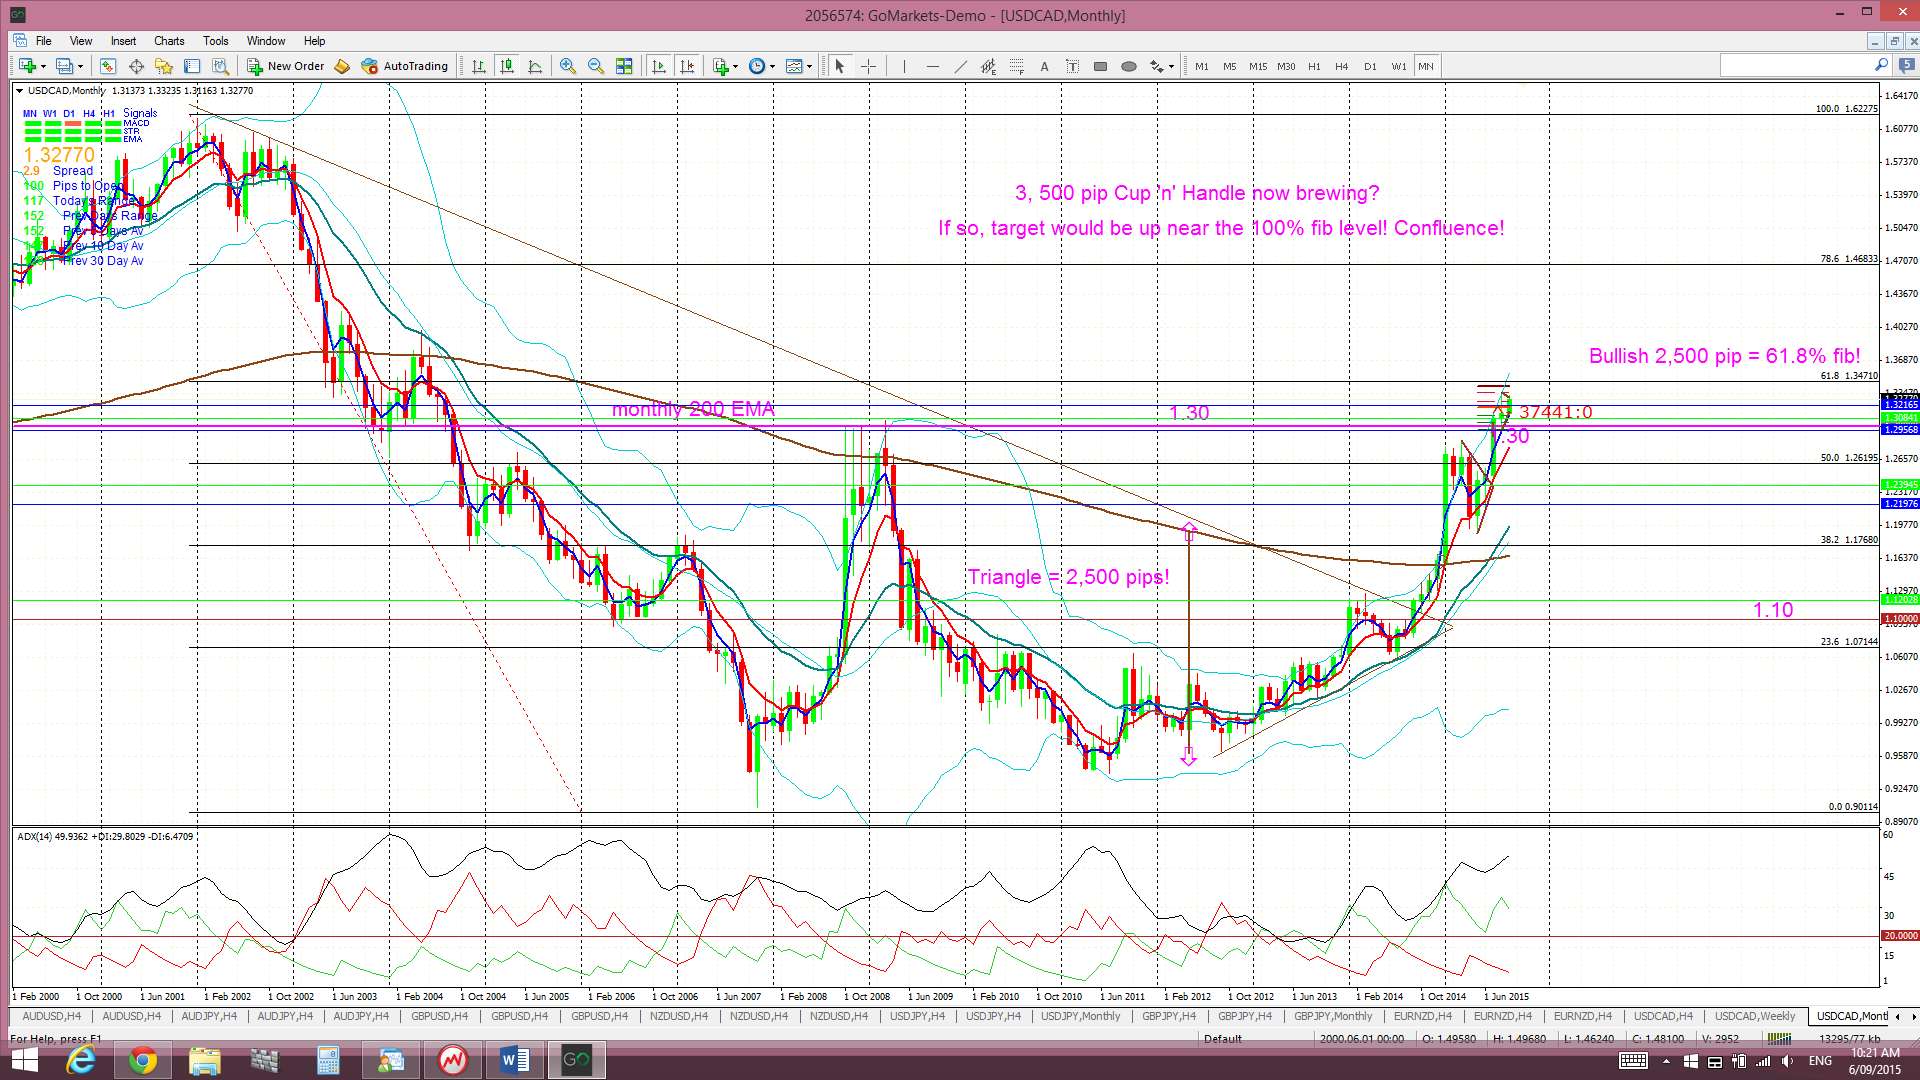
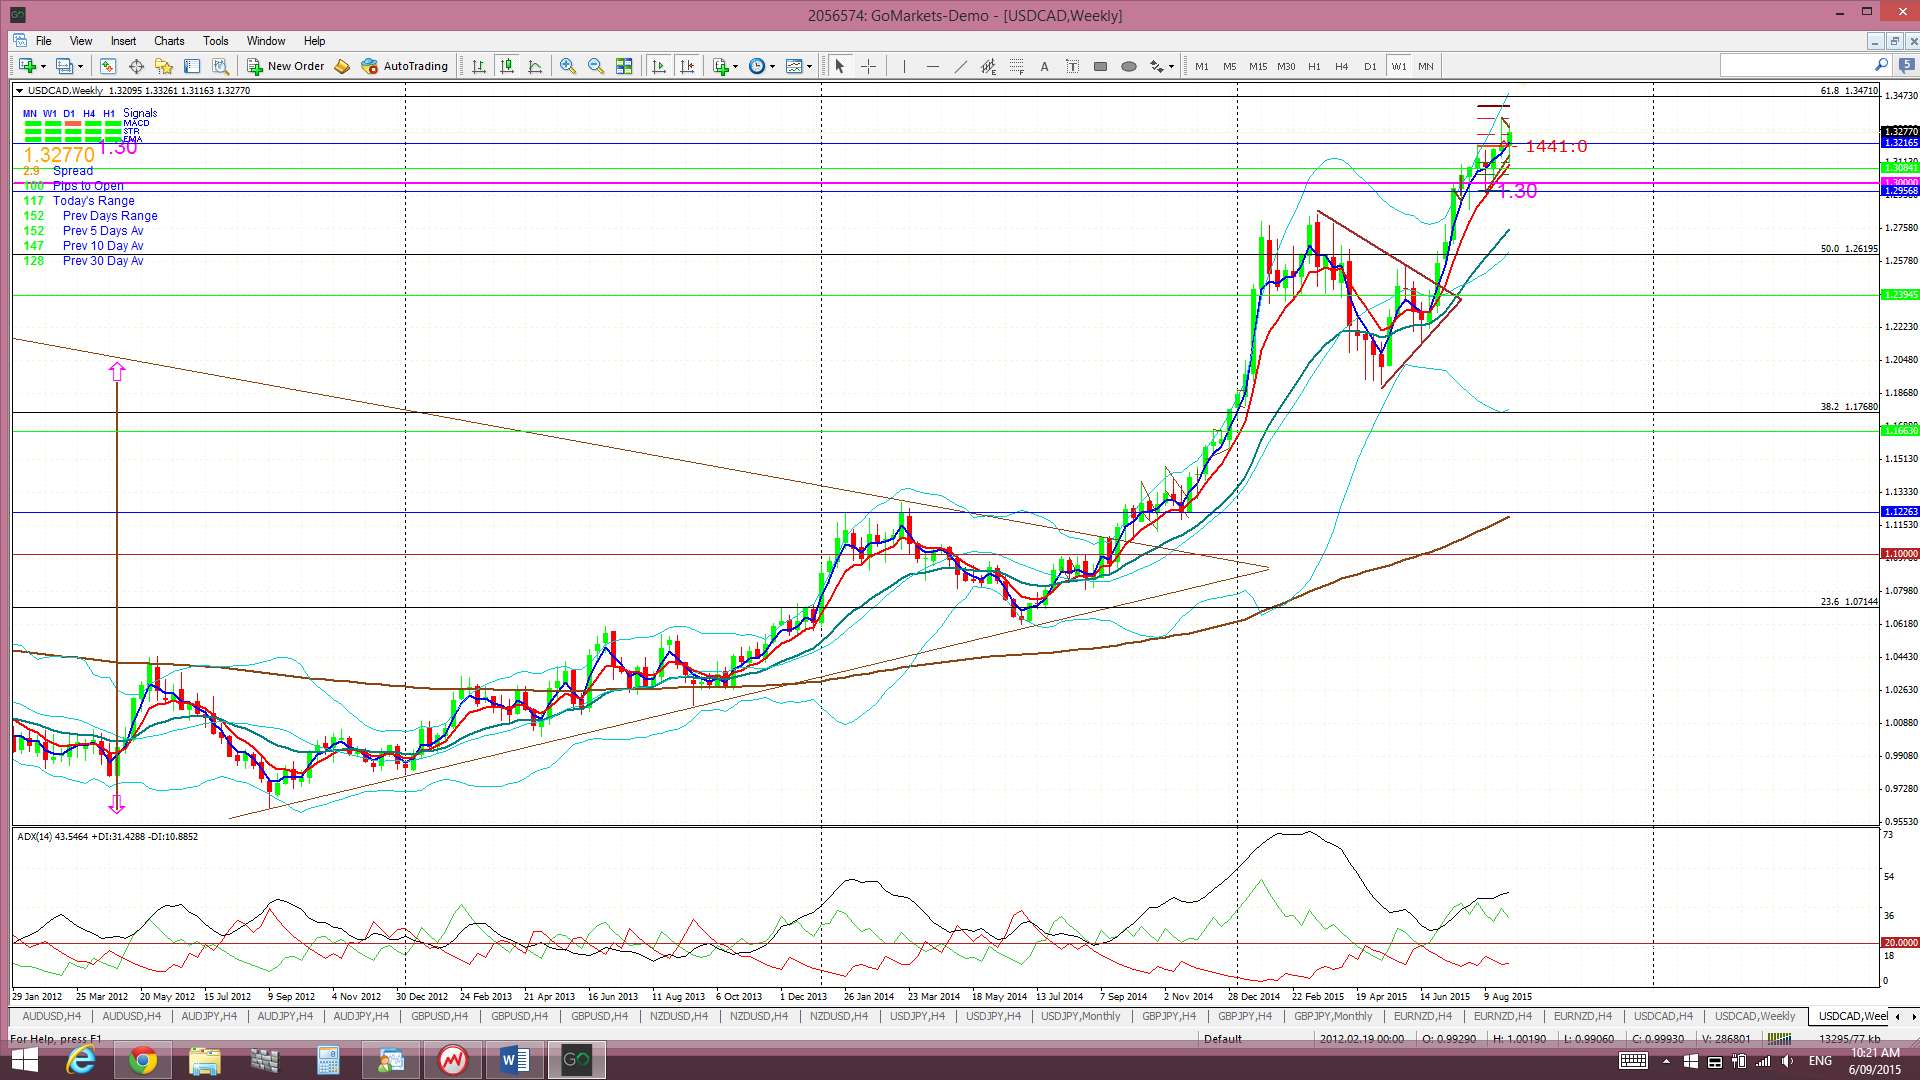
Triangle breakout target: The Loonie had previously broken up and out from a major monthly chart triangle pattern that was identified to deliver up to 2,500 pips and this move is almost complete! This 2,500 pip figure is evaluated from the height of the triangle. I have used the triangle height from the beginning of the bull trend line, as shown in the monthly chart below. The height of the triangle is around 2,500 pips and, thus, this would be the expected move from any breakout action. Extrapolating a bullish move from this triangle places price up at the 61.8% fib level. These fibs levels are popular targets in retracement moves and so this adds some confluence to this as a possible target. The bullish move has given over 2,300 pips so far.
Monthly Chart Cup ‘n’ Handle? The monthly chart now also shows a possible bullish Cup ‘n’ Handle pattern forming up under the 1.30 level. This is worth keeping an eye on as the pattern would be worth up to 3,500 pips if it was to evolve as this is the height of the ‘Cup’. The interesting point is that the target for this pattern would put price up at the highs reached back in 2002 and this is equal to a 100% Fib retracement of the 2002-2007 bear move.
Price is trading above the Cloud on the 4hr, daily, weekly and monthly charts.
The weekly candle closed as a small bullish candle.
The main risk event for this pair in the coming week is the BoC interest rate decision on Wednesday 9th.
- I’m watching for any new TC signal on this pair and the 1.30 level.

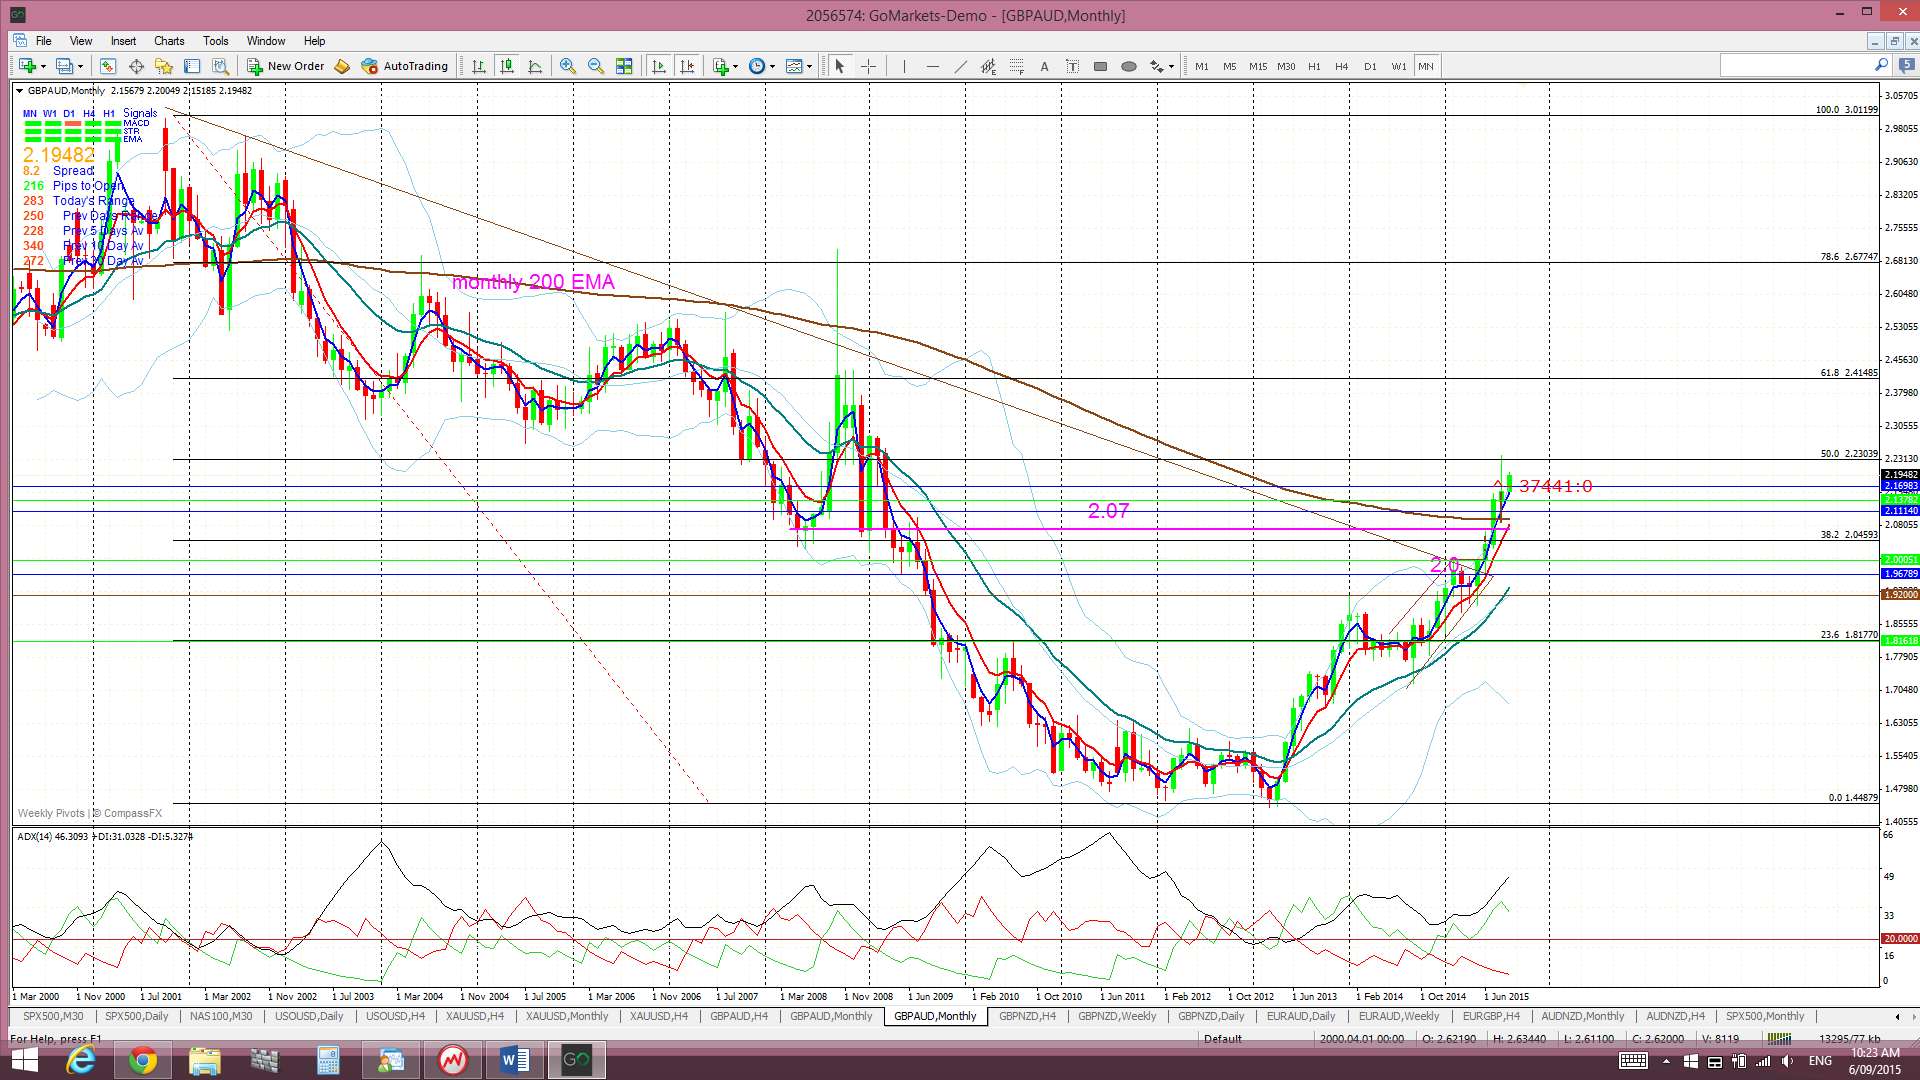
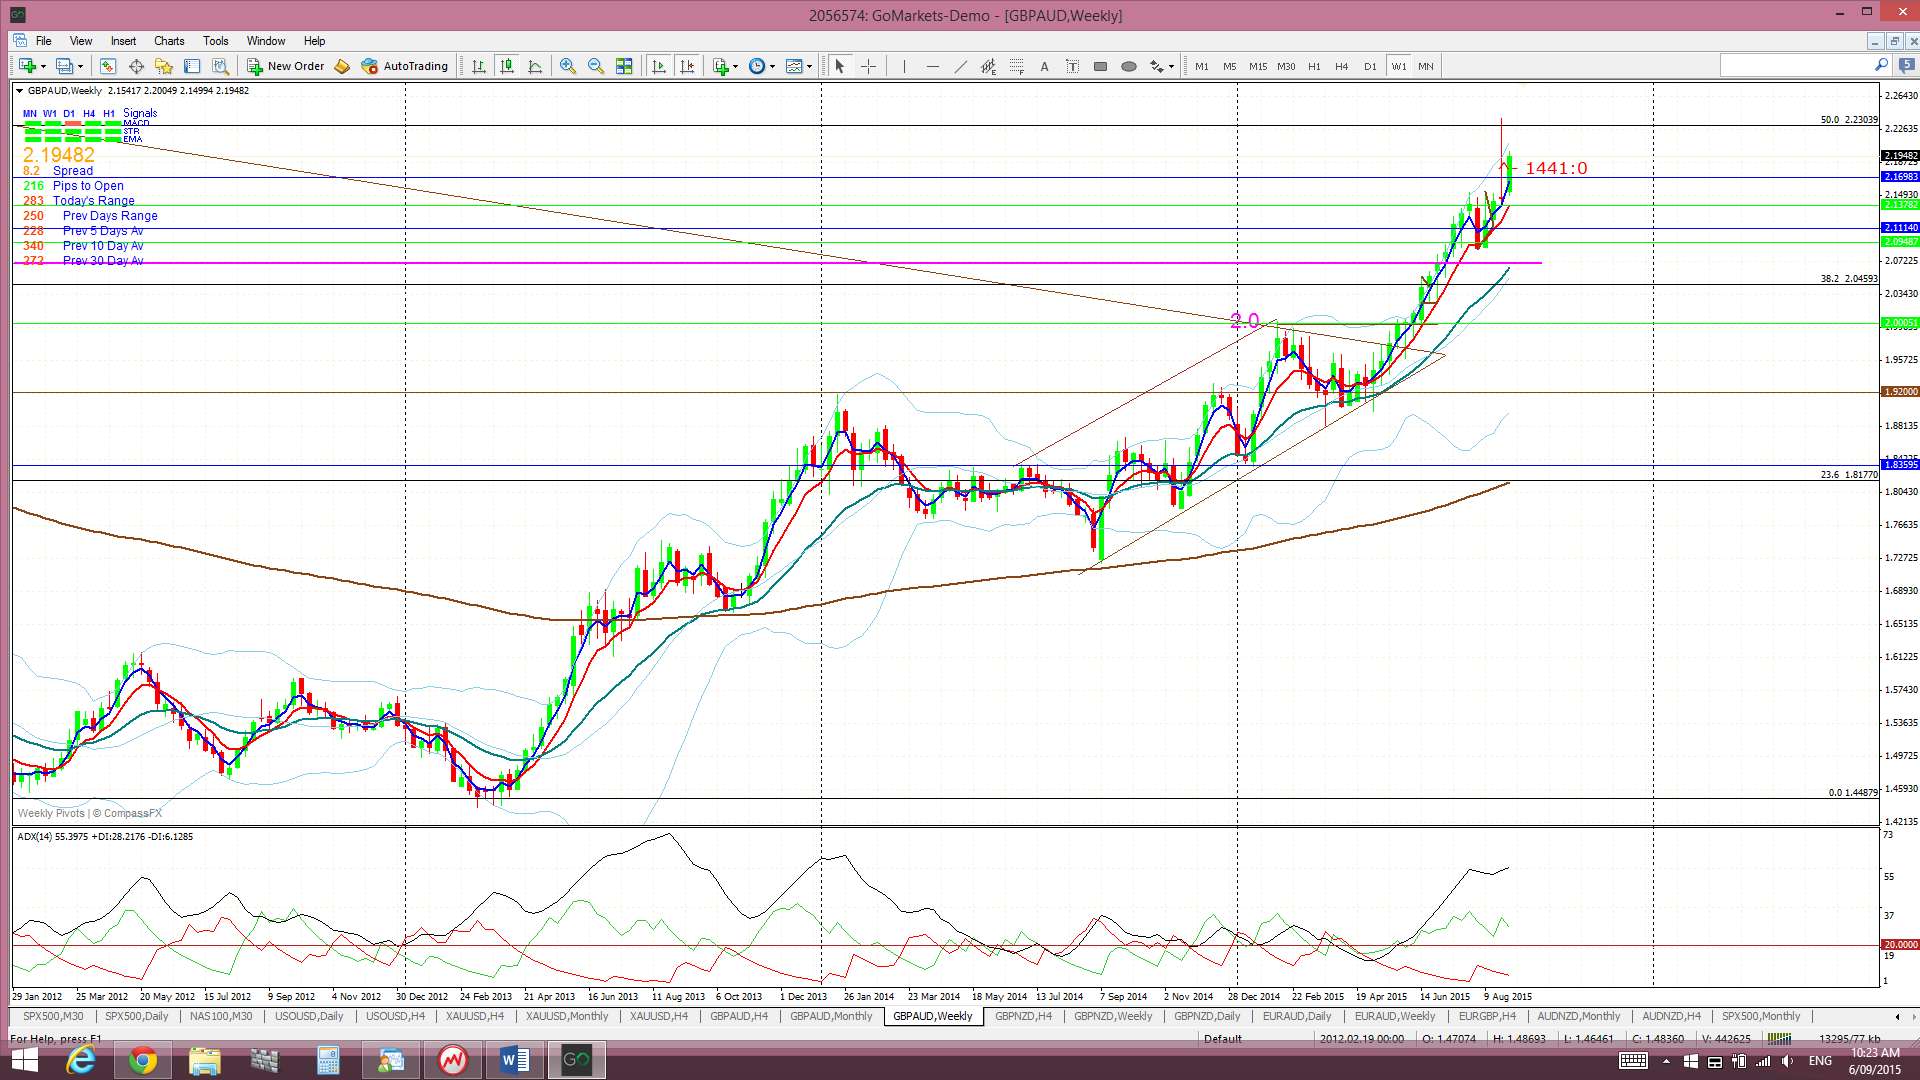
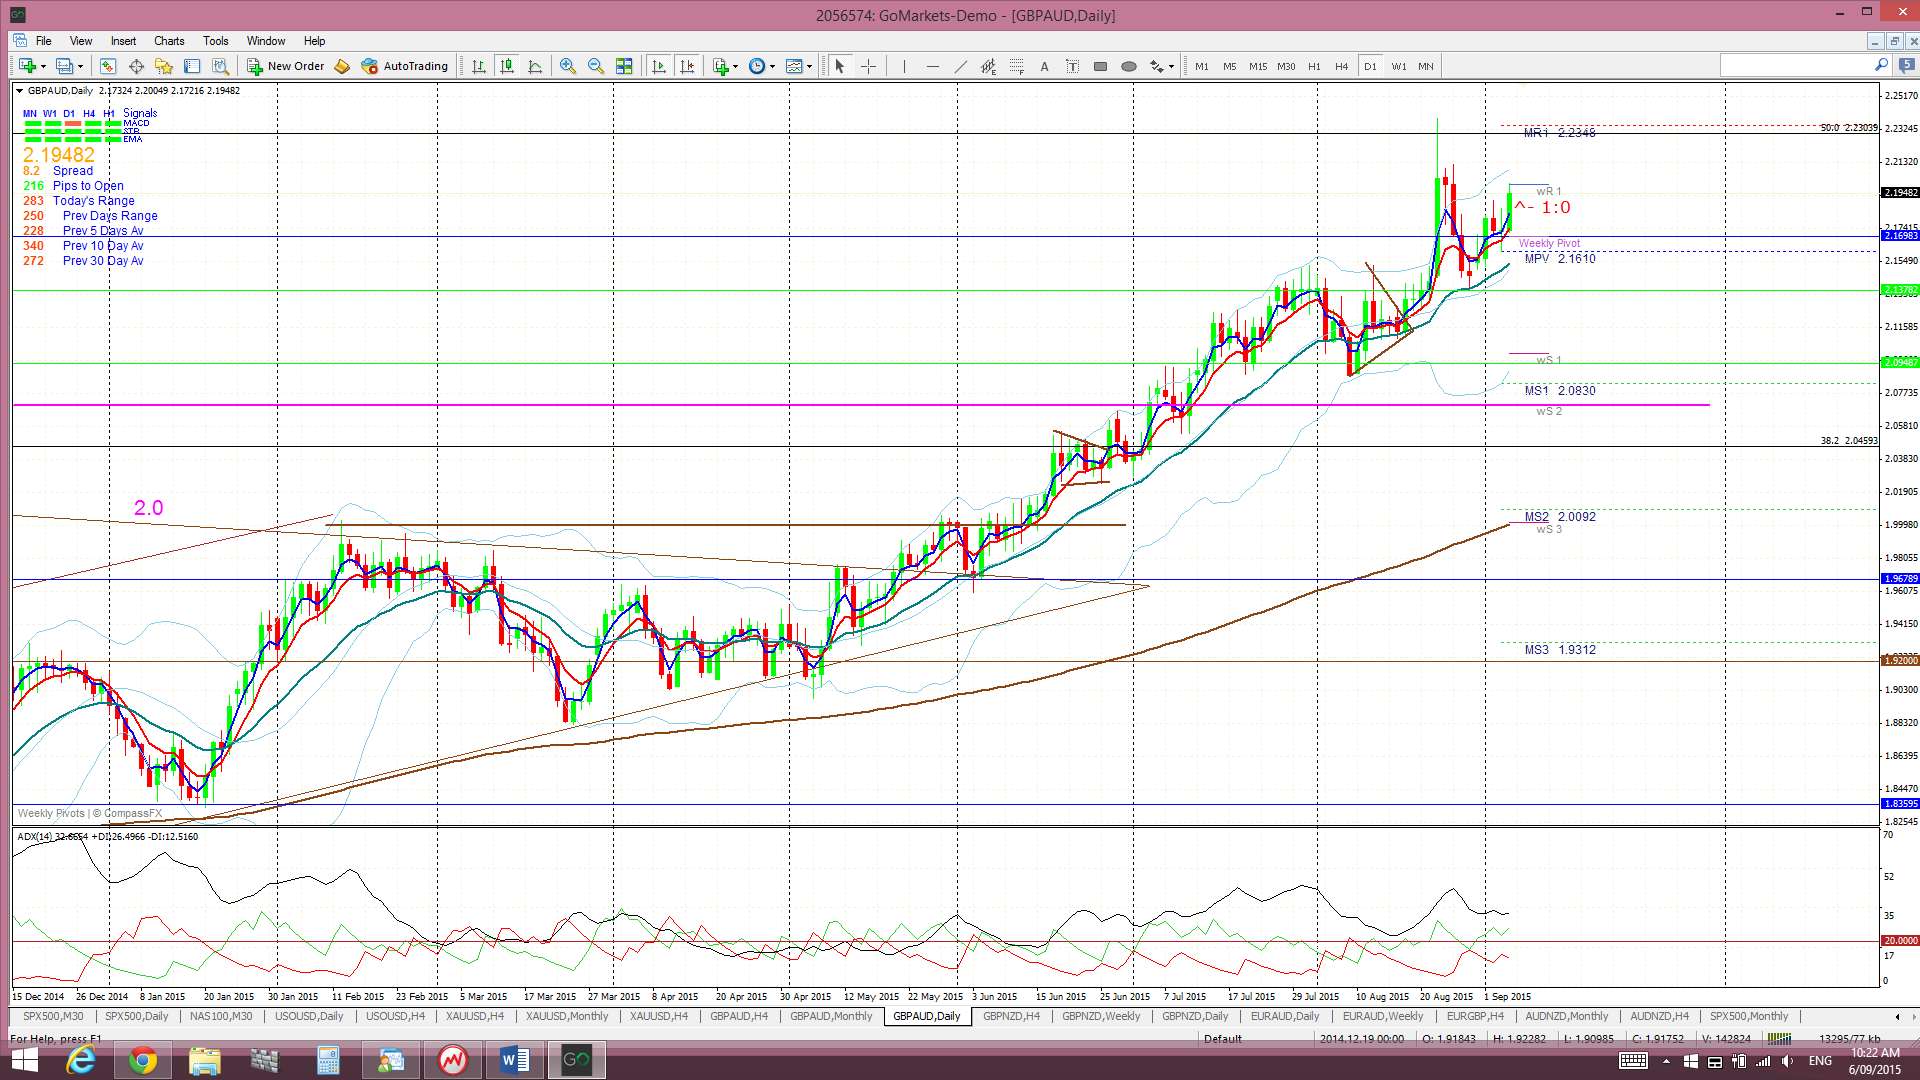
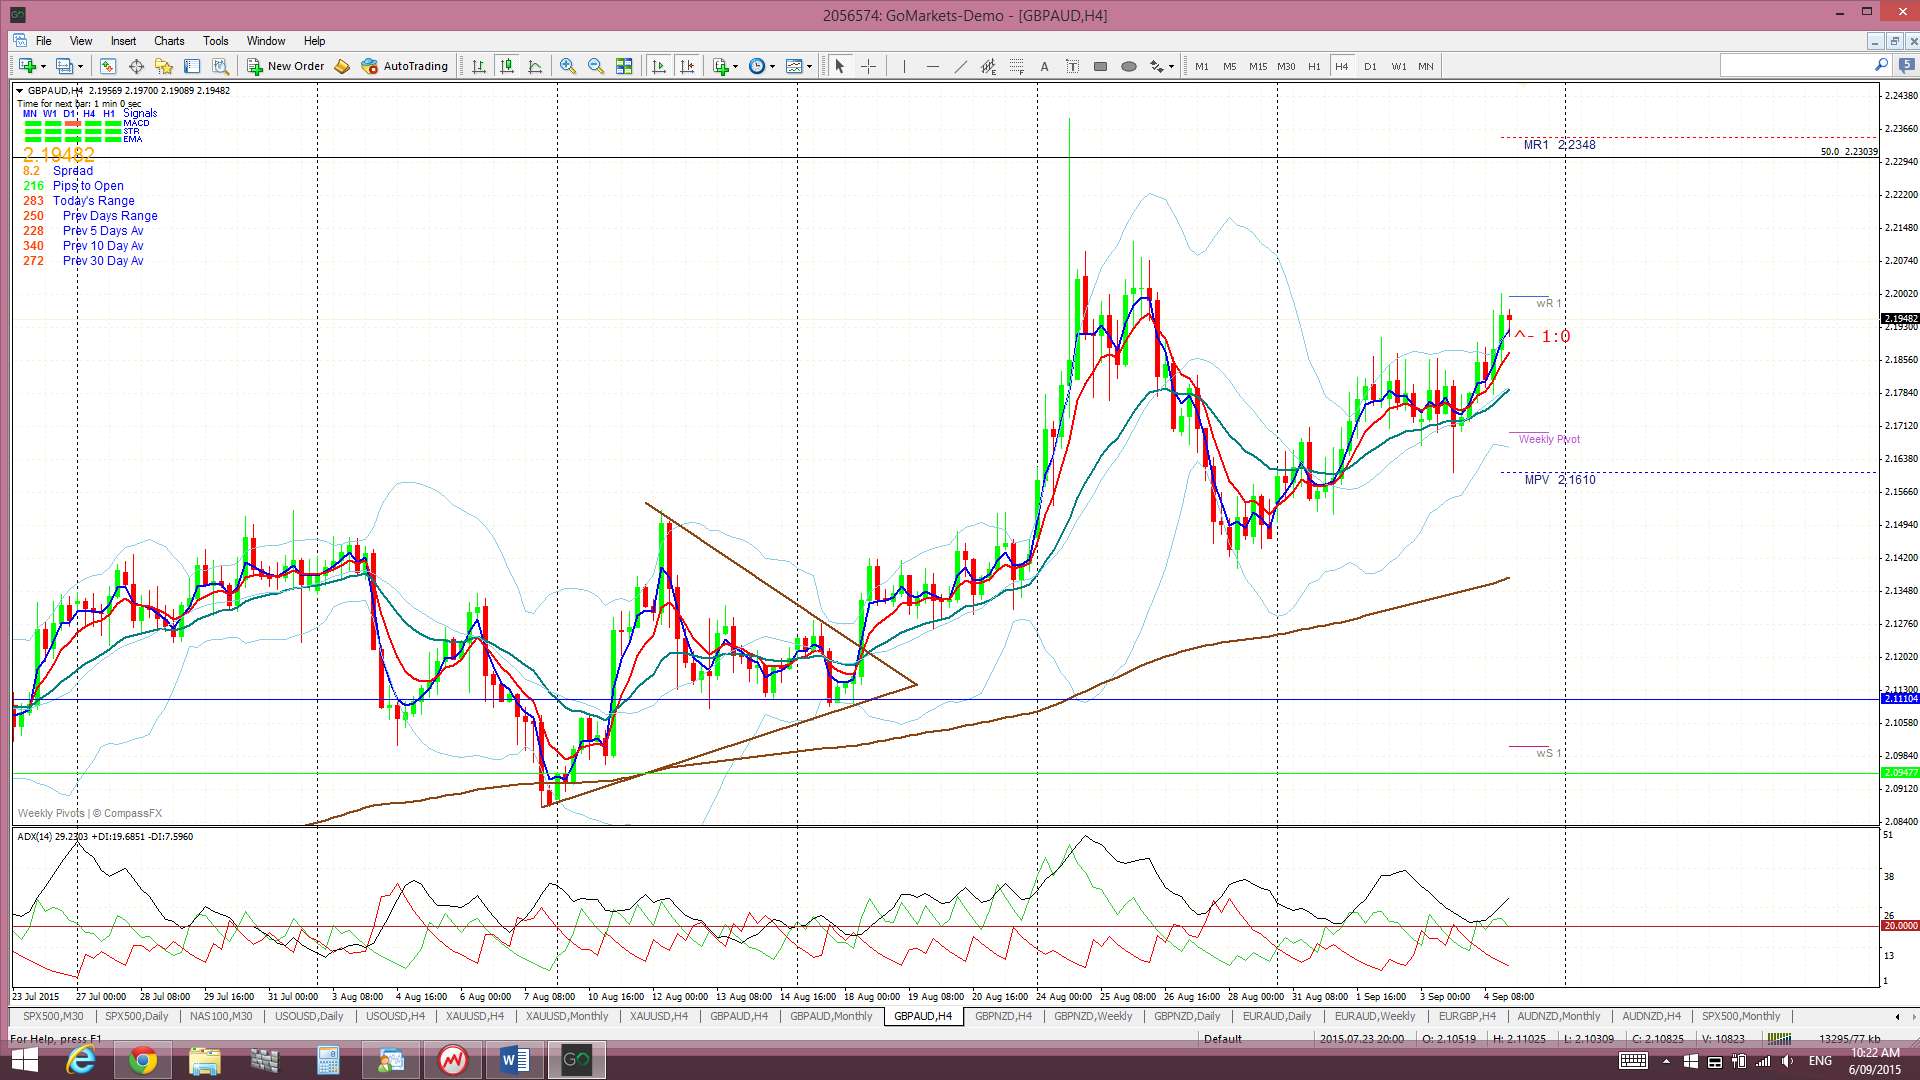
GBP/AUD: This pair remains choppy above the 2.07 level and, although it continues to move higher, I’m still watching for any test of this key S/R region.
There is the look of a ‘Cup’ pattern on the monthly chart and so we could see some choppiness around this 2.07 region as a potential ‘Handle’ forms up however this choppiness could still deliver decent moves though within these swings and we saw this again during last week.
Any continued bullish momentum may bring an alternative monthly chart pattern into focus though. A continued push up to the 2.4 region near the 61.8% fib would help to form up a possible bullish ‘Inverse H&S’ pattern. I would then be looking for any pullback back down to the ‘Shoulder’ region of 2.07:
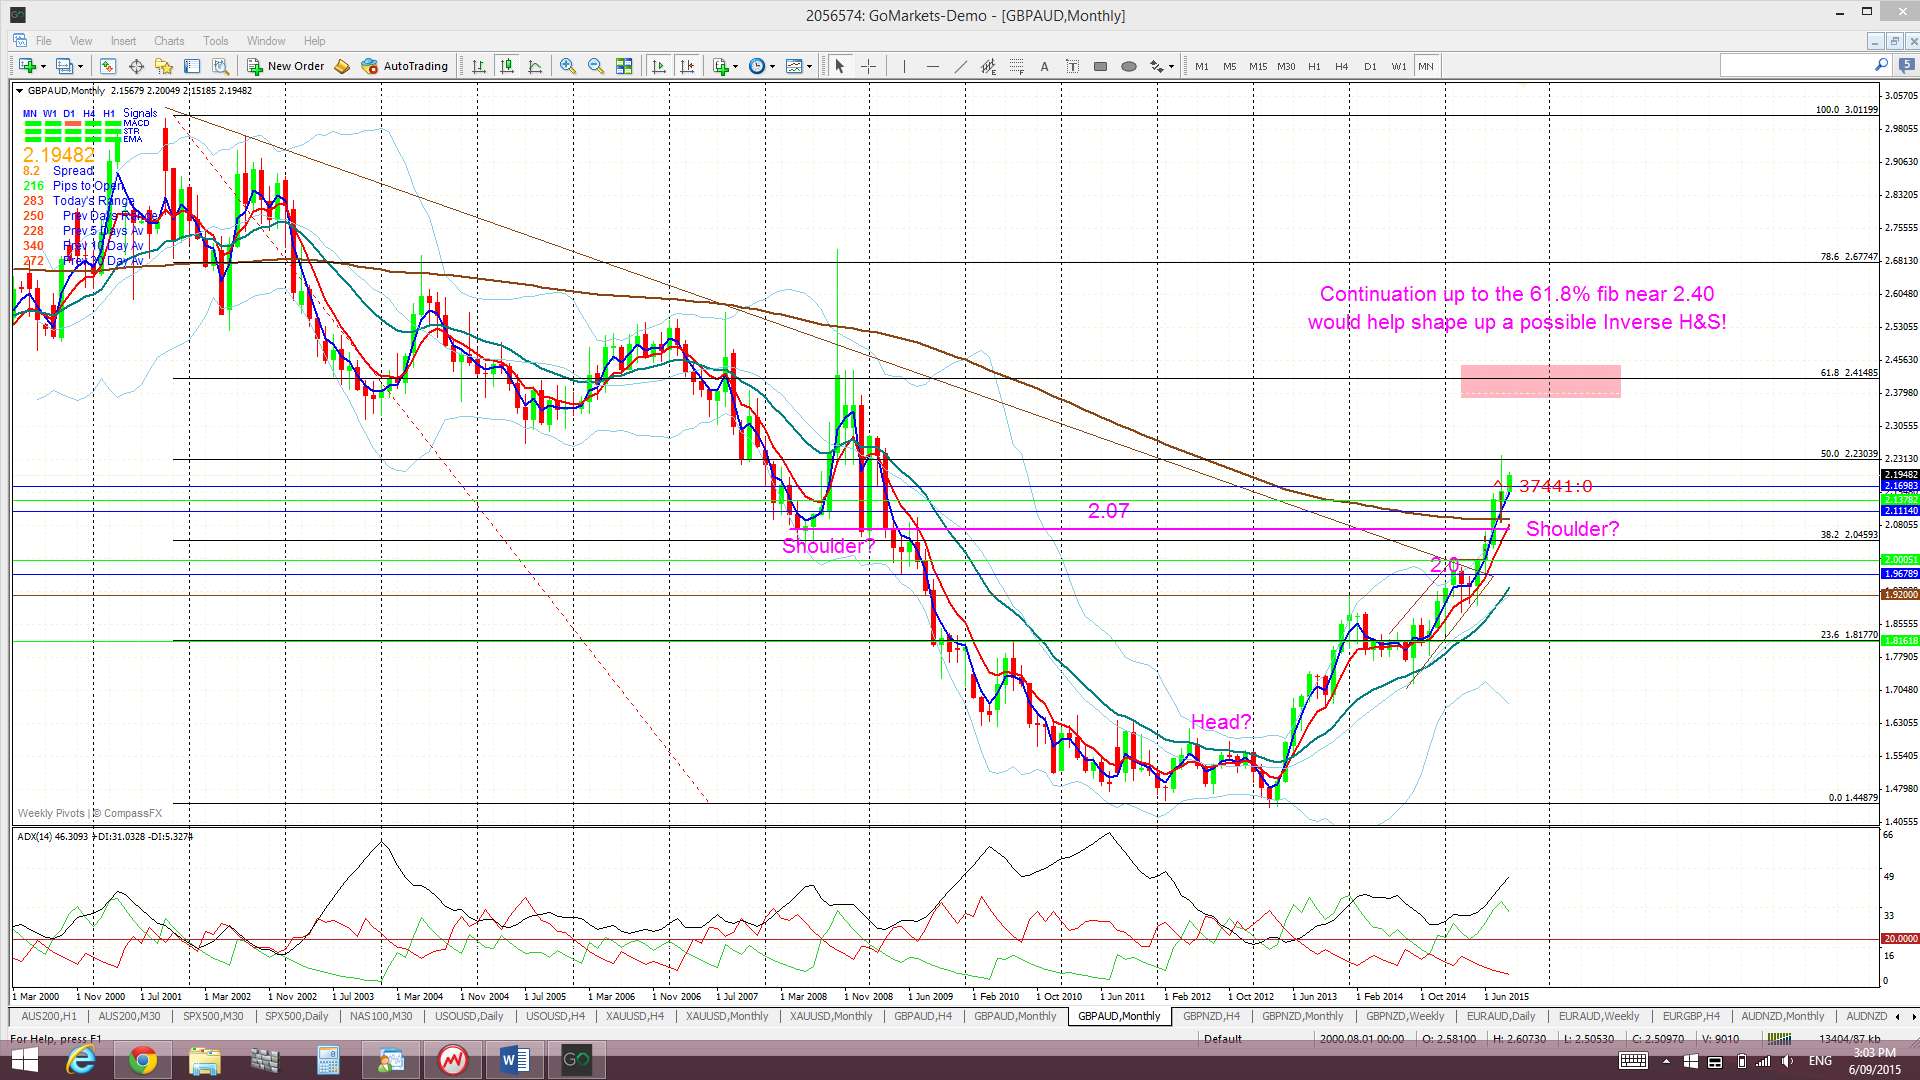
Price is trading above the Ichimoku Cloud on the 4hr, daily, weekly and monthly charts.
The weekly candle closed as a bullish candle.
- I’m watching for any new TC signal on this pair and the 2.07 level.
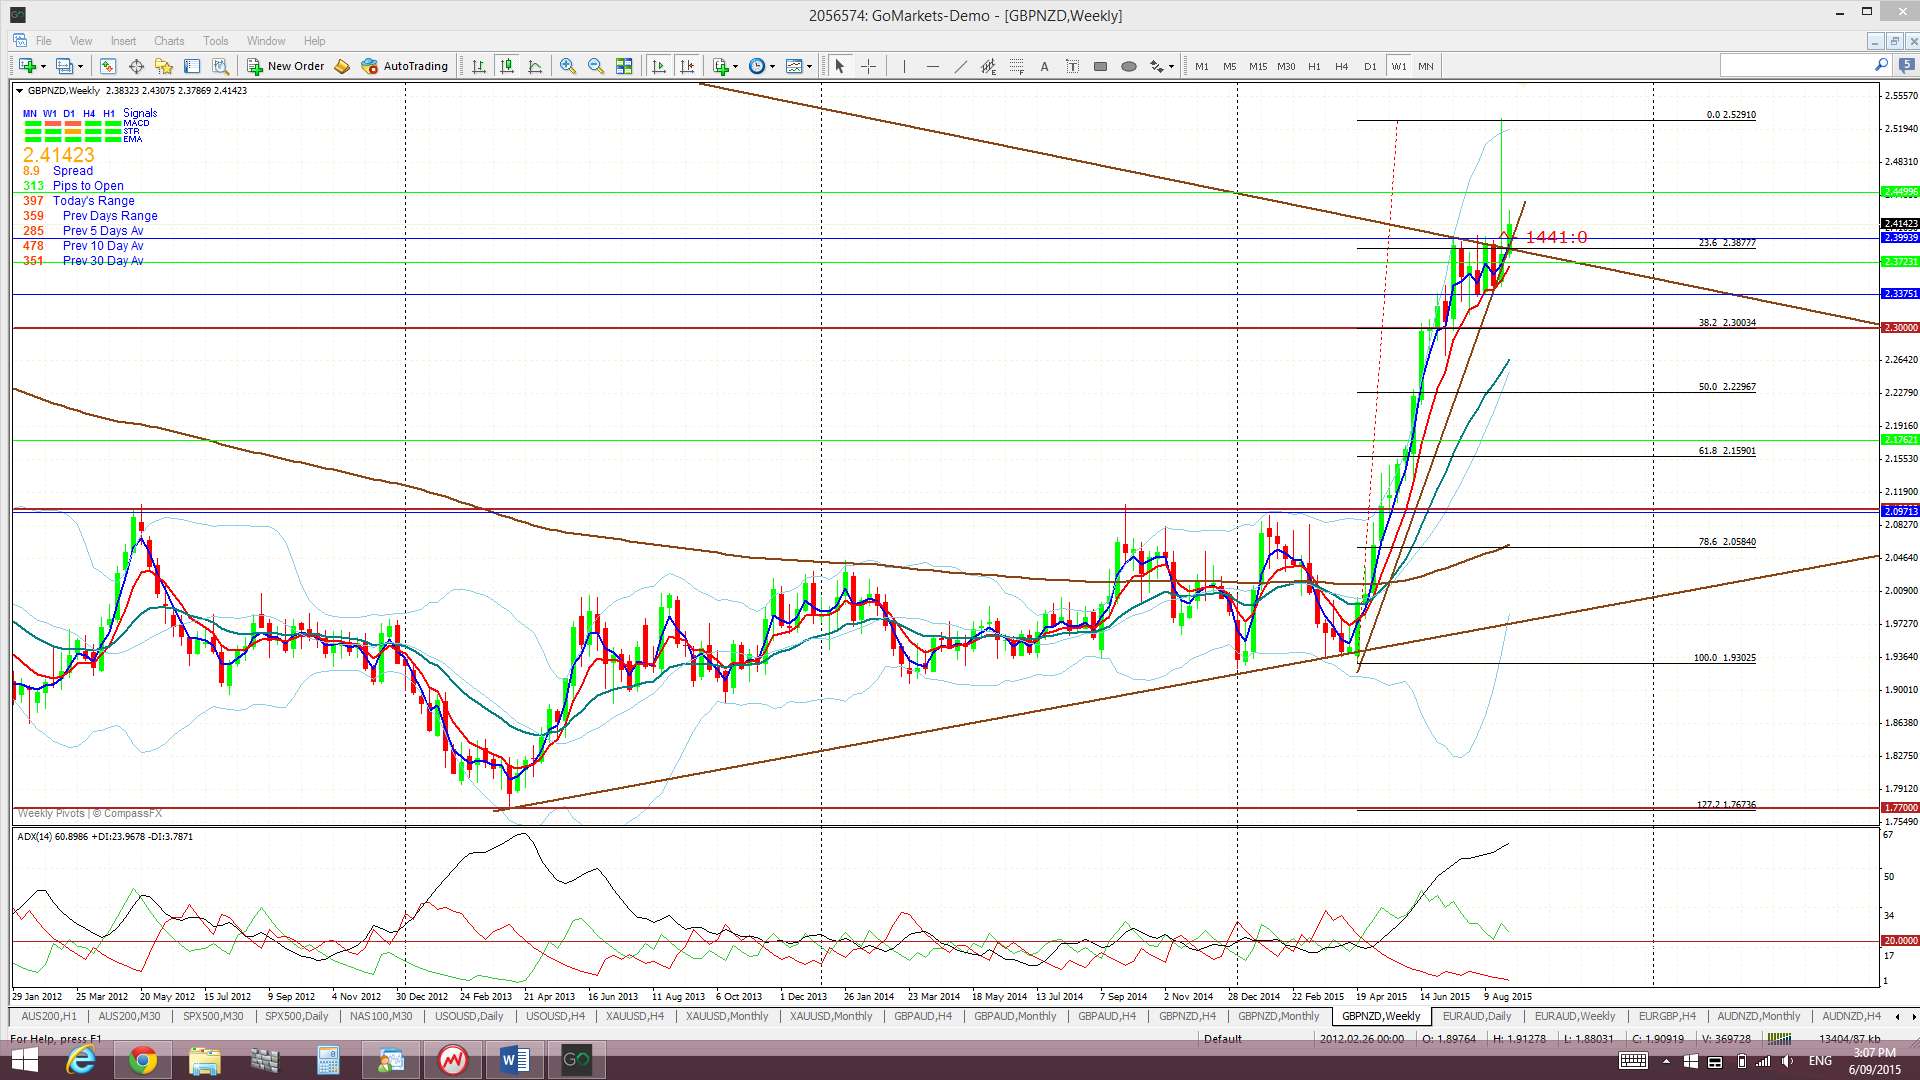
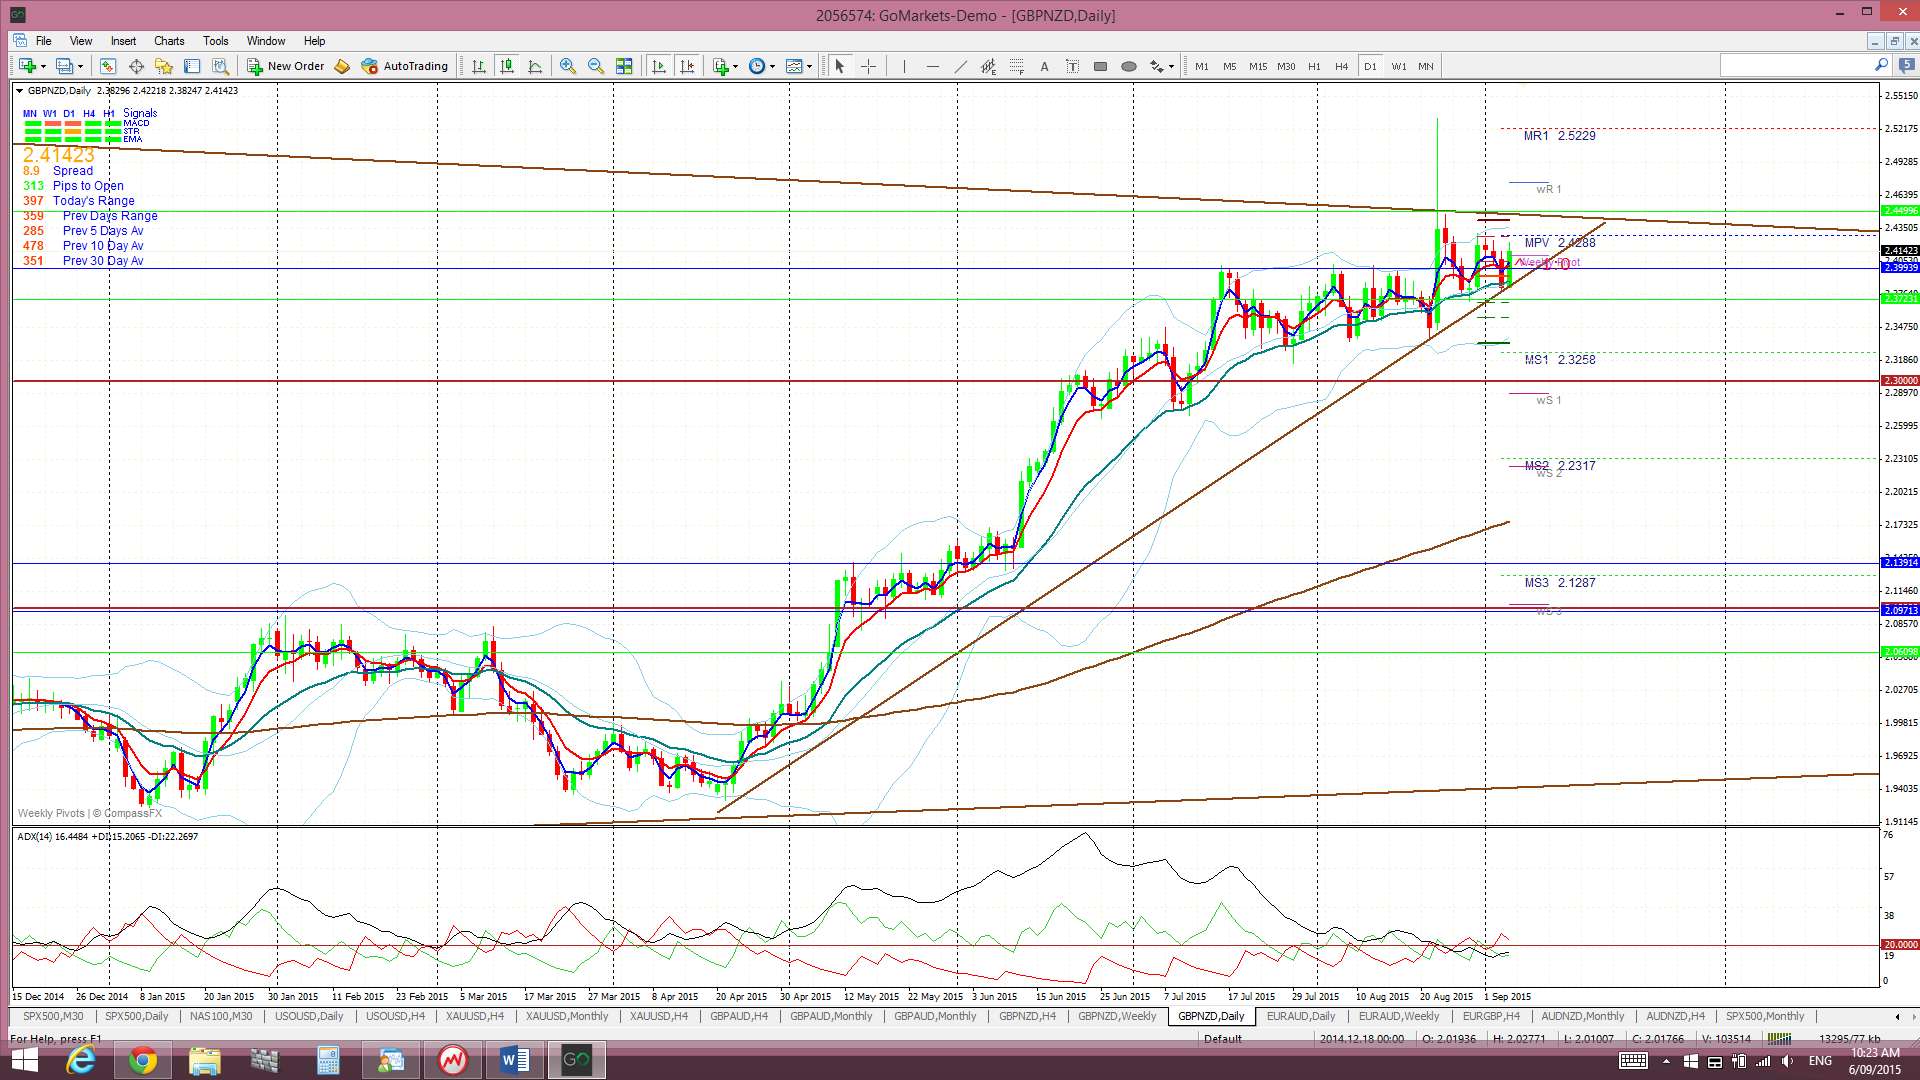
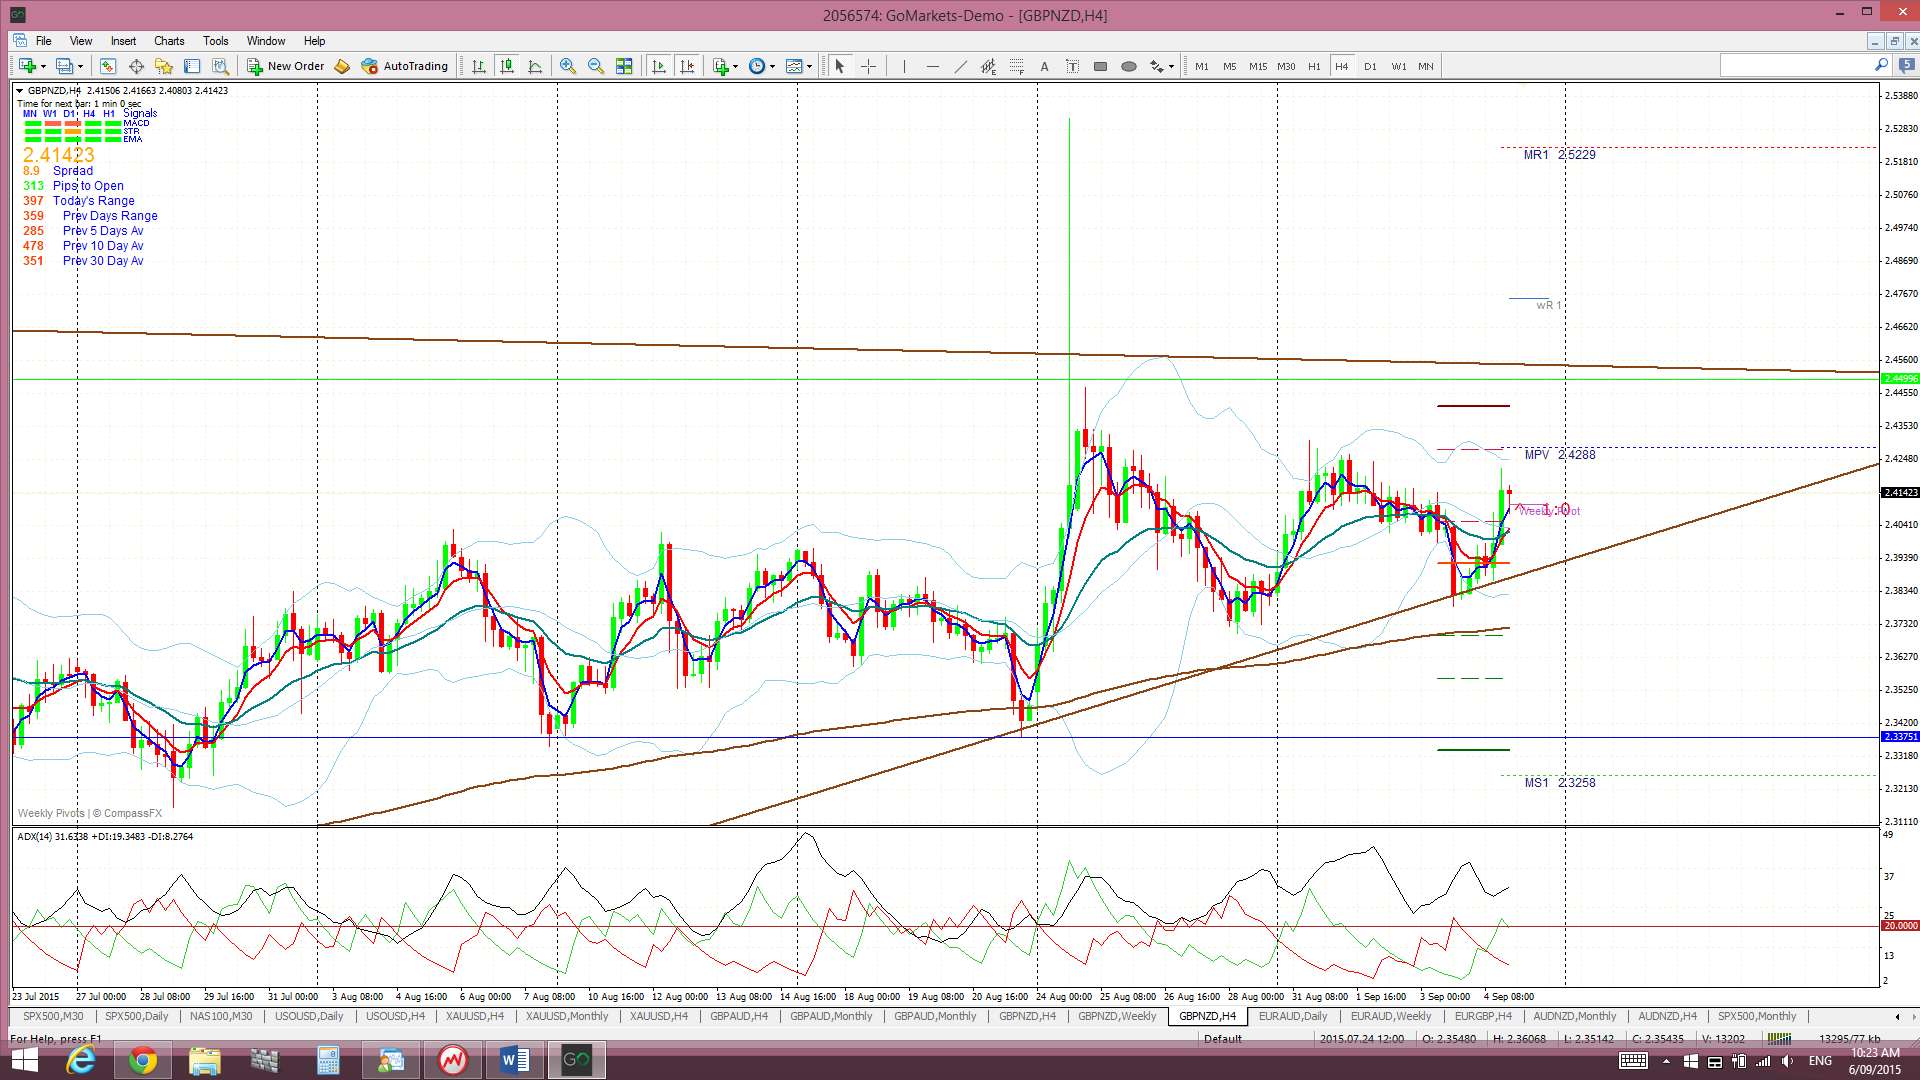
GBP/NZD: The GBP/NZD remains choppy under the monthly chart’s bear trend line but is becoming increasingly squeezed as a support trend line rises to meet this upper resistance.
It is worth noting that any 61.8% fib pullback here would bring price back down to the previous breakout and S/R region of 2.10.
The GBP/NZD is trading in the Cloud on the 4hr chart but above the Cloud on the daily, weekly and monthly charts.
The weekly candle closed as a small bullish candle.
- I’m watching for any new TC signal and the monthly chart’s bear trend line.

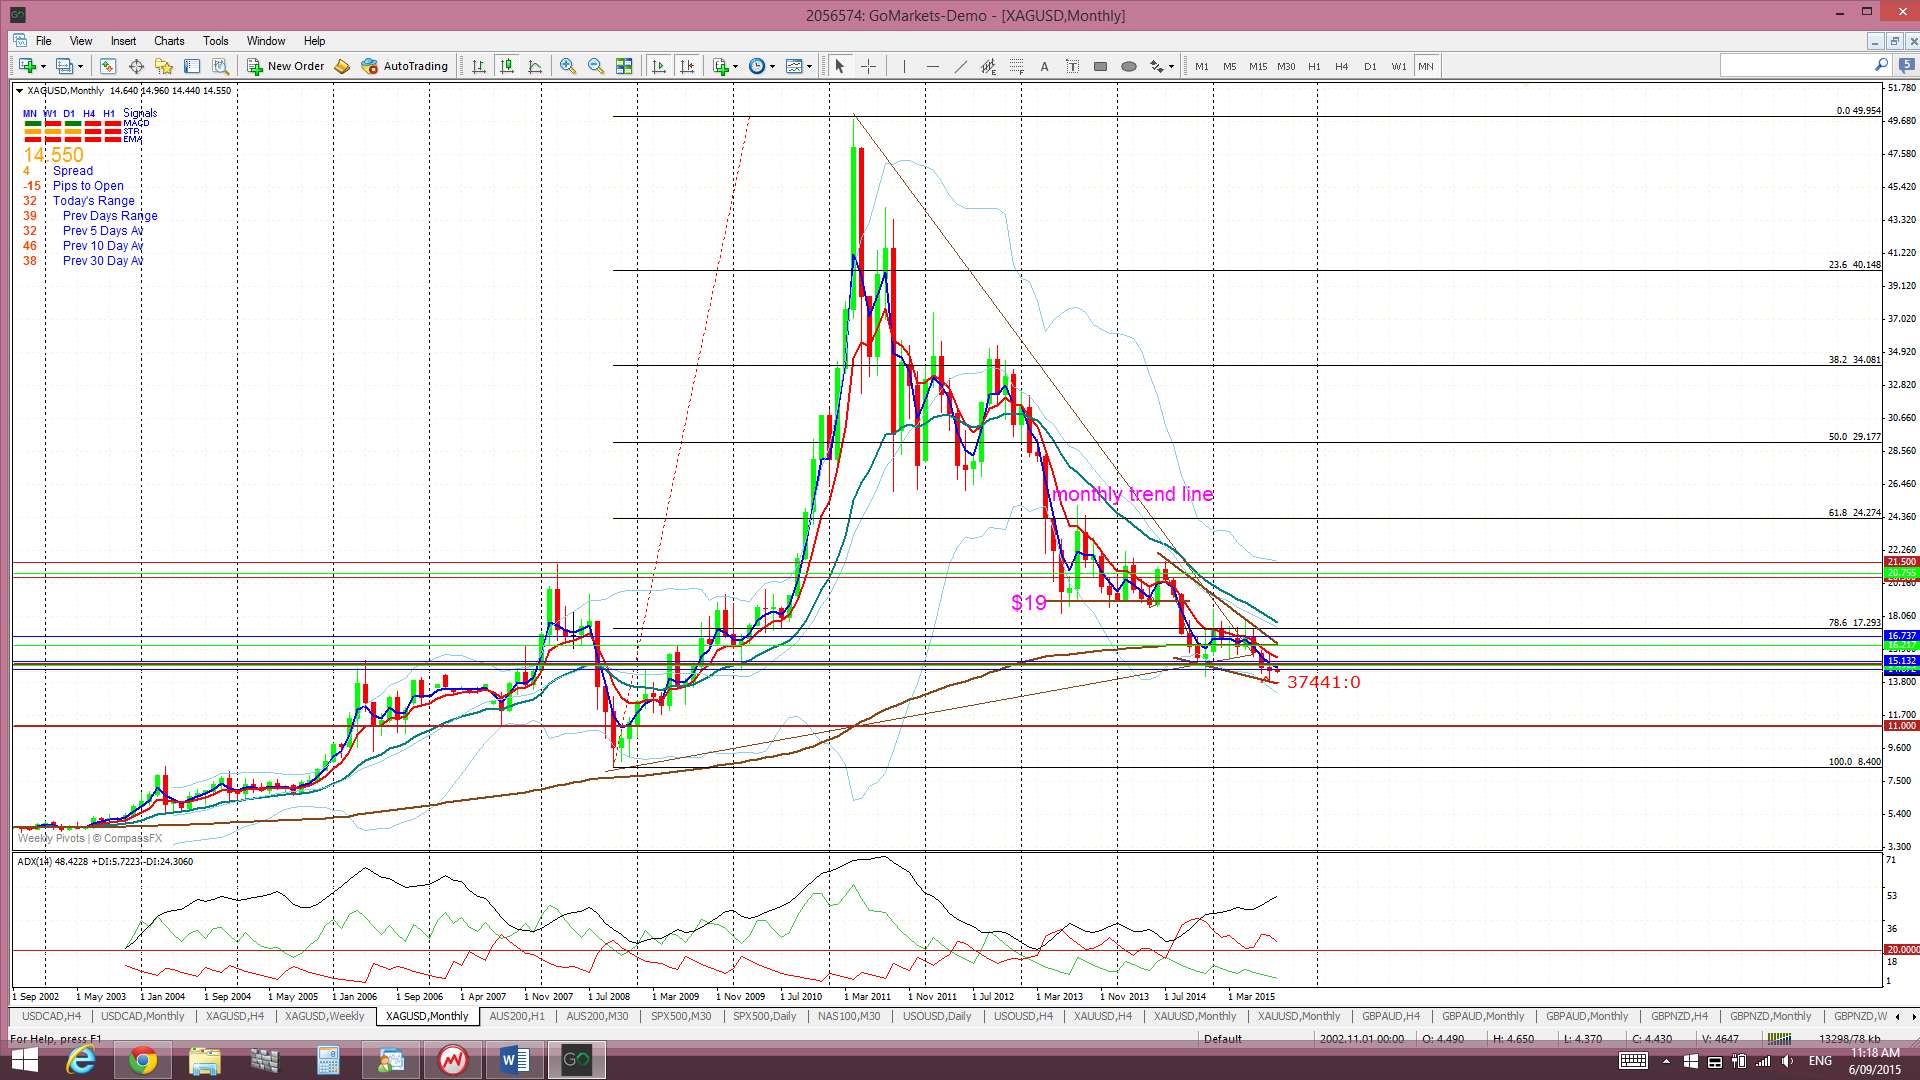
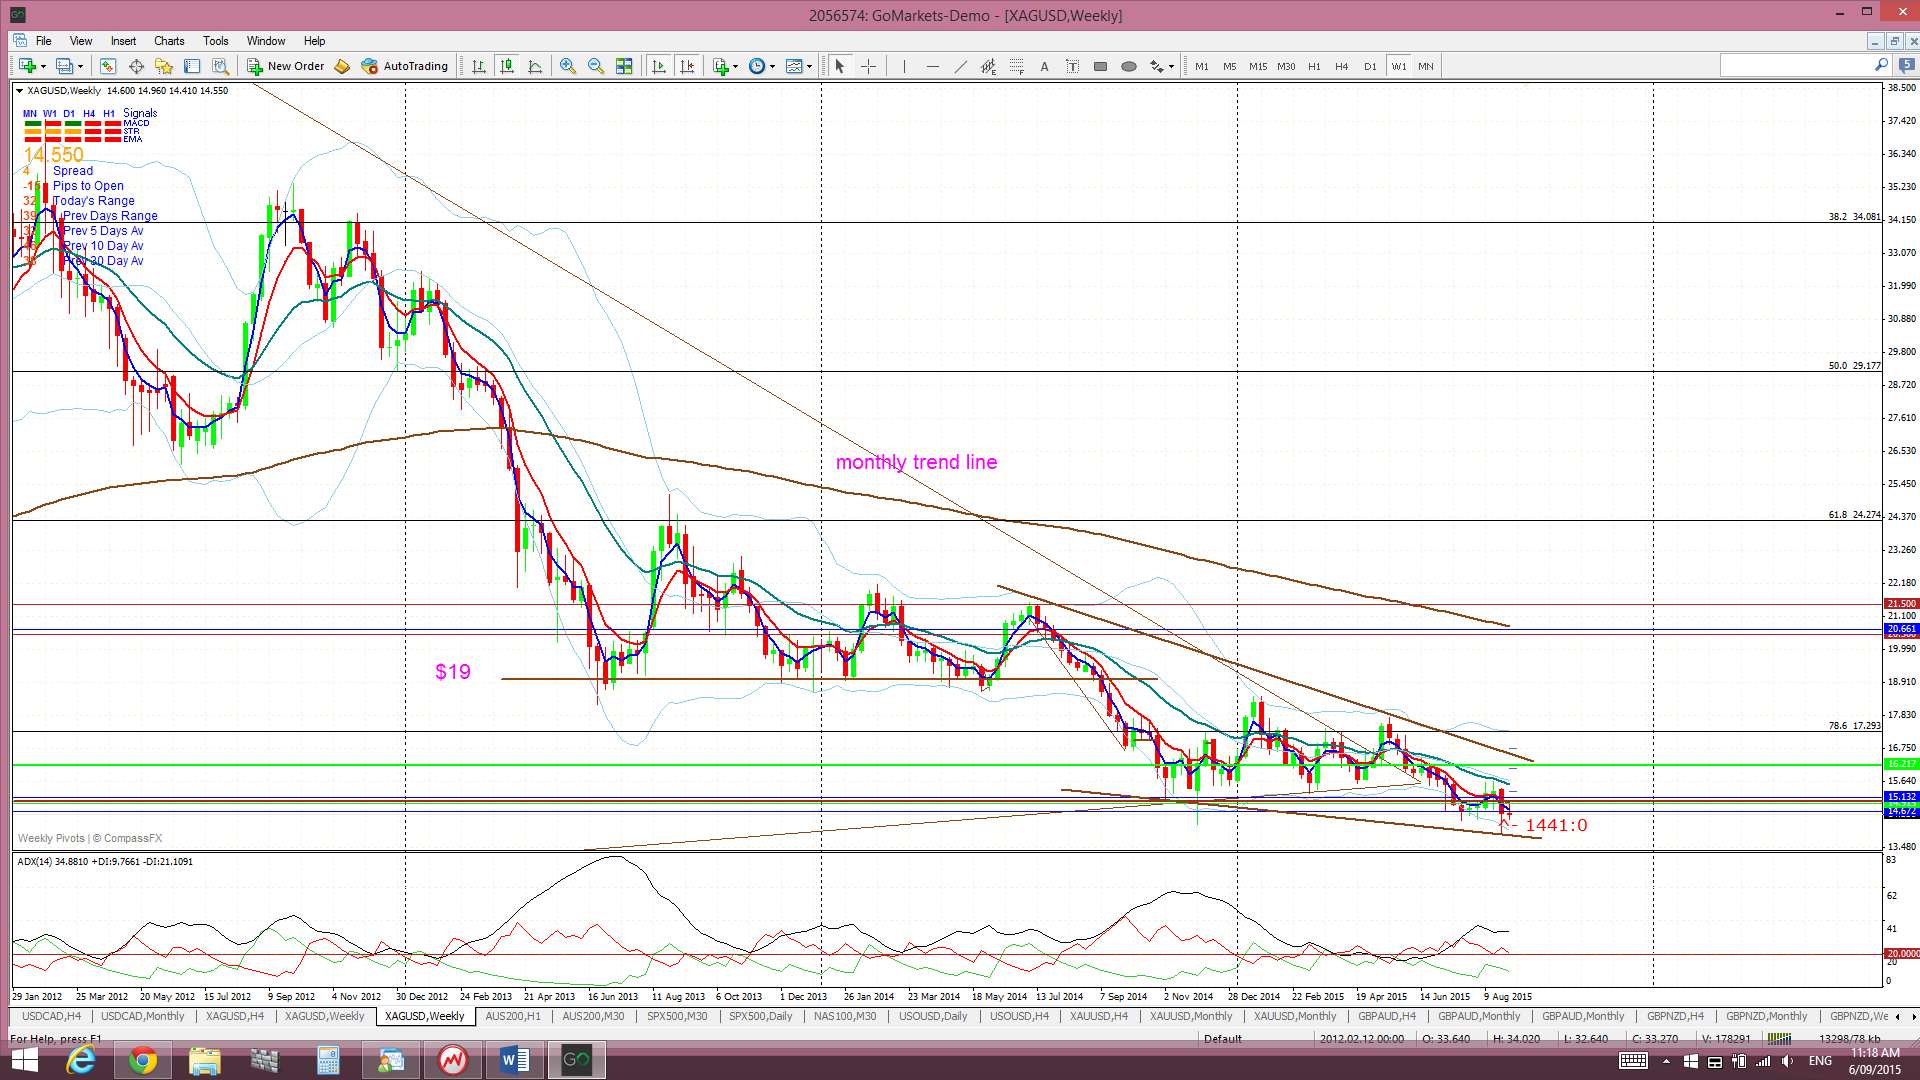
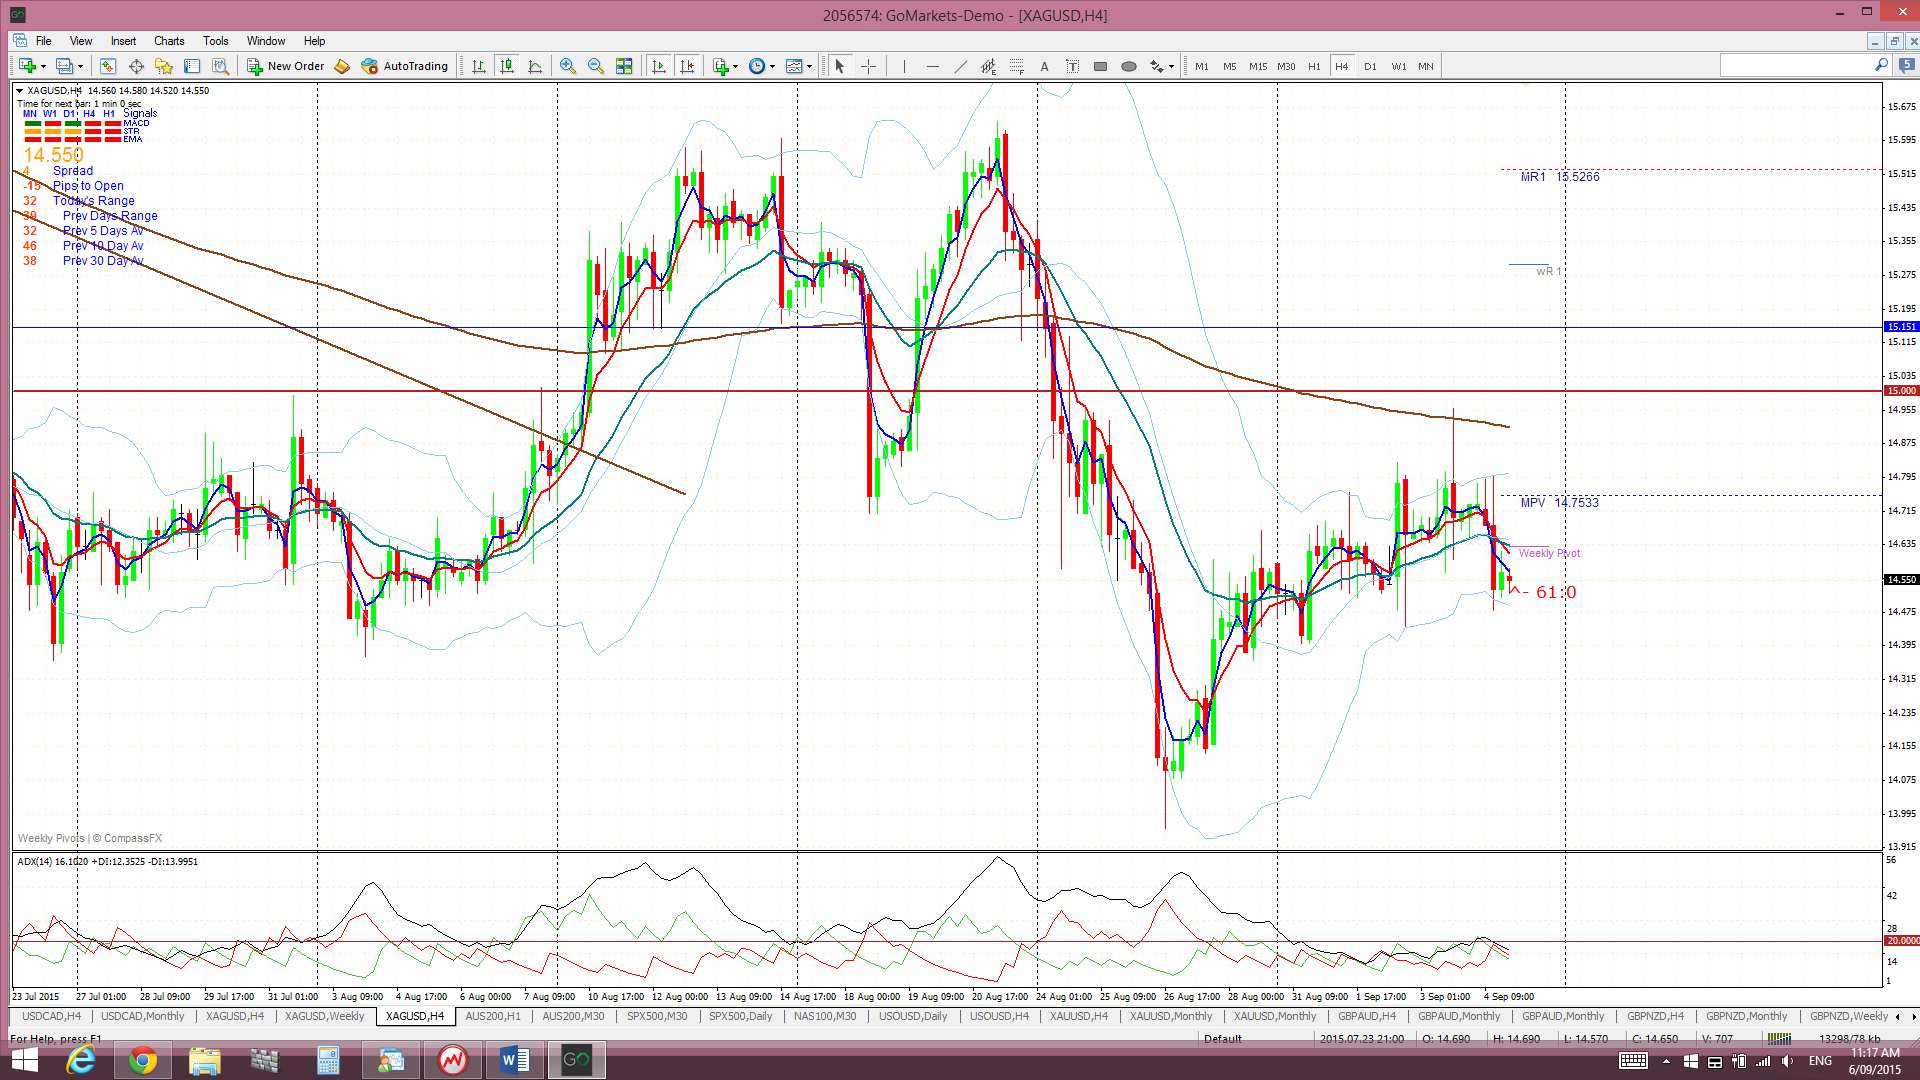
Silver: Silver chopped a bit higher last week after finding support from the $14 level the week before and in spite of a strengthening US$ but couldn’t manage to close back above the $15 level.
Silver is trading in the Cloud on the 4hr chart but below the Cloud on the daily, weekly and monthly charts.
The weekly candle closed as a small bearish coloured ‘Spinning Top’ candle reflecting some indecision here.
Any sustained hold below $15 would be bearish and would bring the $11 and $9 levels in focus. $11 is previous S/R and the $9 area is the 100% fib level. I’m seeing a possible bullish-reversal descending wedge starting to form up on the weekly chart though and so will keep an eye on these trend lines.
- I’m watching for any new TC signal and the $15 level.

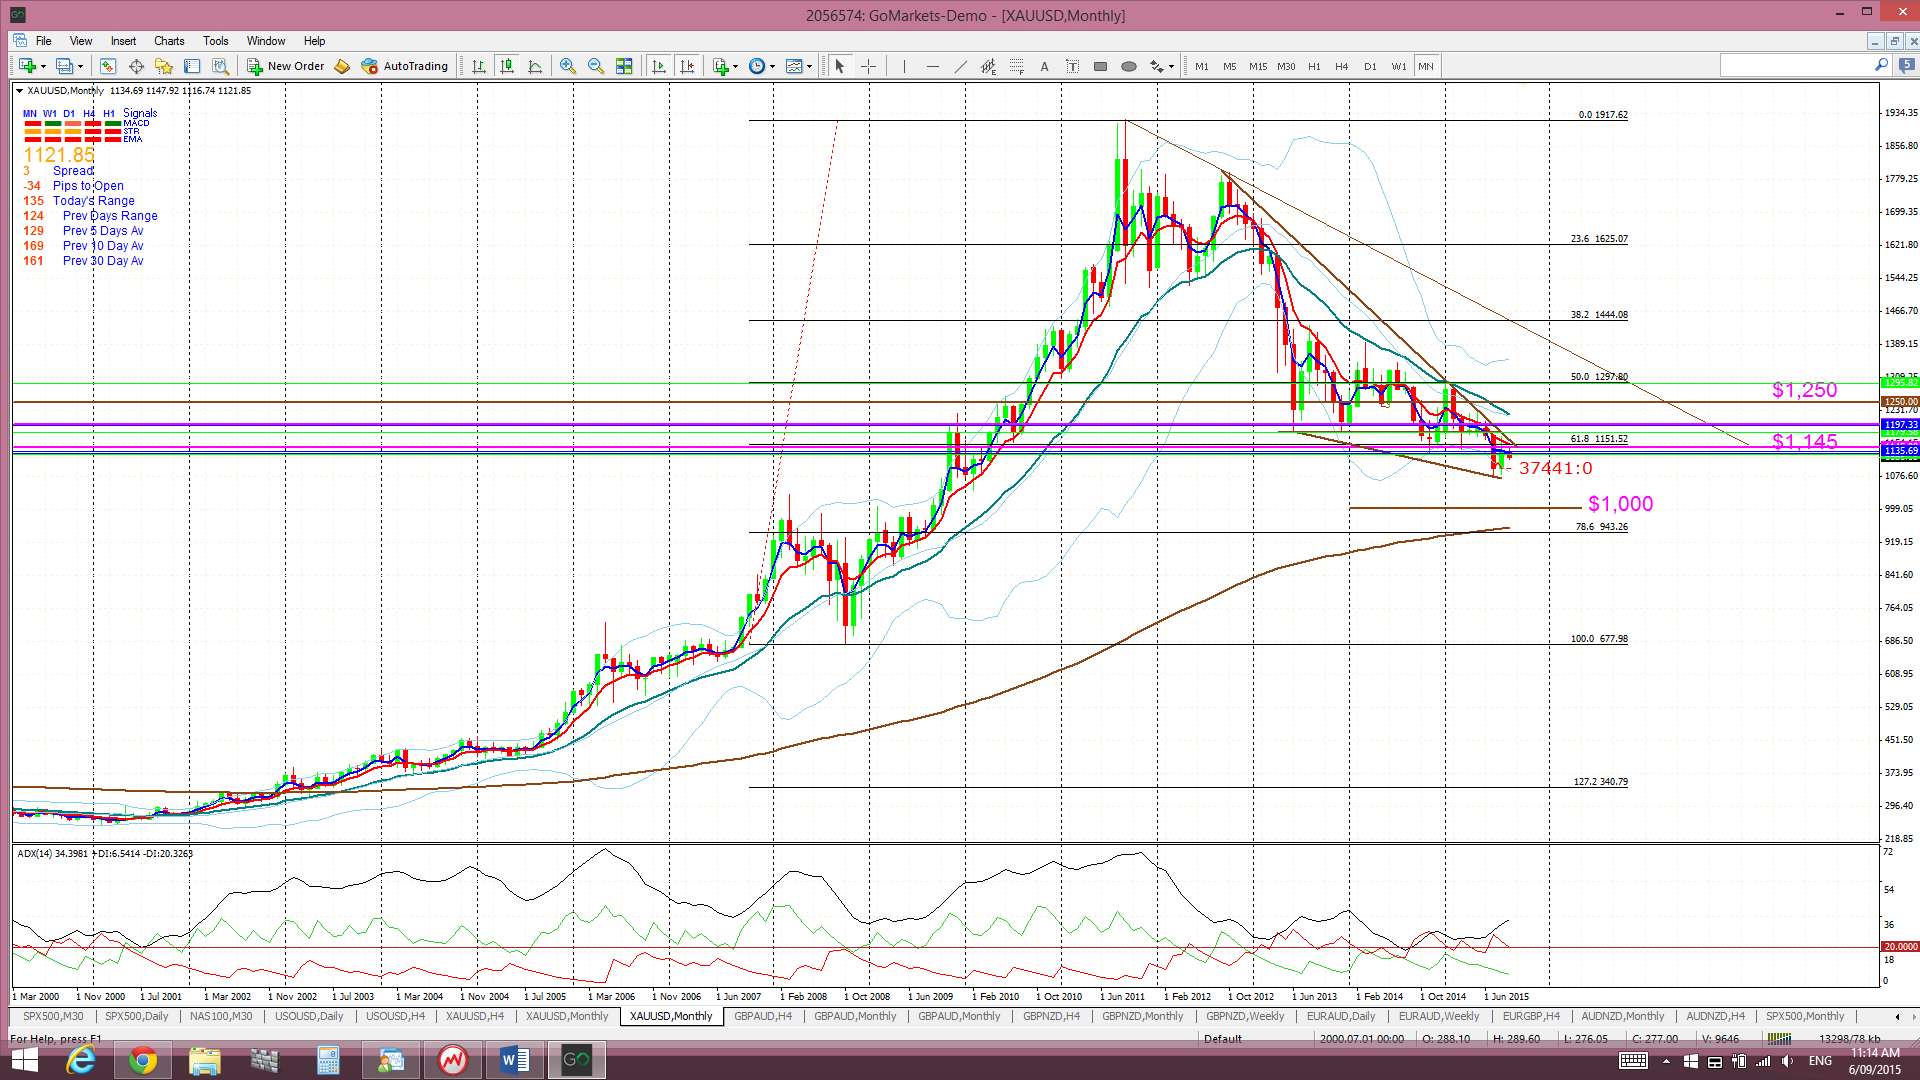
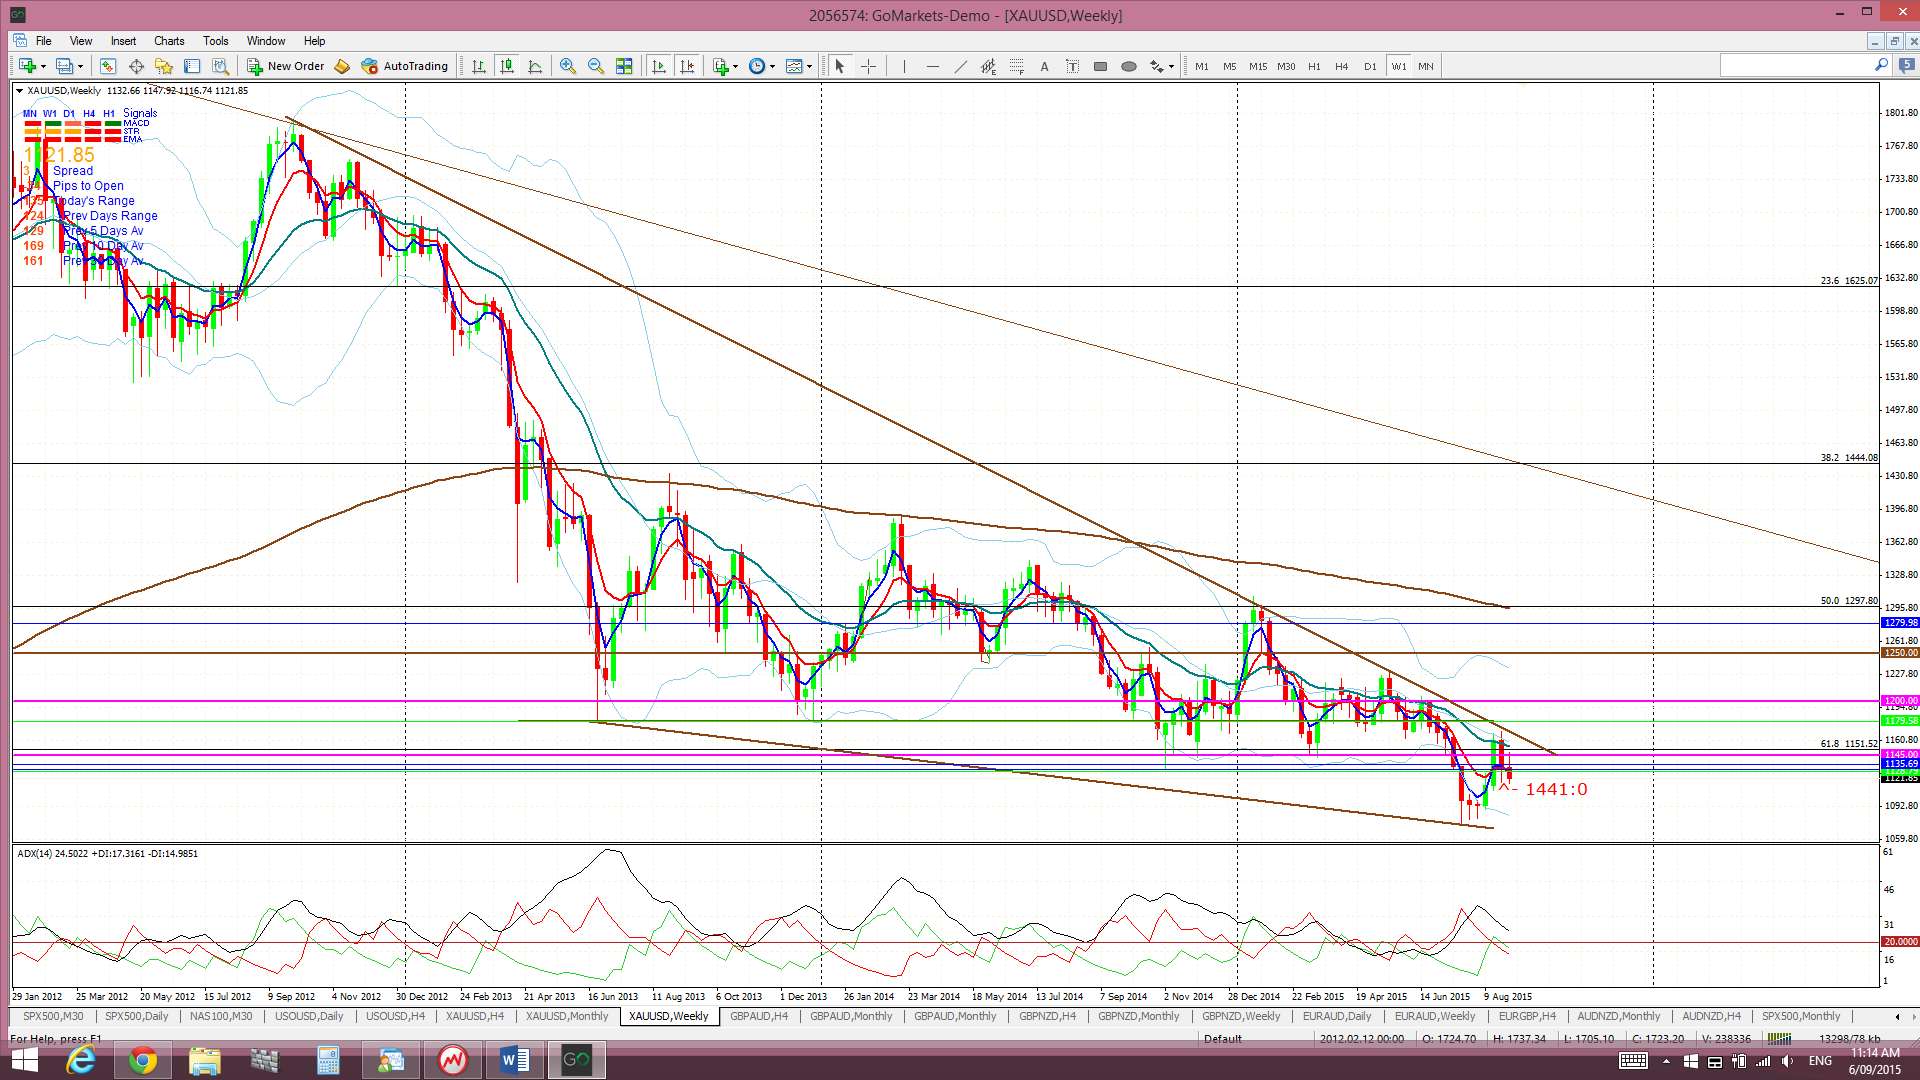
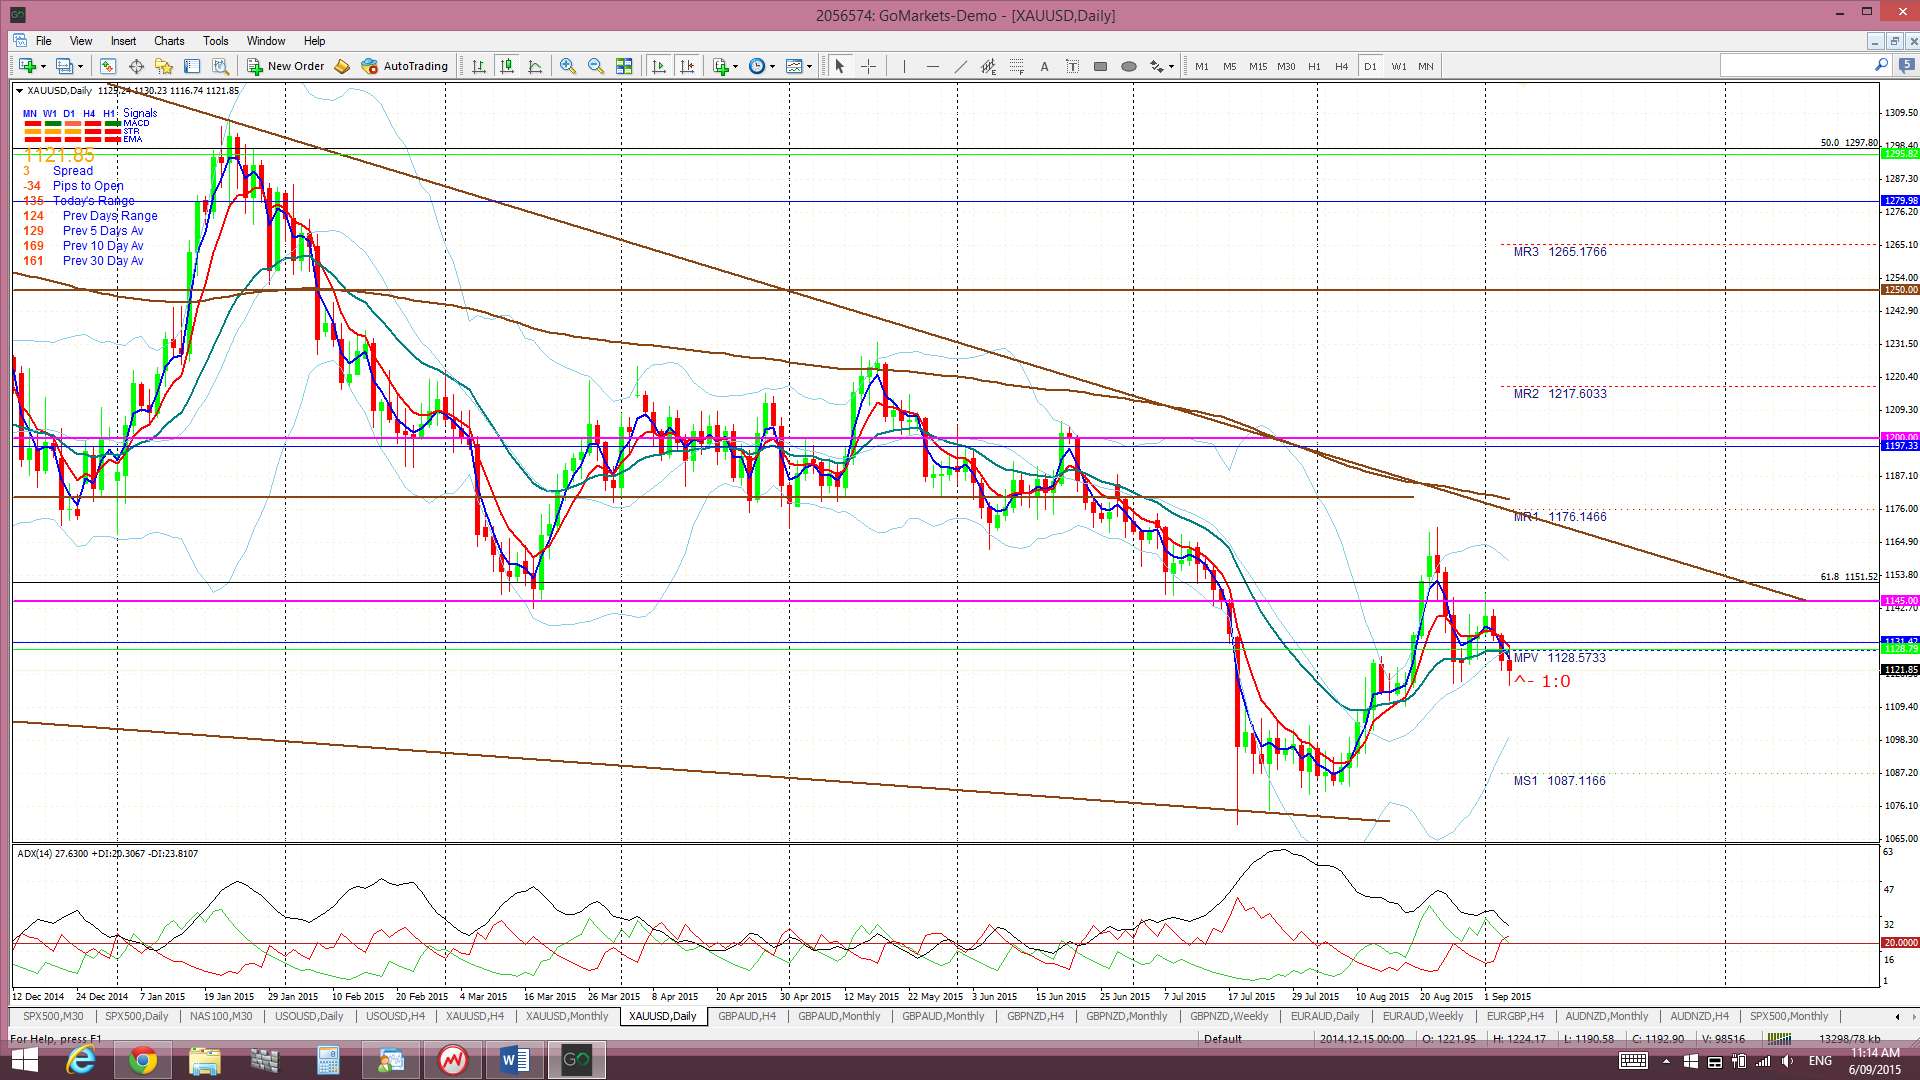
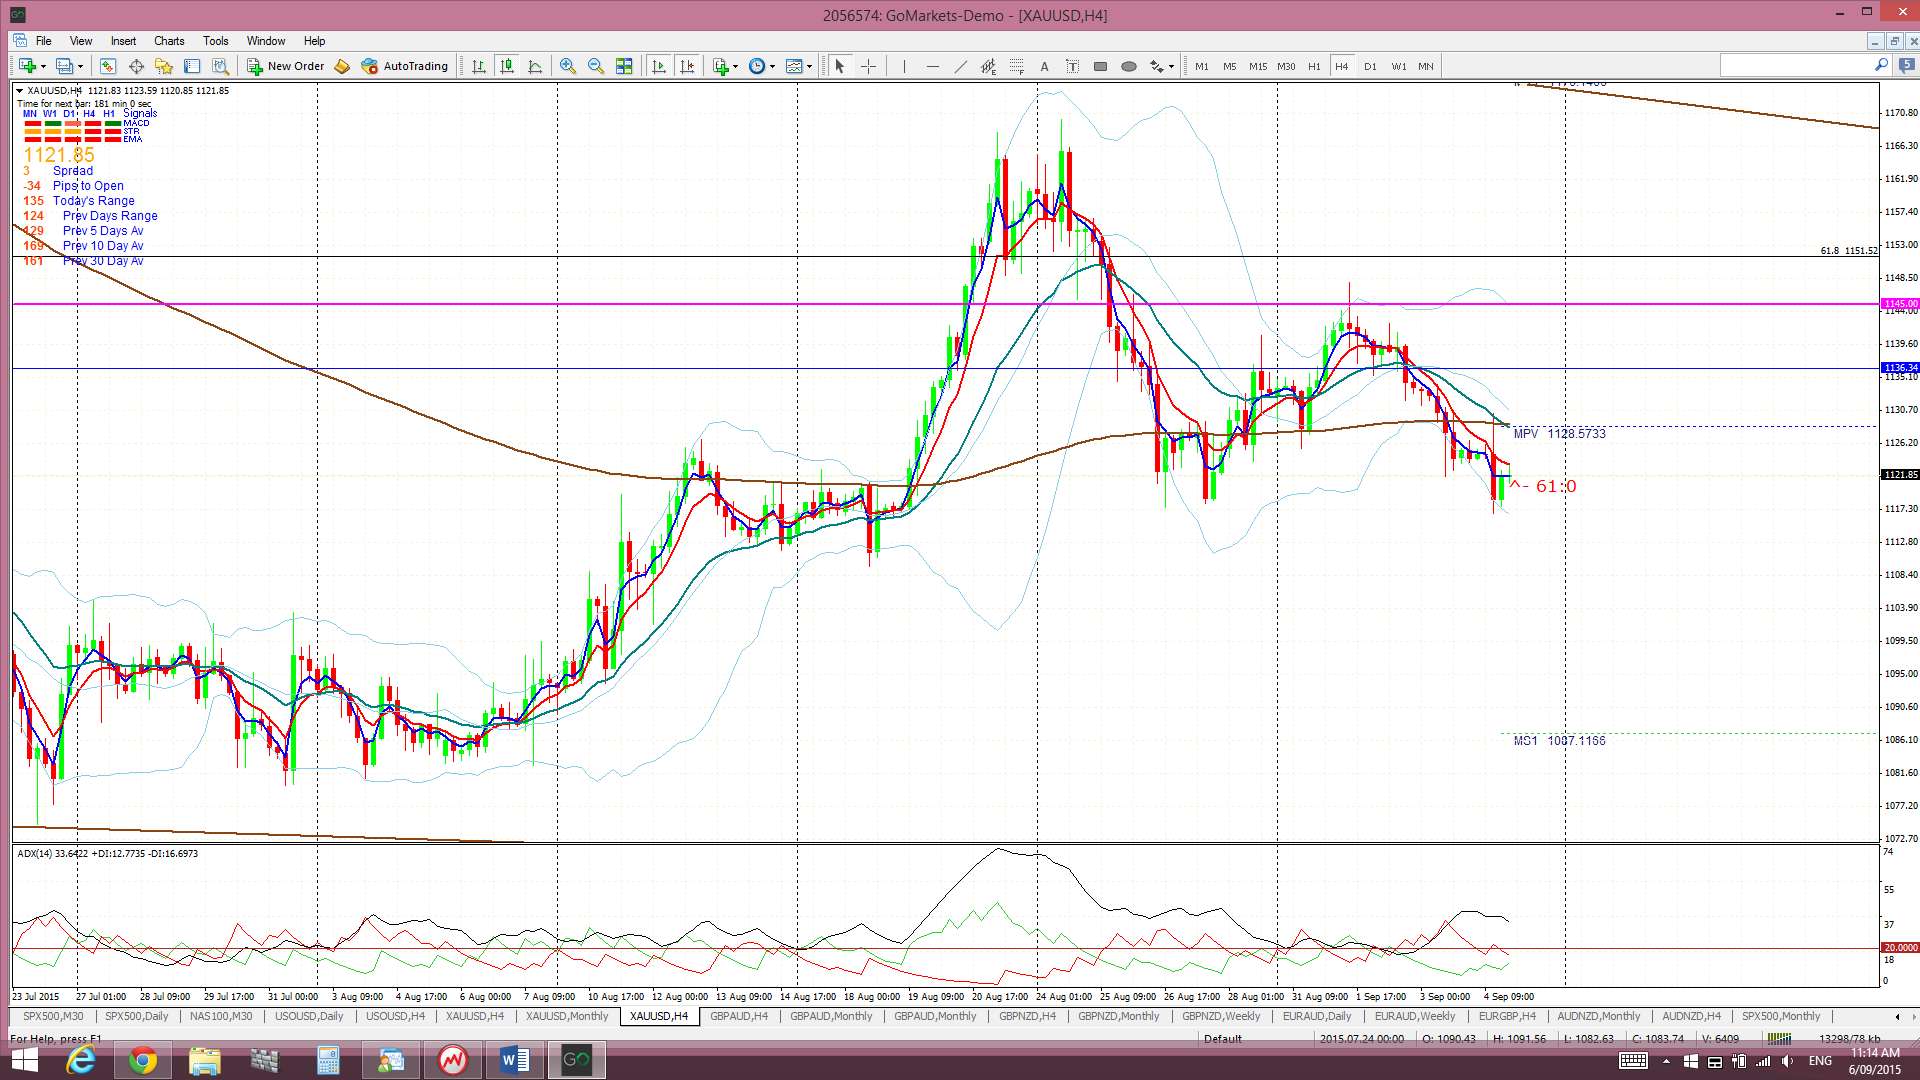
Gold: Gold chopped back up to test the key $1,145 level, and near to the 61.8% fib level, again last week but couldn’t manage a weekly close above these key S/R levels.
Traders are getting plenty of opportunities to SHORT Gold with these tests back up at $1,145 though.
The weekly hold below $1,145 for now however remains bearish and suggests that a deeper pull back could still be in store for Gold. The August monthly candle, although bullish coloured, closed below the 61.8% fib and $1,145/1,500 region and continues to support a bearish bias here. Bearish targets below $1,145 and $1,100 include the $1,000 psychological level and, then, the 78.6% fib near $950. I do note a bullish-reversal looking descending wedge forming up on the weekly chart here too though so will keep an eye on these tend lines as well!
Gold is trading in the Cloud on the daily chart but below the Cloud on the 4hr, weekly and monthly charts.
The weekly candle closed as a bearish candle.
- I’m watching for any new TC signal and the $1,145/1,150 level.
The post USD/JPY & S&P500: Thelma and Louise? appeared first on www.forextell.com.