I have been tracking the A/U within a descending triangle for some weeks now. These are bearish continuation patterns and the A/U has now broken through the bottom trend line.
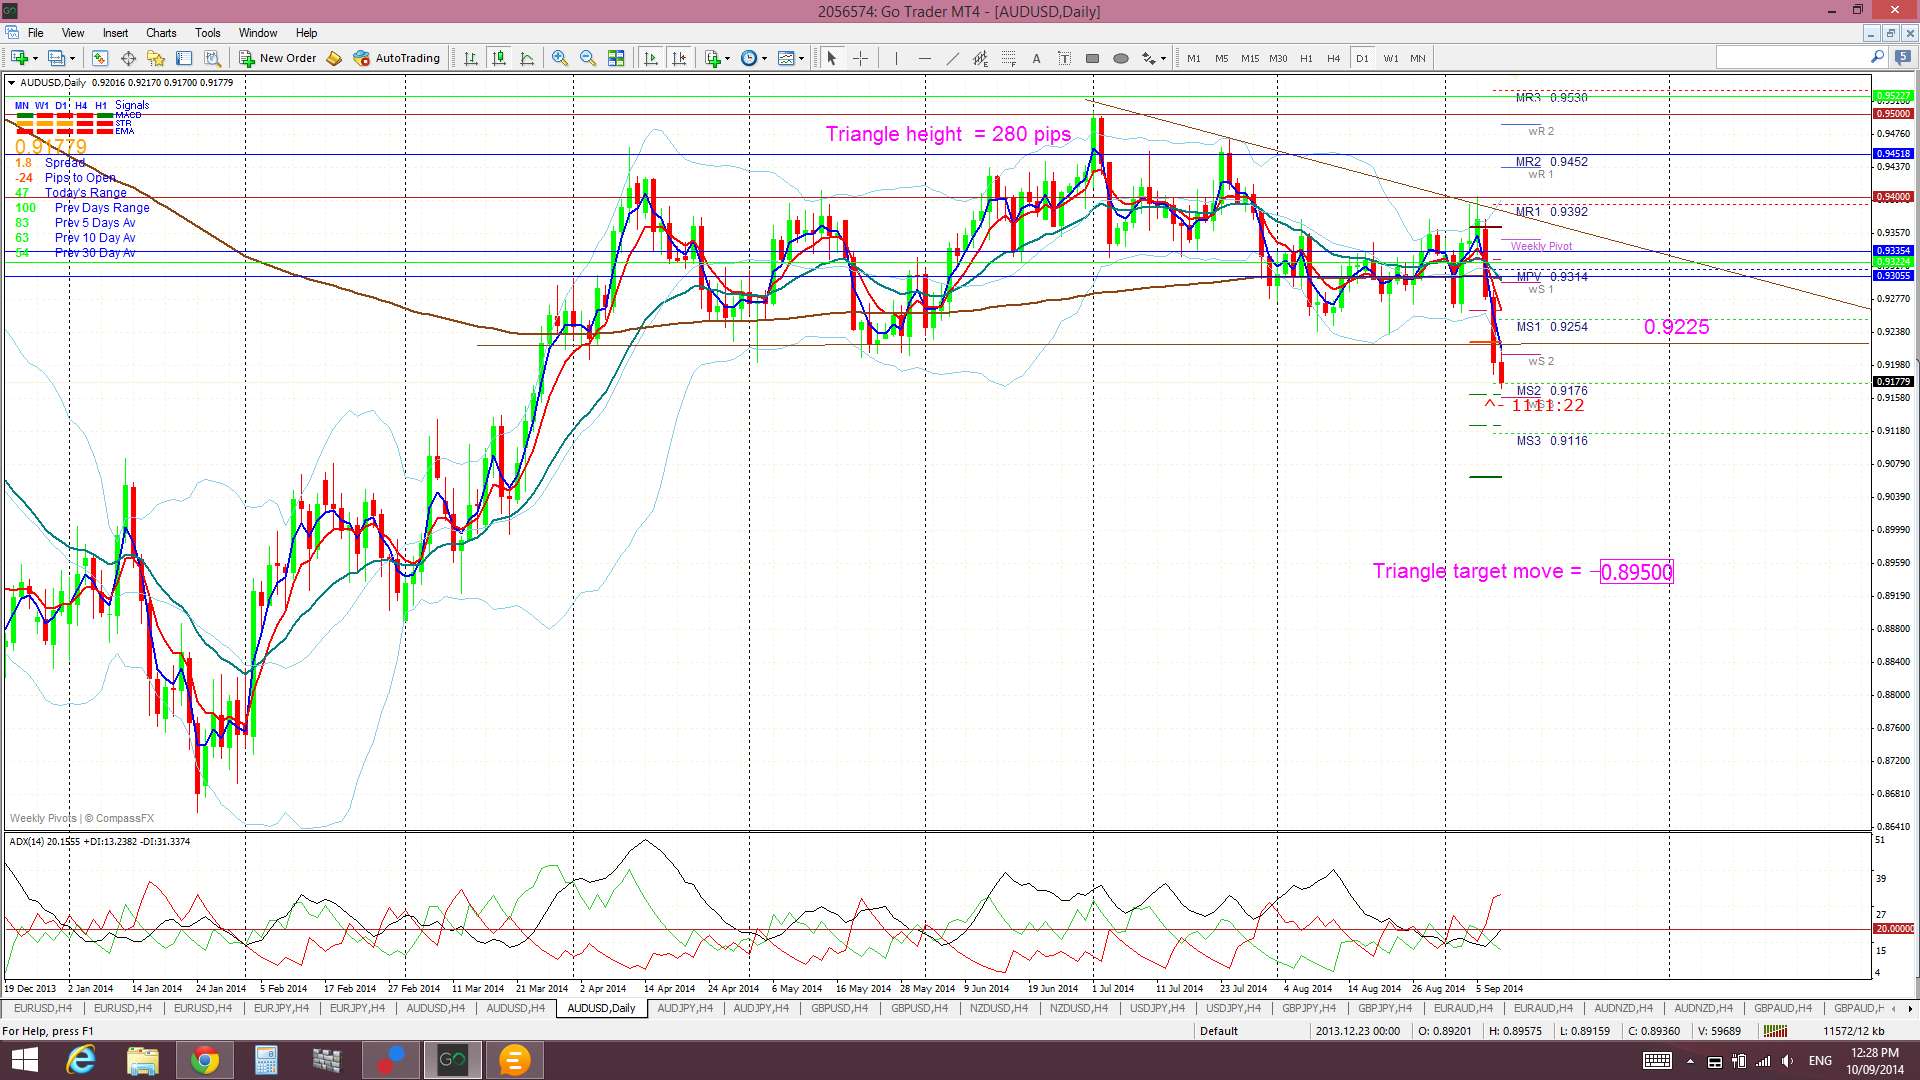
This bearish break suggests a continuation move lower and I thought I’d apply technical theory to look for a possible target for this move. The height of the triangle was about 280 pips. Thus, the expected follow through move below the 0.9225 trend line is of 280 pips as well. This gives a target near the 0.895 level:
A/U daily: showing bearish descending triangle break and suggested possible target of 0.895:
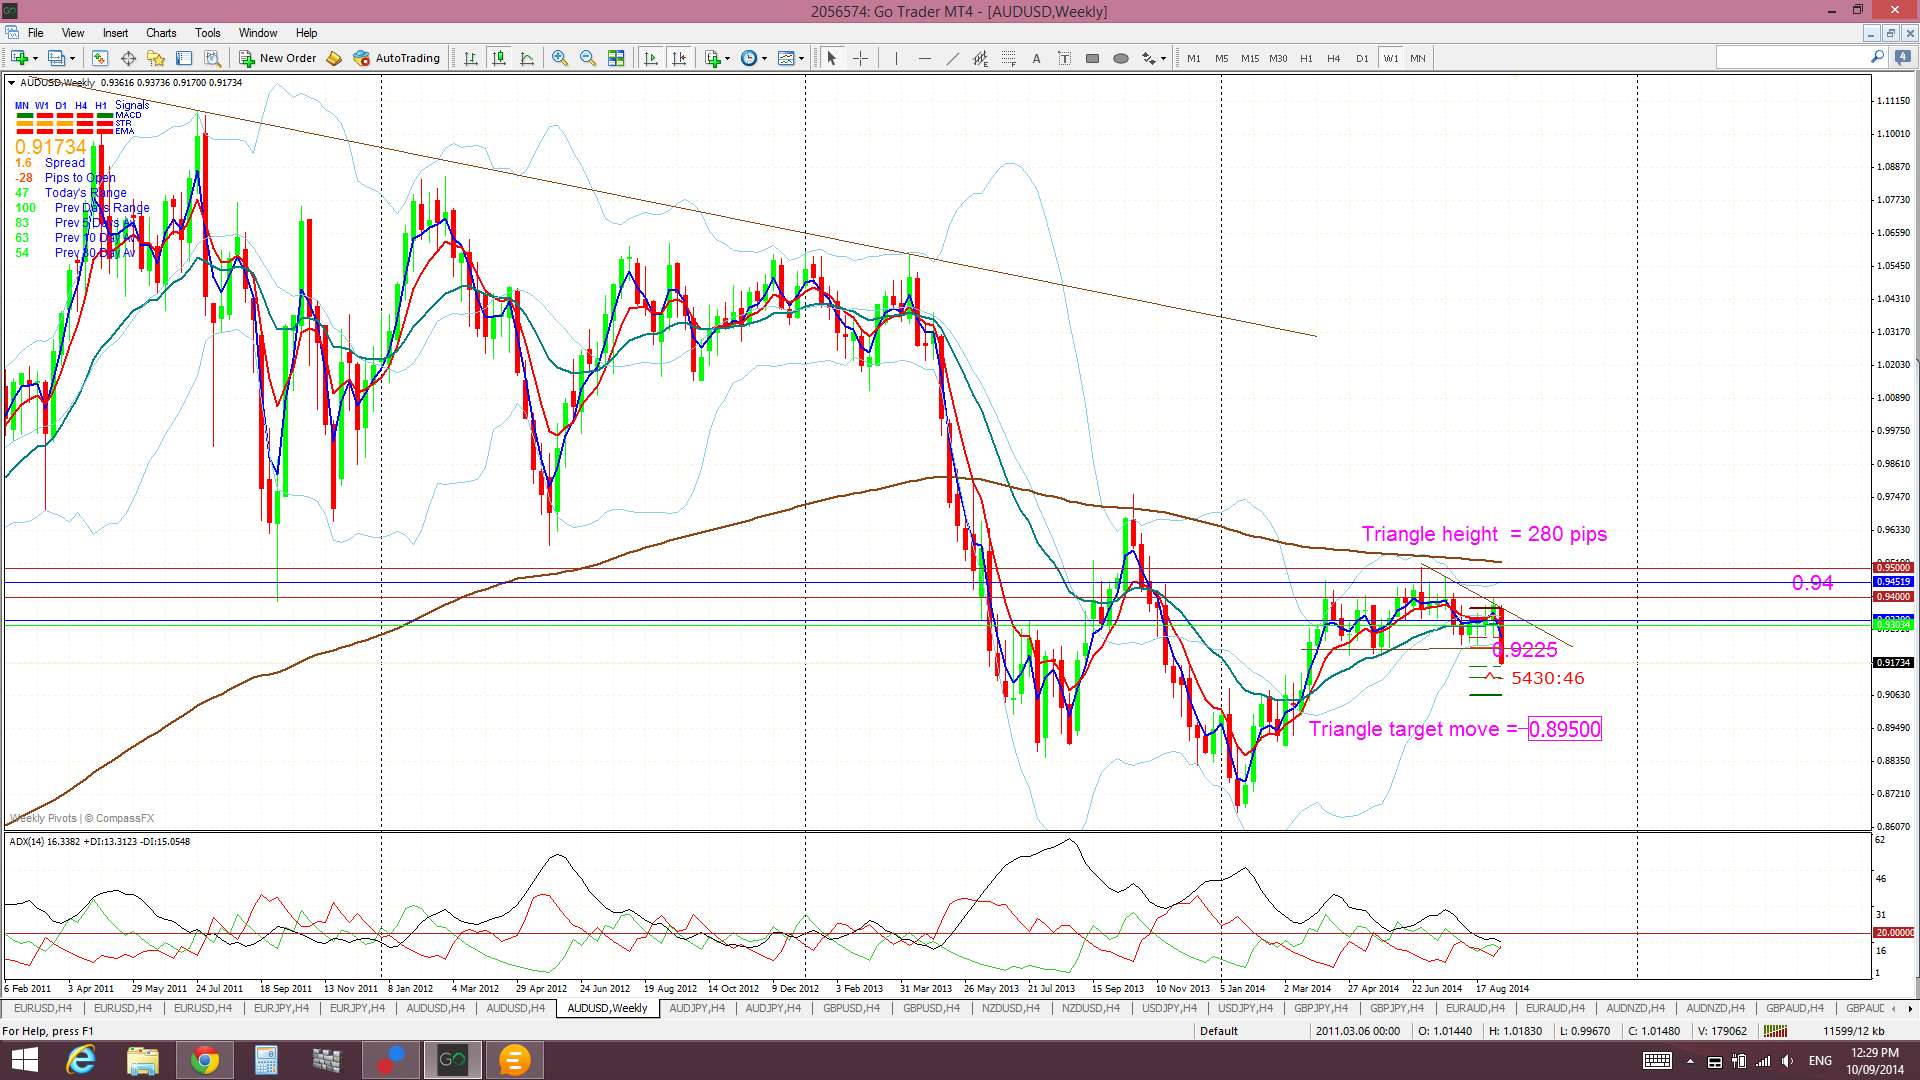
Stepping out to the weekly chart offers an interesting insight here. I have been wondering whether the weekly chart would ever form up into anything with a little more technical design. This might be the opportunity to do so! A move down to to the 0.895 area, followed by a bounce, would help to make a weekly chart bullish ‘inverse H&S’ pattern. Food for thought!
A/U weekly:
Summary: the break below the bottom triangle trend line suggests bearish continuation for the A/U. A suggested target for any follow through move, derived from technical theory, is 0.895. Such a move would help to build a weekly chart bullish ‘inverse H&S’ pattern.
The post A/U: triangle break target + an interesting fact! appeared first on www.forextell.com.