I have written a lot of articles on this pair over recent weeks: on Aug 4th, Aug 26th, Aug 27th, Aug 29th and the most recent on Sept 2nd. This pair seems to be continuing to carve out a base as it holds out and up from a bullish ascending triangle break with the hold above 1.105.
AUD/NZD 4hr: This pair has been in a gradual uptrend for the last 4 weeks. It has knocked off one key resistance level at 1.105 and this also marked the bullish ascending triangle breakout which alone has yielded up to 140 pips. The next major level of 1.12 is just above current price and the relevance of this level can be seen impacting as far back as 2003 (monthly chart below). A new TC signal is trying to form here on the 4hr chart BUT won’t be valid as the candle will most likely close outside the Bollinger band.

AUD/NZD daily: price has cleared the 1.105 level but is now negotiating the 1.12 level:

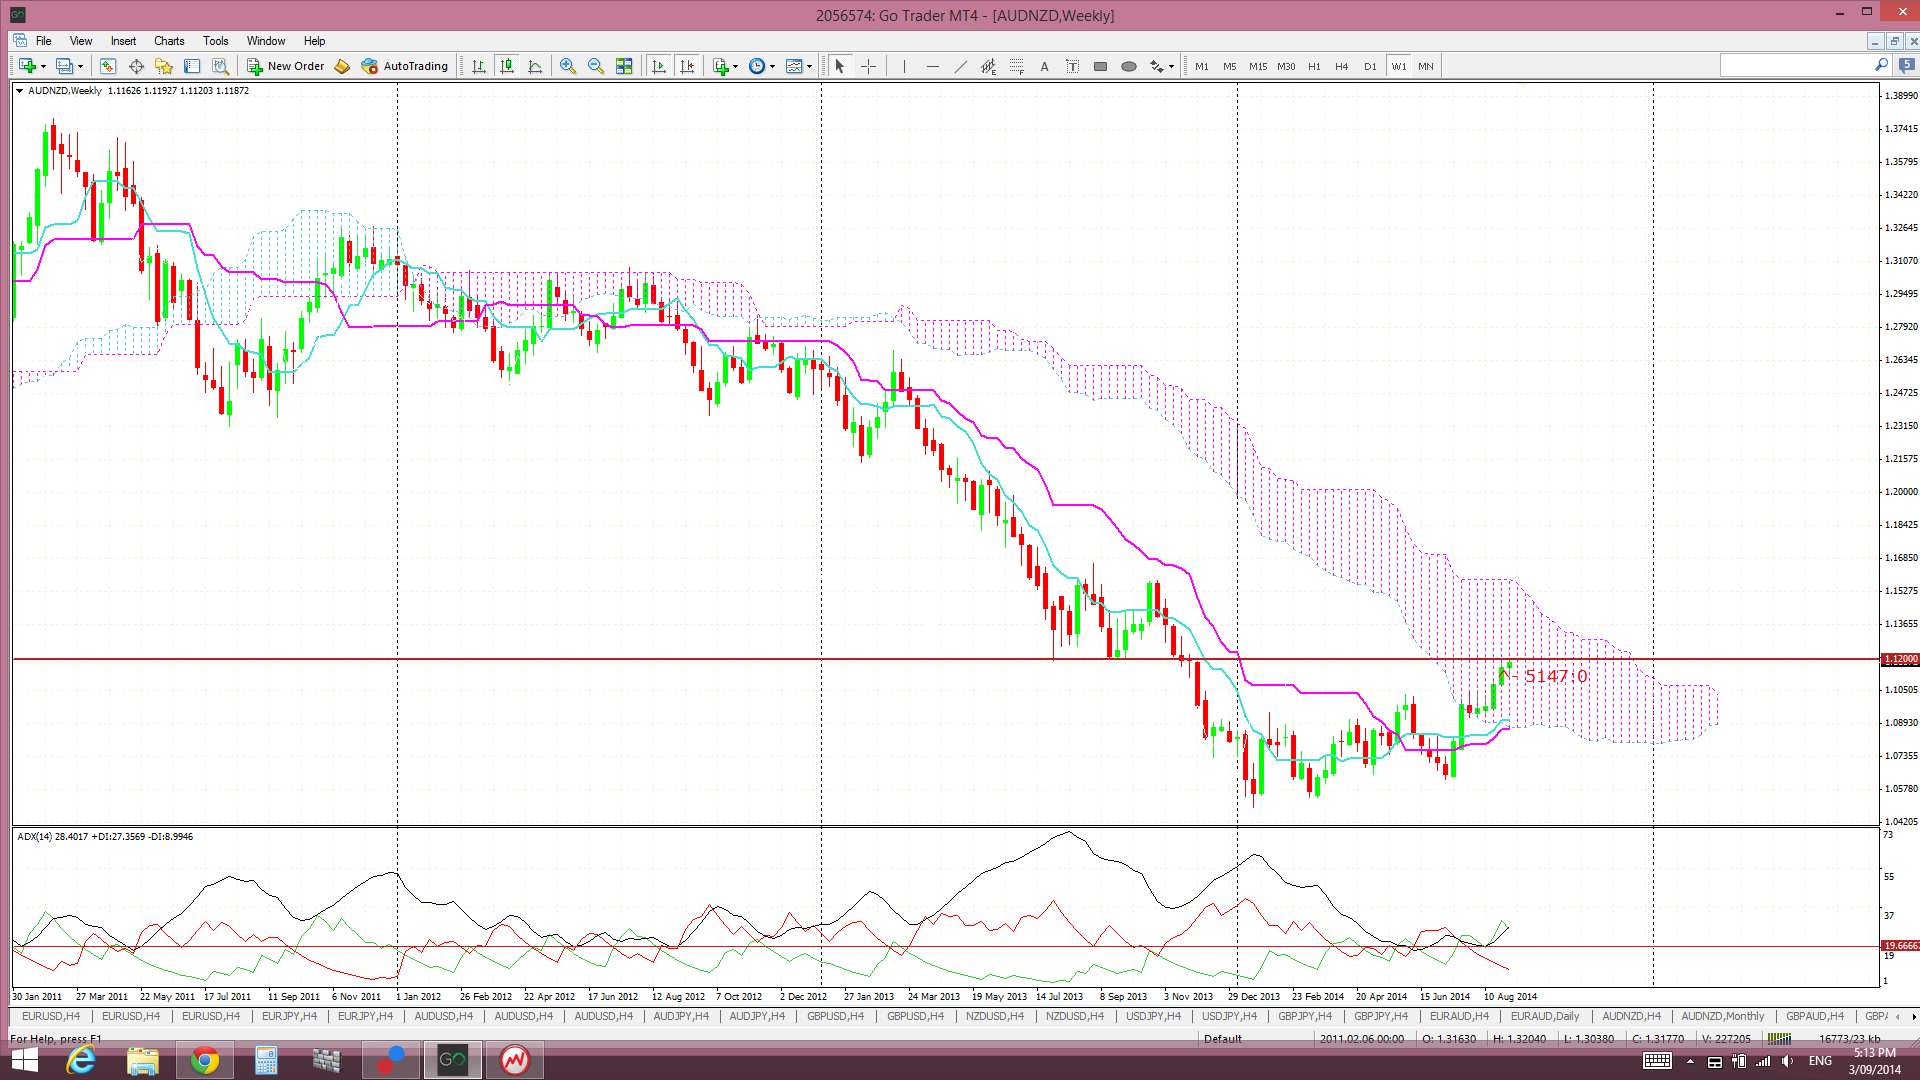
AUD/NZD weekly: the importance of the 1.12 level can be seen from this weekly chart:

AUD/NZD weekly Cloud: The AUD/NZD is already trading above the Cloud on the 4hr and daily chart and is attempting to move up through weekly Cloud:
AUD/NZD monthly: the monthly chart gives a better picture of the significance of the 1.12 level. Any close and hold above this would be bullish and suggest continuation:

Summary: the AUD/NZD is attempting to move up through the 1.12 resistance level. Any daily close and hold above that would support a new LONG trade. Some traders will prefer to wait to see a weekly close above this level for bullish confirmation. A failure to close above this level would suggest either further consolidation between 1.105 – 1.12 OR a possible reversal (the latter unlikely me thinks!)
The post AUD/NZD: trade plan around the 1.12 level. appeared first on www.forextell.com.