The recent activity and discussion with Bond prices and Interest Rates motivated me to look back over my charts of TMV. I wrote an article about this ETF around this time last year and it can be found through the following link. It has been a long wait to see any sign of a decent upward bullish breakout on TMV but we may be starting to see this now.
Recall that as Yields or Interest Rates rise then Bond prices would be expected to fall as per the relationship shown in this schema:
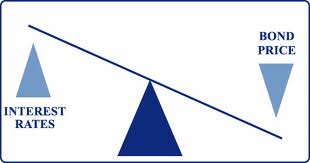
Thus, in an environment of increasing Interest Rates one would expect to see Bond prices fall and the inverse Bond ETF, TMV, to rise. The following charts show that such a correlation is starting to unfold and so I’ll be watching for any follow-through activity with these moves.
TLT monthly: iShares Barclays 20+ Yr Treasury Bond ETF: This is the current chart of the Bond ETF. The month has yet to close but there is obvious downside pressure being placed on this 8-year support trend line:

TNX monthly: Interest Rate 10 Year Note Index: This index has been in a downtrend for the last 25 years but the pattern of printing lower Highs and lower Lows may be coming to an end. Any break and hold above this 25-year bear trend line and move back above the 30 level would suggest that some mean reversion could be on the way:

TMV: TMV is a triple leveraged ETF, released in 2009, that tracks 3 x the inverse performance of the NYSE 20 Year Plus Treasury Bond Index. I wrote about this ETF last year suggesting traders watch for any bullish-reversal but this has been very slow in evolving, however, the recent weekly close is rather encouraging.
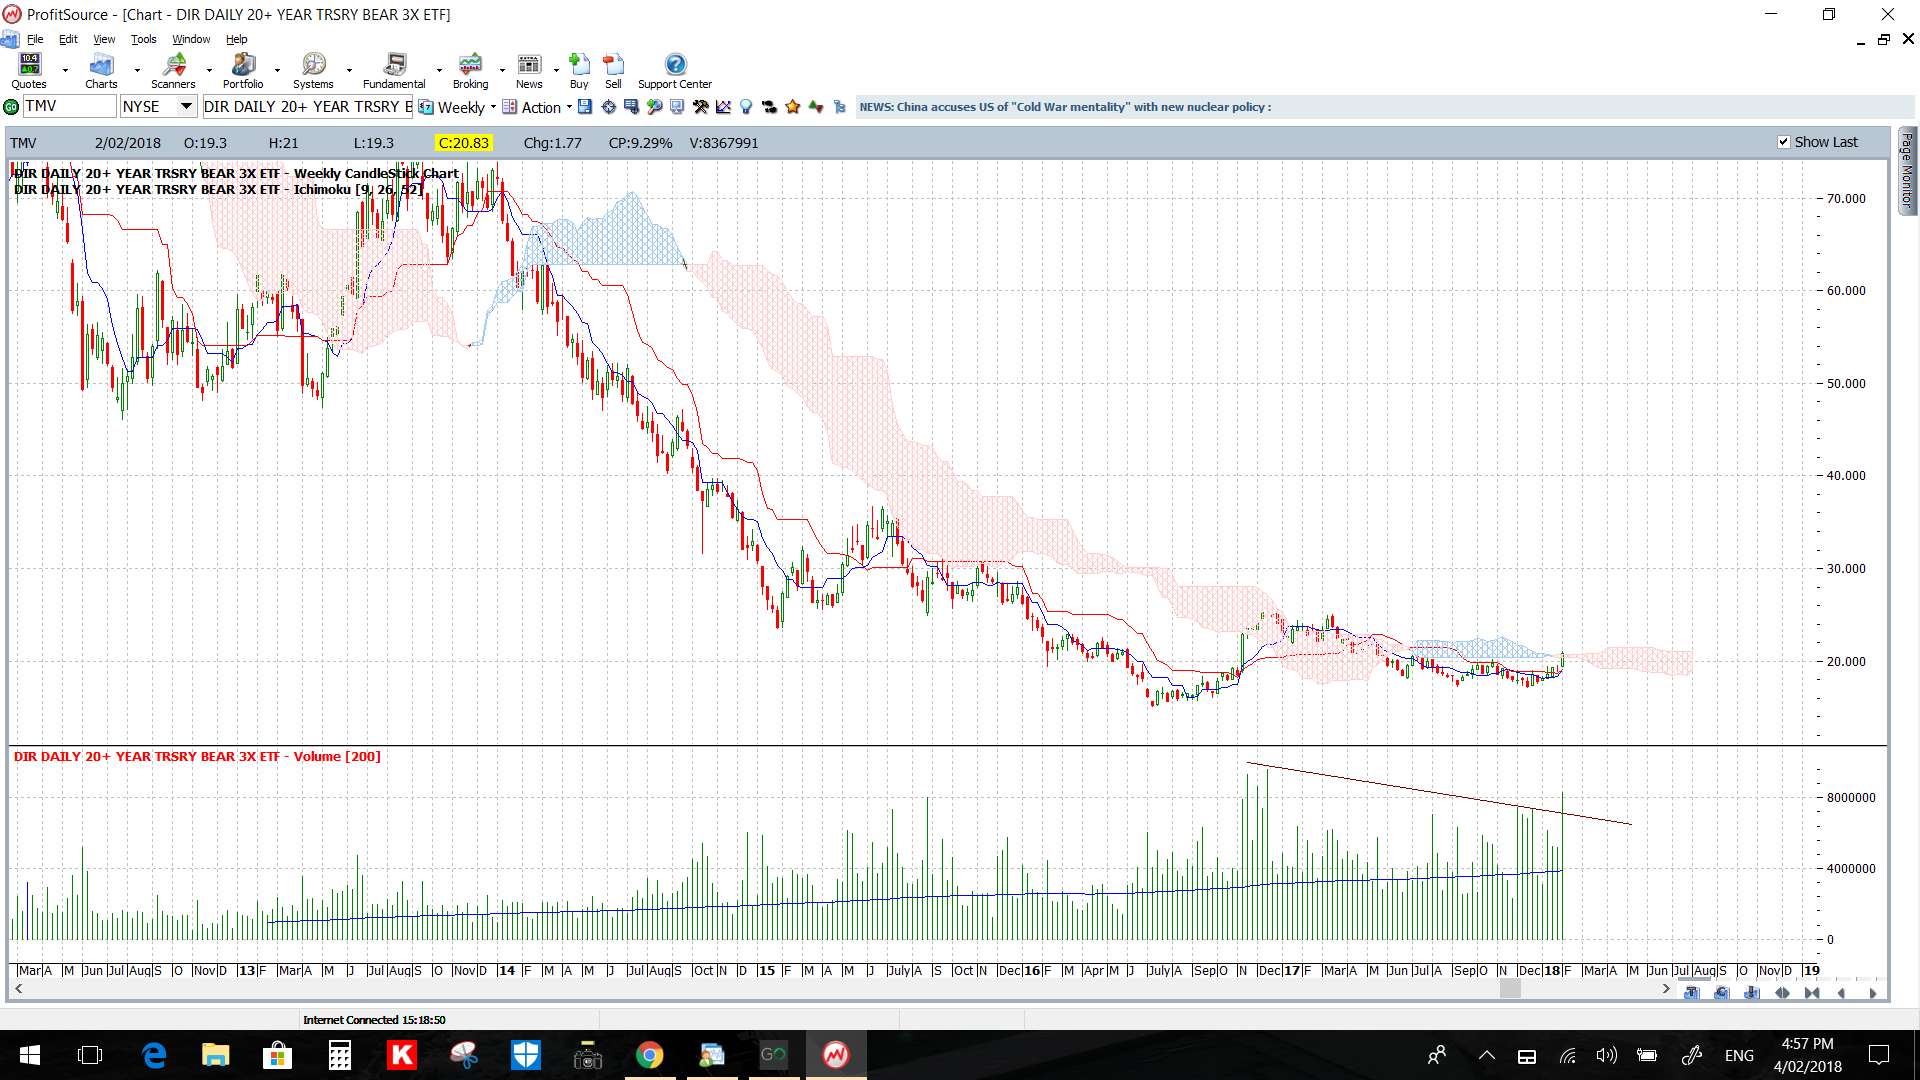
TMV weekly: The bear trend line has been broken and price action has closed back above the key 20 level and this has evolved with increasing momentum:

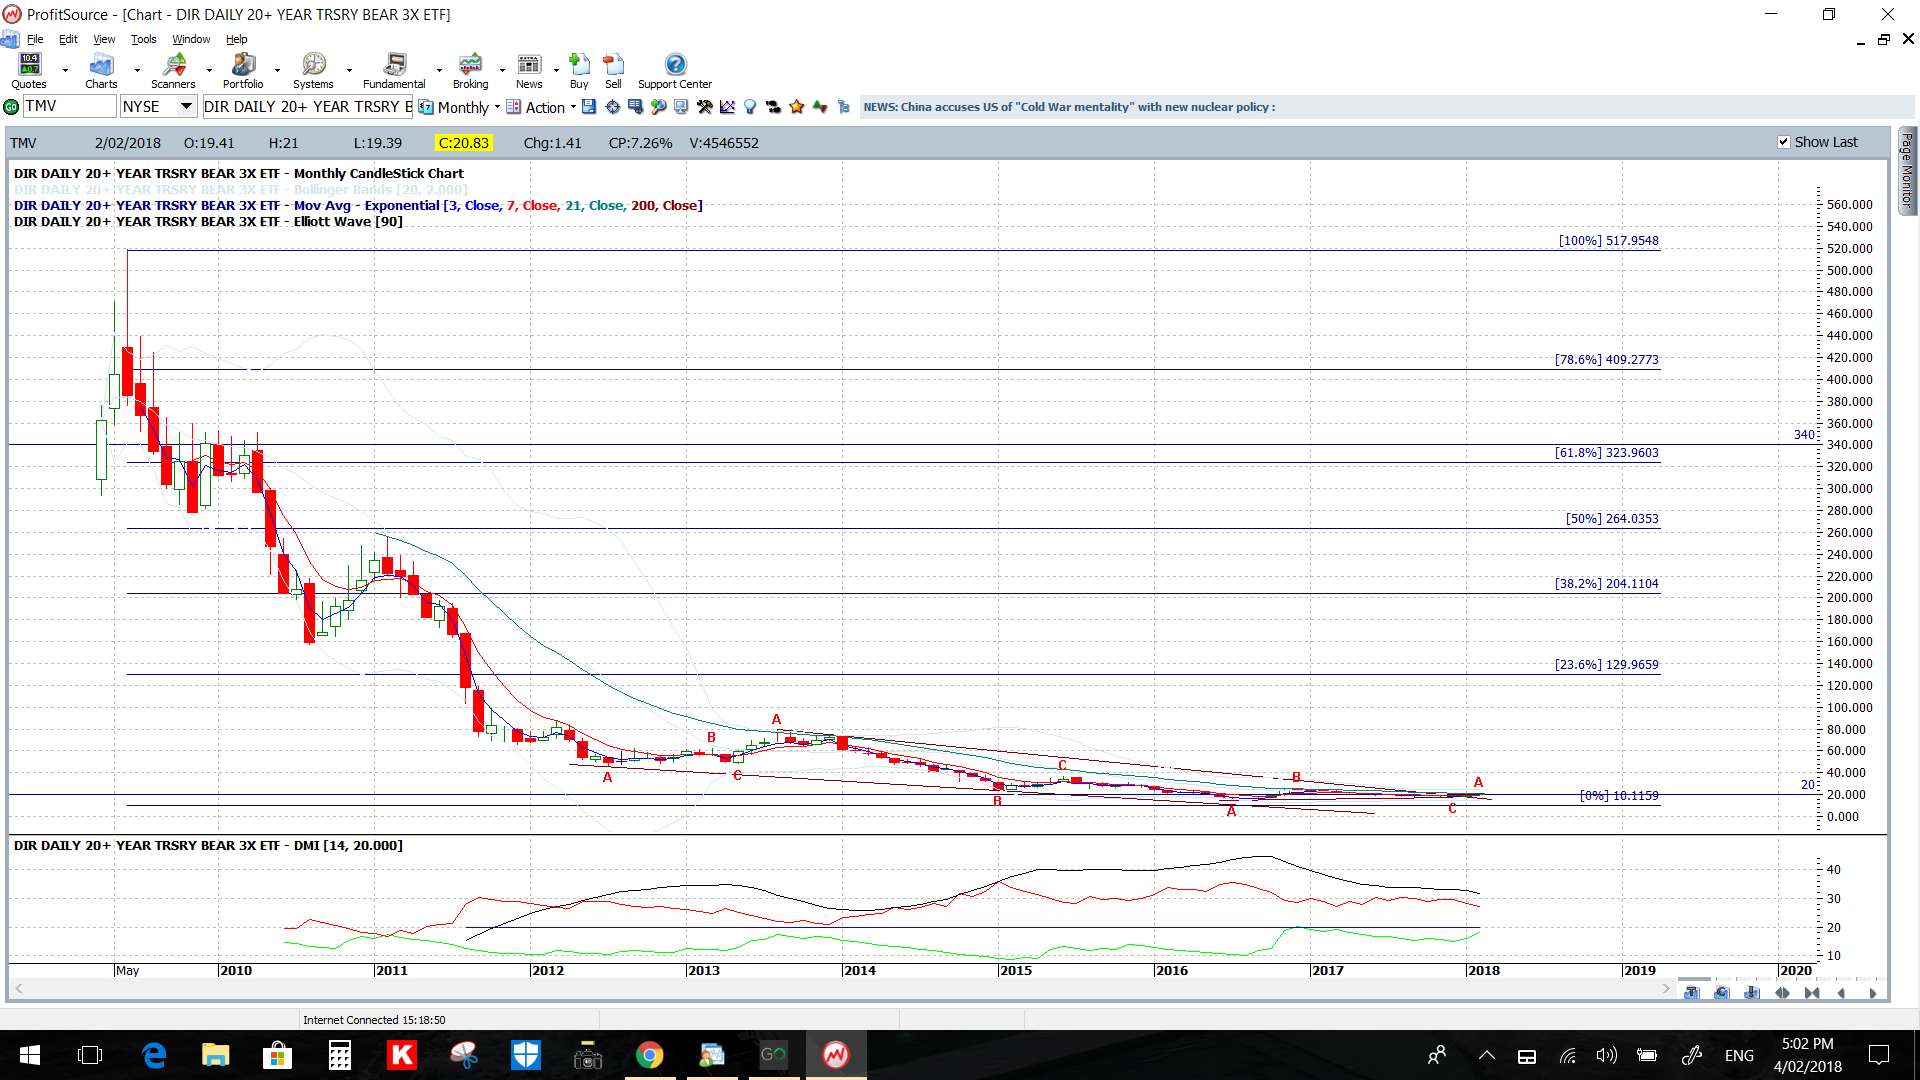
TMV monthly: There is a lot of room for recovery here! Note how the monthly chart’s 61.8% fib is up near previous S/R at 340:
TMV weekly Cloud: Note how price action is above the Cloud and this move evolved with increased Volume; always a good sign!
Summary: TMV may provide a trading opportunity given the landscape of rising Yields and falling Bond price. Keep an eye out for follow-through activity with the following TMV chart features:
- The recent bullish wedge trend line breakout.
- The recent bullish weekly Ichimoku Cloud breakout.
- Increased Momentum.
- Increased trading Volume.