Mon 1st Sept
The Cable has been trading within a descending trading channel for the last 8 weeks. This has been giving the weekly chart a bit of a ‘Bull Flag’ appearance but we are yet to see any channel breakout, bullish or bearish! A bullish candle close was printed last week following after 7 bearish weekly candles and we could be about to see some further bullish activity so traders will be keenly watching these channel trend lines.
Cable weekly: ‘Bull Flag’?
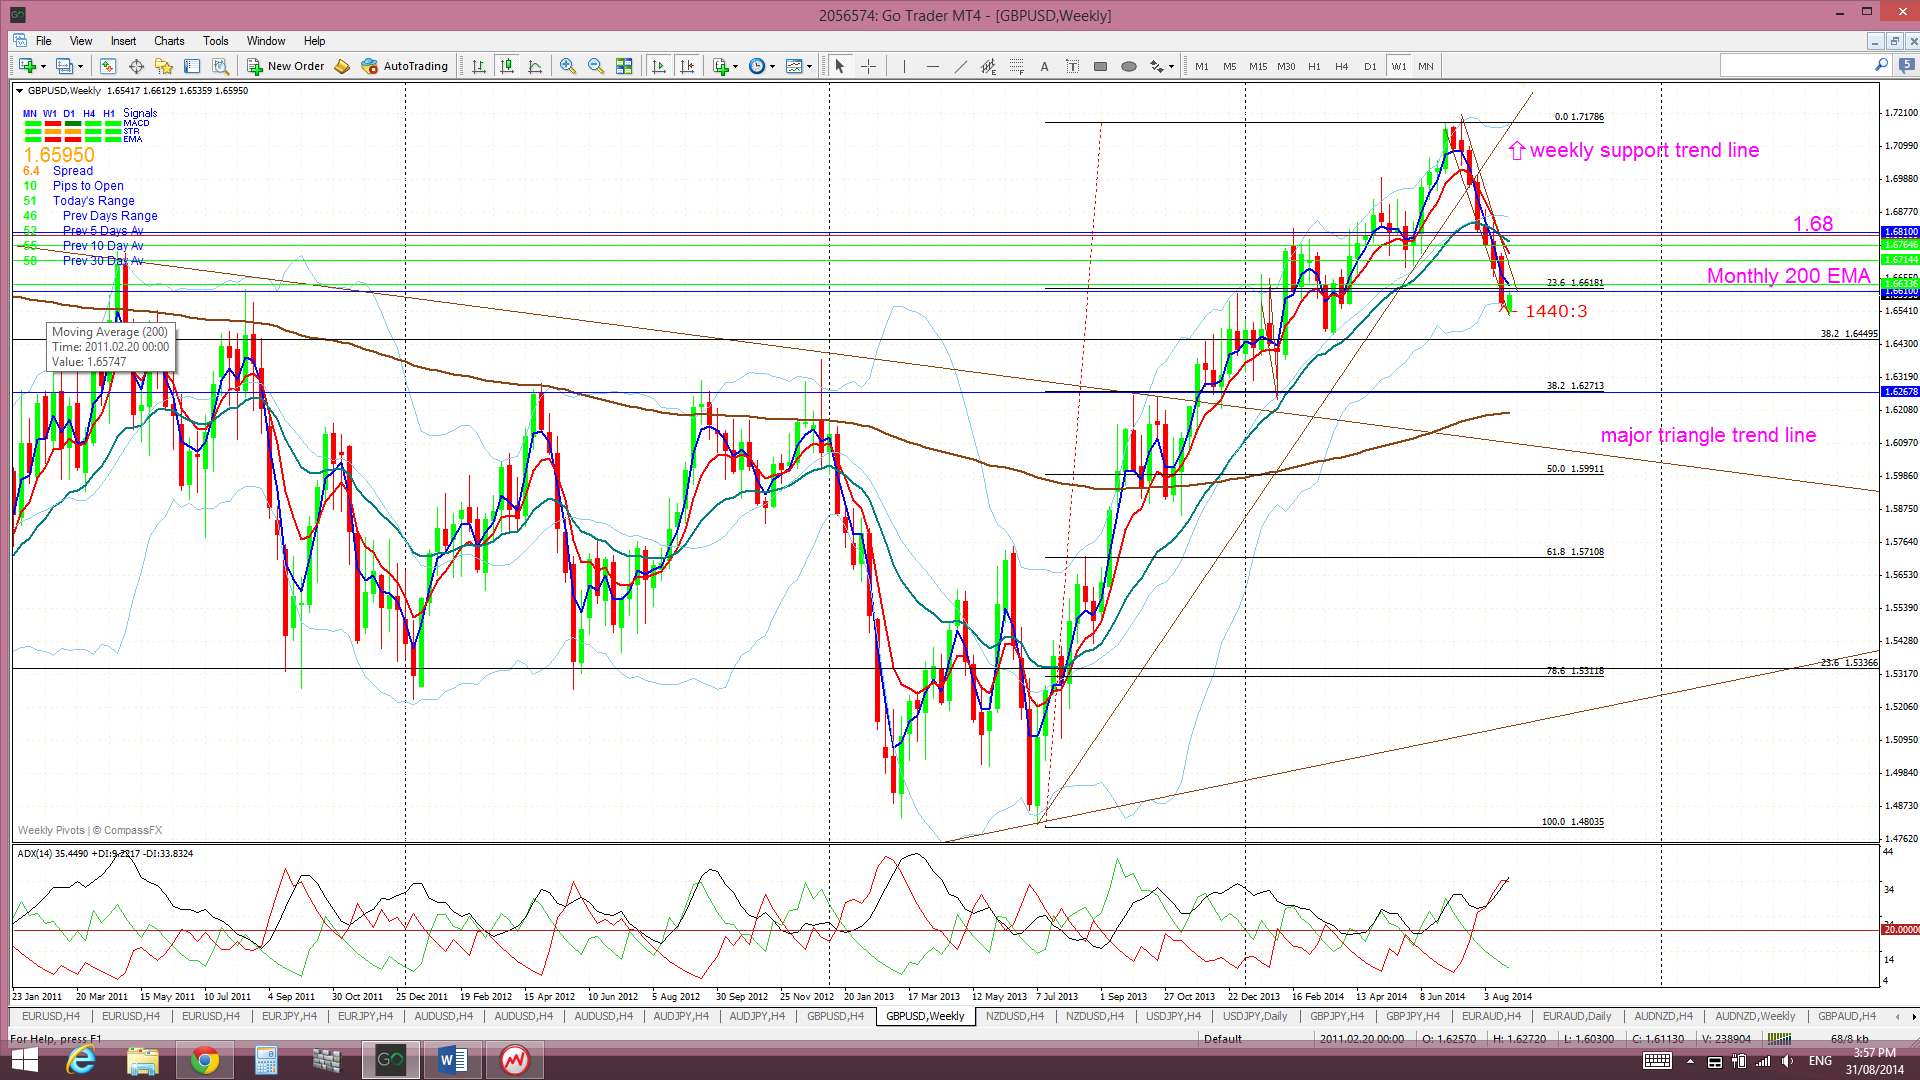
Price is edging up towards the upper trend line of this trading channel and this action is starting to look a bit bullish. Most of this channel is in view on the 4hr chart and, hence, I have a question for you all. What time frame chart are traders wanting to use to confirm a break of this trading channel before taking any new trade? Weekly, daily, 4 hr or 1 hr?

I will be waiting for a daily candle to close outside the trading channel before taking any new ‘trend line break trade’ but that’s just me.
Two pieces of Chinese data have been released so far today and both have been a bit soft but near target and so haven’t caused any ‘risk off’ move with AUD, NZD or GBP. There is GBP Manufacturing PMI data tonight and this might be just the item to trigger some movement on the Cable and shift it out of this channel.
Remember today is a holiday in the USA and Canada.
The post Cable: A quick question for you all. appeared first on www.forextell.com.