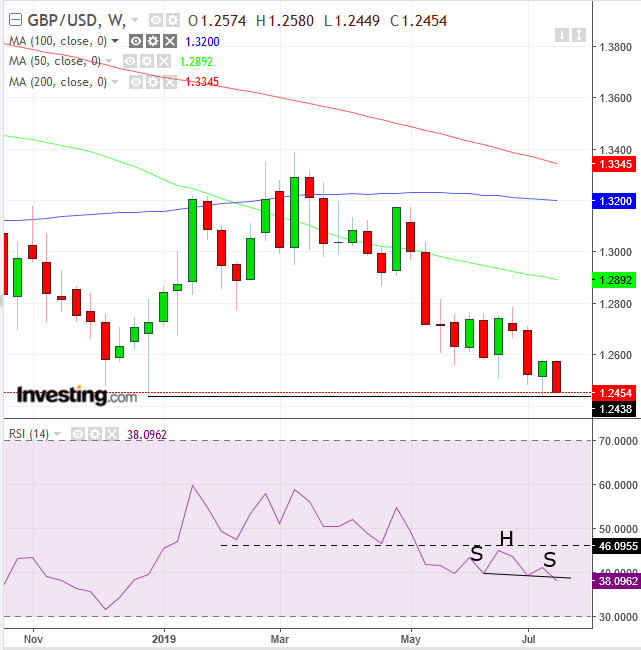
Will the pound‘s plunge continue after hitting the lowest level since April 2017? As Brexit talks turn the most hostile since British people voted to leave the European Union in 2016, sterling remains caught in the uncertainty of the debate. The charts, however, may be able to give us a little more insight into what its future movements may be.
Today, the pound is about 6.65% down from its March high, bringing it to a 2.4% loss YTD. Traders are asking themselves whether this is the bottom and whether cable can be expected to return to the March highs.
That question is evident in the chart, as the price tests the Jan. 3 intraday low of a fat-finger selloff.

Chart powered by TradingView
The price has posted a new low, extending the downtrend since the March high. However, it has remained above the Jan. 3 low, suggesting there is enough demand to support the price.
The RSI completed a continuation H&S pattern, demonstrating a continued downtrend after the pause. The pattern demonstrated a change in contracts between buyers and sellers, in which the latter drowned all available demand and now seek additional buyers at lower prices.
The technical mechanism—stopping out long positions, attracting short sellers—is compounded by a reversal in sentiment, in which the market shifts its outlook from higher to lower prices. This phenomenon tends to build up and continue until it meets a catalyst or major technical block.
The bottom line is that further Brexit developments, especially polls, will undoubtedly lead prices in whipsaws. For now, a new low—below the Jan. 3 trough, after a close below the recent, July 9 low—would be crucial to demonstrate that supply remains heavier than demand.
Trading Strategies
Conservative traders would wait for a low below the Jan. 3 trough, followed by a return move that would prove resistance, strengthening the case for a long-term downtrend.
Moderate traders would also wait for a close below the 1.2438, Jan. 3 low (two pips below the July 8 low), as well as wait for the expected pull back, to reduce exposure, but not necessarily to ascertain the bears’ conviction.
Aggressive traders may enter a contrarian long position, to take advantage of a possible bounce off the support, affording an entry extremely near to the support, either for a bigger risk-reward ratio, or for the strength of the potential upward move.
Trade Sample – Long Position
- Entry: 1.2450
- Stop-Loss: 1.2430
- Risk: 20 pips
- Target: 1.2550, round number below July 12 high
- Reward: 100 pips
- Risk-Reward Ratio: 1:5
Jul 17, 2019 00:01
Source: Investing.com

 By
By