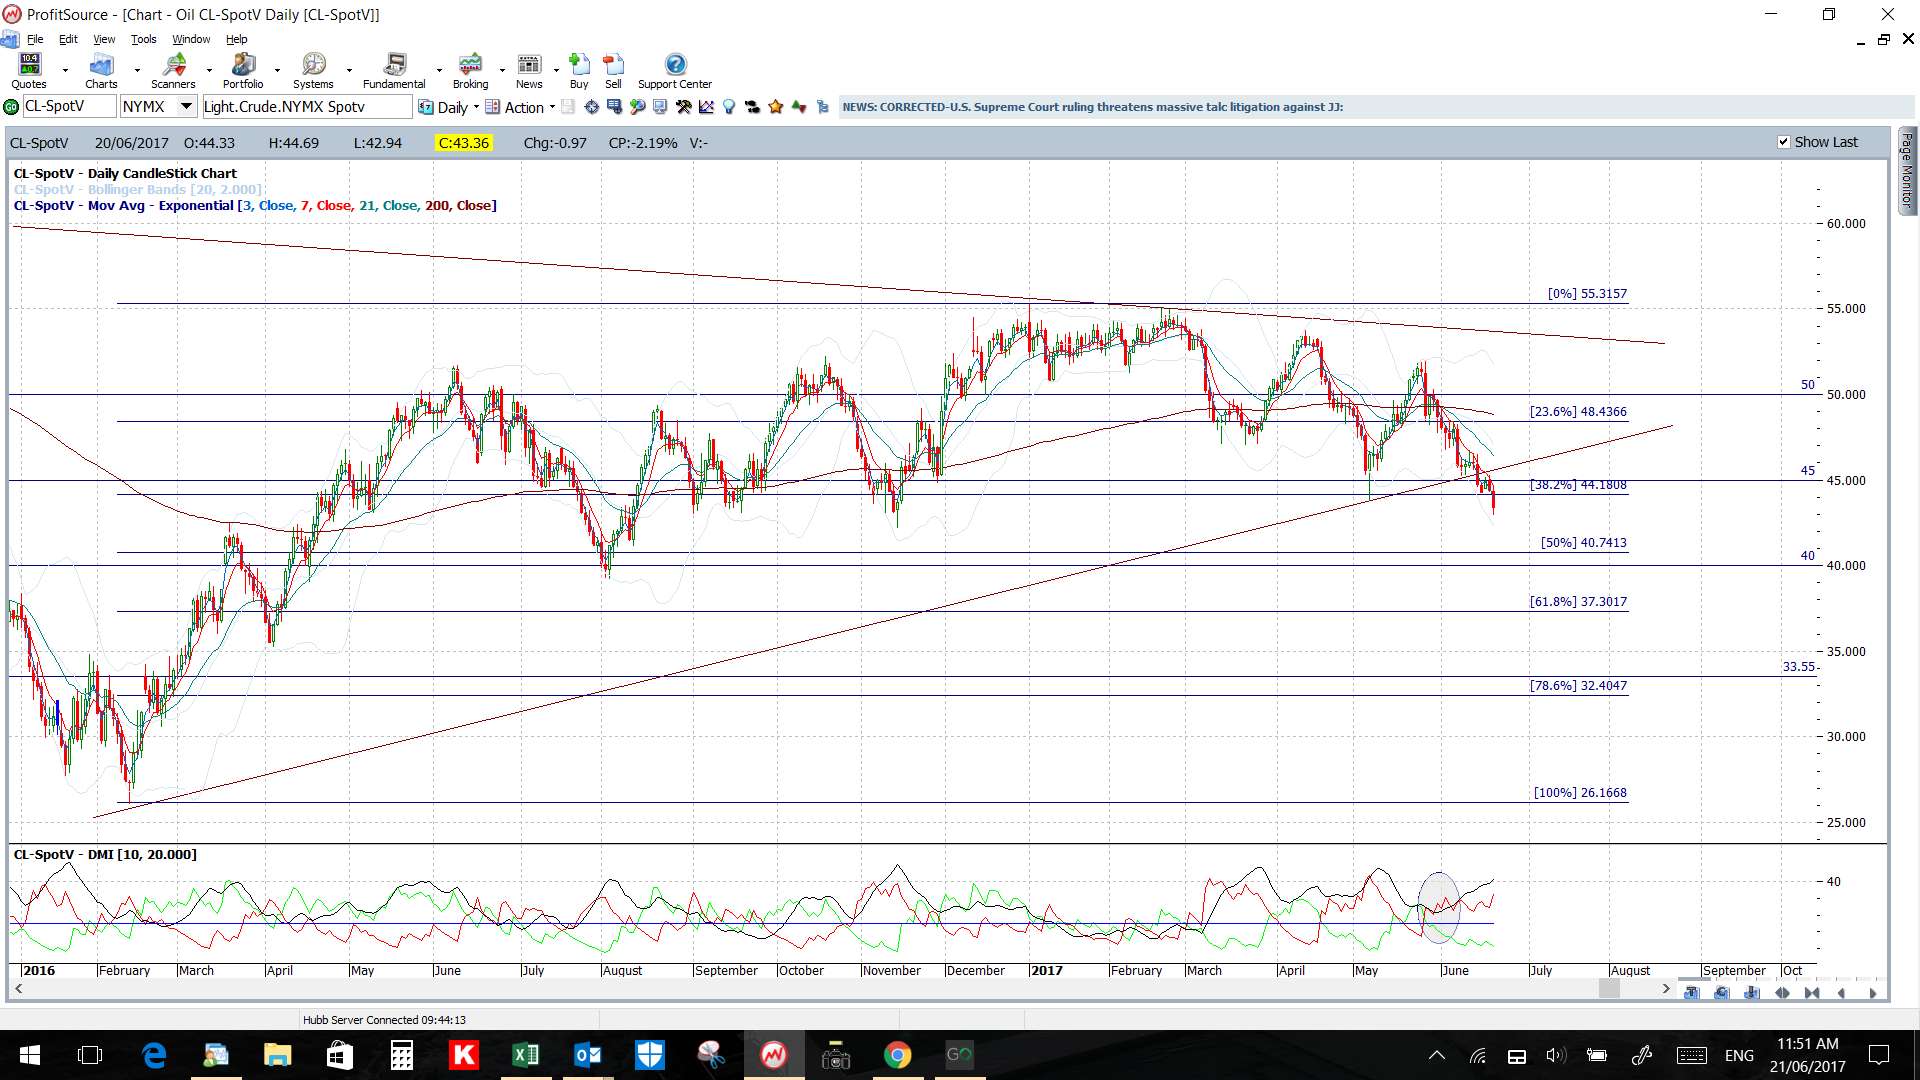
A 16-month support trend line was broken recently and Crude has remained under pressure from supply concern. In this post I nominate the technical levels I think are worth watching given tonight’s Us Crude Inventory data.
Oil daily: a 16-month support trend line remains broken. Watch for any test of the daily chart’s 50% fib level; near $40. Note that price action, technically speaking, remains in an uptrend until the 61.8% fib is broken; this is near $37.
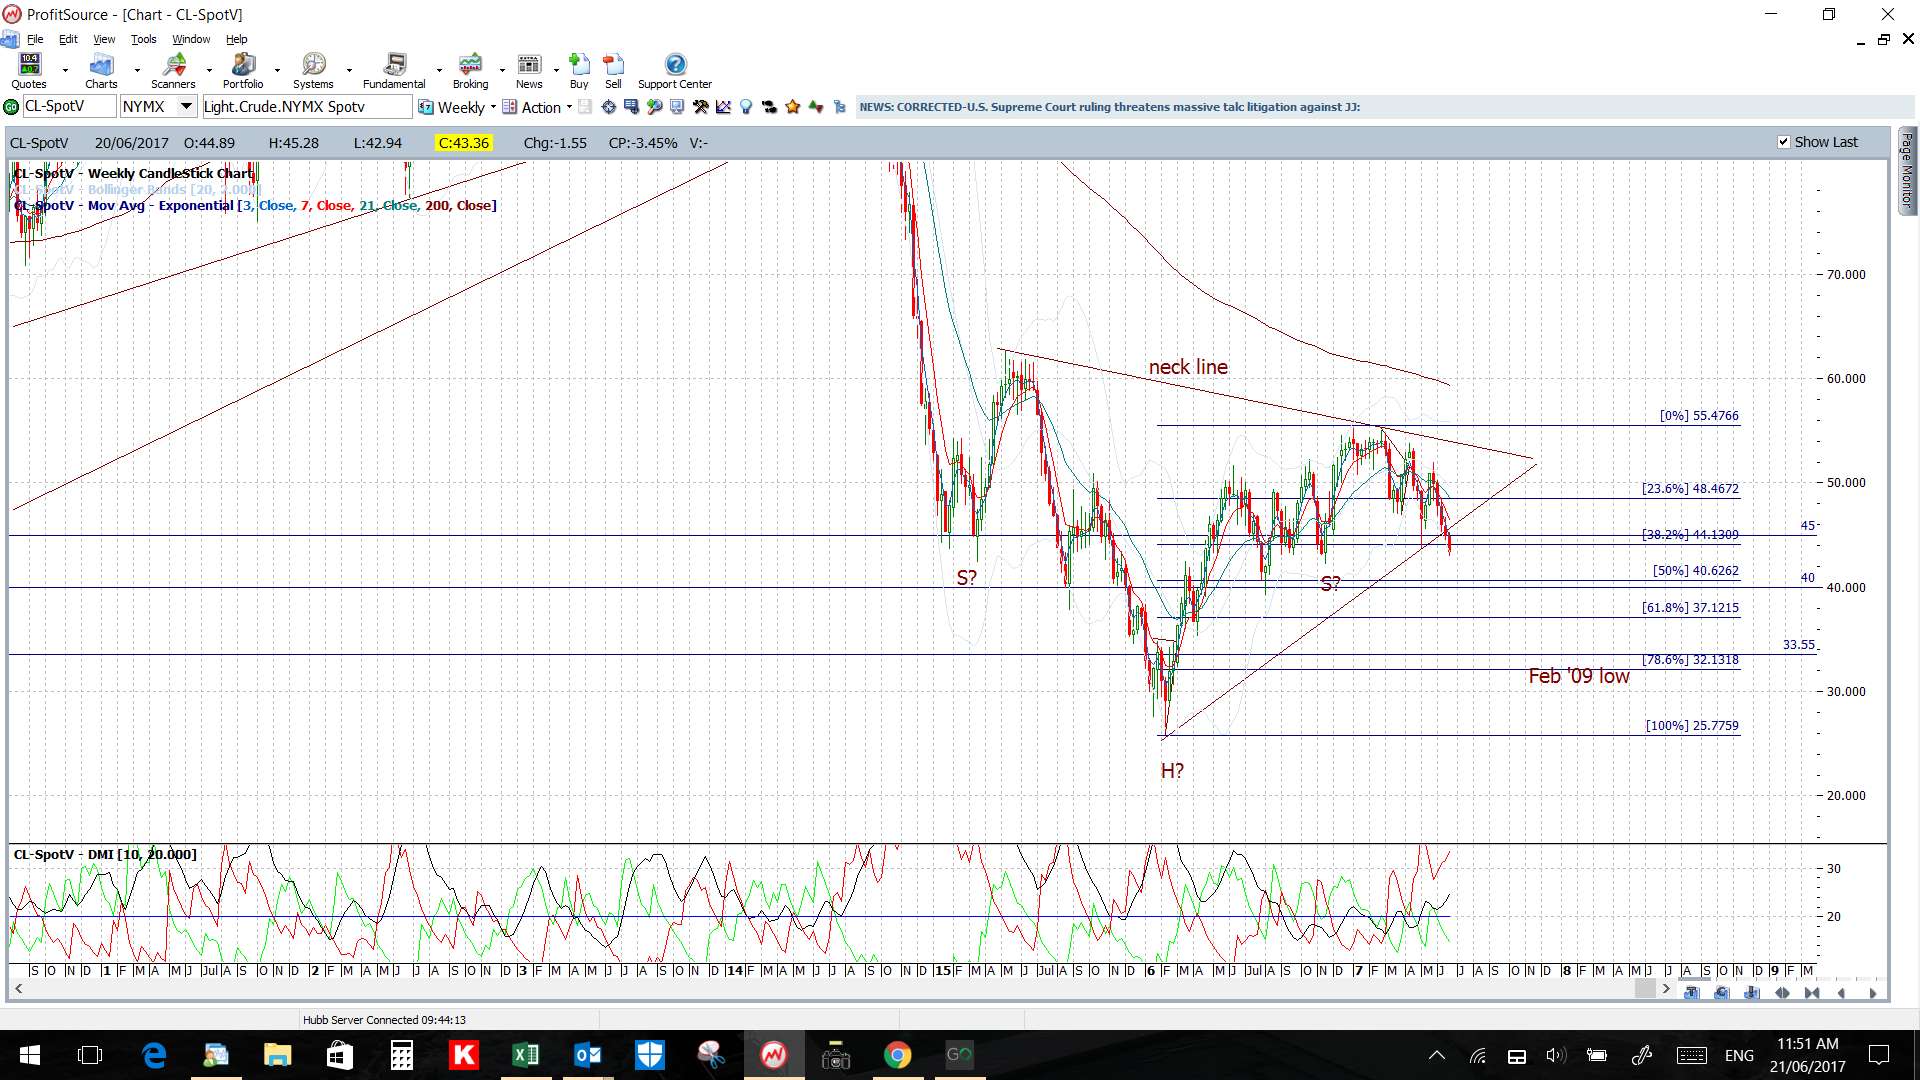
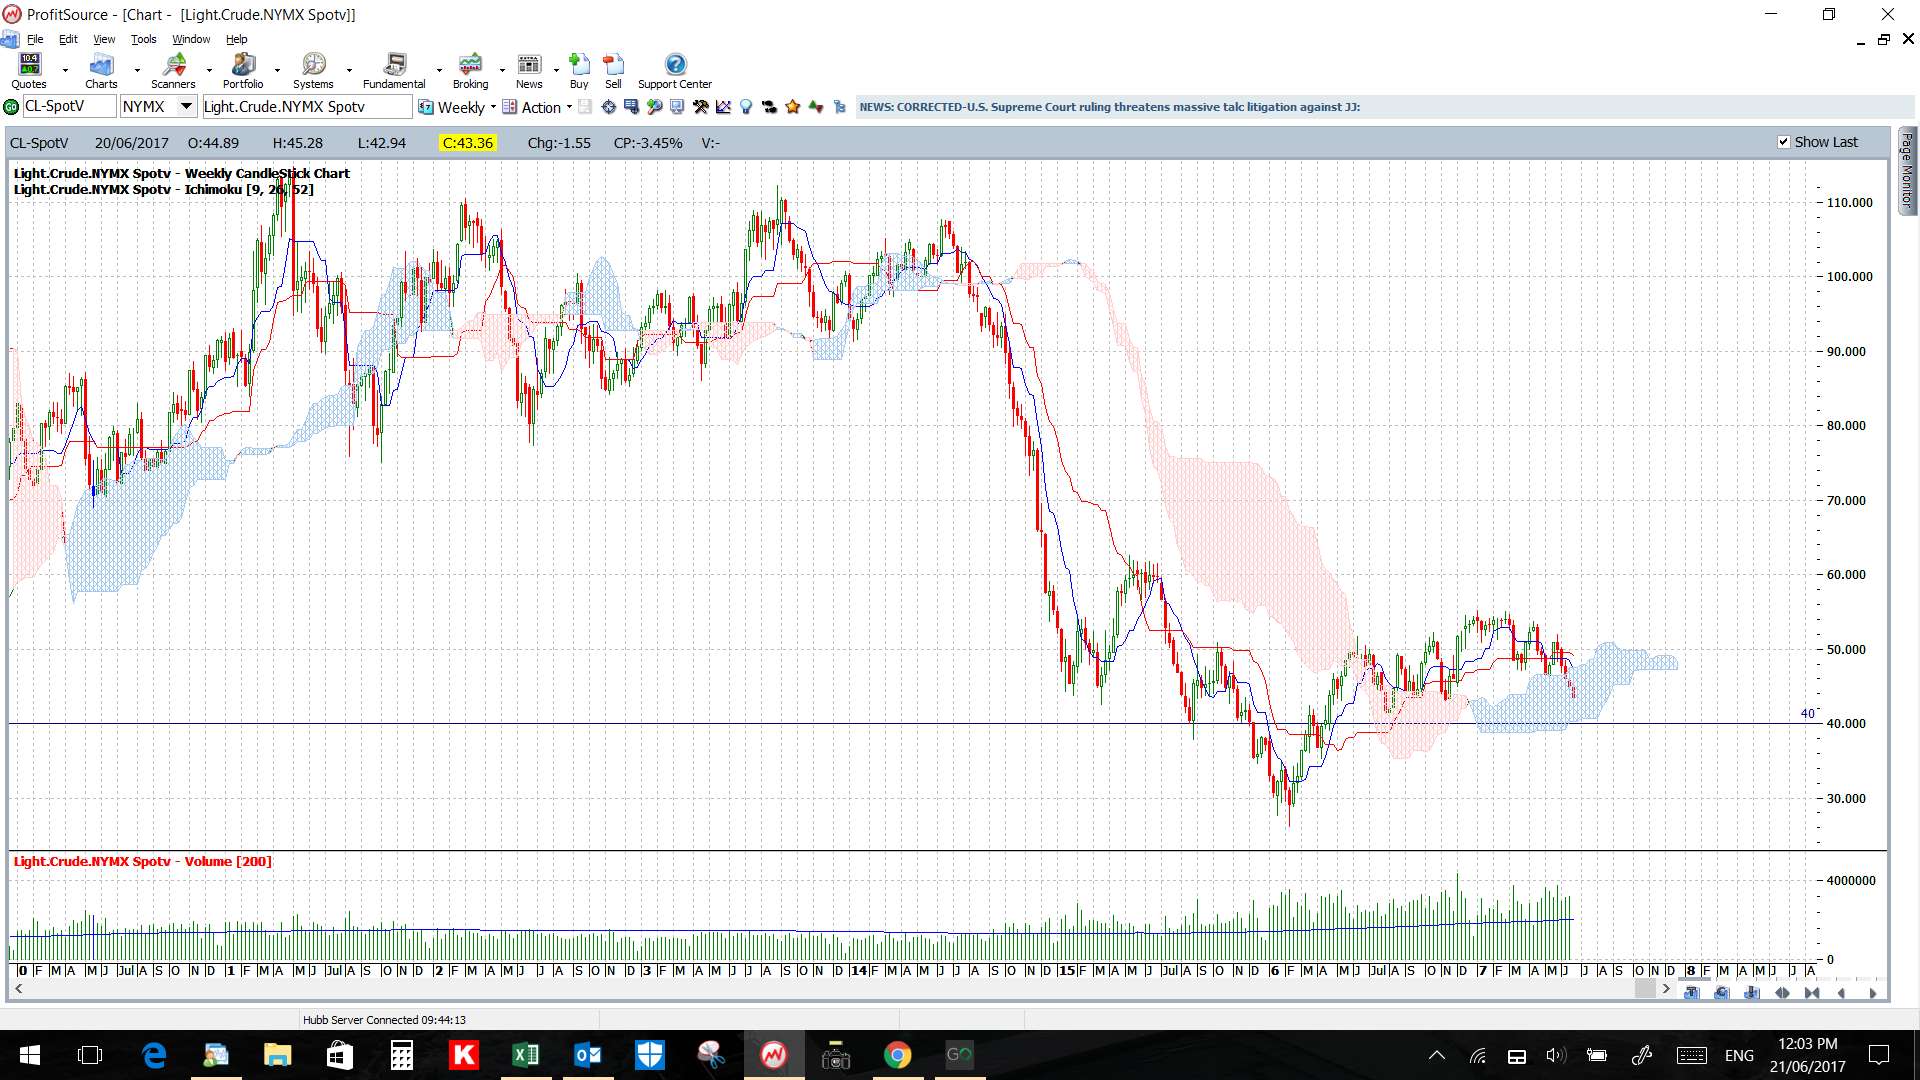
 Oil weekly: the weekly chart shows this $40 region as rather significant and so I would not be surprised to see price action test this major S/R level. It’s of no surprise also to see Cloud support from the base of the weekly Cloud kick in near $40 as well!
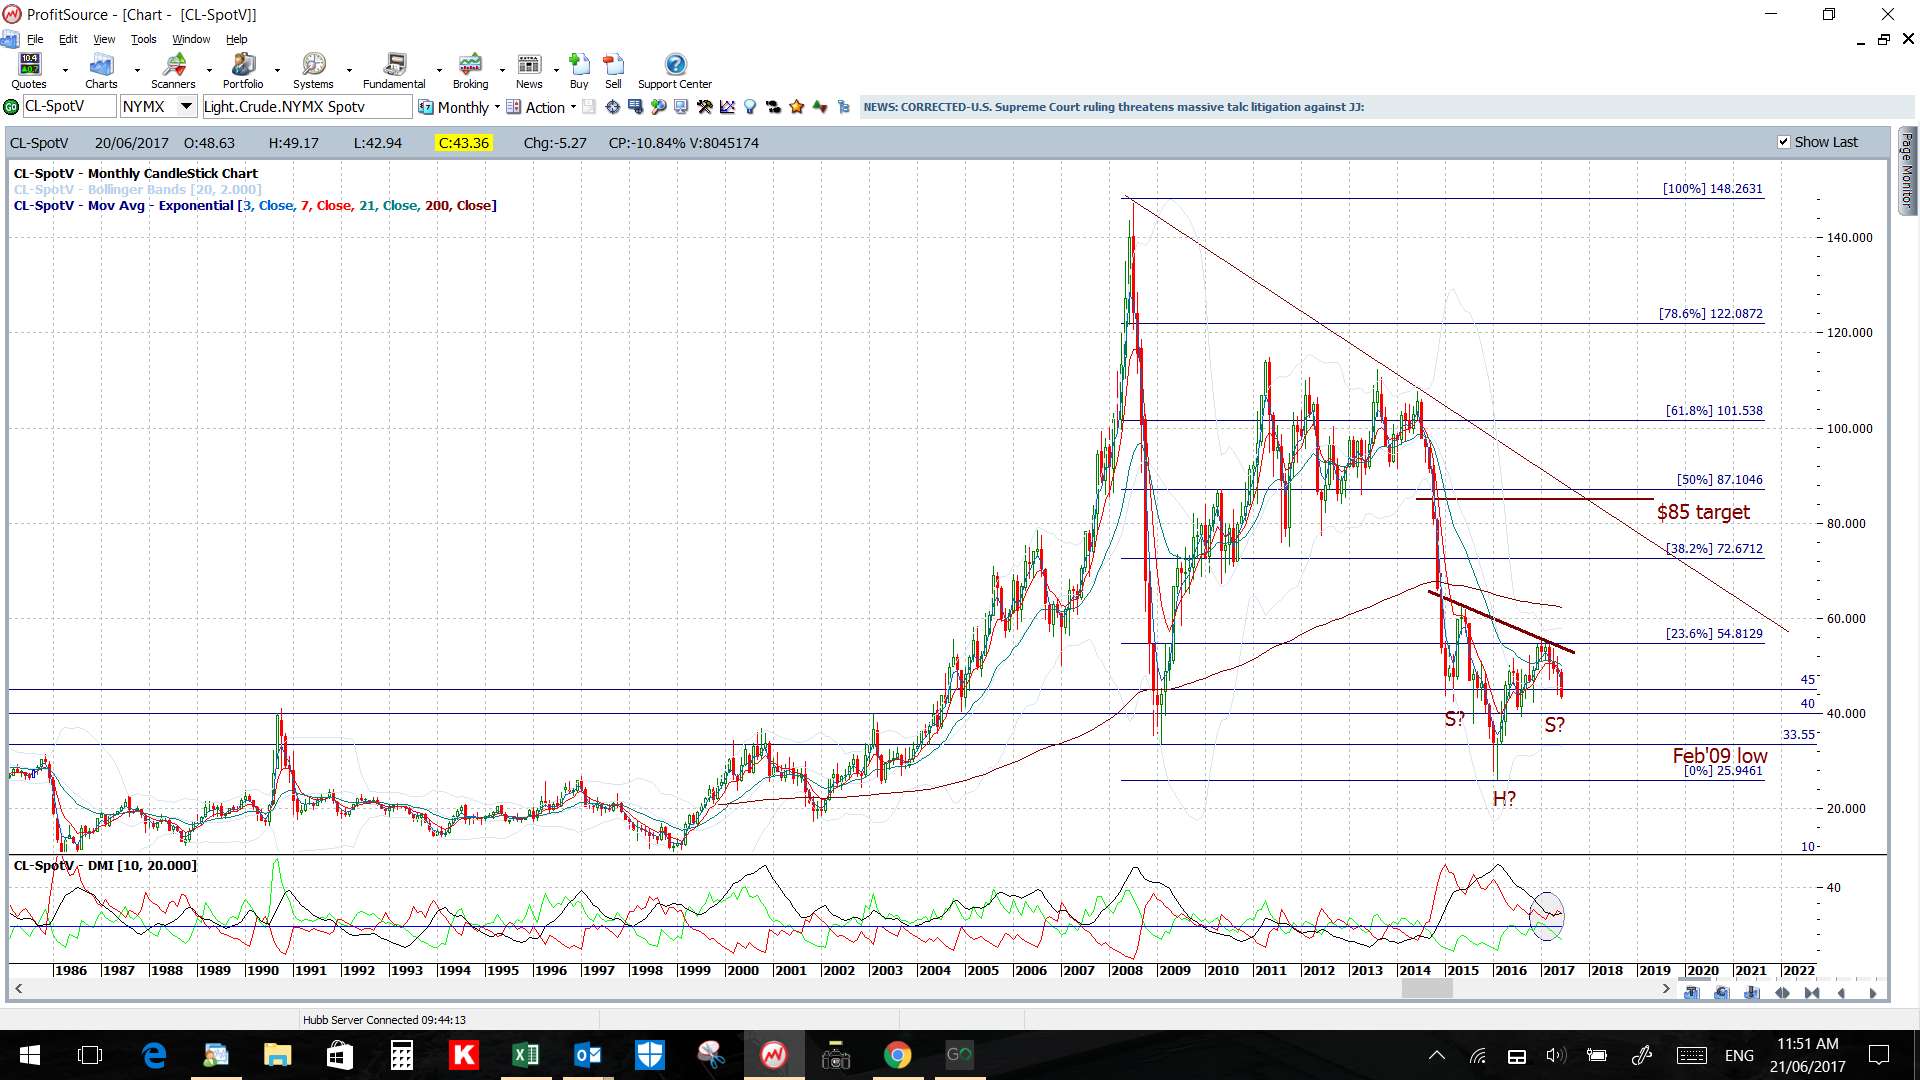
Oil monthly: any pullback to the $40 level would help to shape up the ‘Right Shoulder’ of the monthly chart’s lop-sided ‘Inverse H&S’ pattern that I’ve had in play for some time now. Confluence!
Summary: watch for any test of the daily/weekly chart’s 50% fib, near $40, and then the 61.8% fib, near $37. Price action remains in a technical uptrend until the 61.8% fib ($37) level is broken.