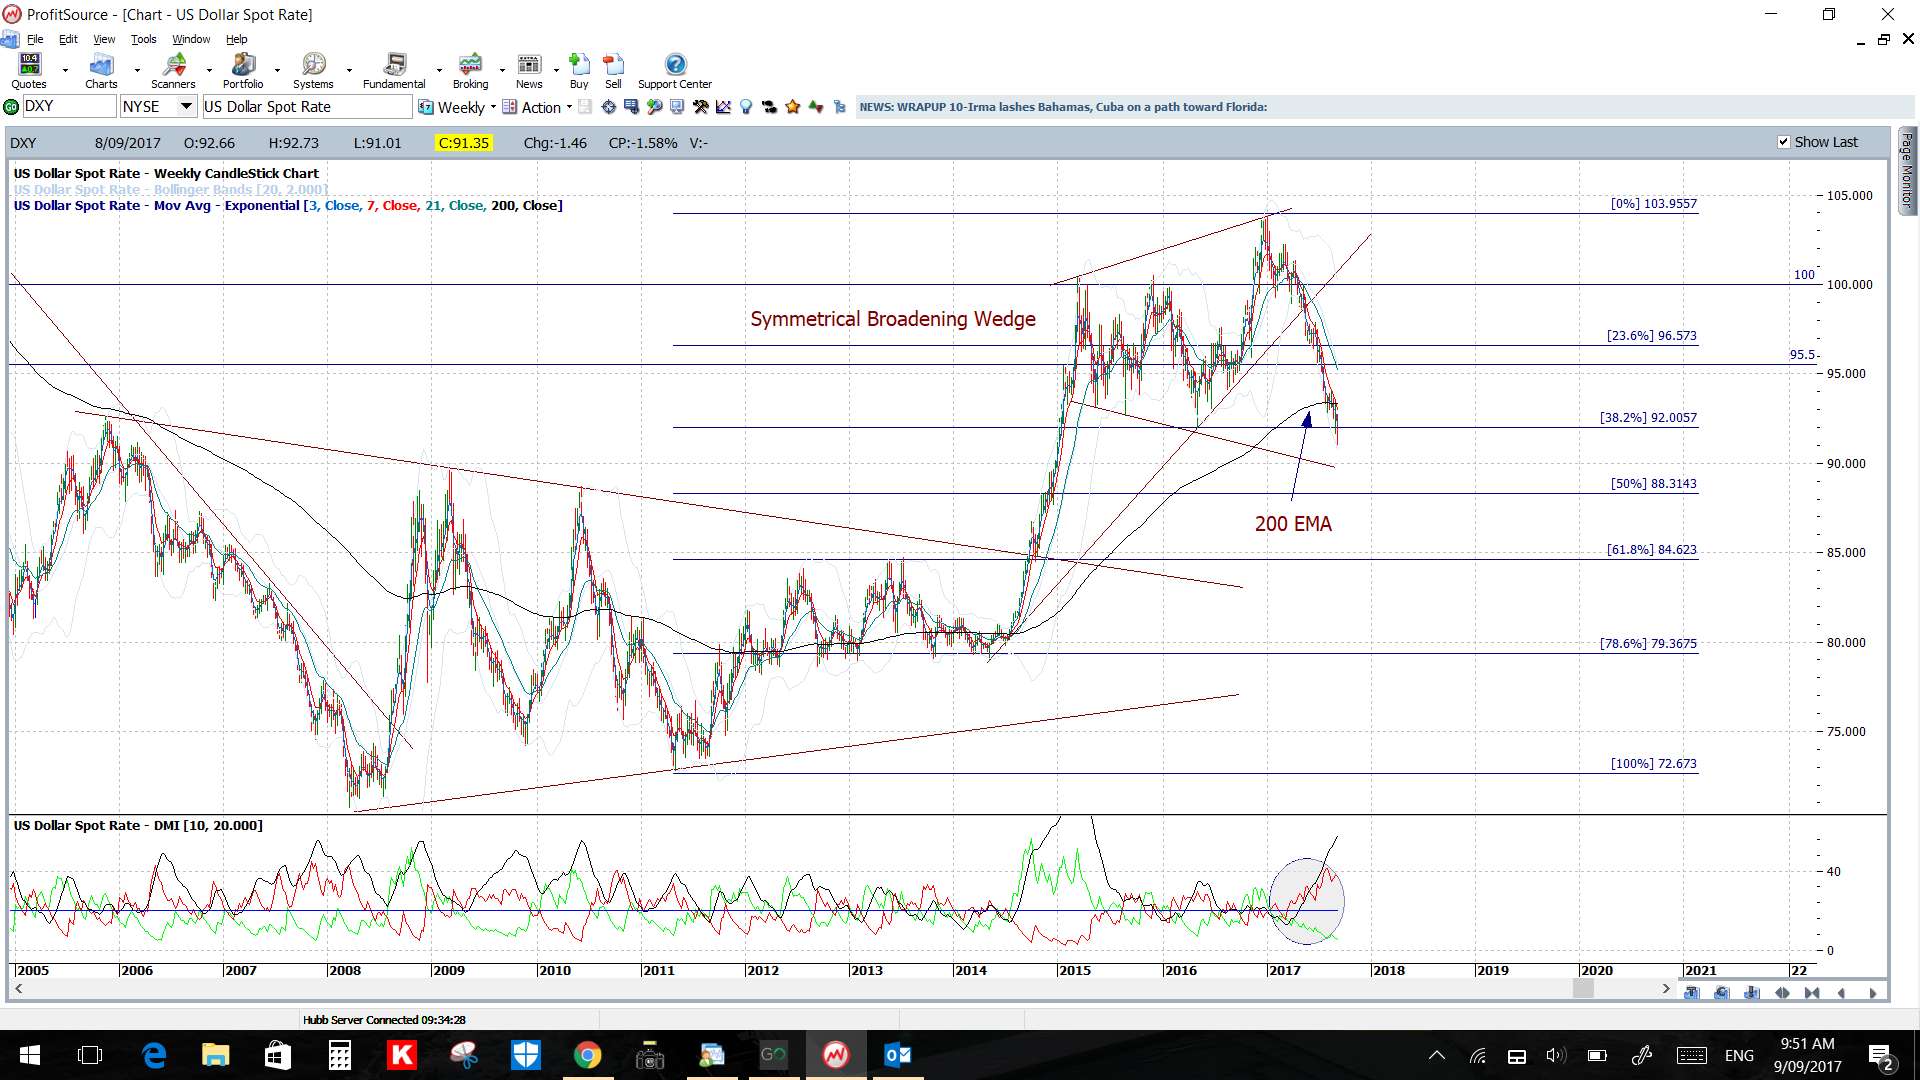
The US$ has closed lower for the week and I am still watching for any test of key fib levels: the 50% near 88 and then the 61.8% near 84.5.
NB: I am away this w/e and struggling with the local conditions; see below. My next w/e update might be delayed!
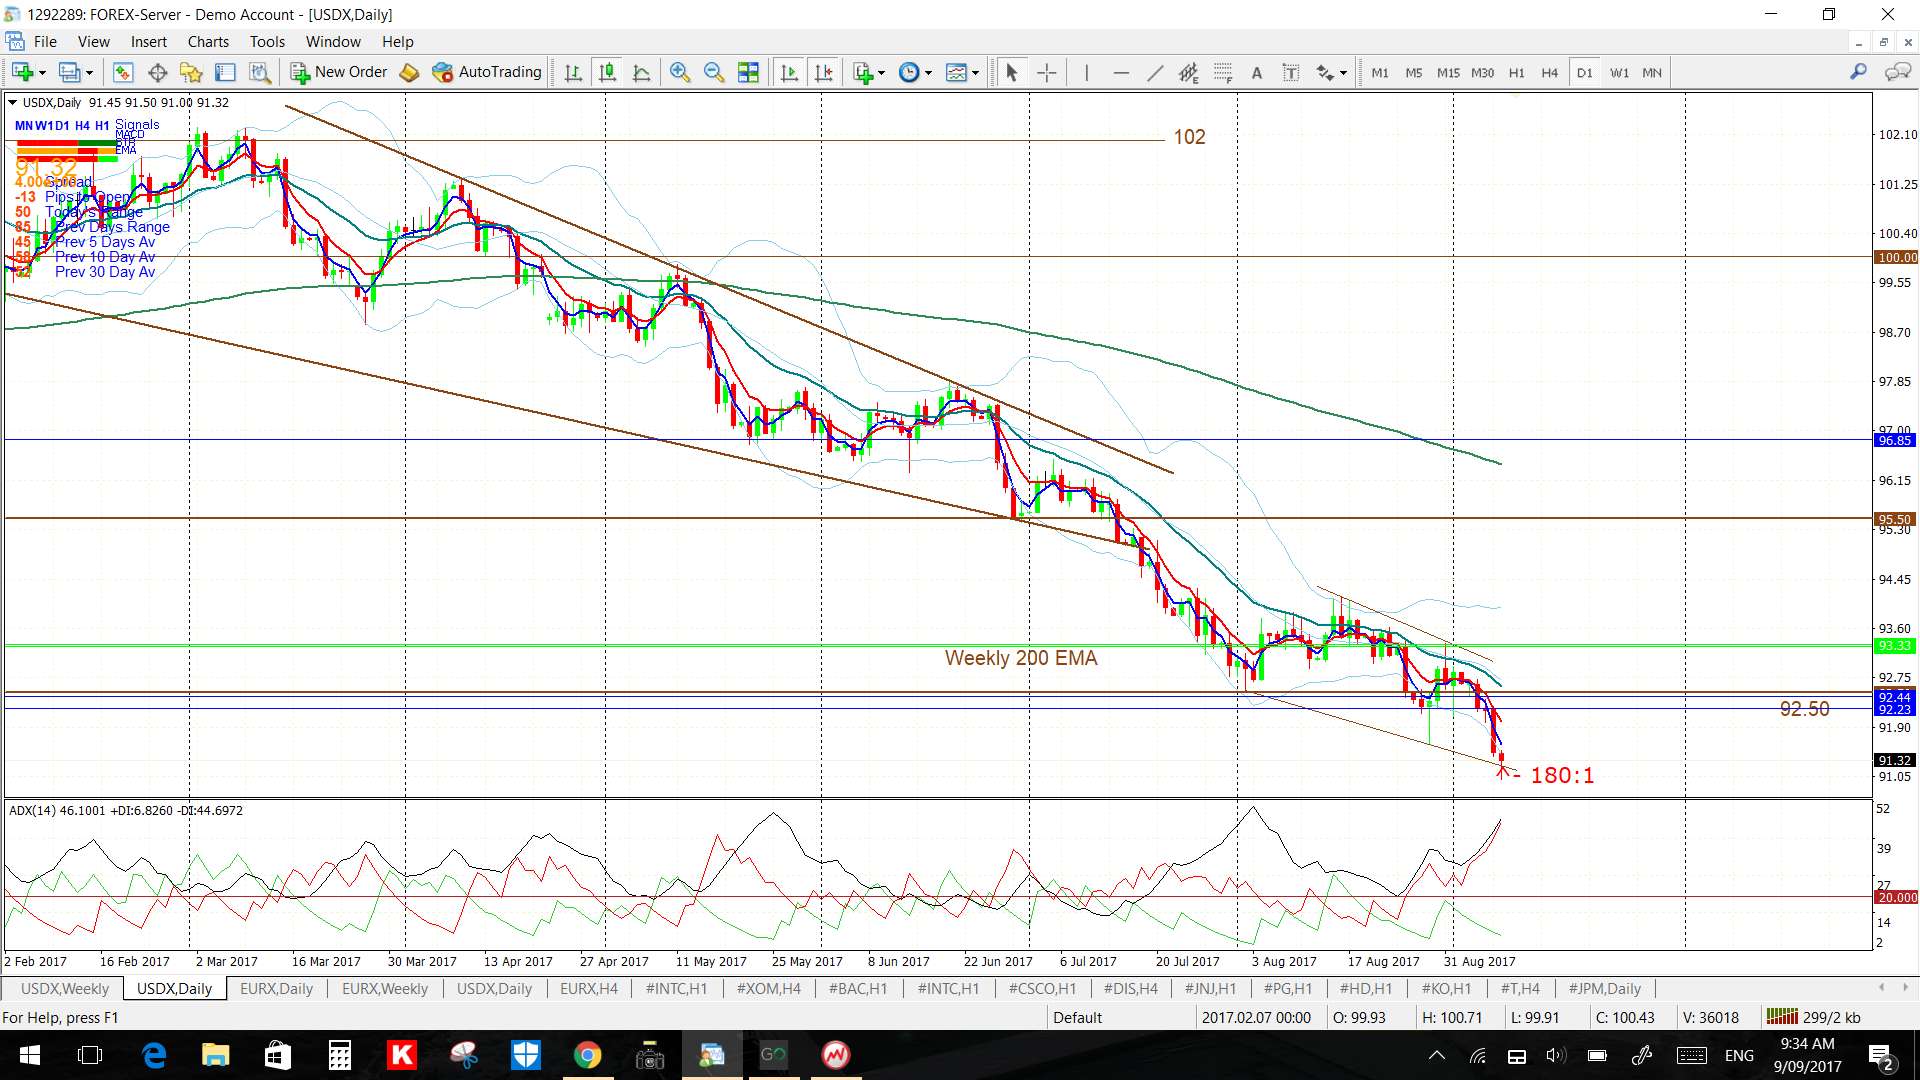
USDX: the index printed a bearish candle for the week and has closed below 92.50 but remains in a daily Flag, of sorts.
Recall: the US$ longer-term uptrend remains intact until such time as it breaks and holds below the 61.8% fib of the 2014-2016 weekly swing high and this level is down near 84.50.
Also, keep note of the fact that the Fibonacci retracement on the weekly swing low move, since the start of 2017, still has the 61.8% fib level up near the previous S/R level of 100. I will be watching this 100 level if there is any recovery move.
Keep watch of the following levels in coming sessions:
- the weekly 200 EMA.
- the S/R level of 92.50.
- the daily chart’s Flag trend lines.
- the bottom trend line of the symmetrical wedge pattern.
- the longer-term weekly swing high 50% Fibonacci level; down near 88.
- the longer-term weekly swing high 61.8% Fibonacci level; down near 84.50.
- the recent weekly swing low 61.8% Fibonacci level, up near 100; if there is any recovery move.


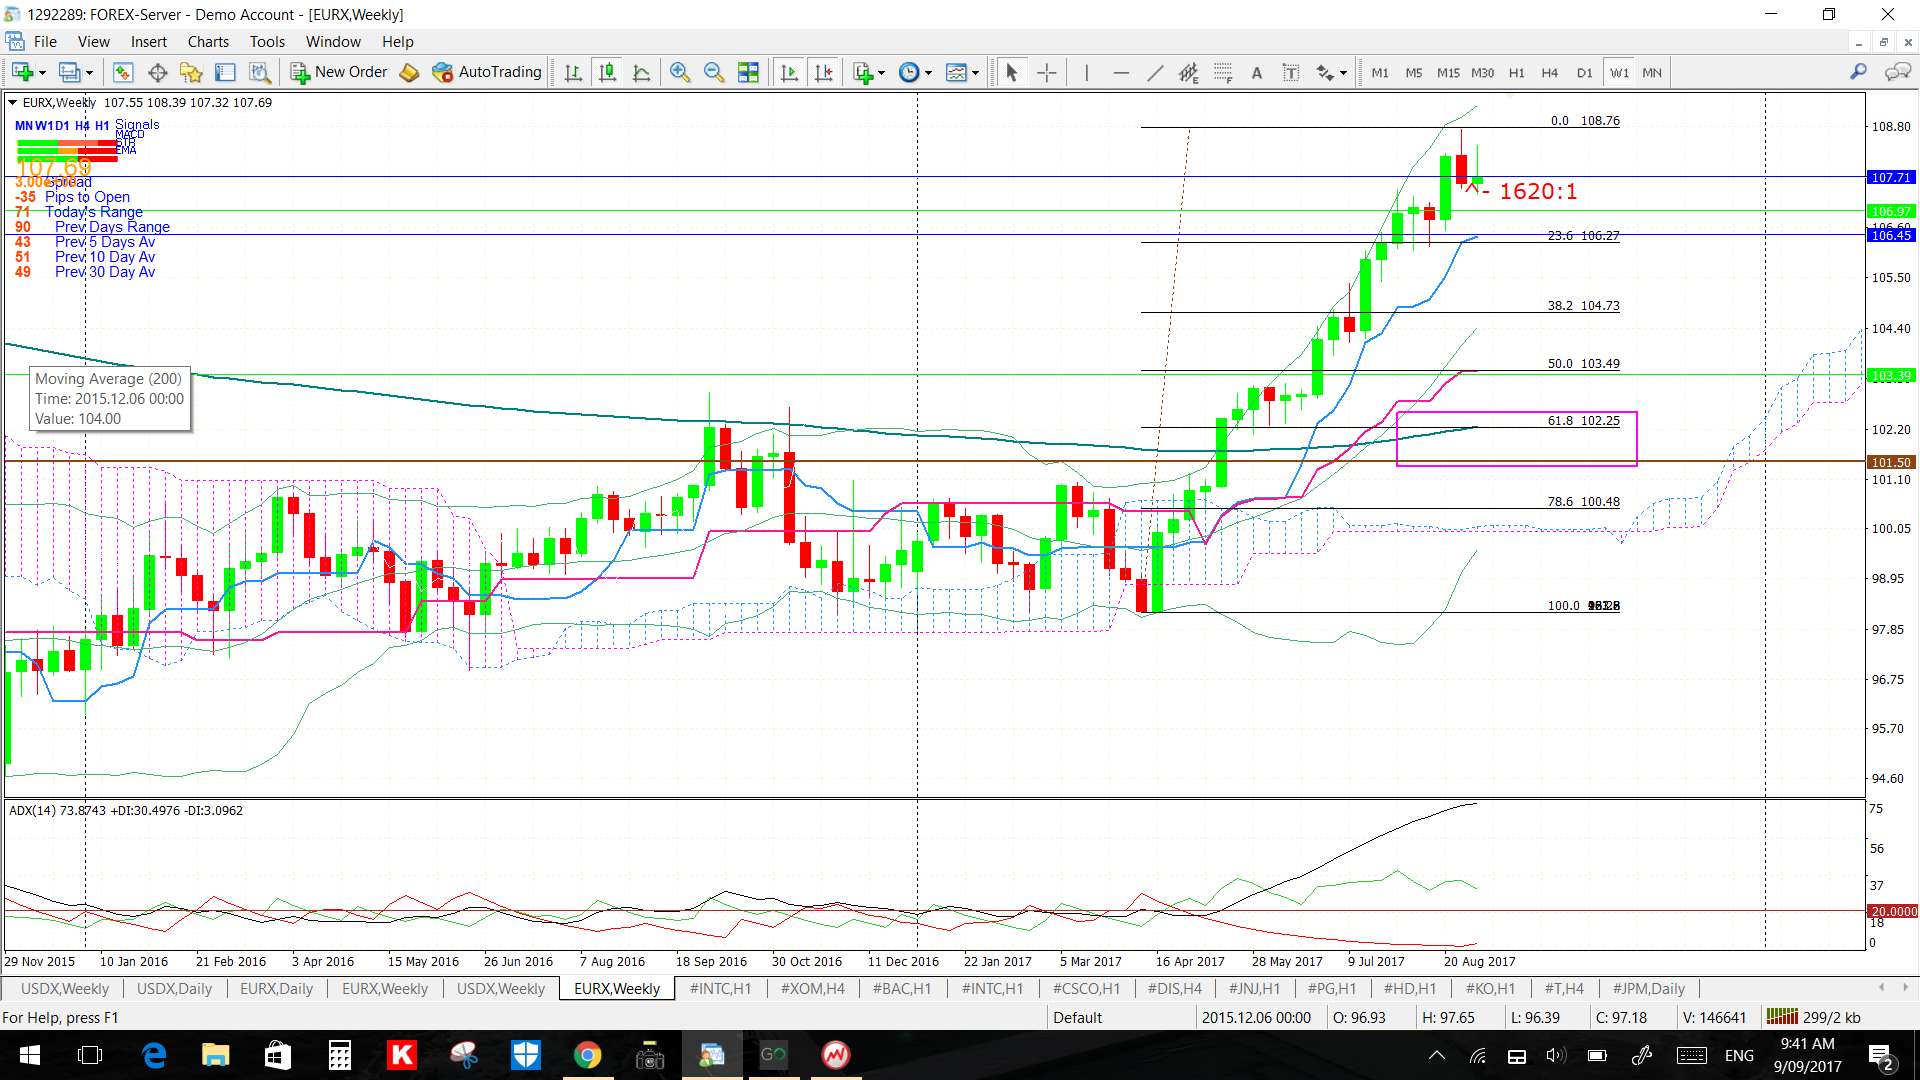
EURX weekly: The EURX has printed a bullish coloured Spinning Top candle reflecting some indecision after this long bullish run.
Recall: This index has been in a long uptrend and a pause or pullback would not be out of order here, even if there is to be a longer-term recovery move. I note the 61.8% fib of this recent swing high move is down near previous S/R around 101.5 and the weekly 200 EMA and this would be in focus if there is any correction move to the downside:

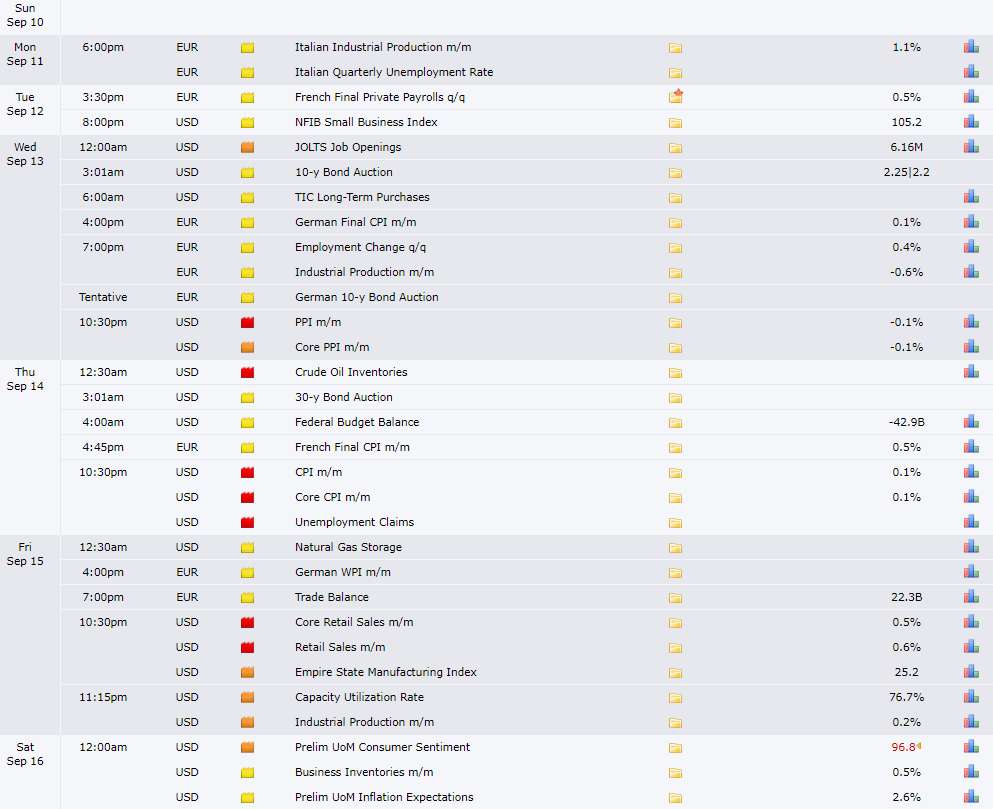
Calendar: there isn’t any high impact EUR data but there is USD CPI, PPI and Retail Sales to monitor: