USDX
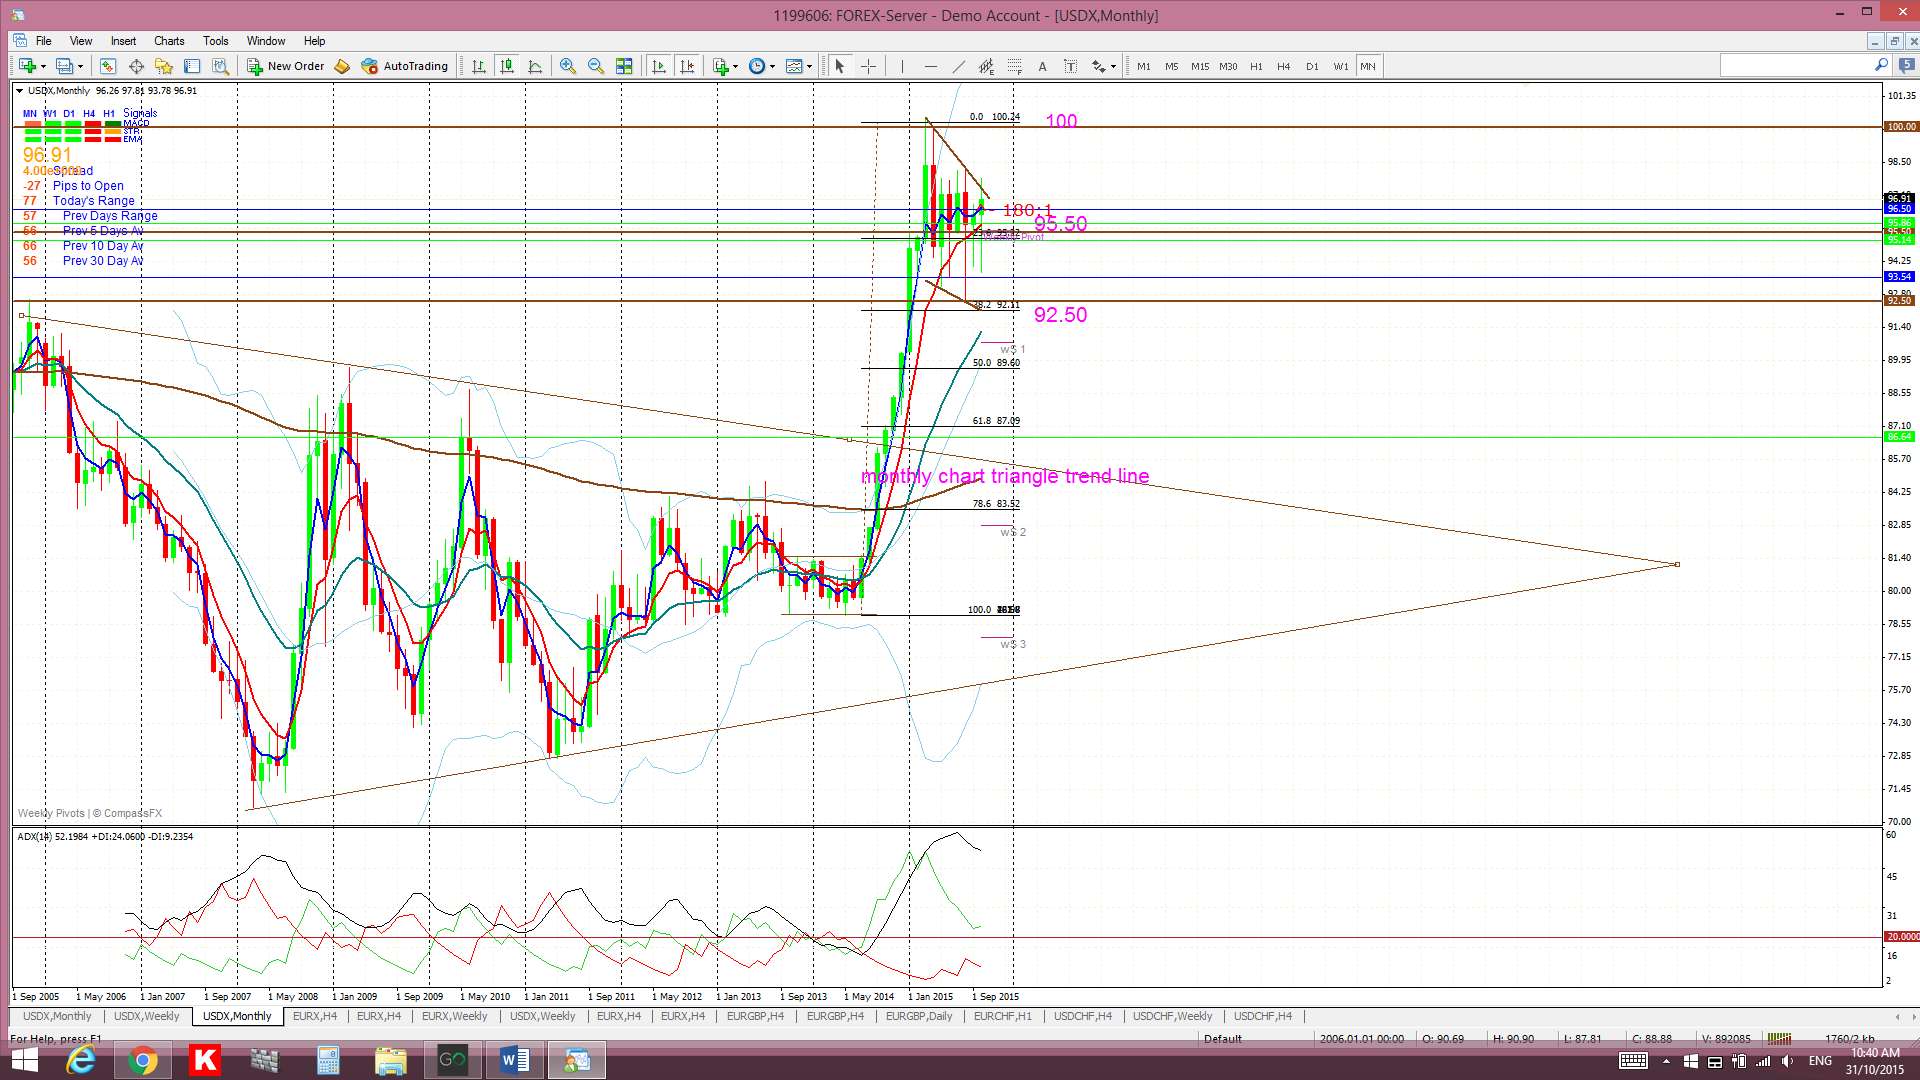
Monthly: The October candle closed as a small bullish candle with a long lower shadow but still under the key 100 level.
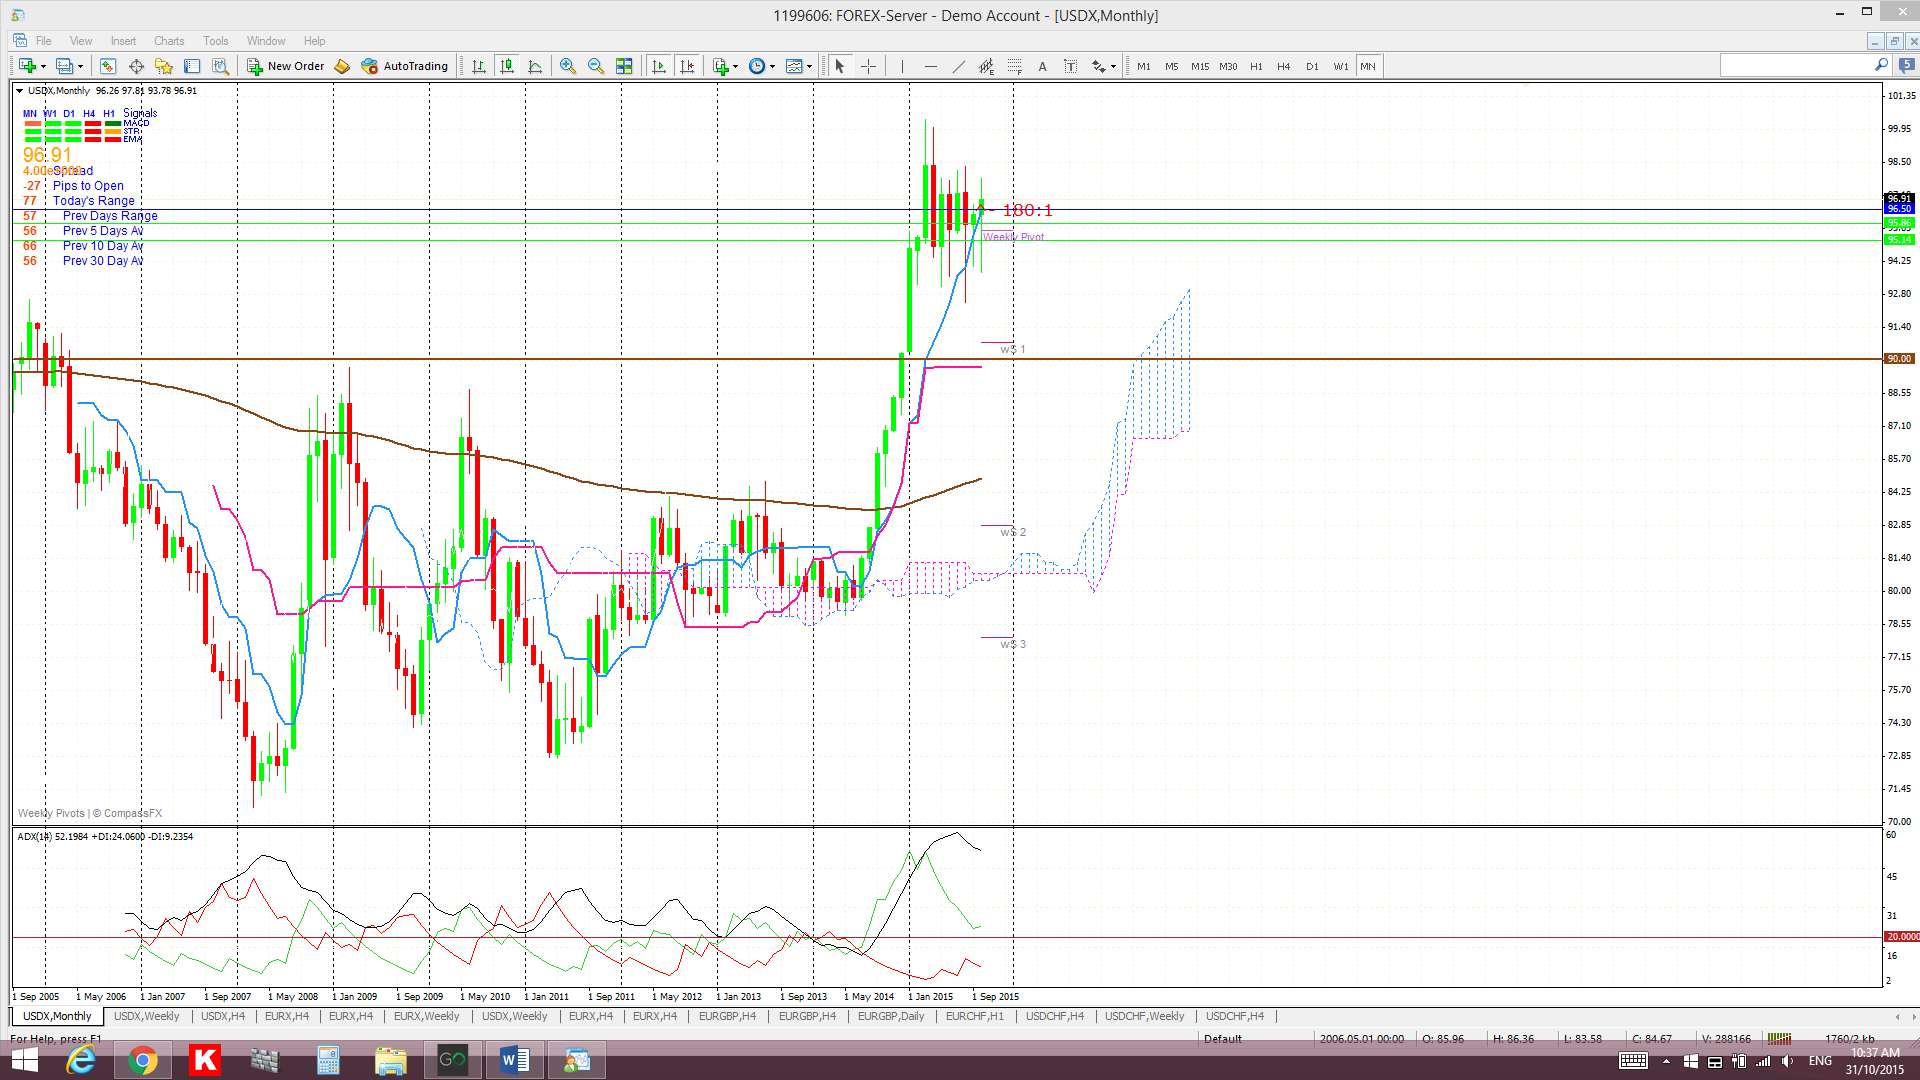
Monthly Ichimoku: The October candle closed above the Cloud.
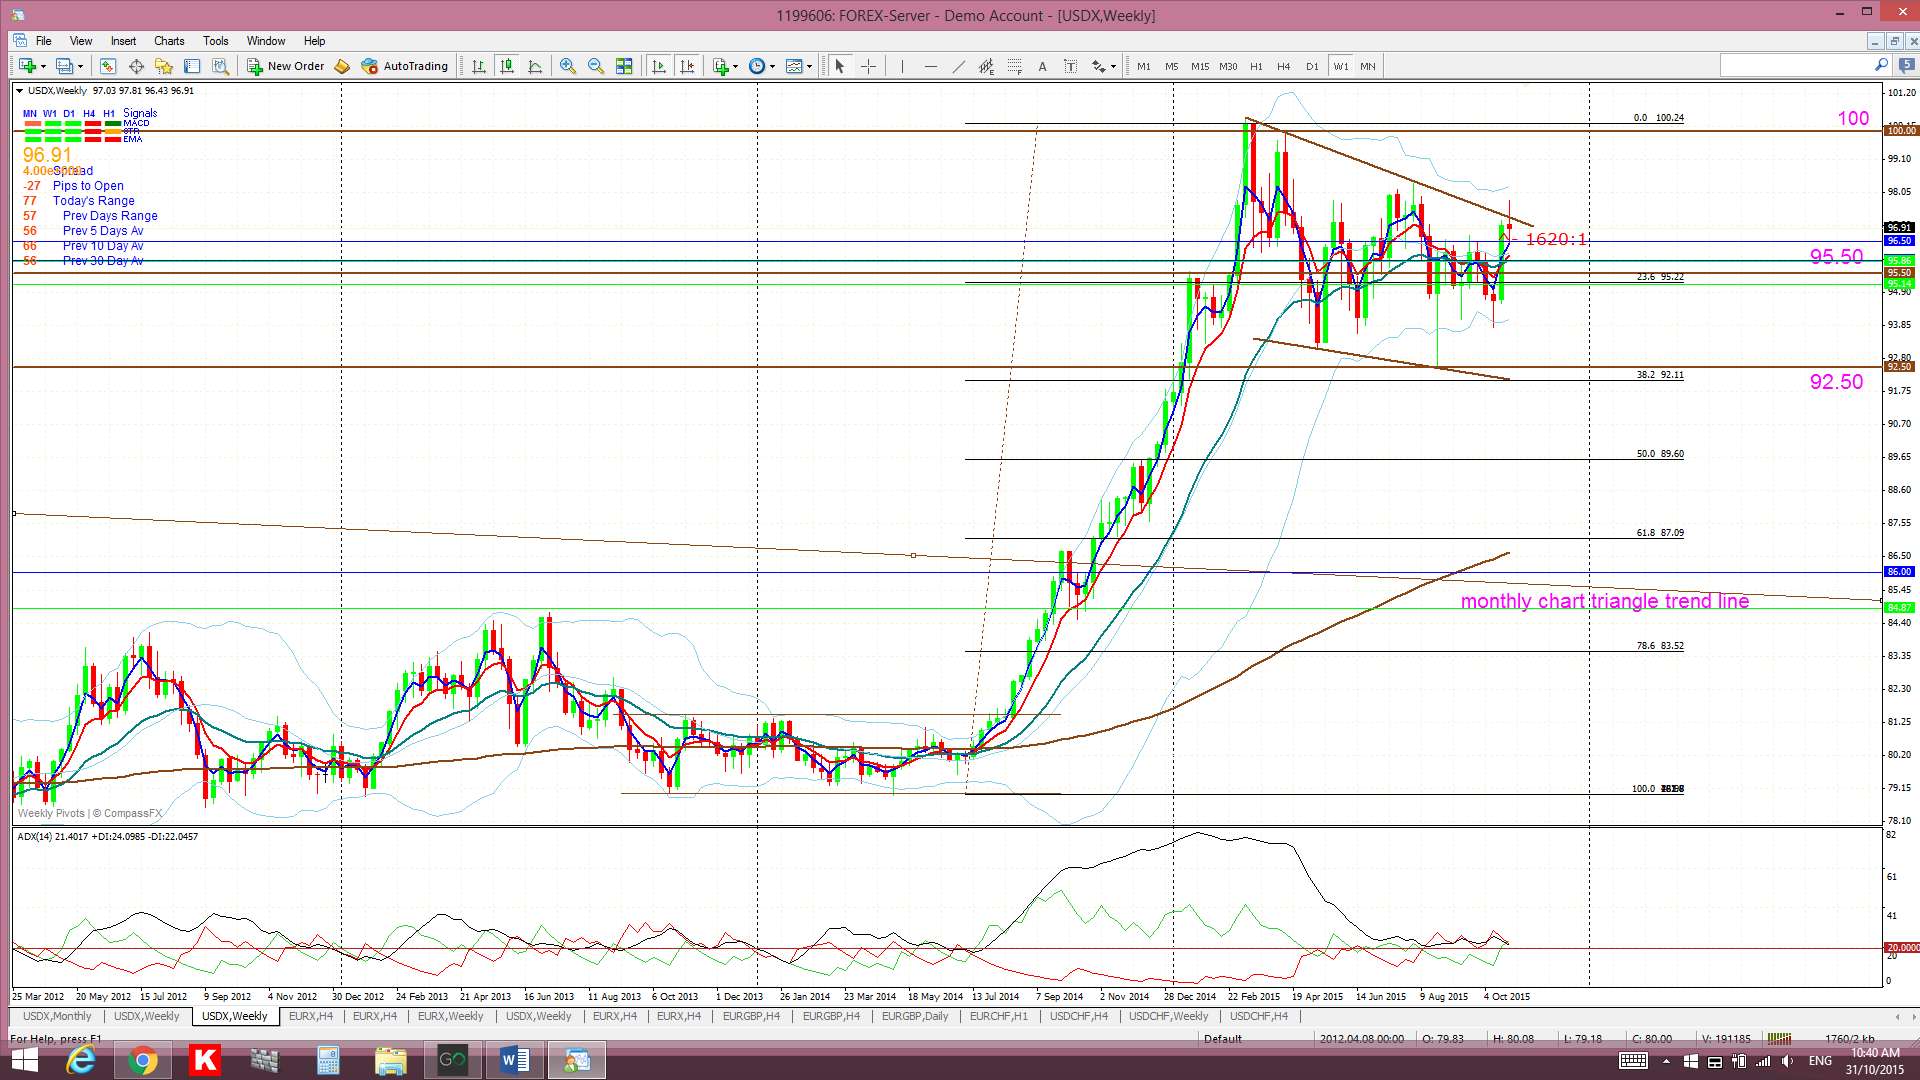
Weekly: Last week’s candle closed as a bearish coloured ‘Spinning Top’ candle but back within the long-term Flag pattern. Any bullish continuation from here will bring the 100 level back into focus with some possible ‘Triple Top’ jitters. However, any bearish breakdown below 92.50 will bring the 61.8% fib level, down near 87, the weekly 200 EMA and the previously broken triangle trend line, into focus.
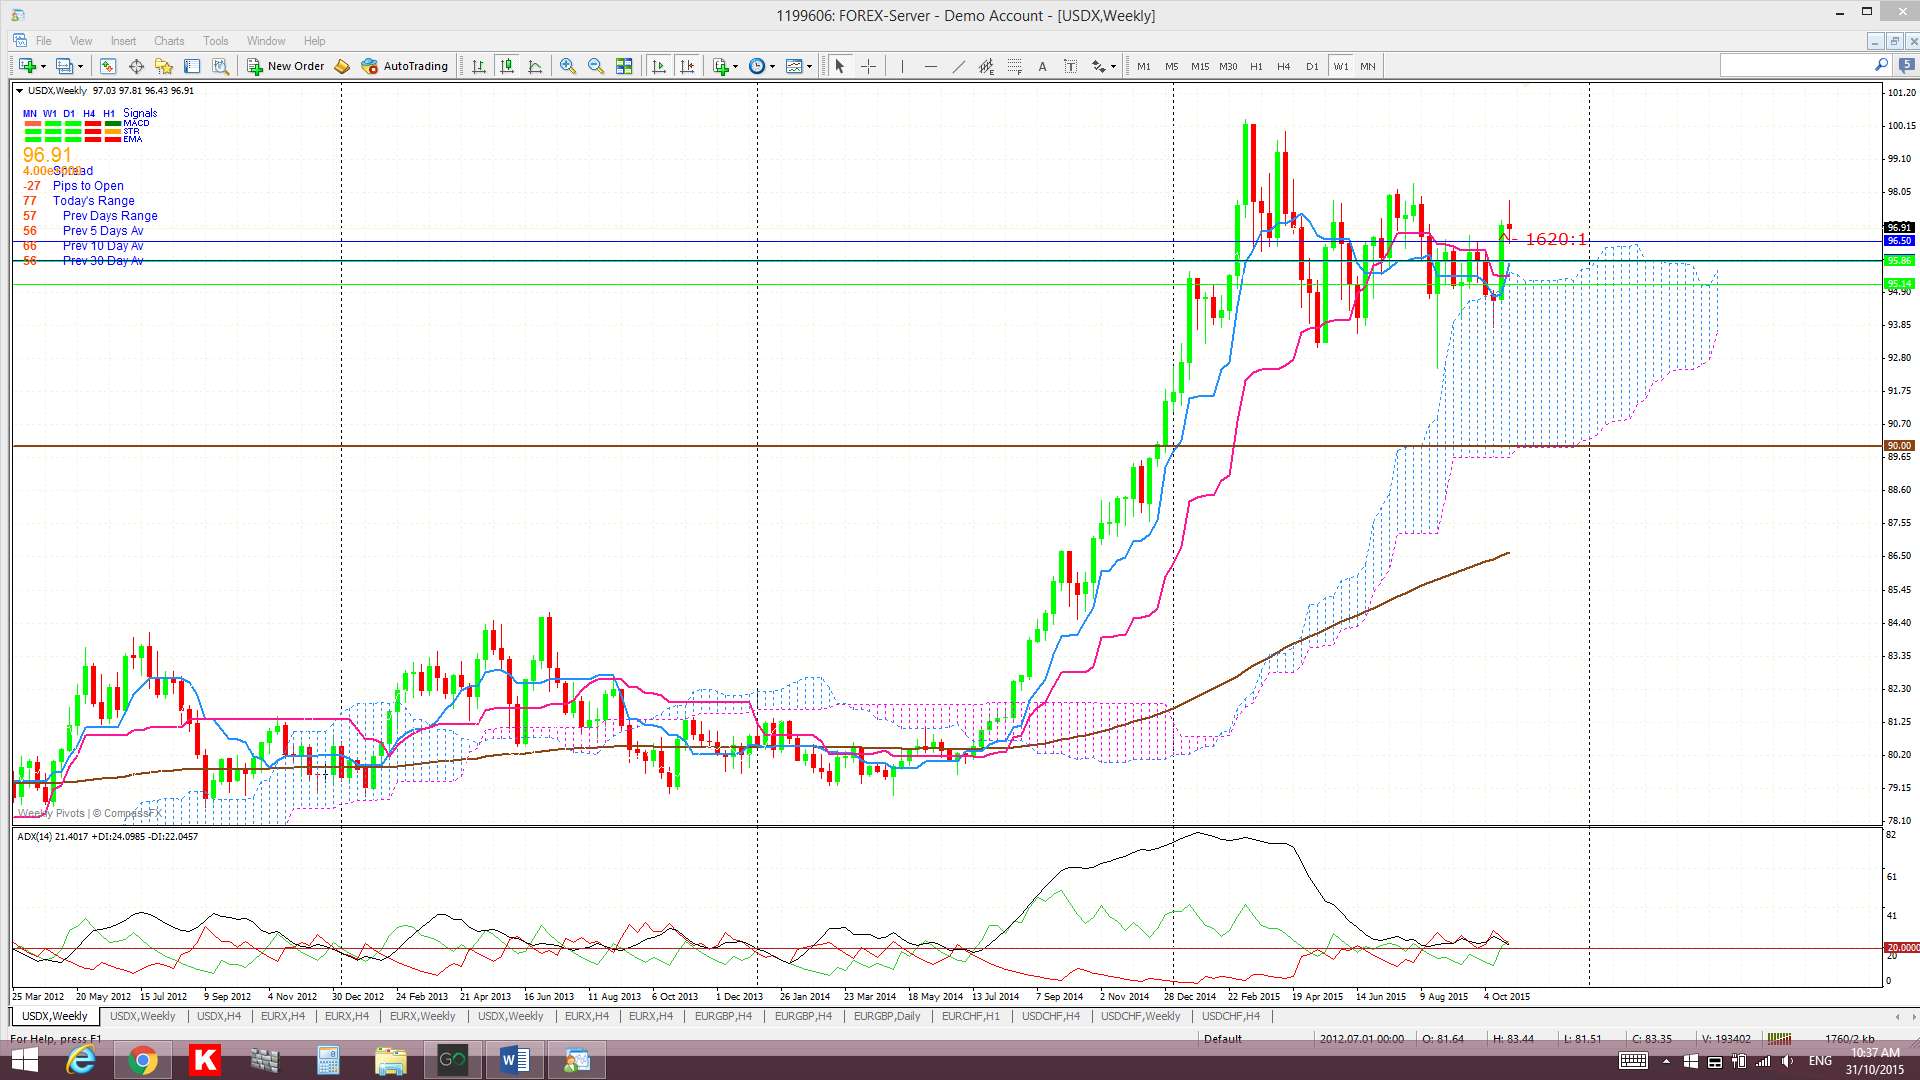
Weekly Ichimoku: The weekly candle closed above the weekly Cloud! Note that there looks to be a very new BULLISH Tenkan/Kijun cross so I will be keen to see if there is bullish momentum follow through. Next week’s NFP might determine the outcome here.
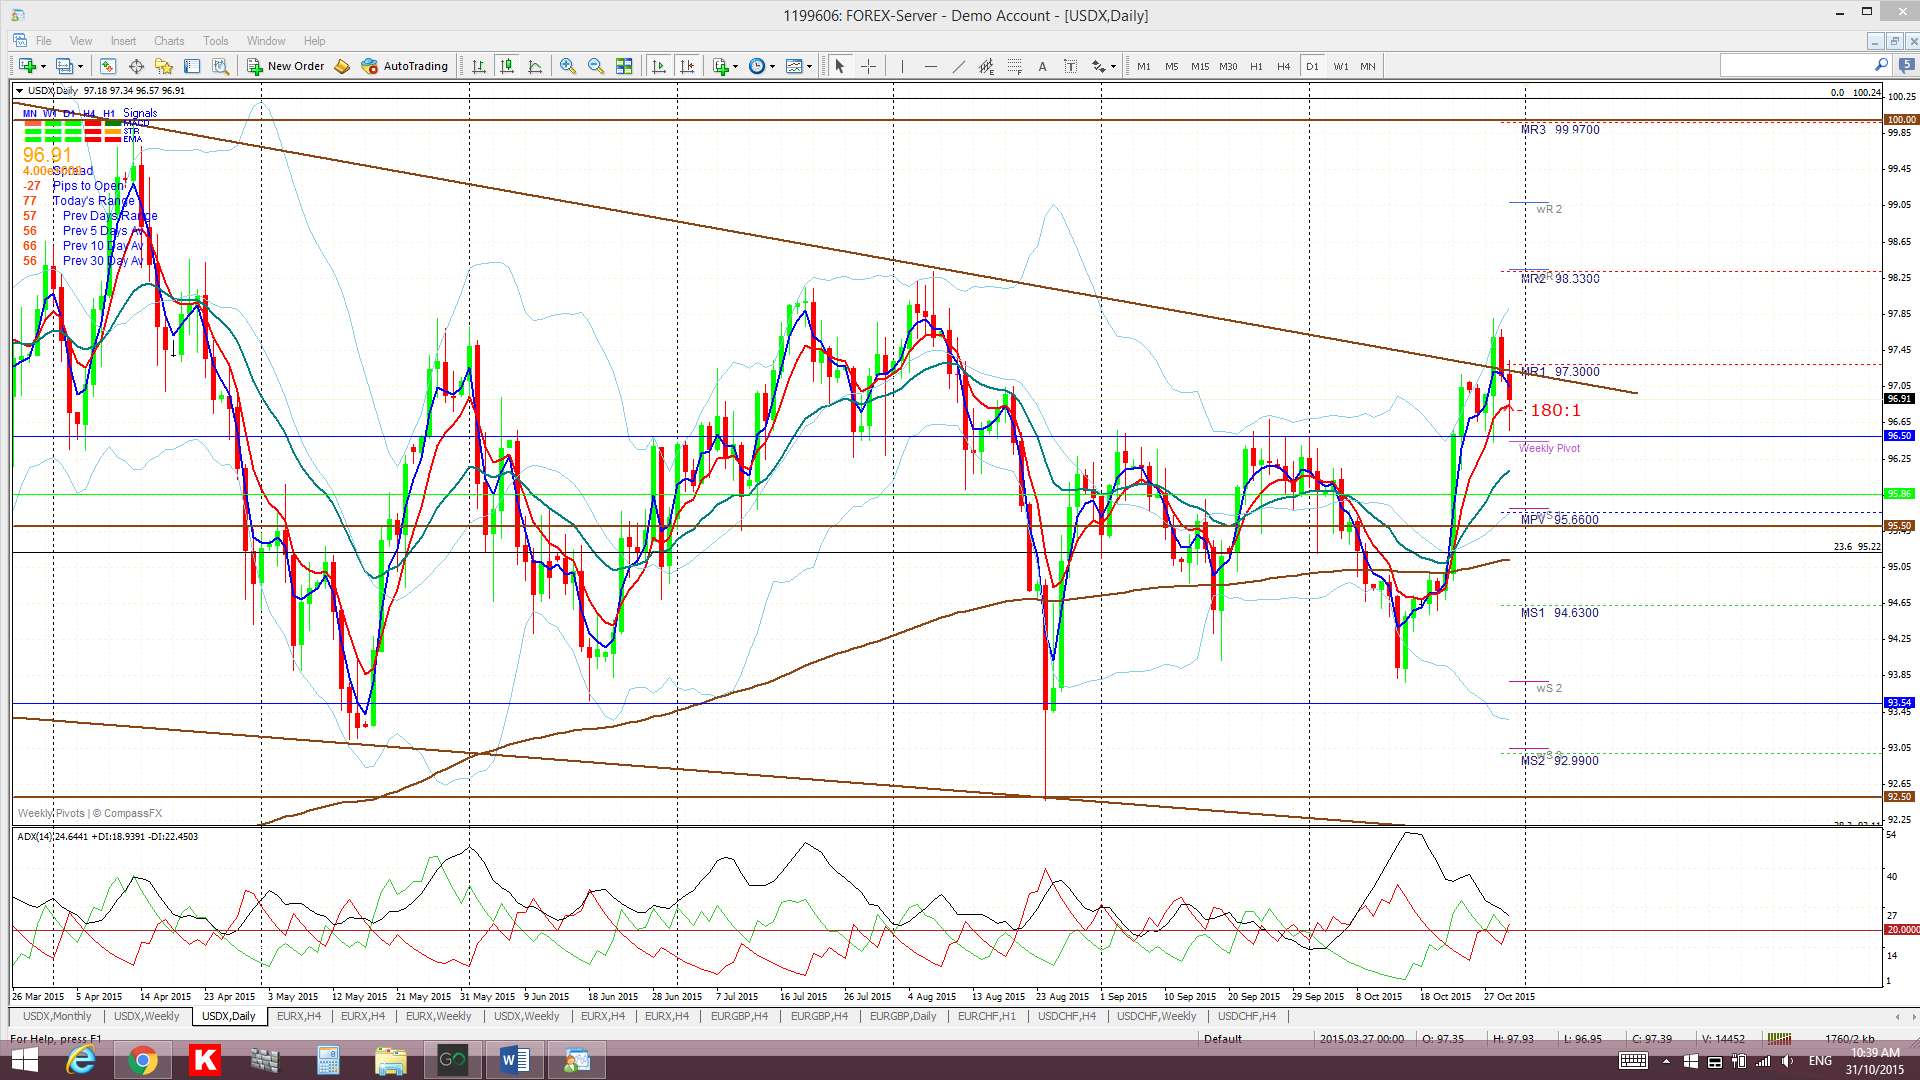
Daily: Price chopped higher with hawkish FOMC but weaker than expected data on Thursday and Friday resulted in bearish candles for those days. The 100 level remains as overall resistance above current price.
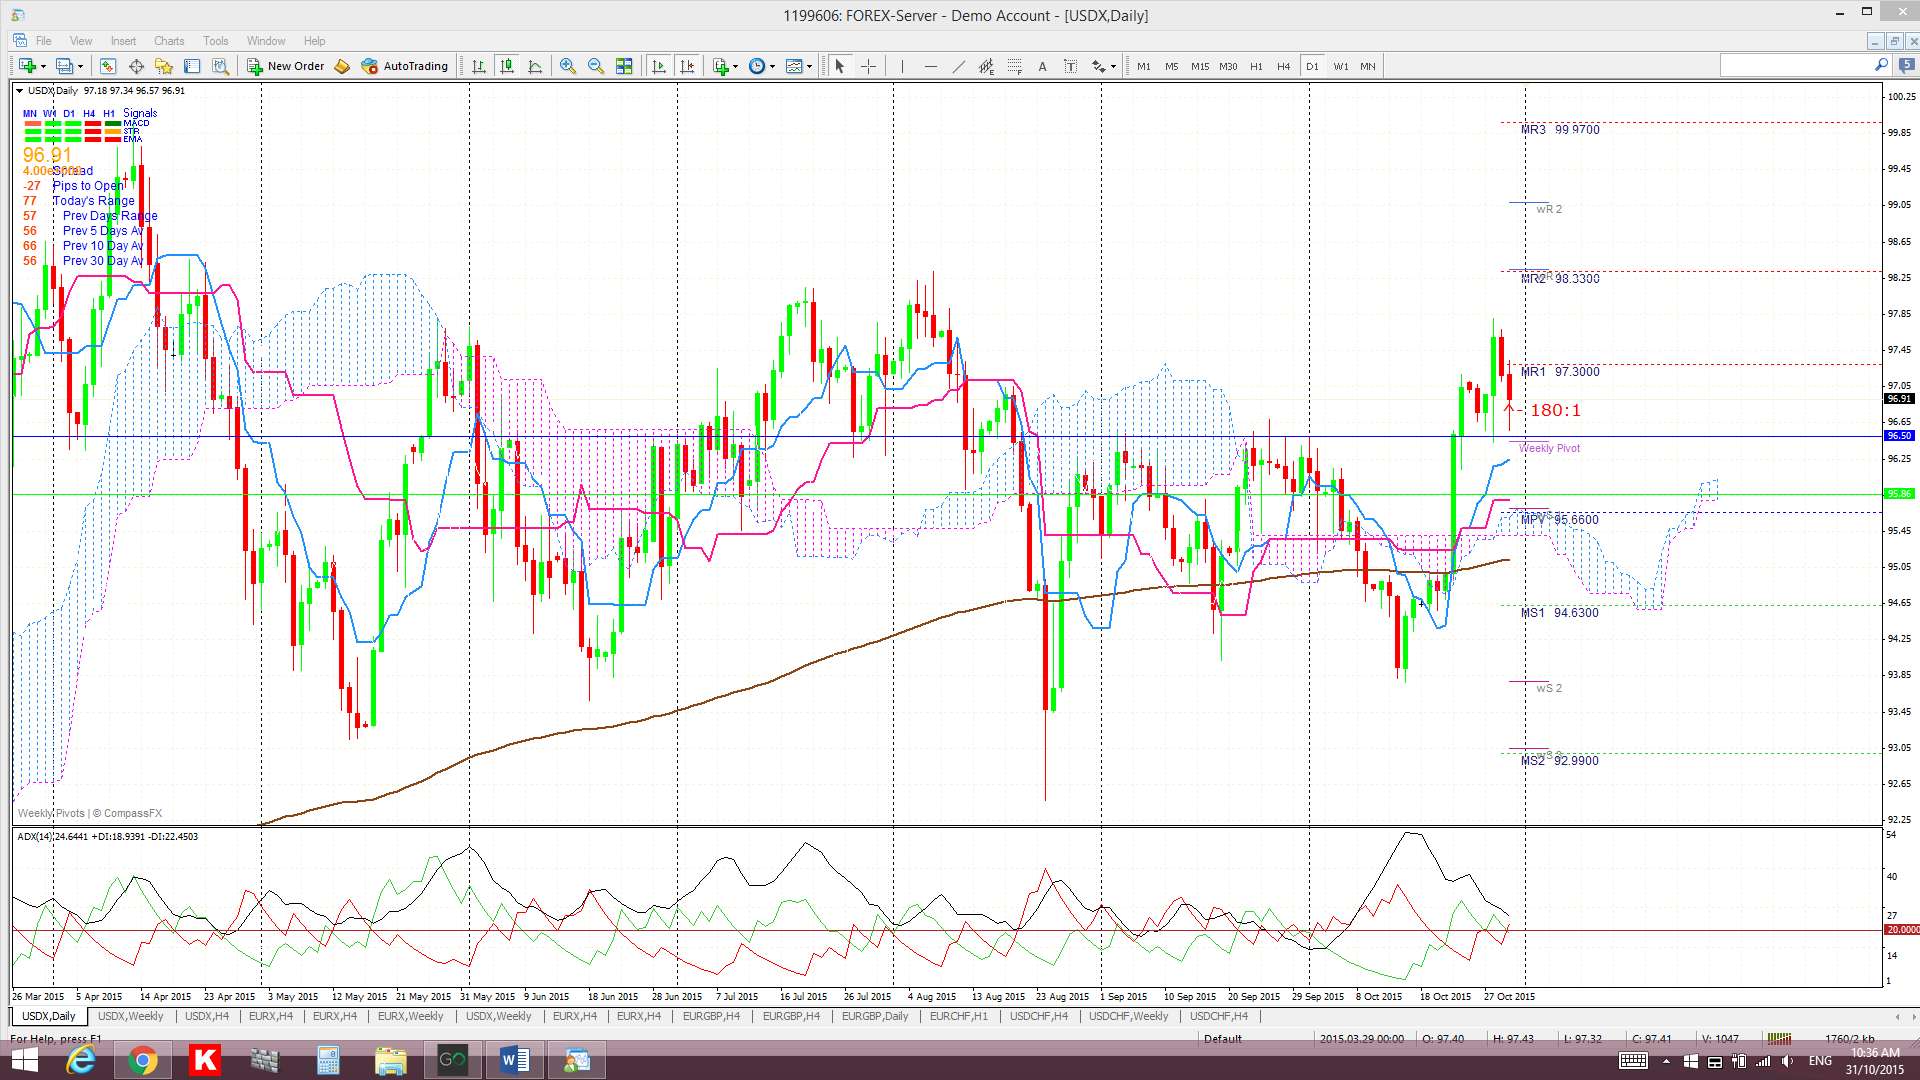
Daily Ichimoku Cloud chart: Price traded below the Cloud all week.
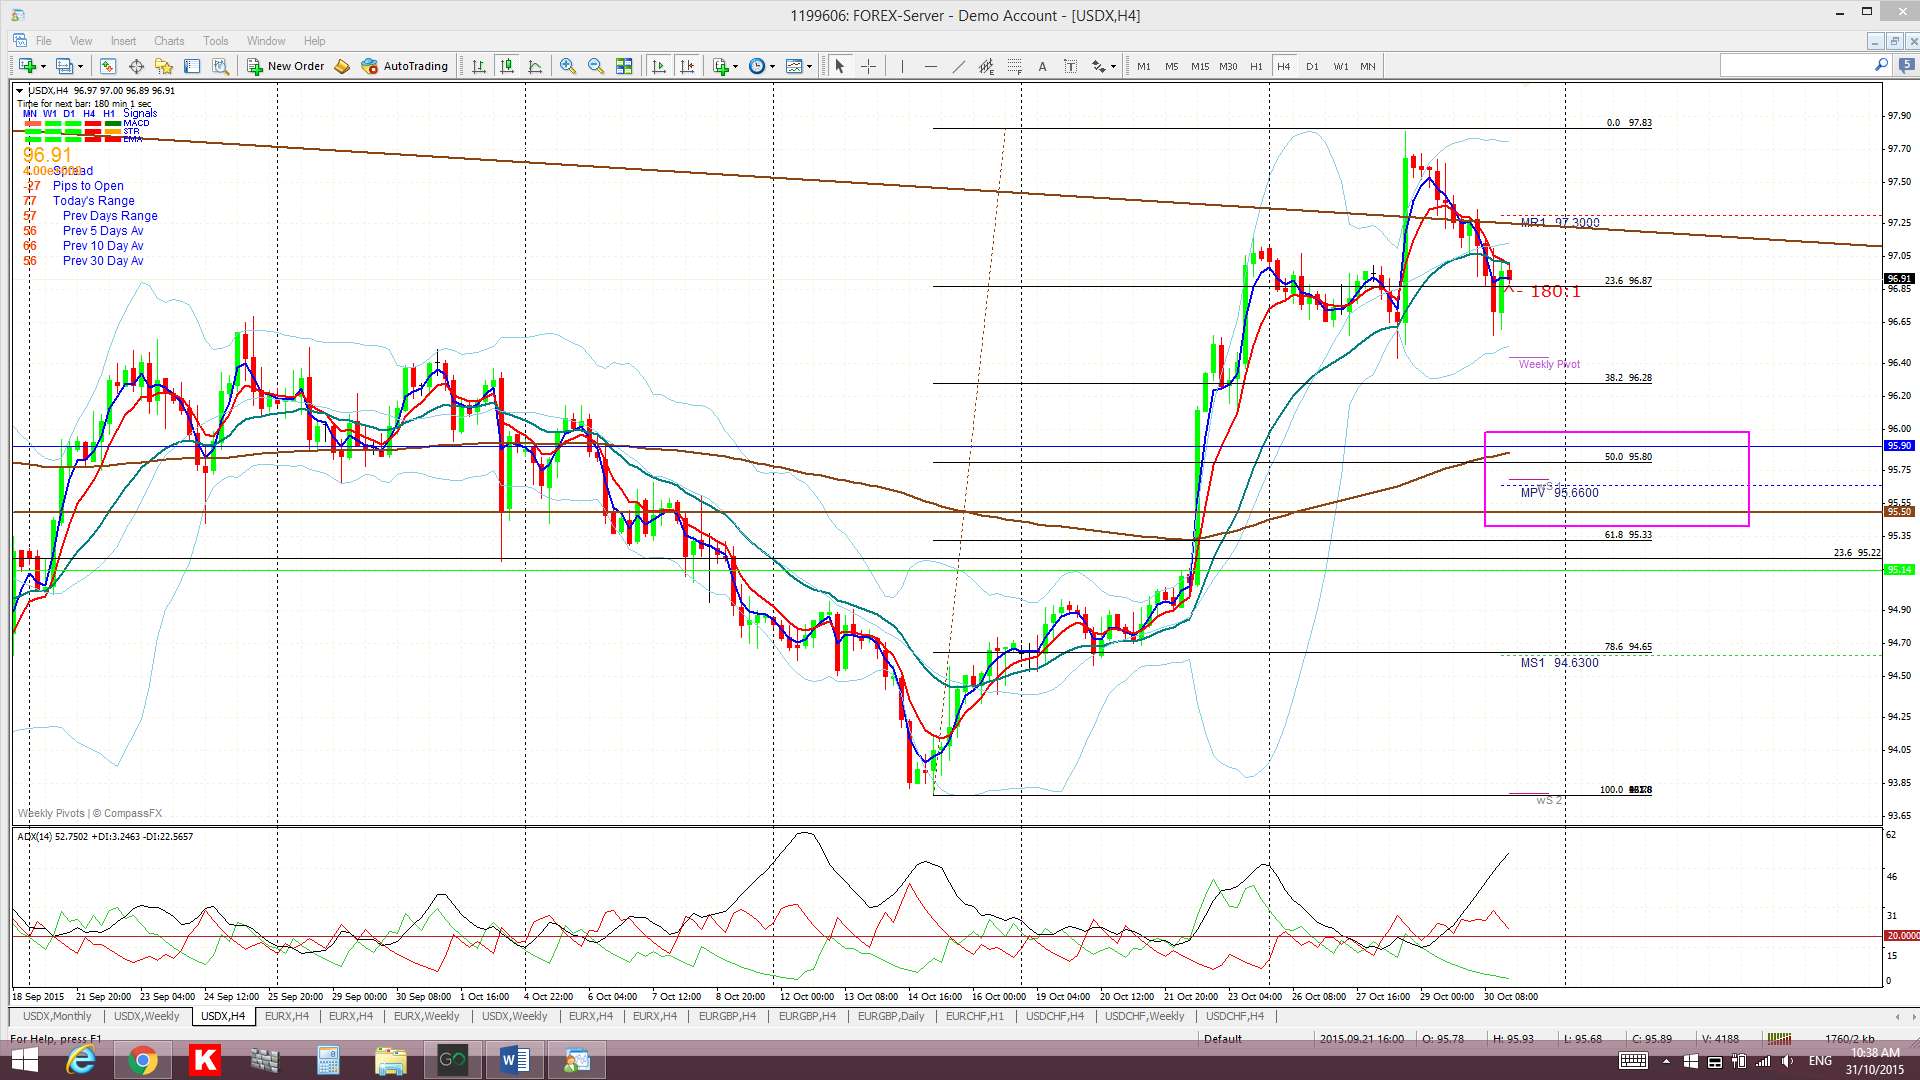
4hr: Price chopped sideways until Wednesday when FOMC gave a big up-move but it was downhill after that. Note how a 50% retrace of this recent swing high would bring price down near the support of the monthly pivot, as it is now, the 4hr 200 EMA and the 95.50 level.
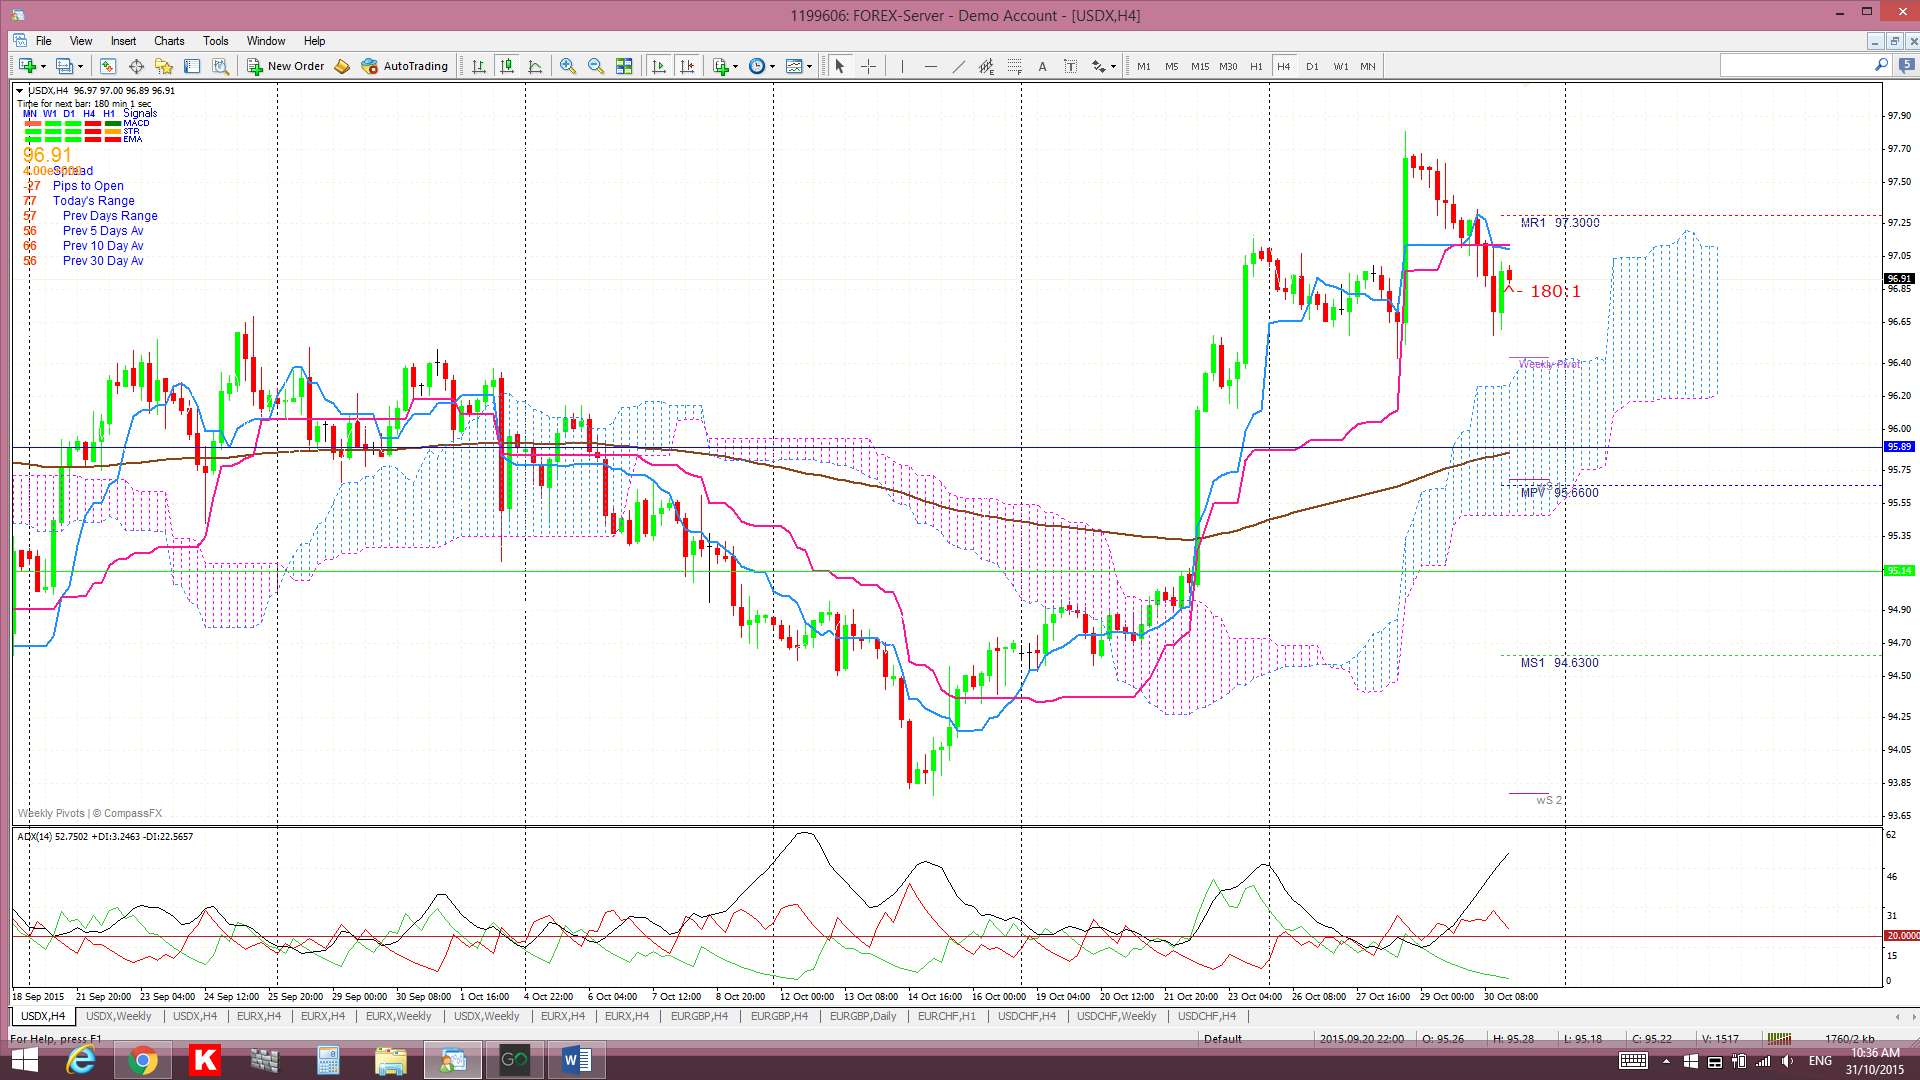
4hr Ichimoku Cloud chart: Price traded above the Cloud all week. This chart is still aligned with the daily chart and suggests LONG US$.
EURX
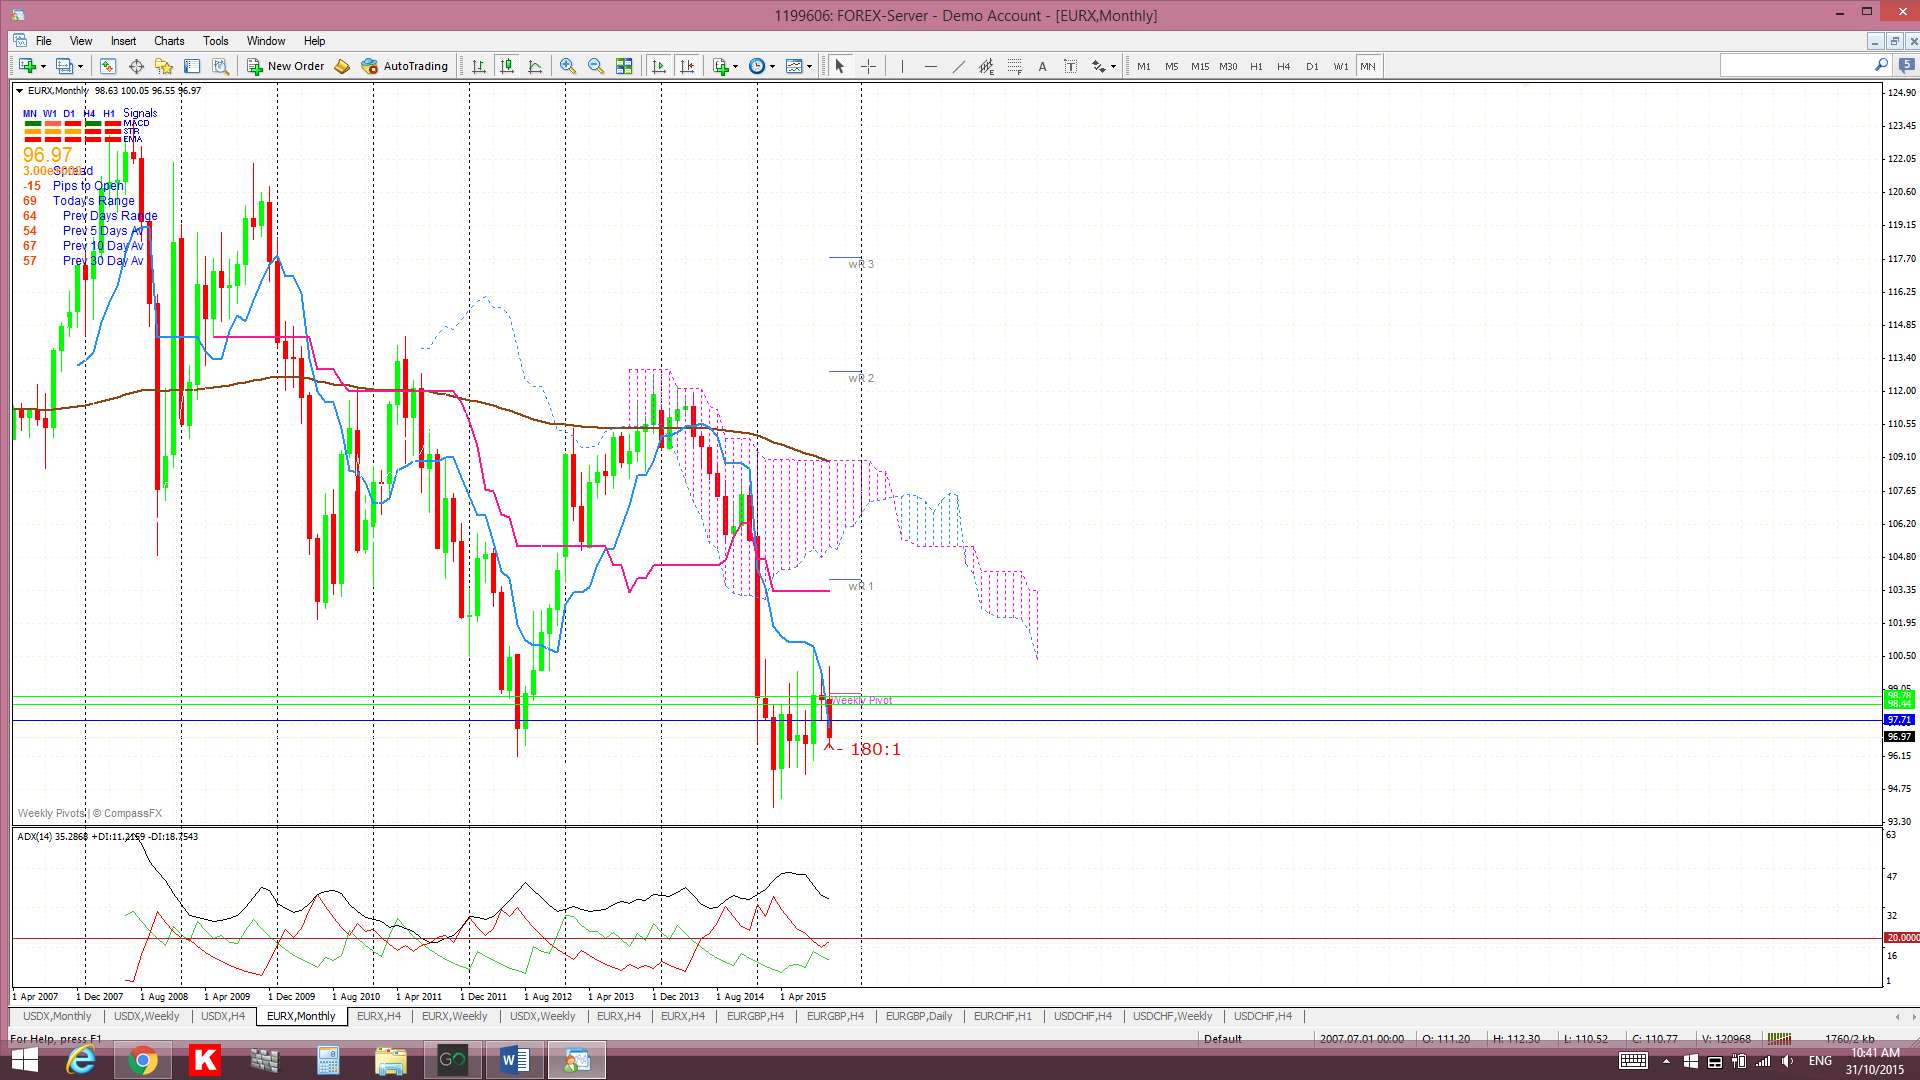
Monthly: The October candle closed as a bearish candle but still just above the key 96 ‘Double Bottom’ level.

Monthly Ichimoku: The October candle closed below the Cloud.
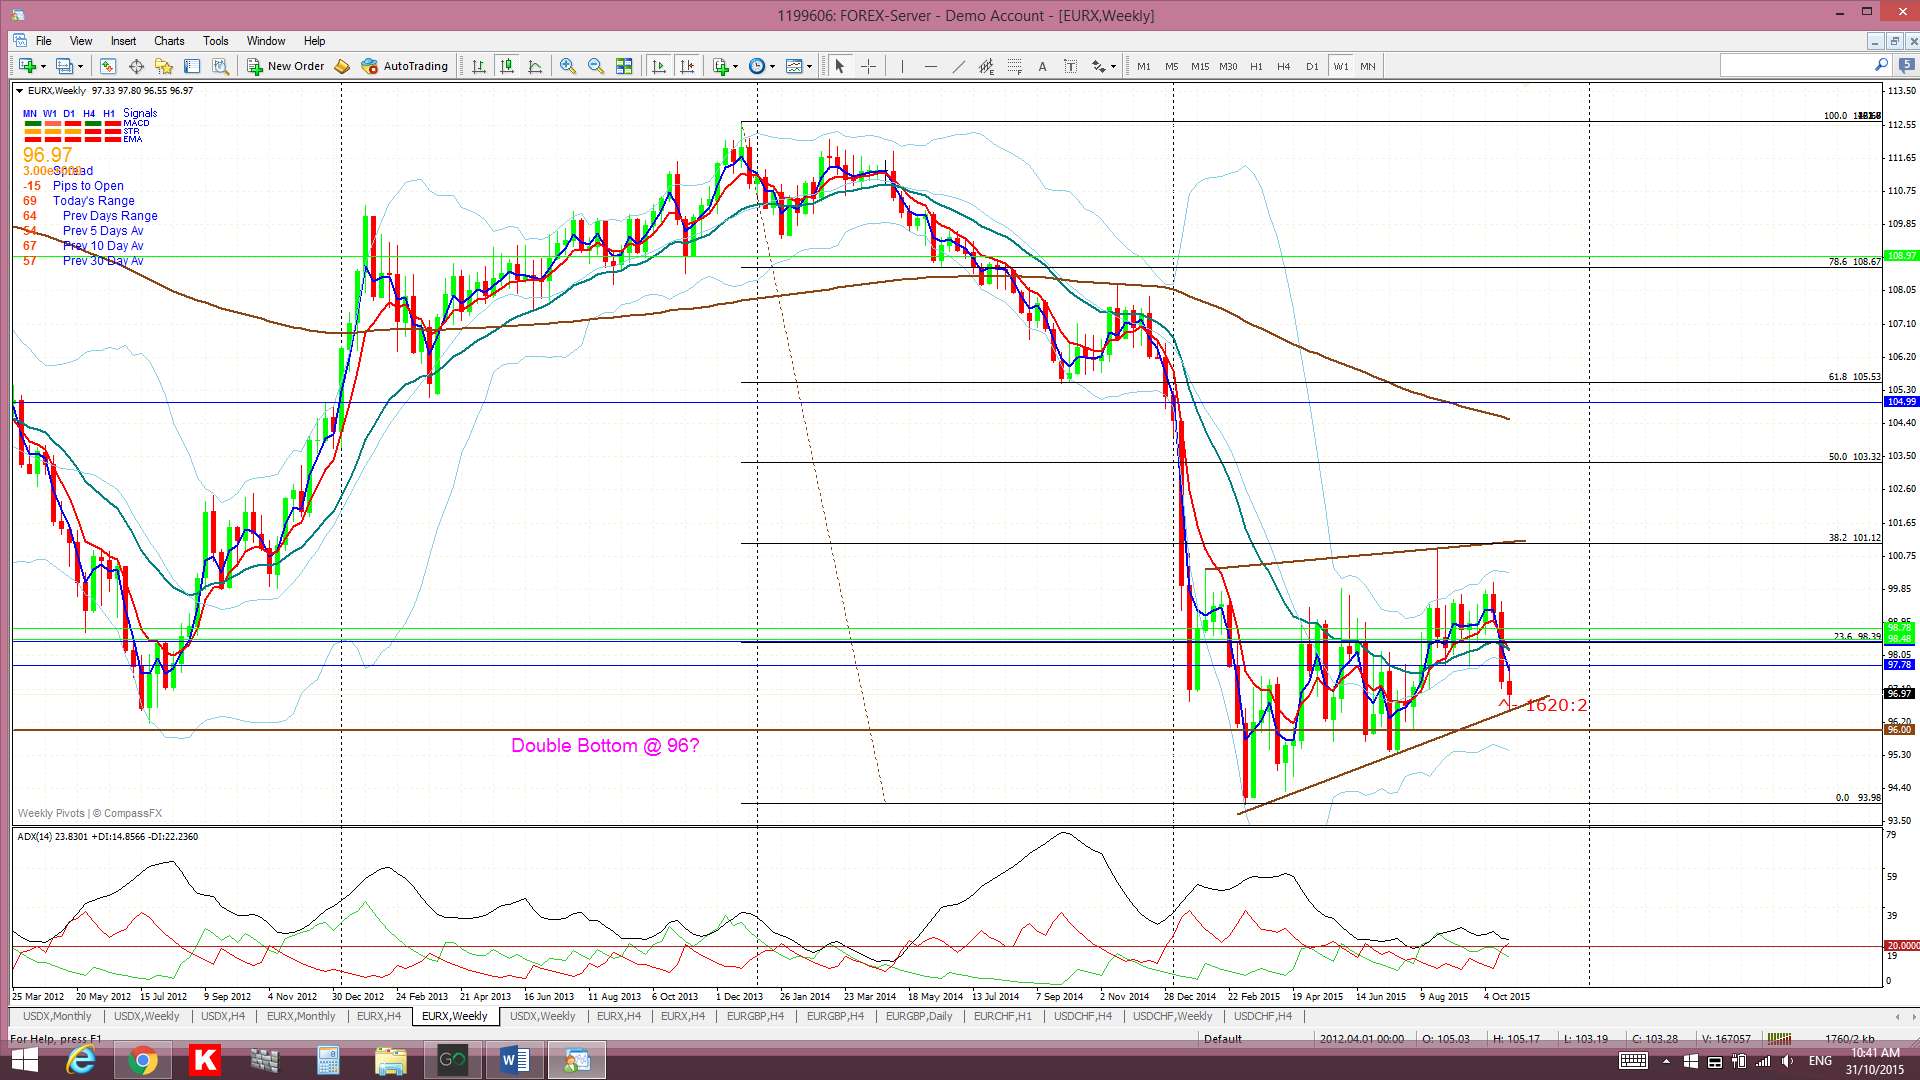
Weekly: The weekly candle closed as a bearish coloured ‘Spinning Top’ candle here too, also reflecting some indecision. There have been two conflicting weekly-based technical patterns competing over recent months; a basing-style bullish ‘Double Bottom’ and a ‘Bear Flag’, but neither pattern has trumped just yet.
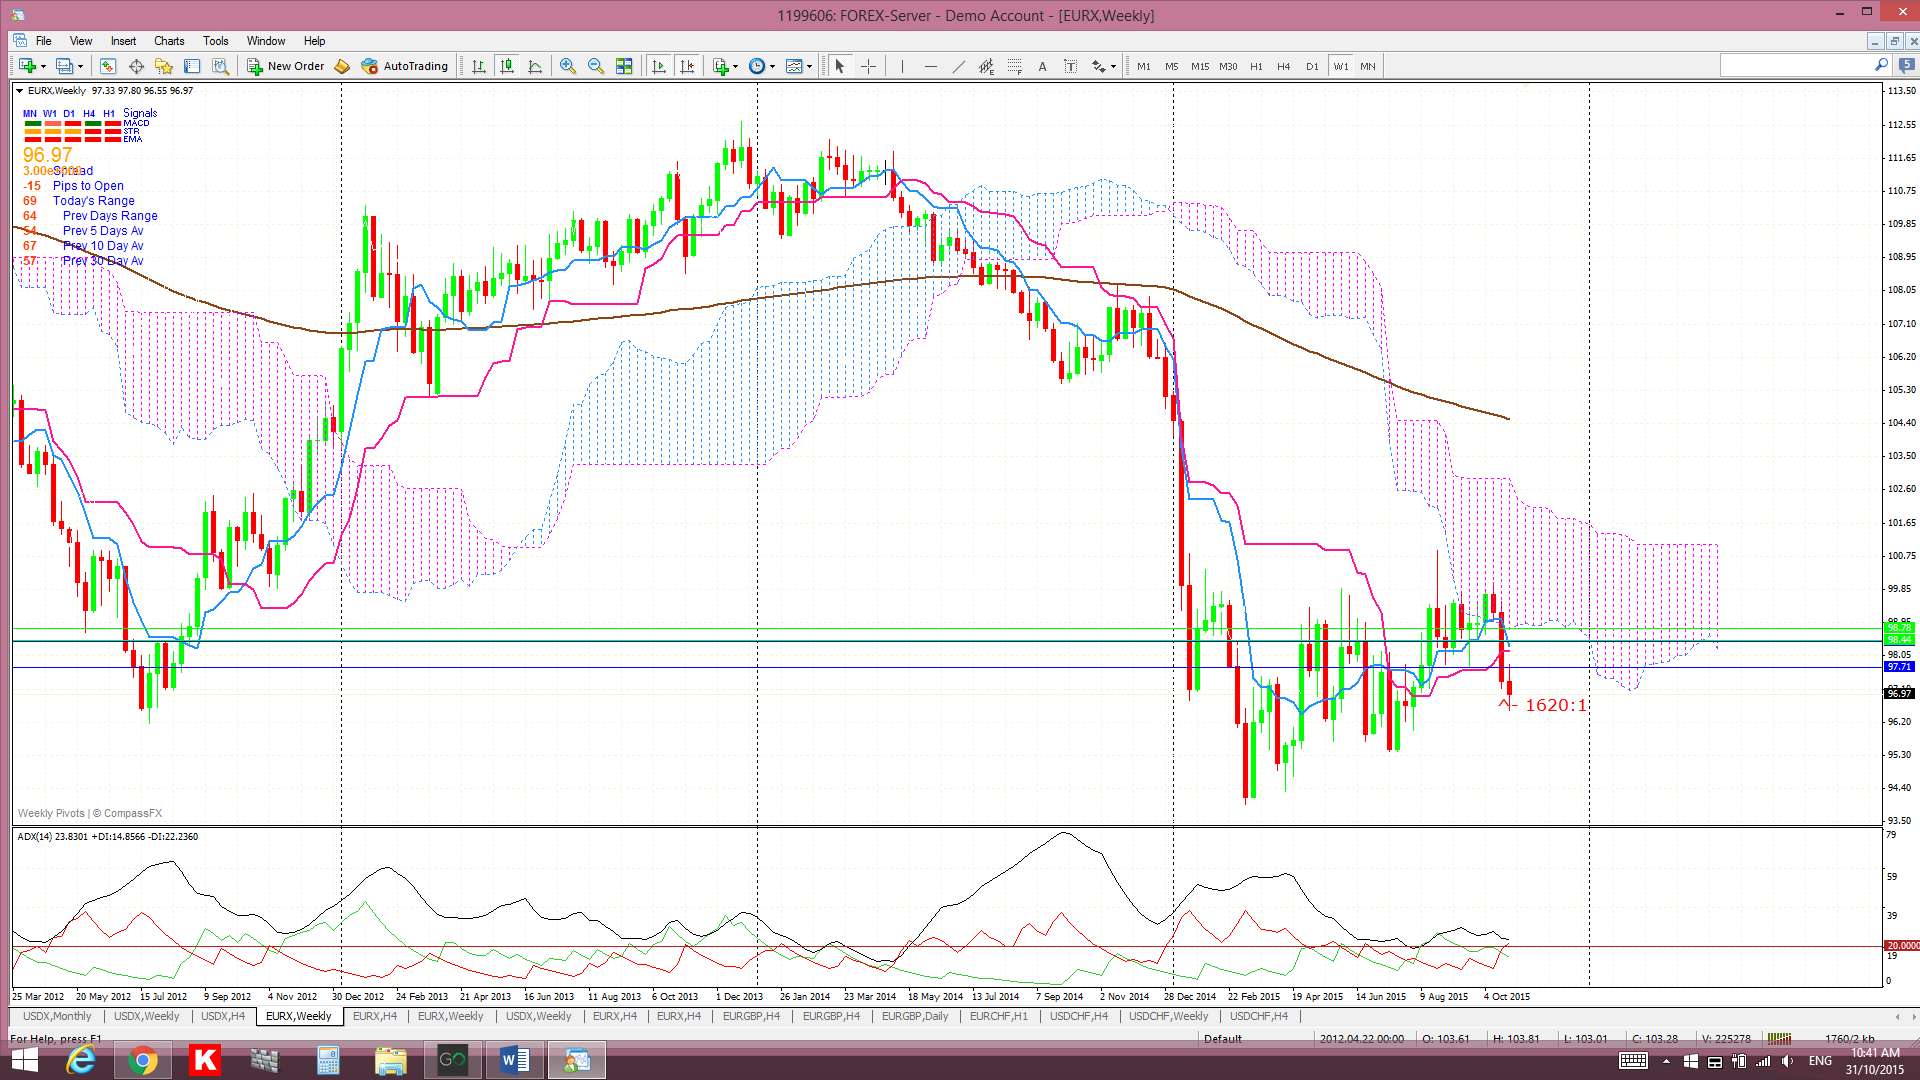
Weekly Ichimoku: Price is trading below the weekly Cloud. The bullish Tenkan/Kijun cross here still remains open for now but I would want to see a new bearish cross before being confident of any resumption of bearish momentum.
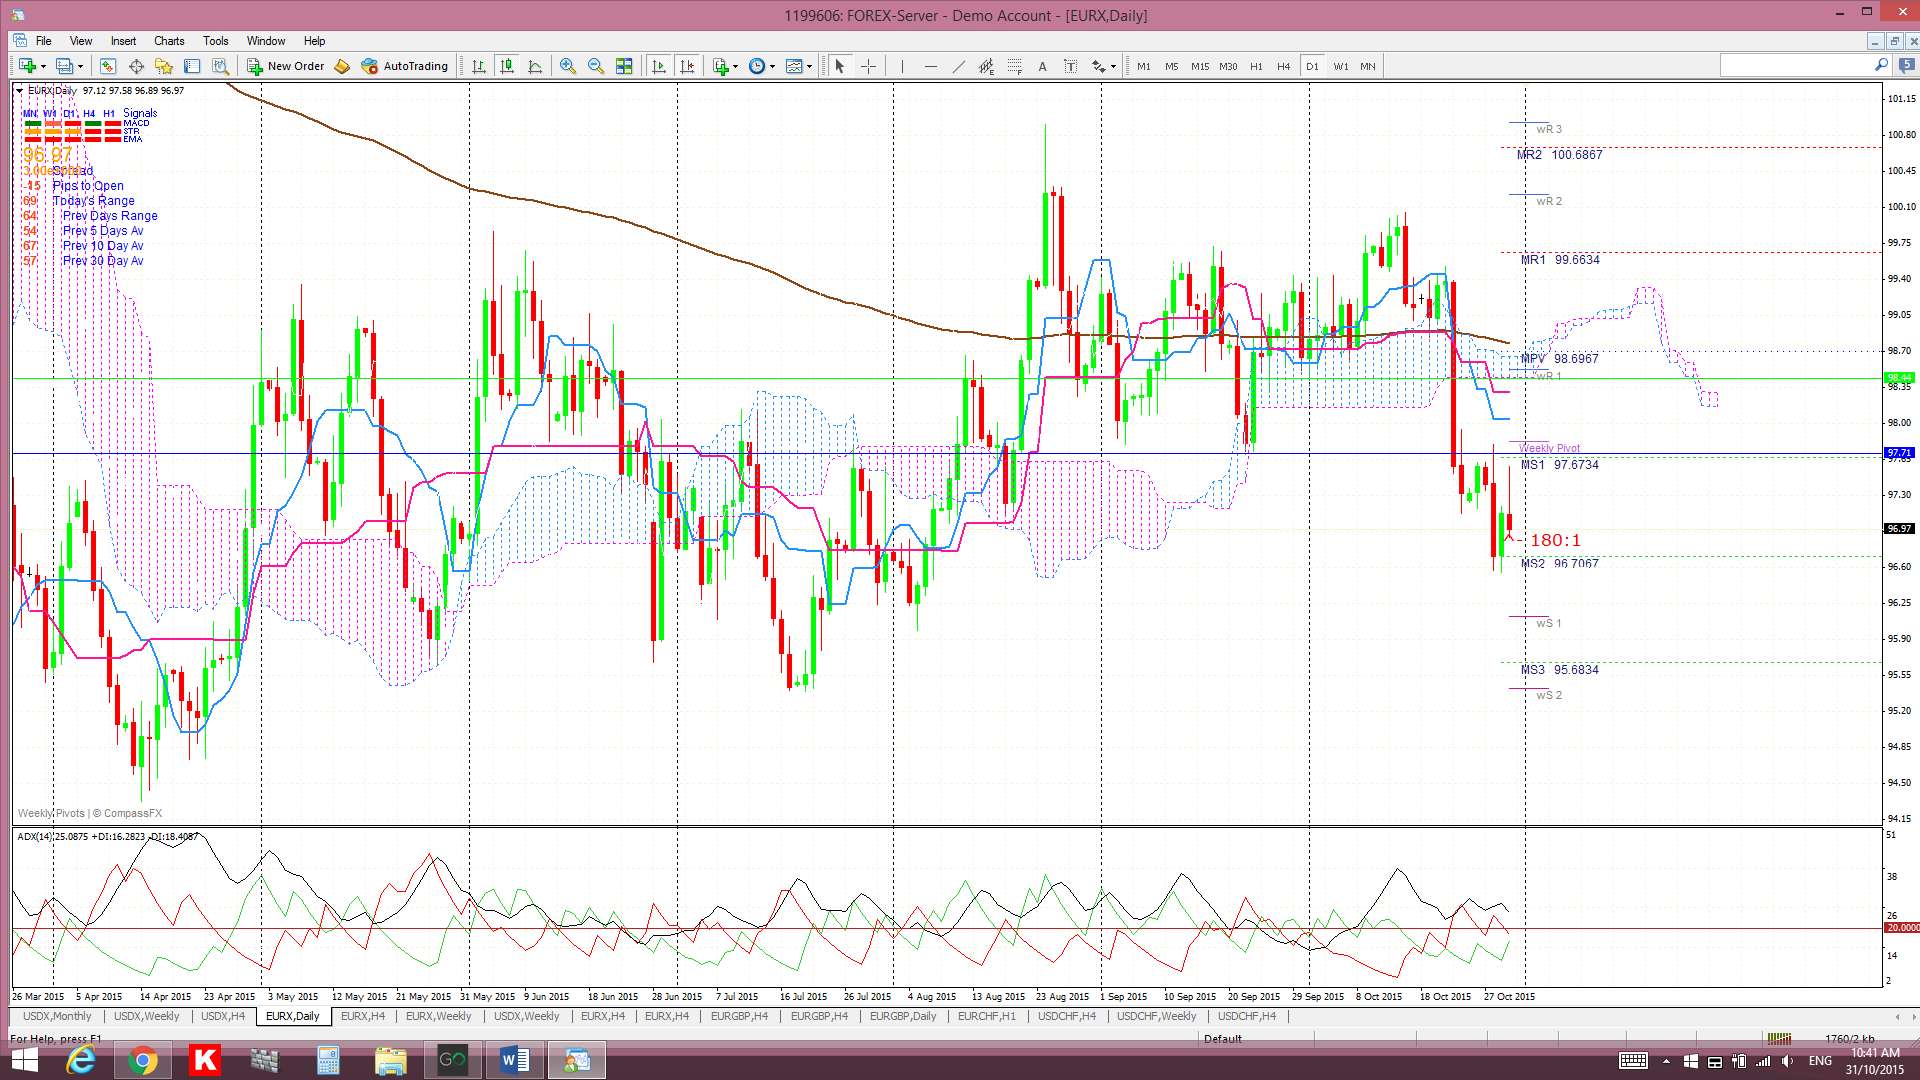
Daily: Price chopped sideways until Wednesday’s FOMC but then traded lower. Note how the bottom Flag trend line was effective support though.

Daily Ichimoku Cloud chart: Price traded below the daily Cloud all week.
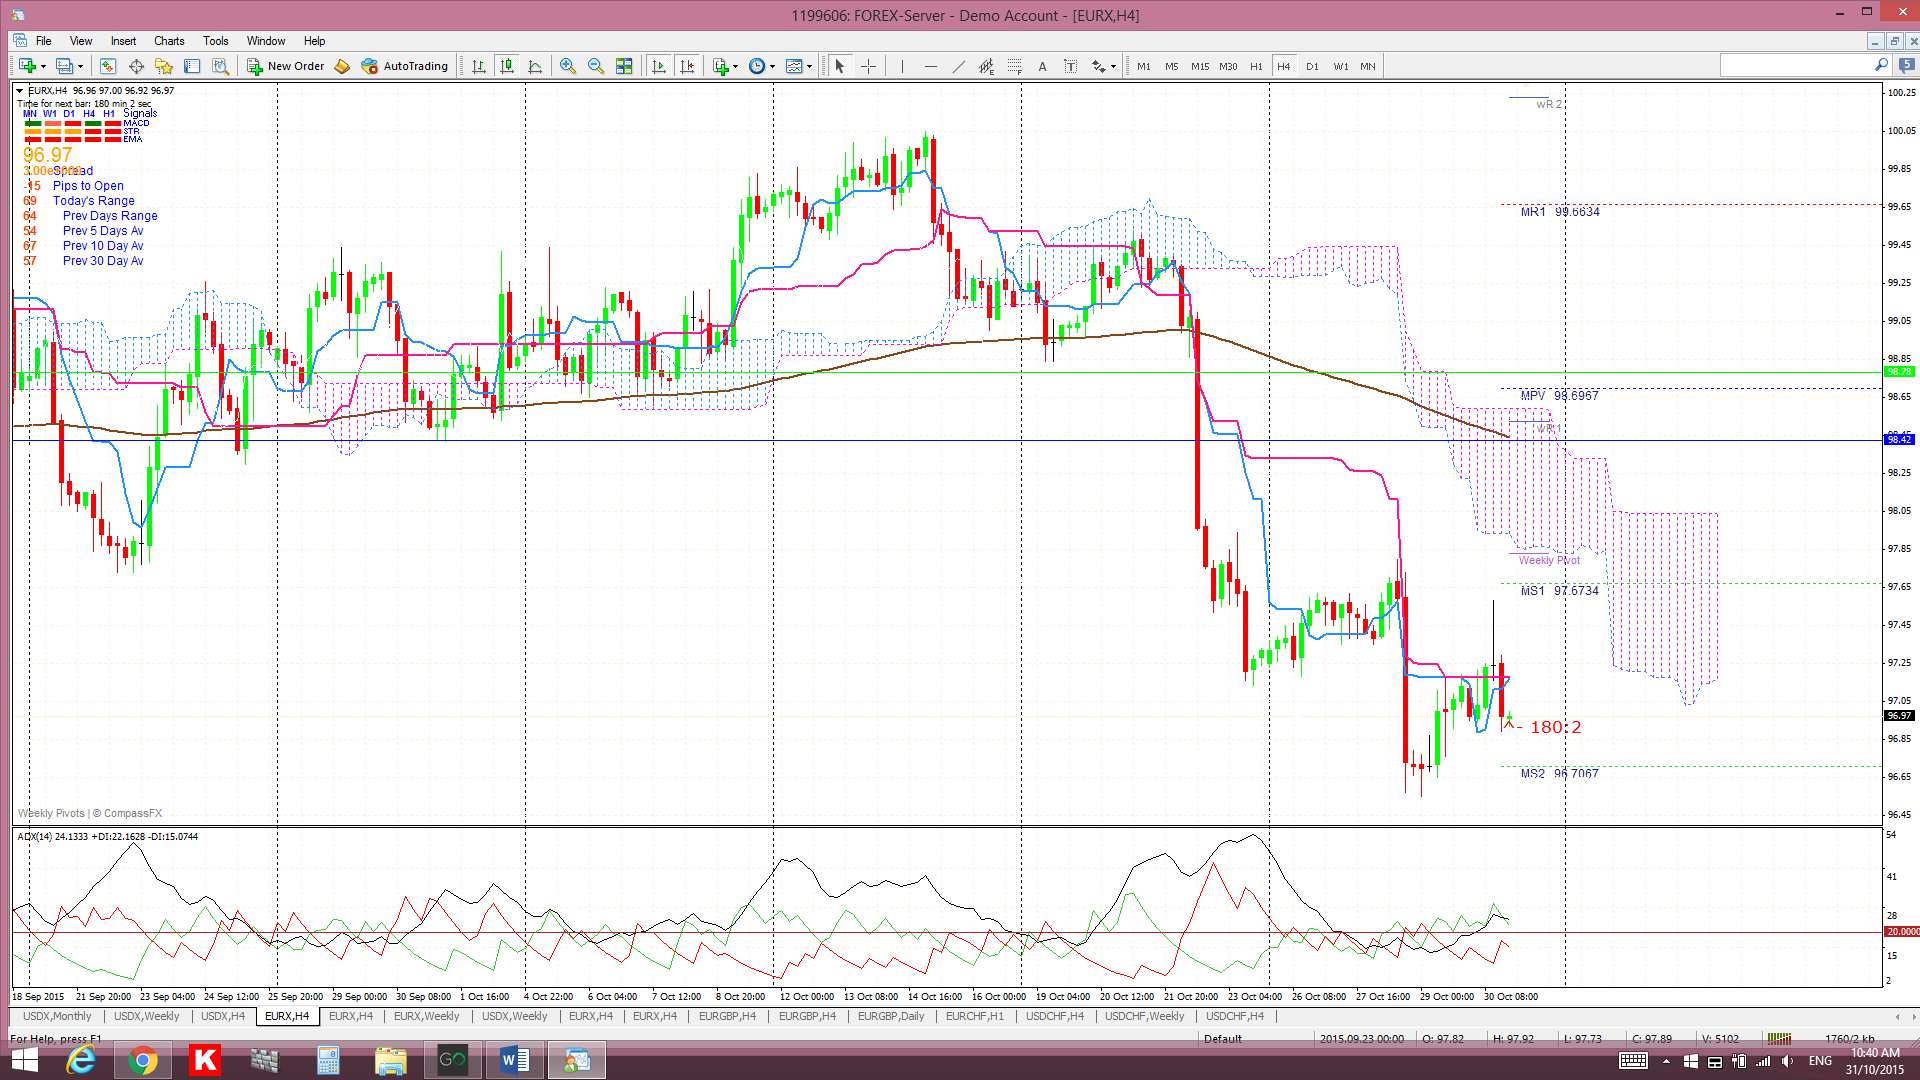
4 hr: There were mostly small candles on the 4hr chart apart from one large bearish candle on Wednesday with FOMC. Note how any 61.8% retrace would bring price back to near the monthly pivot and 4hr 200 EMA.

4 hr Ichimoku Cloud chart: Price traded below the 4hr Cloud all week. This chart is aligned with the daily chart and suggests SHORT EUR$.
General:
- Both indices continue consolidating sideways in weekly/monthly-chart Flag patterns that have persisted for over 7 months now. Thus, not a whole lot has changed, nor with this commentary.
- The USDX and EURX are CURRENTLY ALIGNED for the same directional move on their Ichimoku charts BUT I am wary given that both indices are trading at such significant levels within these long-term Flag patterns. A bounce from these extreme levels is just as possible and may all depend on how economic data unfolds in coming sessions.
- Each week I keep anticipating which piece of economic data-event might trigger a breakout on both of these index Flag patterns. I still think there won’t be a decisive Flag breakout on either index until the US Federal Reserve actually announces either a specific date OR delay for any US interest rate increase. Last week’s FOMC statement suggested that December could be still open for a US rate hike but until such news is actually announced then I suspect this range-bound activity could continue.
USDX: The US$ closed slightly lower last week but this is significant given the hawkish FOMC statement. This bearish close means the index, whilst initially breaking up and out from a Flag, remains consolidating within the potential Bull Flag pattern. Wednesday’s FOMC caught many by surprise with its hawkish tone and the US$ rallied thereafter but subsequent US economic data was weaker than expected and resulted in two bearish days which ultimately delivered the bearish weekly close. Wage growth and spending remain as key considerations for the US Federal Reserve with any US interest rate decision and some weaker than expected data on these two fronts on Friday, along with the weaker USD GDP print and lack of BoJ activity, all combined to put pressure on thoughts of any imminent US rate hike and, hence, also put pressure on the US$. Next week’s NFP will be closely watched here and probably more so for the wages component of this data. The NFP expectation is for higher than the last print, although this is still below trend, but it will most likely be the ‘average hourly earnings’ that will most interest the Federal Reserve.
As I’ve mentioned over many weeks, I still consider the US$ is in no-man’s land whilst it trades above 92.50 and below 100. I continue to wait for a decisive breakout from this region to signal the next major directional move on the index as this choppy and range-bound price action has gone on for over six months now. Thus, the levels to keep watching on the USDX are:
- The weekly chart Flag trend lines.
- The psychological 100 level above current price. This is the top of the recent trading range.
- The 92.50 level below current price. This is the bottom of the recent trading range.
EURX: The EURX closed lower for the week and it seems more due to Yin and Yang-style activity related to the US$. The hawkish FOMC statement boosted the US$ which, in turn, put pressure on the EUR$ and there wasn’t enough up-beat EUR-related data to help it recover much after that. The fact remains that the Eurozone is trading within a monetary easing cycle and the US is trying to emerge from one.
The levels to watch on the EURX continue to be:
- The weekly chart Flag trend lines.
- The 105.5 level: The weekly chart reveals that a 61.8% fib retracement of the recent lengthy bear move is back up near the 105.50 level and weekly 200 EMA. Any hold back above 96 and continued recovery effort might see the index target this region.
- The 96 level:This is a major support level for the EURX and a possible bullish ‘Double Bottom’ region.
- The 94 level: Any break and hold back below 96 might suggest bearish continuation as it represents a break of the monthly charts ‘Double Bottom’. If so, the recent low printed near 94 will come back into focus.
Note: The analysis provided above is based purely on technical analysis of the current chart set ups. As always, Fundamental-style events, by way of any Ukraine, Eurozone or Middle East events and/or news announcements, continue to be unpredictable triggers for price movement on the indices. These events always have the potential to undermine any technical analysis.
The post End of week data rains on FOMC’s US$ parade. appeared first on www.forextell.com.