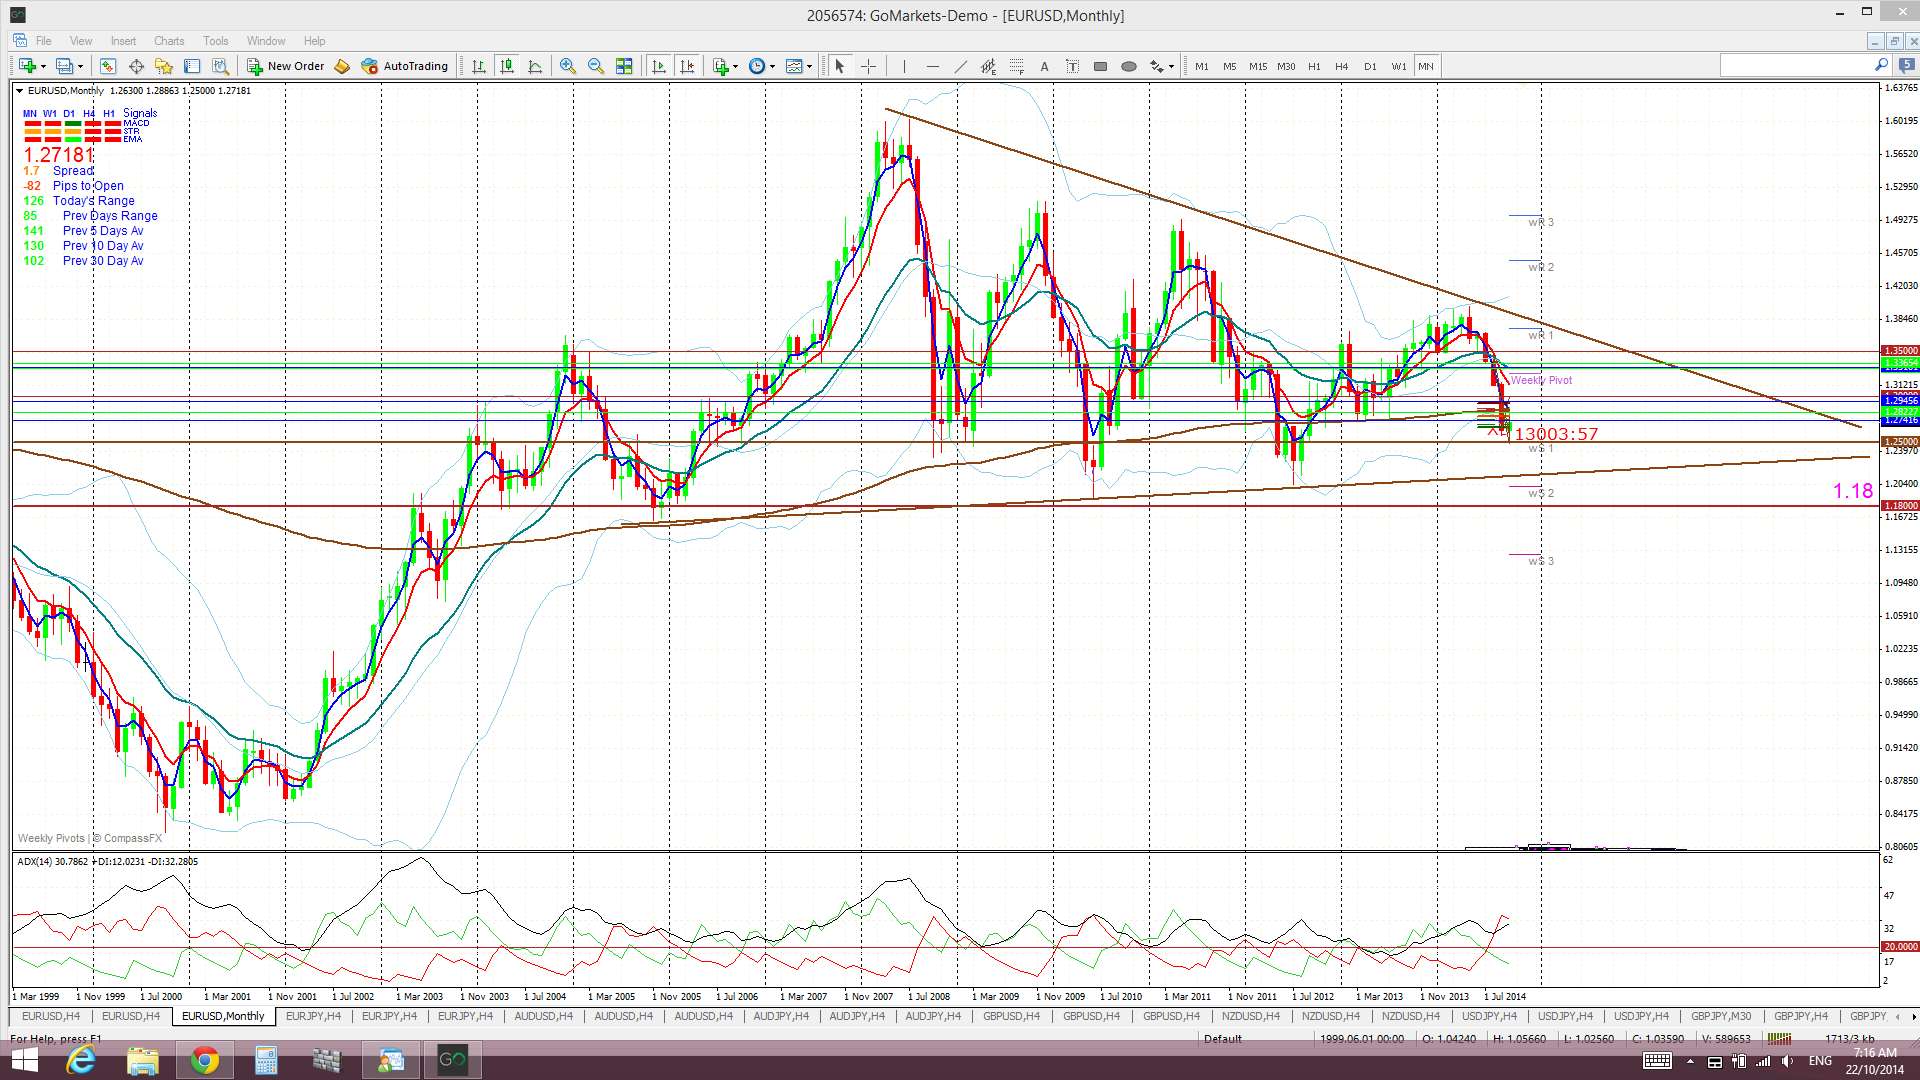
The E/U traded lower overnight on rumours about ECB corporate bond buying and with USD strength following, yet more, upbeat USD data. Traders need to remember that, despite some recent uptrend with the E/U, this pair is trading within an overall bearish descending triangle pattern on the monthly chart and within a ‘Bear Flag’ on the daily chart. So, things are looking a bit tough for this pair.
E/U monthly chart: the descending triangle pattern is a bearish continuation pattern and has a base at around the 1.18 level. The height of this triangle is about 4,000 pips. Technical theory would suggest that any bearish breakdown of this triangle at 1.18 might see a similar move. It is worth noting that this would bring the E/U down to levels not seen since 2000/2001!
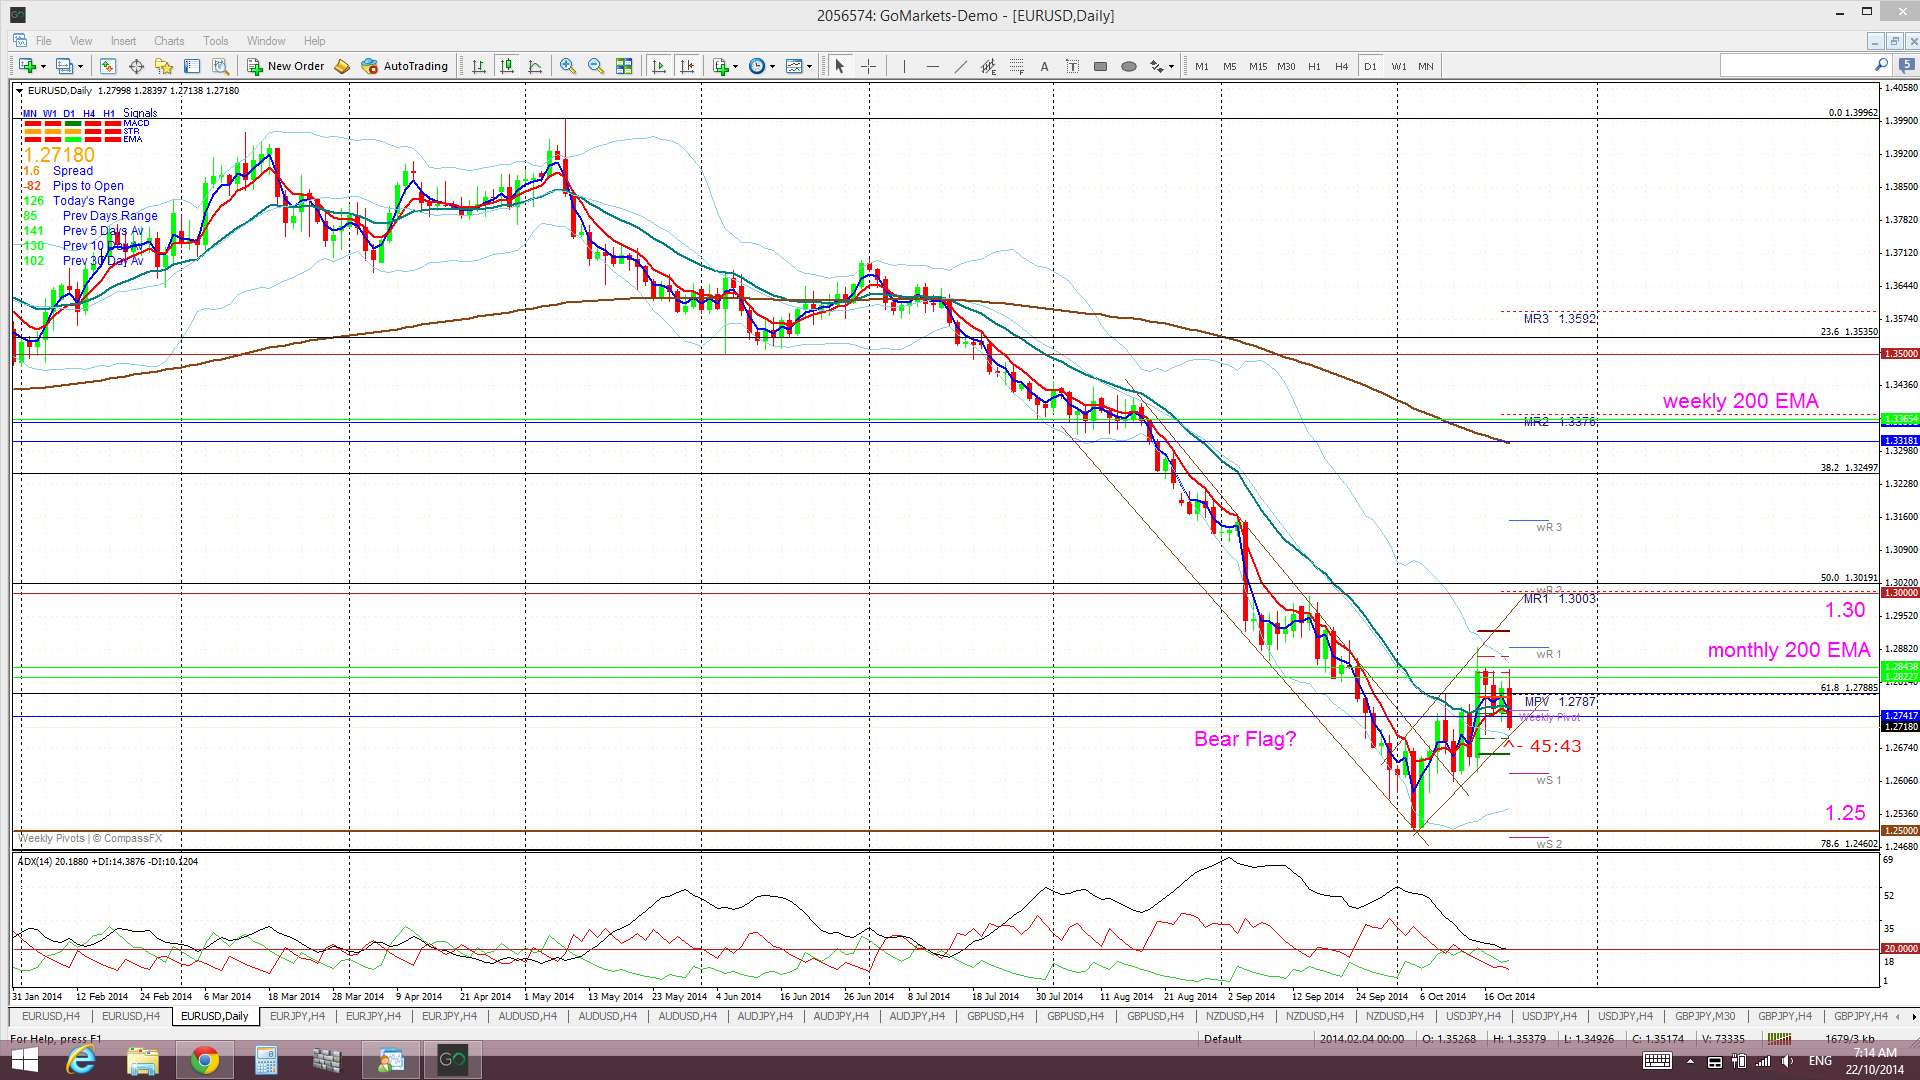
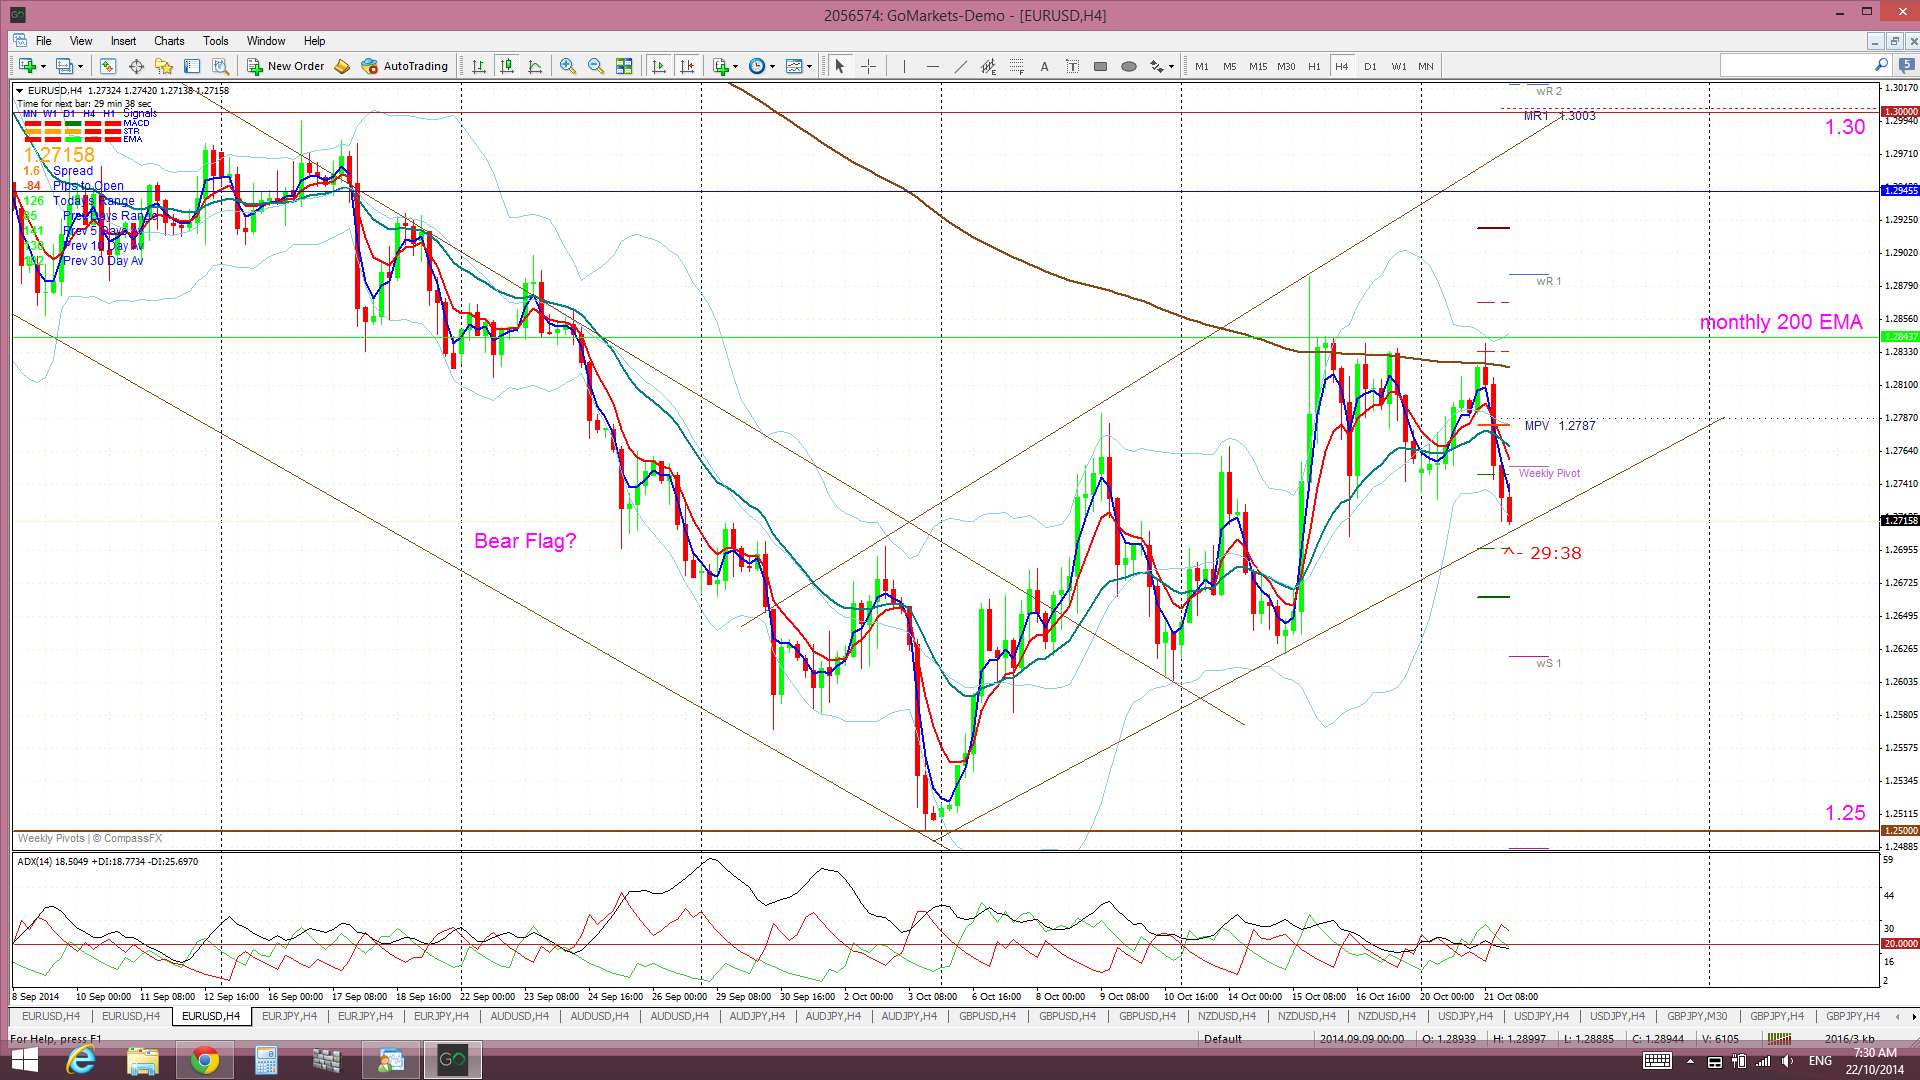
E/U and the Bear Flag? The 4hr and daily charts show the potential ‘Bear Flag’ still forming up on the E/U. The ‘Flag Pole’ of this pattern is about 1,000 pips, at a minimum. I am essentially just measuring the daily chart trading channel. Thus, any Bear Flag breakdown would suggest a continuation move of at least about 1,000 pips. Personally, I will be waiting for for any close and hold below 1.25 to confirm a ‘Bear Flag’ break and then looking for a possible target down near 1.15.
E/U daily:
E/U 4hr:
Summary: USD strength and EUR weakness have combined to see the E/U trade lower. Traders should watch trend lines on both the developing ‘Bear Flag’ and descending triangle pattern to help gauge entry for any bearish E/U trades.
The post E/U: ‘Bear Flag’ still building. appeared first on www.forextell.com.