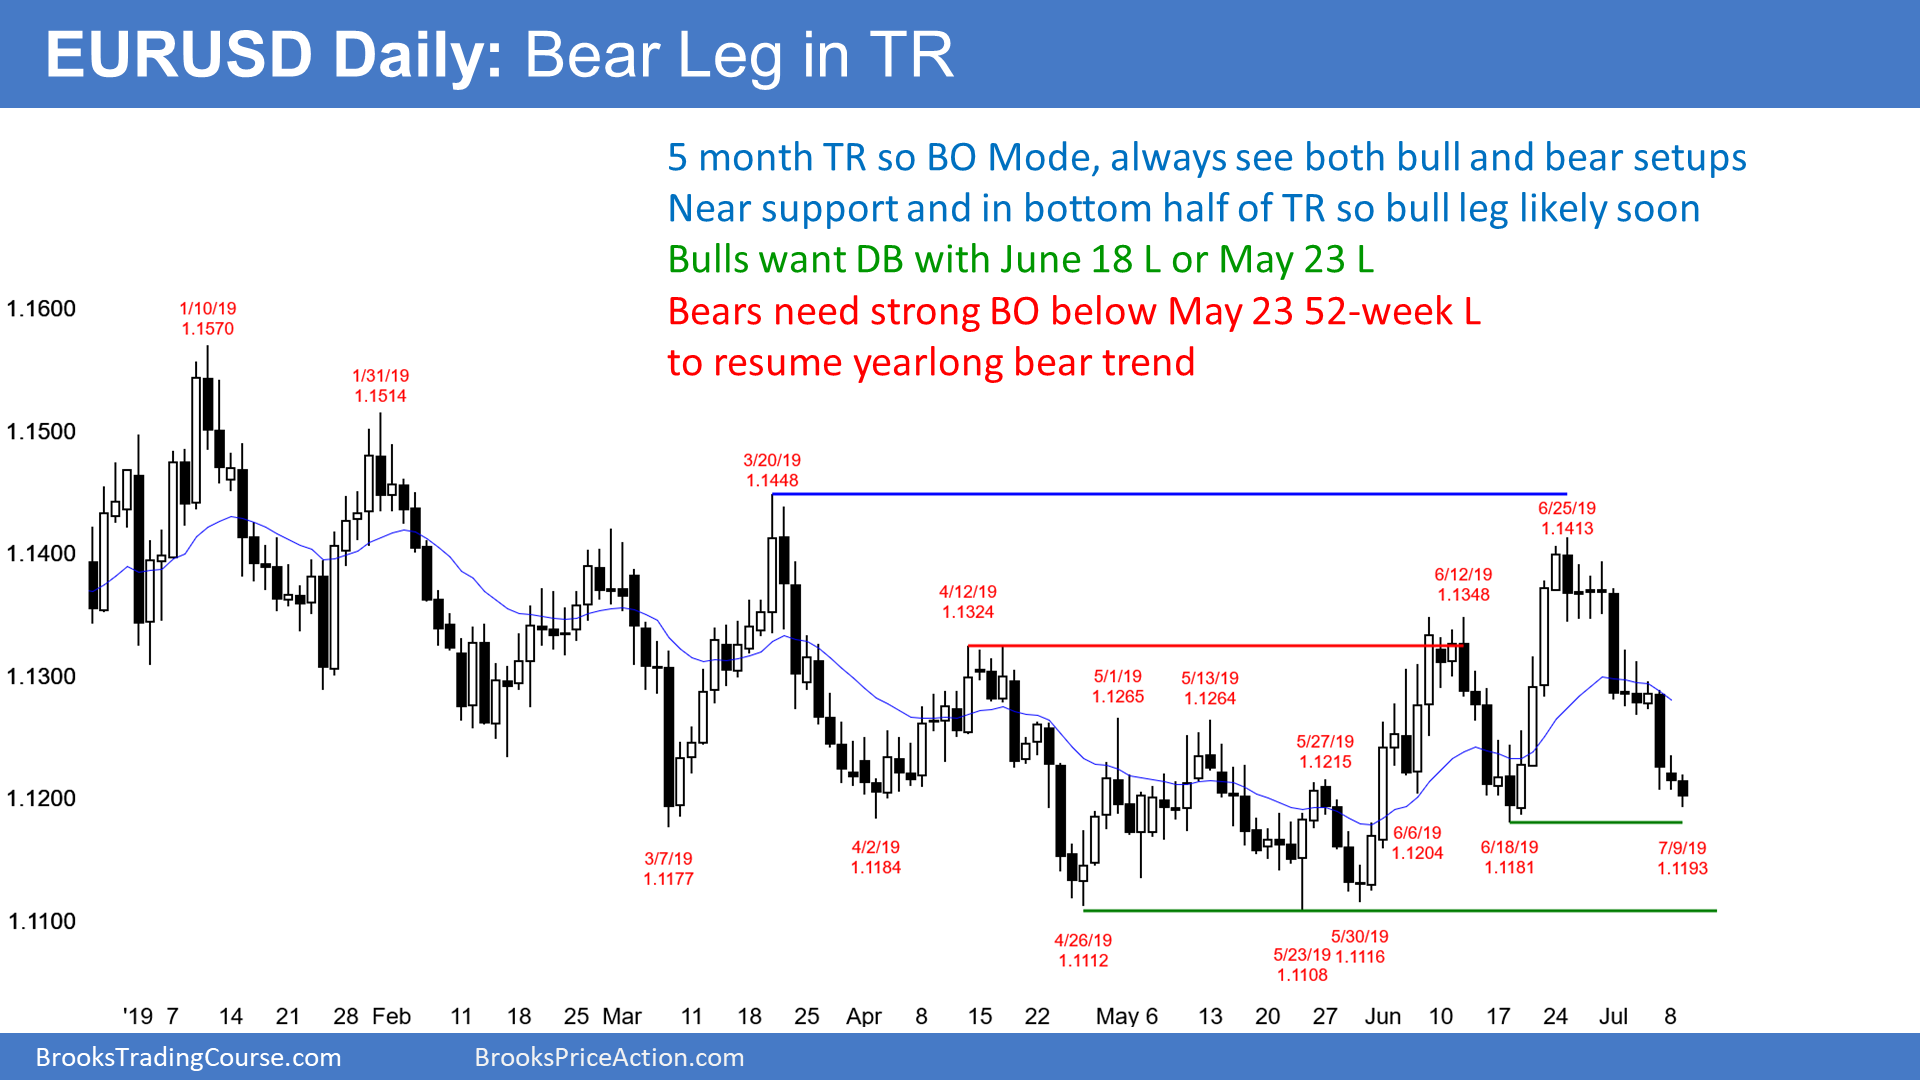
The EUR/USD daily Forex chart has been in a trading range for 5 months. Most of the legs up and down lasted 2 – 3 weeks. This 2 week selloff is now testing a major higher low in the bottom half of the range. Consequently, the bulls will probably begin a bull leg within a week.
Most of the down legs have required a micro double bottom before a bull leg began. Also, the bull legs typically ended with a micro double top. Therefore, traders expect that the chart will have to stop going down and begin to go sideways for a few days before it can go up.
It is in the buy zone since it is near support. Furthermore, there have been 3 legs down in a 7 day bear channel micro channel. This is a parabolic wedge sell climax. As a result, traders will begin to transition from selling to buying over the next few days. This is true even if the bears get a brief breakout below the May 23 52-week low 1st.
Overnight EUR/USD
The EUR/USD 5 -inute Forex chart has been in a 25 pip range overnight. This follows yesterday’s small day. The bears are probably exhausted. They will likely not want to sell aggressively here after an 8-day micro channel and parabolic wedge channel at support. Traders expect limited downside this week.
The bulls will begin to look for buy setups that will lead to at least a 50 pip rally today or tomorrow. Until they see one, they will scalp for 10 – 20 pips.
Traders expect a bottoming process this week. They would then look for at least a 50% retracement of the selloff, which means a test above 1.13 within a couple weeks.
The selling is drying up. But the chart will likely need another day or so of sideways trading before the bulls begin a 2 – 3 week rally.
 By Al Brooks
Jul 09, 2019 01:21PM ET
Source: Investing.com
