Last week: Despite much market anxiety over FOMC and the Greek-debt situation the two TC signals from the previous week extended their gains to yield over 900 pips. The Cable reached 500 pips and is still open but the GBP/JPY closed off on Friday after giving 430 pips. New mid-week signals on the E/J and E/J were ignored. The US$ continued to weaken following the more dovish than expected FOMC and mixed US economic data, however, most focus is now on the Euro as the world watches and waits for any news on the Greek-debt crisis, the results of which could trigger large FX moves.
This week:
The US$ has continued to weaken and is approaching the threshold support level of 92.50 and any break and hold below this level would support bearish continuation. An update on the FX Indices can be found through this link.
The week had been pretty light for scheduled ‘high impact’ news but there is now an emergency meeting of Eurogroup leaders on Monday to discuss the Greek-debt crisis. The outcome of this meeting has the potential to rattle global trading markets and news updates will need to be monitored. One has to wonder what the currency charts will look like after this week’s round of Greek-debt negotiations or after the June 30th IMF deadline and whether this will prove to be a pivotal and defining week for currency movement. The UK’s Daily Mail image below kind of sums up the contagion potential associated with the current Greece situation:

GBP: The GBP has enjoyed a strong couple of weeks and this has been not so much because of any stand-out economic data, although increased UK wage earnings would have helped, but primarily because other currencies have been mired with either bad news or Central Bank activity/jawboning and have slipped back. I would expect the GBP to keep making gains especially if EUR weakness develops with the Greek-debt crisis.
Silver and Gold: both metals are trading near key support levels but I would expect them to be supported if the Greek-debt situation worsens, that is, beyond what it currently is.
NB: I am away next week as it is school holidays here and so updates will be brief and few.
Events in the Ukraine and the Middle East, as well as with Greek Debt talks, continue to have the potential to undermine any developing ‘risk’ appetite and need to be monitored.
Stocks and broader market sentiment:
US stock indices, the S&P500, DJIA, NASDAQ, and Russell 2000, all posted bullish weekly candles despite broad-based concern about the situation with the Greek debt crisis and the NASDAQ even printed the highest weekly close on record. The DAX closed higher too but not so the FTSE as Grexit fear seemed to weigh heavy there. US stock traders seemed to take comfort from FOMC guidance that any US rate hike would be gradual and that assurance helped to support US stock sentiment.
I continue to watch out for further clues as to any new momentum move, long or short though! In particular I’m looking out for:
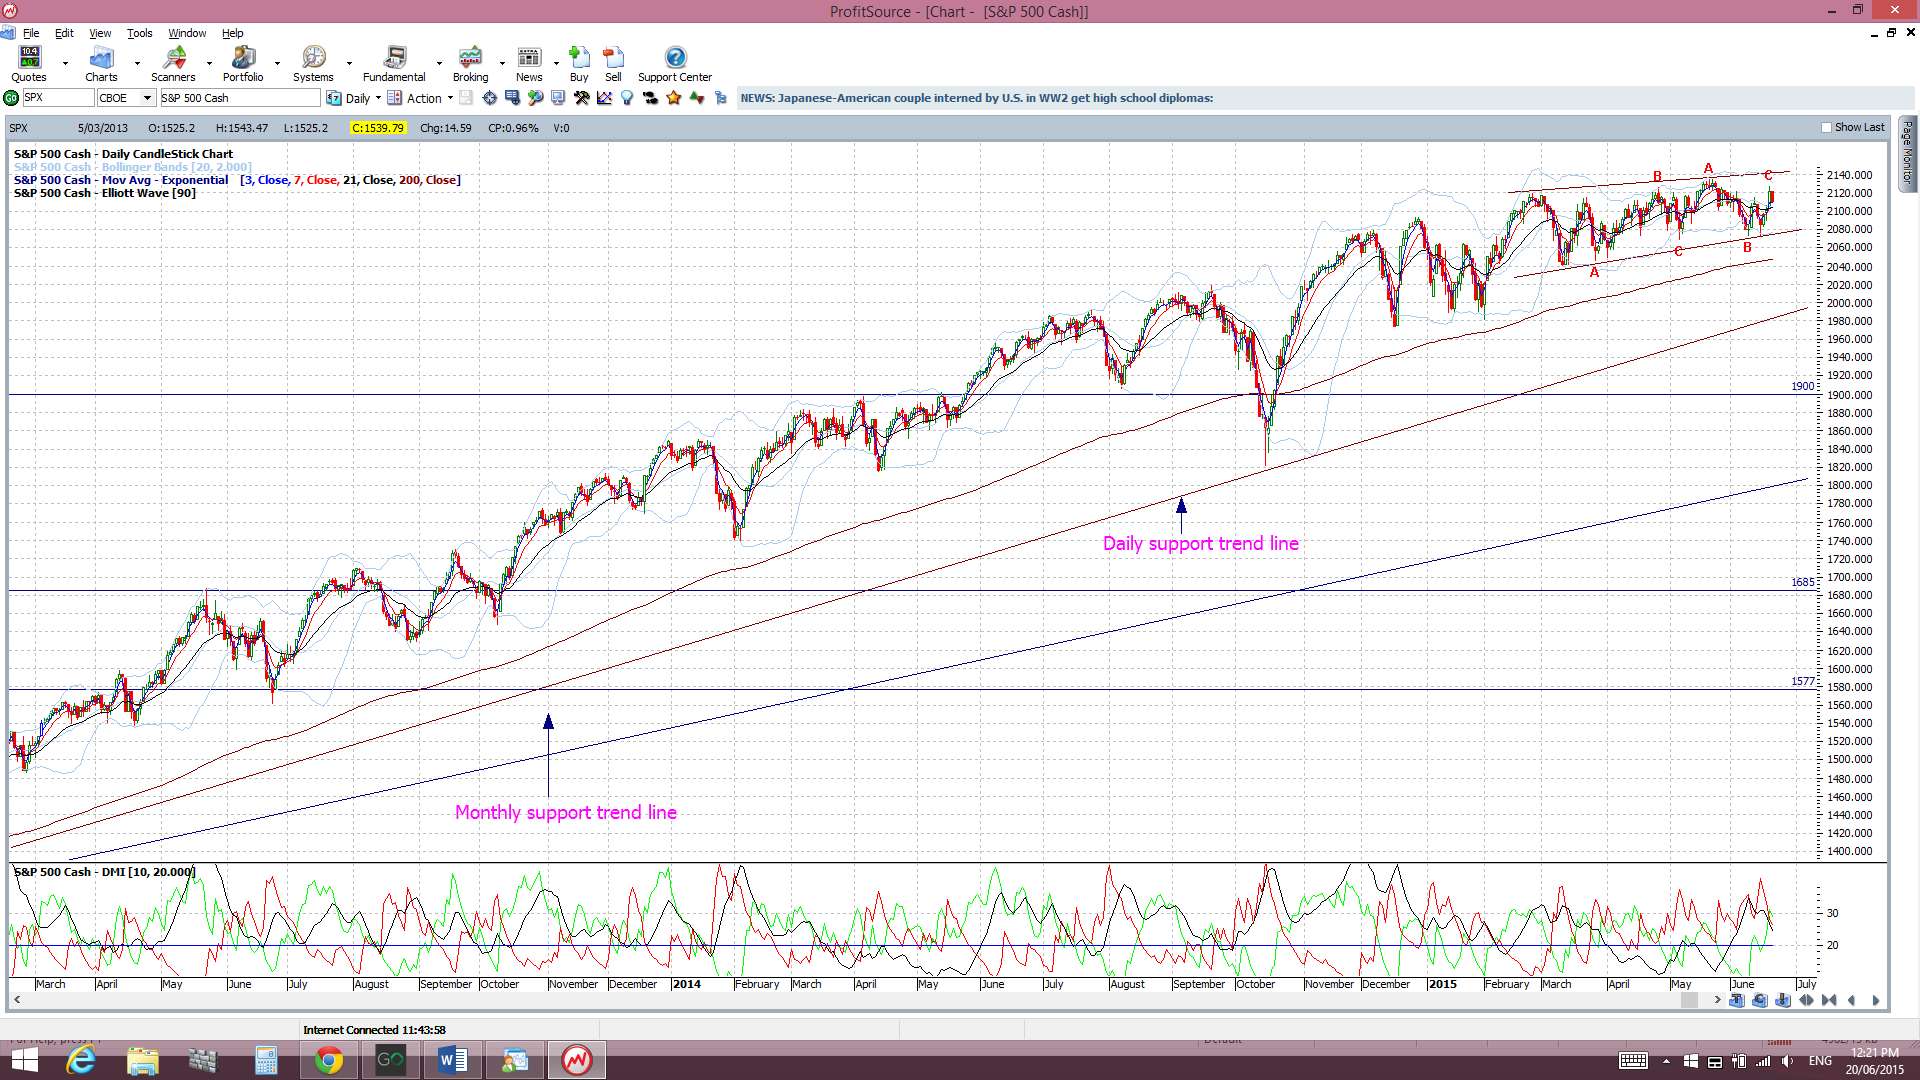
S&P500 daily chart: The index closed back above the psychological 2,100 level and is still above daily trend line support. The possible bearish ascending wedge is still in play though and so I’ll keep watching these trend lines:
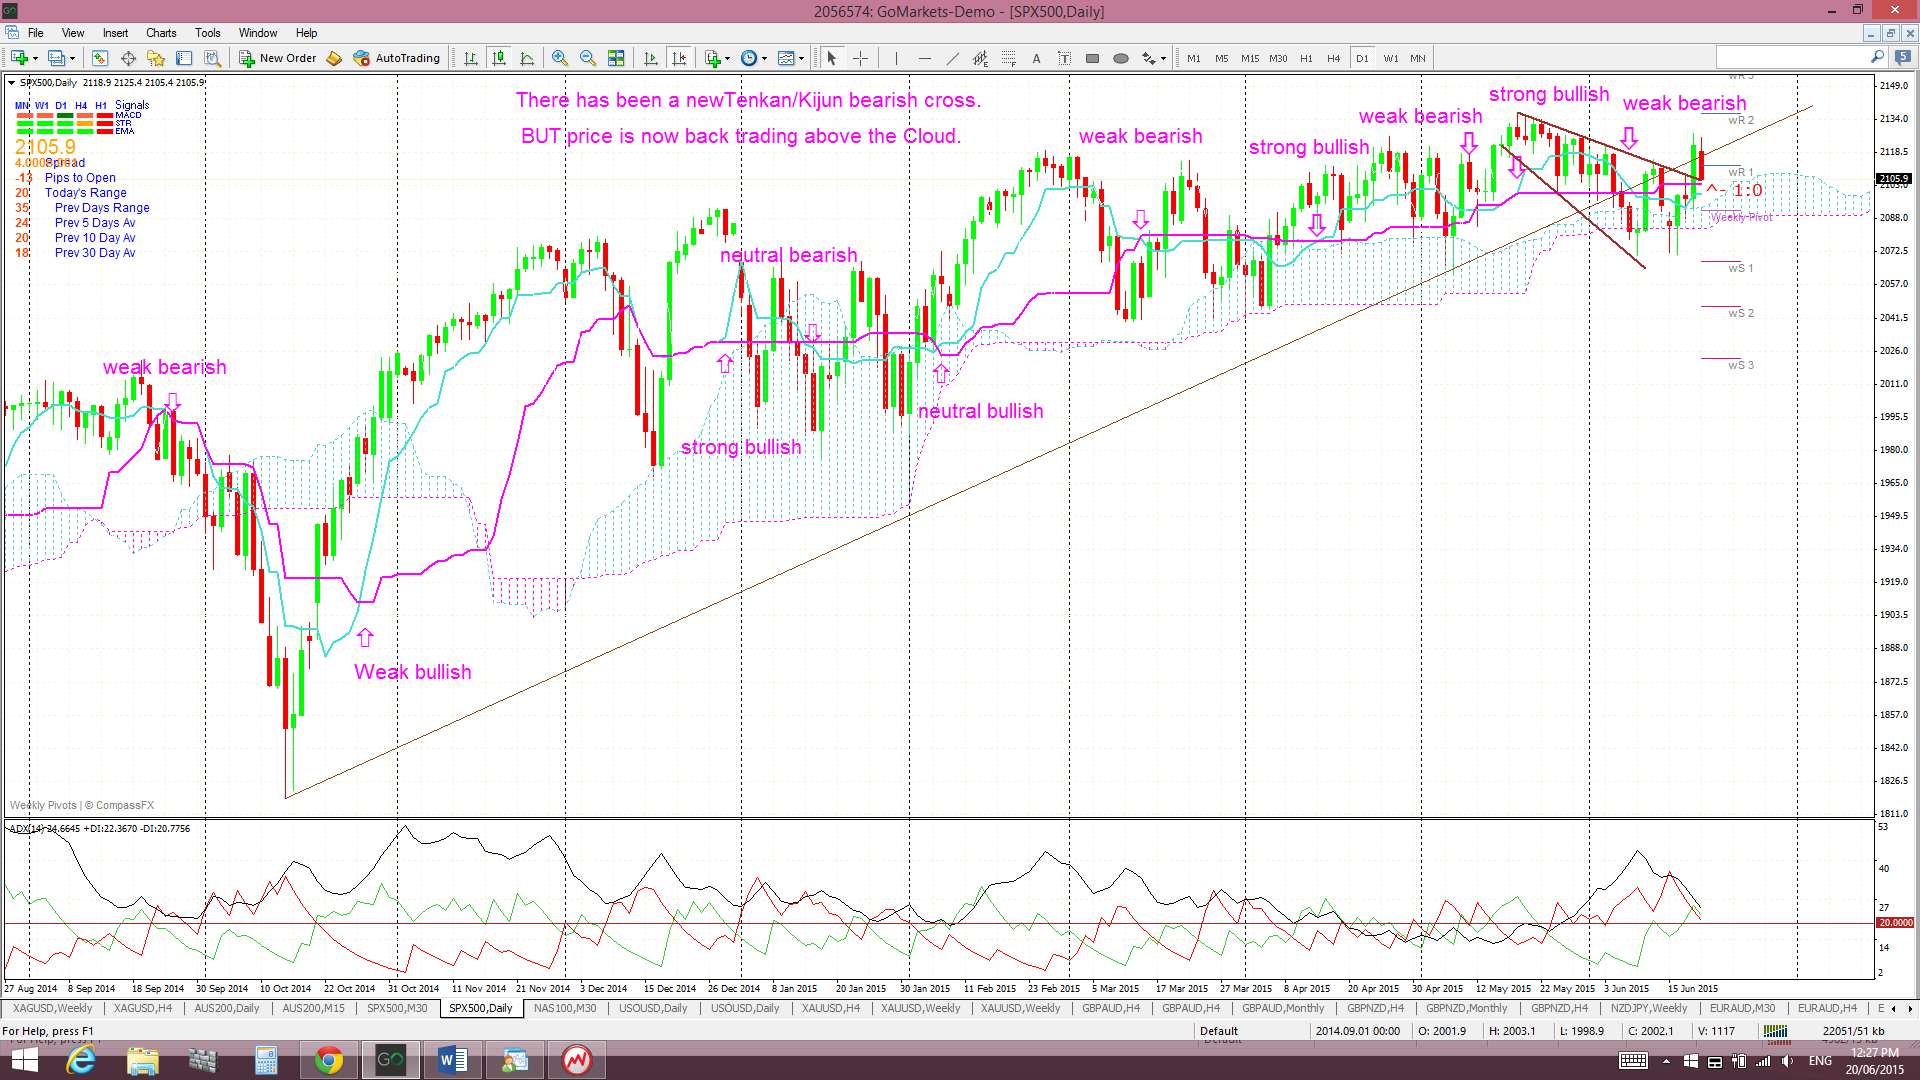
Ichimoku S&P500 chart: a clear cross of the blue Tenkan-sen line below the pink Kijun-sen line. There has been a recent bearish Tenkan/Kijun cross here but this evolved above the Cloud and so is deemed a ‘WEAK’ signal. Price is above the Cloud though so watch for any hold above this support and for any new bullish cross:
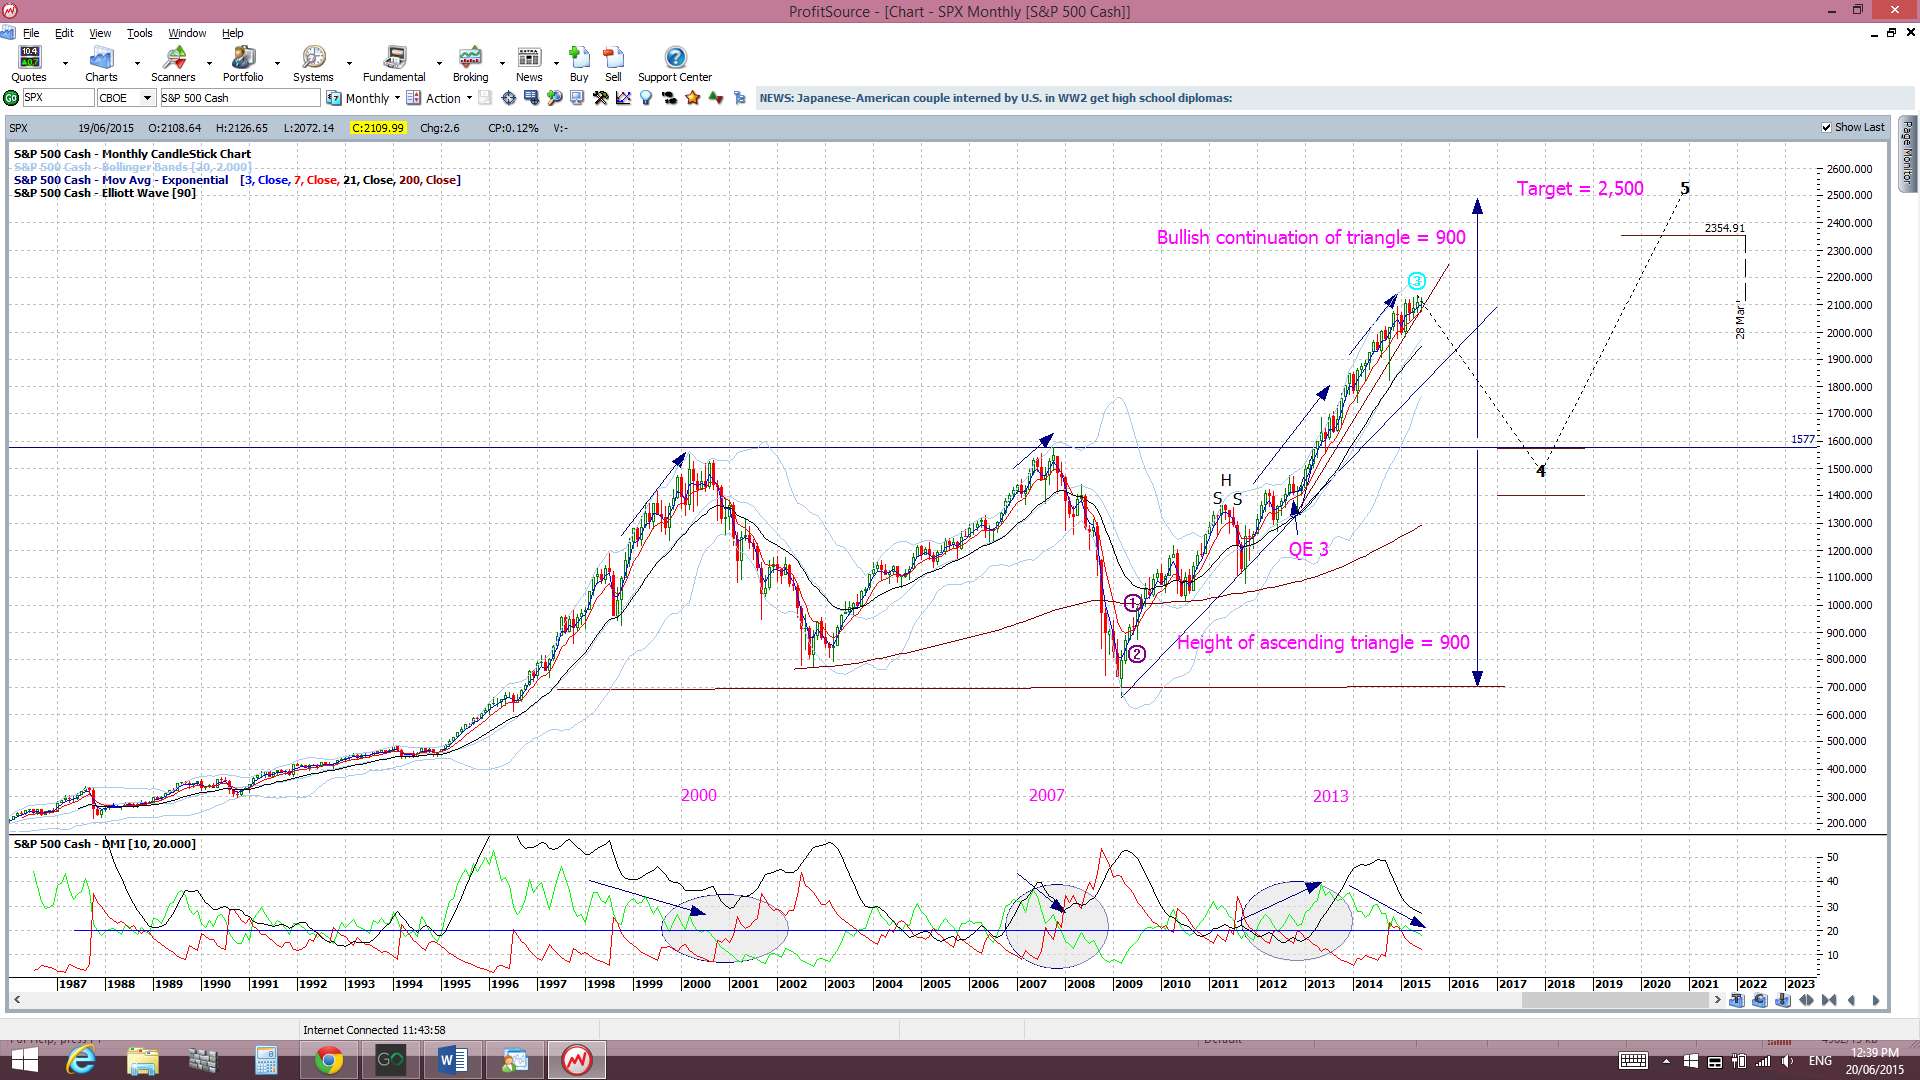
S&P500 monthly chart: a break of the monthly support trend line. The monthly trend line remains intact but a break of this support level would suggest to me of a more severe pull back or correction. I am still seeing divergence on the monthly chart for now though.
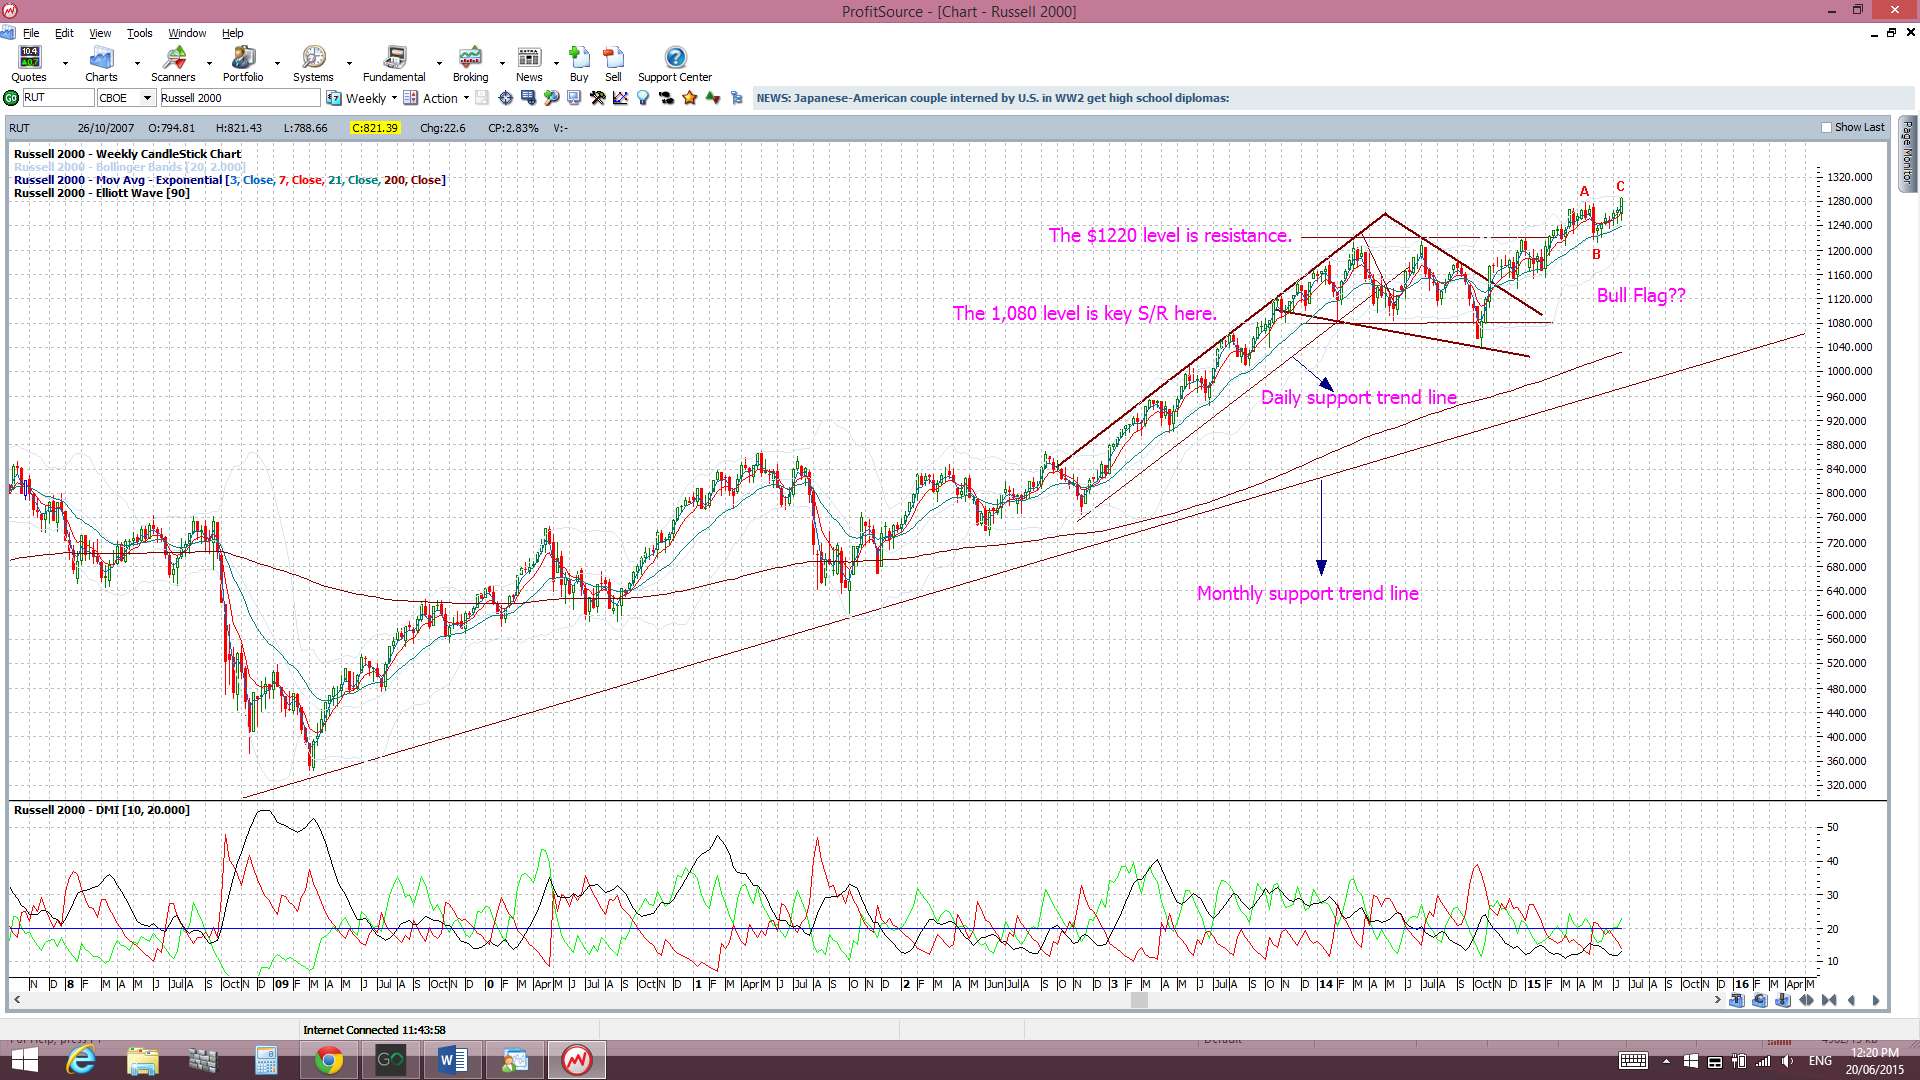
Russell 2000 Index: this small caps index is considered a US market ‘bellwether’ and so the fact it is still trading above the key 1,220 level and printed another bullish weekly candle is noteworthy. The Bull Flag seems to be picking up steam.
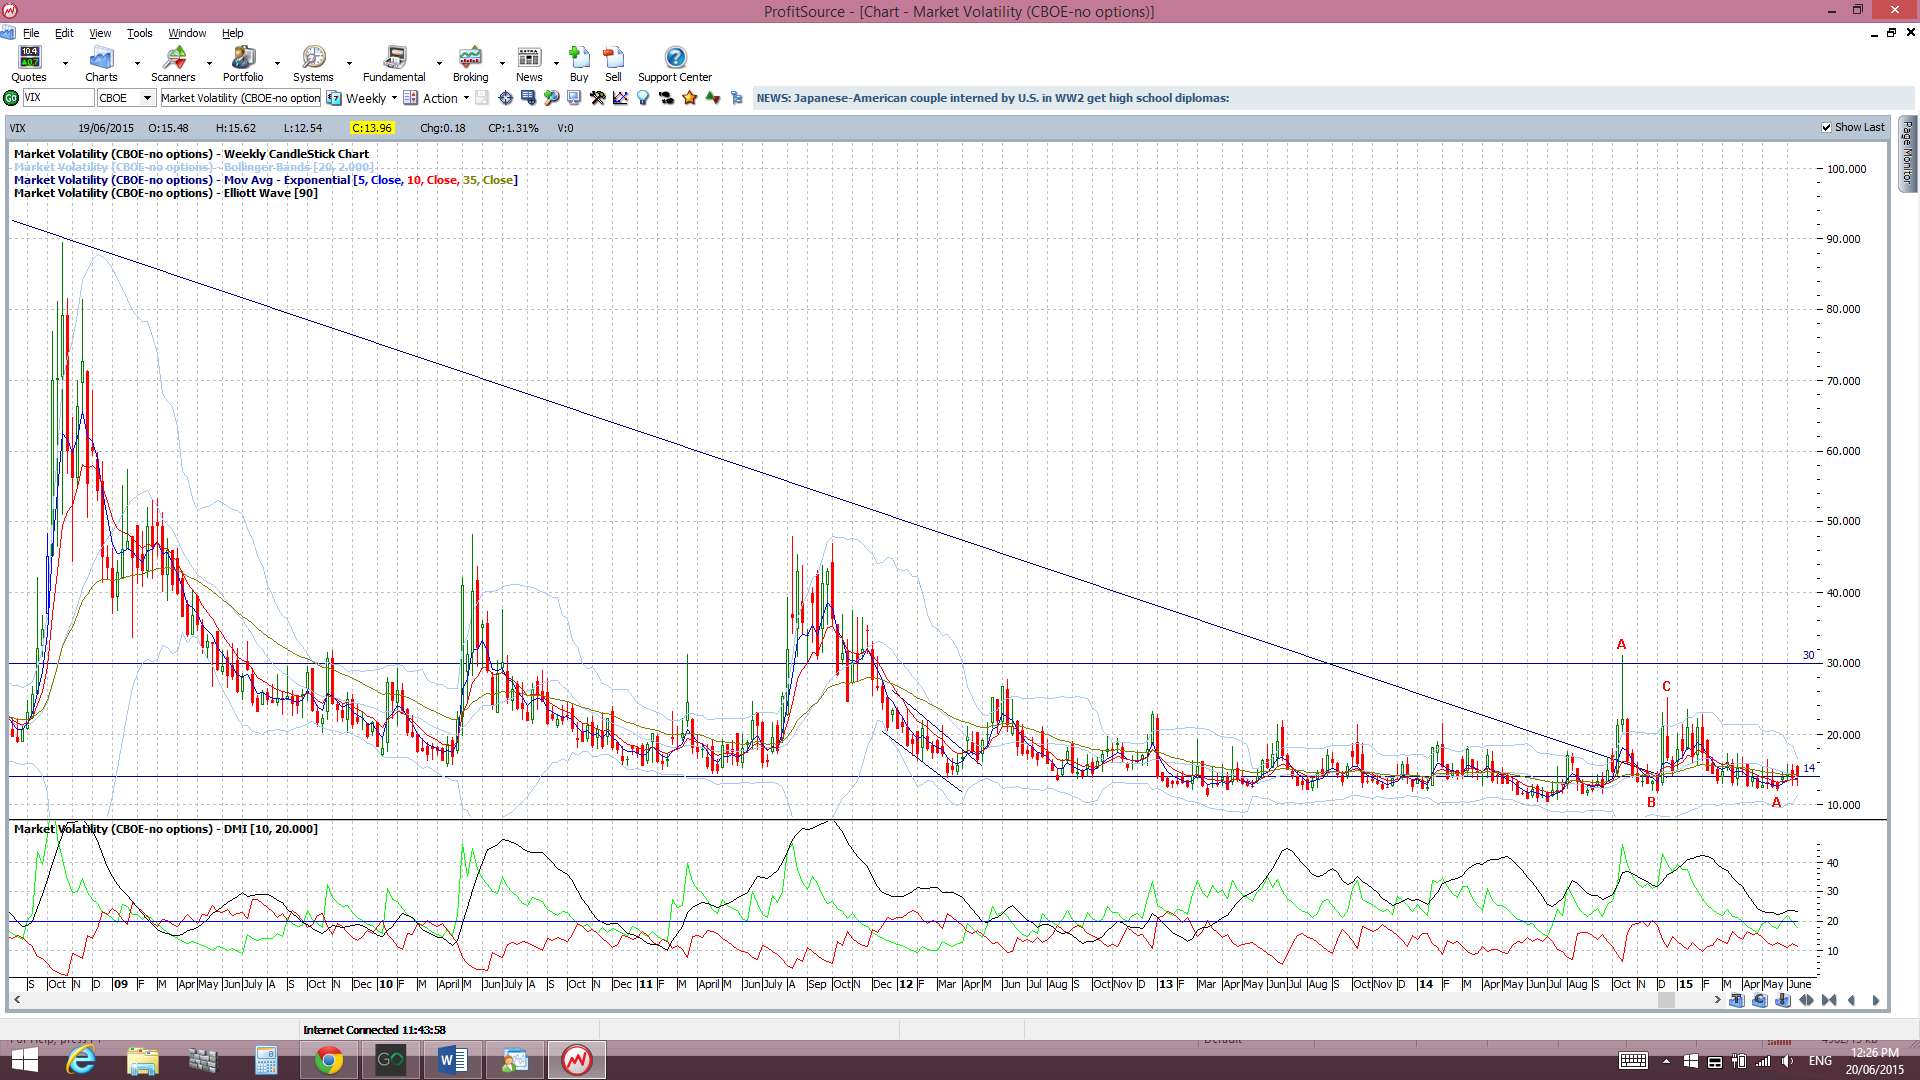
VIX Index: The ‘Fear’ index is back below the 14 level and printed a bearish weekly candle, in spite of the Grexit concern.
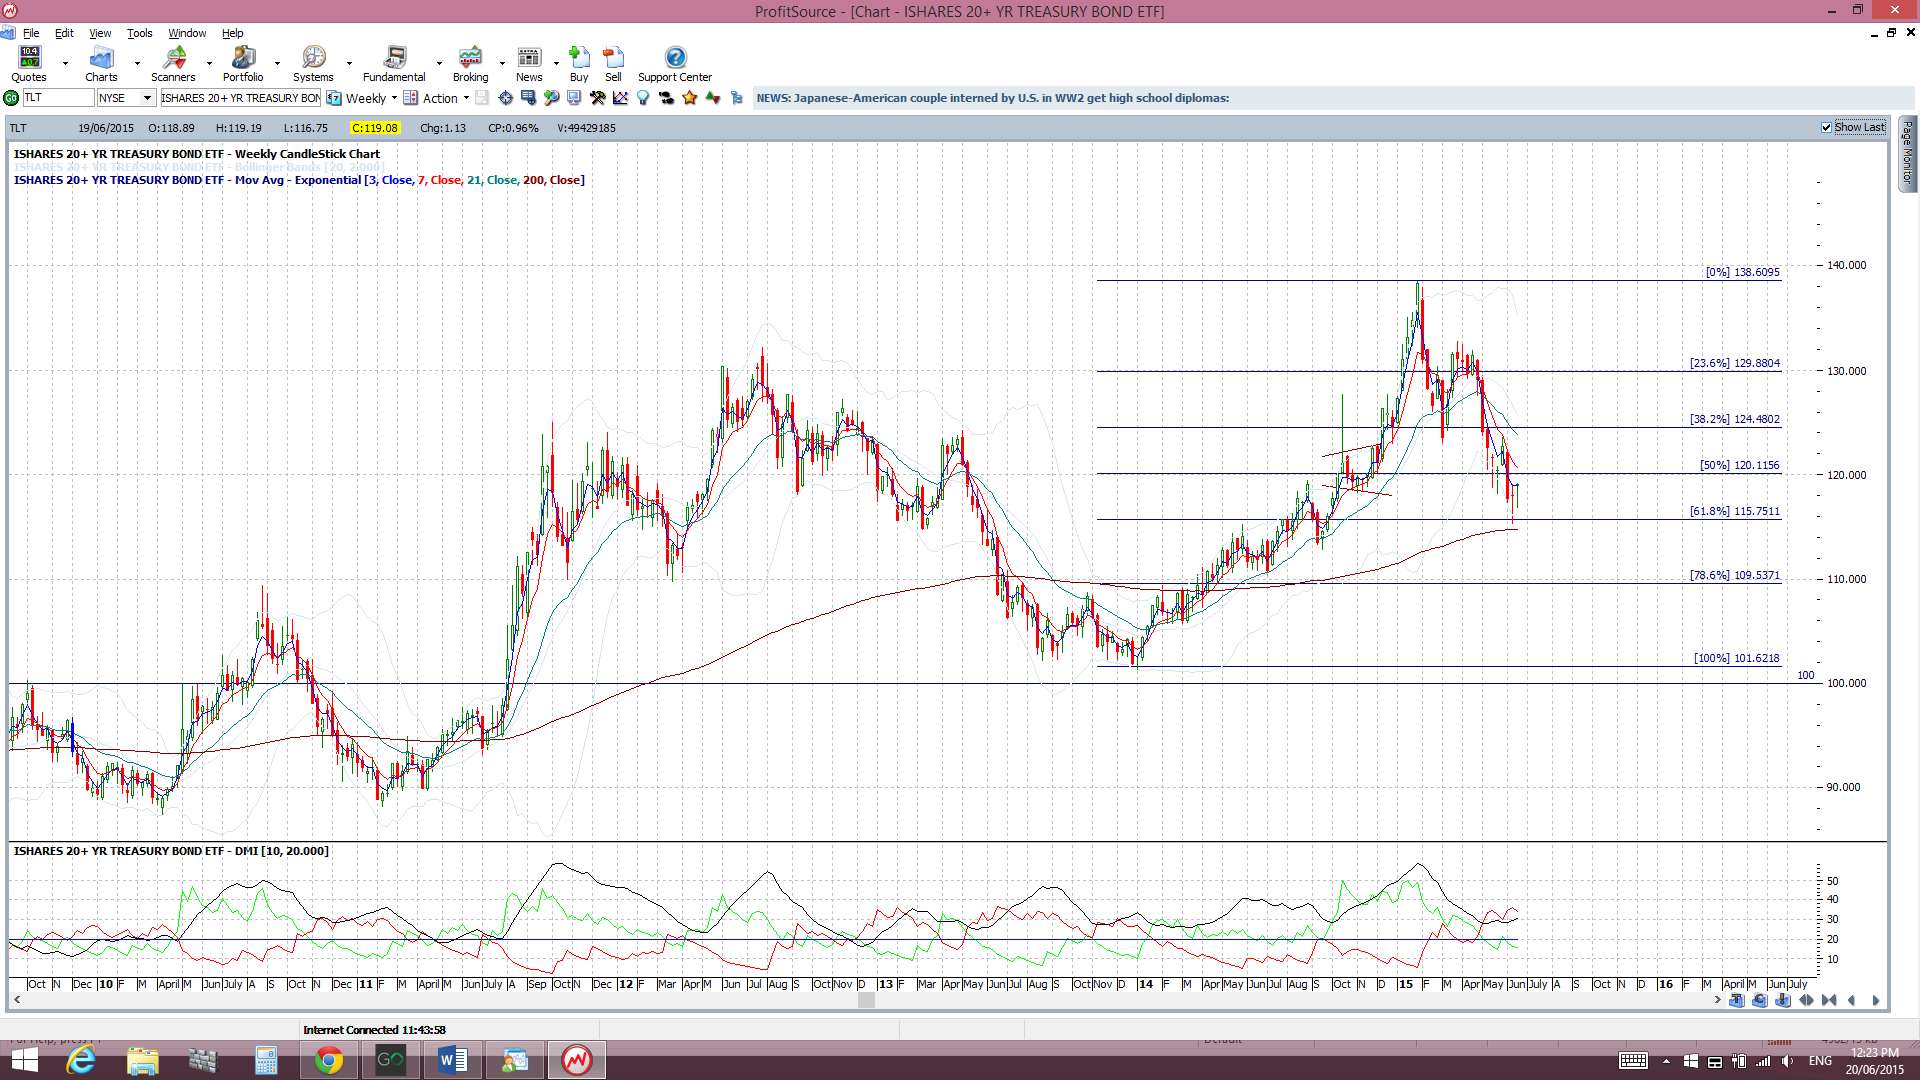
Bonds: The bond ETF had another indecision week and has bounced up off the 61.8% fib level.
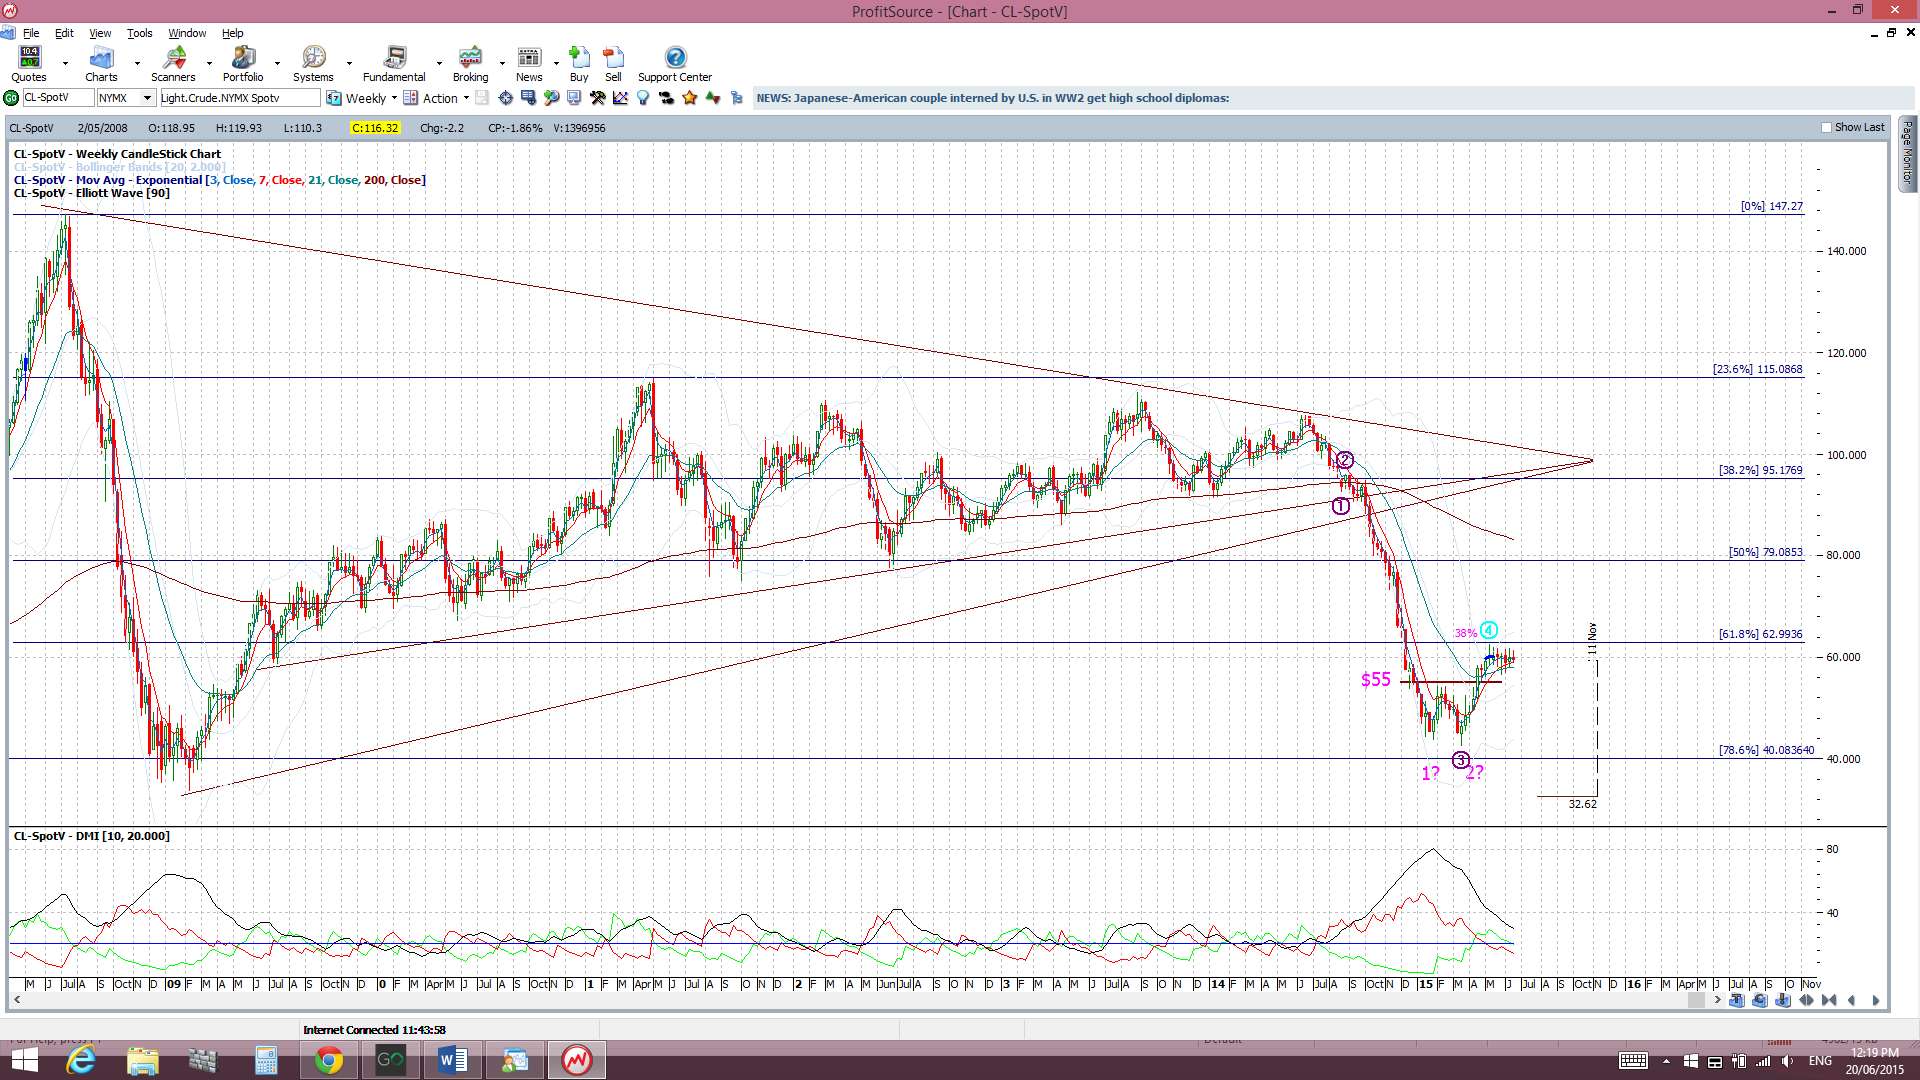
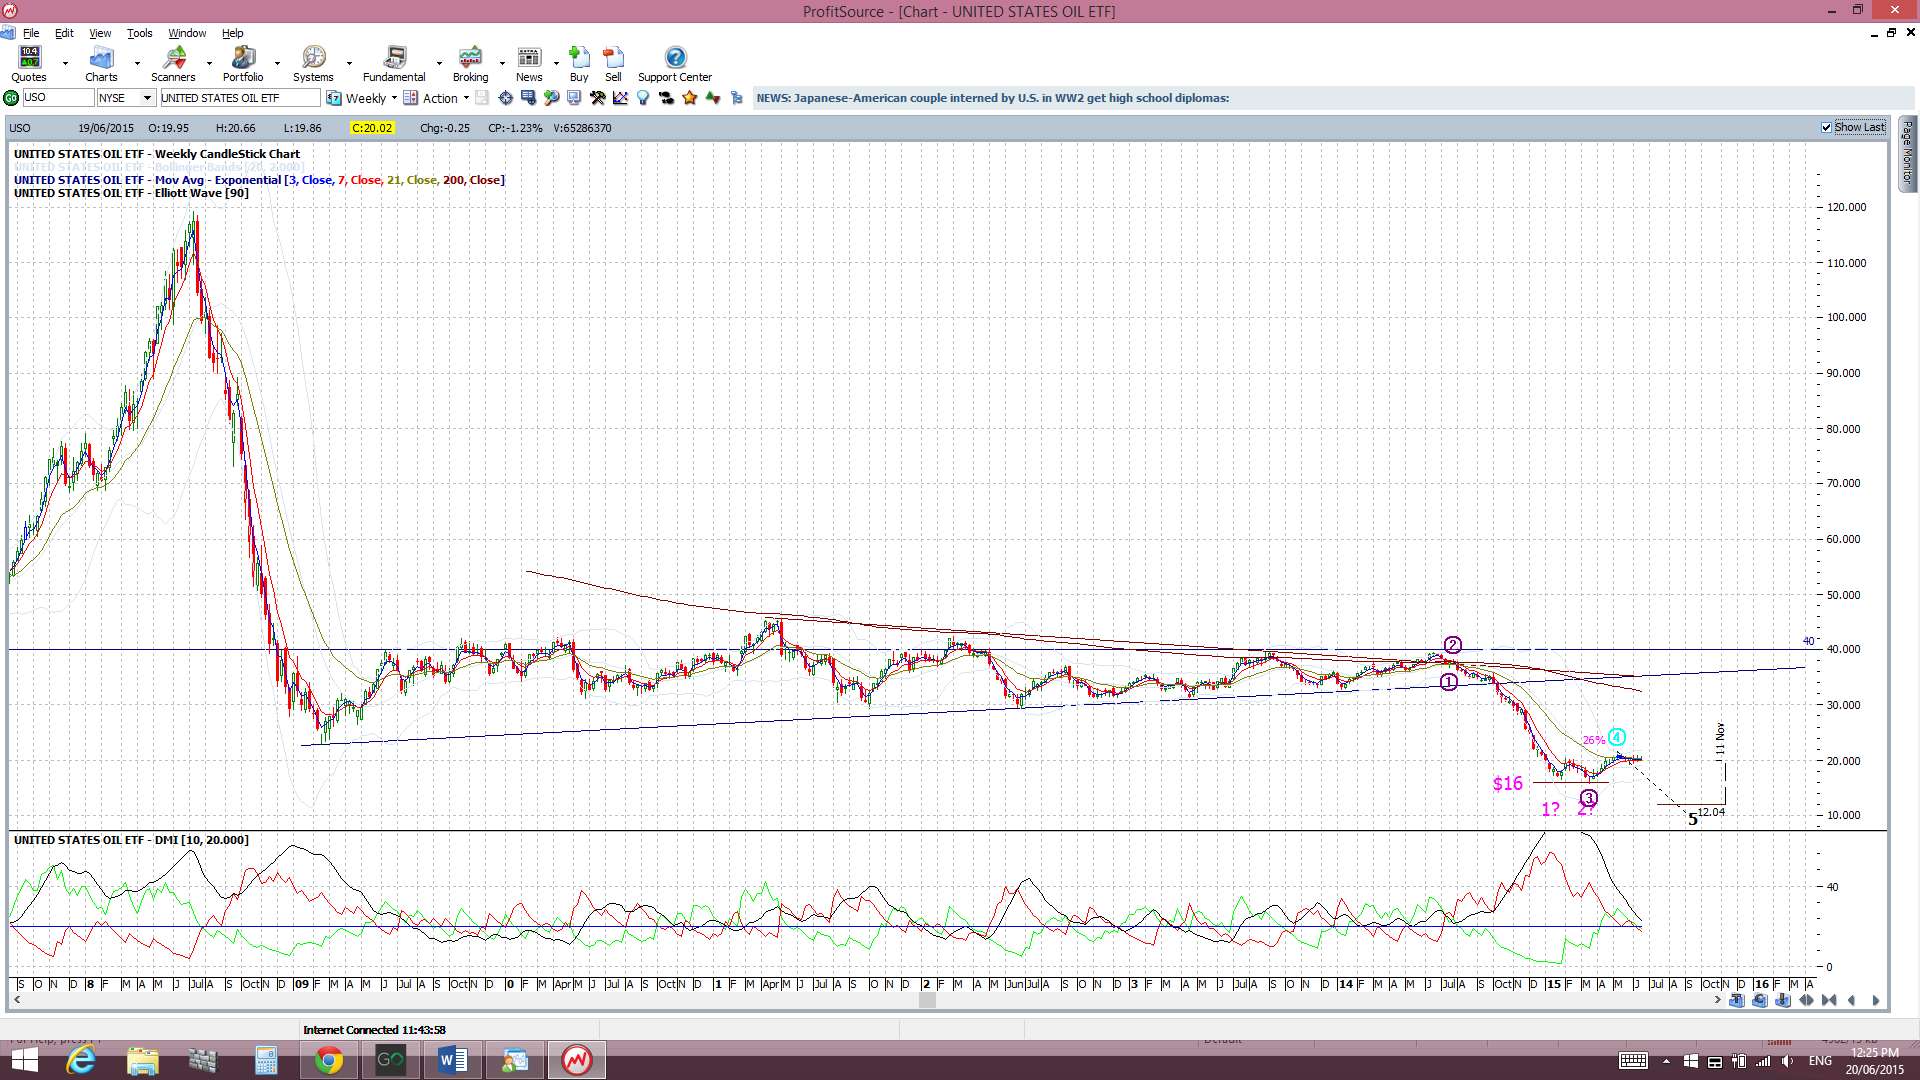
Oil: Oil had a bearish week but is still holding above the breakout region from the bullish ‘Double Bottom’. I’m still on the lookout for a test of the $55 ‘neck line’ breakout level before possible continuation but it continues consolidating near the $60 level for the moment. USO is still holding near $20 following a bullish ‘Double Bottom’ breakout but printed a small bullish weekly candle.
Trading Calendar Items to watch out for:
- Mon 22nd: CNY Bank Holiday. EUR Euro Summit and Eurogroup Emergency meetings. USD Existing Home Sales.
- Tue 23rd: CNY HSBC Flash Manufacturing PMI. EUR French & German Flash Manufacturing PMI. GBP Inflation Report Hearings. USD Core Durable Goods.
- Wed 24th: EUR German Ifo Business Climate. USD Final GDP.
- Thurs 25th: USD Unemployment Claims.
- Fri 26th: NZD Trade Balance. GBP BoE Gov Carney speech.
Forex:
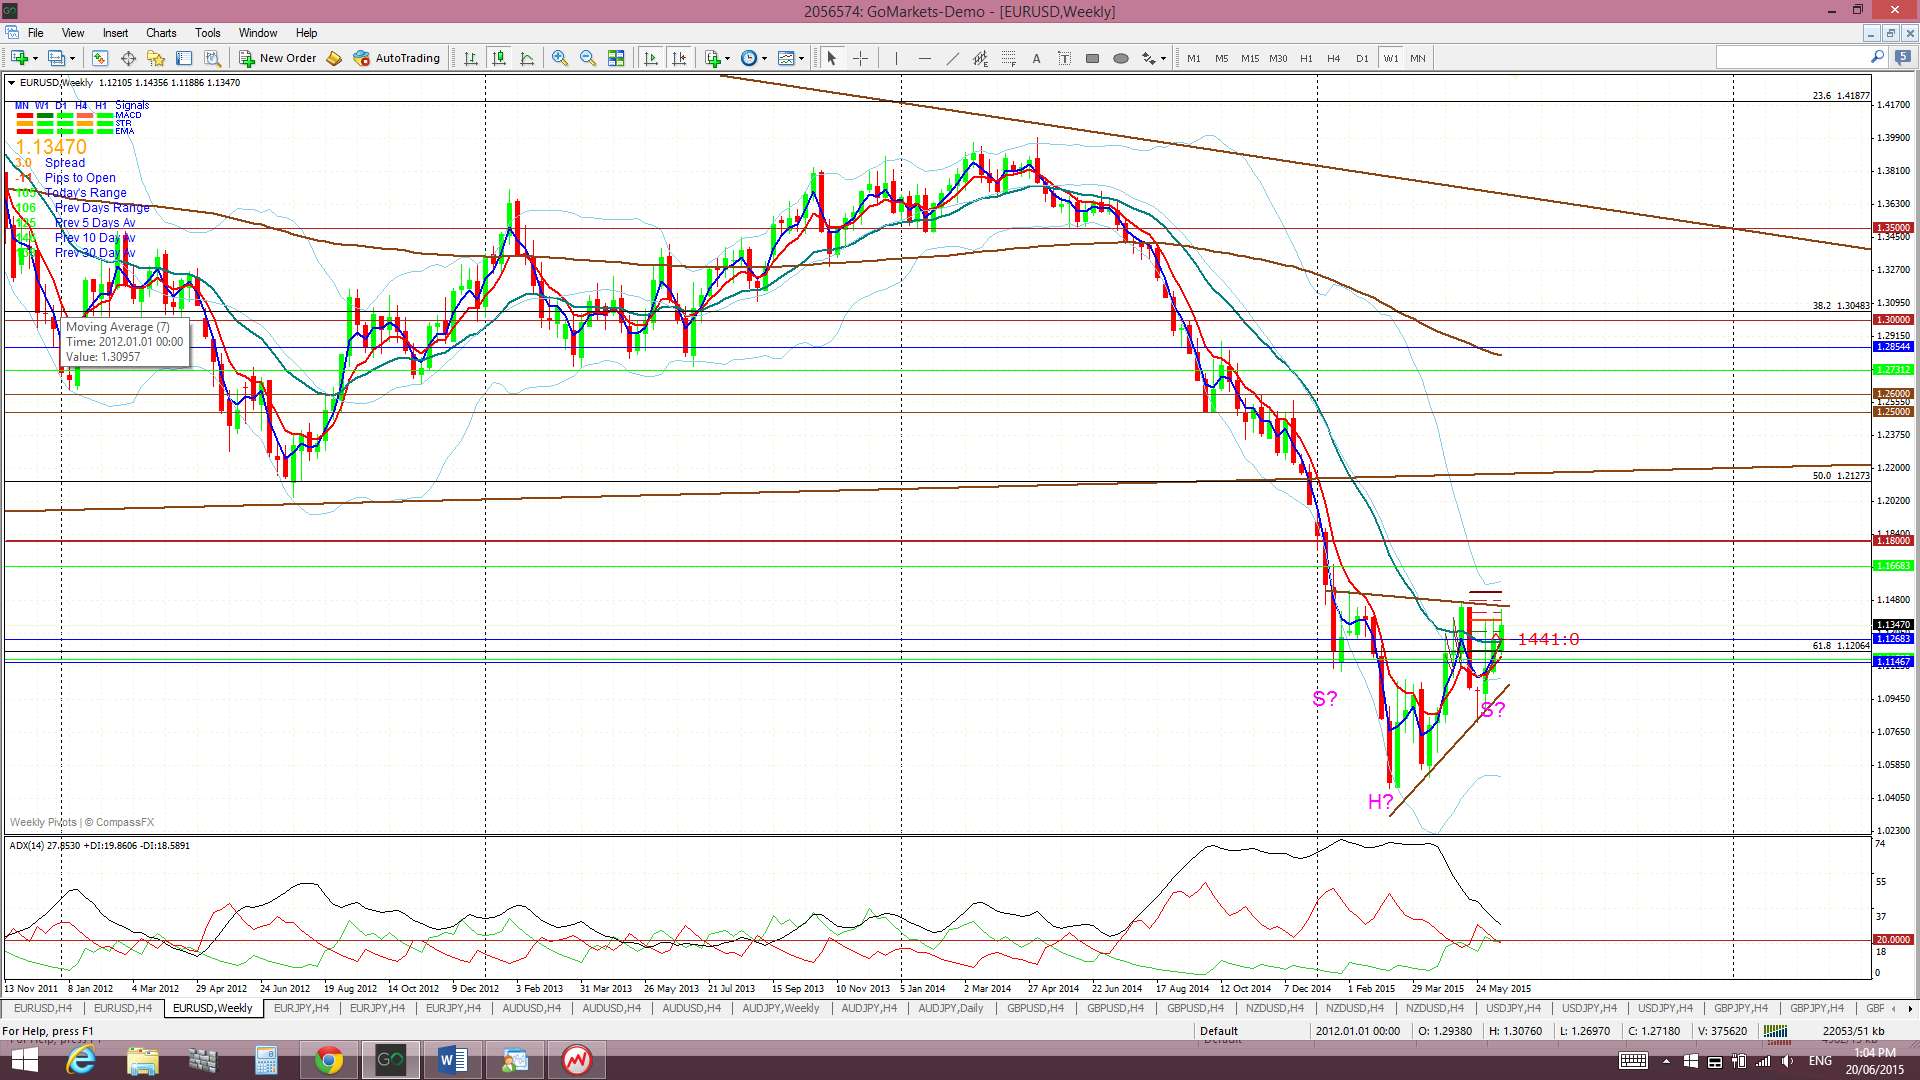
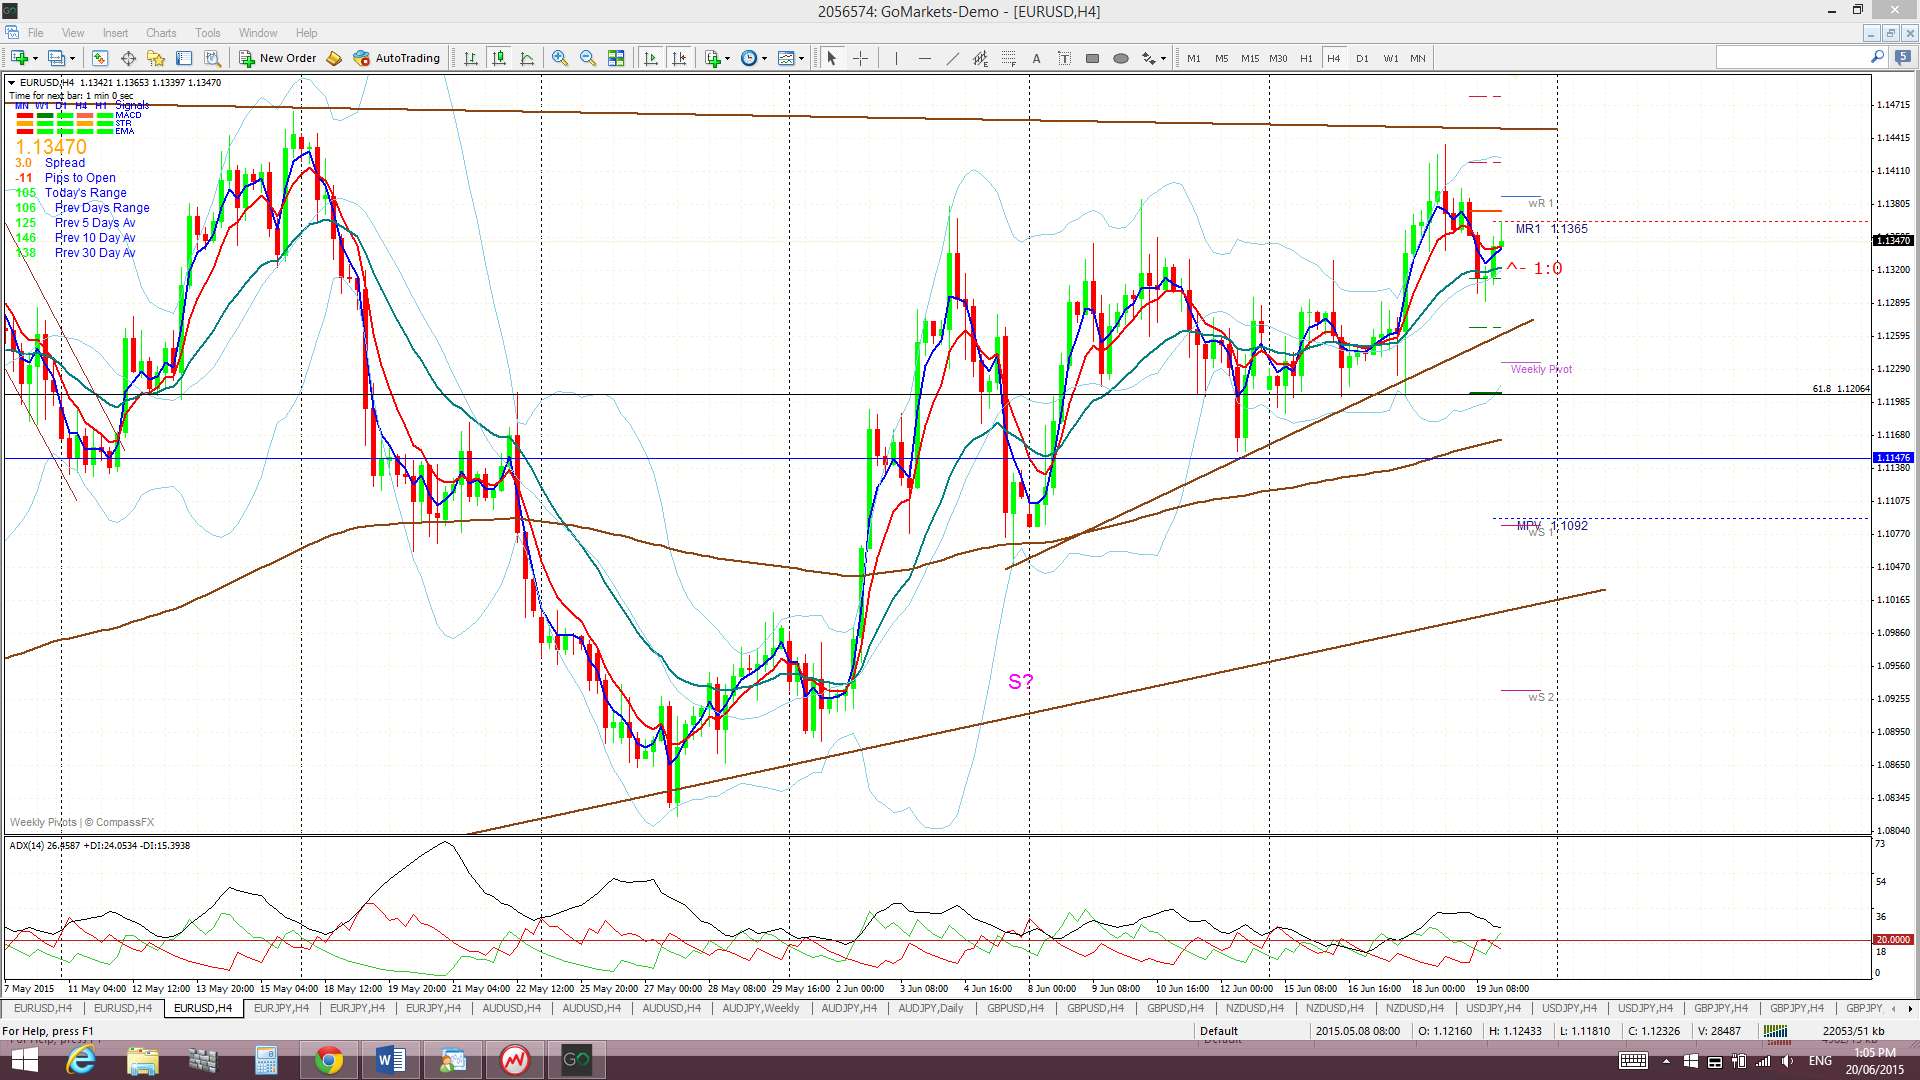
E/U: The E/U had been consolidating within a 4hr triangle for much of the last two weeks and, despite the lack of resolution with Greece, FOMC inspired US$ weakness triggered a bullish breakout. Price is now edging up towards a daily chart triangle trend line that is part of a potential weekly chart Bear Flag. It may be worth watching for any momentum based triangle breakout move here to help track the next major move for this pair.
Price also continues to hold above the 1.12 level and this is significant for this pair as it is the 61.8% fib of the 2000-2008 swing high move. I am still seeing a possible weekly-chart Bear Flag though and any trend line breaks with momentum will hopefully guide traders here.
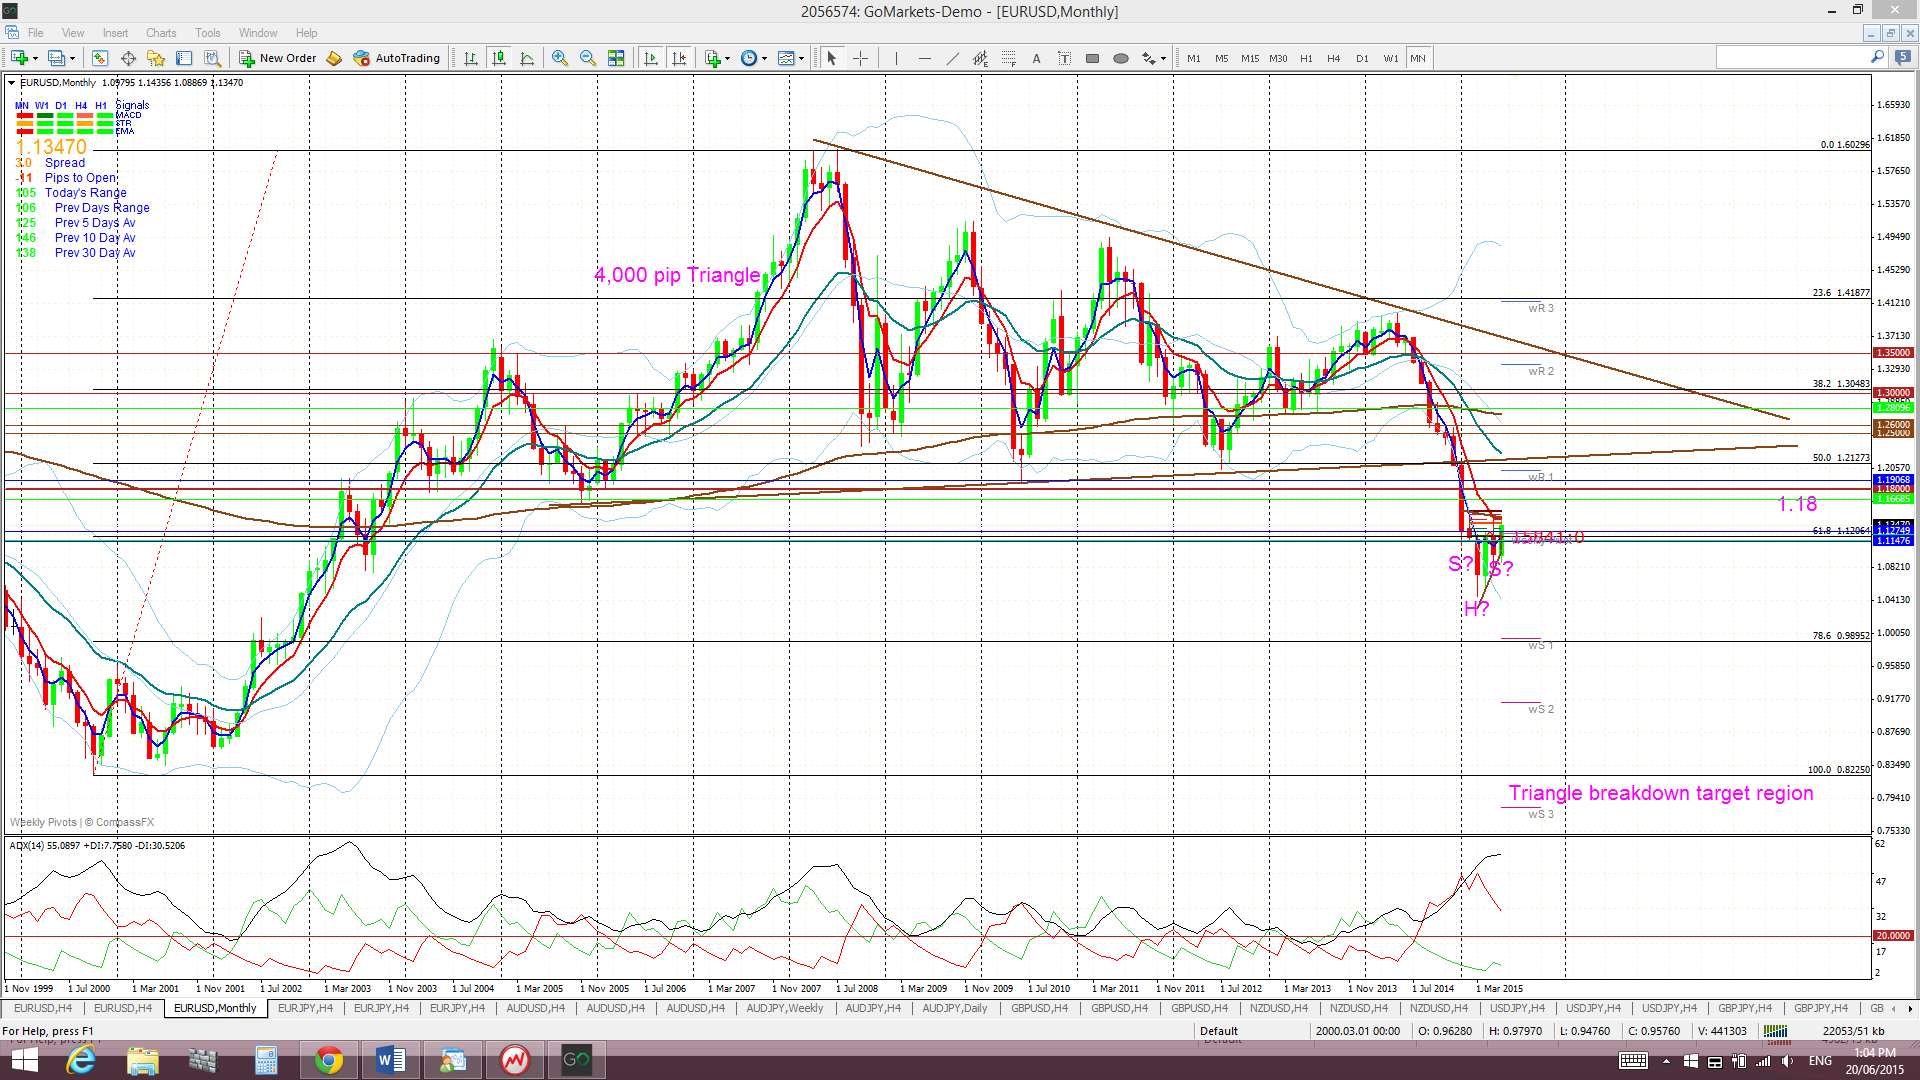
Descending triangle on the monthly chart: Despite some recent bullish activity there is still an overall bearish pattern in play on the E/U monthly chart: a 4,000 pip bearish descending triangle breakdown on the monthly chart. The descending triangle pattern is a bearish continuation pattern and has a base at around the 1.18 level. The height of this triangle is about 4,000 pips. Technical theory would suggest that the bearish breakdown of this triangle below 1.18 might see a similar move. It is worth noting that this would bring the E/U down near 0.80 and to levels not seen since 2000/2001!
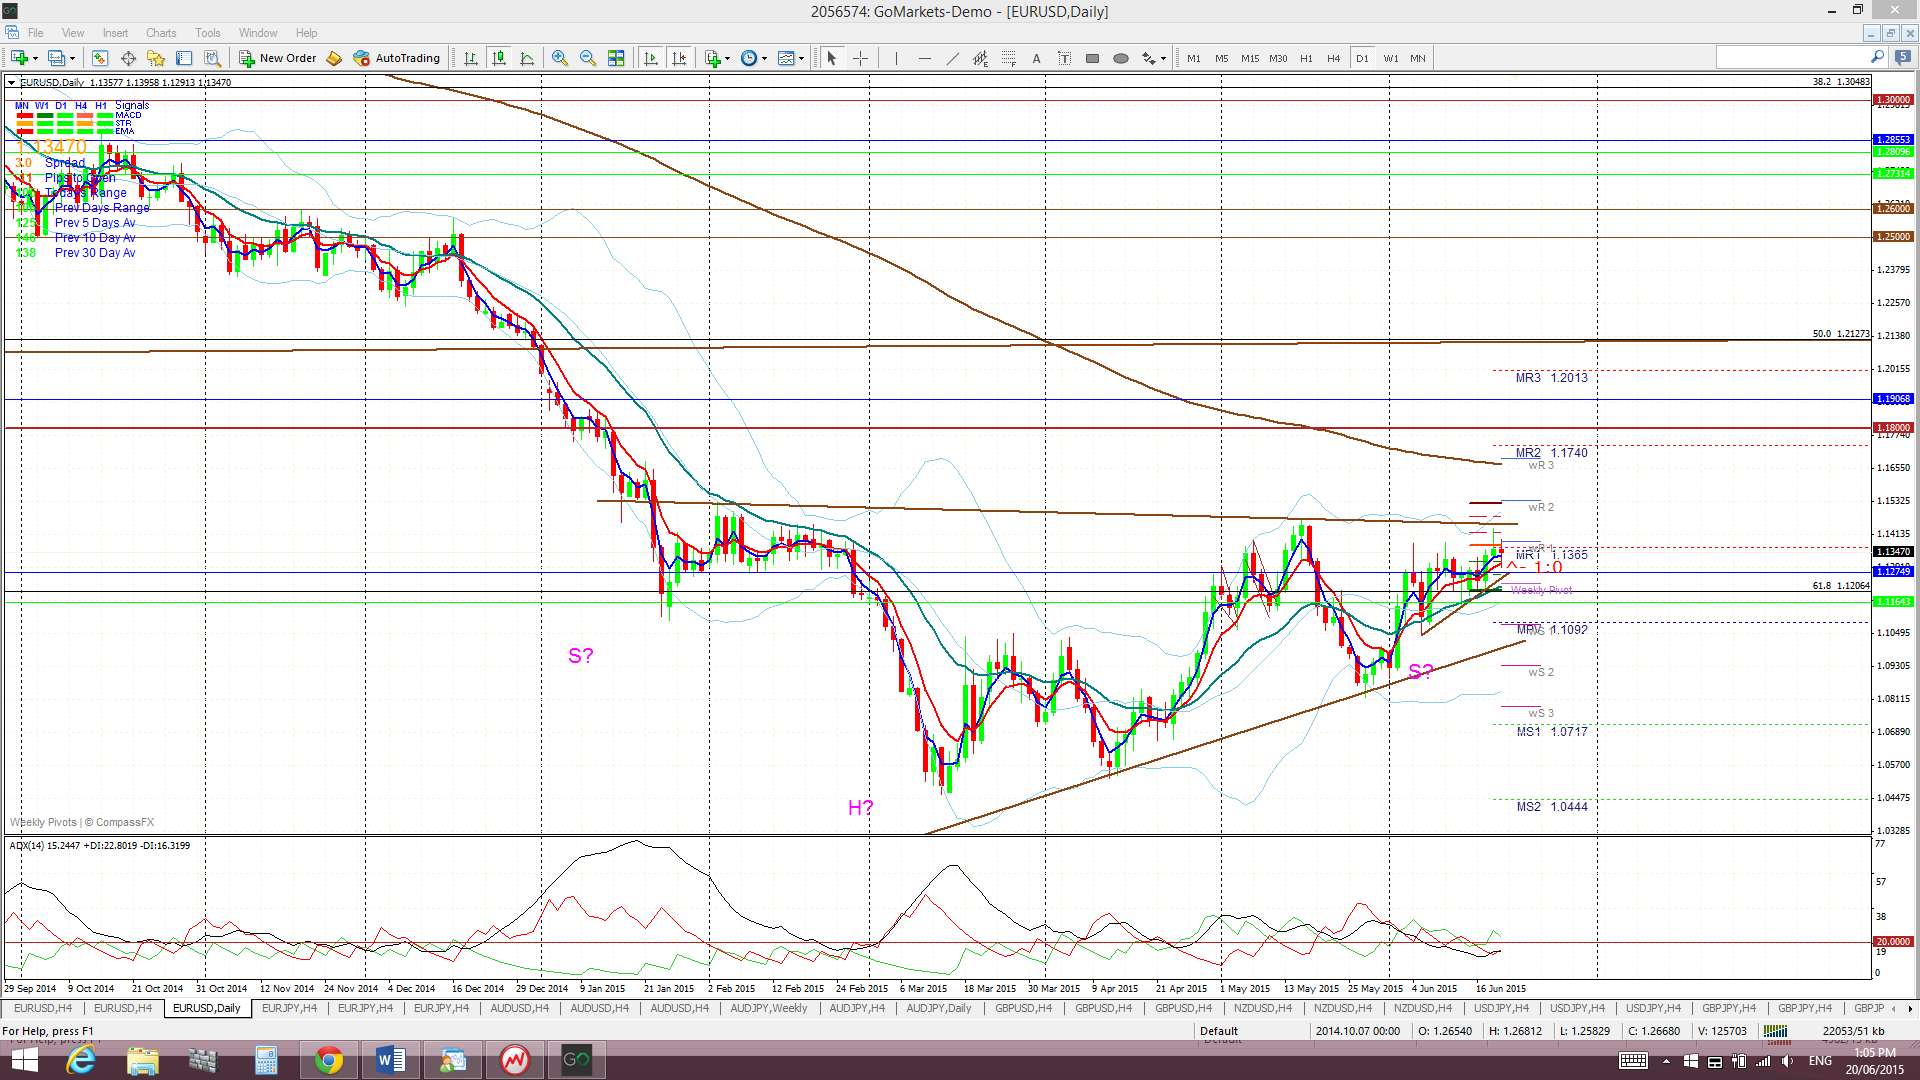
Price is trading above the Ichimoku Cloud on the 4hr & daily chart but below the Cloud on the weekly and monthly charts.
The weekly candle closed as a bullish candle.
Traders need to watch for any w/e and/or Monday news relating to the Greek debt situation as this could trigger huge moves on EUR pairs.
- I’m watching for any new TC signal on this pair and the weekly chart’s Bear Flag trend lines.
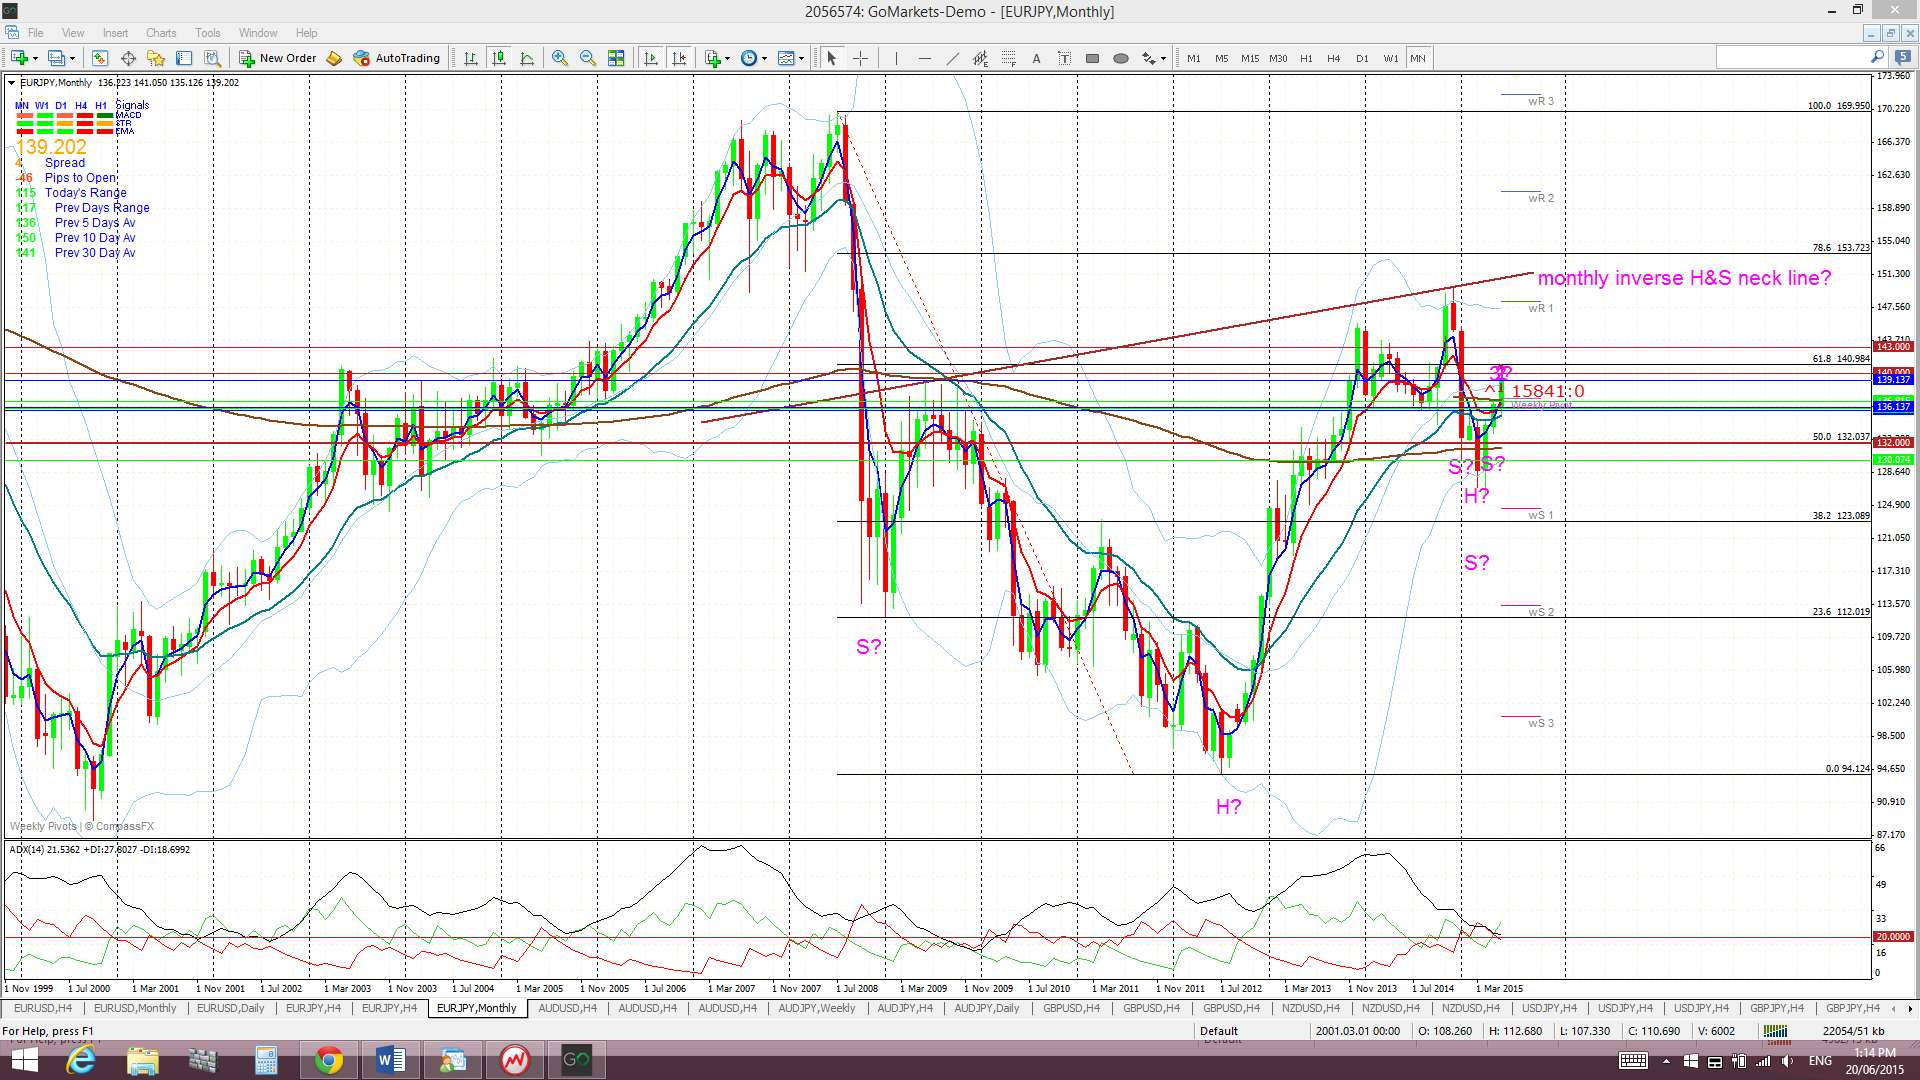
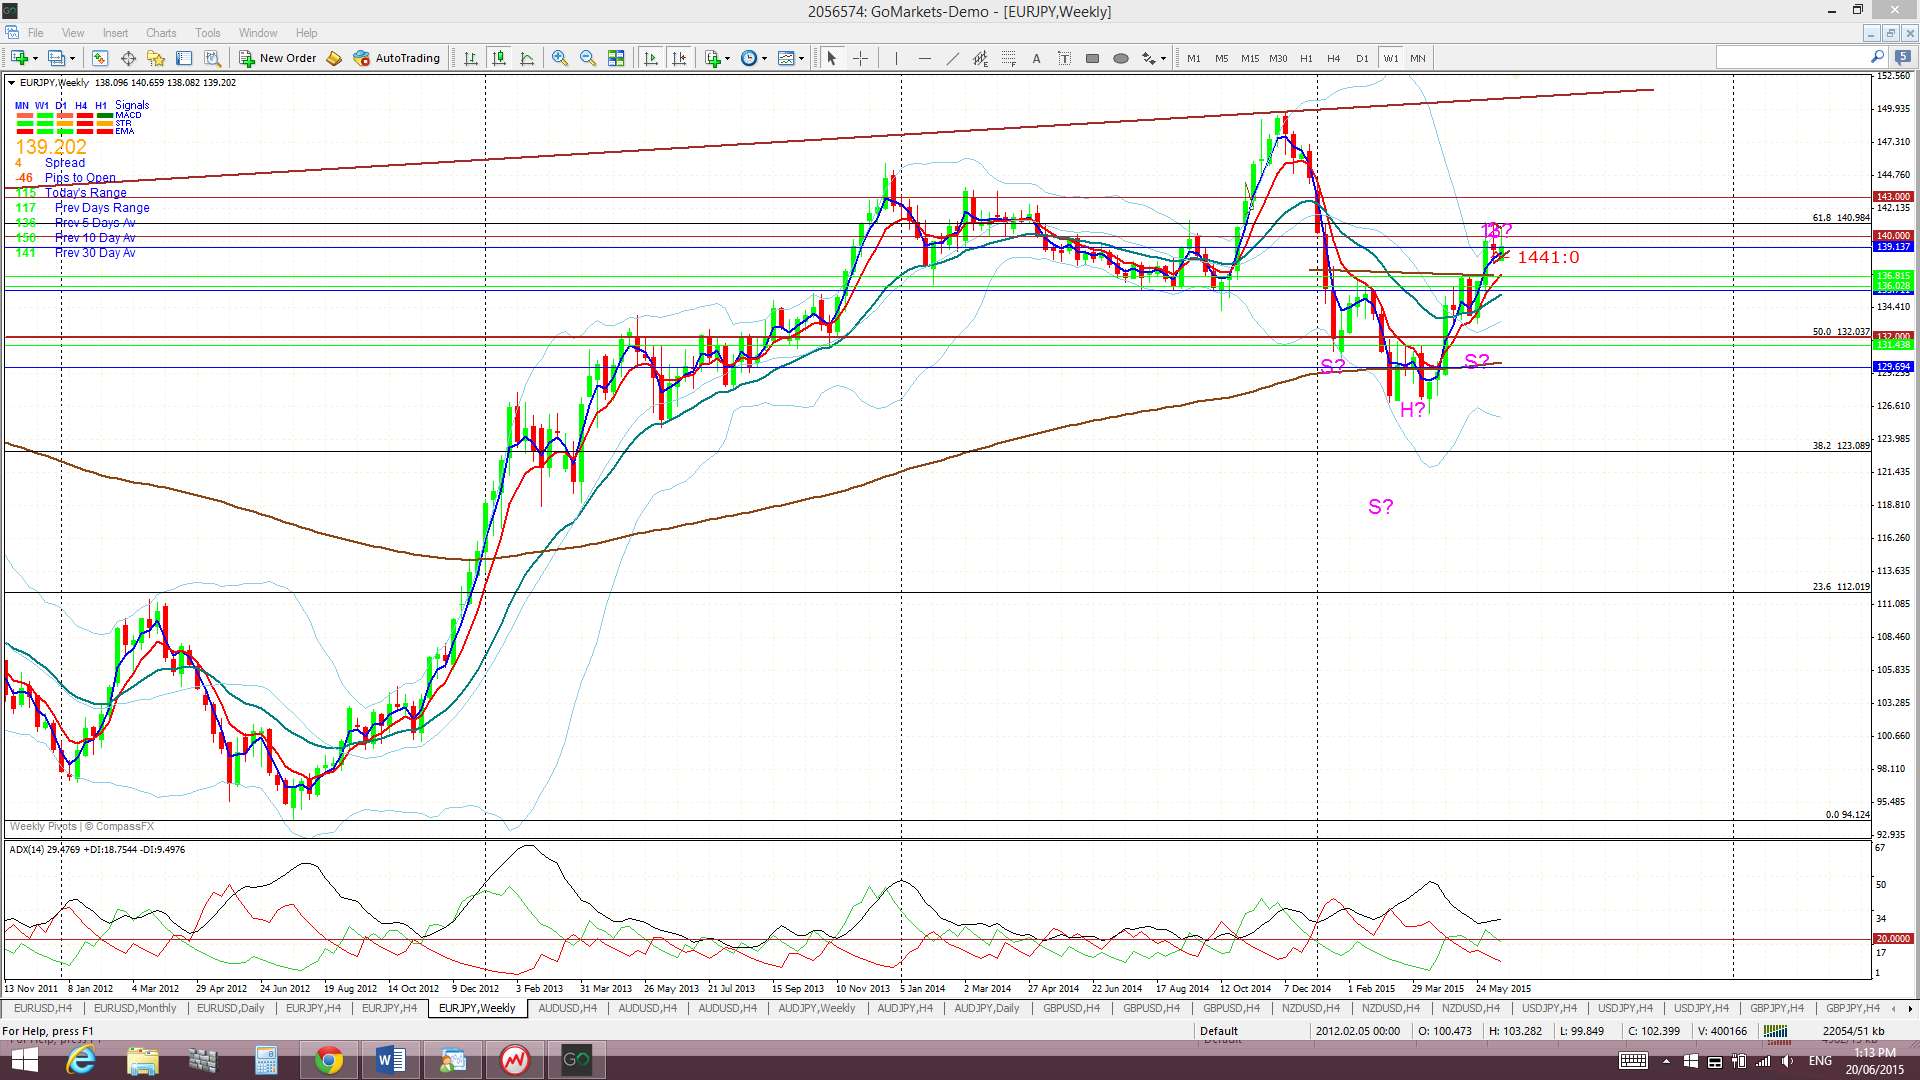
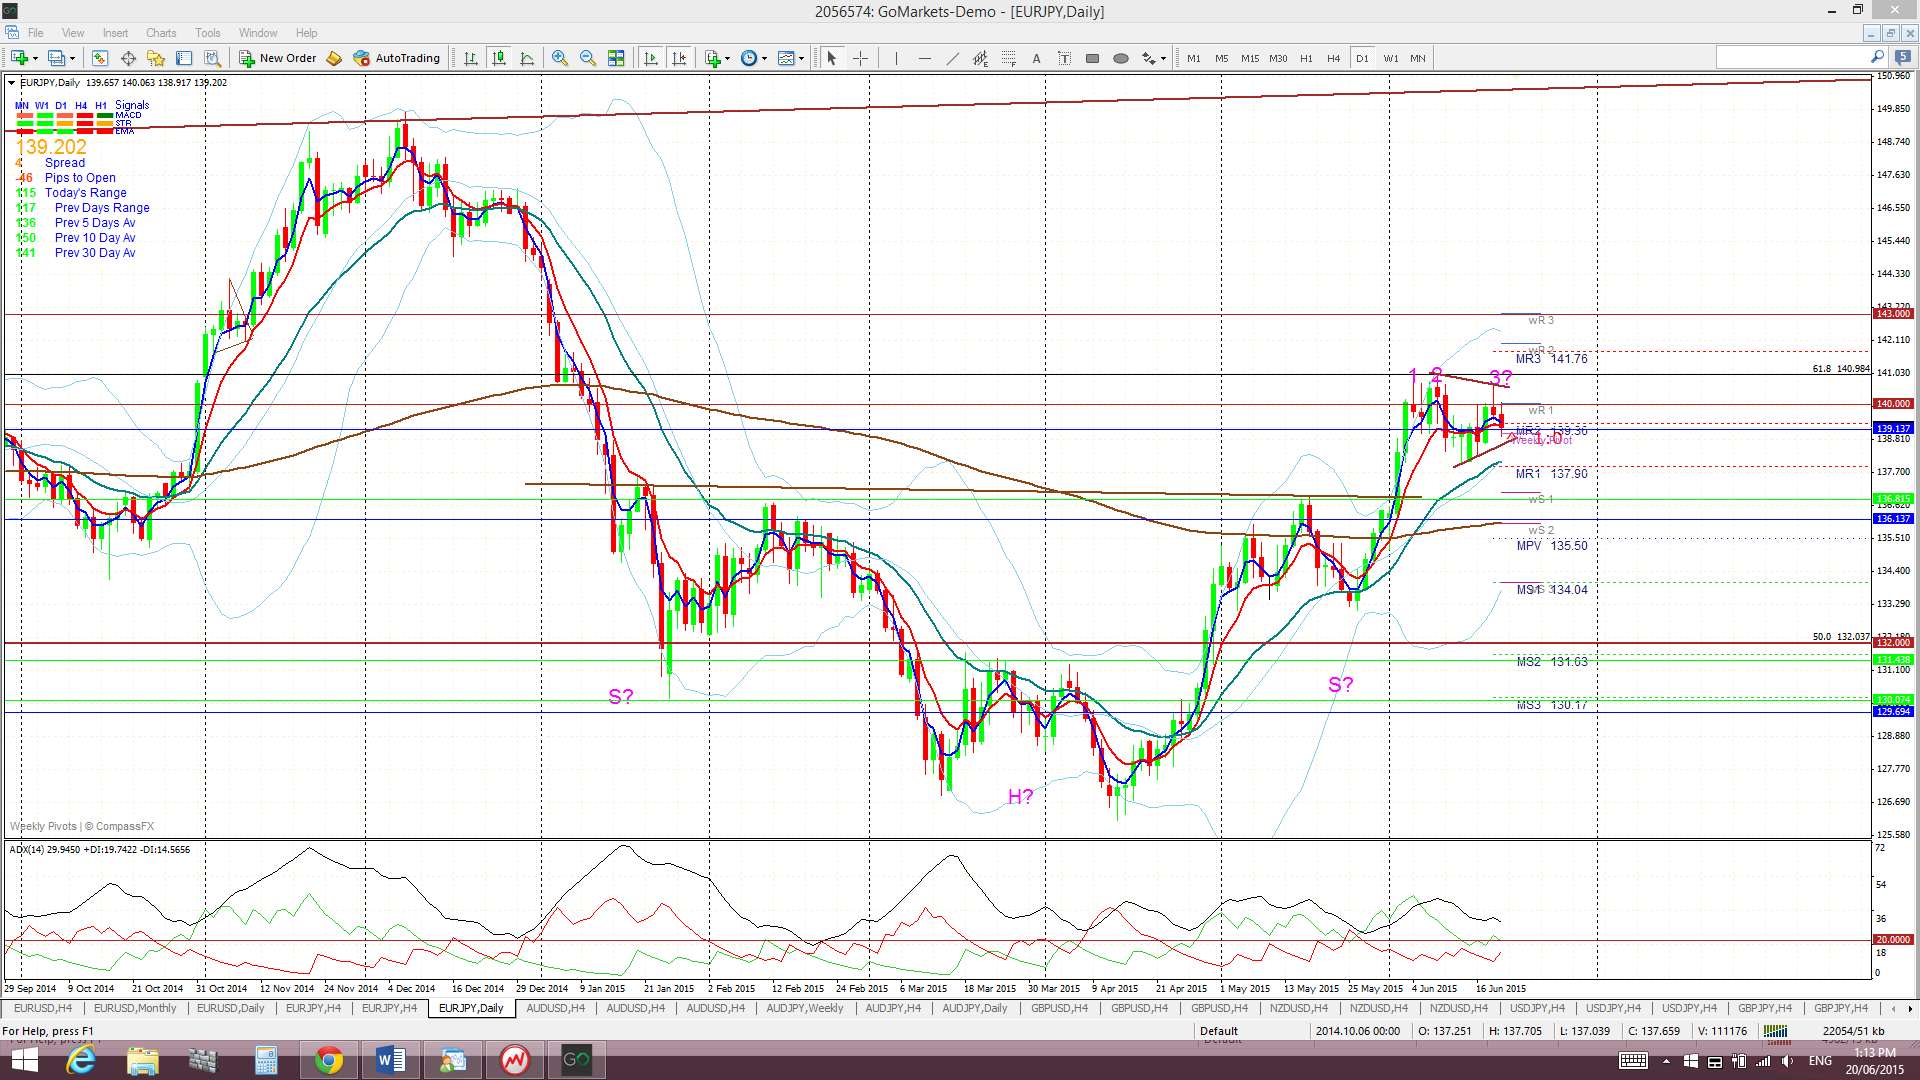
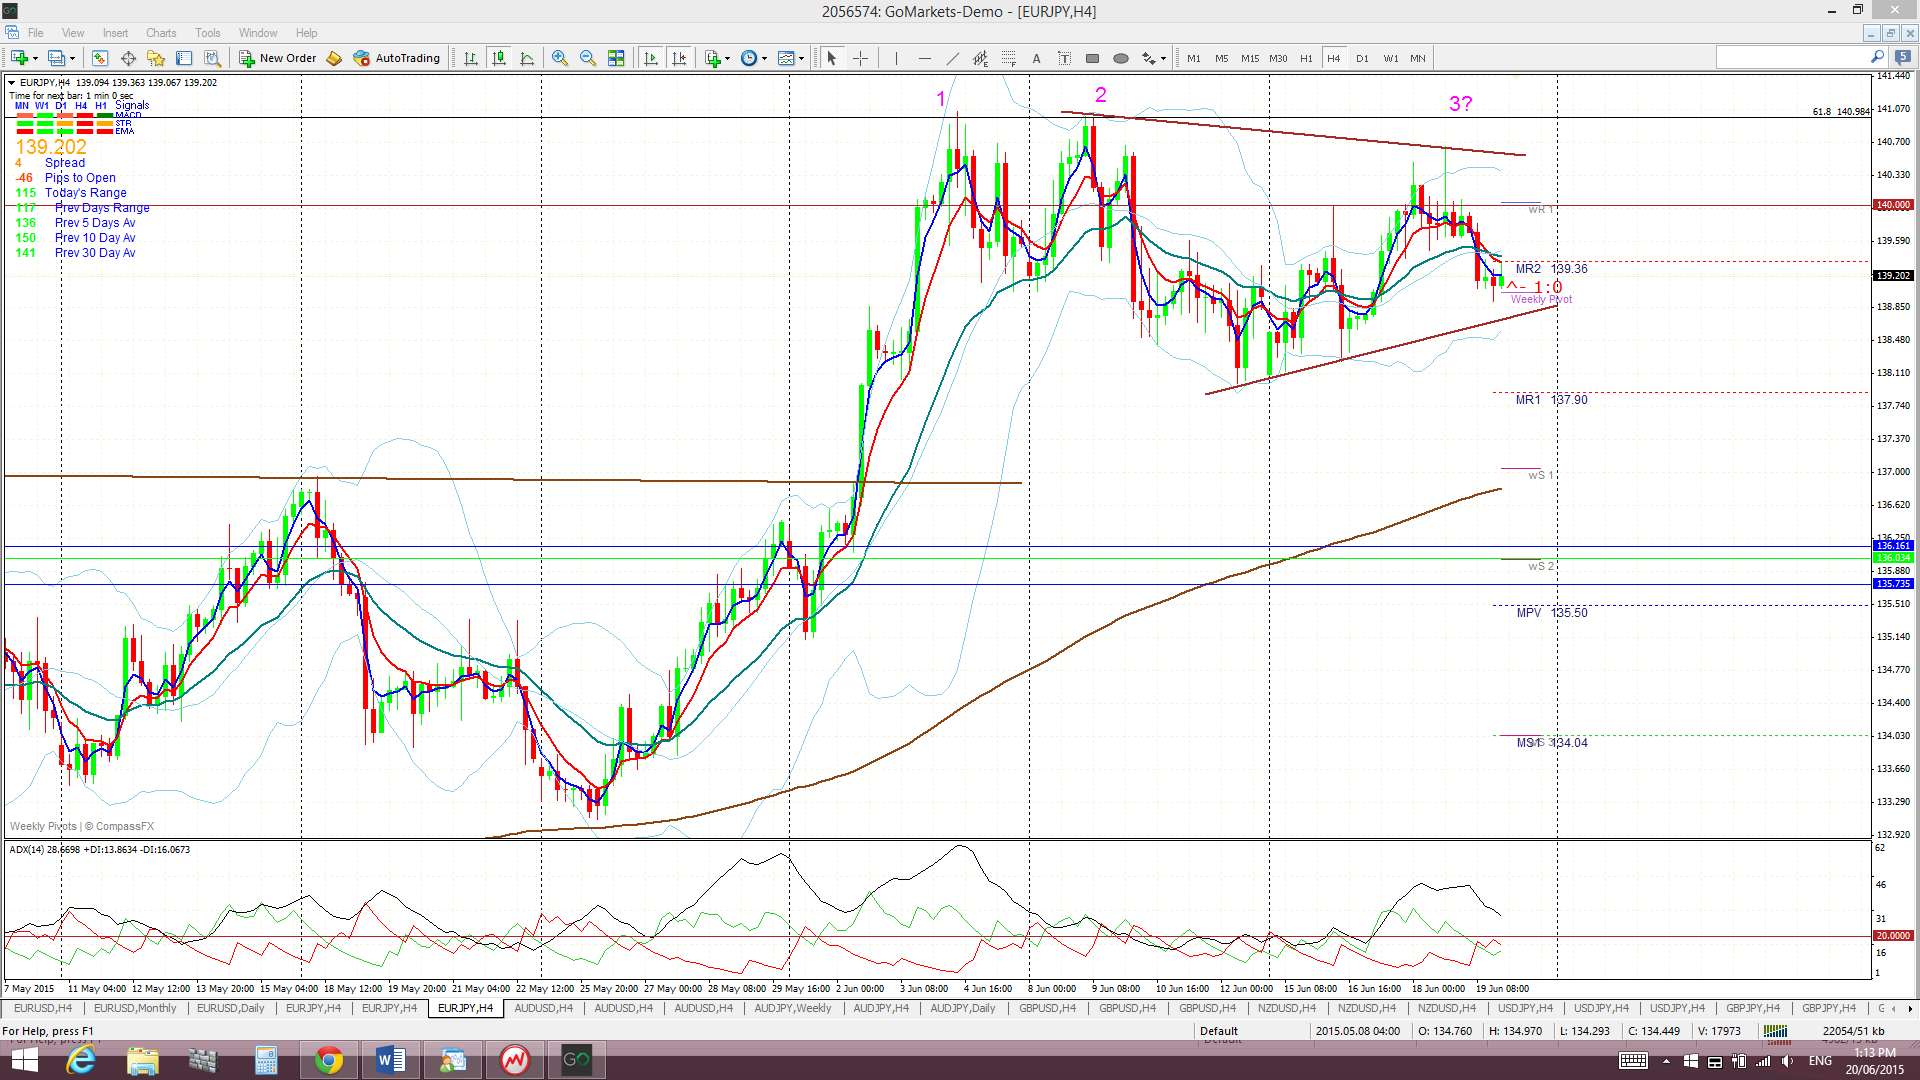
E/J: The E/J spent much of the week consolidating within a 4hr Flag pattern below the psychological 140 level. A breakout attempt came after FOMC but the E/J struggled to hold back above the 140 level. The 61.8% fib of the 2008-2012 swing low move is still just above current price near 141 and also marks a recent ‘Triple Top’ region. Any break and hold above 140 and 141 would suggest a move up to the monthly chart’s neck line of the bullish inverse H&S pattern.
Price is trading in the Cloud on the 4hr chart, below the Cloud on the weekly chart but above the Cloud on the daily and monthly charts.
The weekly candle closed as a bullish candle.
Watch for any w/e and/or Monday Greek-debt related news to impact this pair.
- I’m watching for any new TC signal on this pair, the 140 and 141 level and the monthly chart’s inverse H&S.
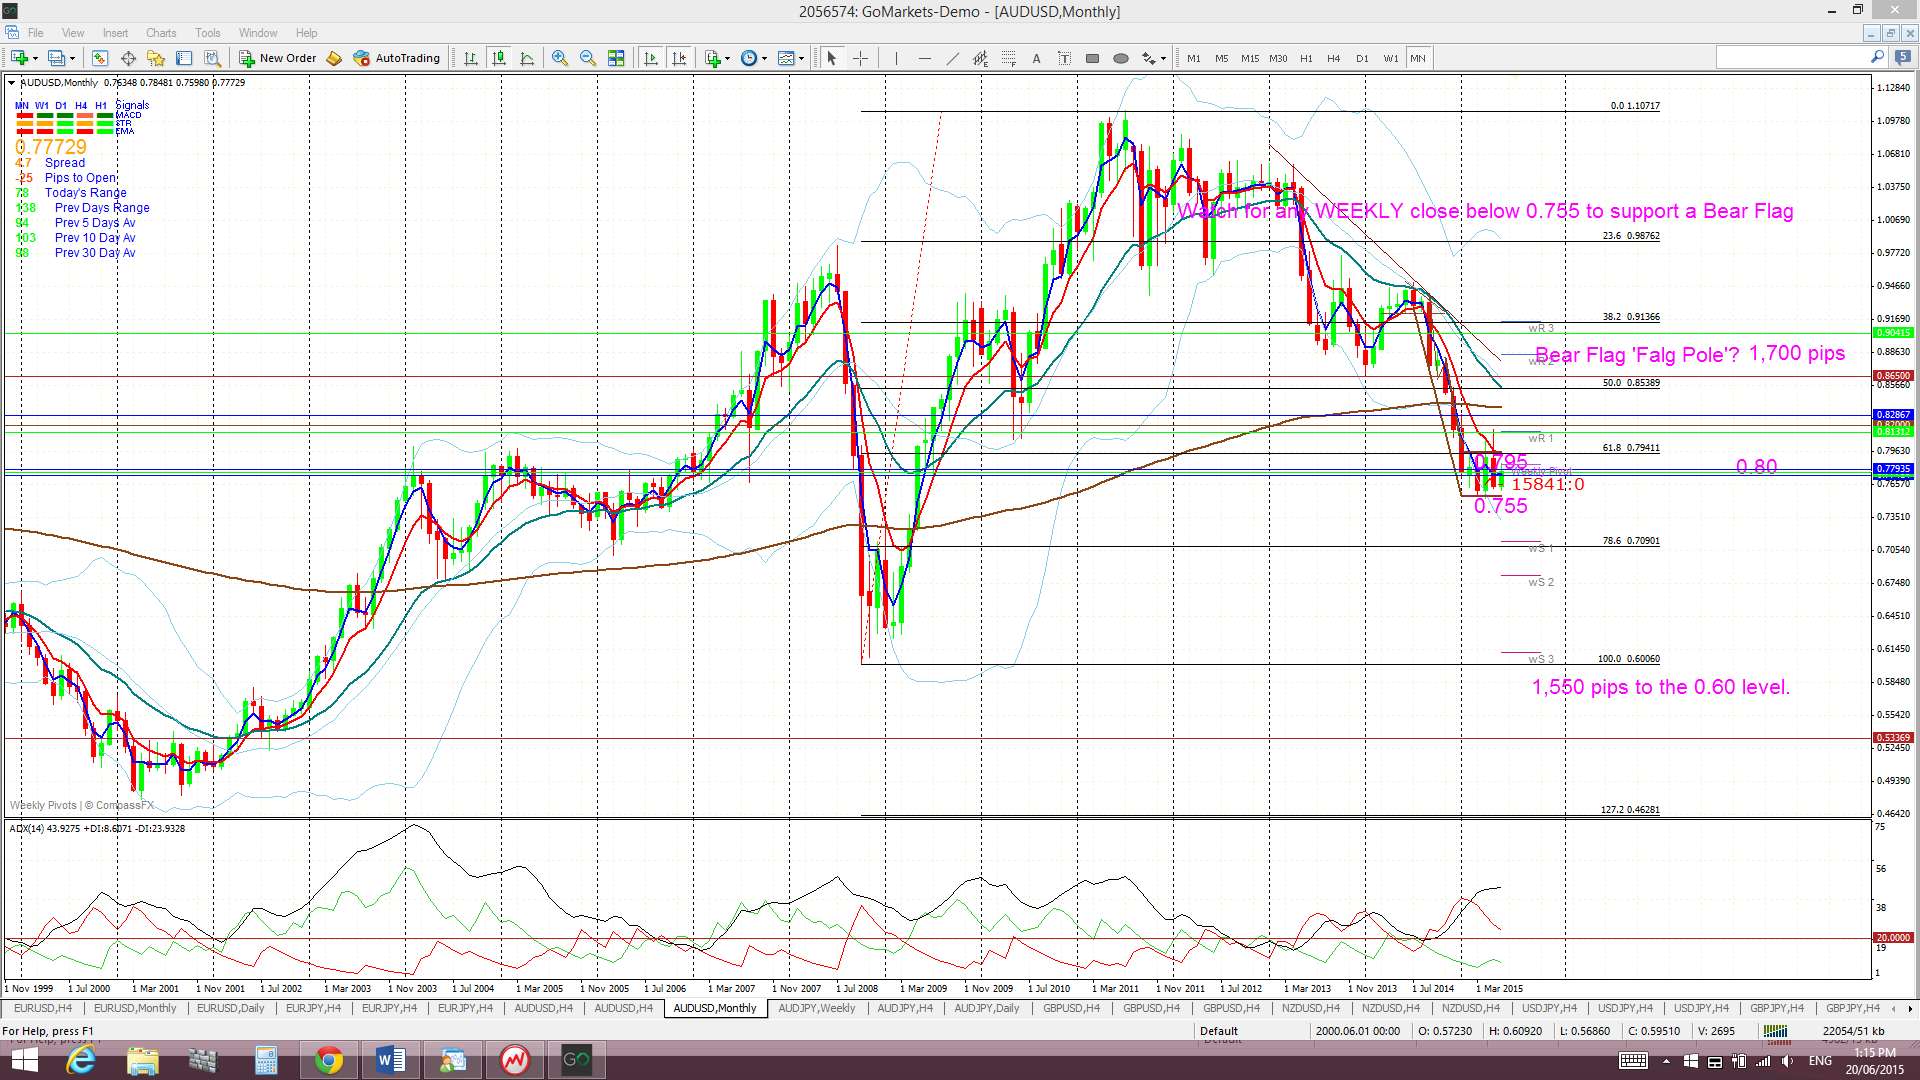
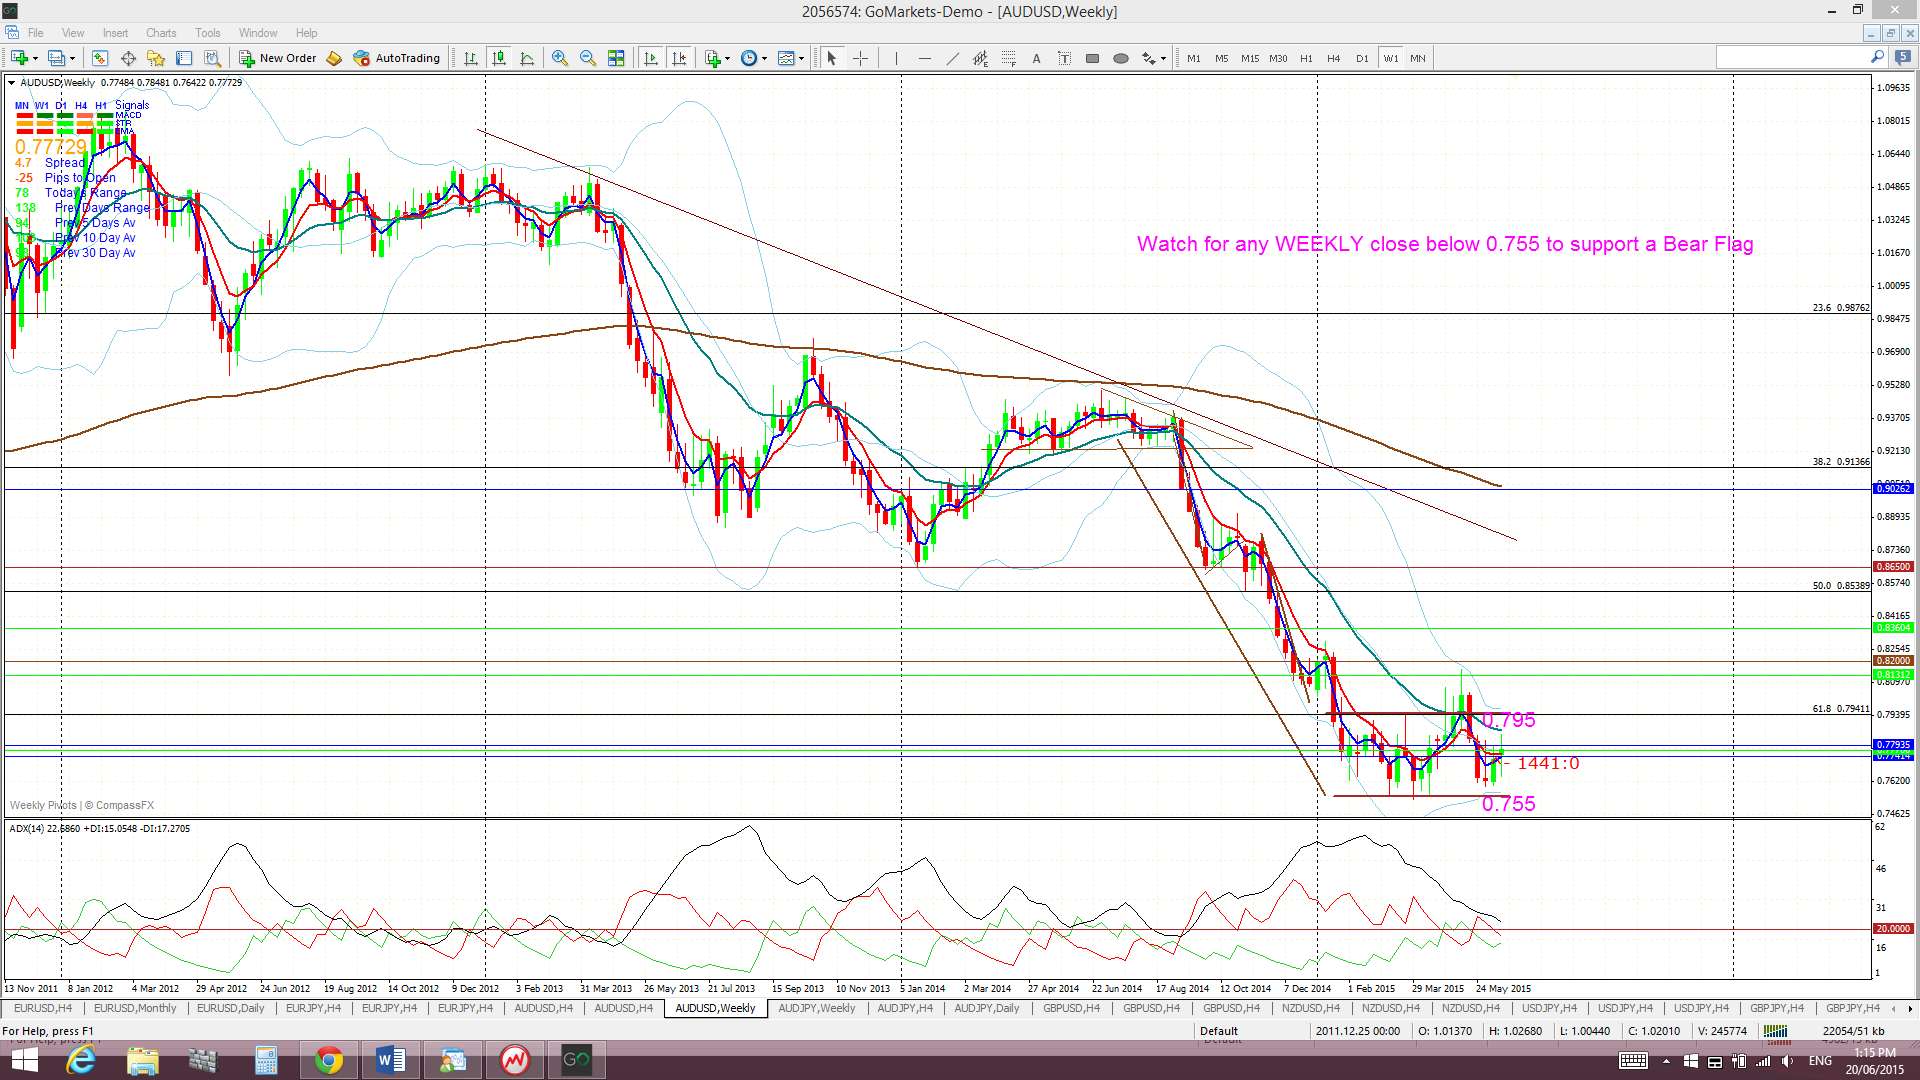
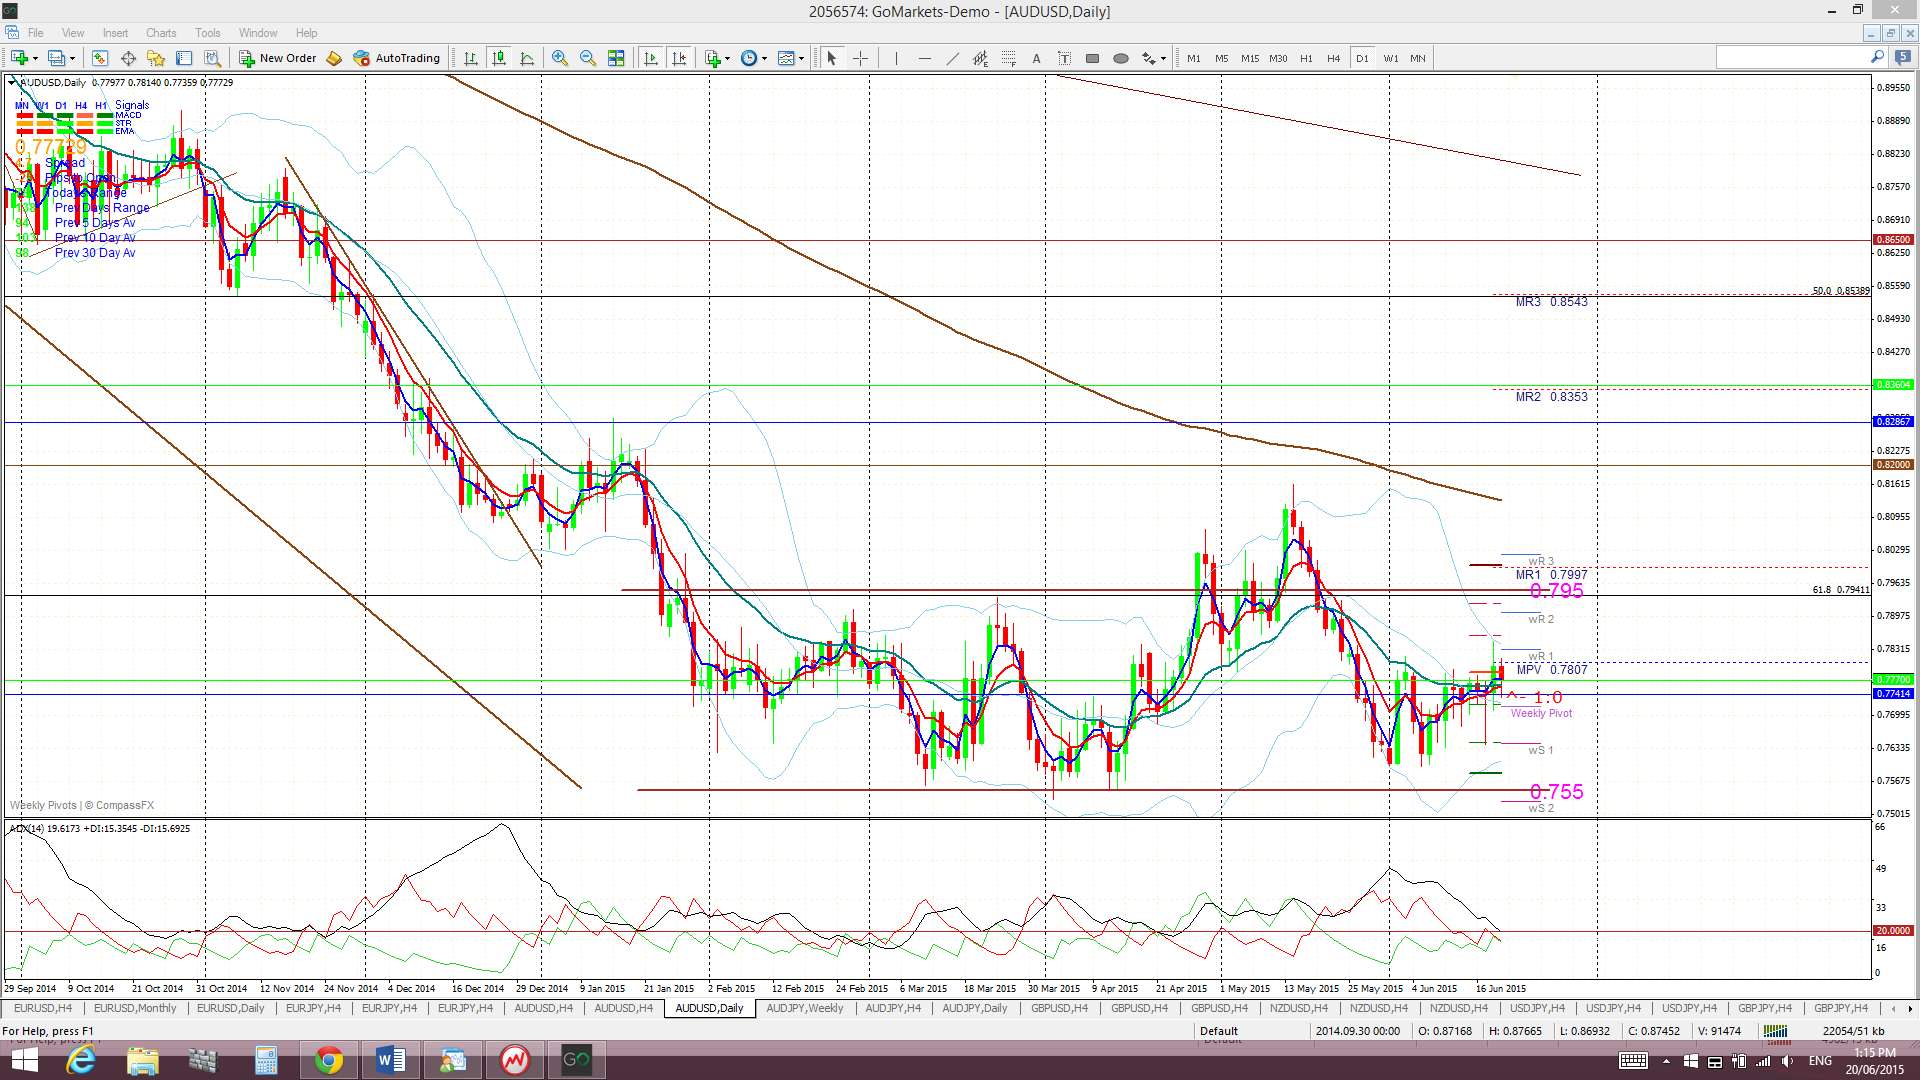
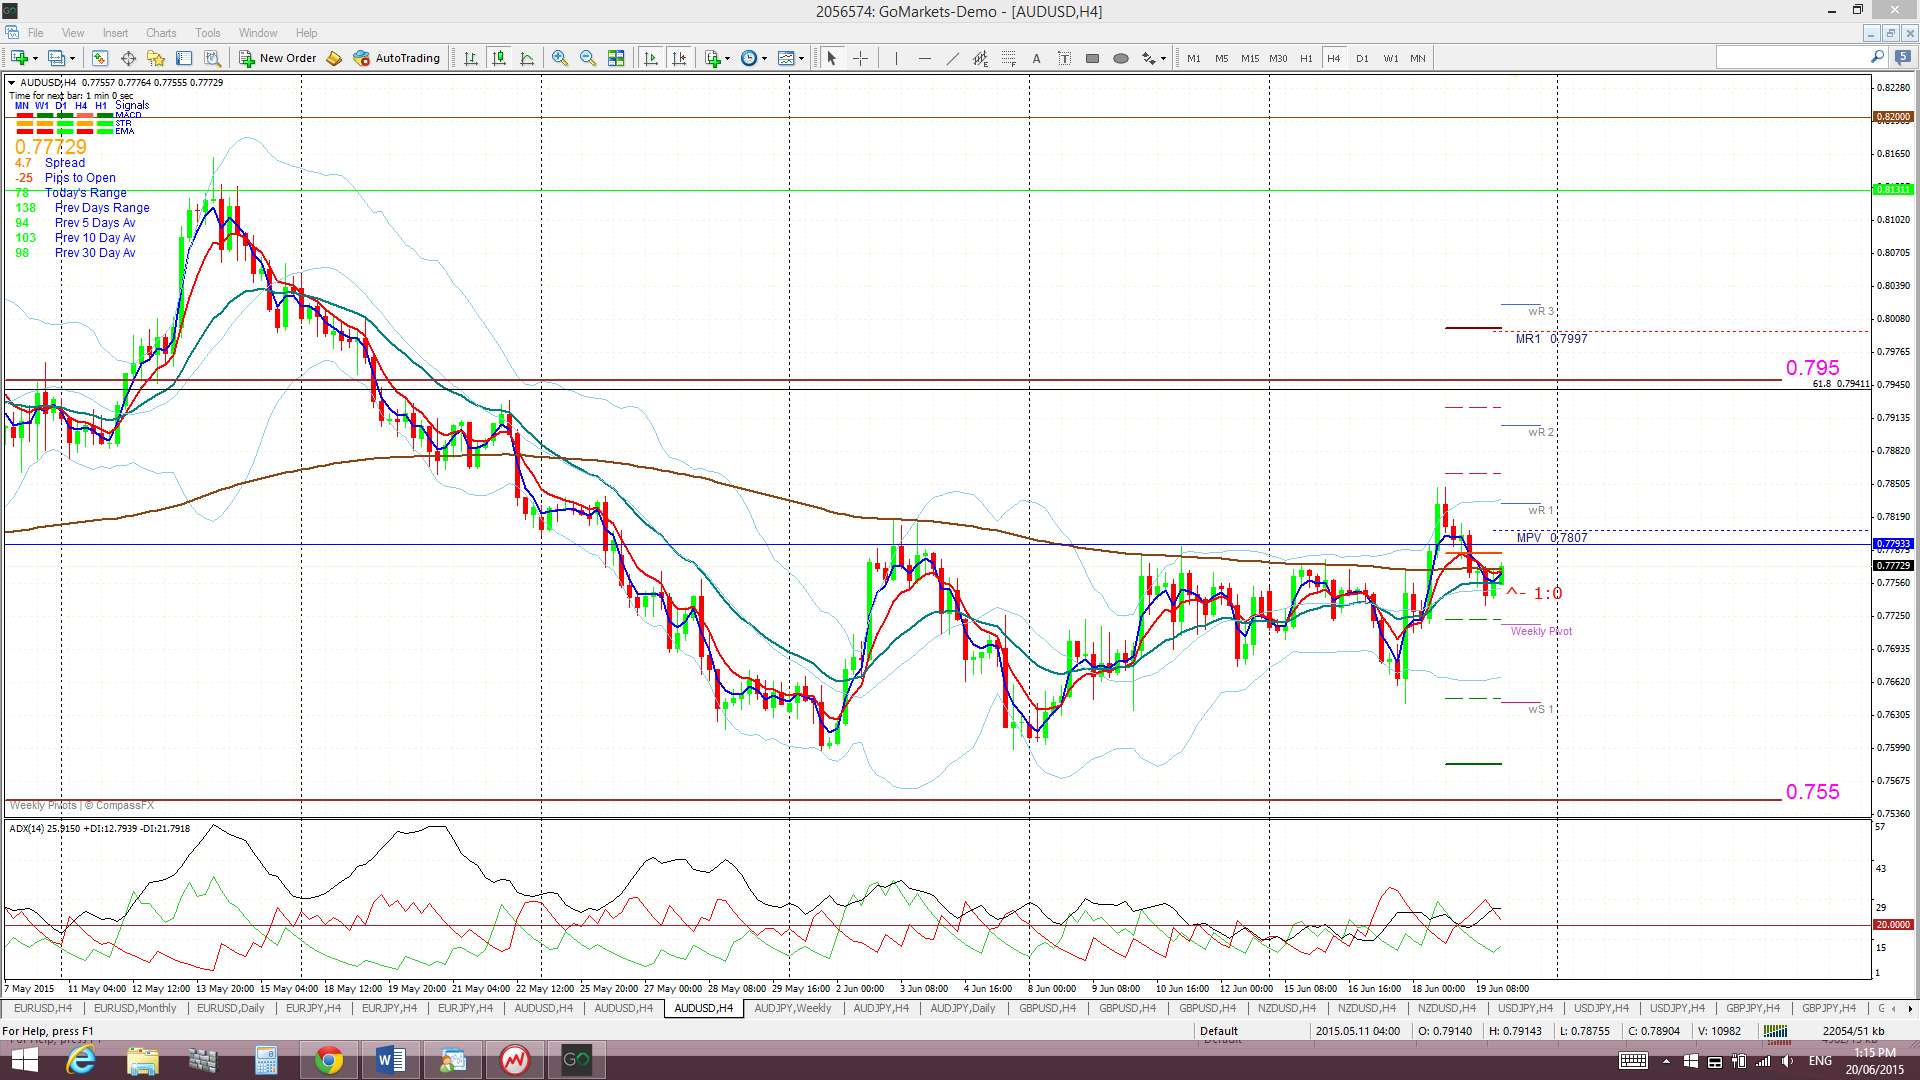
A/U: The A/U remains range bound between the 0.795 and 0.755 horizontal trading channel. Any break and hold below this 0.755 would be bearish as it would suggest a possible weekly-chart H&S breakdown. However, any continued US$ weakness might help this pair to carve out a base from this trading range.
I heard an interesting interview yesterday on the topic of the Australian economy and the rather entrenched misconceptions about its economic health status. This is something that I have been nodding to when I post charts of the AUD/NZD monthly chart and reflect on the pivotal shift that seems to be underway there. A transcript of the article in question can be found through this link and is well worth the read.
Price is trading above the Cloud on the 4hr chart but below the Cloud on the daily, weekly and monthly charts.
The weekly candle closed as a bullish coloured ‘Spinning Top’.
Watch for any w/e or Monday Greek-debt news to impact this pair as well.
- I’m watching for any new TC signal on this pair and the 0.755 / 0.795 levels.
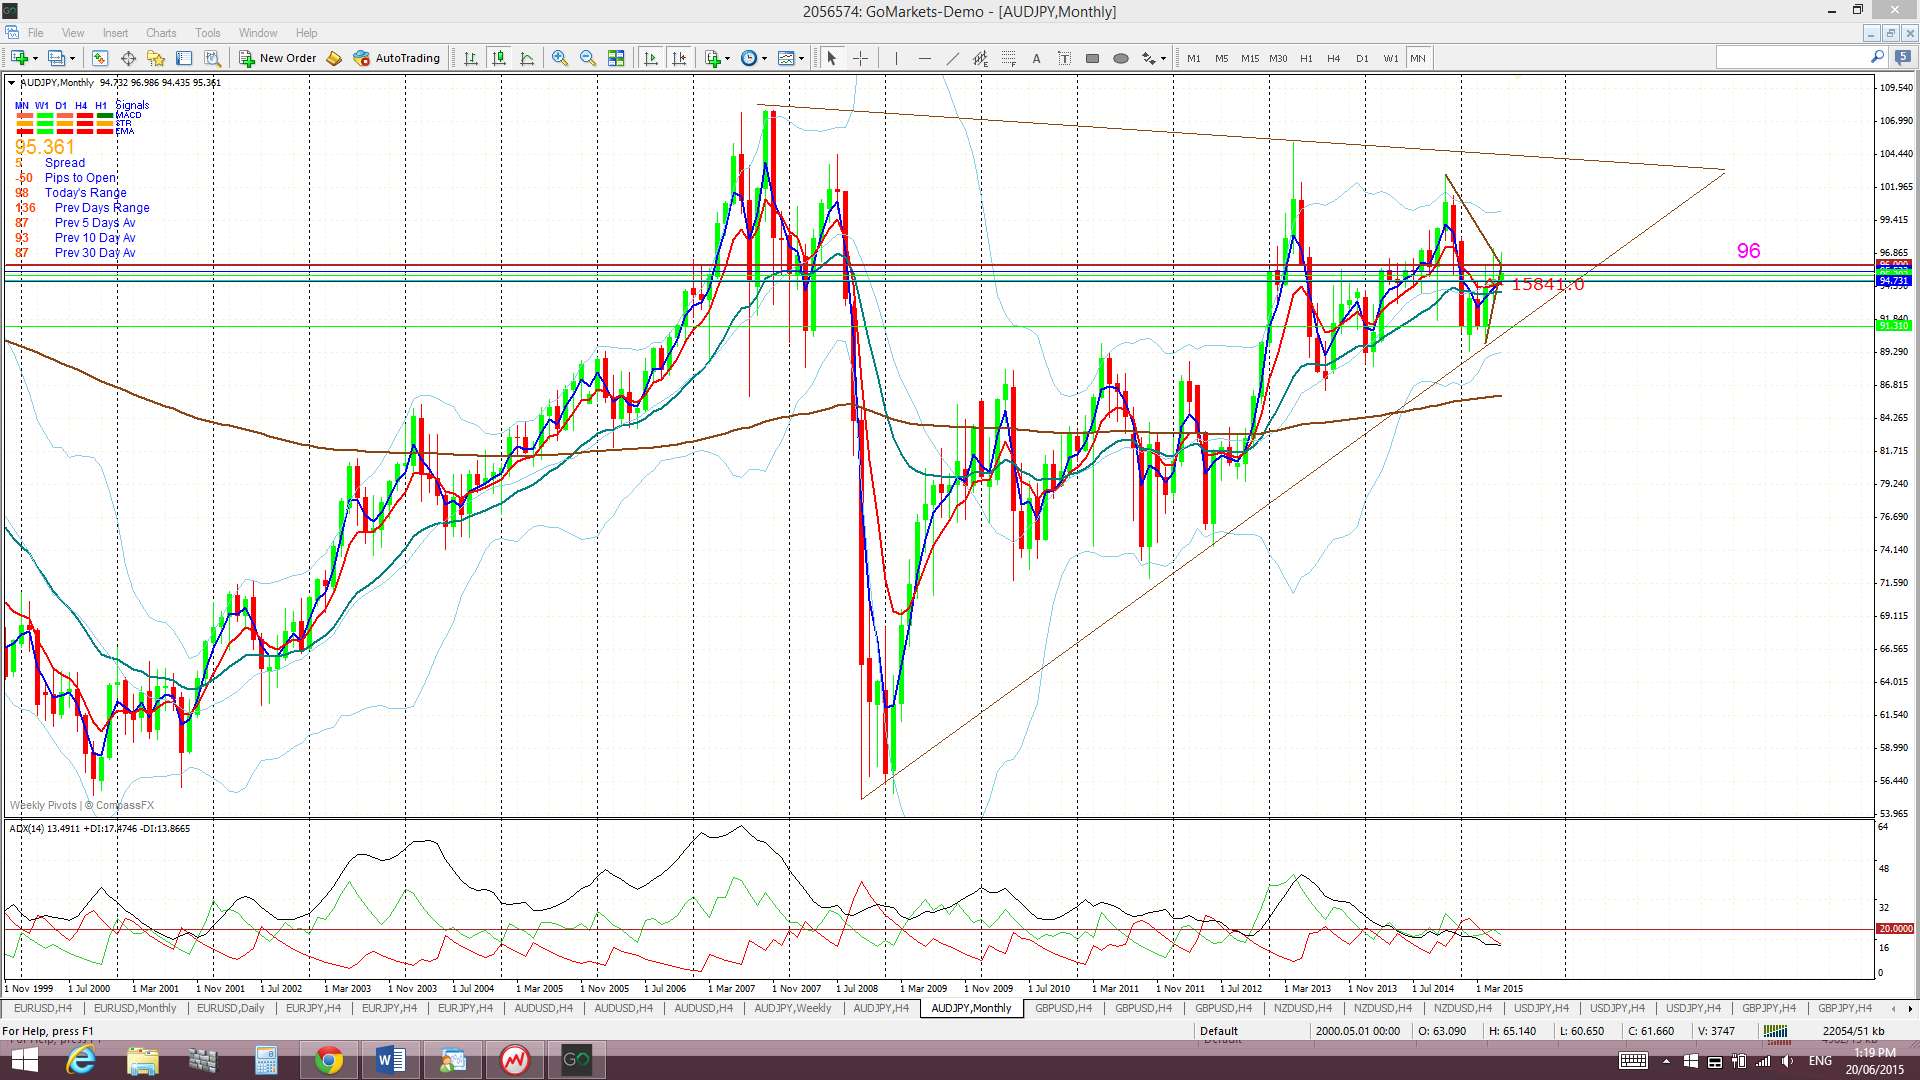
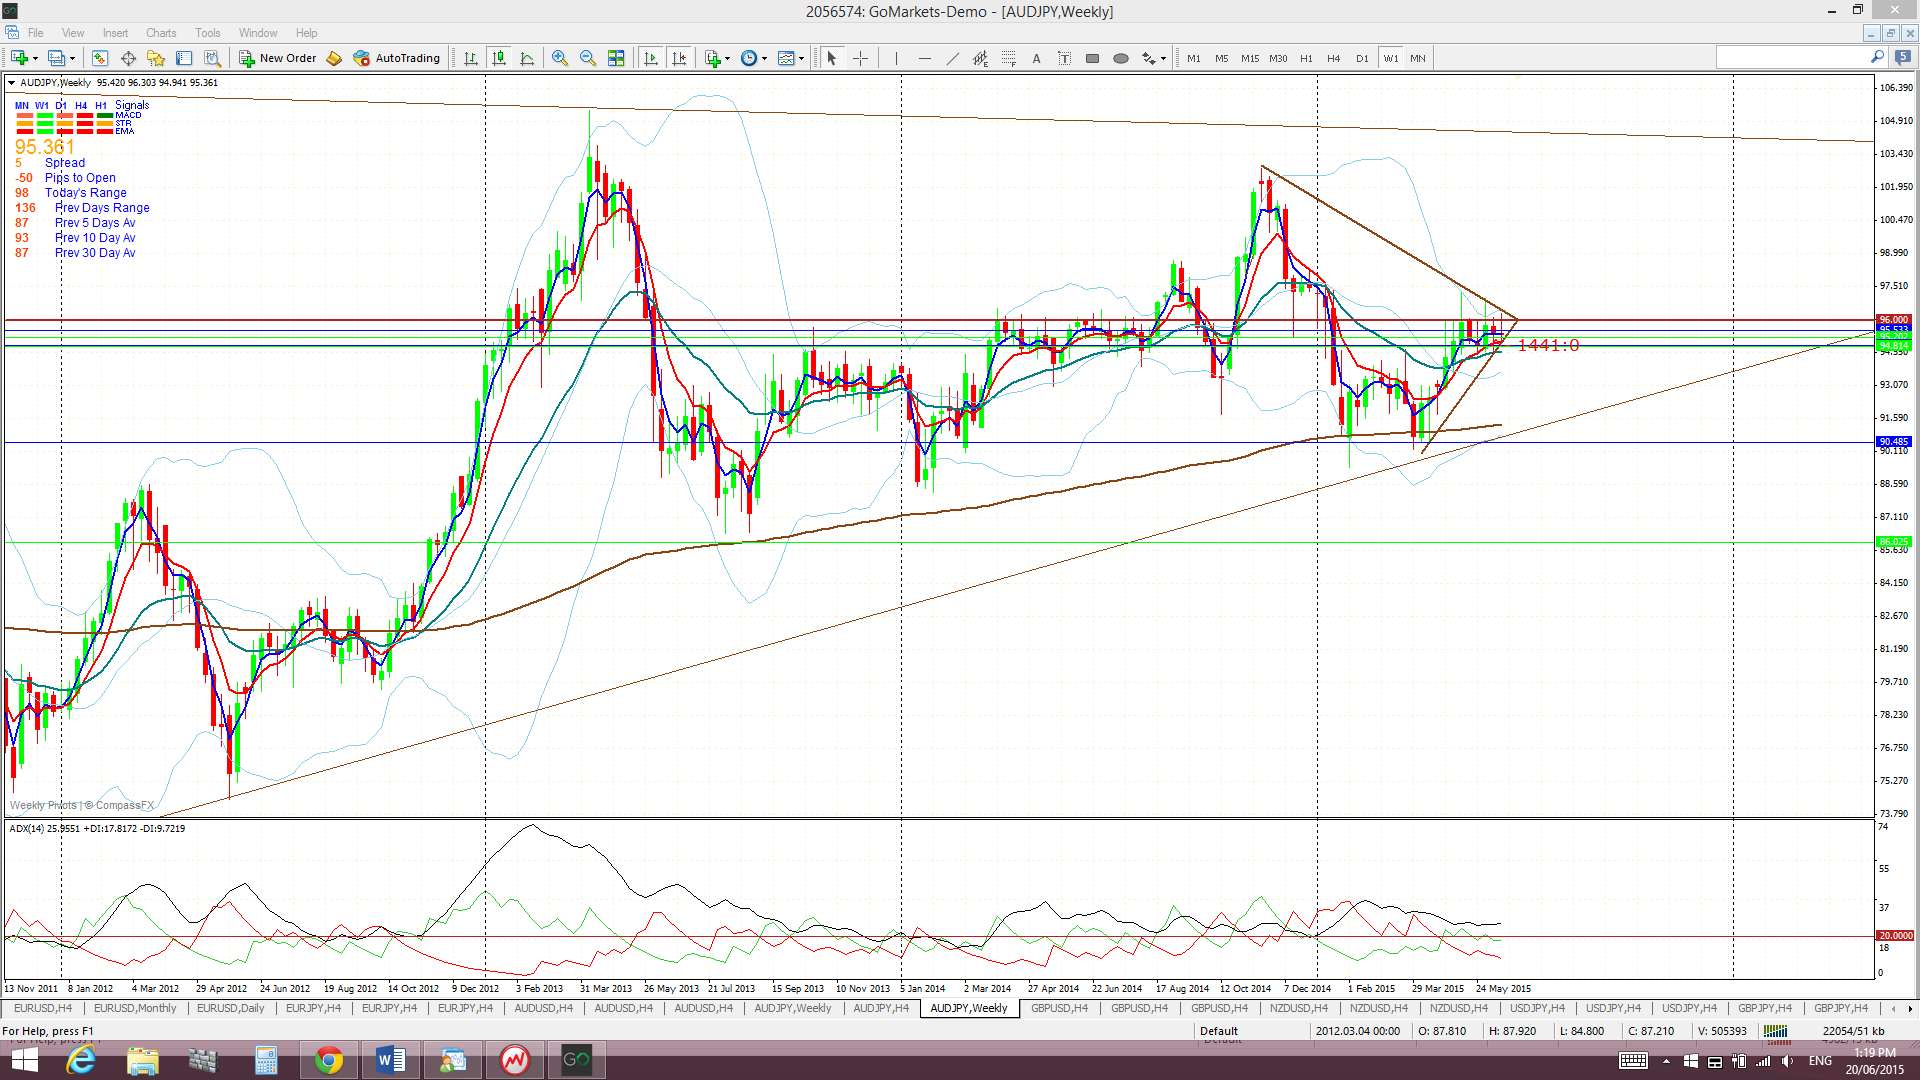
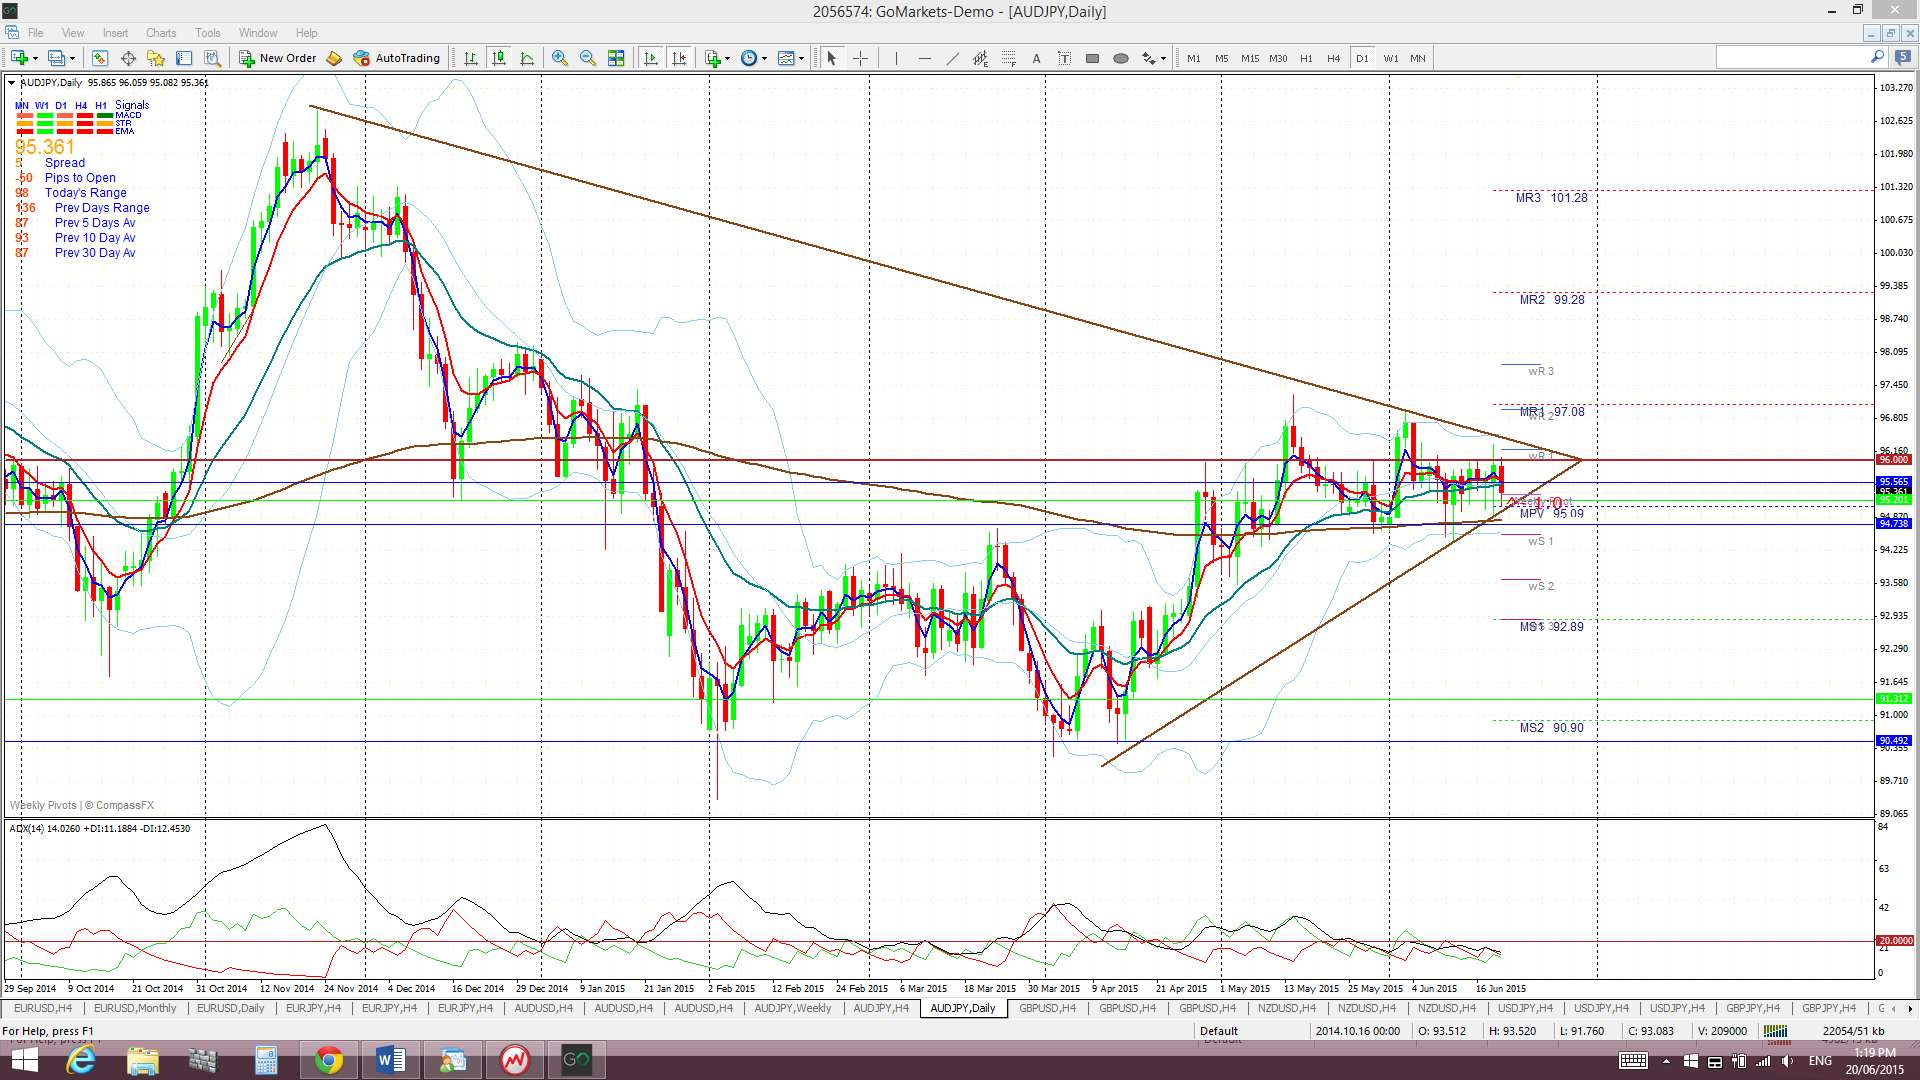
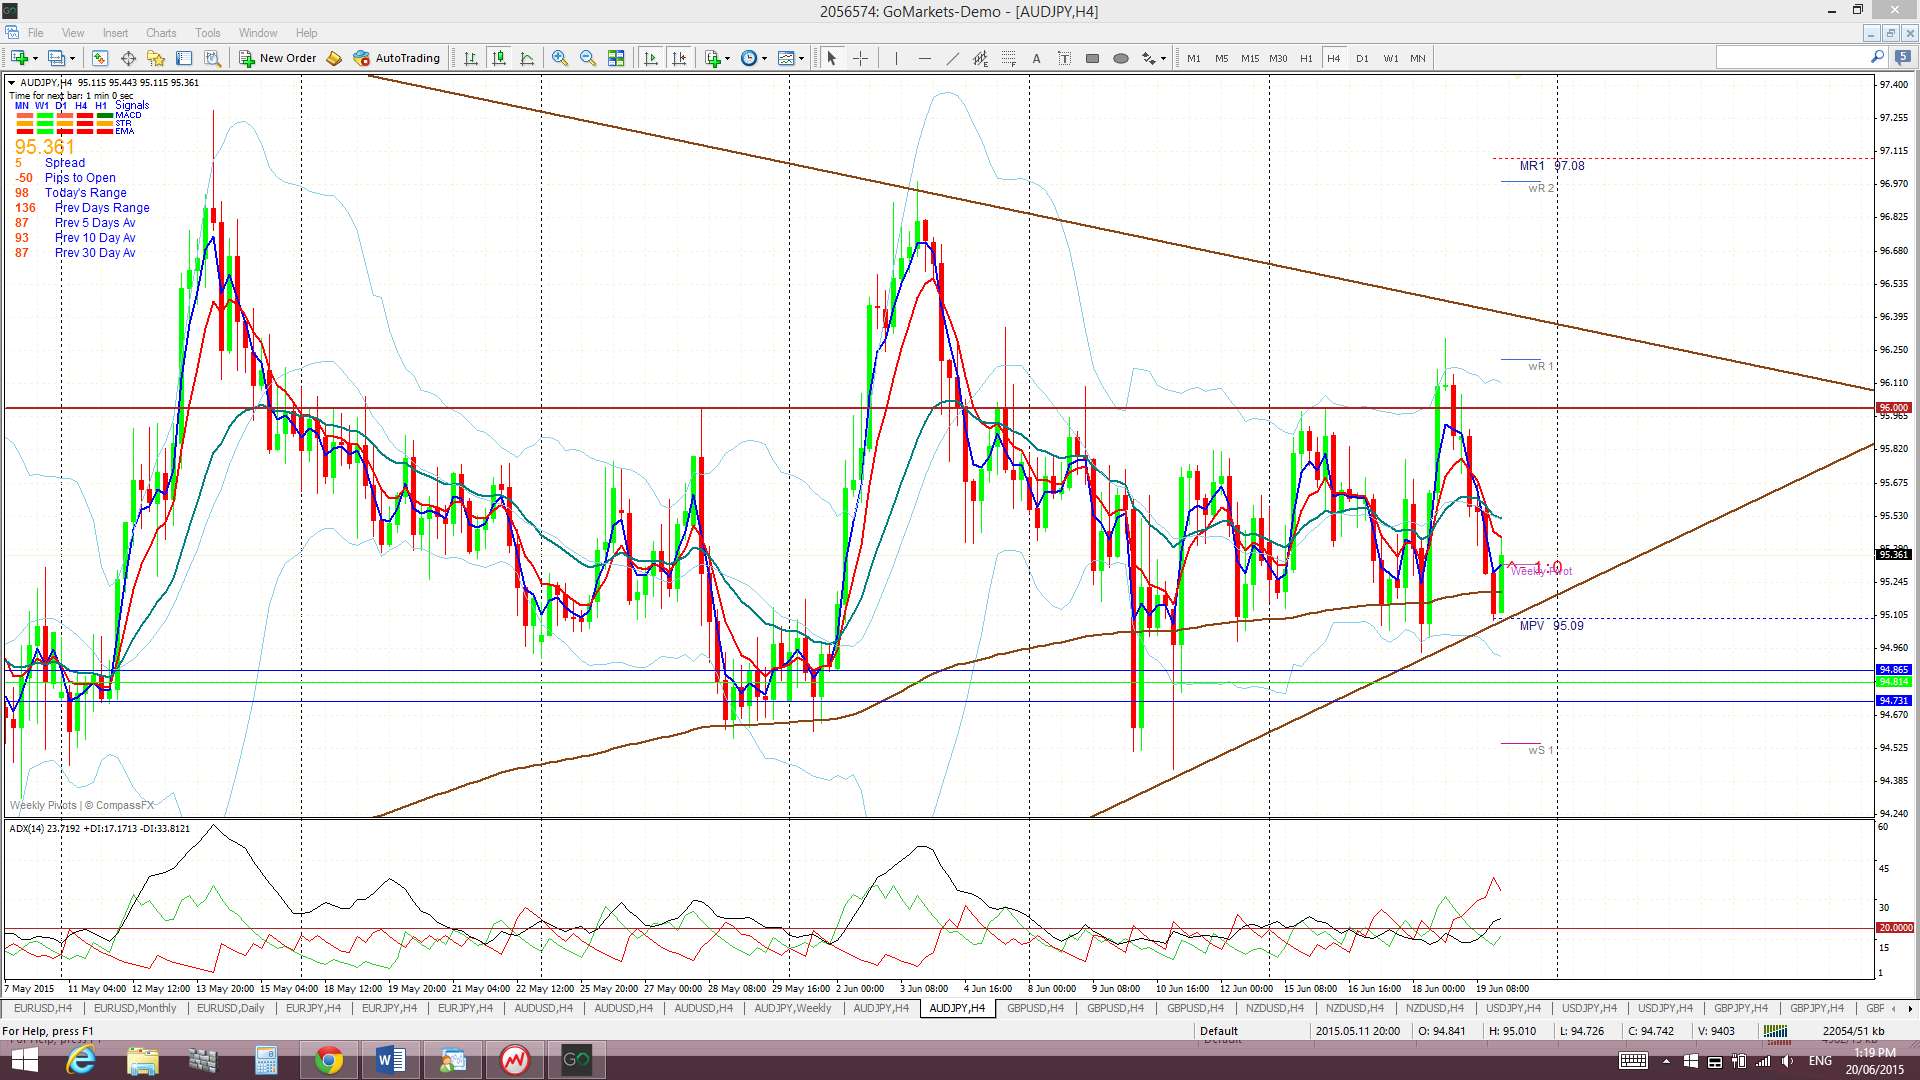
A/J: The A/J continued consolidating sideways with a daily chart triangle and below the key 96 level.
The weekly chart continues to show price action holding above the weekly 200 EMA and the monthly chart shows the A/J conforming to an even larger triangle pattern.
Price is trading above the Cloud on the daily and monthly charts but in the Cloud on the 4hr chart and just below the Cloud on the weekly chart.
The weekly candle closed as a bearish coloured Doji candle.
- I’m watching for any new TC signal on this pair, the daily chart triangle and the 96 level.
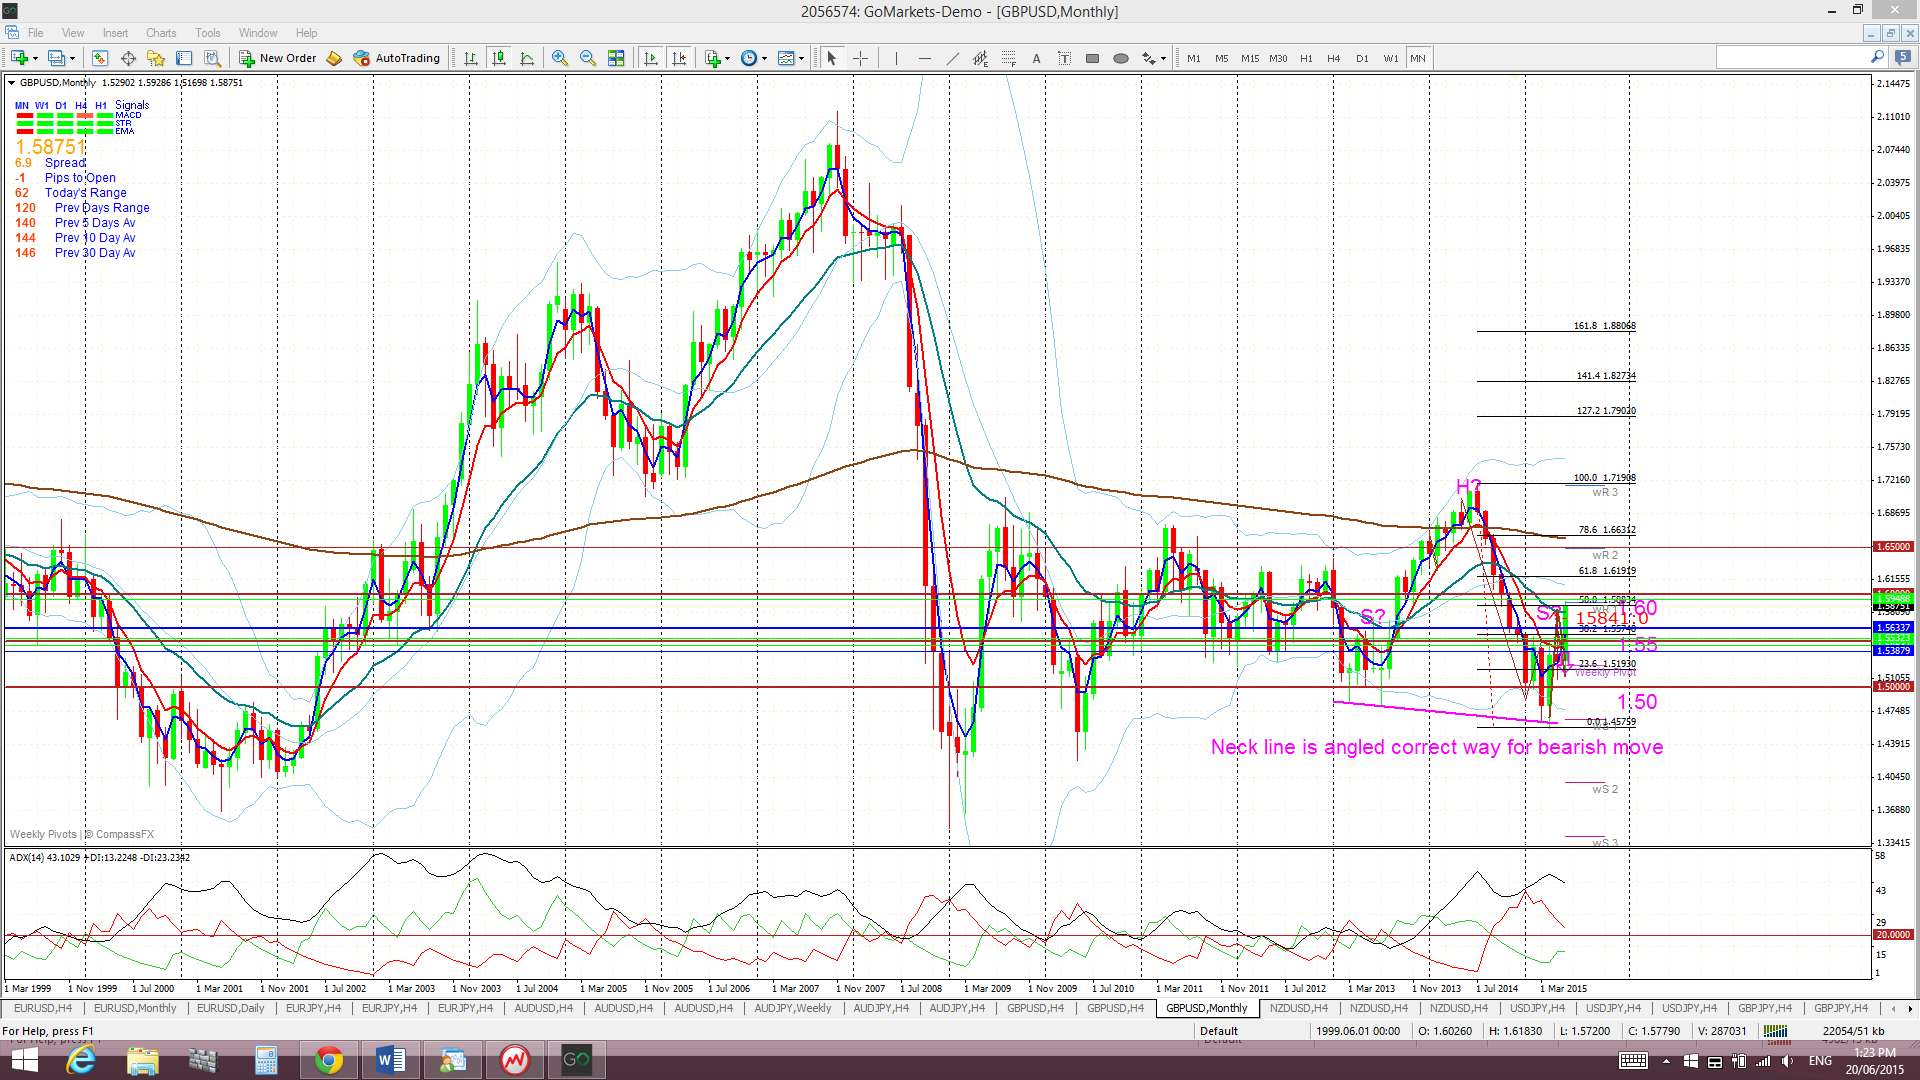
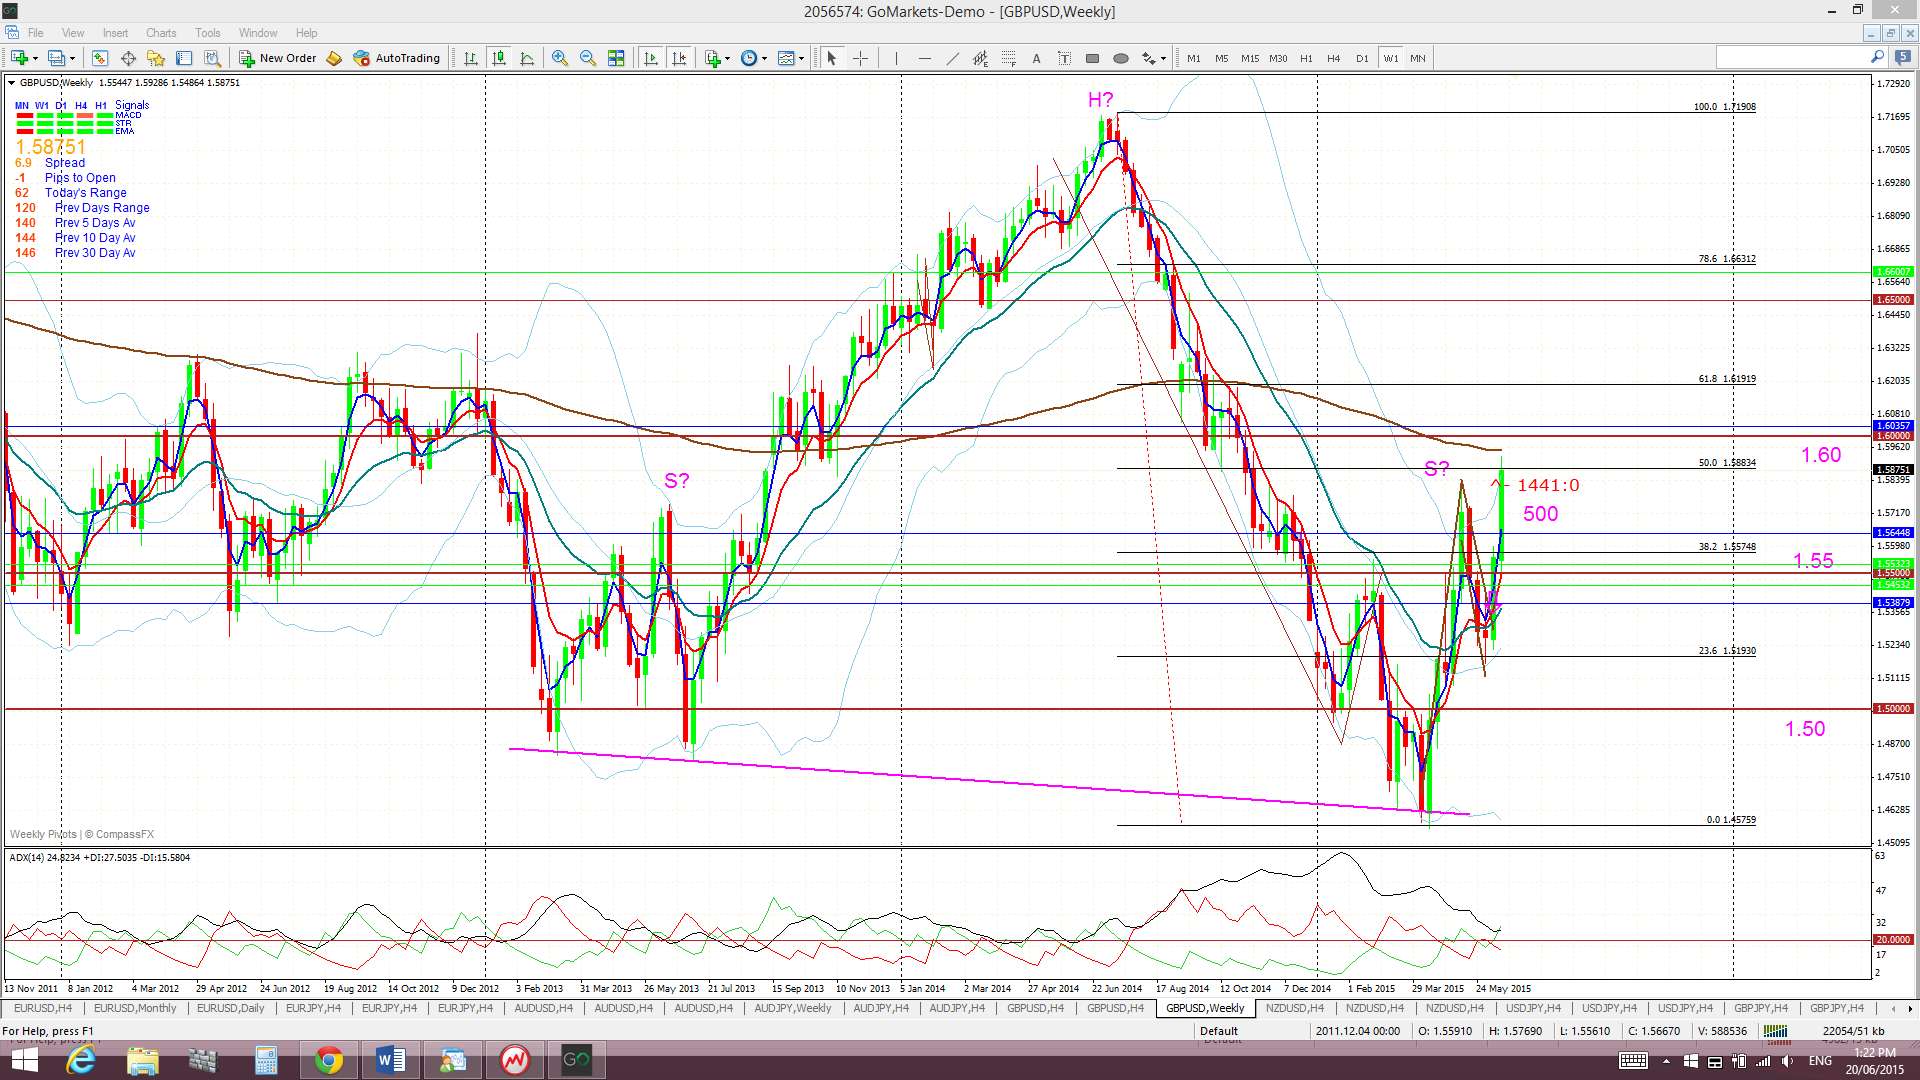
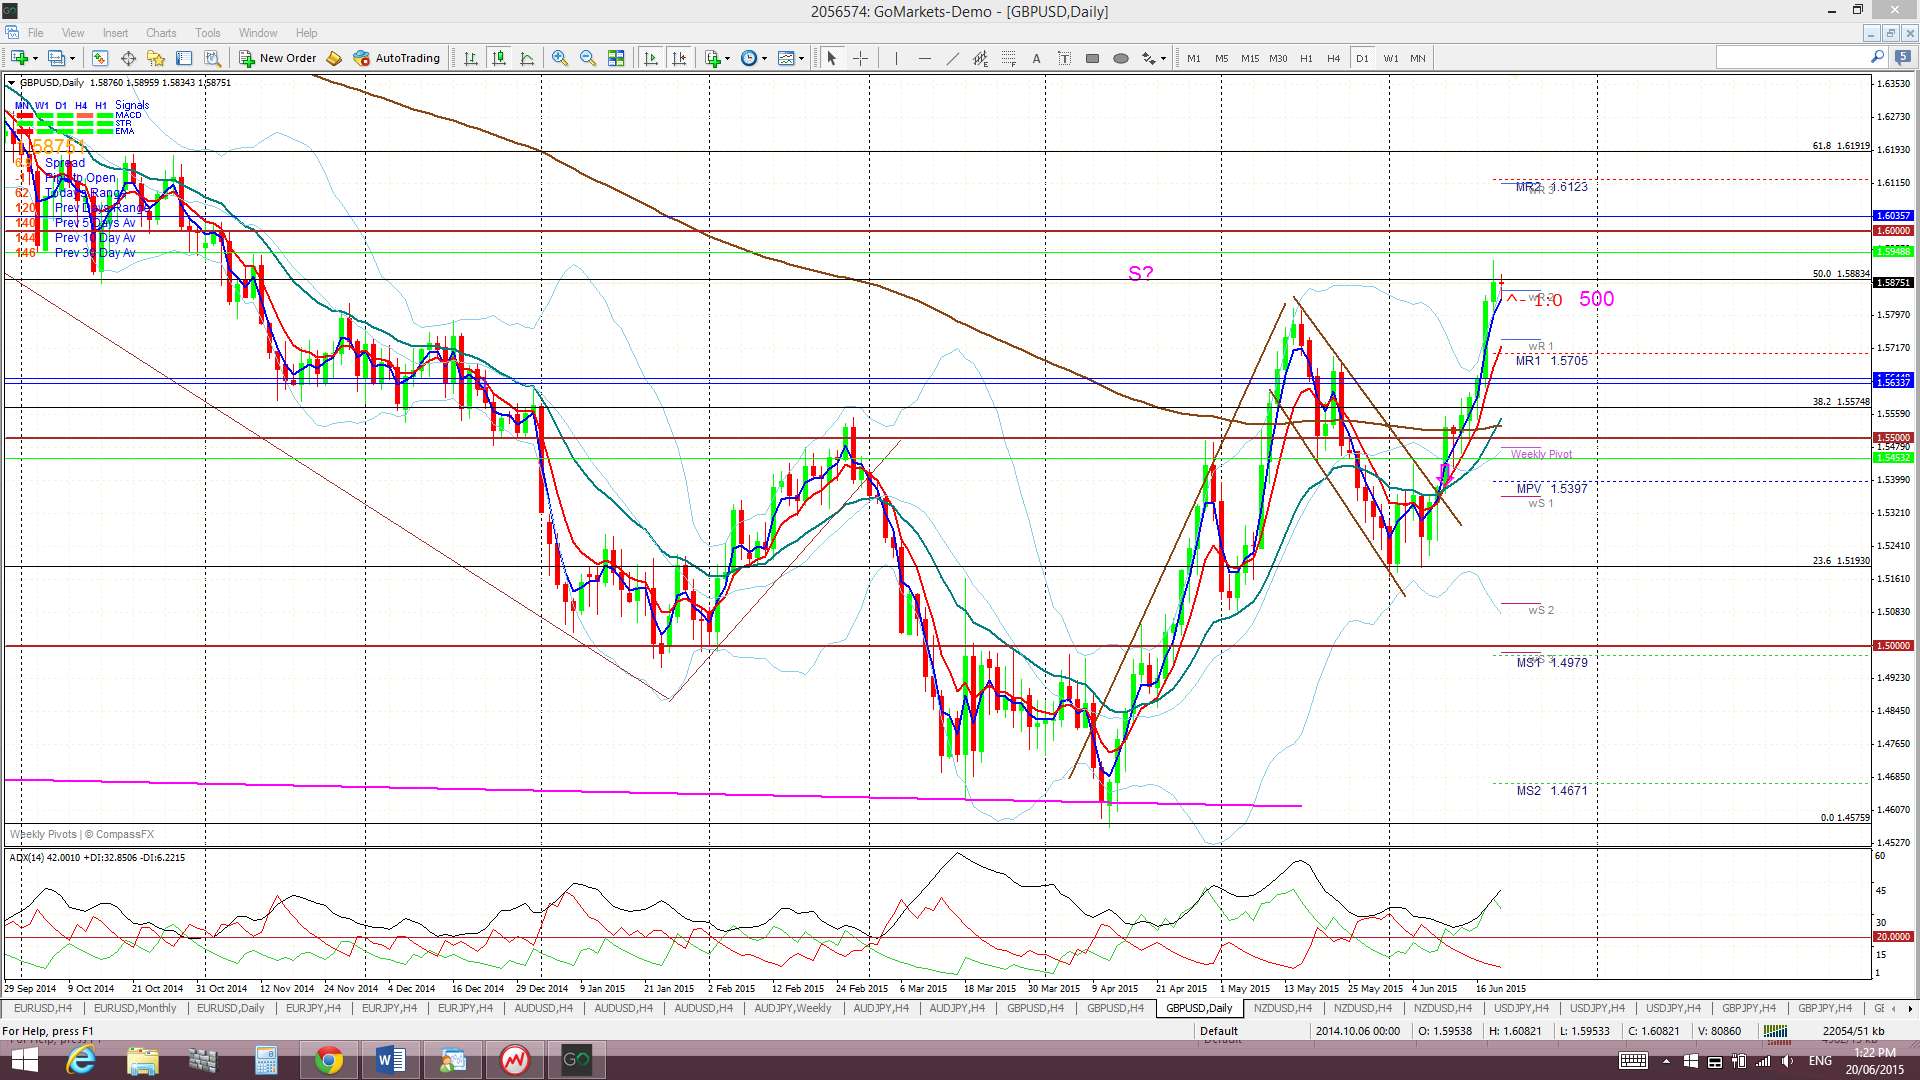
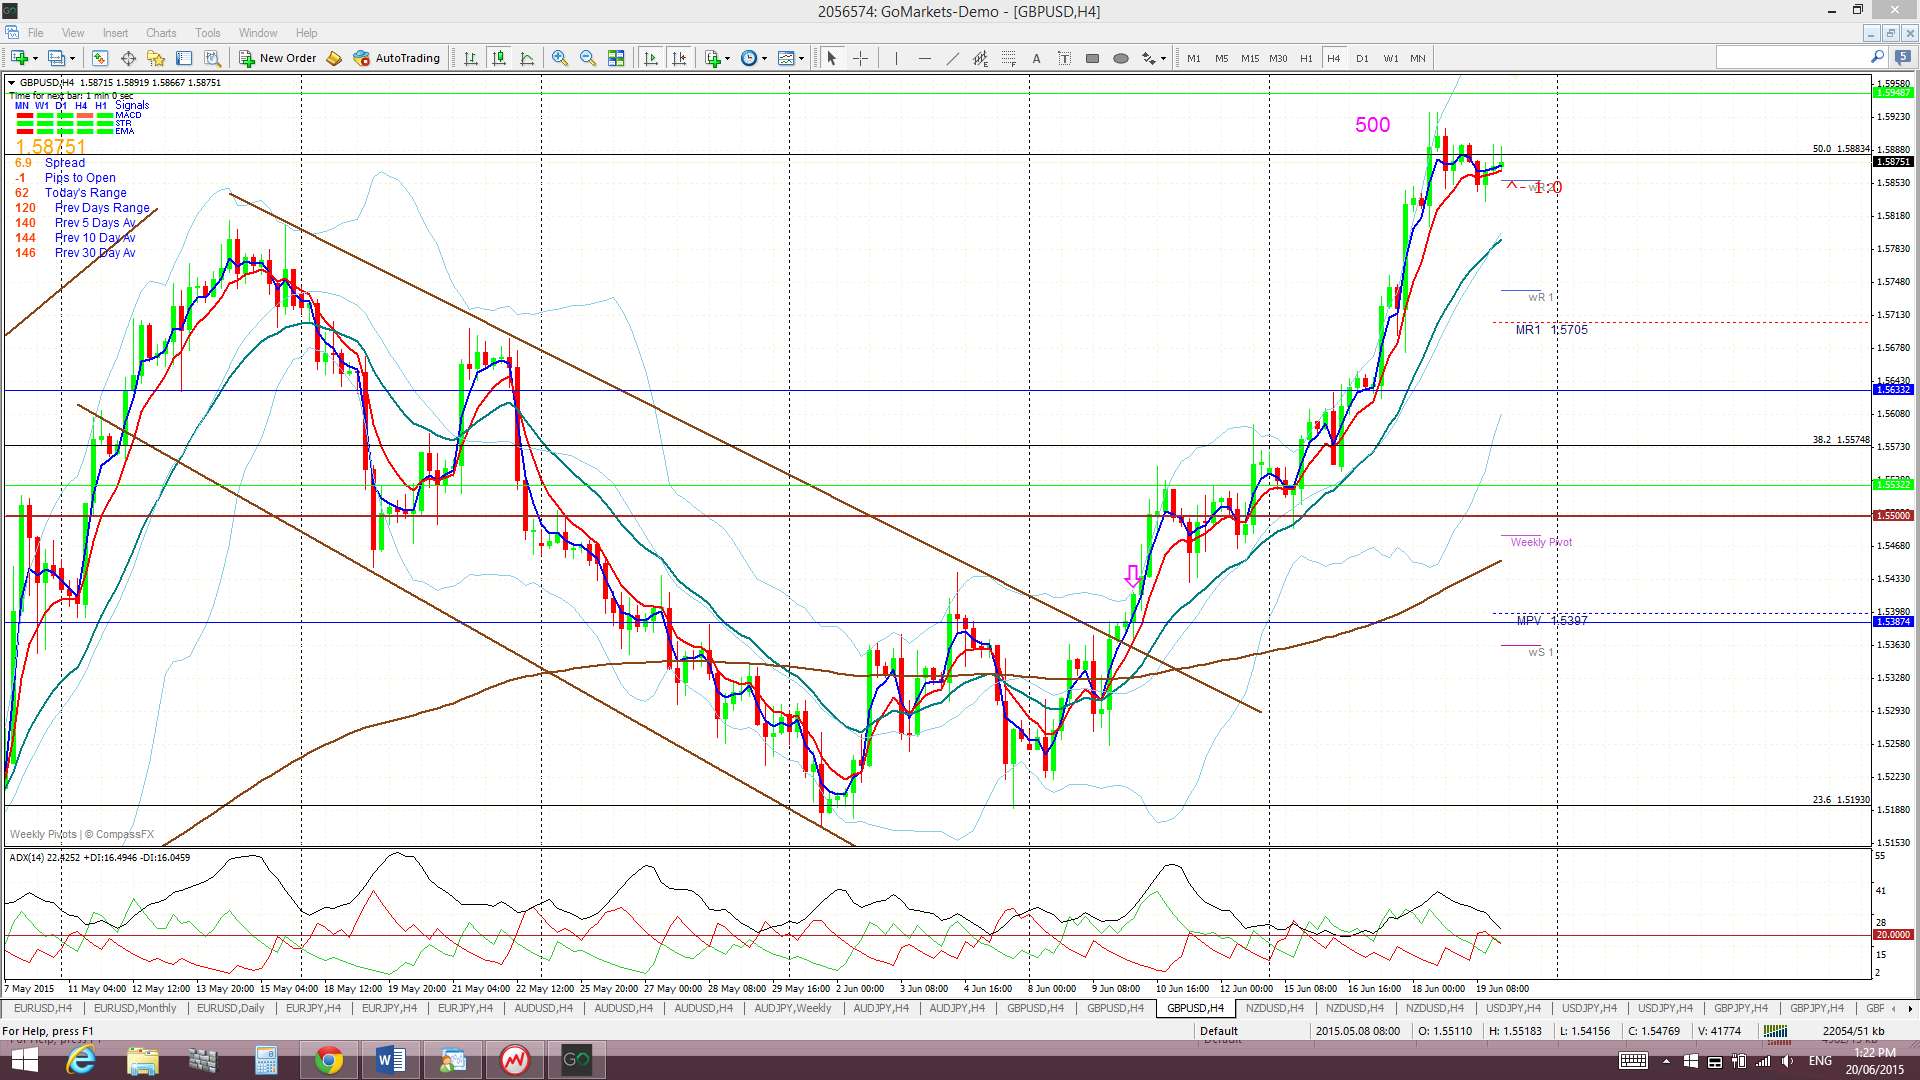
G/U: The Cable continued on its rally last week and the TC signal from the previous week has yielded up to 500 pips. Price action only slowed once it reached the 50% fib of the recent swing low move and it parked near this support for over the w/e.
I had previously mentioned that any bullish continuation back above 1.55 though would suggest a trip up to near the weekly 200 EMA and the key 1.60 level and price is just below these two levels right now.
Weekly chart H&S: There is a possible bearish H&S pattern forming on the weekly chart but the failure to break below the ‘neck line’ is holding this pattern off the time being. The height of the pattern is about 2,400 pips and suggests a similar move lower with any break and hold below the ‘neck line’. Recall that the GBP/USD printed a monthly close in March below 1.50, the first since June 2010. This bearish development supports the H&S pattern BUT we will need to see a close and hold below the ‘neck line’ to confirm any such bearish breakdown.
Price is trading above the Cloud on the 4hr, daily and monthly charts but below the Cloud on the weekly chart.
The weekly candle closed as another large bullish candle.
Any negative Greek-debt news could help to benefit this pair from EUR/GBP flows. Apart from that the only GBP new is a BoE Carney speech set down for Friday.
- There is an open TC signal on this pair.
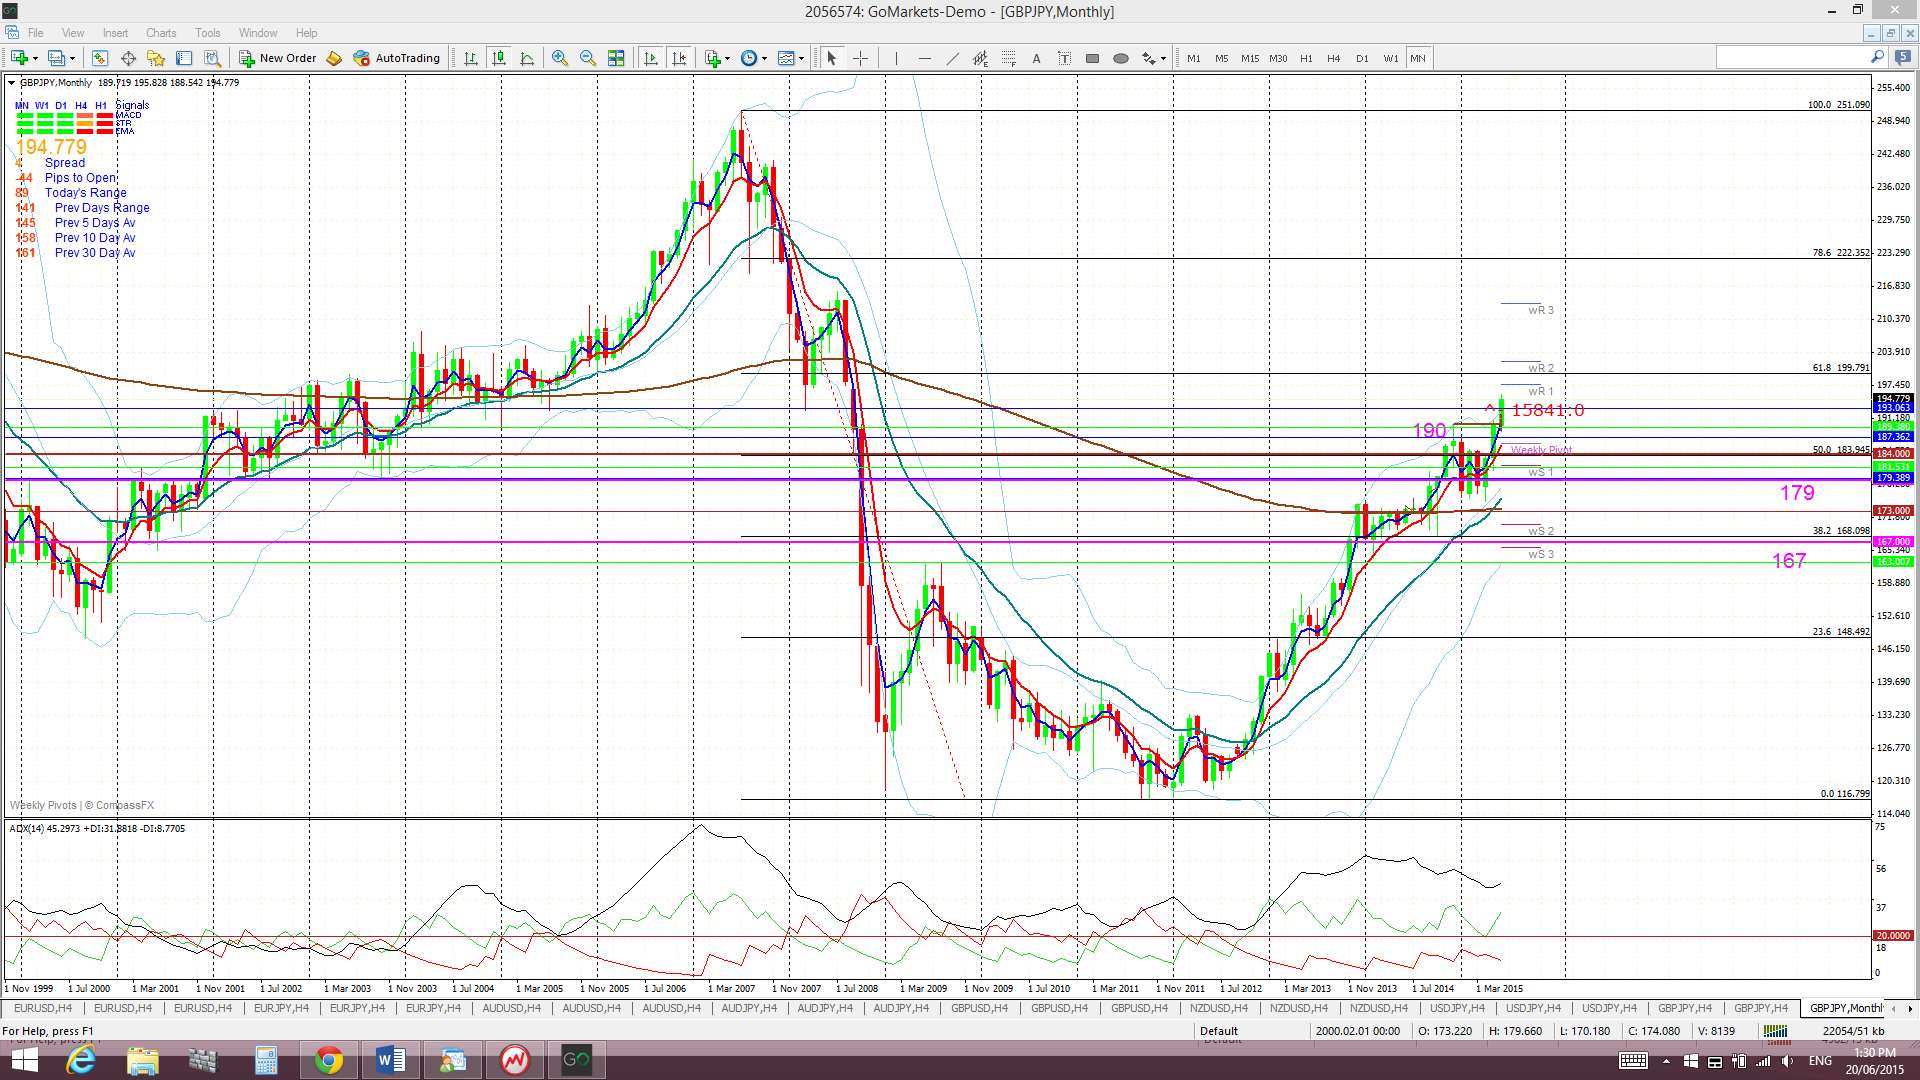
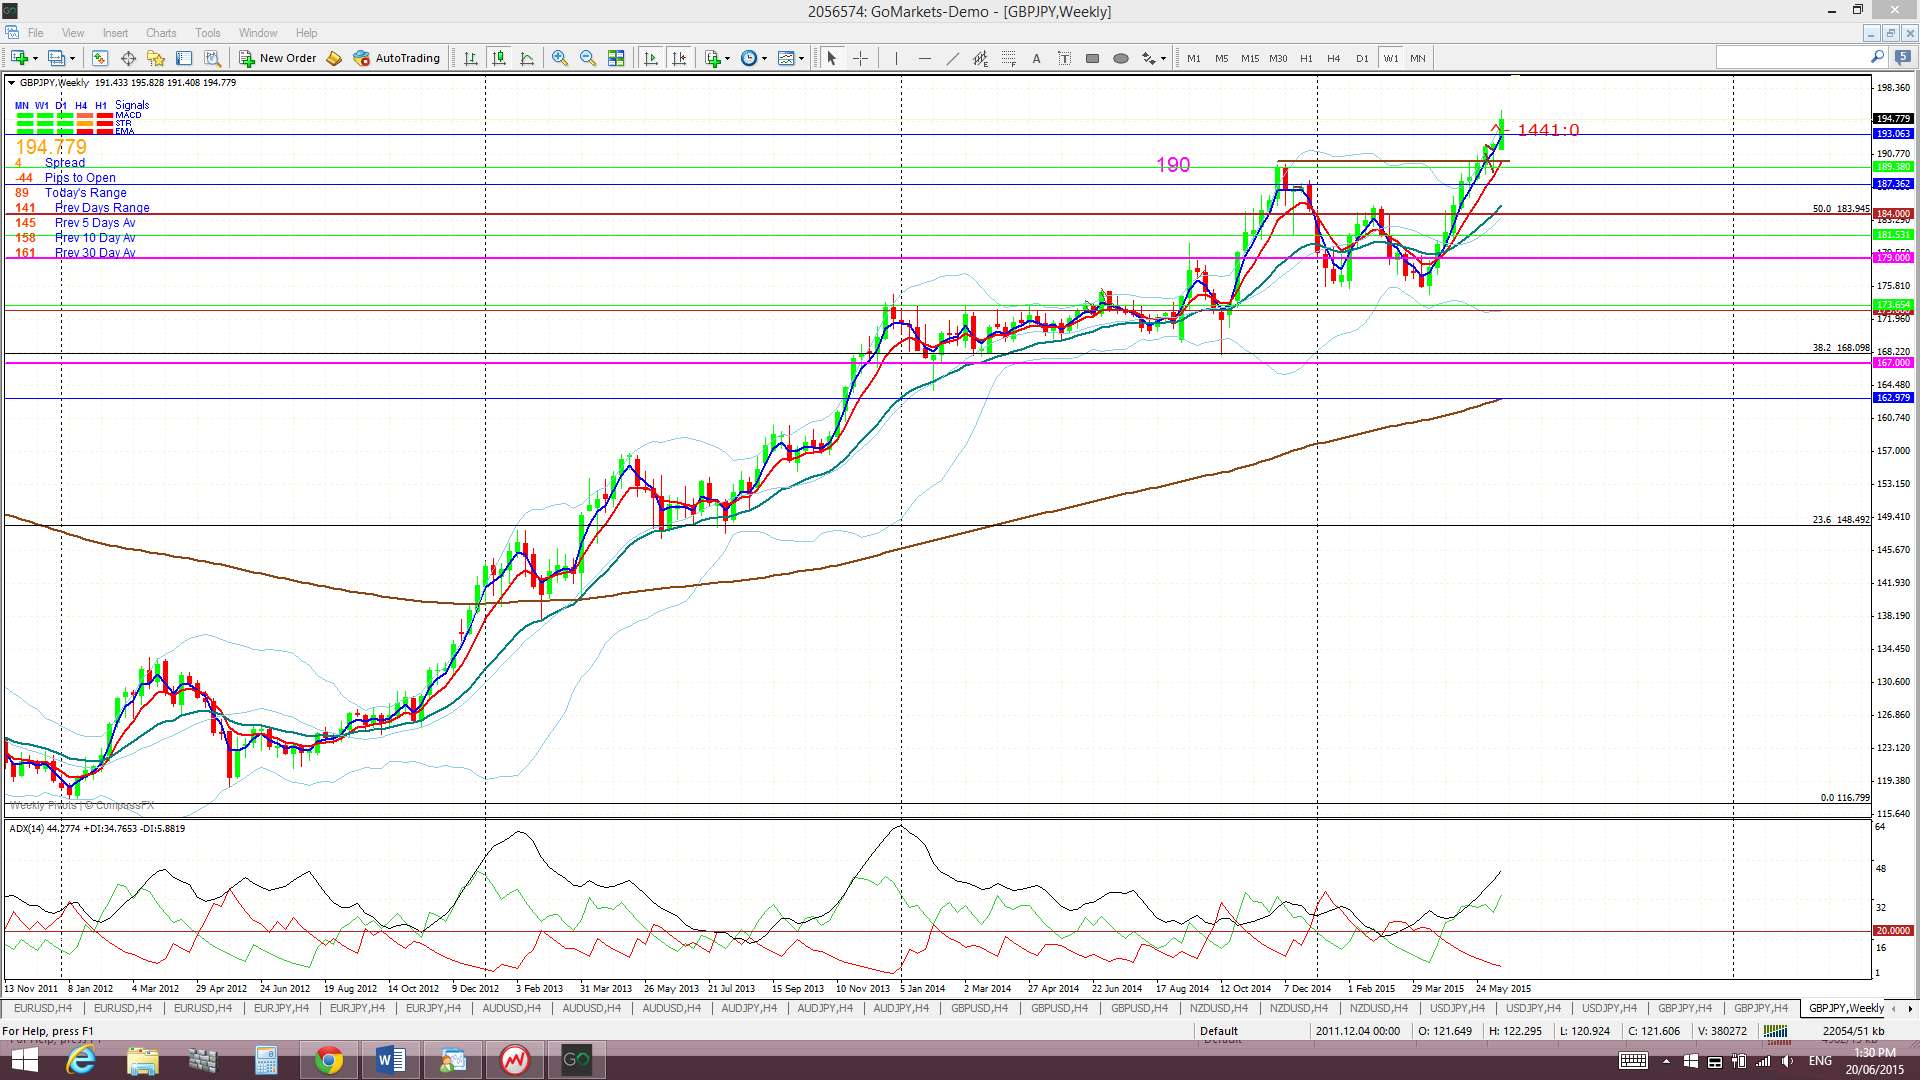
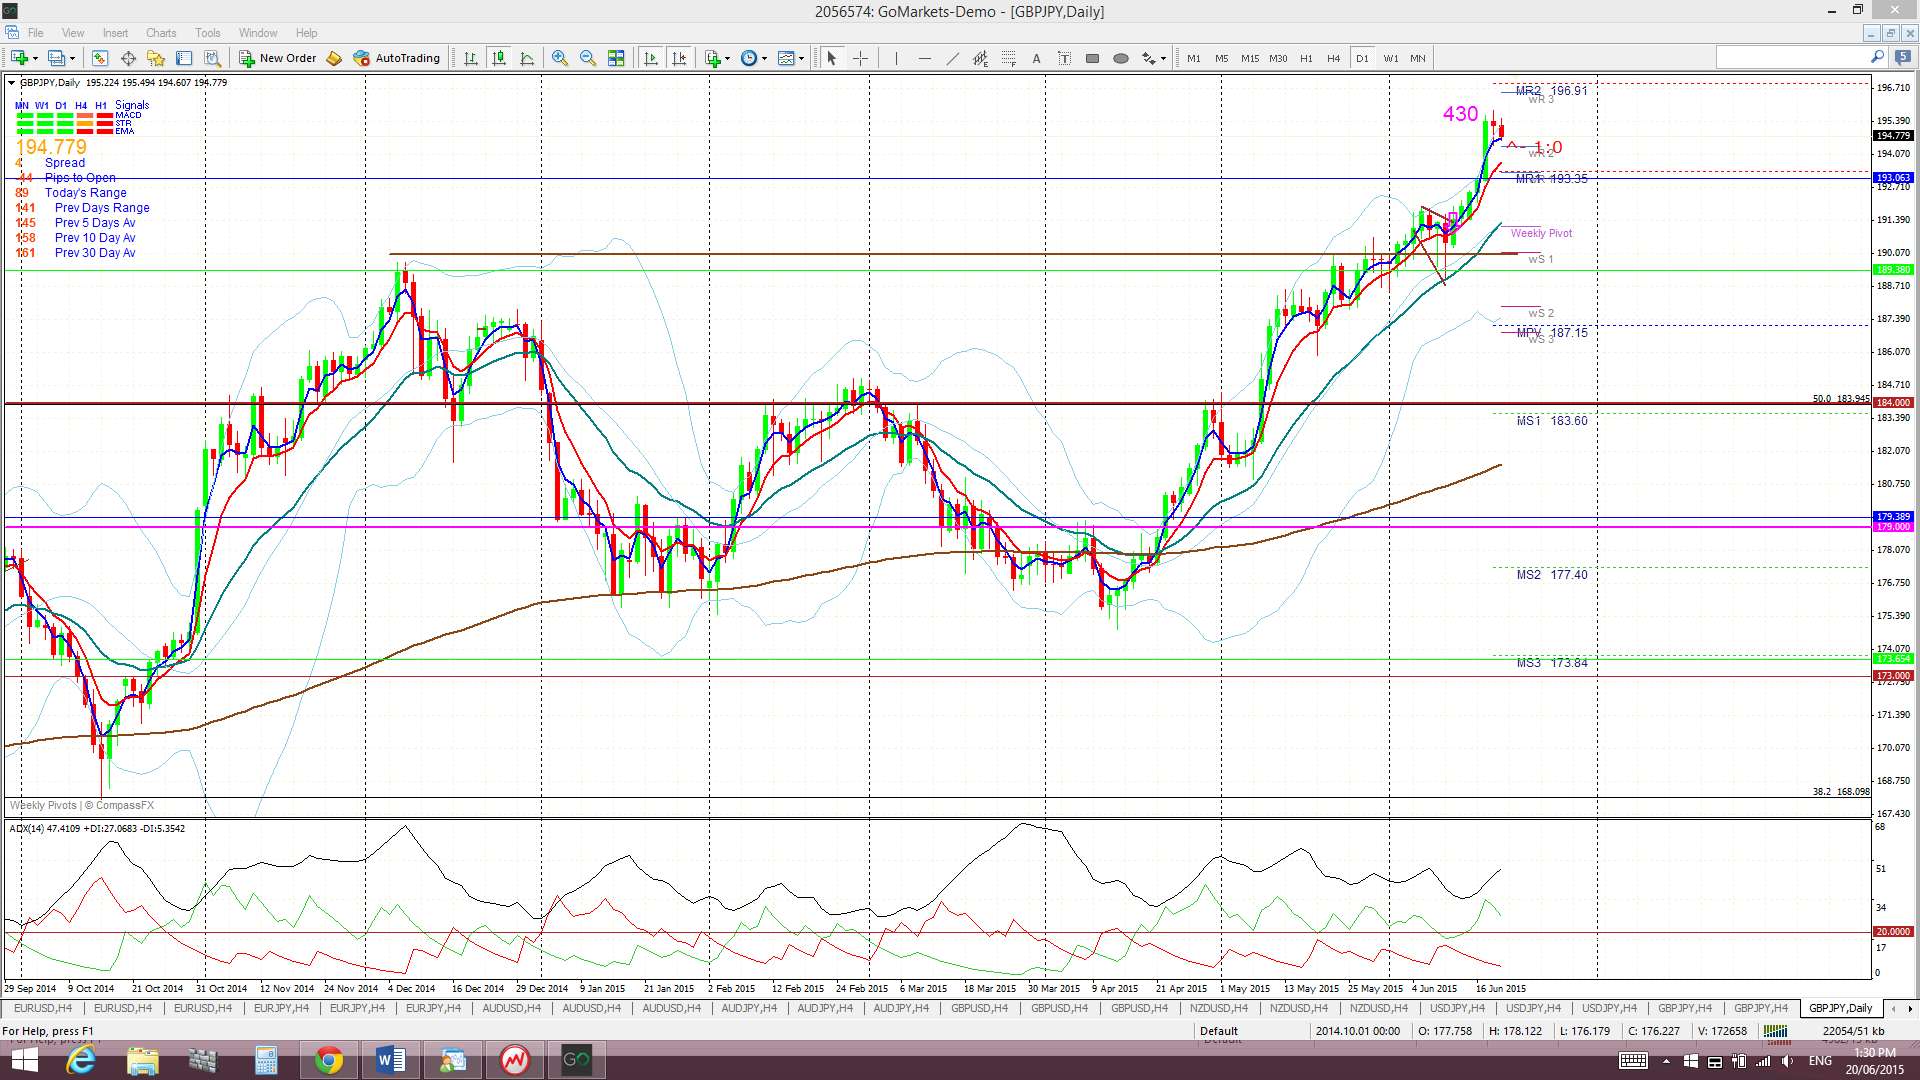
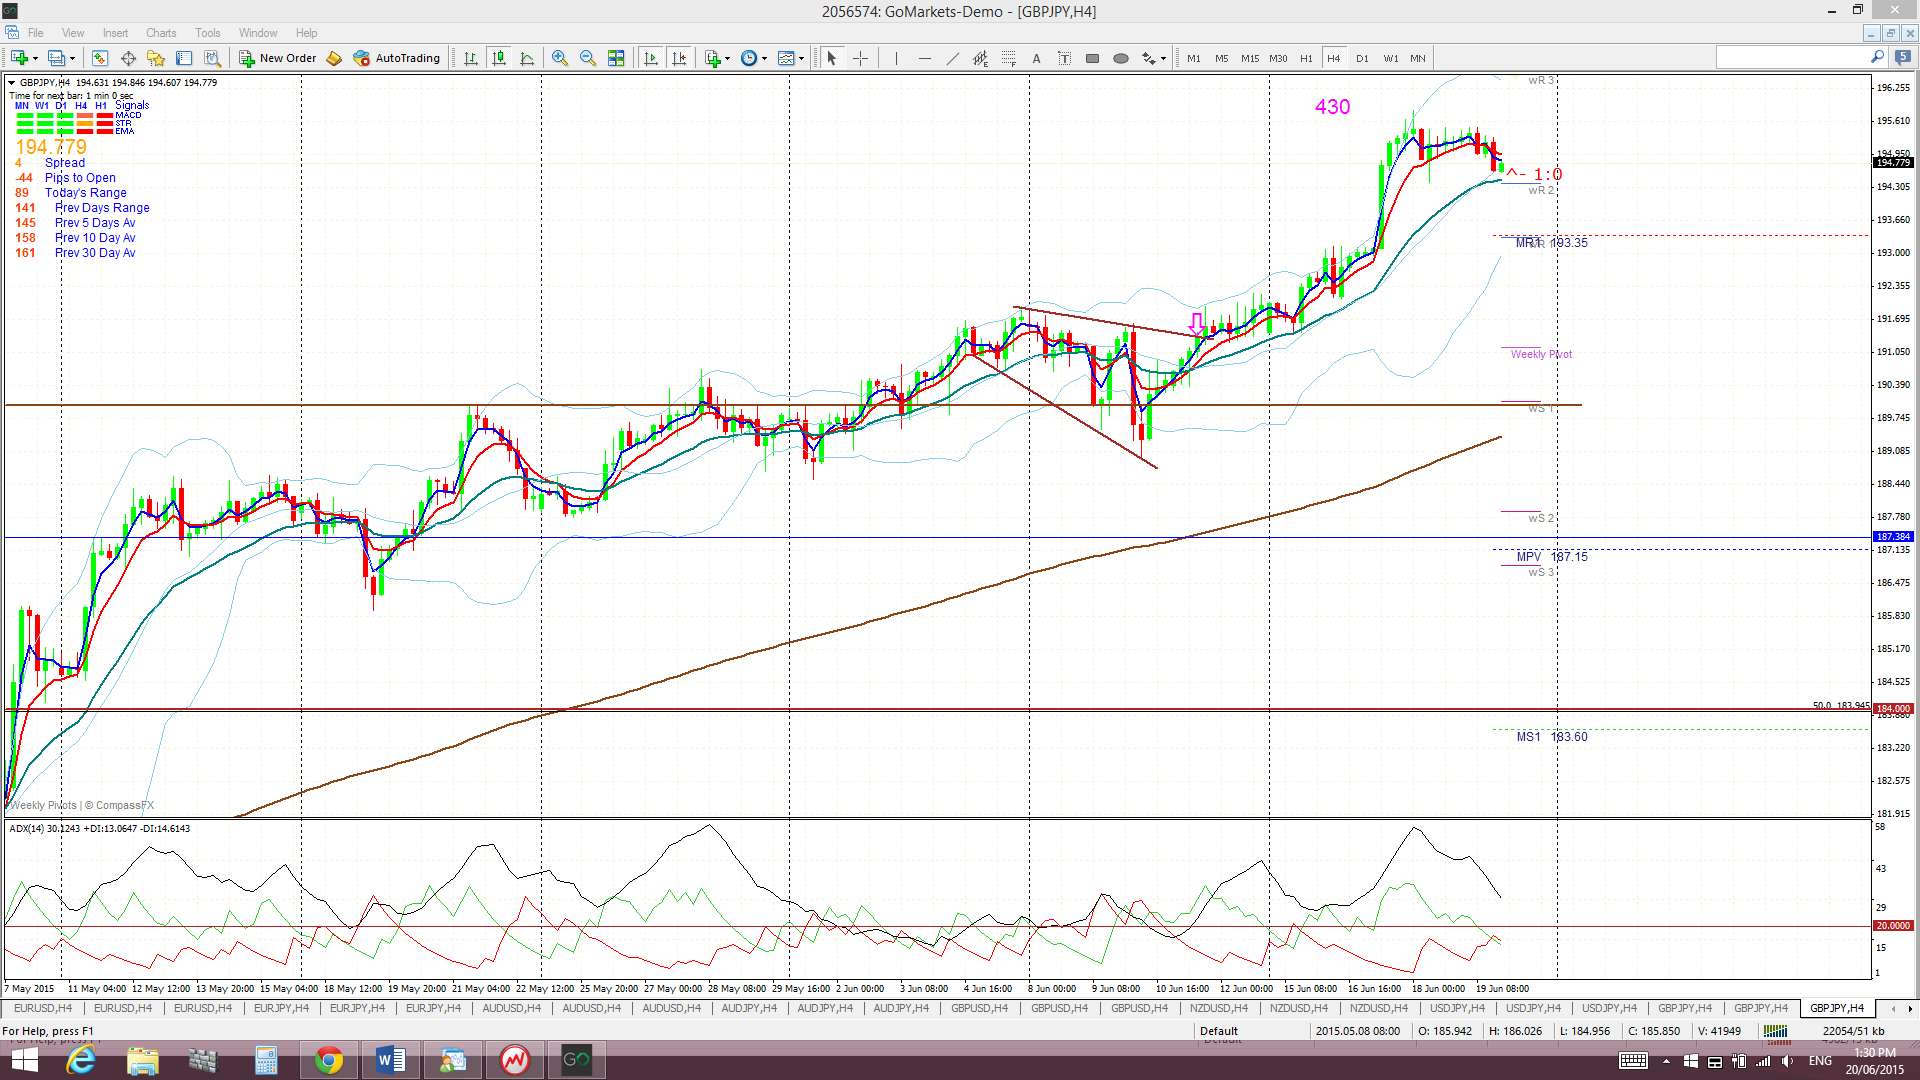
GBP/JPY: The GBP/JPY continued to make gains after the previous week’s triangle breakout and TC signal. The pip tally from this TC signal peaked at 430 pips but closed off during Friday’s session.
The 61.8% fib of the major 2007-2011 swing low move is above current price and near the 200 level and so I would expect this pair to target that level if bullish momentum continues at all.
Price is still trading above the Ichimoku Cloud on the 4hr, daily, weekly and monthly charts.
The weekly candle closed as a large bullish candle.
Risk events here are much the same as for the GBP/USD.
- I’m watching for any new TC signal on this pair.
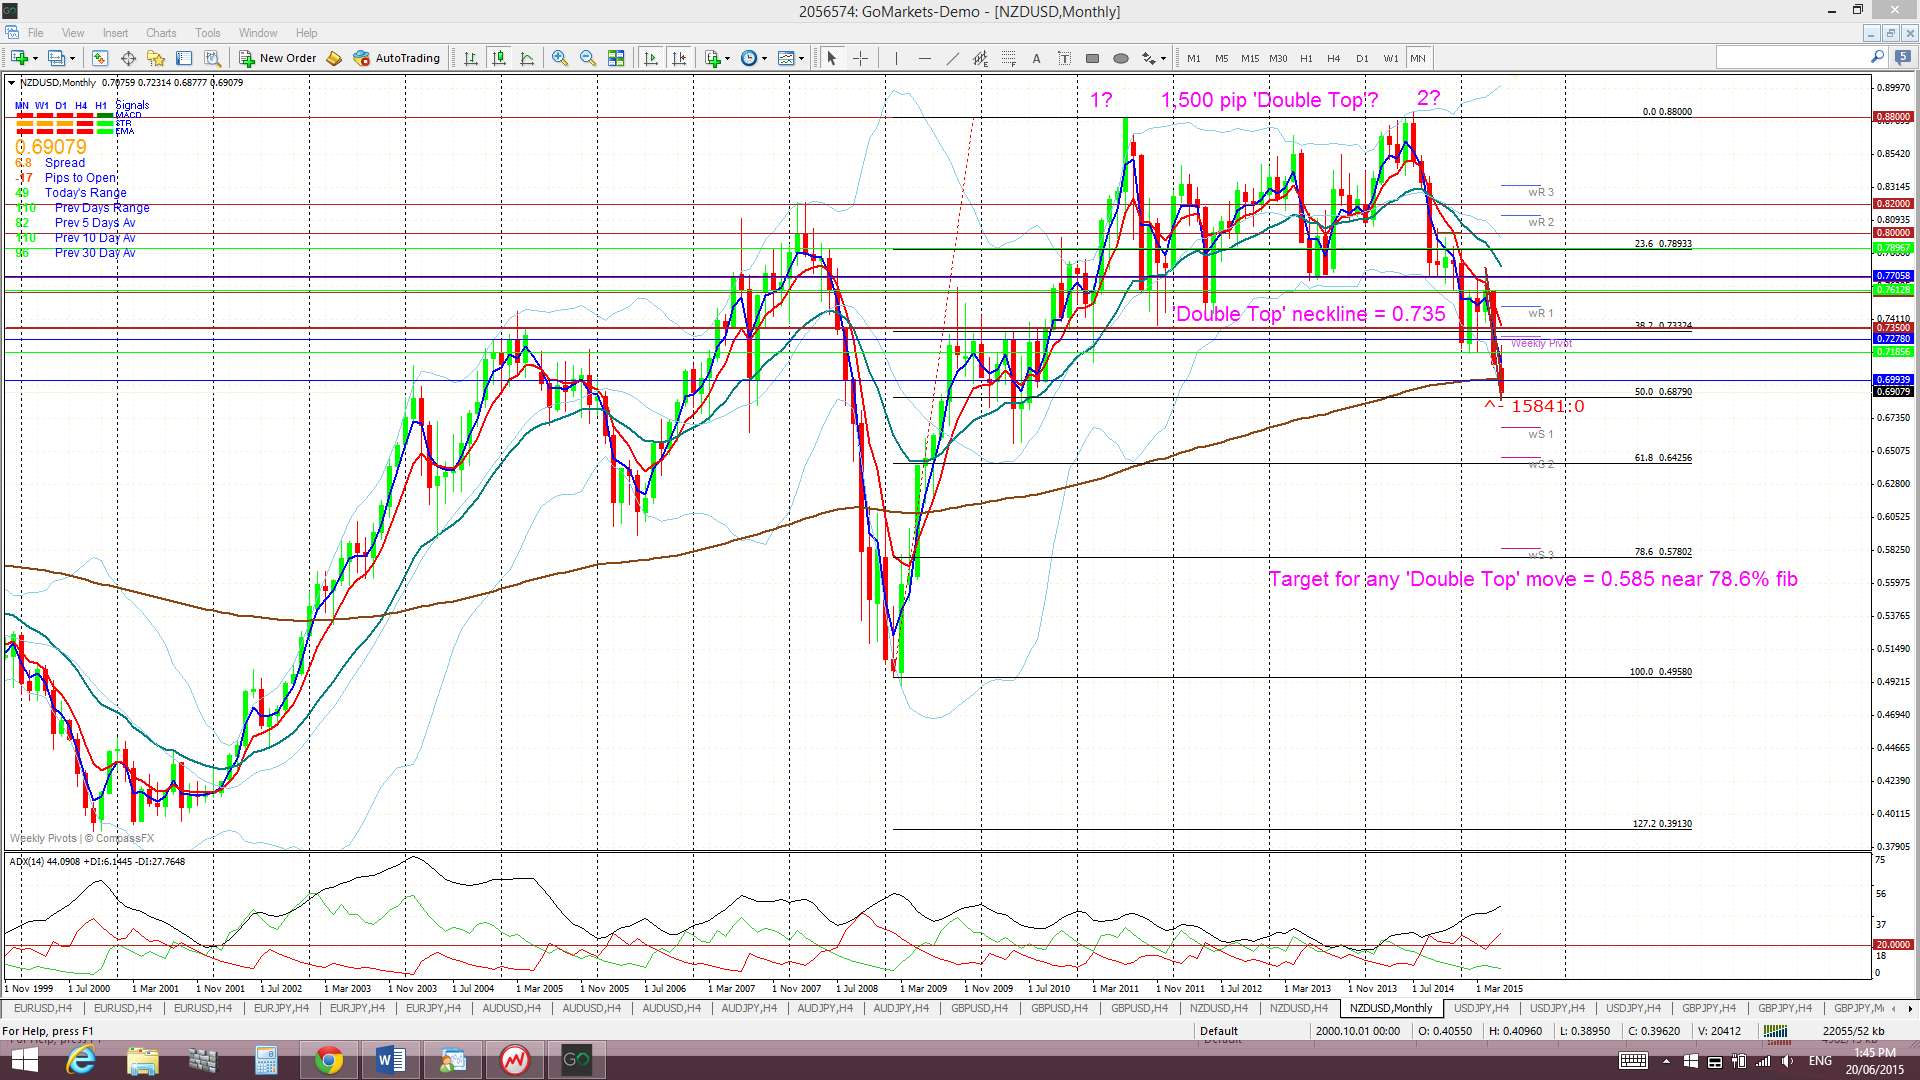
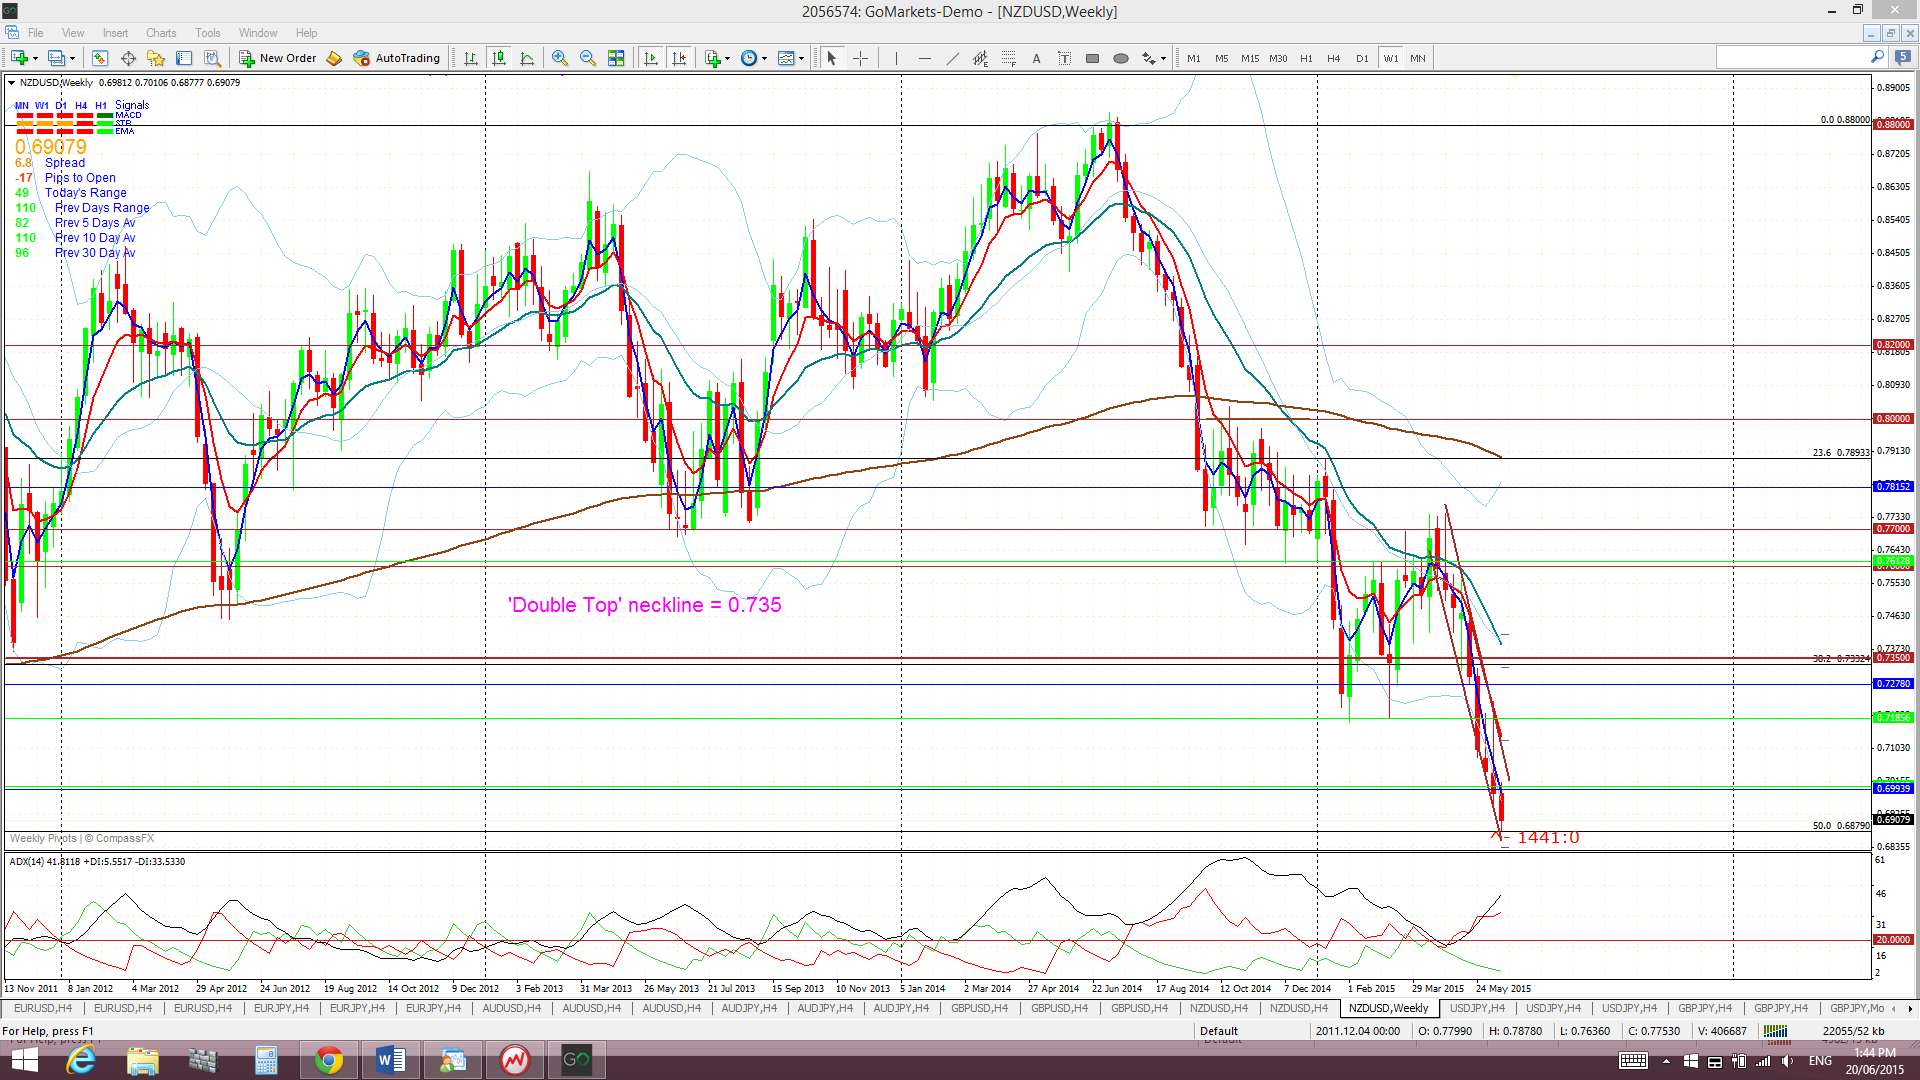
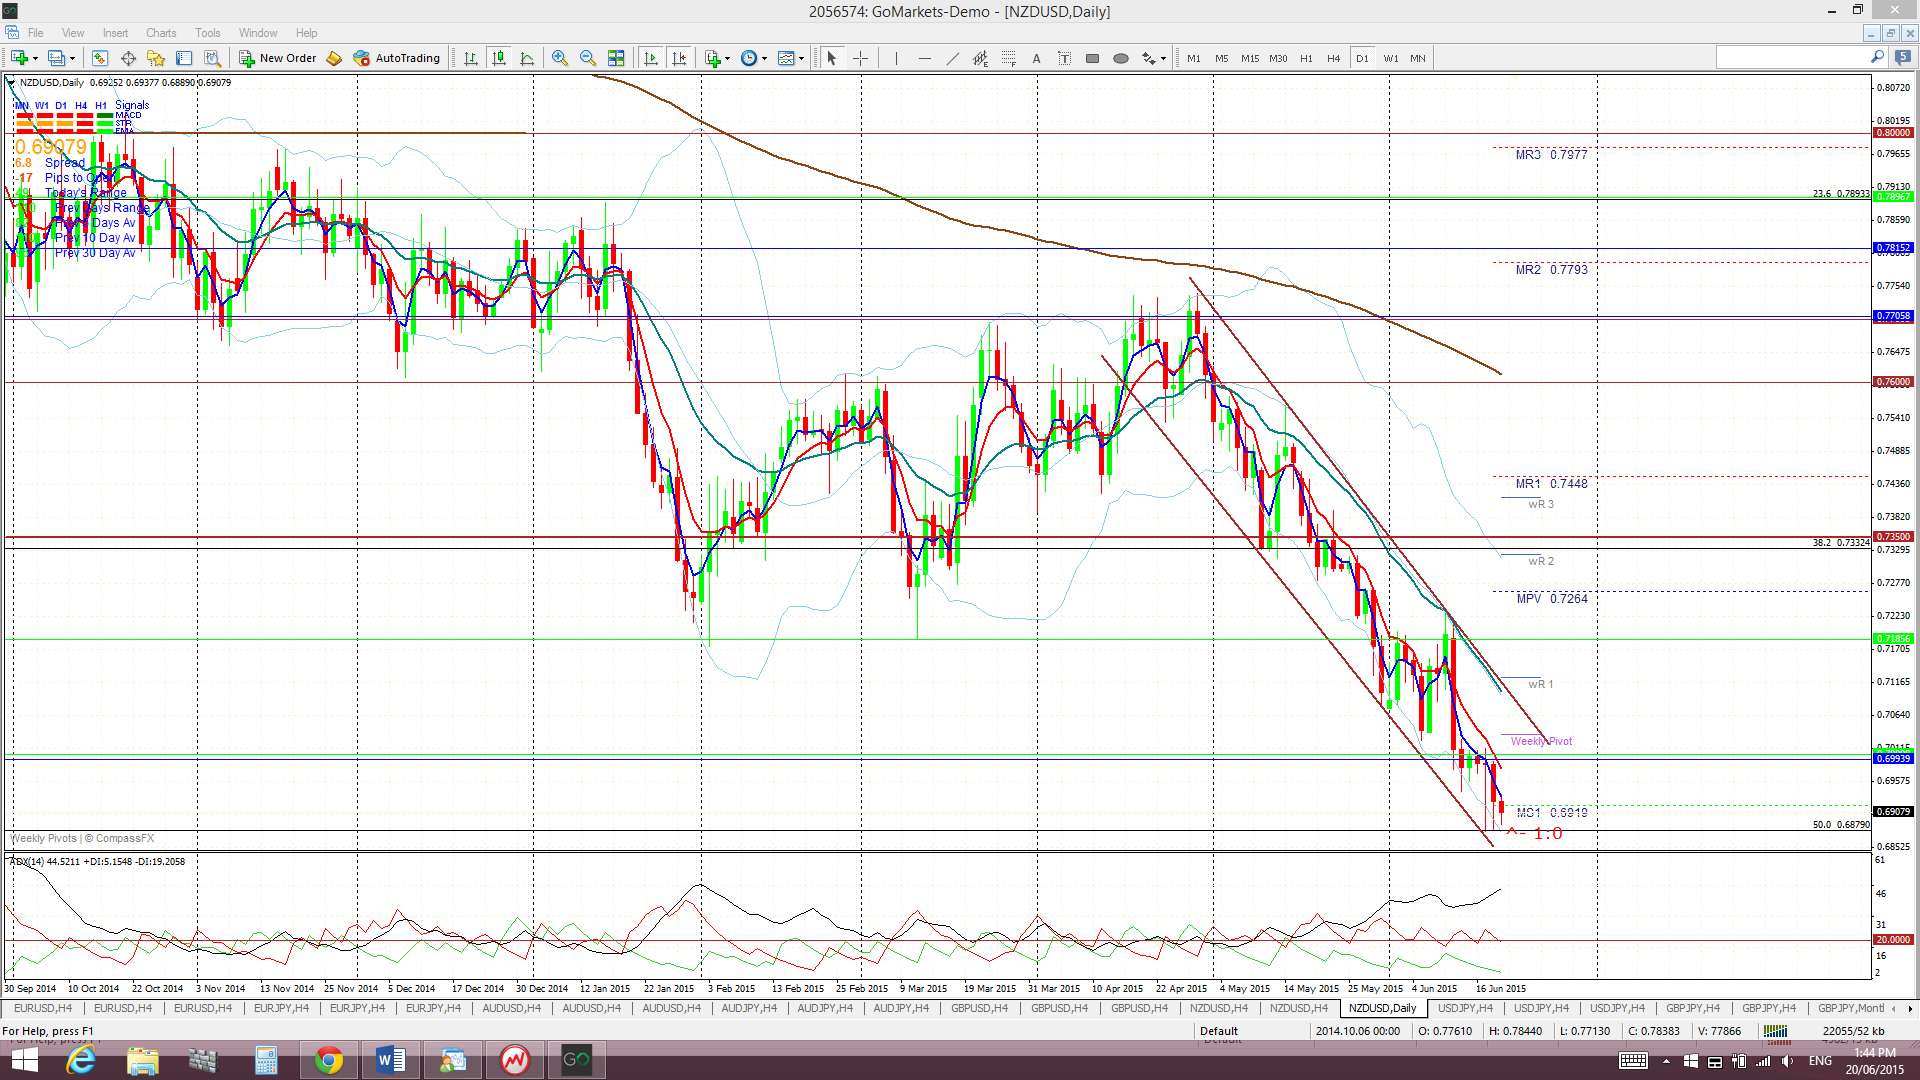
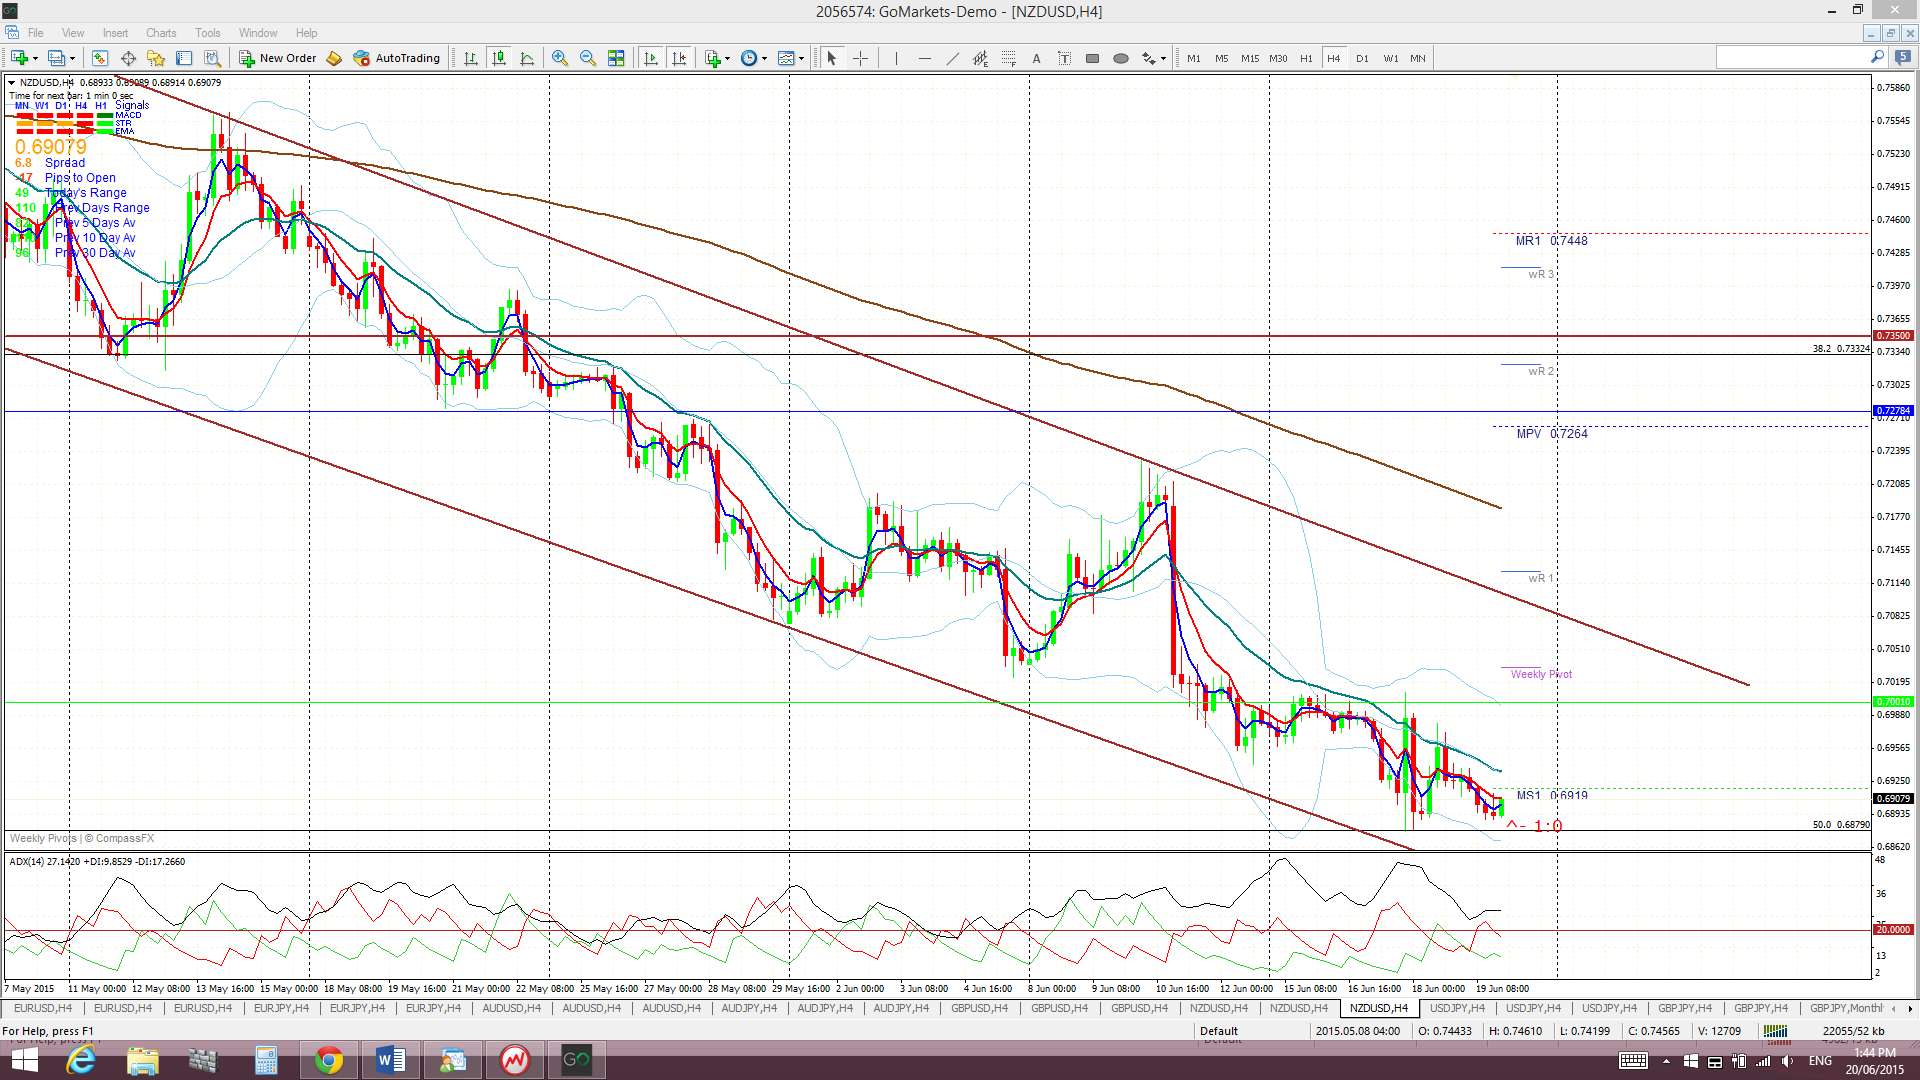
Kiwi: NZD/USD: The Kiwi is still trading within a descending trading channel and below the monthly chart’s ‘Double Top’ neck line level of 0.735. Price chopped along below this ‘neck line’ in a range between the monthly 200 EMA and the 50 % fib of the 2009-2011 swing high move. Any break and hold below this 50% fib support would suggest a trip down to the 61.8% fib level near 65 cents.
‘Double Top’ breakdown on Monthly chart? The monthly chart still reveals a possible ‘Double Top’ pattern with a neck line at 0.735. The monthly candle close below this level for January suggested a possible 2,000 pip bearish follow through move as this is the height of the ‘Double Top’. The May monthly candle closed below this level so this may mark the start of the bearish breakdown here. Technical theory would suggest looking for a test of 0.735 before bearish continuation but these ‘tests of broken trend line’ have been few and far between of late!
Price is still trading below the Ichimoku Cloud on the 4hr, daily and weekly charts and in the lower part of the Cloud on the monthly chart. A break and hold below the monthly Cloud would be bearish but this region may offer some support to the Kiwi.
The weekly candle closed as a bearish candle.
There is NZD Trade Balance data on Friday but also watch out for any Greek-debt news related movement.
- I’m watching for any new TC signal on this pair and the 50% fib level.
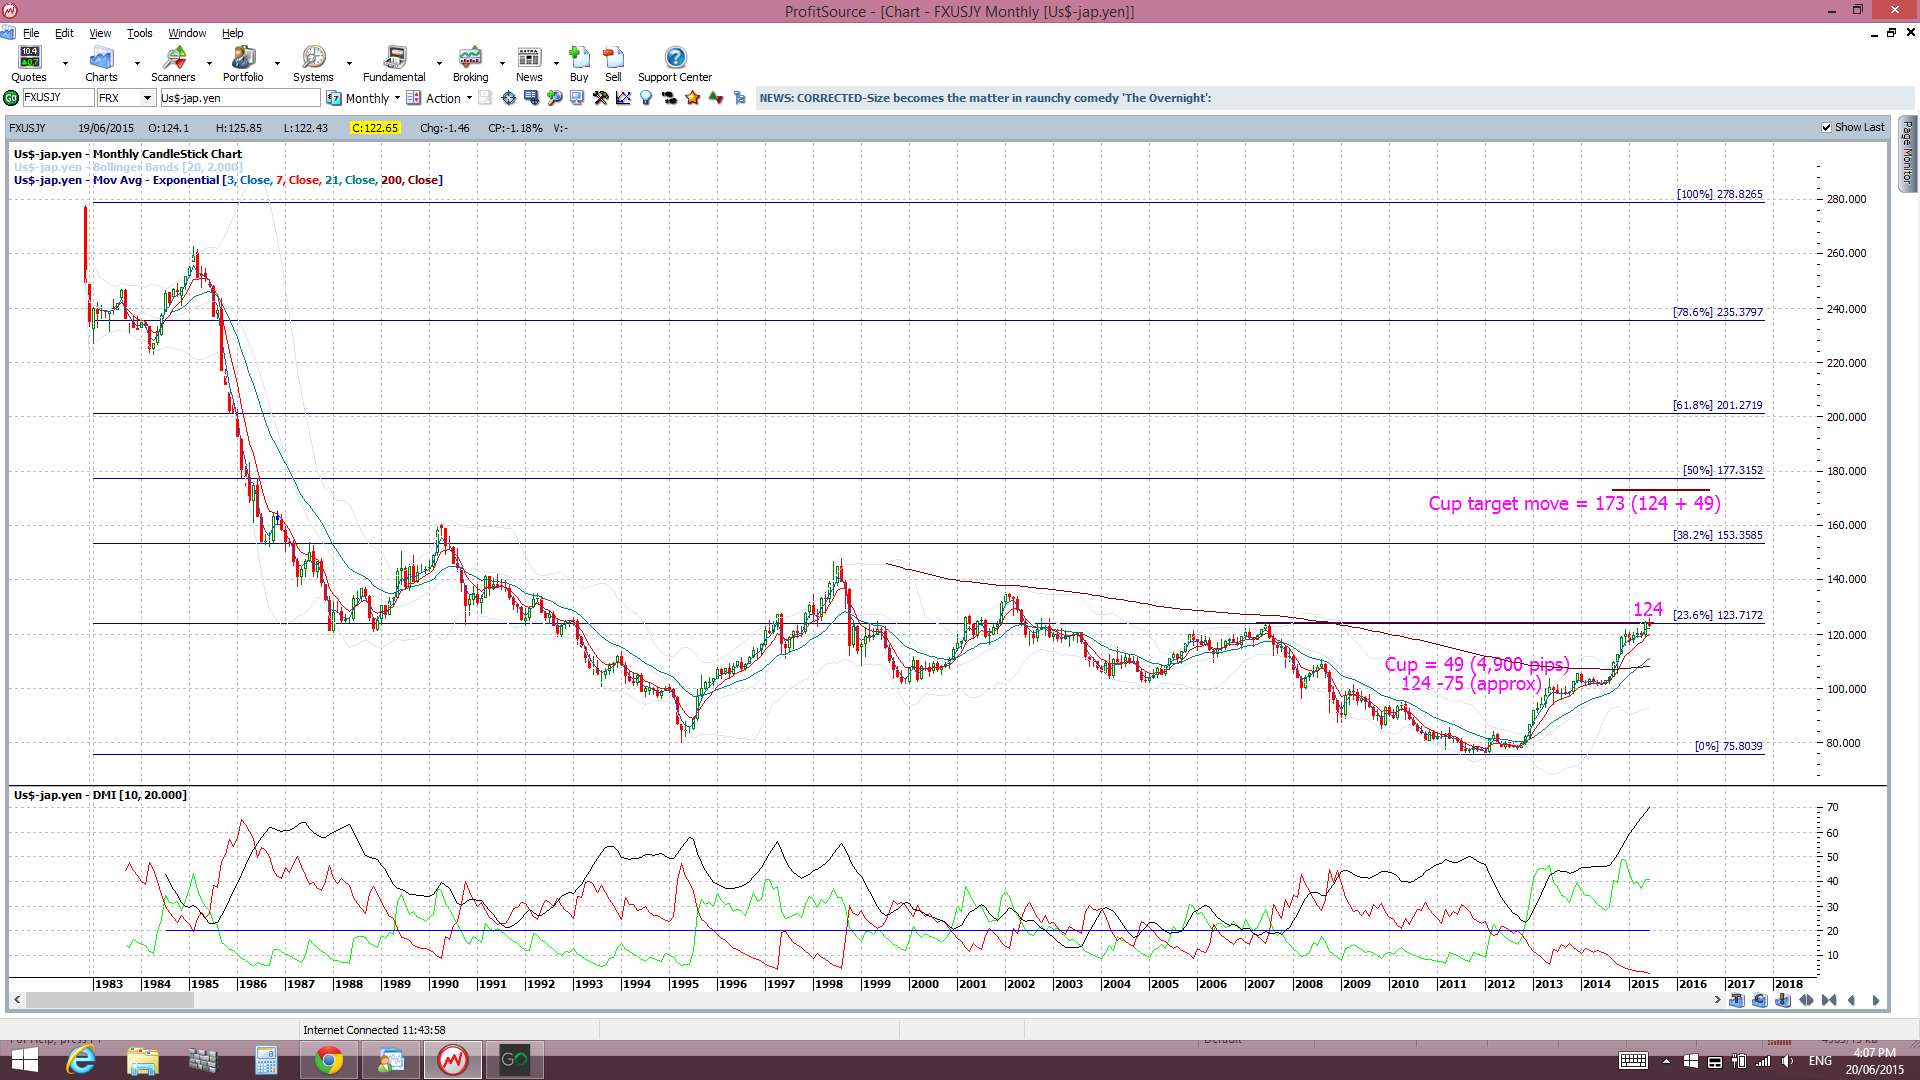
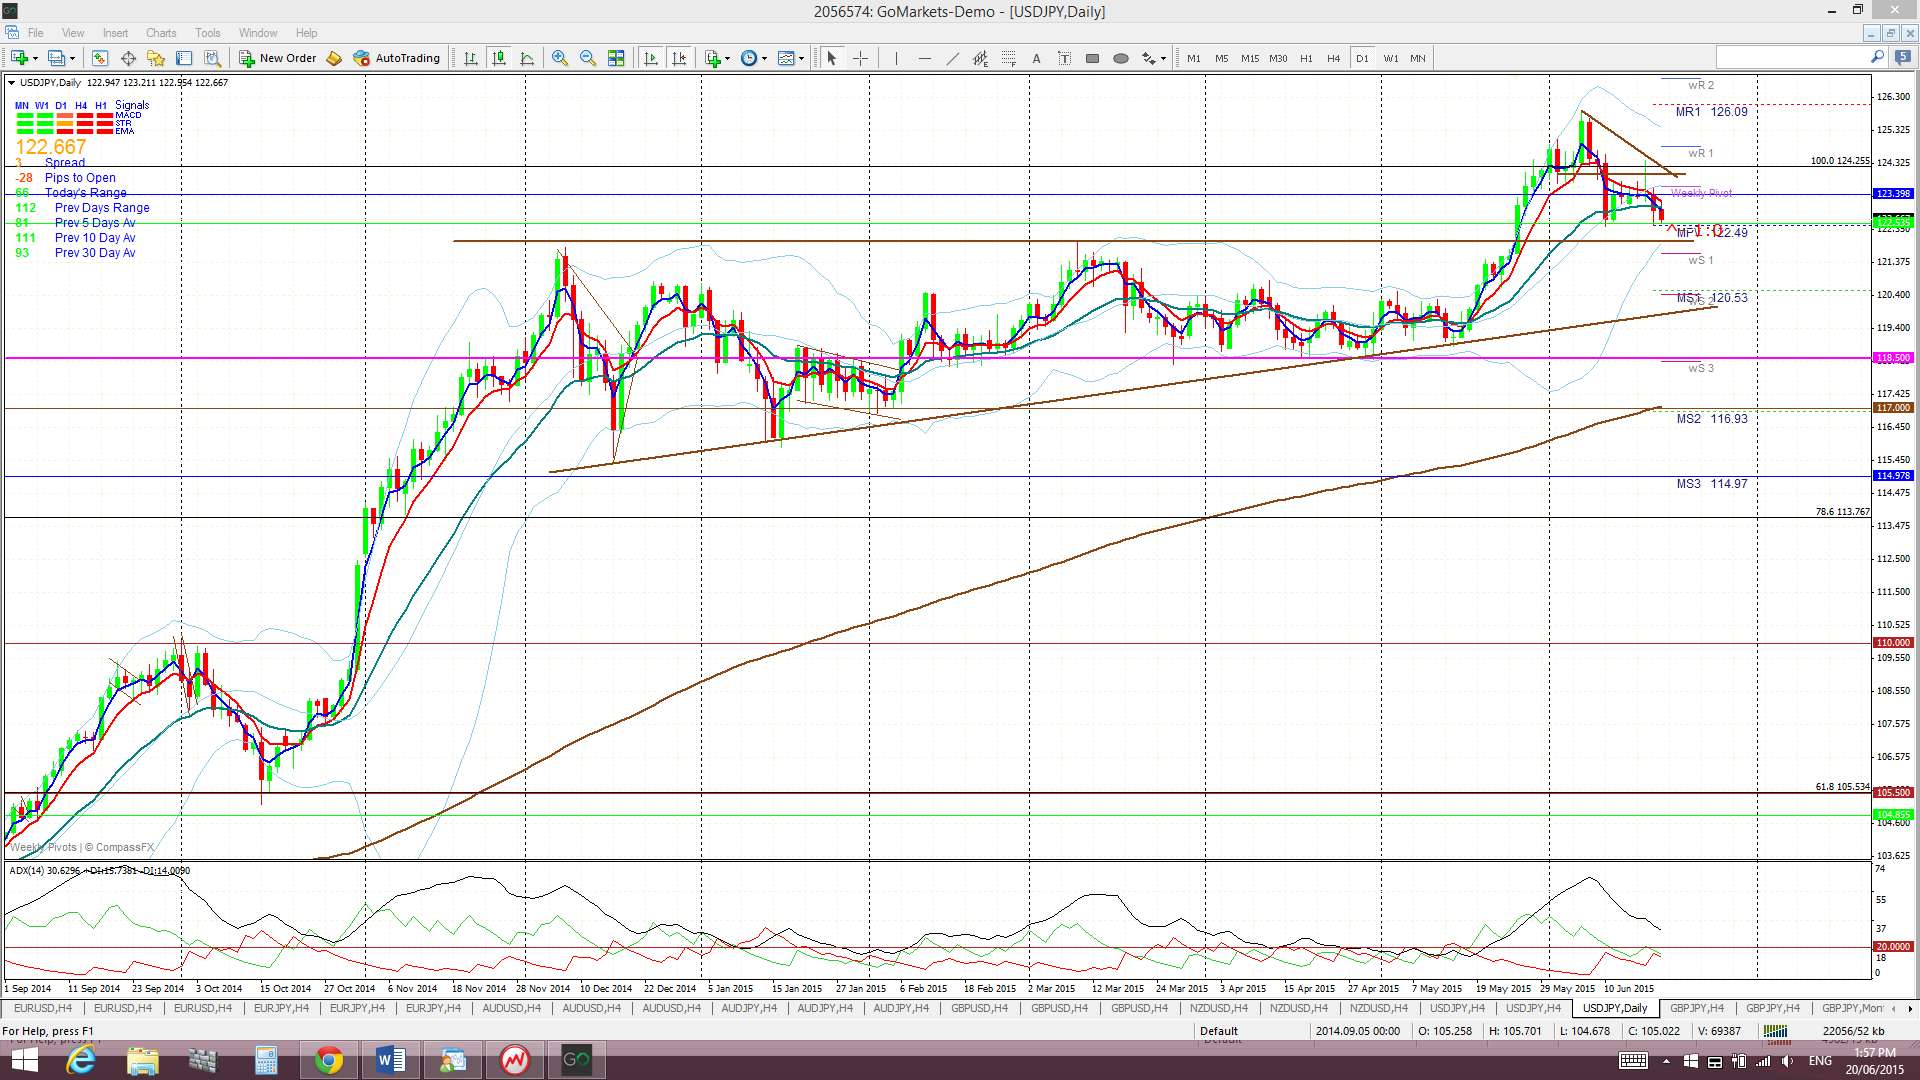
The Yen: U/J: US$ weakness kept this pair trading below the 124 level for most of the week. Remember that 124 represents highs not seen since April 2002. Price pulled back but found support from the 50% fib of the recent swing high move.
Price is now trading below the Cloud on the 4hr chart but above the Cloud on the daily, weekly and monthly charts.
The weekly candle closed as a small bearish candle with a long upper shadow.
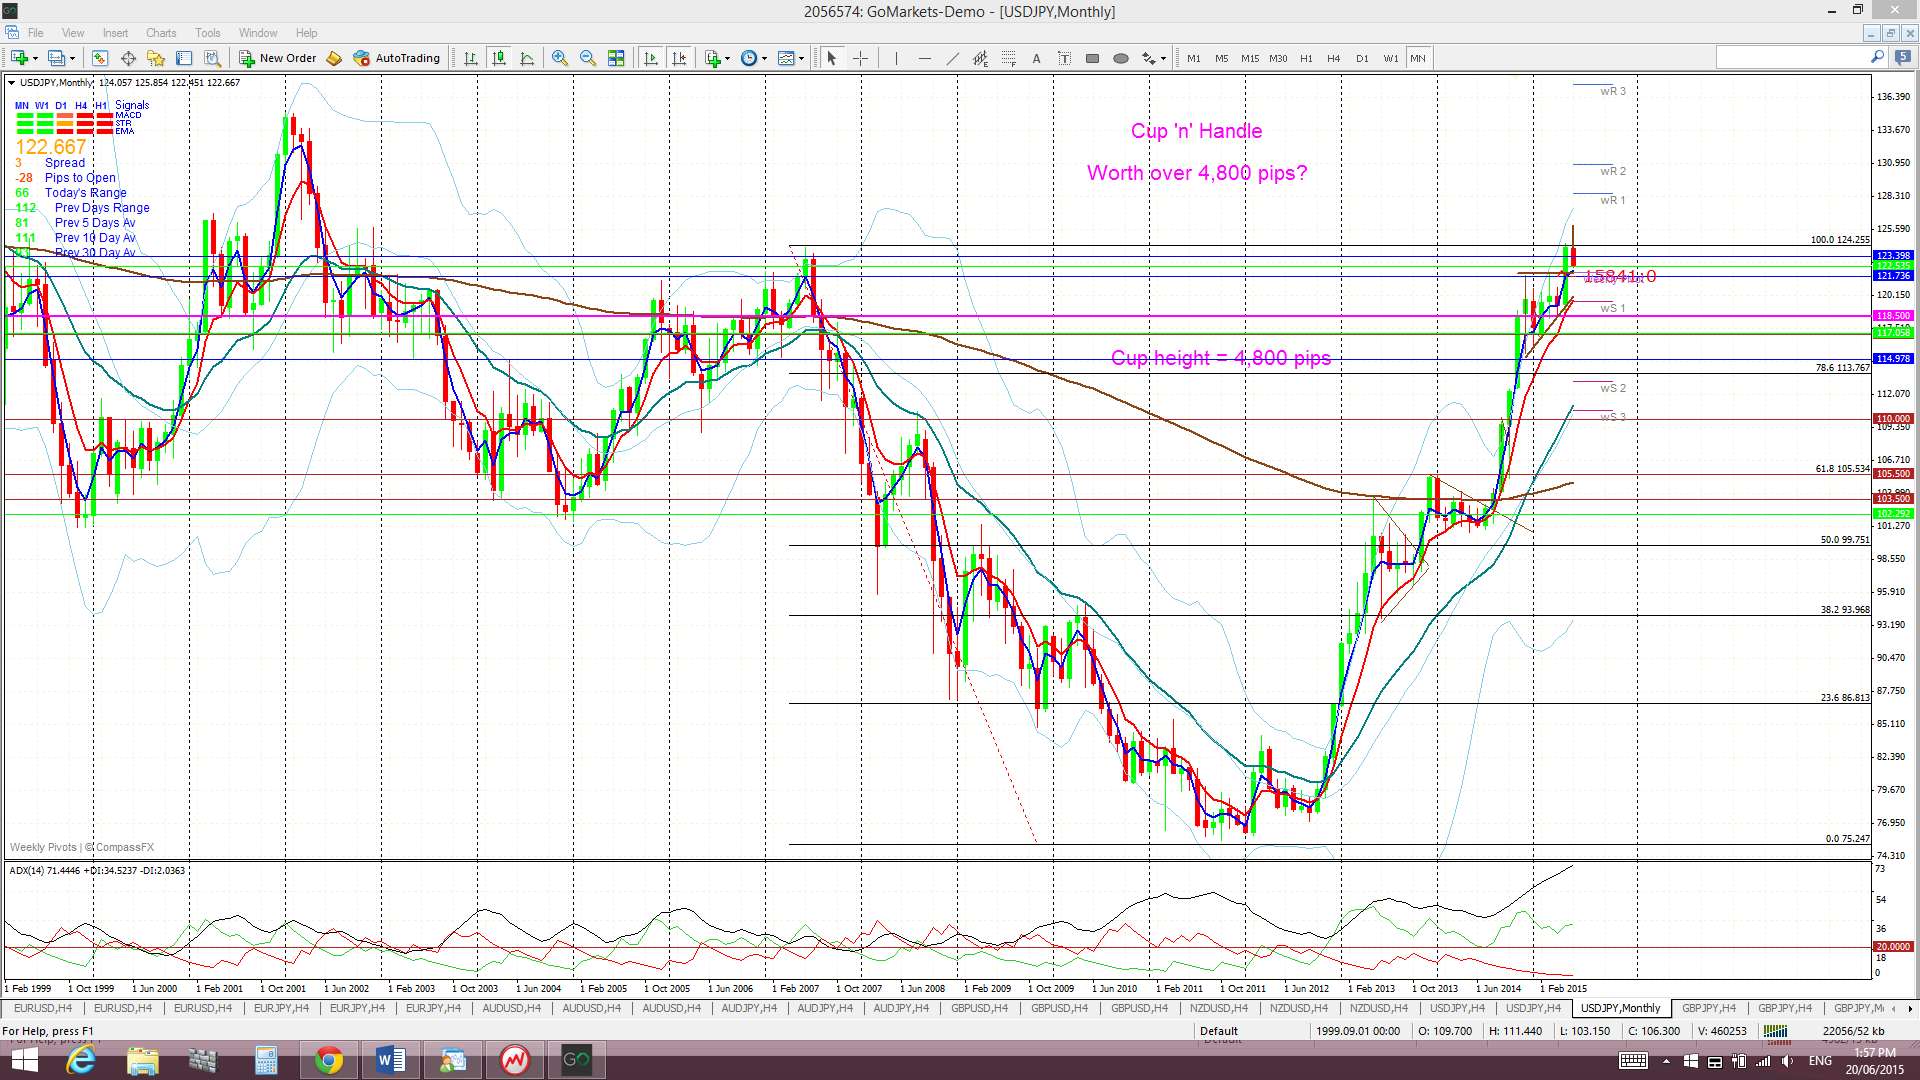
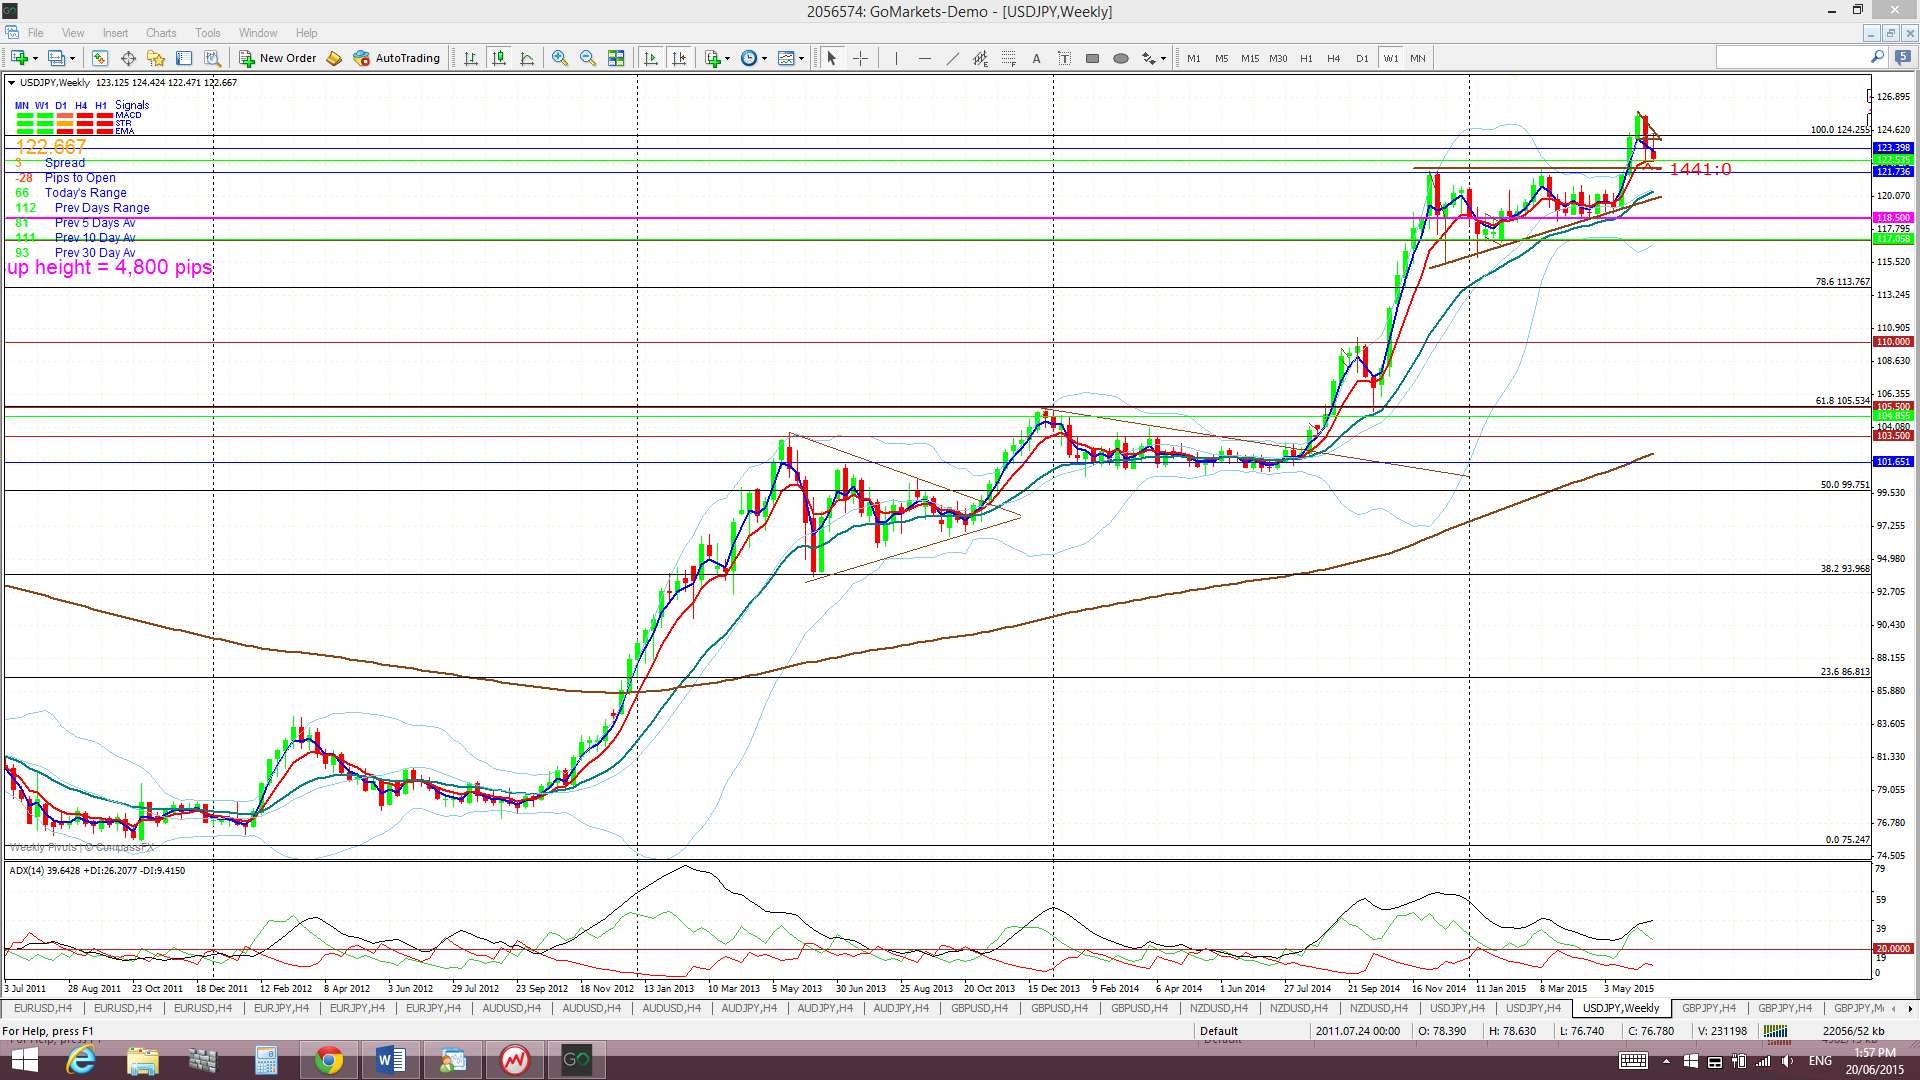
Monthly Chart Bullish Cup’ n’ Handle pattern: There looks to be a new bullish Cup ‘n’ Handle forming up on the monthly chart. The theory behind these patterns is that the height of the ‘Cup’ pattern is equivalent to the expected bullish move from the ‘handle’ breakout. The height of the Cup for the U/J weekly chart is around 4,800~ 4,900 pips. This may seem like a massive move but the longer term chart below shows this move to be reasonable as it would take the U/J up near the 50% fib of the 1983-2012 swing low move.
- I’m watching for any new TC signal on this pair.
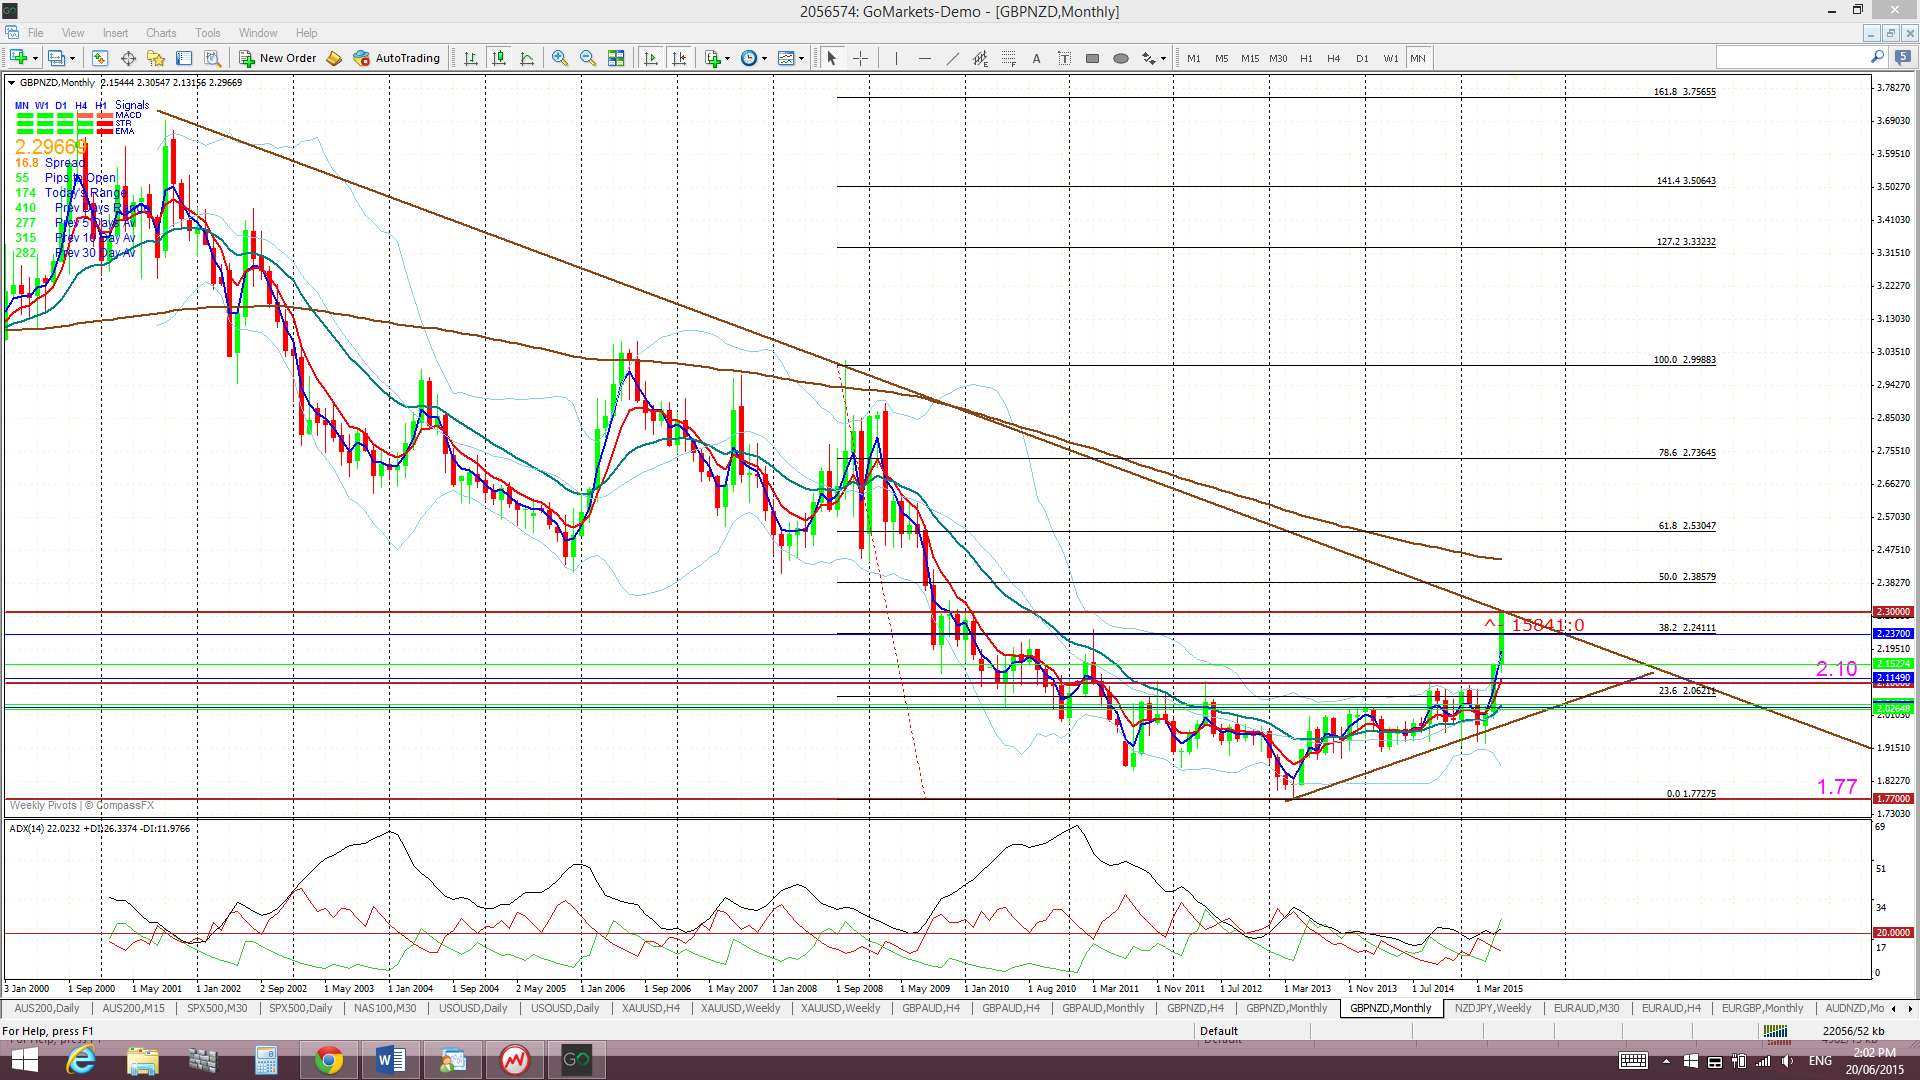
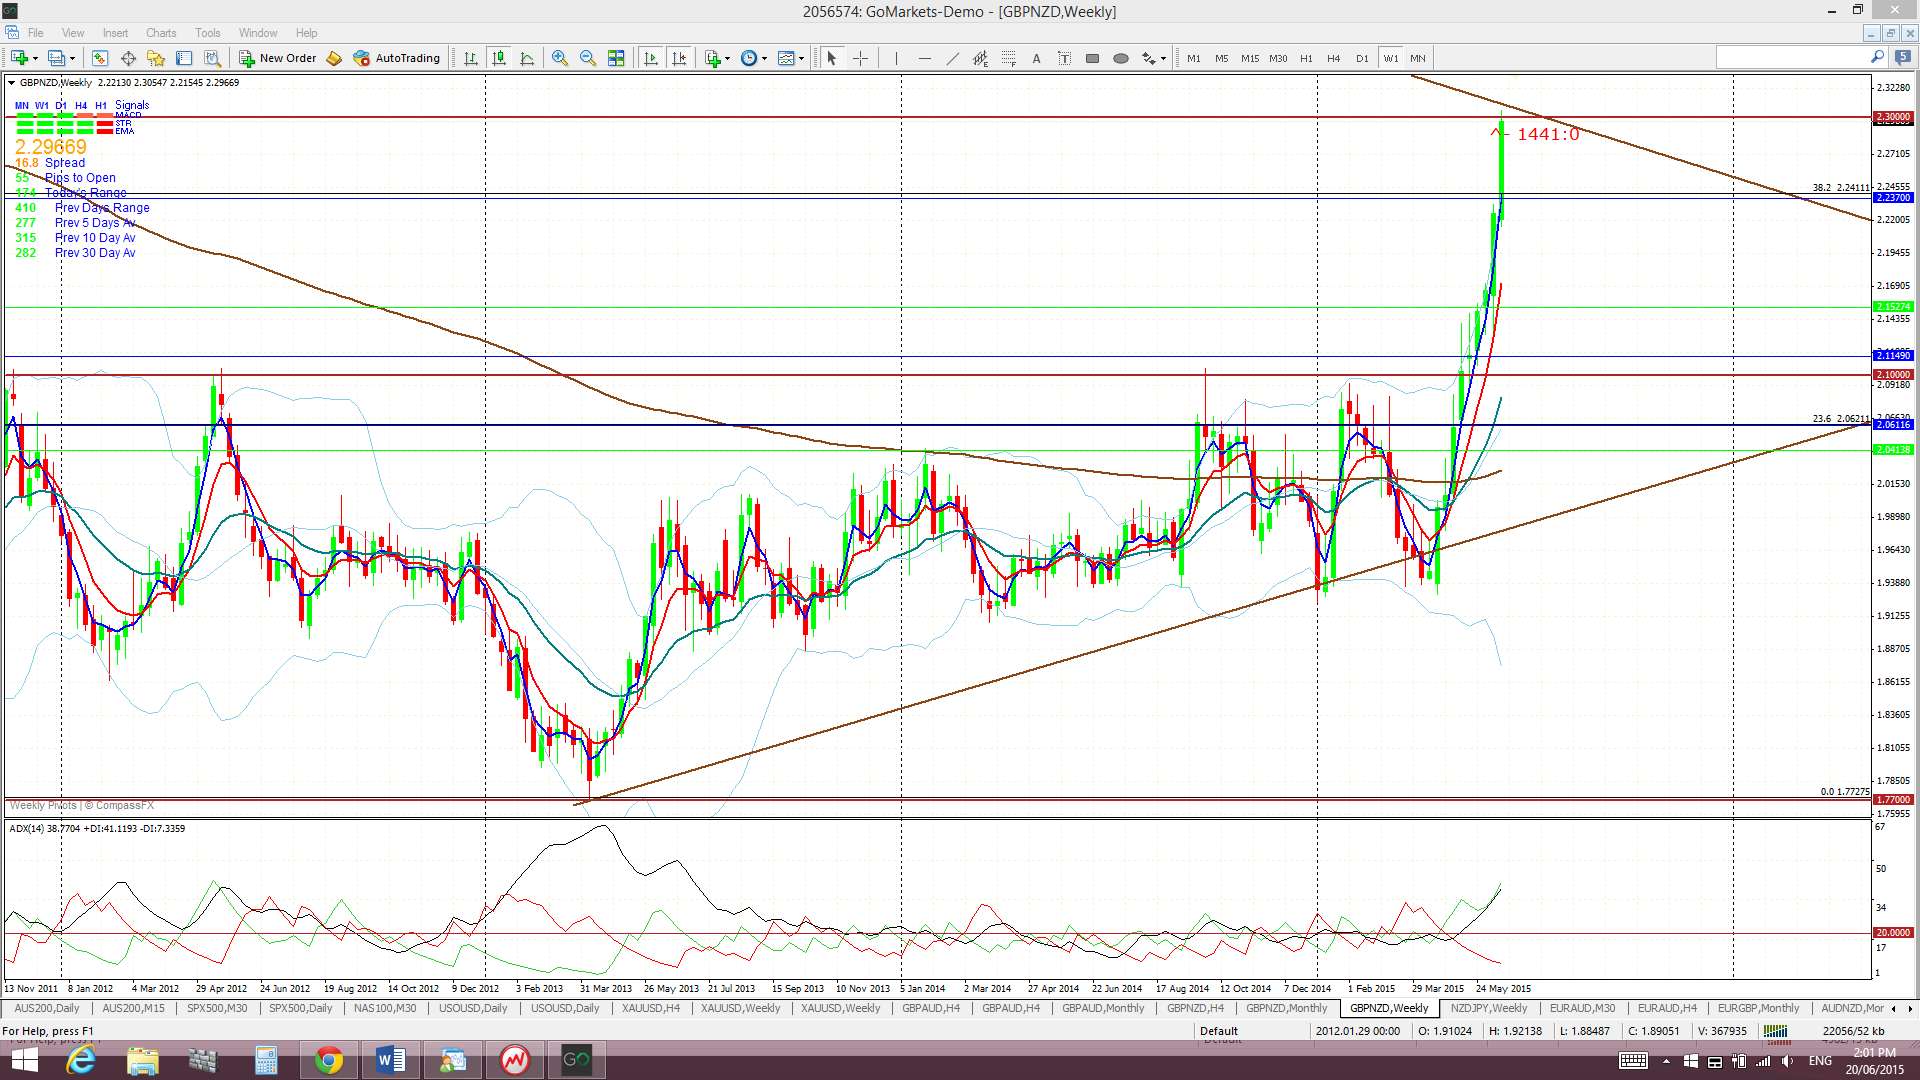
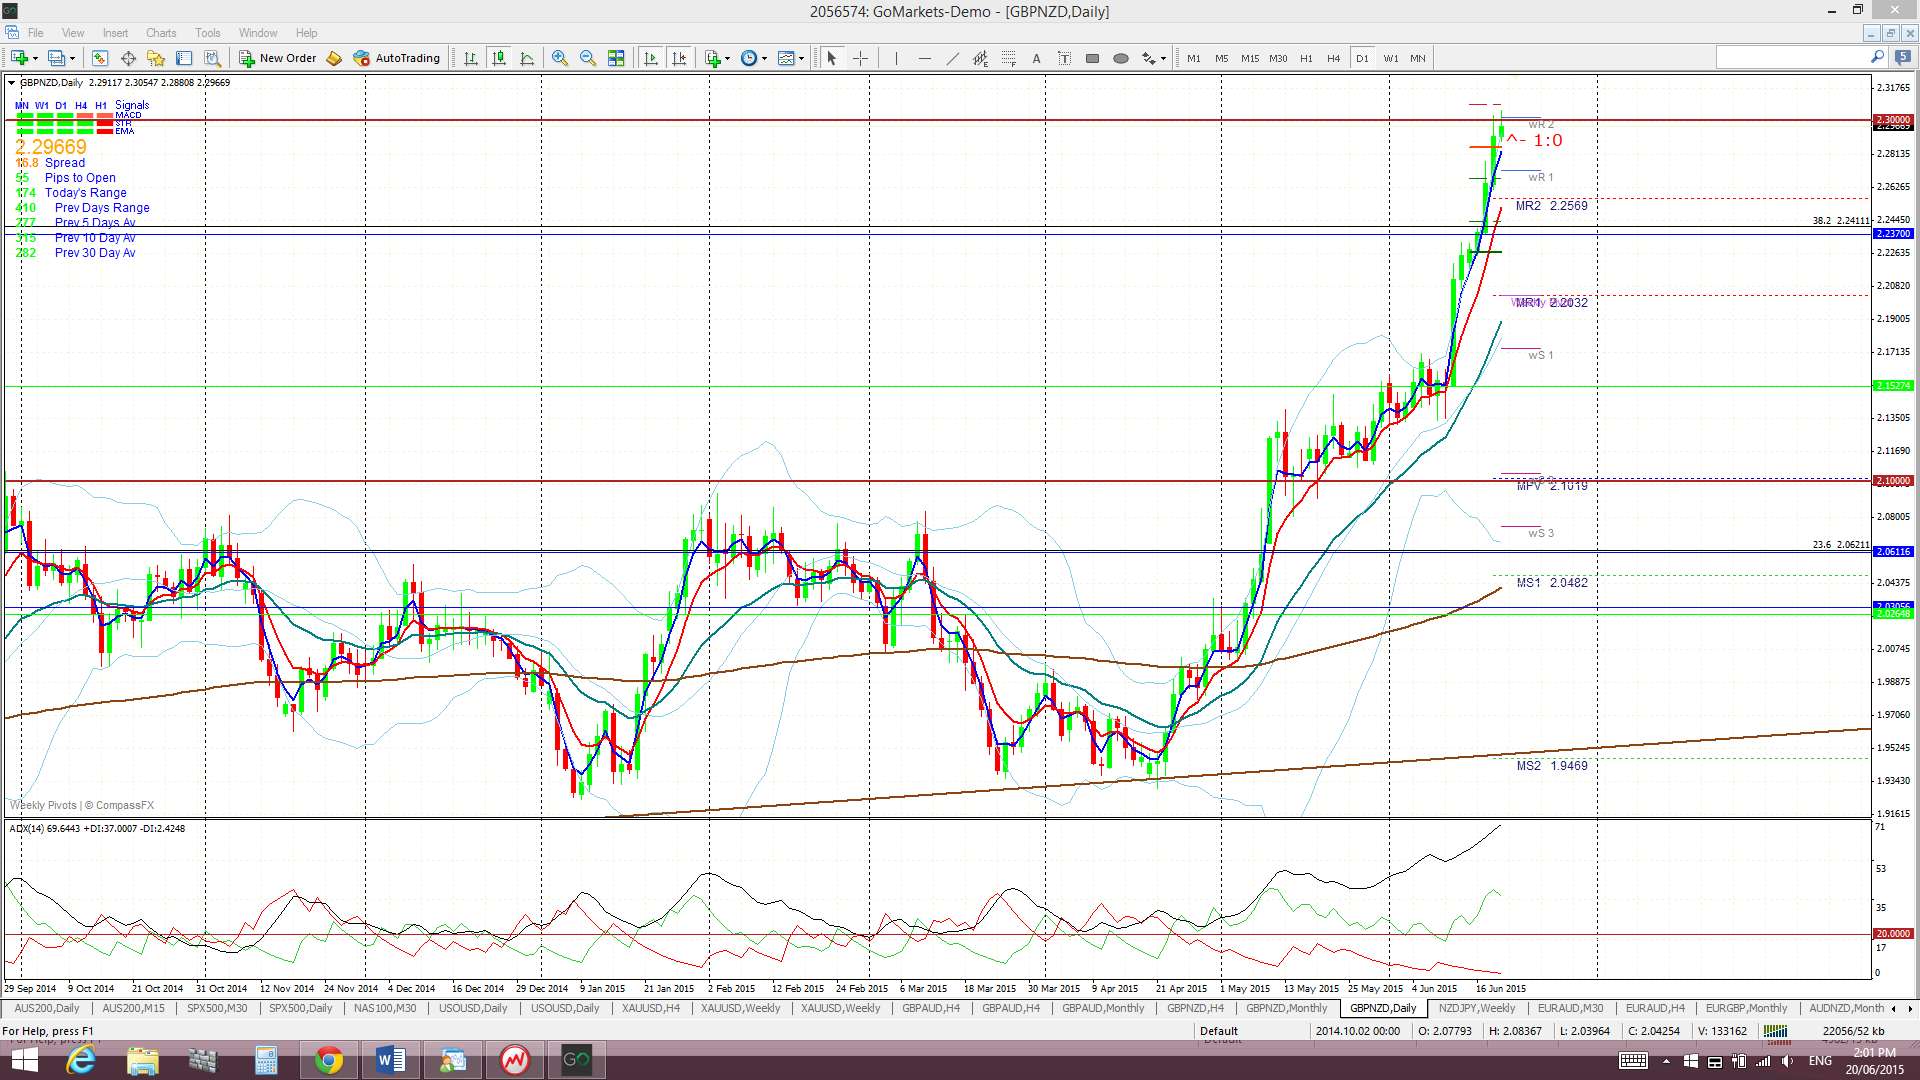
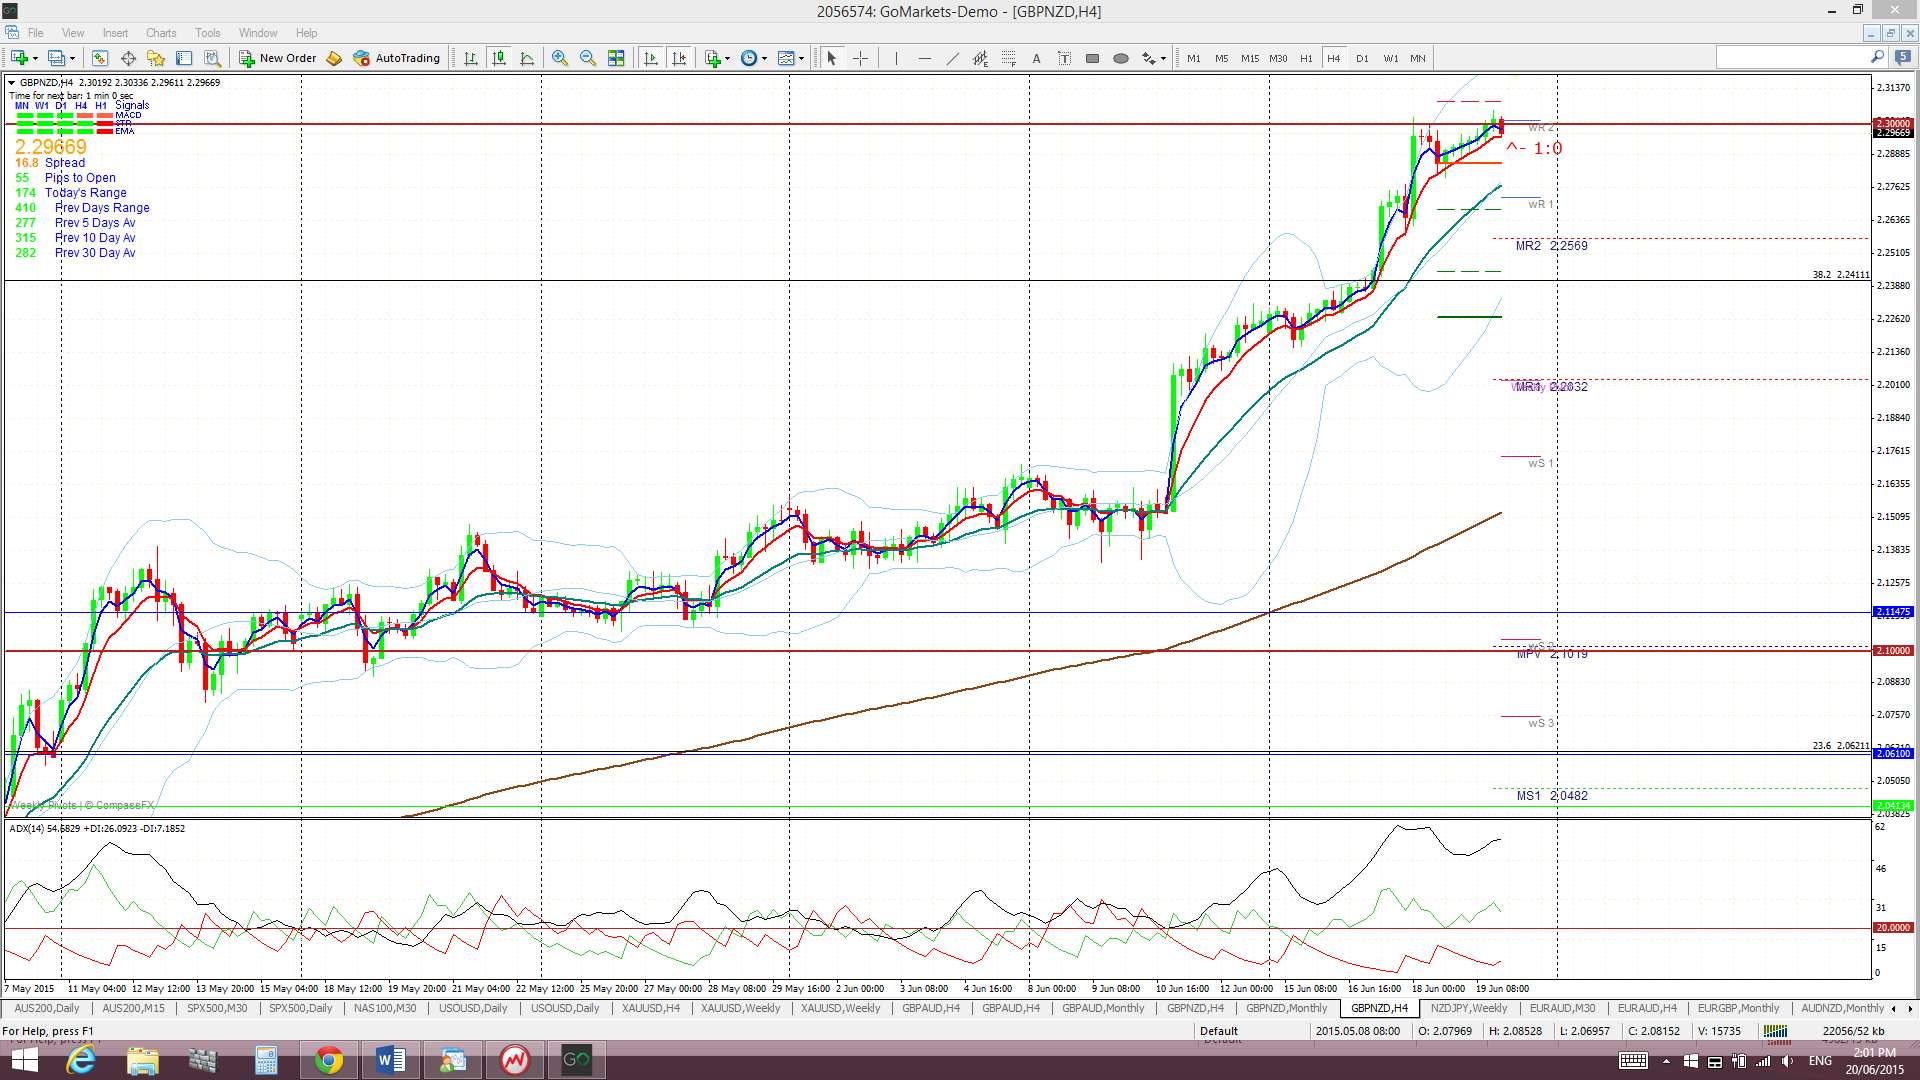
GBP/NZD: The pair has been quite the performer of late. It wasn’t that long ago I was urging traders to monitor the 2.10 level but it has rallied 2, 000 pips since then! Price action is now at another important junction of 2.30 as this is the region of a major bear trend line and the top of the monthly Cloud. Any break and hold above this level would be bullish and suggest continuation. I wrote a separate article about this pair during the week and it can be found through the following link.
The GBP/NZD is still trading above the Cloud on the 4hr, daily and weekly chart but at the top of the Cloud on the monthly chart.
The weekly candle closed as a large bullish candle.
- I’m watching for any new TC signal and the 2.30 level.
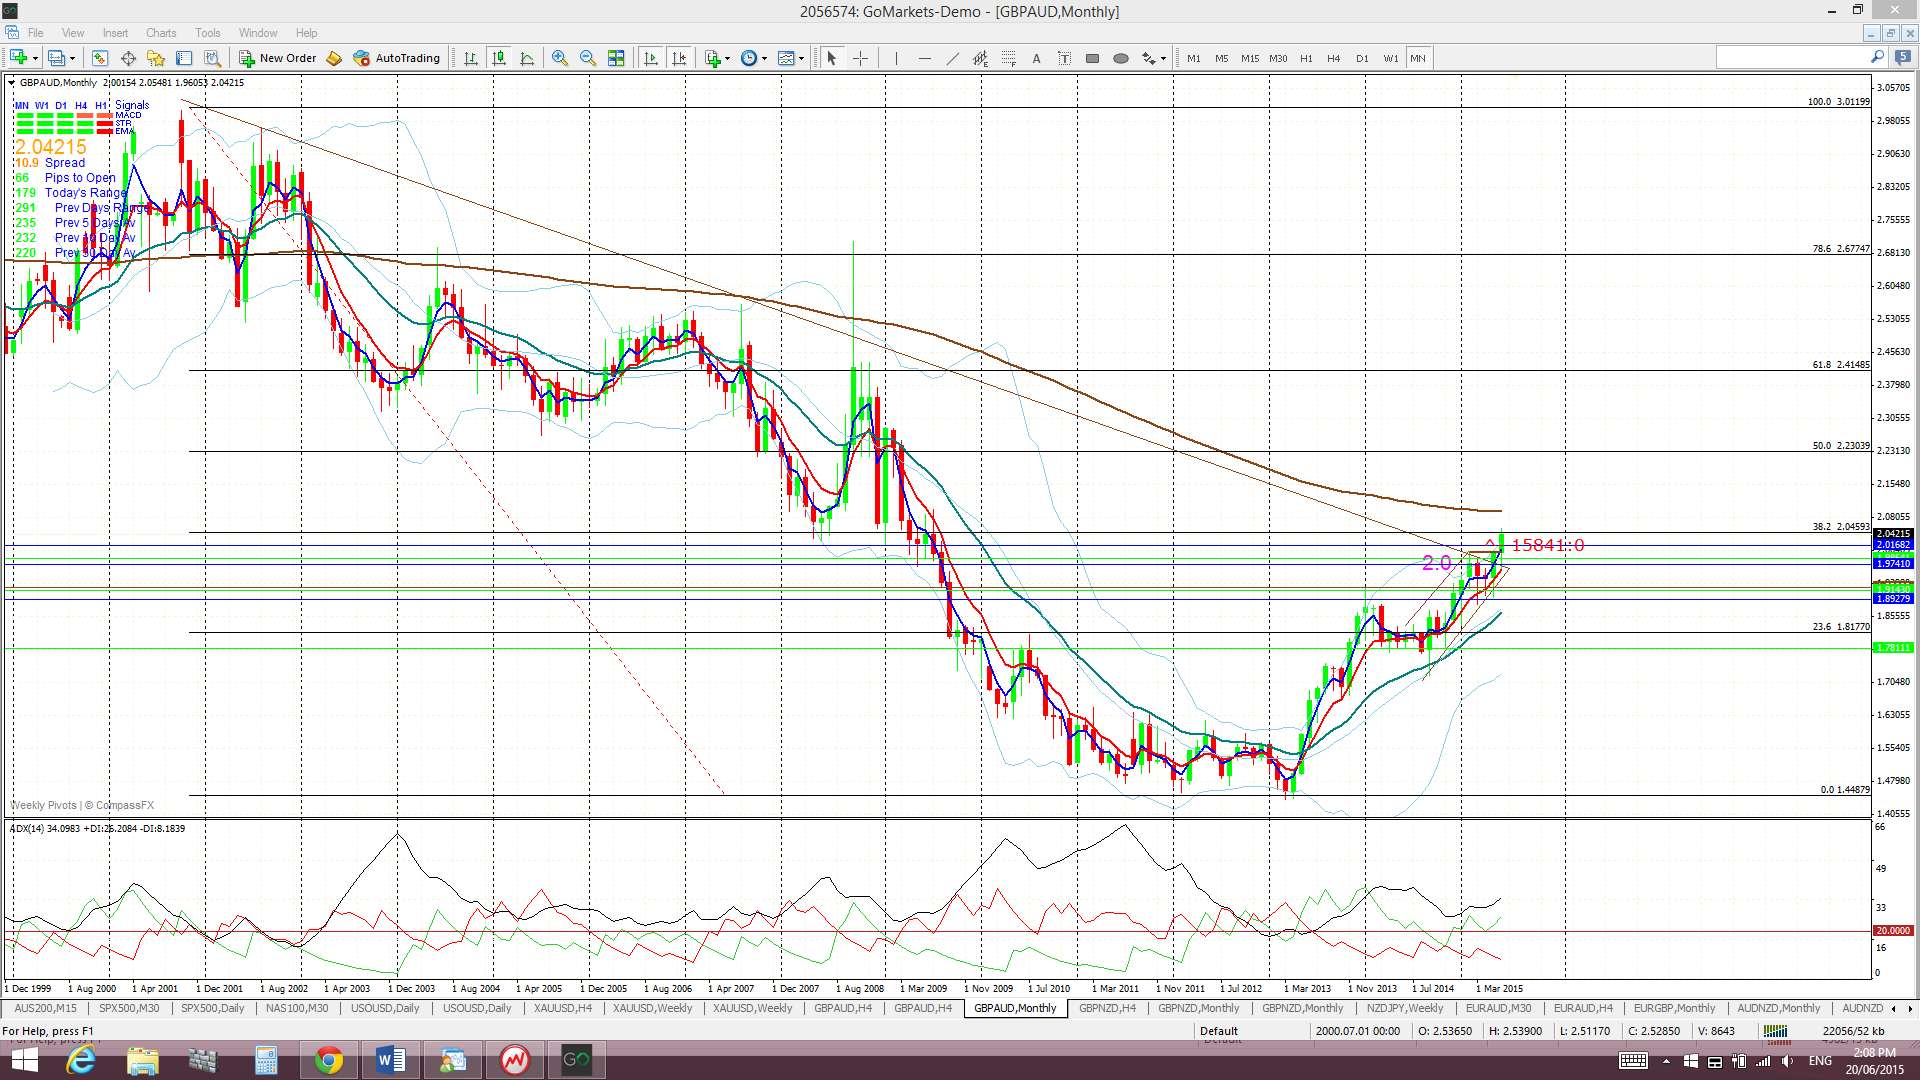
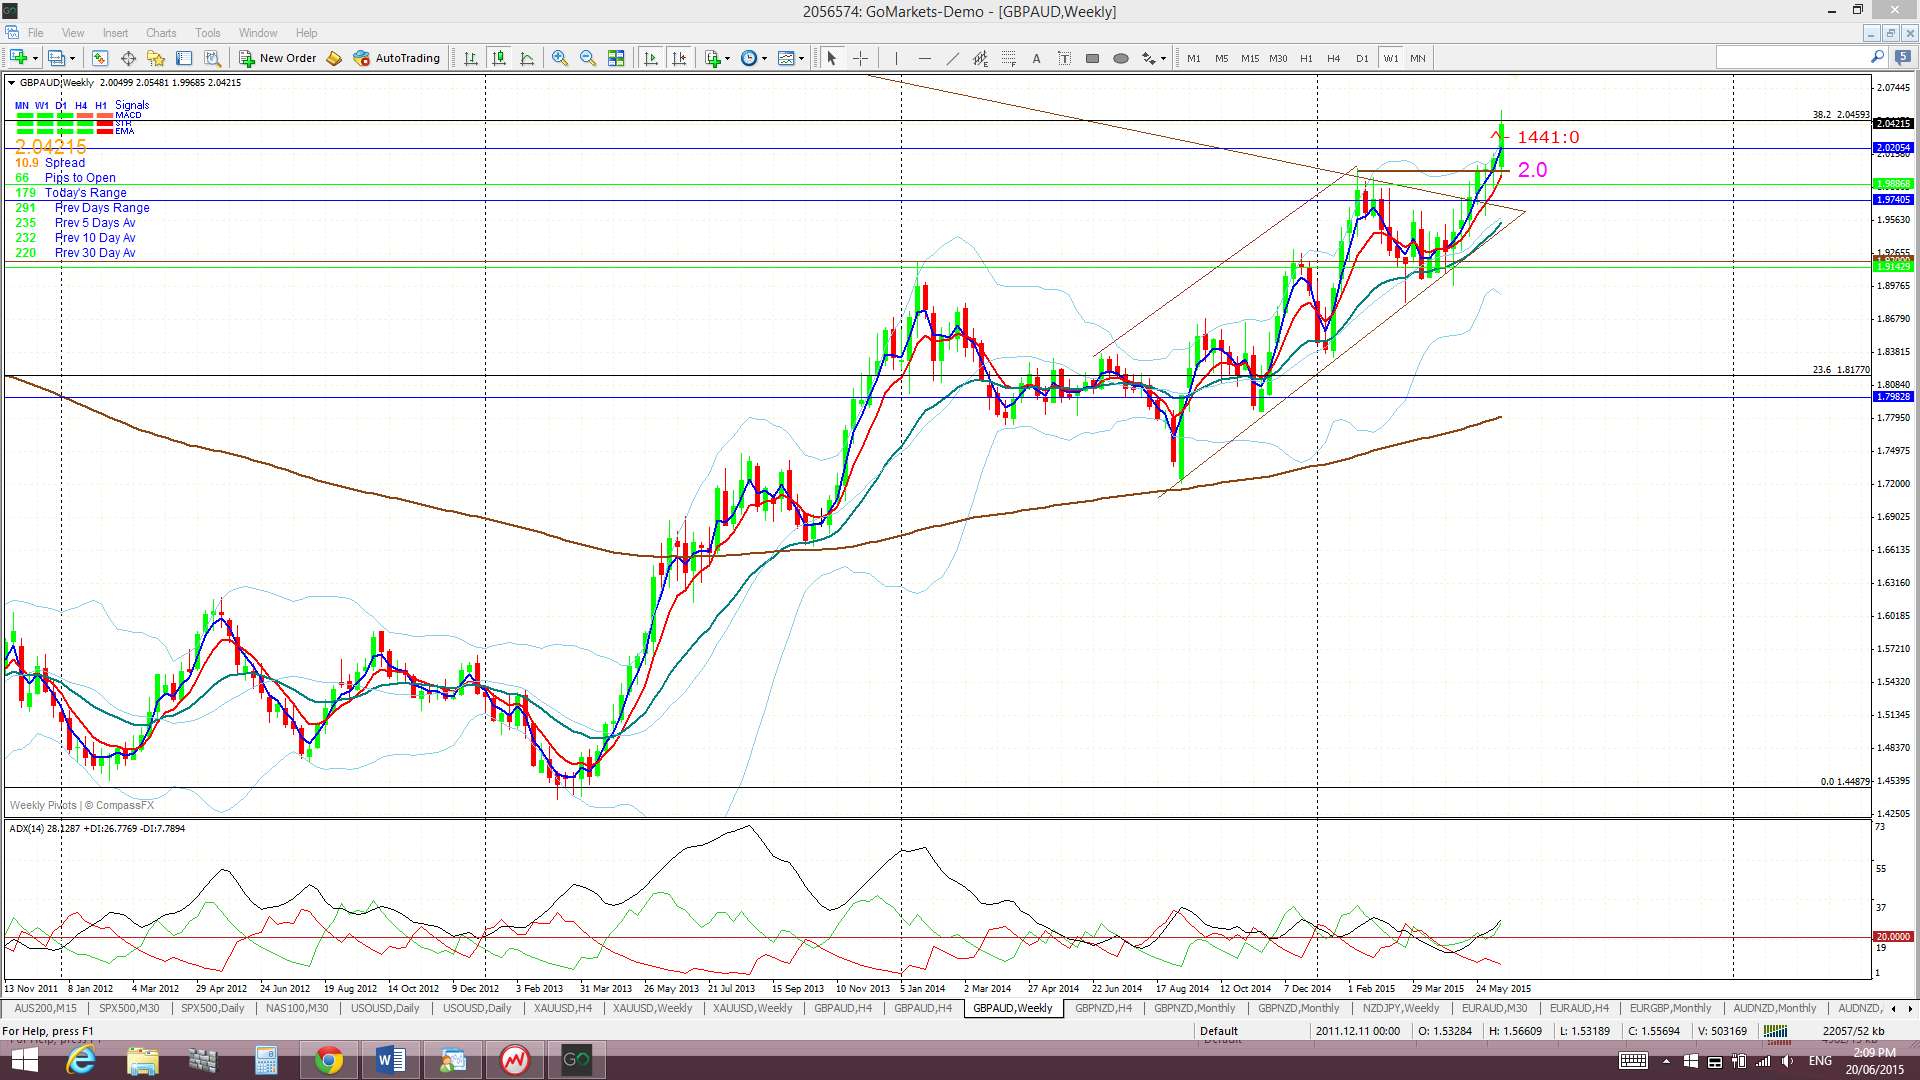
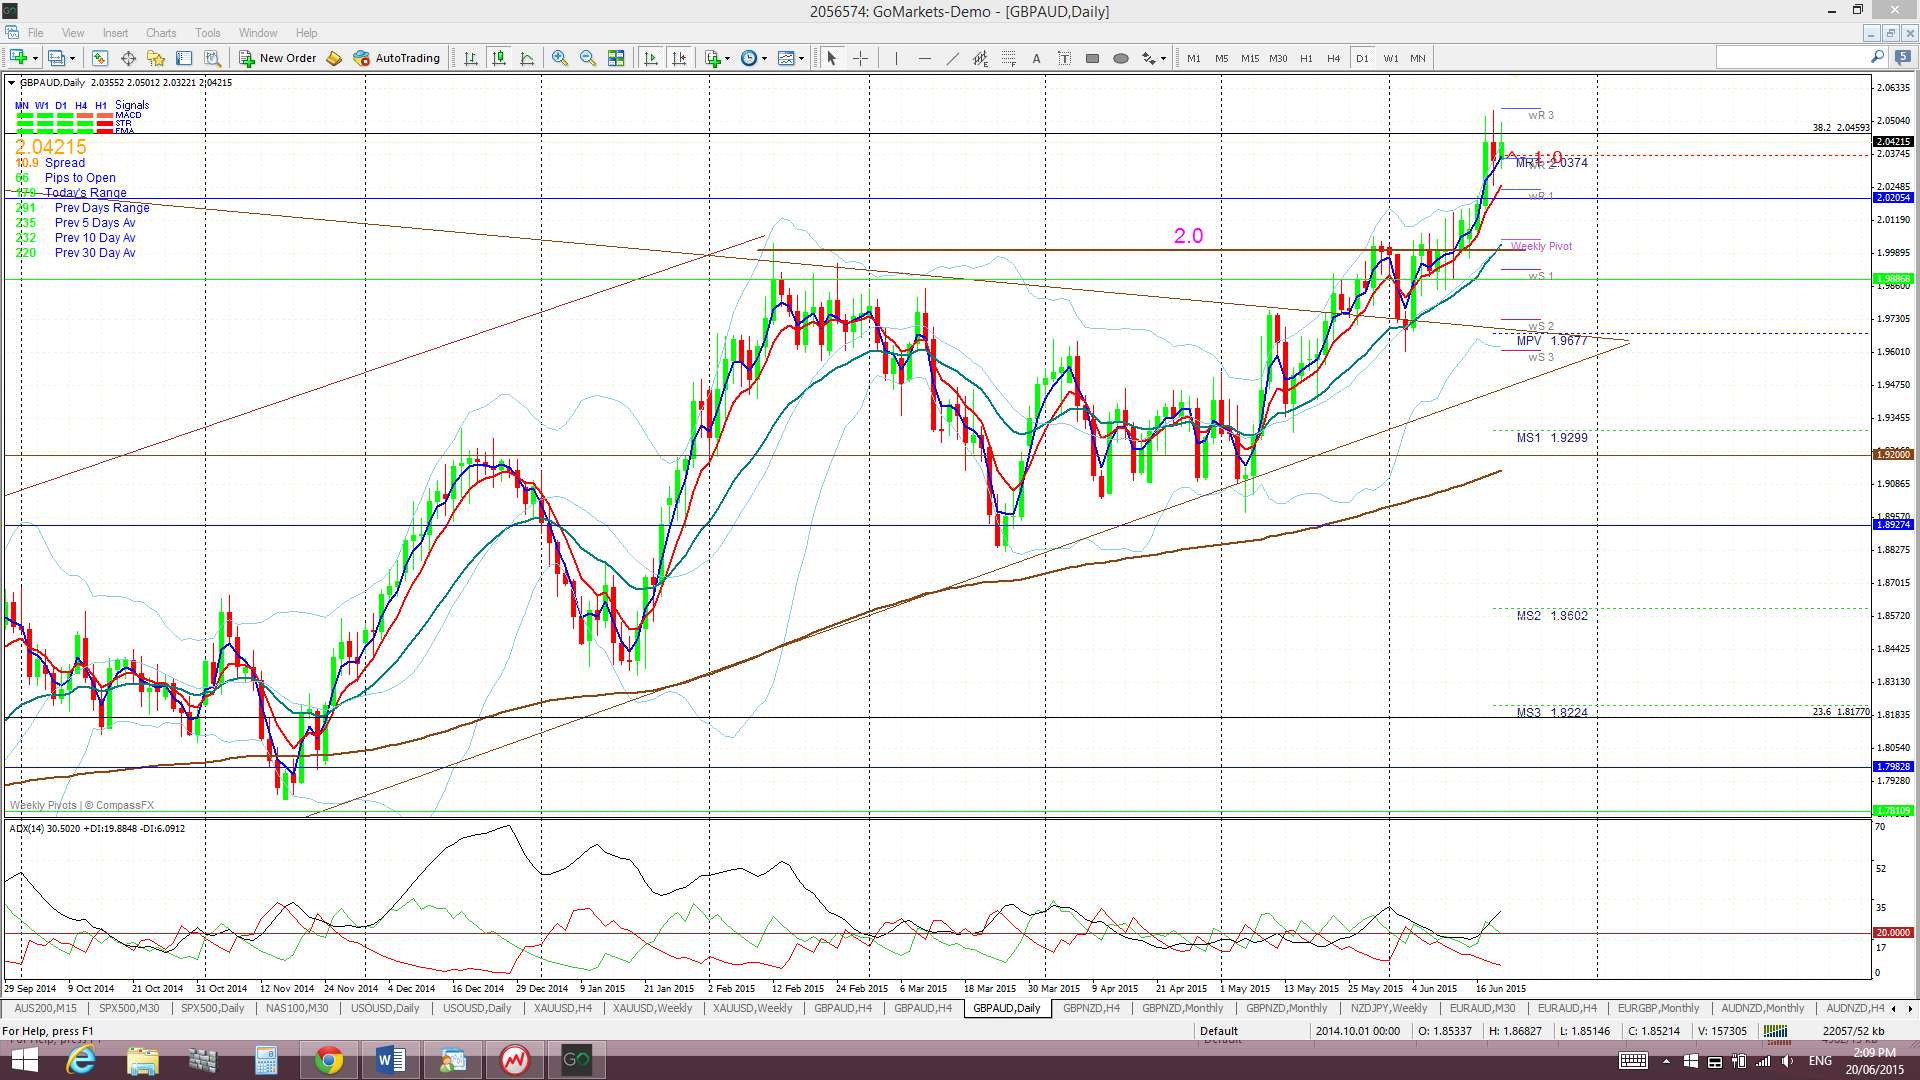
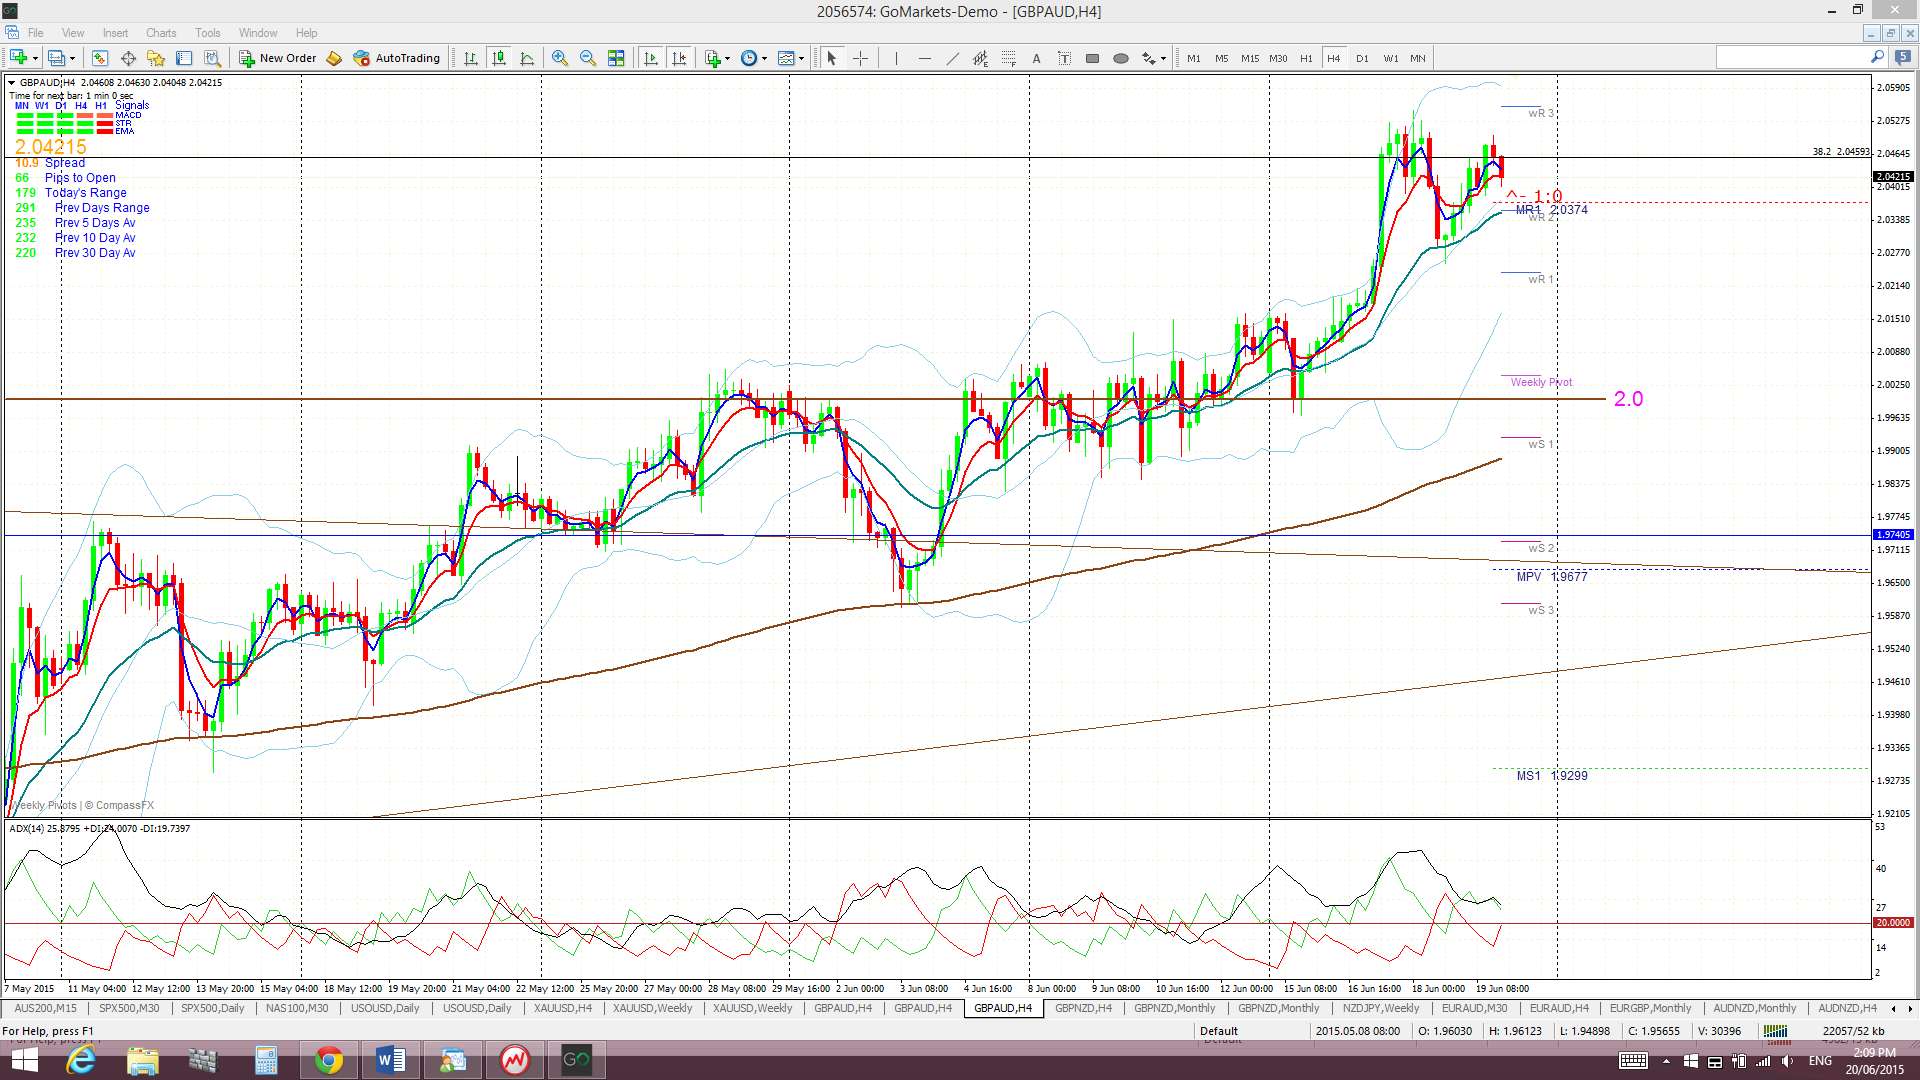
GBP/AUD: This pair looks set to make another monthly candle close above a major bear trend line but also, perhaps, above the key 2.0 level.
Price is still trading above the Ichimoku Cloud on the 4hr, daily, weekly and monthly charts.
The weekly candle closed as a bullish candle and above the 2.0 level again.
- I’m watching for any new TC signal on this pair.
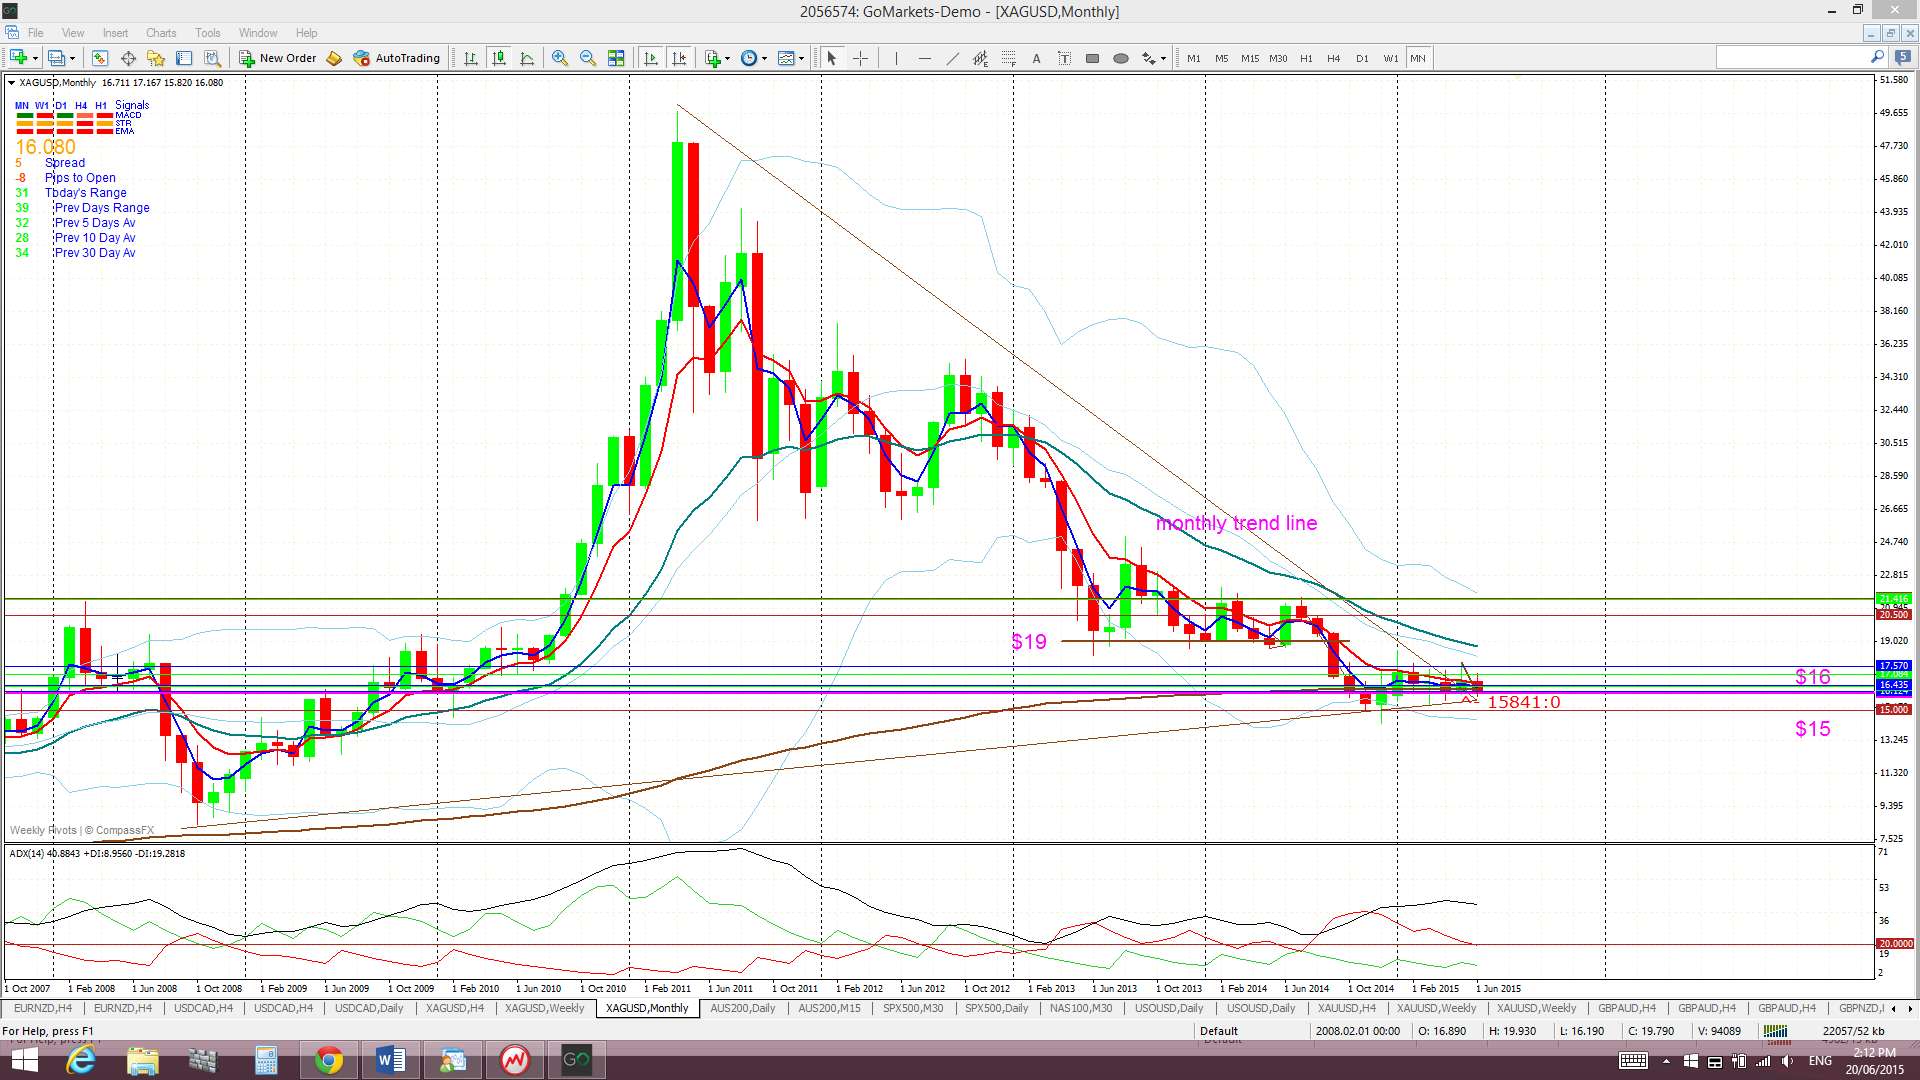
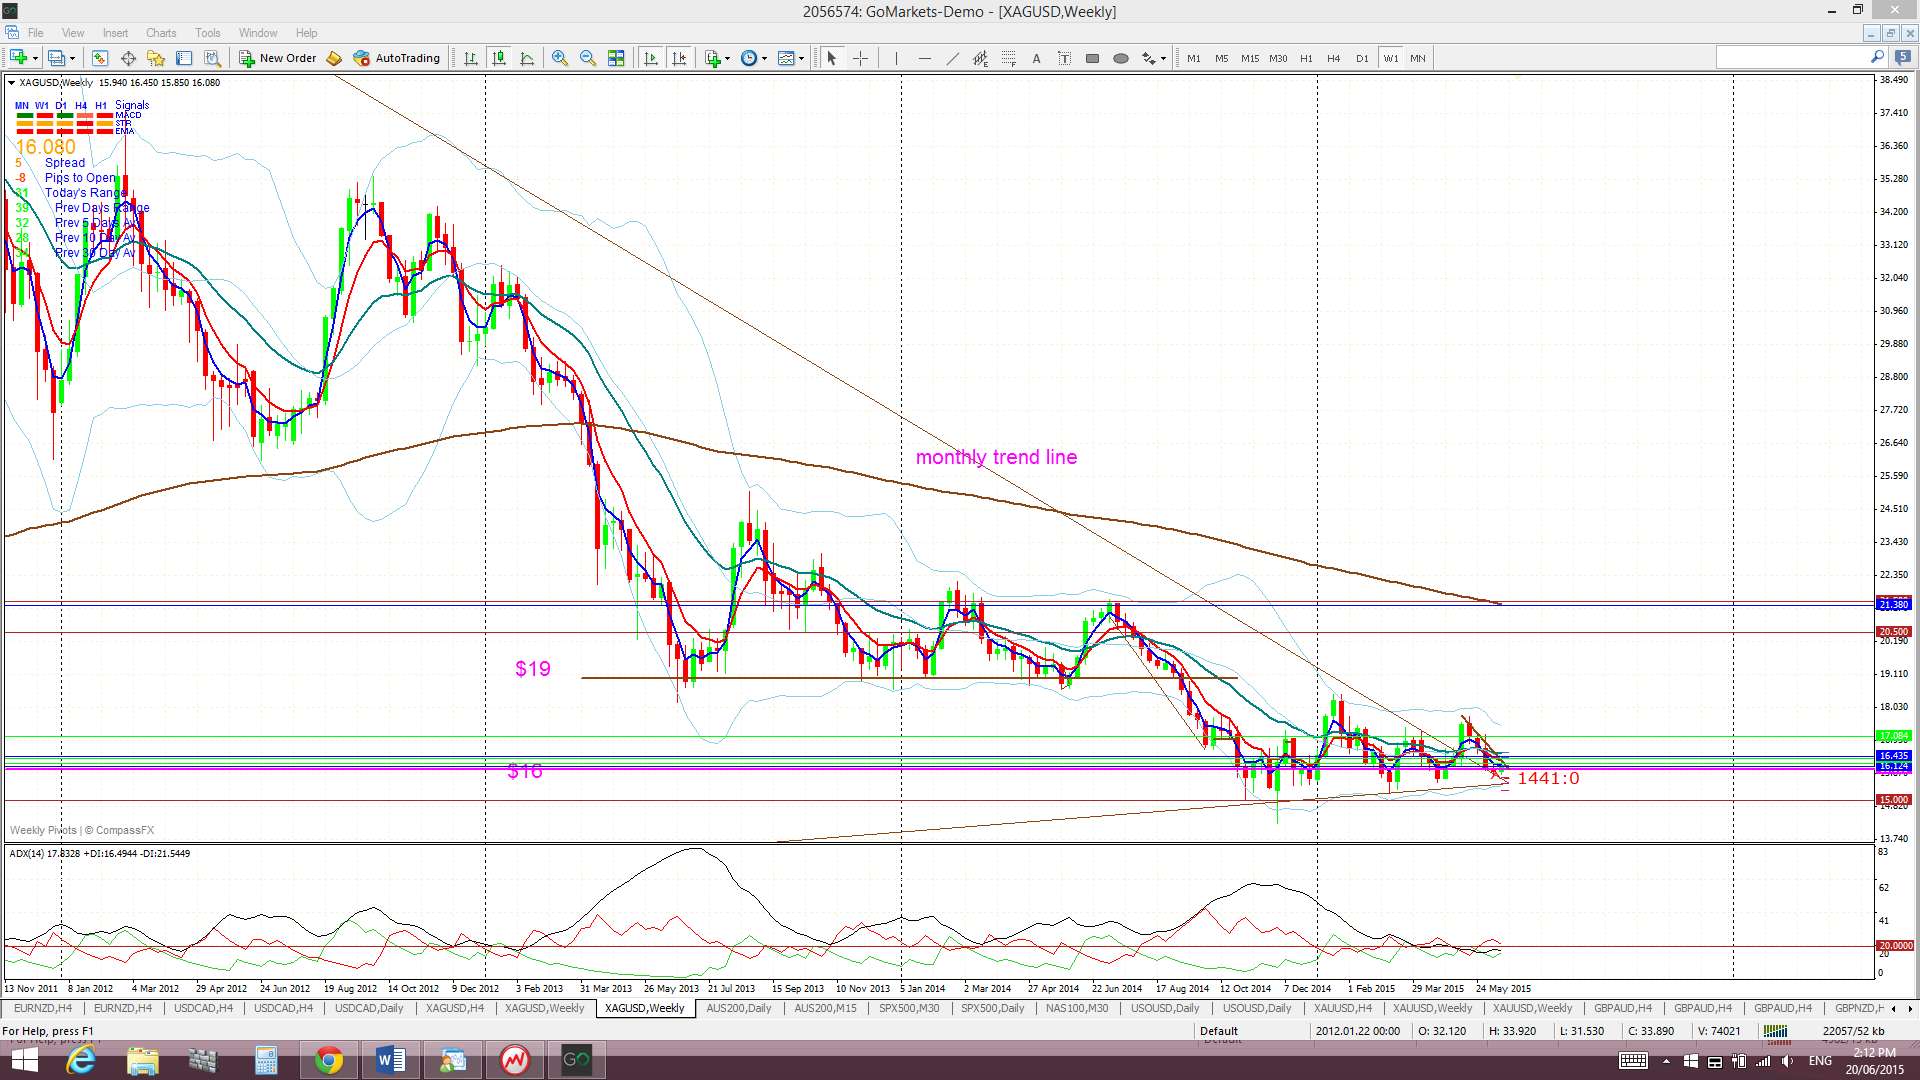
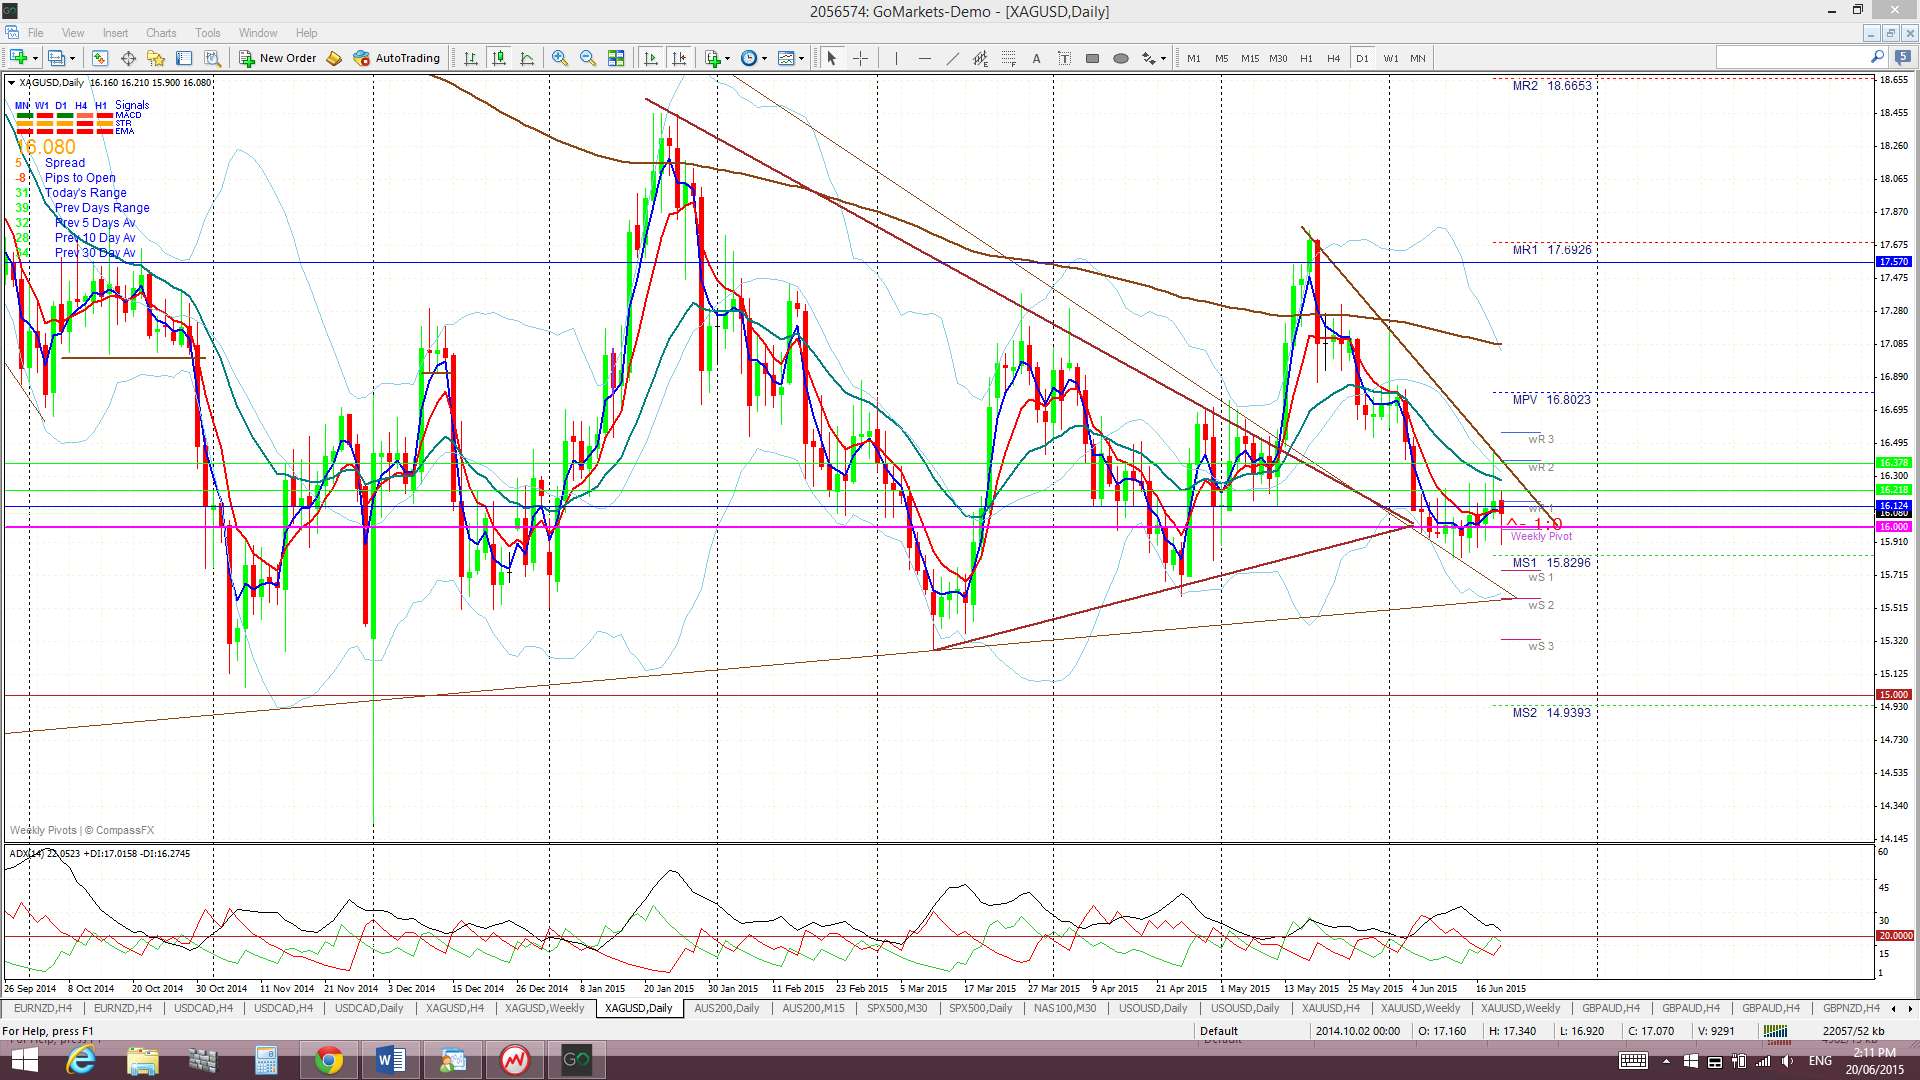
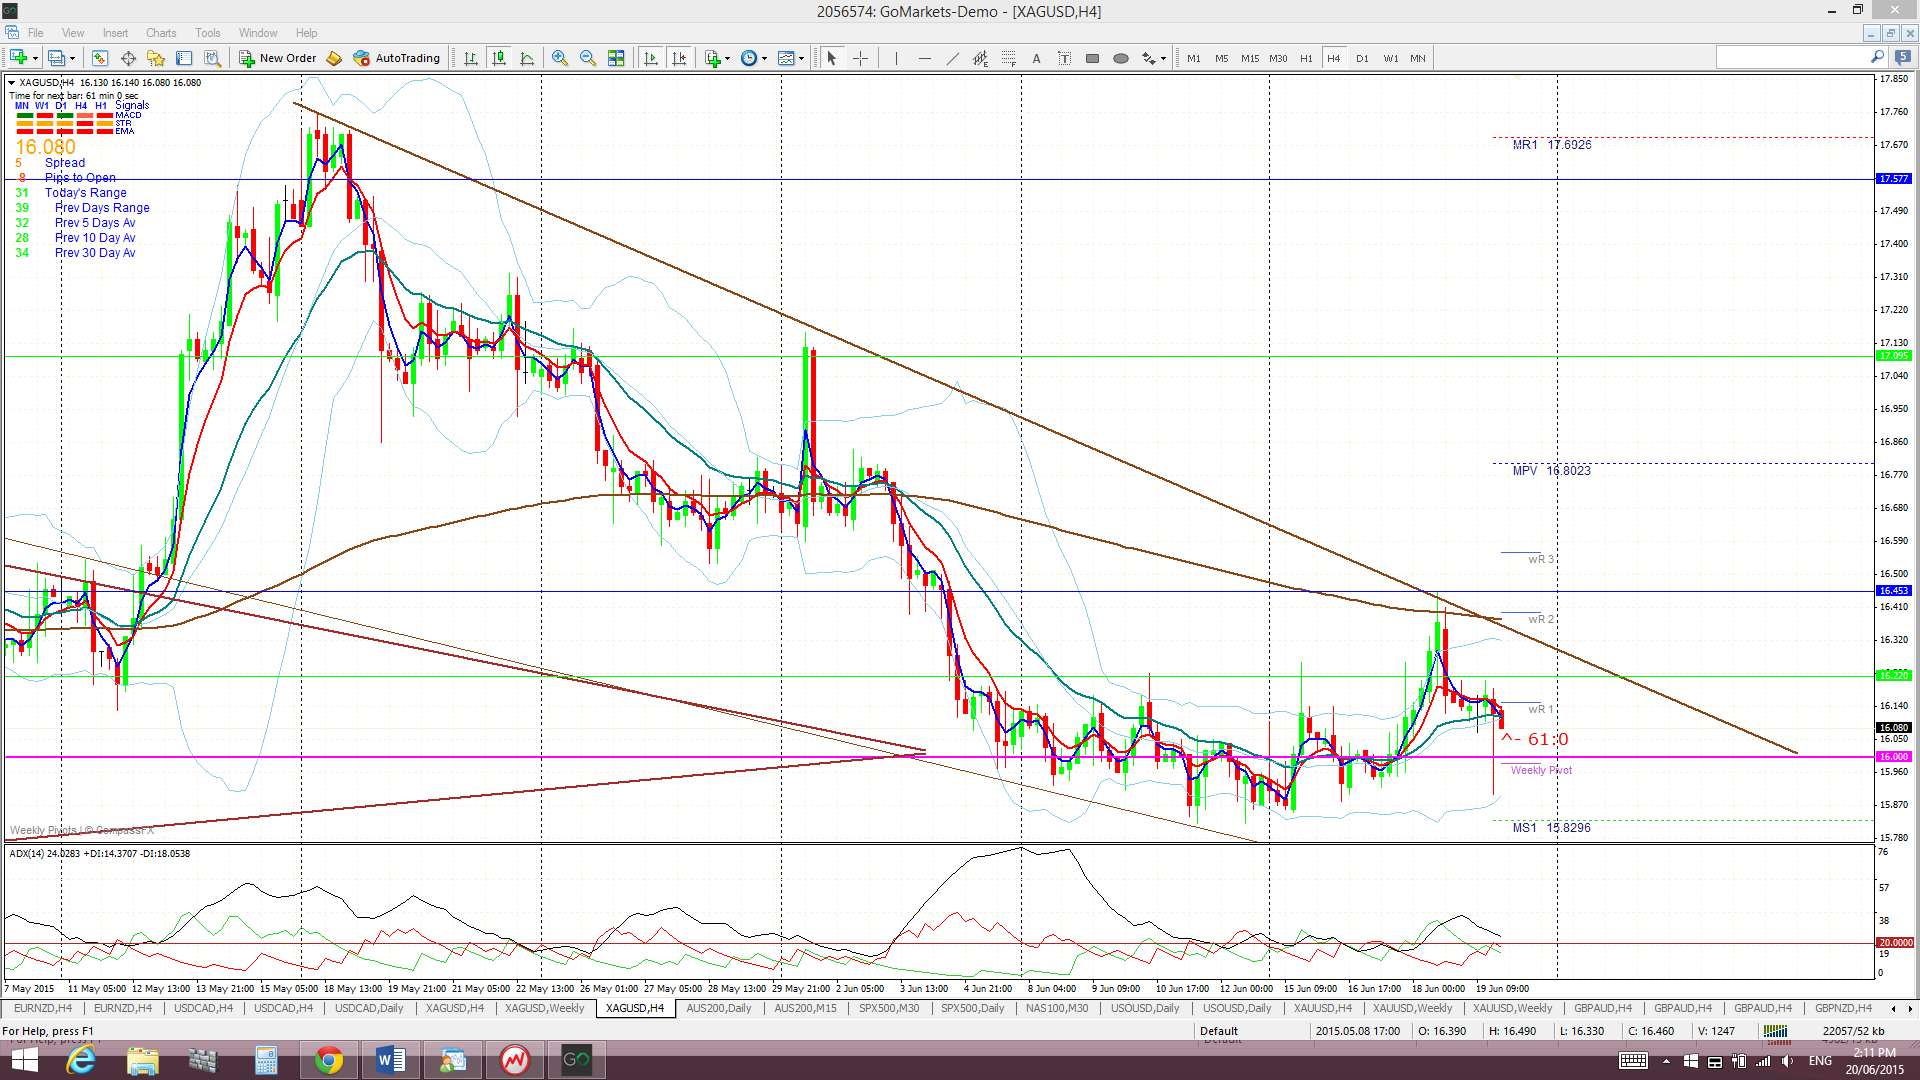
Silver: Silver spent much of the last two weeks trading around the key $16 support level. The weaker US$ following FOMC has helped to lift this metal and it is now negotiating a recent bear trend line.
Silver is trading within the Cloud on the 4hr chart but below the Cloud on the daily, weekly and monthly charts.
The weekly candle closed as a bullish coloured ‘Inverted Hammer’ candle.
- I’m watching for any new TC signal, the $16 level and the recent bear trend line.
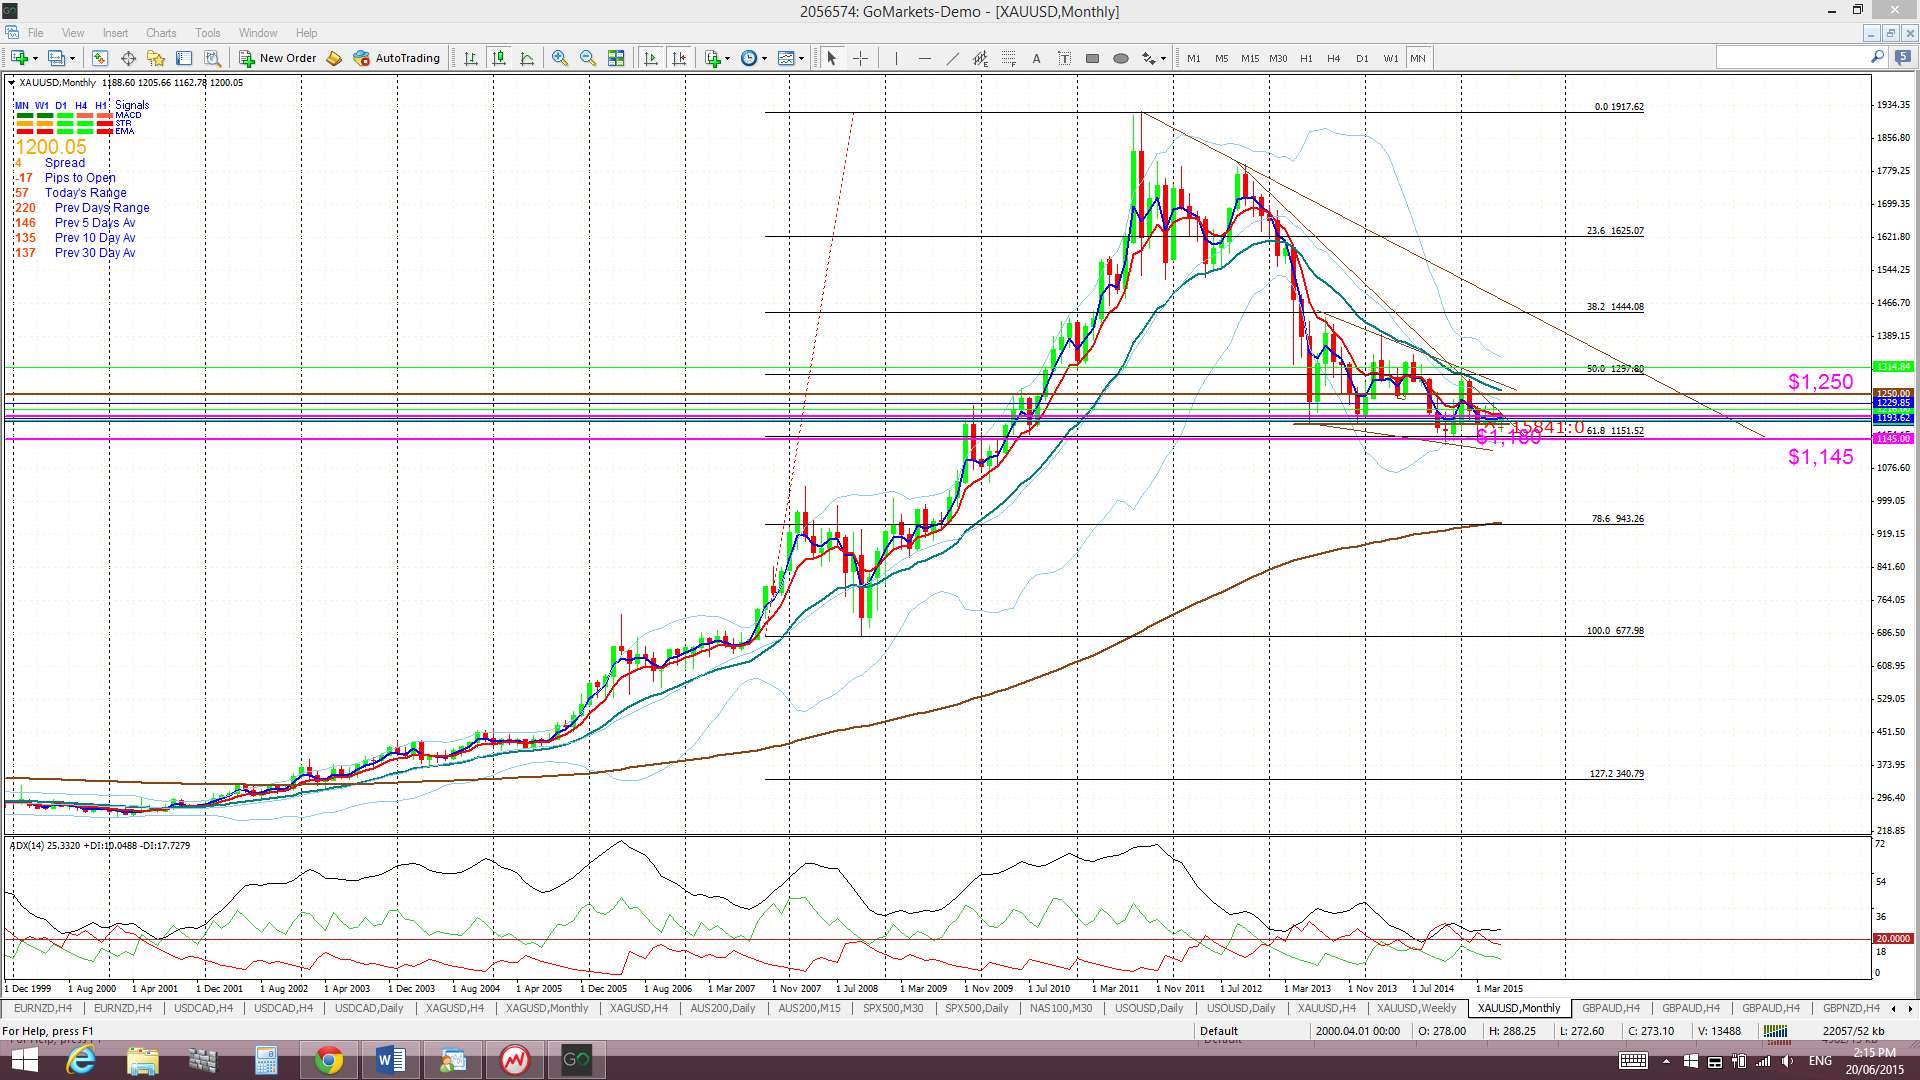
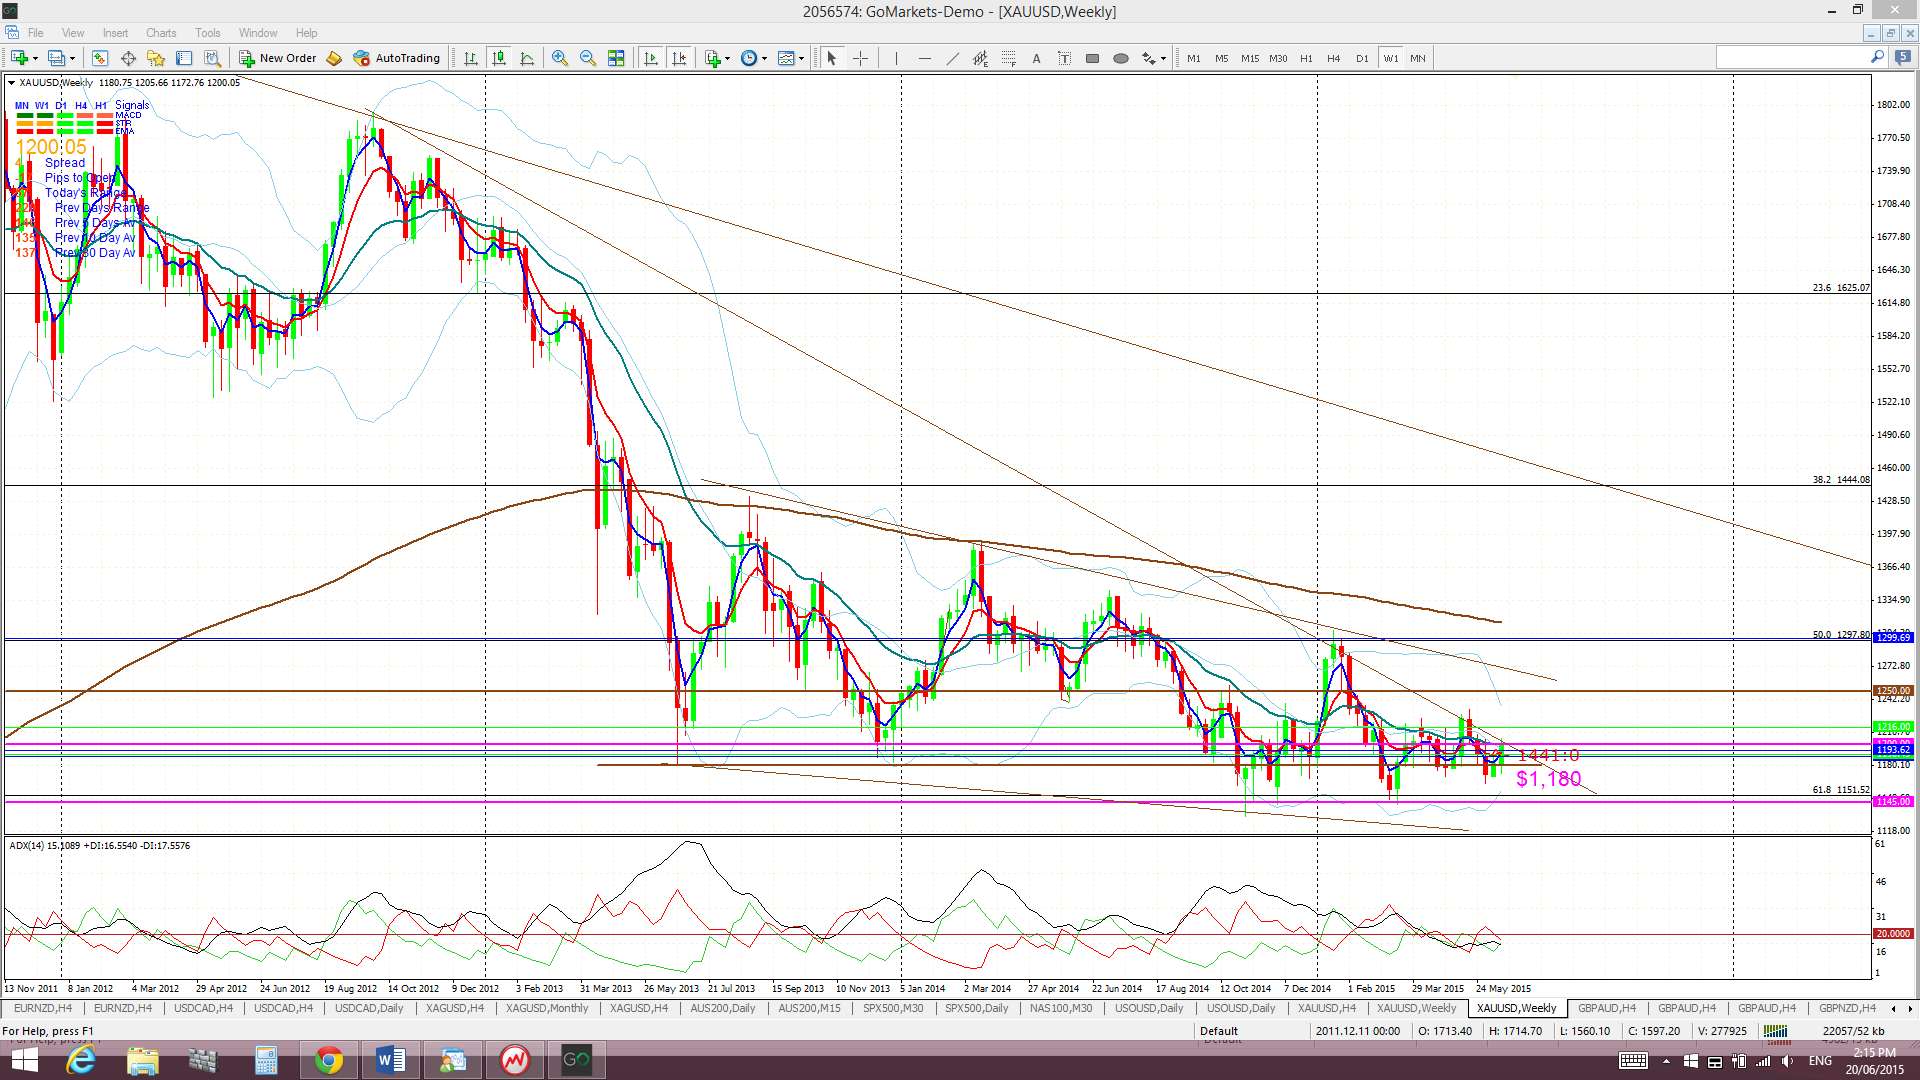
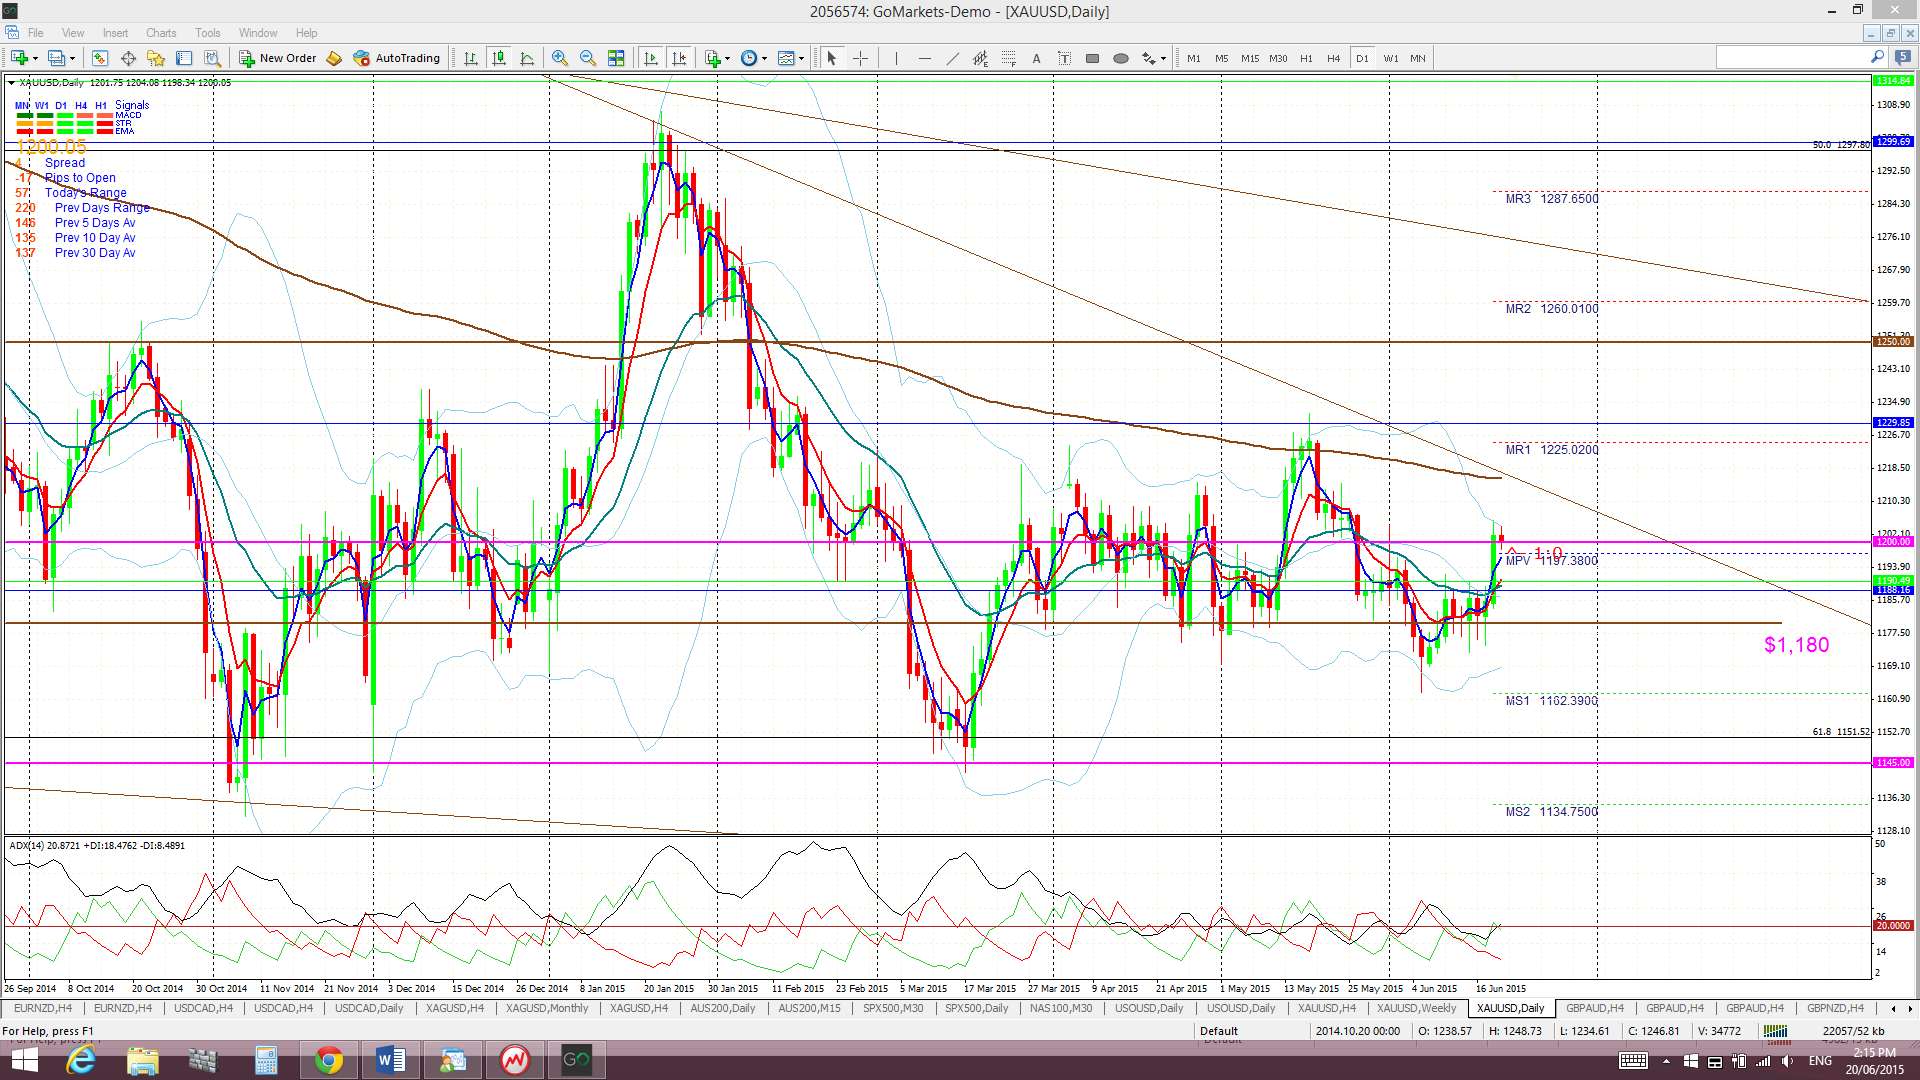
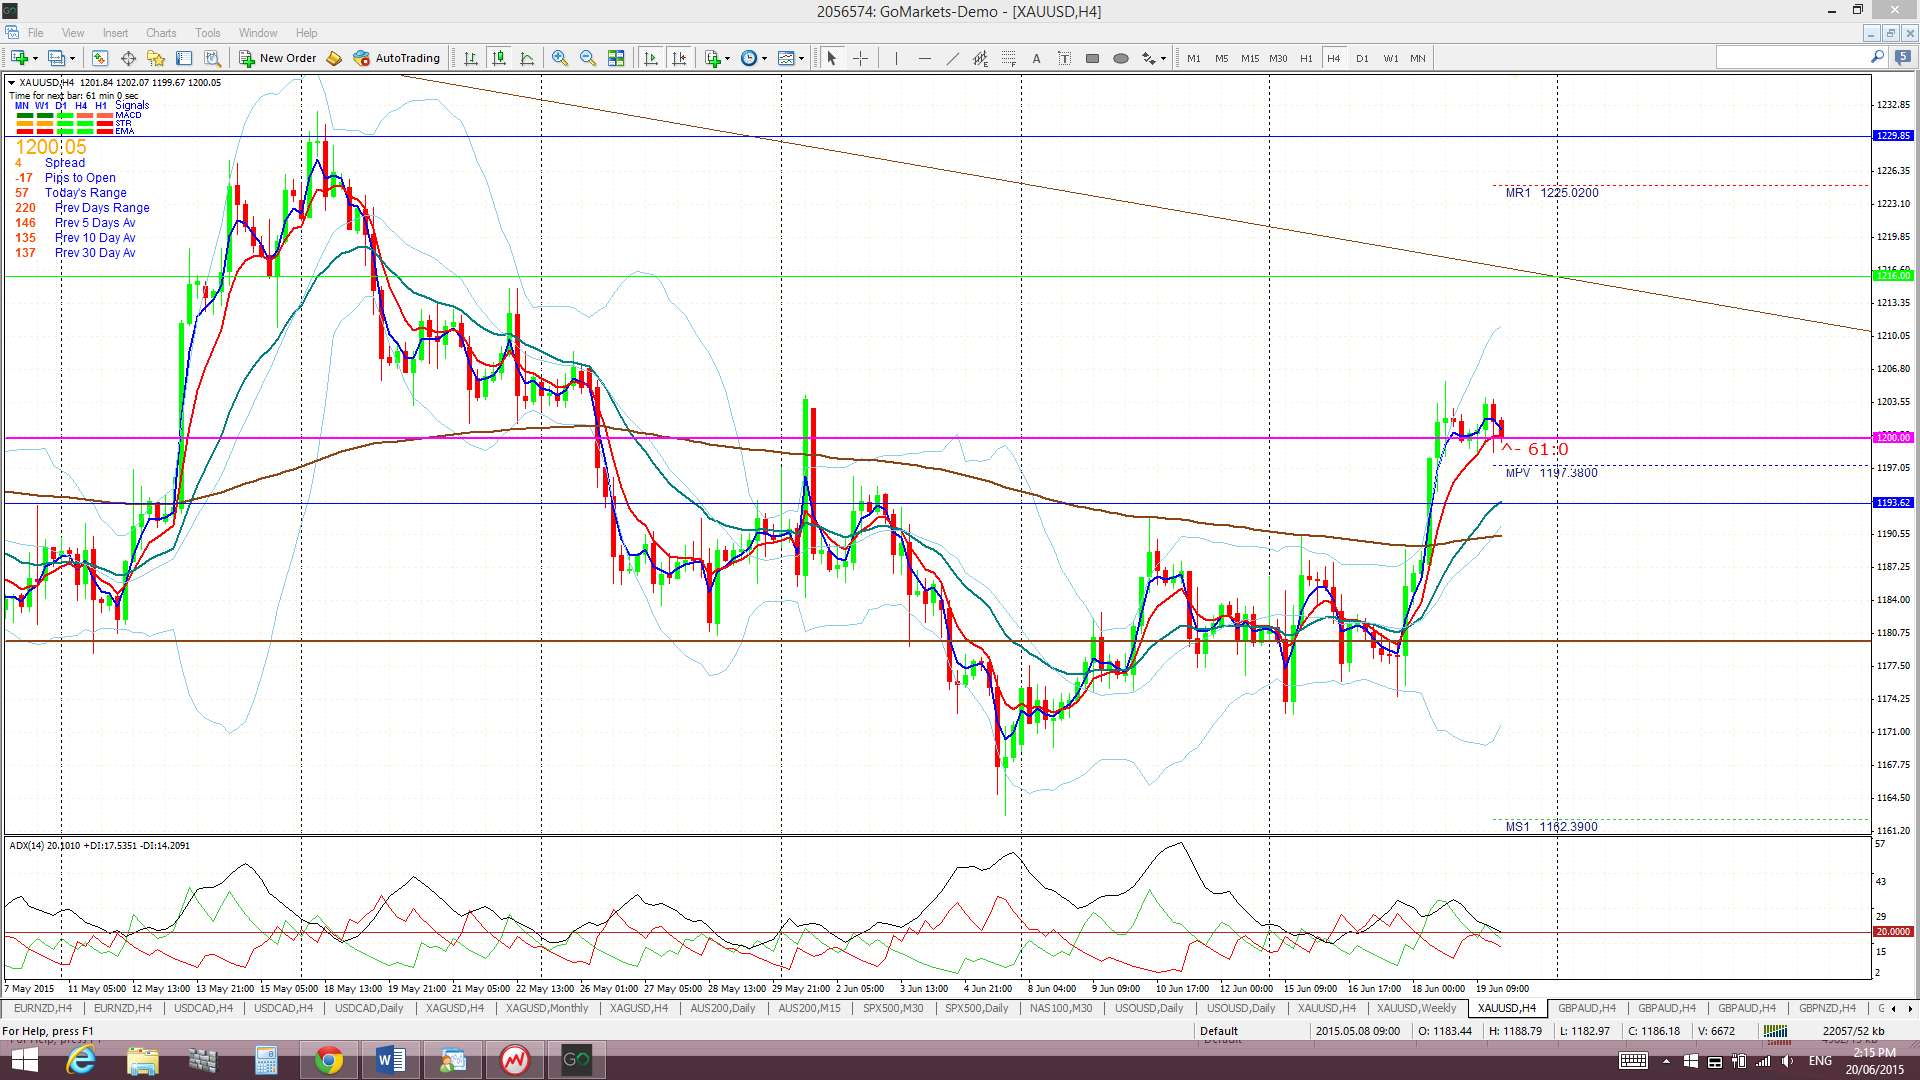
Gold: Gold spent much of the last two weeks trading along the $1,180 support level. FOMC news was fairly well received here too and this enable a bullish move up to the next support level at $1,200.
The weekly chart remains of interest here as it shows price chopping around under a two-year+ trend line and this is helping to form up a bullish descending wedge pattern. The success or otherwise of any breakout here though still looks to be determined by the next direction taken by the US$ though and until the US$ breaks free of the 100-92.50 trading range that remains undecided.
Gold does continue to hold above the 61.8% Fib retracement of the 2008-2011 bull run near $1,145 for the time being though. The daily, weekly and monthly charts show that Gold is really just chopping sideways above this 61.8% fib support and seems to be waiting for the next major move with the US$.
However, any new break and hold below $1,145 would suggest a pull back. Bearish targets below $1,145 include the $1,000 psychological level and, then, the 78.6% fib near $950.
Gold is trading above the Cloud on the 4hr and daily charts but below the Cloud on the weekly and monthly charts.
The weekly candle closed as another bullish candle.
This metal may benefit from any negative fallout with Greek-debt talks.
- I’m watching for any new TC signal and the weekly chart’s wedge trend lines.
The post Forex: a defining week ahead? appeared first on www.forextell.com.