USDX
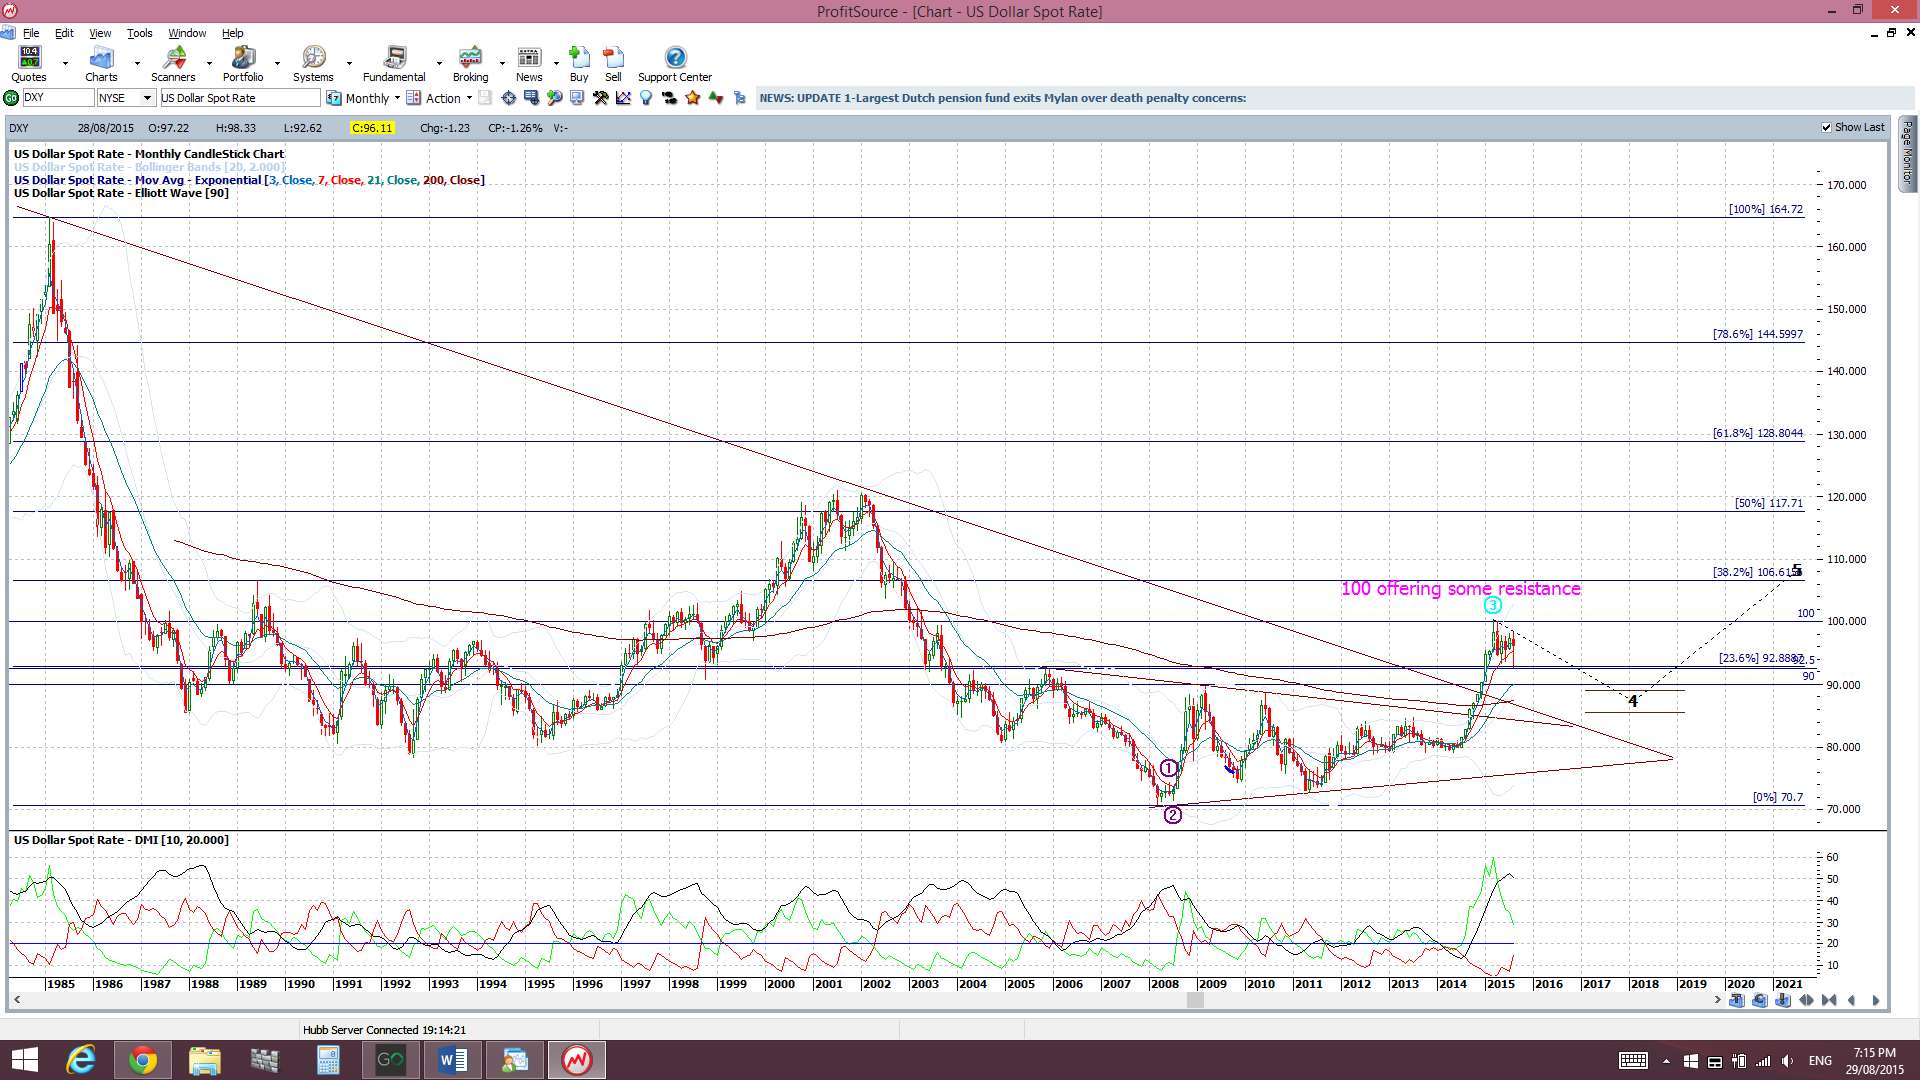
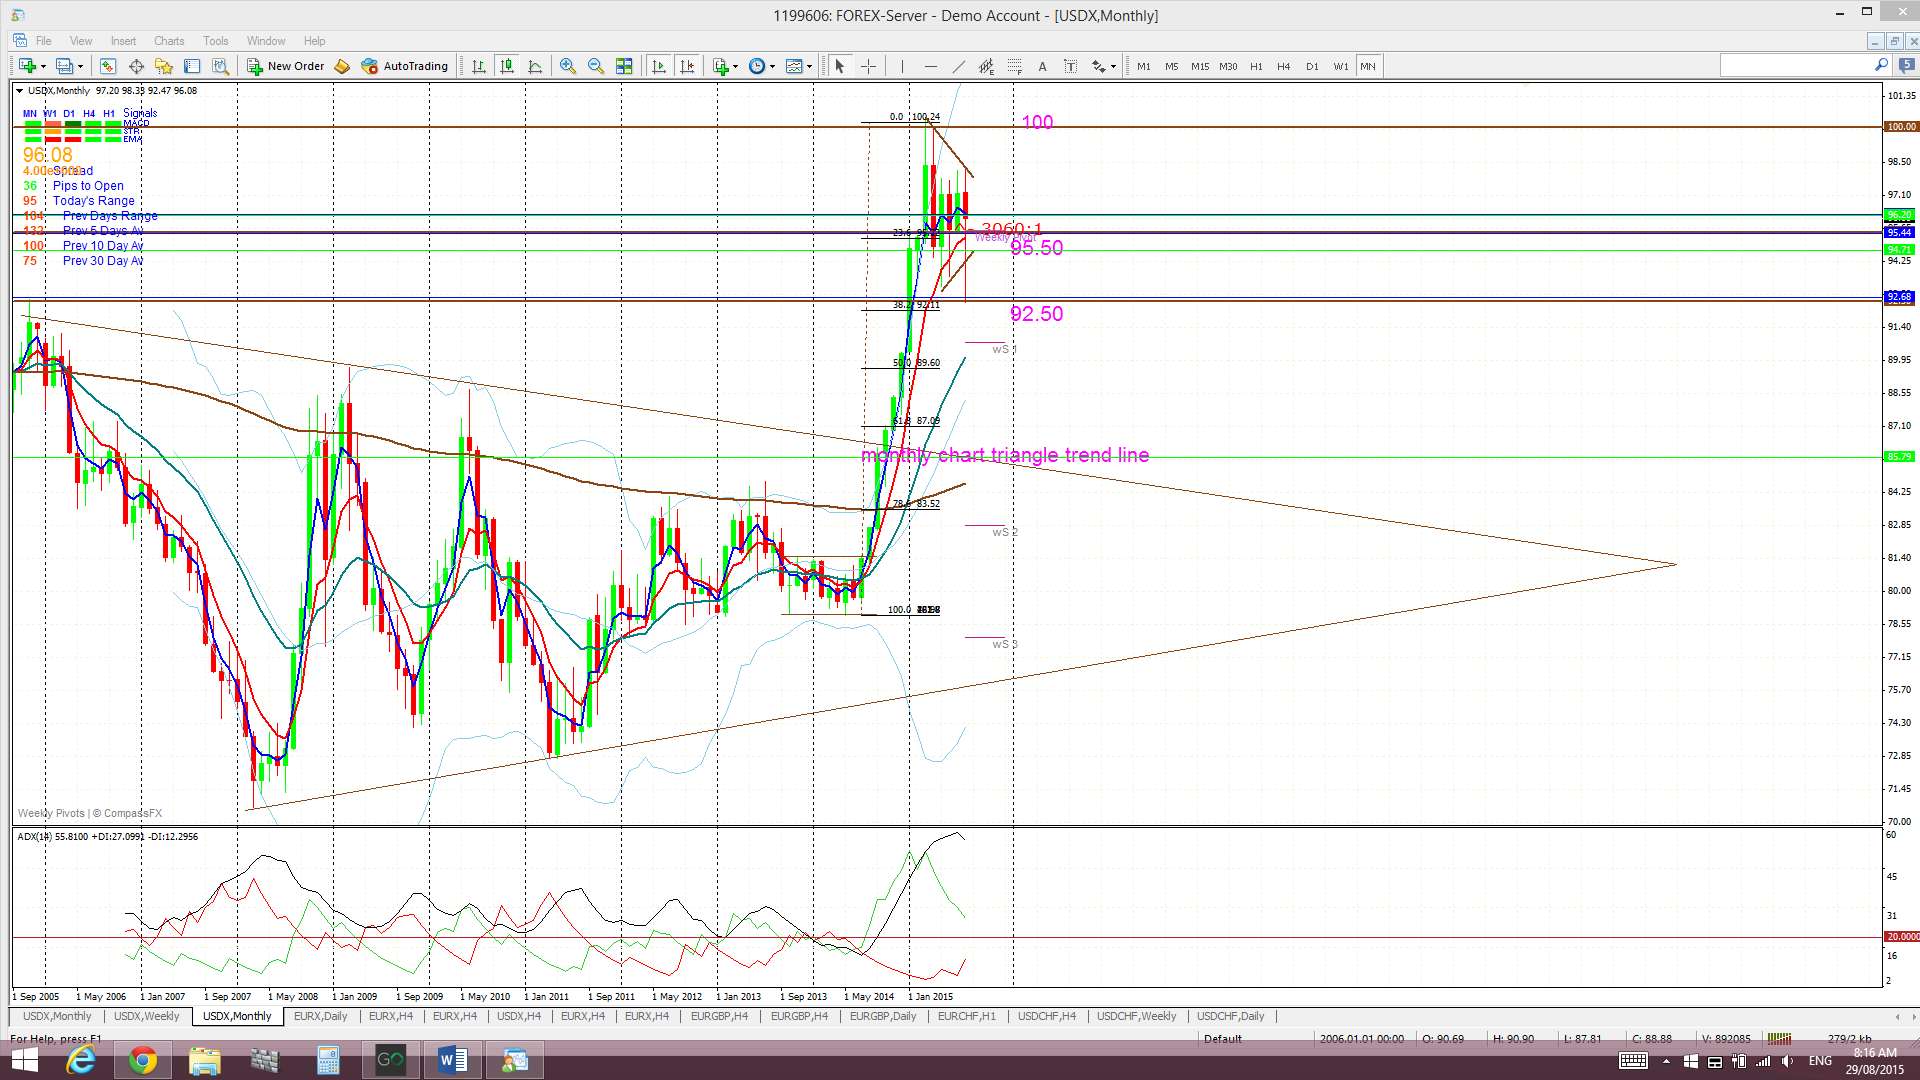
Monthly: The August candle is still printing a bearish, almost ‘Inside’, candle and is still under the key 100 level.
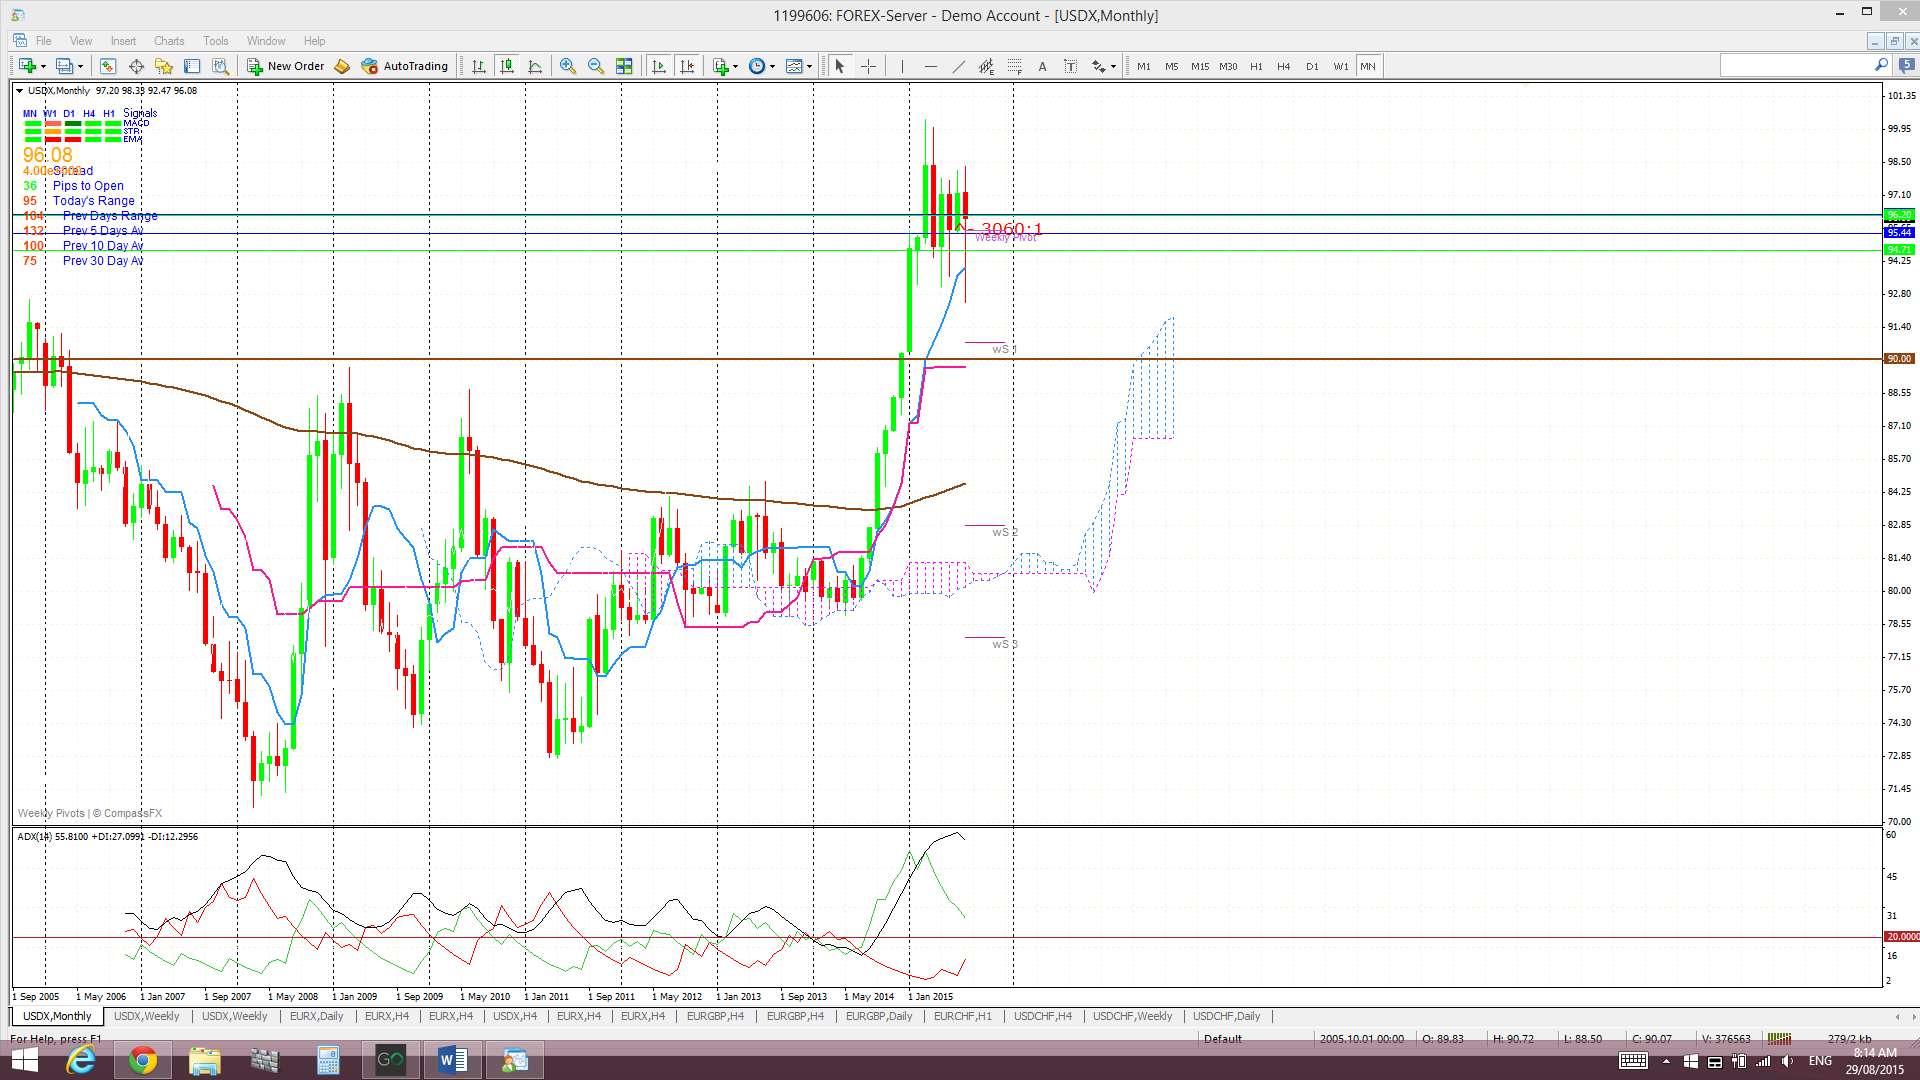
Monthly Ichimoku: The August candle is trading above the Cloud.
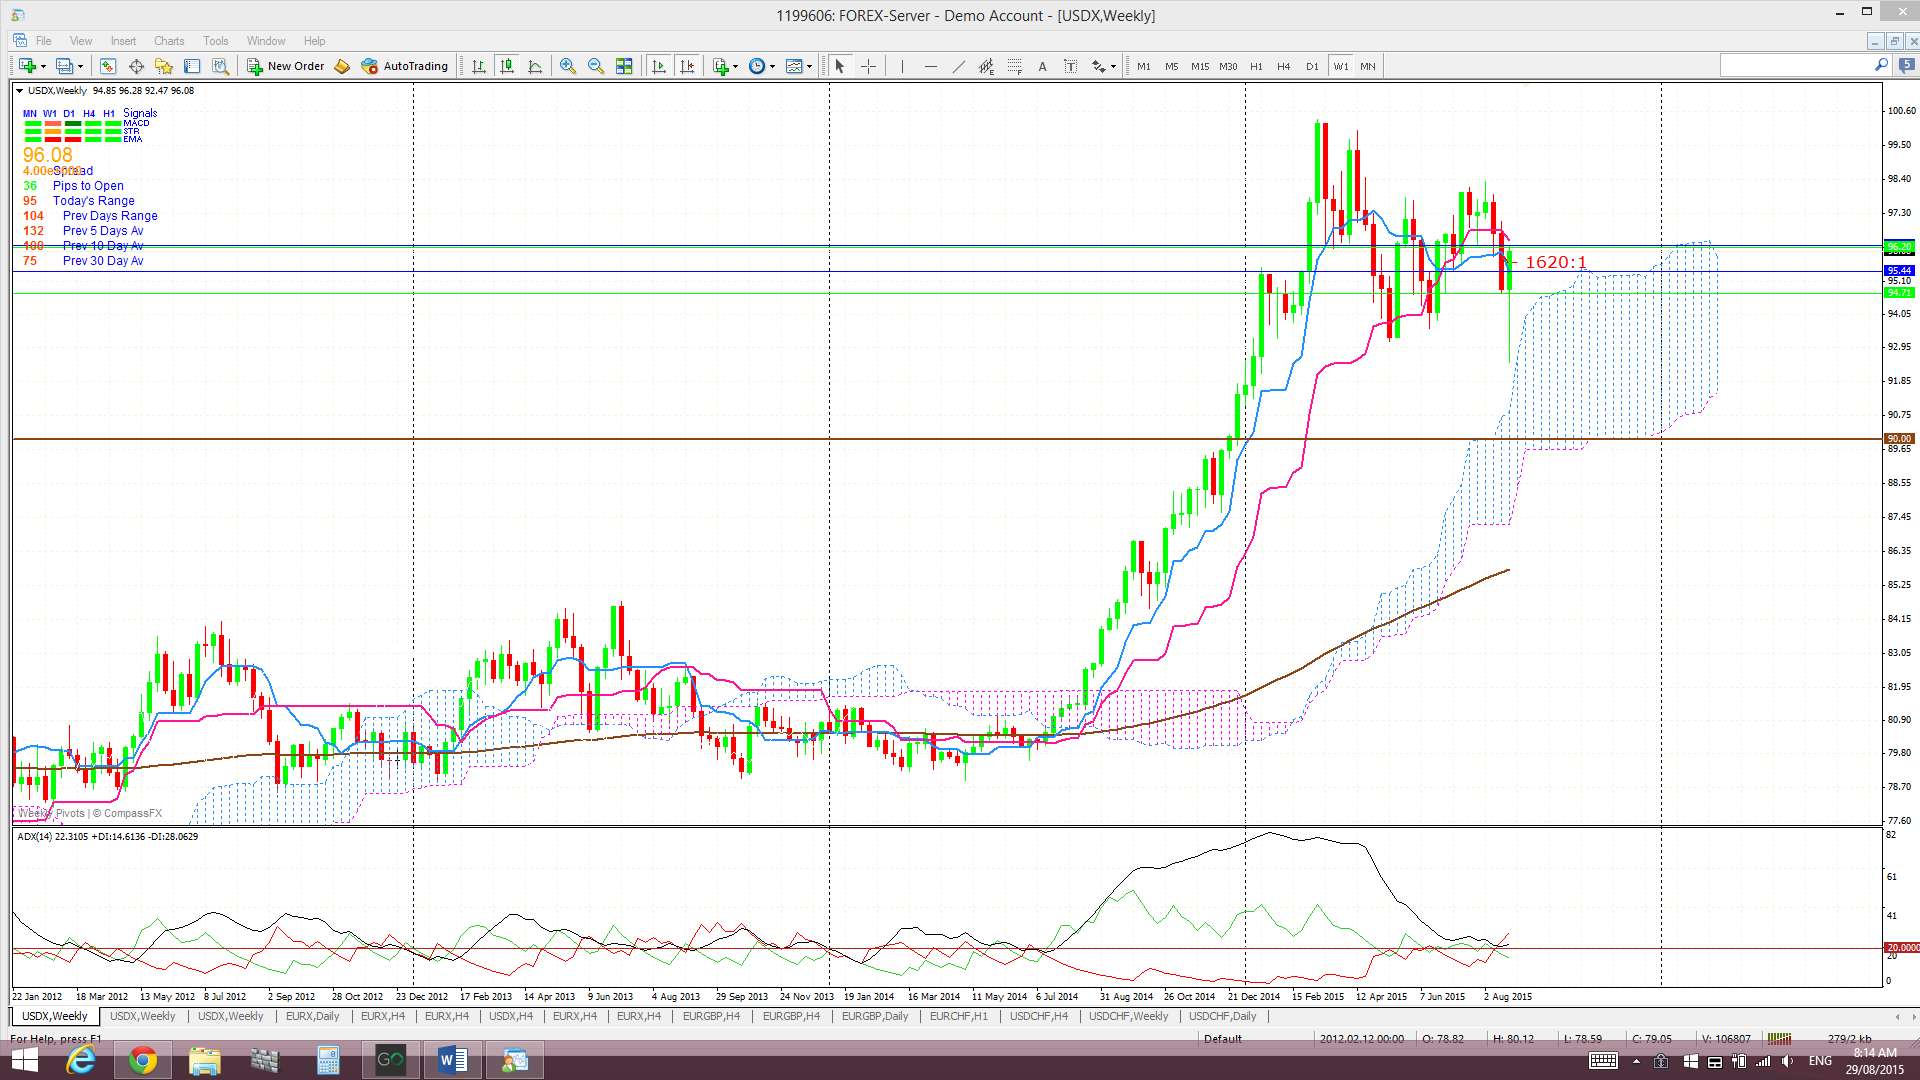
Weekly: Last week’s candle closed as a bullish-reversal ‘Hammer’ candle but also as an indecision-style ‘Inside’ candle. Any bullish continuation from here will bring the 100 level back into focus with some possible ‘Triple Top’ jitters. However, any bearish continuation will bring the 61.8% fib level, down near 87, the weekly 200 EMA and the previously broken triangle trend line, into focus.
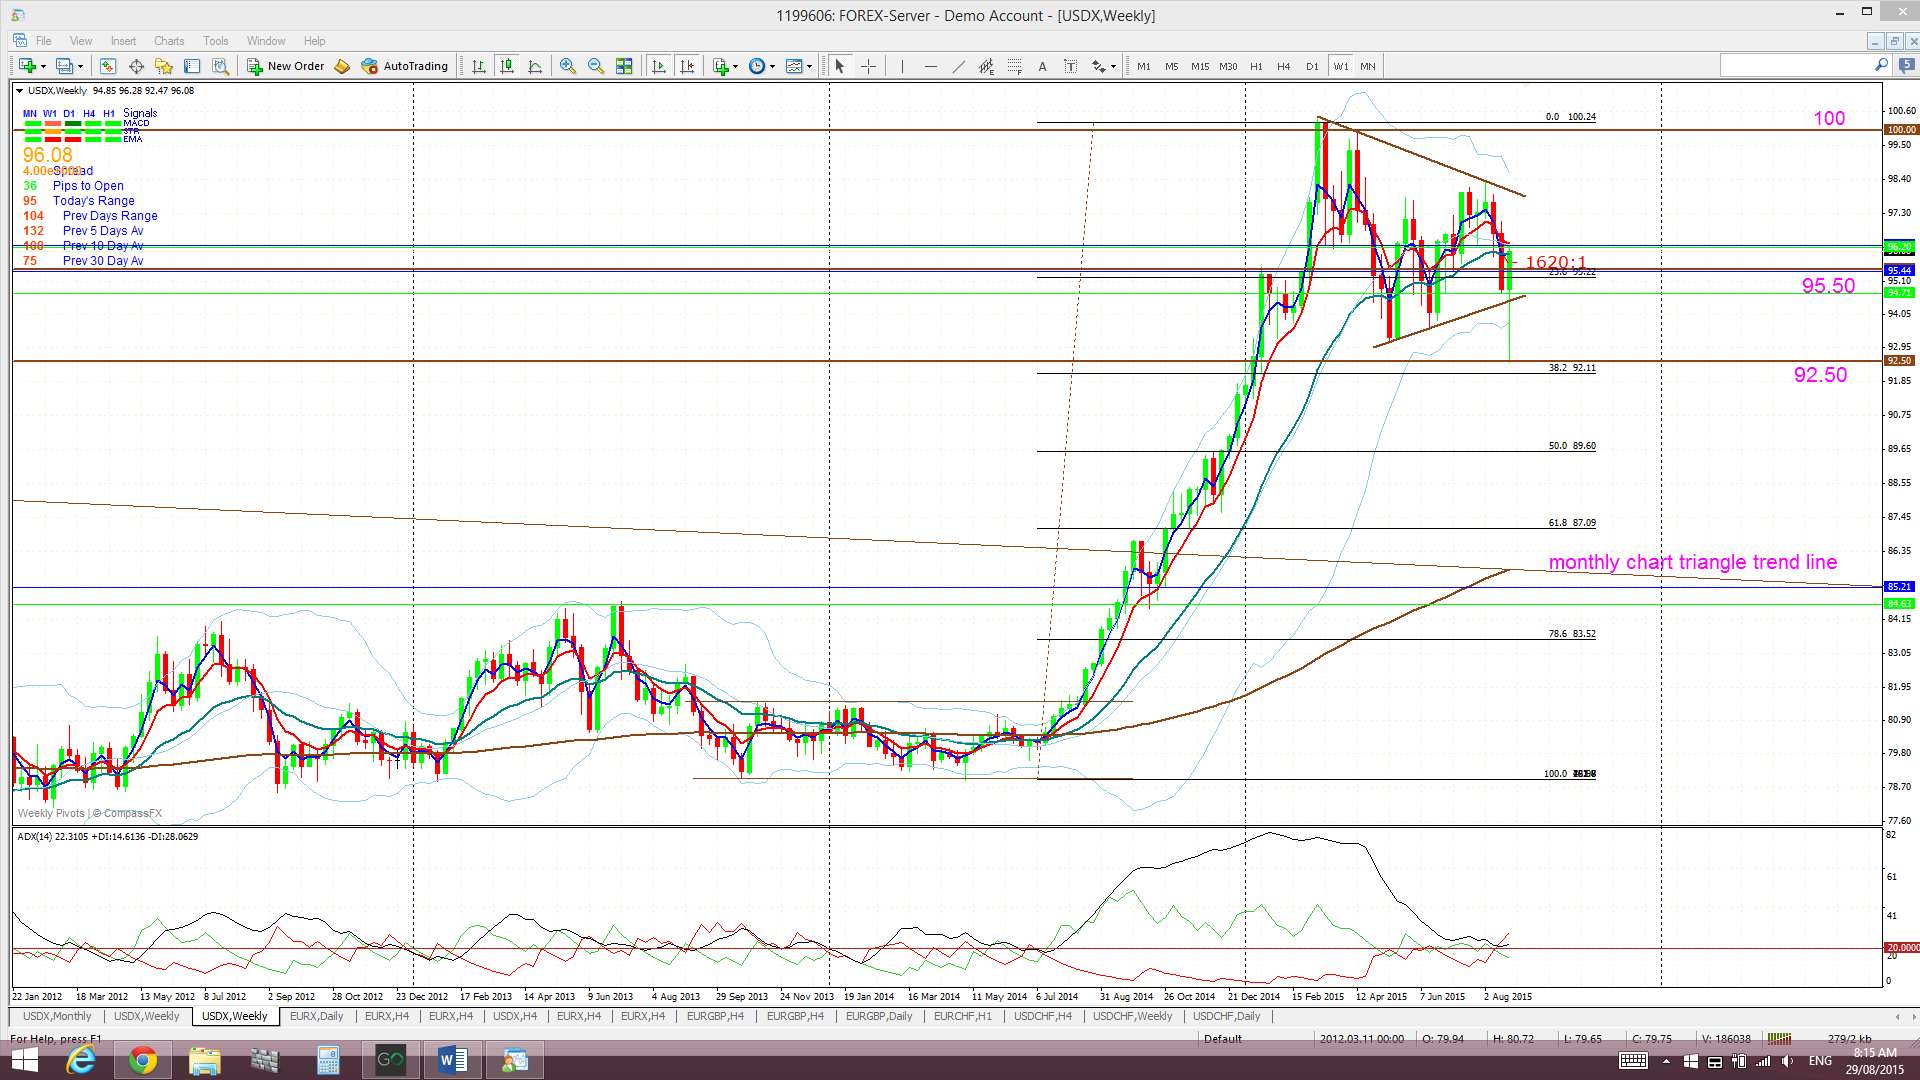
Weekly Ichimoku: The weekly candle closed ABOVE the weekly Cloud. It is worth noting that the bearish Tenkan/Kijun cross is still open and I would want to see a new bullish cross before being too confident of any resumption of bullish momentum. Note how price bounced up off the Cloud:
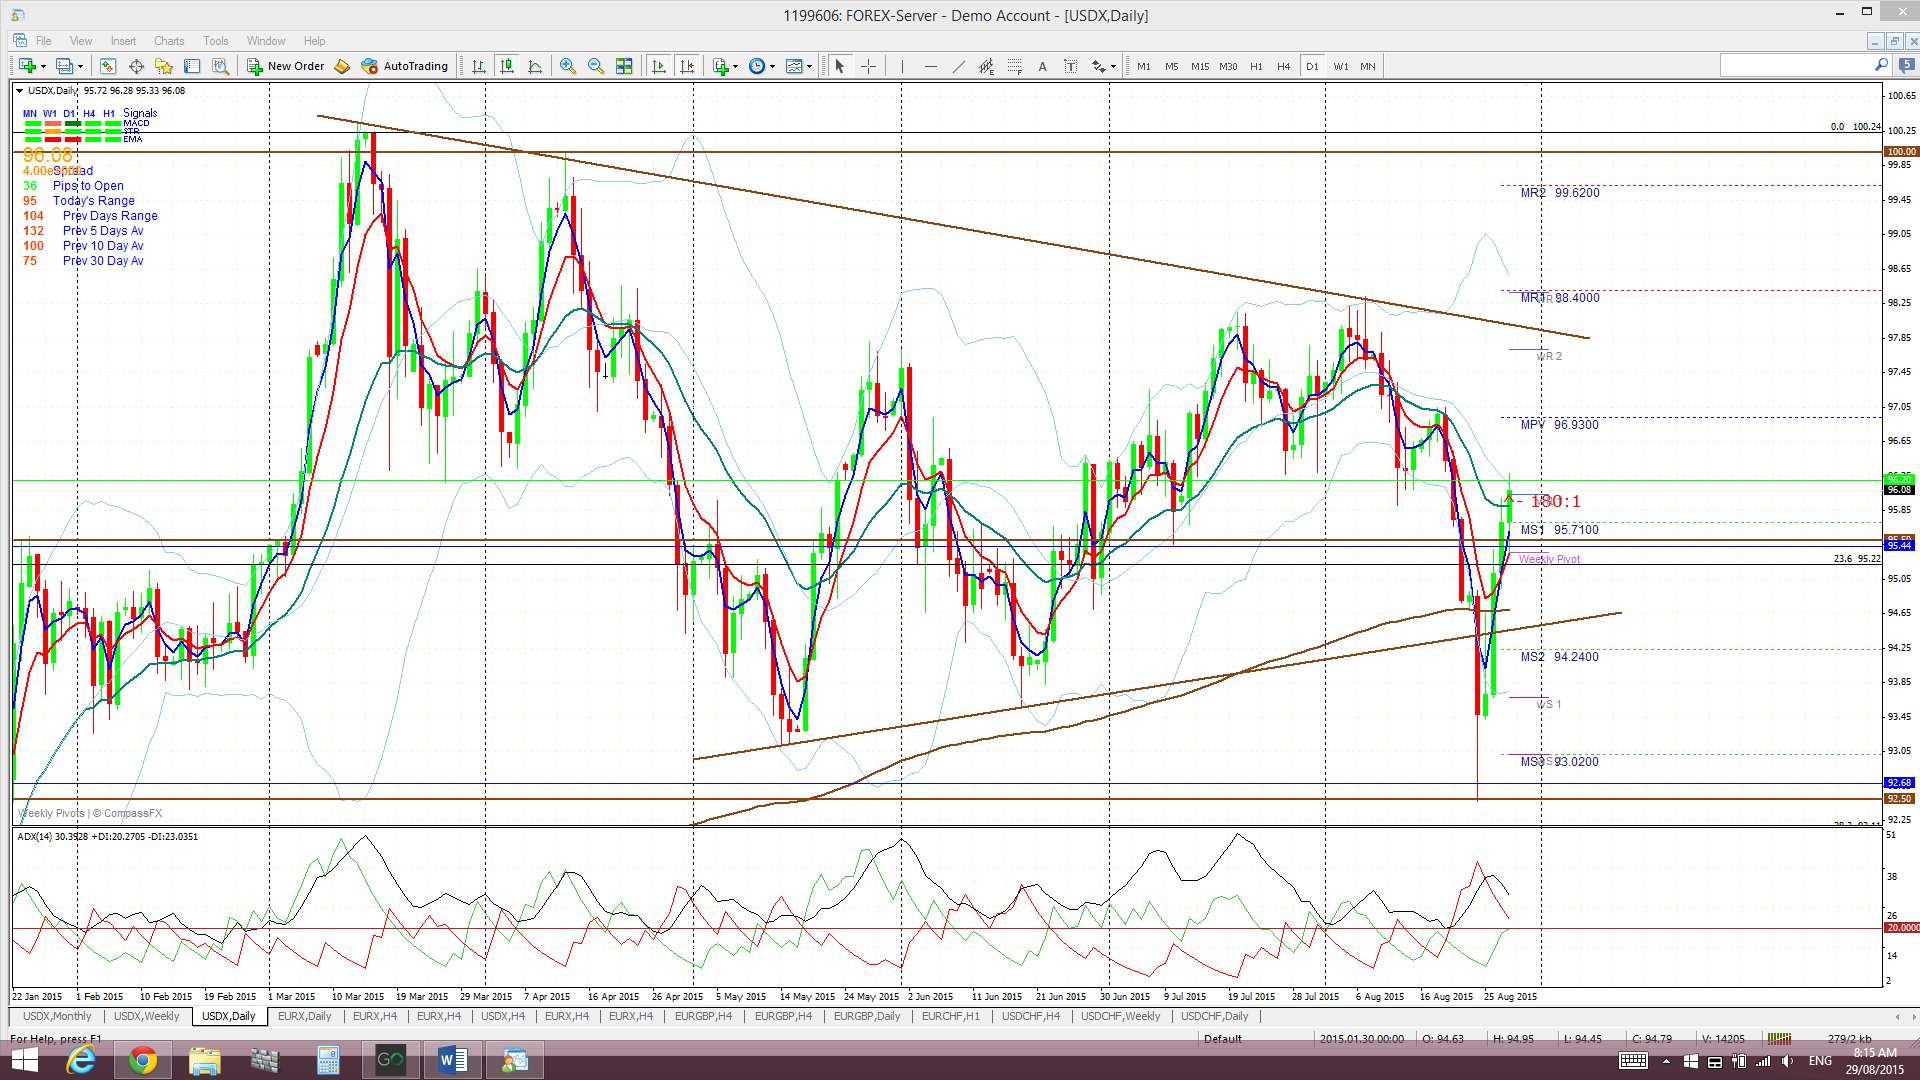
Daily: Price had a big dip on Monday but then printed four bullish candles to finish the week higher. The 100 level remains as overall resistance above current price.
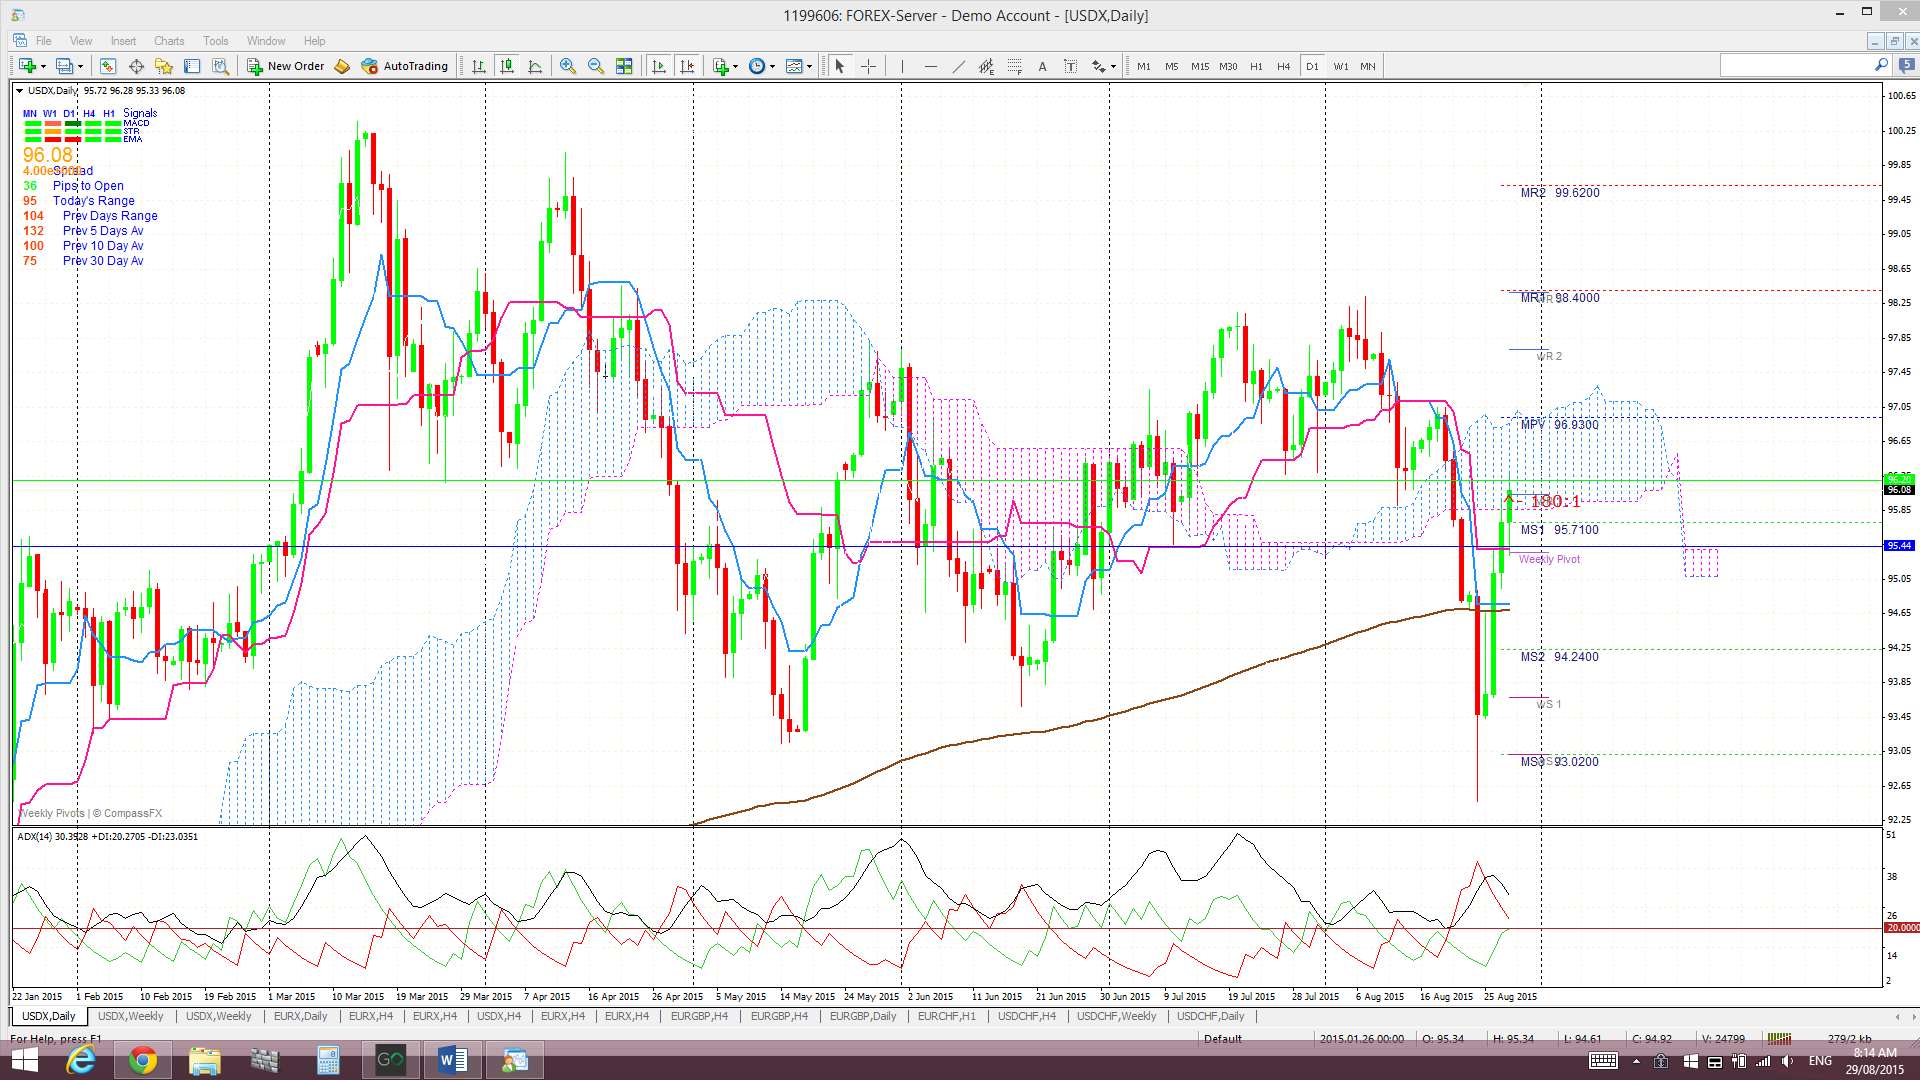
Daily Ichimoku Cloud chart: Price traded below the daily Cloud last week but edged higher to finish the week in the bottom of the Cloud.
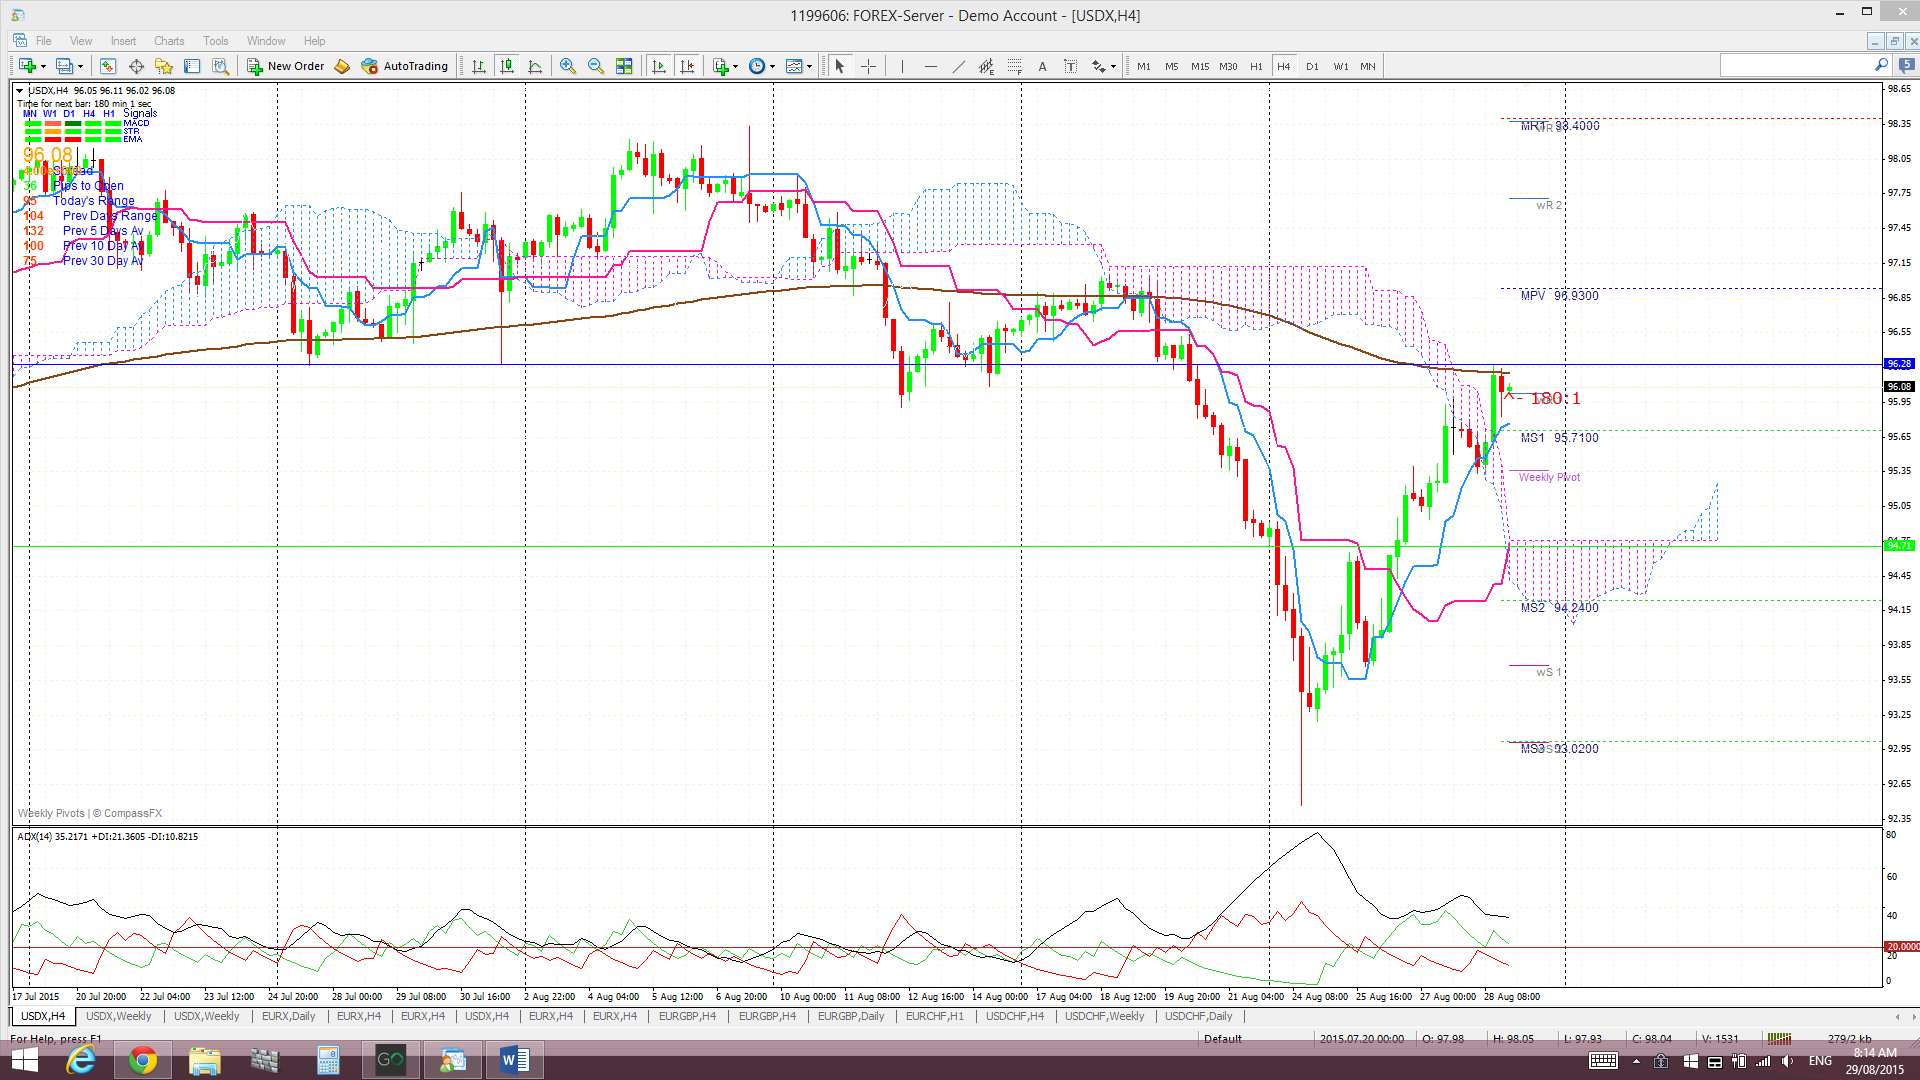
4hr: Price moved lower to start the week but then rallied to finish the week higher. The 4hr 200 EMA is currently offering some resistance to price action.
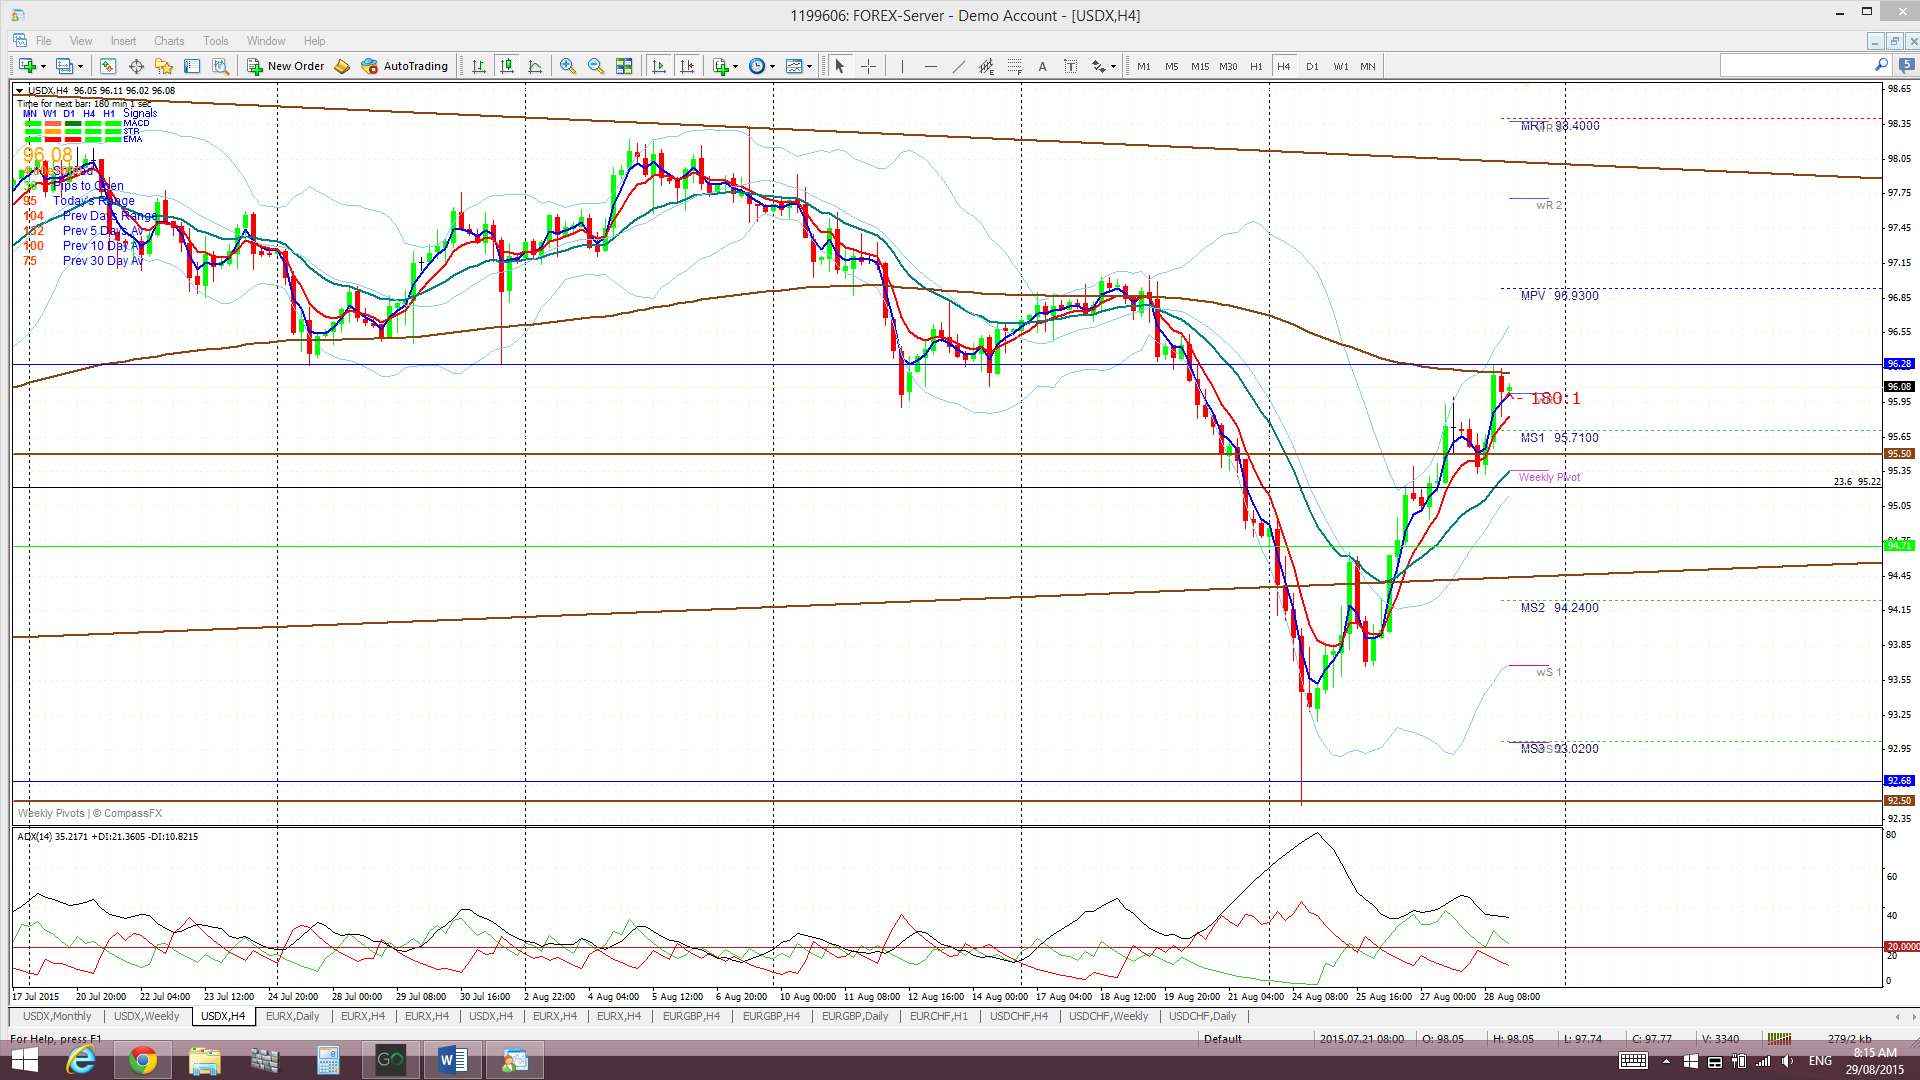
4hr Ichimoku Cloud chart: Price traded below the Cloud at the start of last week but moved back up to close the week above the Cloud. This chart is divergent from the daily chart for now and suggests choppiness.
EURX
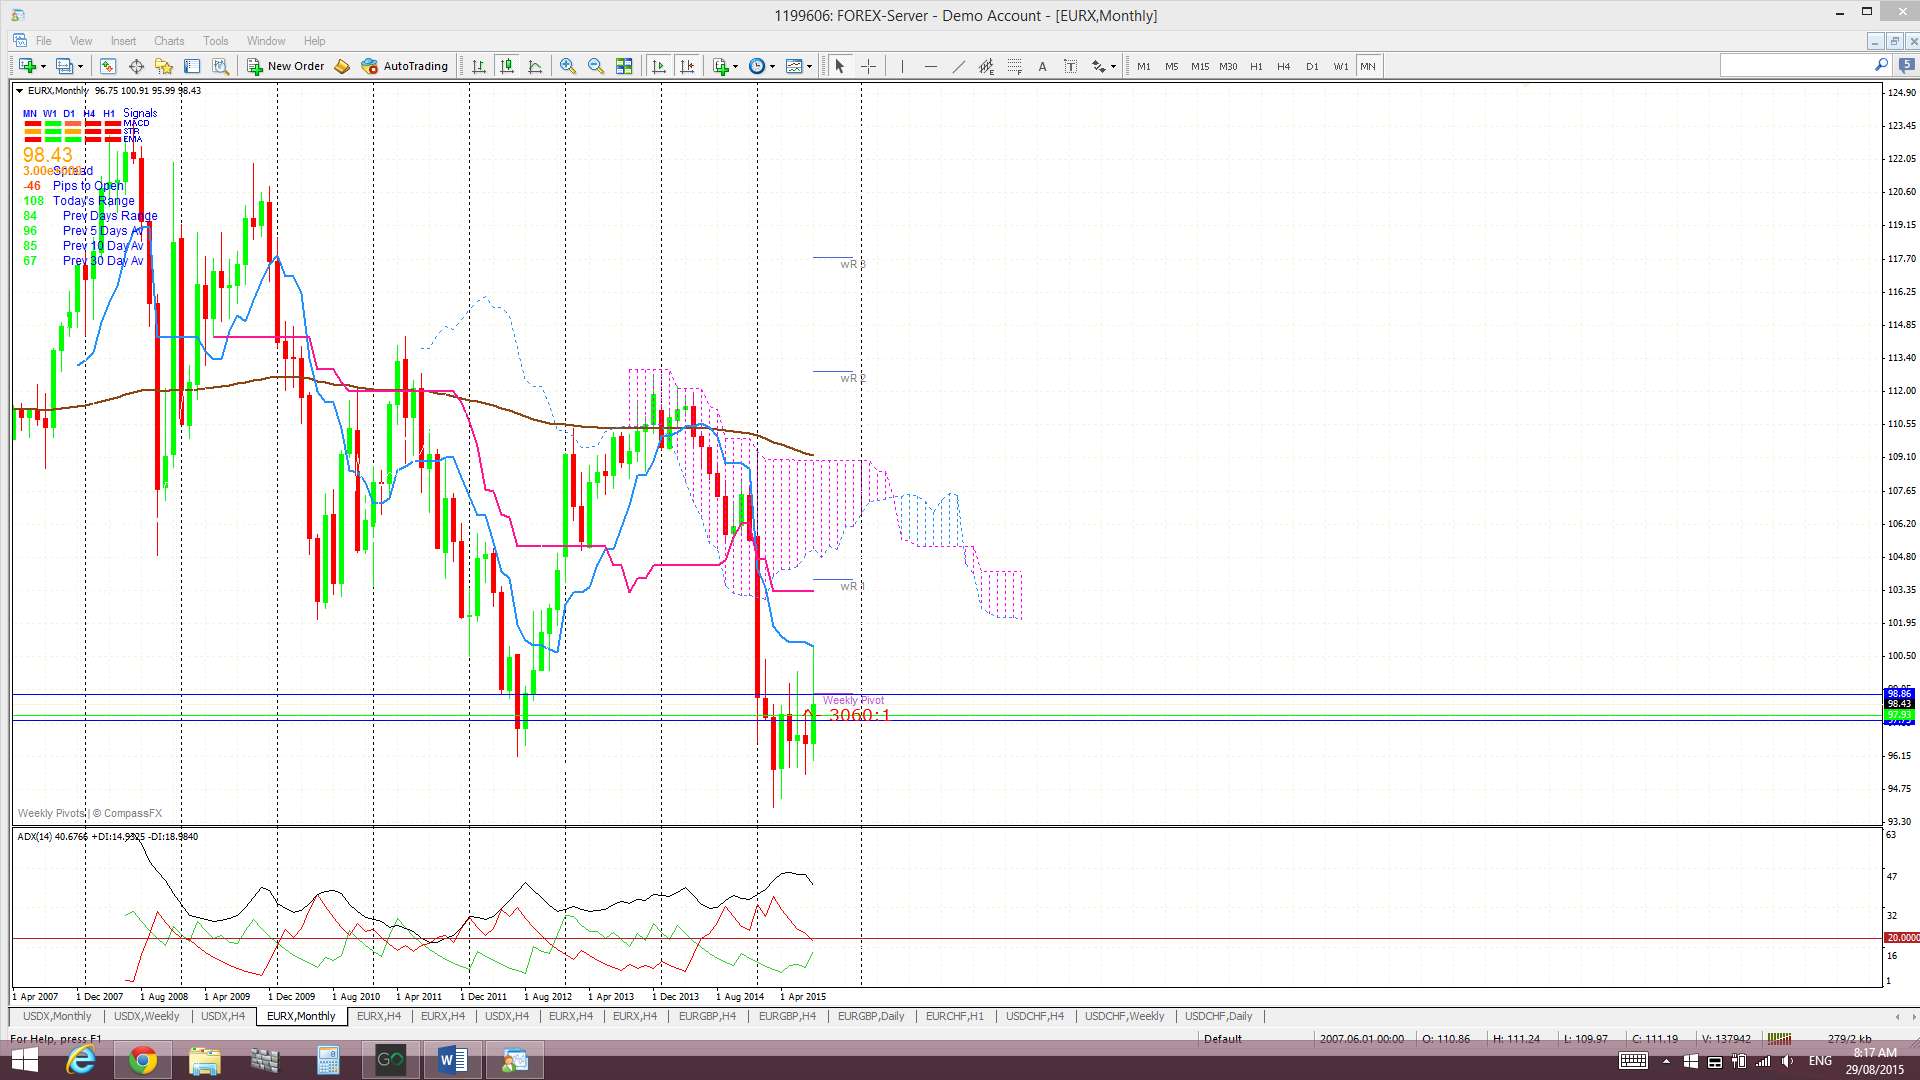
Monthly: The August candle is still printing a bullish, almost ‘engulfing’, candle and is still above the key 96 ‘Double Bottom’ level.

Monthly Ichimoku: The August candle is trading below the Cloud.
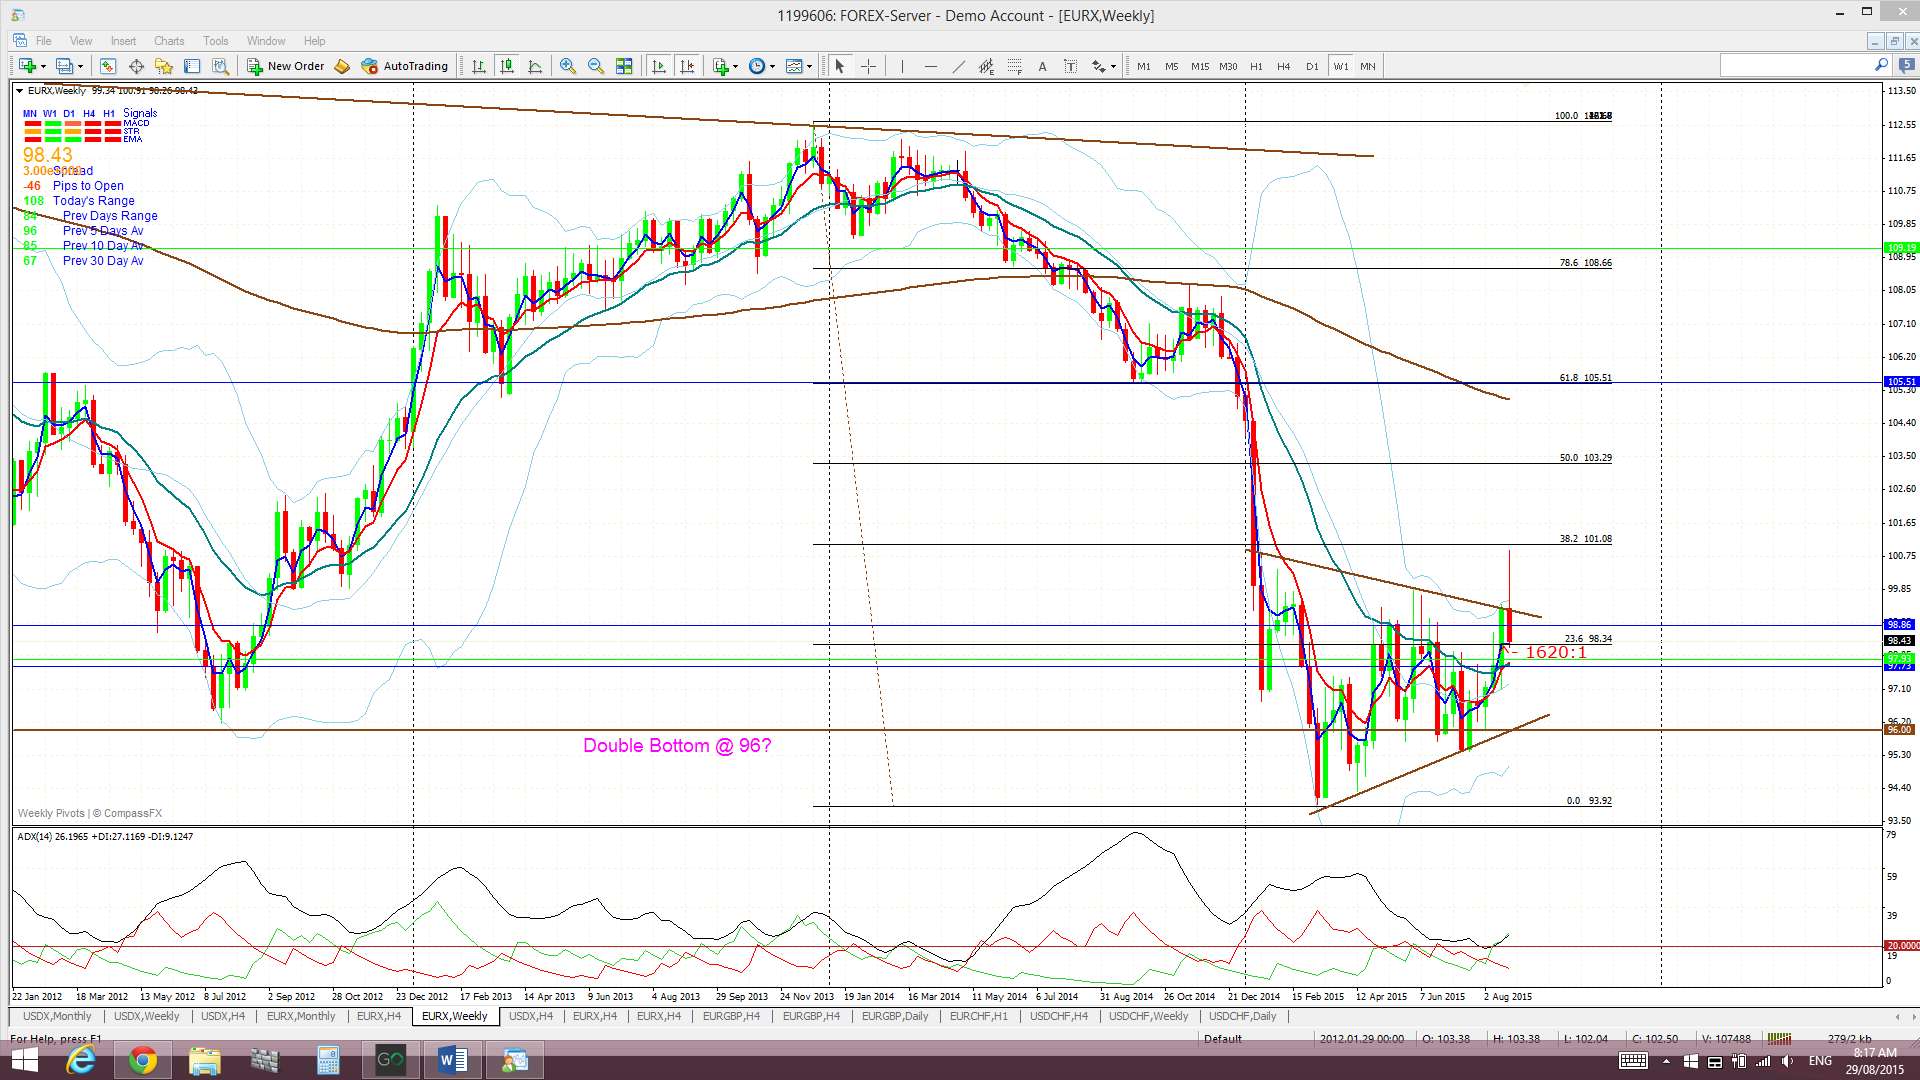
Weekly: The weekly candle closed as a bearish-reversal style ‘Shooting Star’ candle BUT above the key 96 level. This too, like the weekly USDX candle, is also much like an indecision-style ‘Inside’ candle. There have been two conflicting technical patterns competing over recent months; a basing-style bullish ‘Double Bottom’ and a ‘Bear Flag’, but neither pattern has trumped yet.
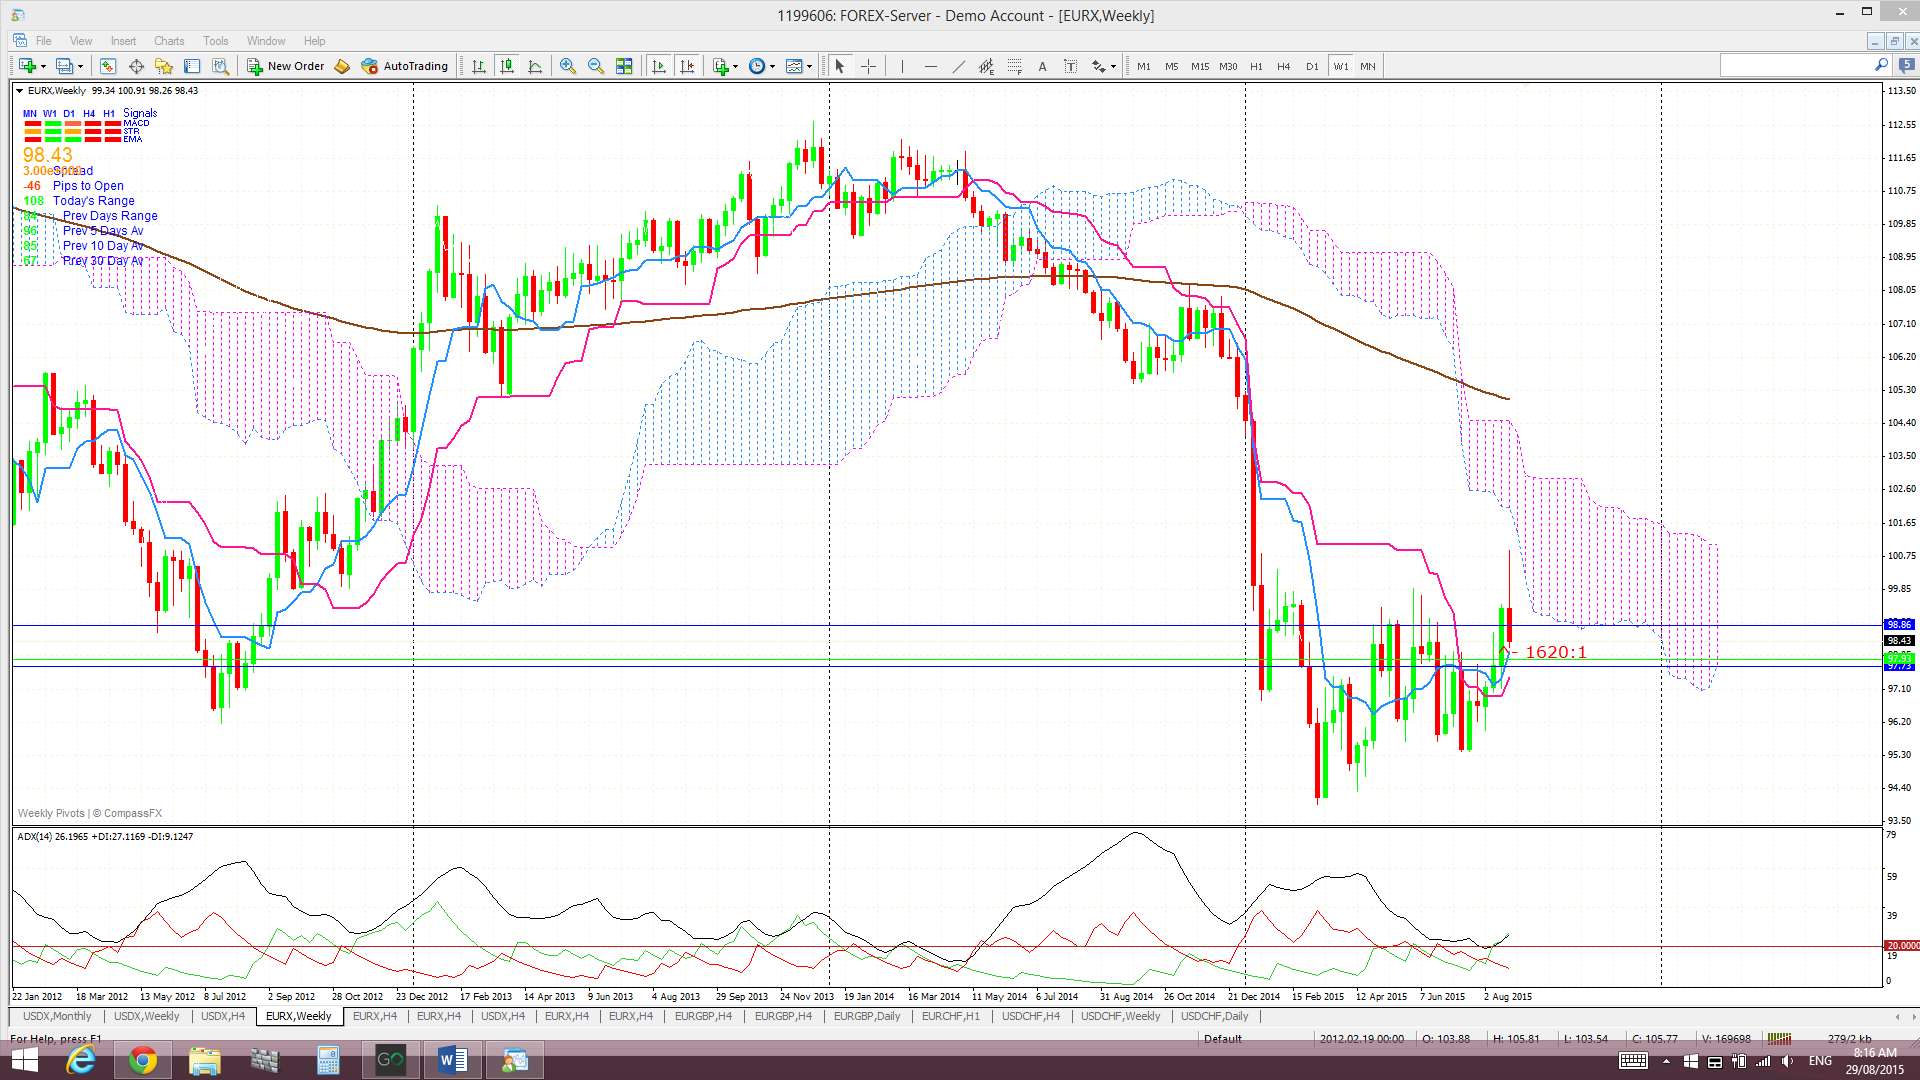
Weekly Ichimoku: Price is still trading below the weekly Cloud BUT edging back up closer to this resistance zone. The recent bullish Tenkan/Kijun cross remains open and, thus, I want to see a new bearish cross before being too confident of any resumption of bearish momentum.
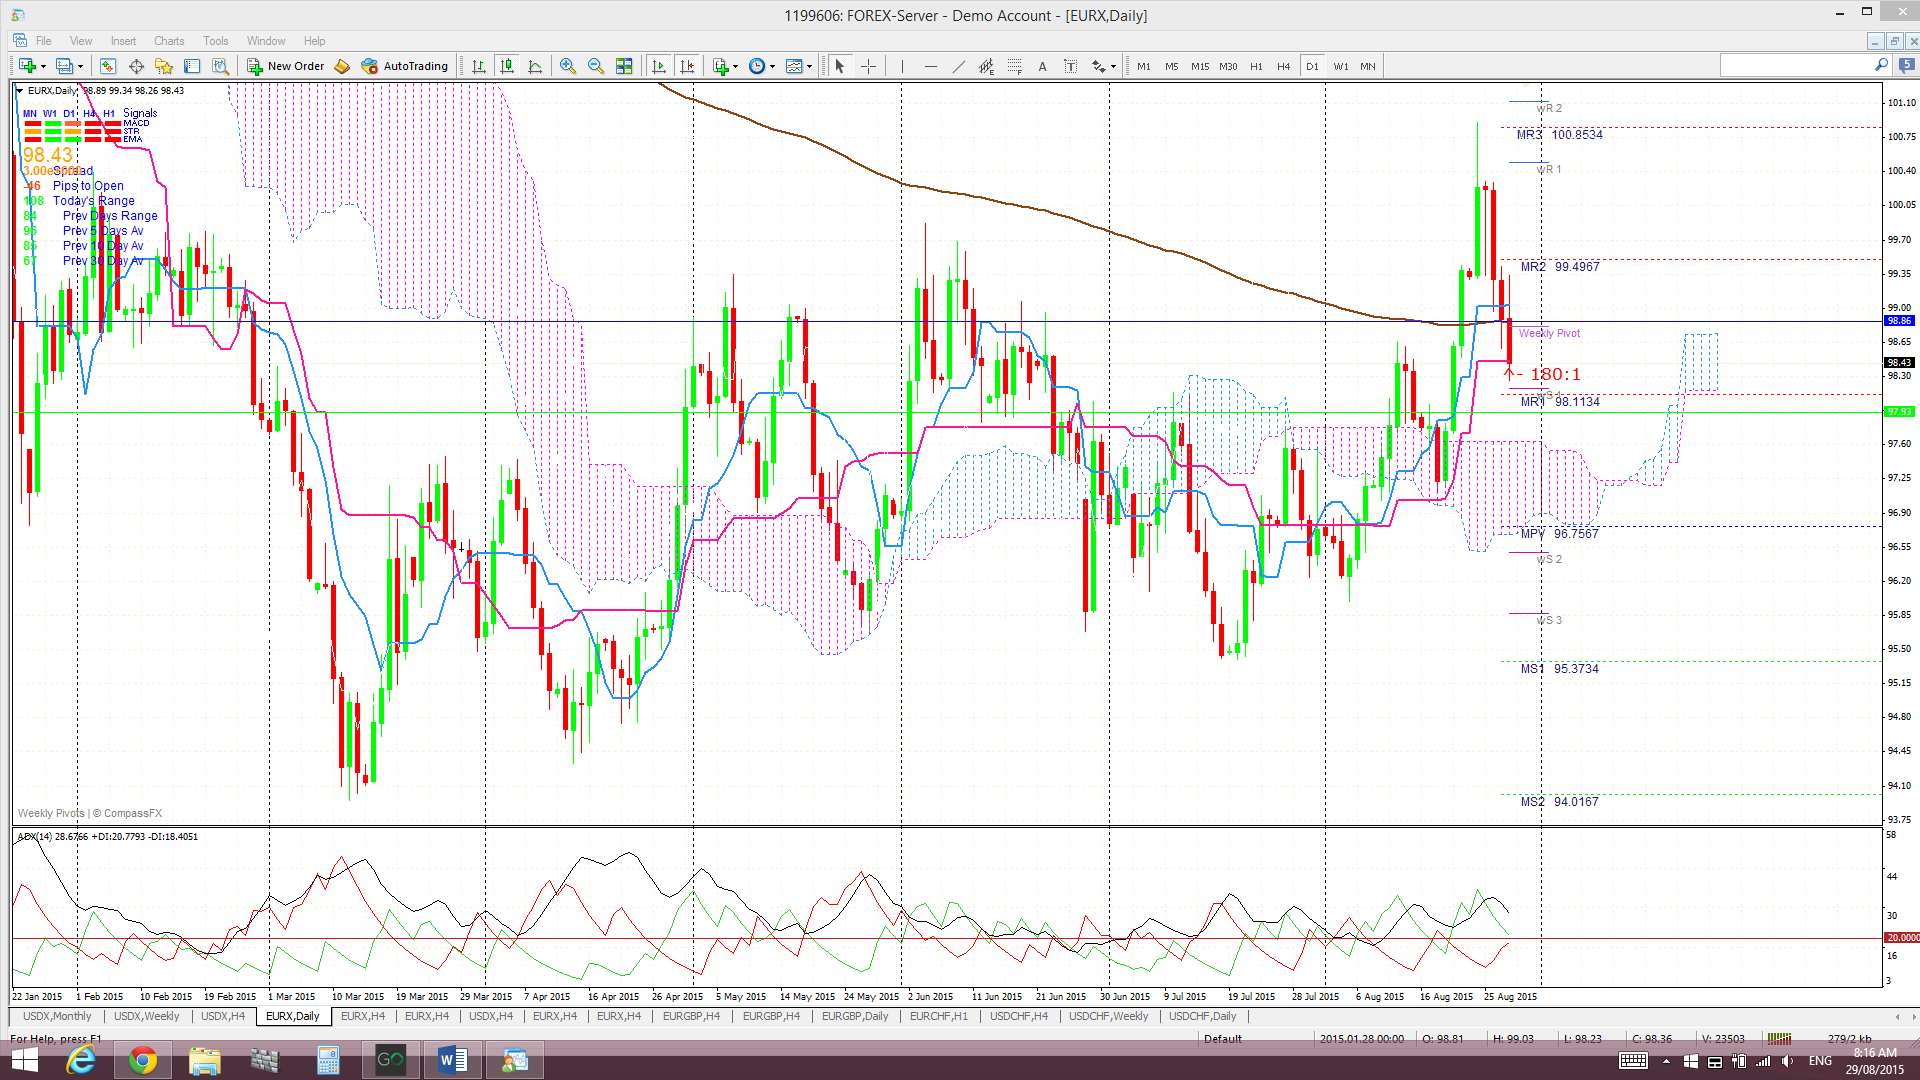
Daily: Price rallied to start the week but then printed four bearish candles to close the week lower.

Daily Ichimoku Cloud chart: Price traded above the daily Cloud last week.
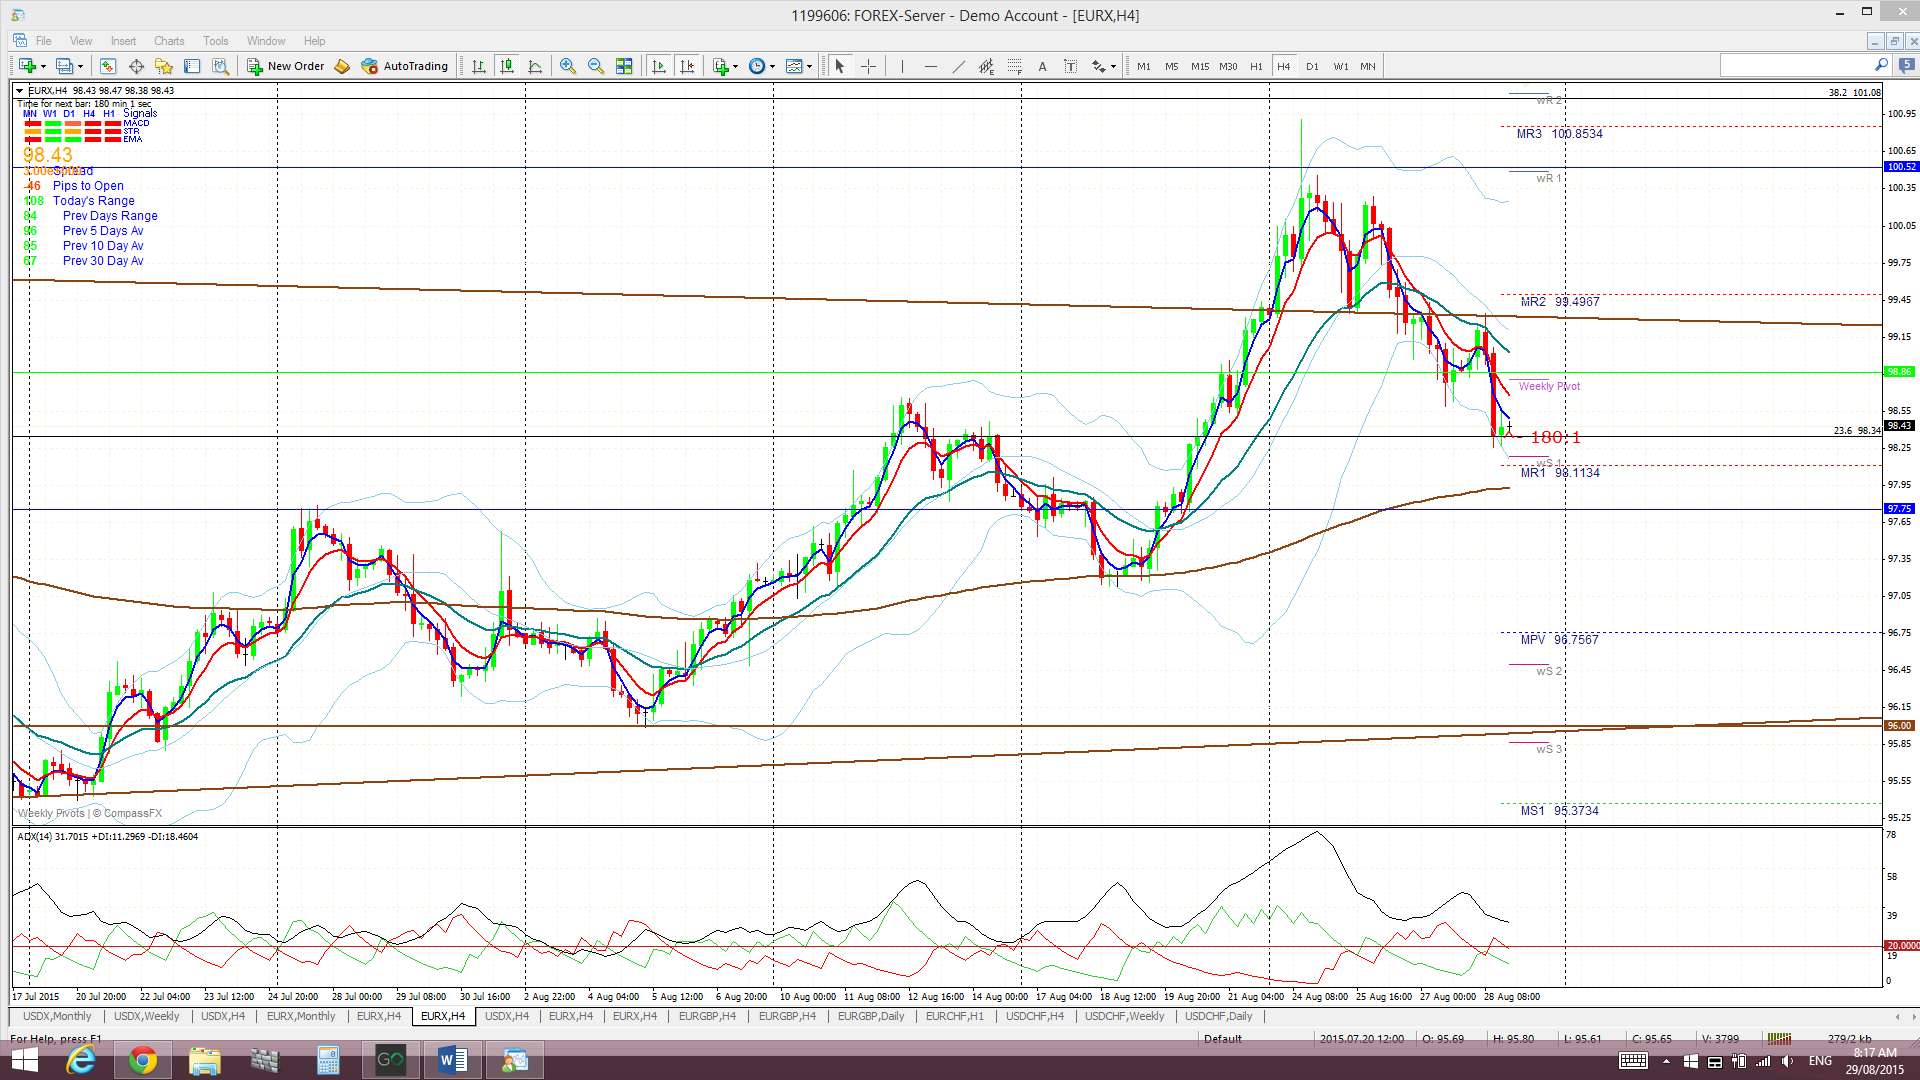
4 hr: Price rallied higher on Monday but then pulled back for the rest of the week.
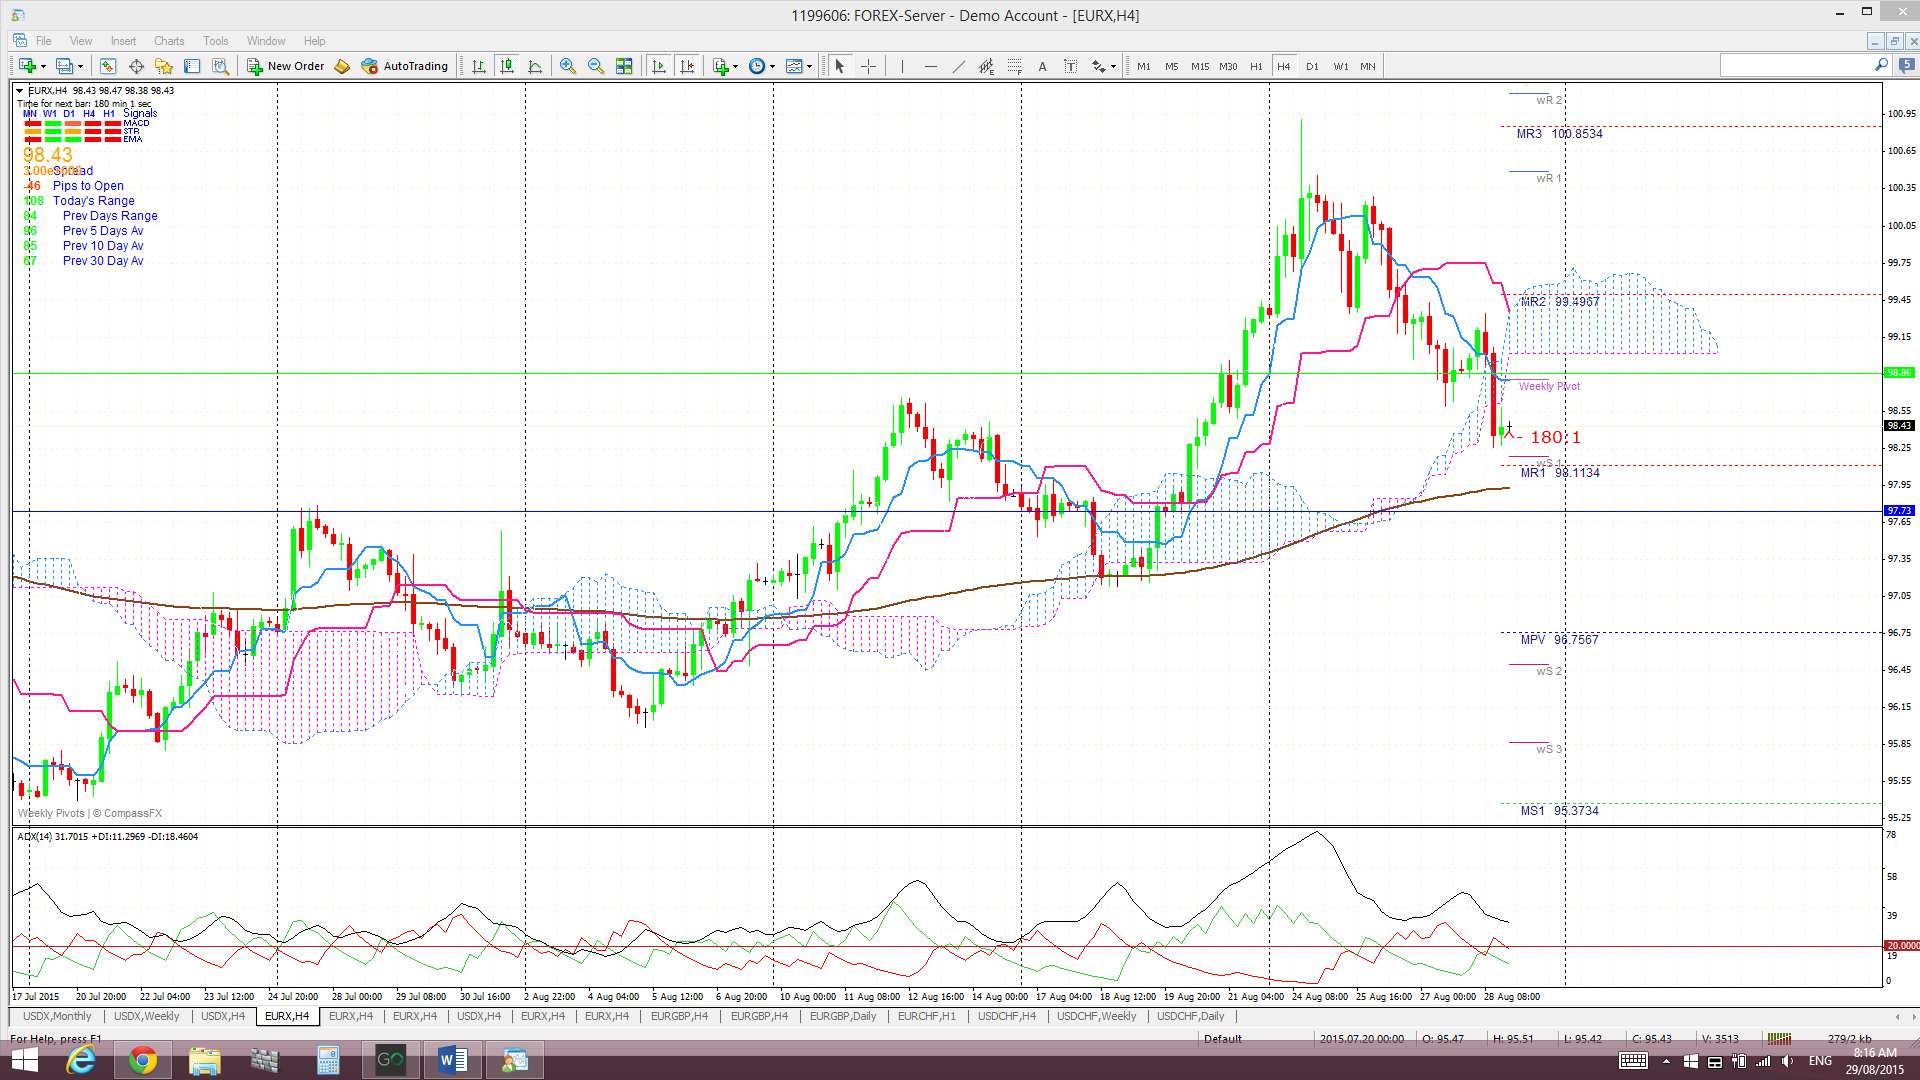
4 hr Ichimoku Cloud chart: The EURX traded above the Cloud for all of last week but pulled back to close below this support region. This chart is now divergent from the daily chart and suggests choppiness.
General:
- Both indices continue consolidating sideways in weekly-chart Flag patterns that have persisted for over 5 months.
- The USDX and EURX are NOT aligned on the Ichimoku charts.
- Each week I keep anticipating which economic data-event might trigger a breakout on both of these index Flag patterns. I am beginning to think that there won’t be a decisive Flag breakout on either index until the Federal Reserve actually announce a specific date for any US interest rate increase.
USDX: The US$ pulled back on Monday to test key 92.50 support but then recovered to close the week higher although still consolidating within a potential Bull Flag pattern.
As mentioned over recent weeks, I still consider the US$ is in no-man’s land whilst it trades above 92.50 and below 100. I continue to wait for a decisive breakout from this region to signal the next major directional move on the index as this choppy and range-bound price action has gone on for over five months now.
Thus, the levels to keep watching on the USDX are:
- The weekly chart Flag trend lines.
- The psychological 100 level above current price. This is the top of the recent trading range.
- The 92.50 level below current price. This is the bottom of the recent trading range.
EURX: The EURX closed lower for the week but is still holding above key 96 support for the time being and trading within a consolidation-style Flag pattern. The fact remains, however, that the Eurozone is trading within a monetary easing cycle and the US is trying to emerge from one. This weekend’s Jackson Hole Symposium might shed light on that success though!
The levels to watch on the EURX remain as:
- The weekly chart Flag trend lines.
- The 105.5 level: The weekly chart reveals that a 61.8% fib retracement of the recent lengthy bear move is back up near the 105.50 level and weekly 200 EMA. Any hold back above 96 and continued recovery effort might see the index target this region.
- The 96 level:This is a major support level for the EURX and a possible bullish ‘Double Bottom’ region.
- The 94 level: Any break and hold back below 96 might suggest bearish continuation as it represents a break of the monthly charts ‘Double Bottom’. If so, the recent low printed near 94 will come back into focus.
Note: The analysis provided above is based purely on technical analysis of the current chart set ups. As always, Fundamental-style events, by way of any Ukraine, Eurozone or Middle East events and/or news announcements, continue to be unpredictable triggers for price movement on the indices. These events always have the potential to undermine any technical analysis.
The post FX indices: still range bound for now. appeared first on www.forextell.com.