There have been some big market moves following the PBoC activity earlier in the week but I consider that it is worth keeping the bigger charting picture in mind on many instruments. Both FX indices remain range bound on the weekly charts and until there is a decisive breakout on one or both of these then these weird and wild market gyrations will most likely continue. Tonight brings US Core Retail, Retail Sales and Unemployment Claims and so watch for any US$ reaction to this data.
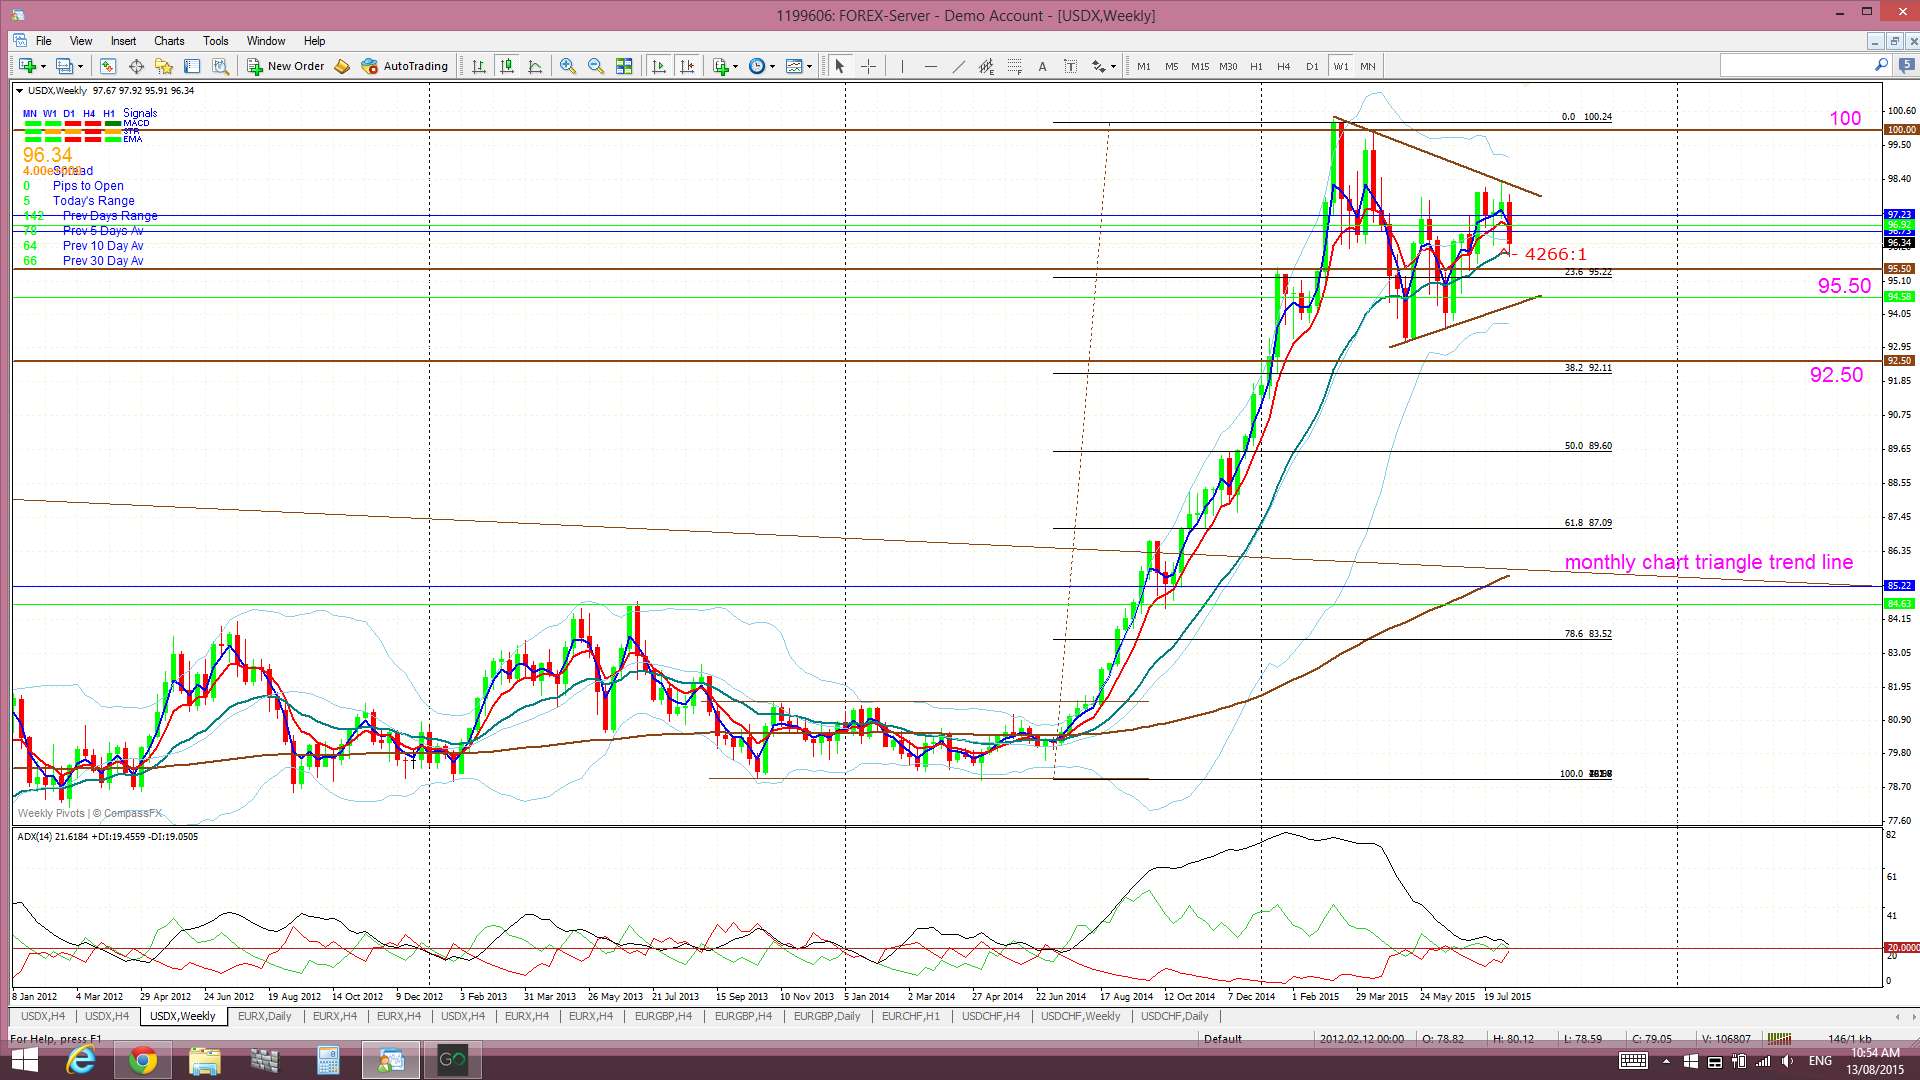
USDX weekly: still consolidating in a potential Bull Flag BUT note how a 61.8% pullback, not out of the realm of trading possibility, would bring price down to test the broken triangle trend line. That is what they call…confluence!
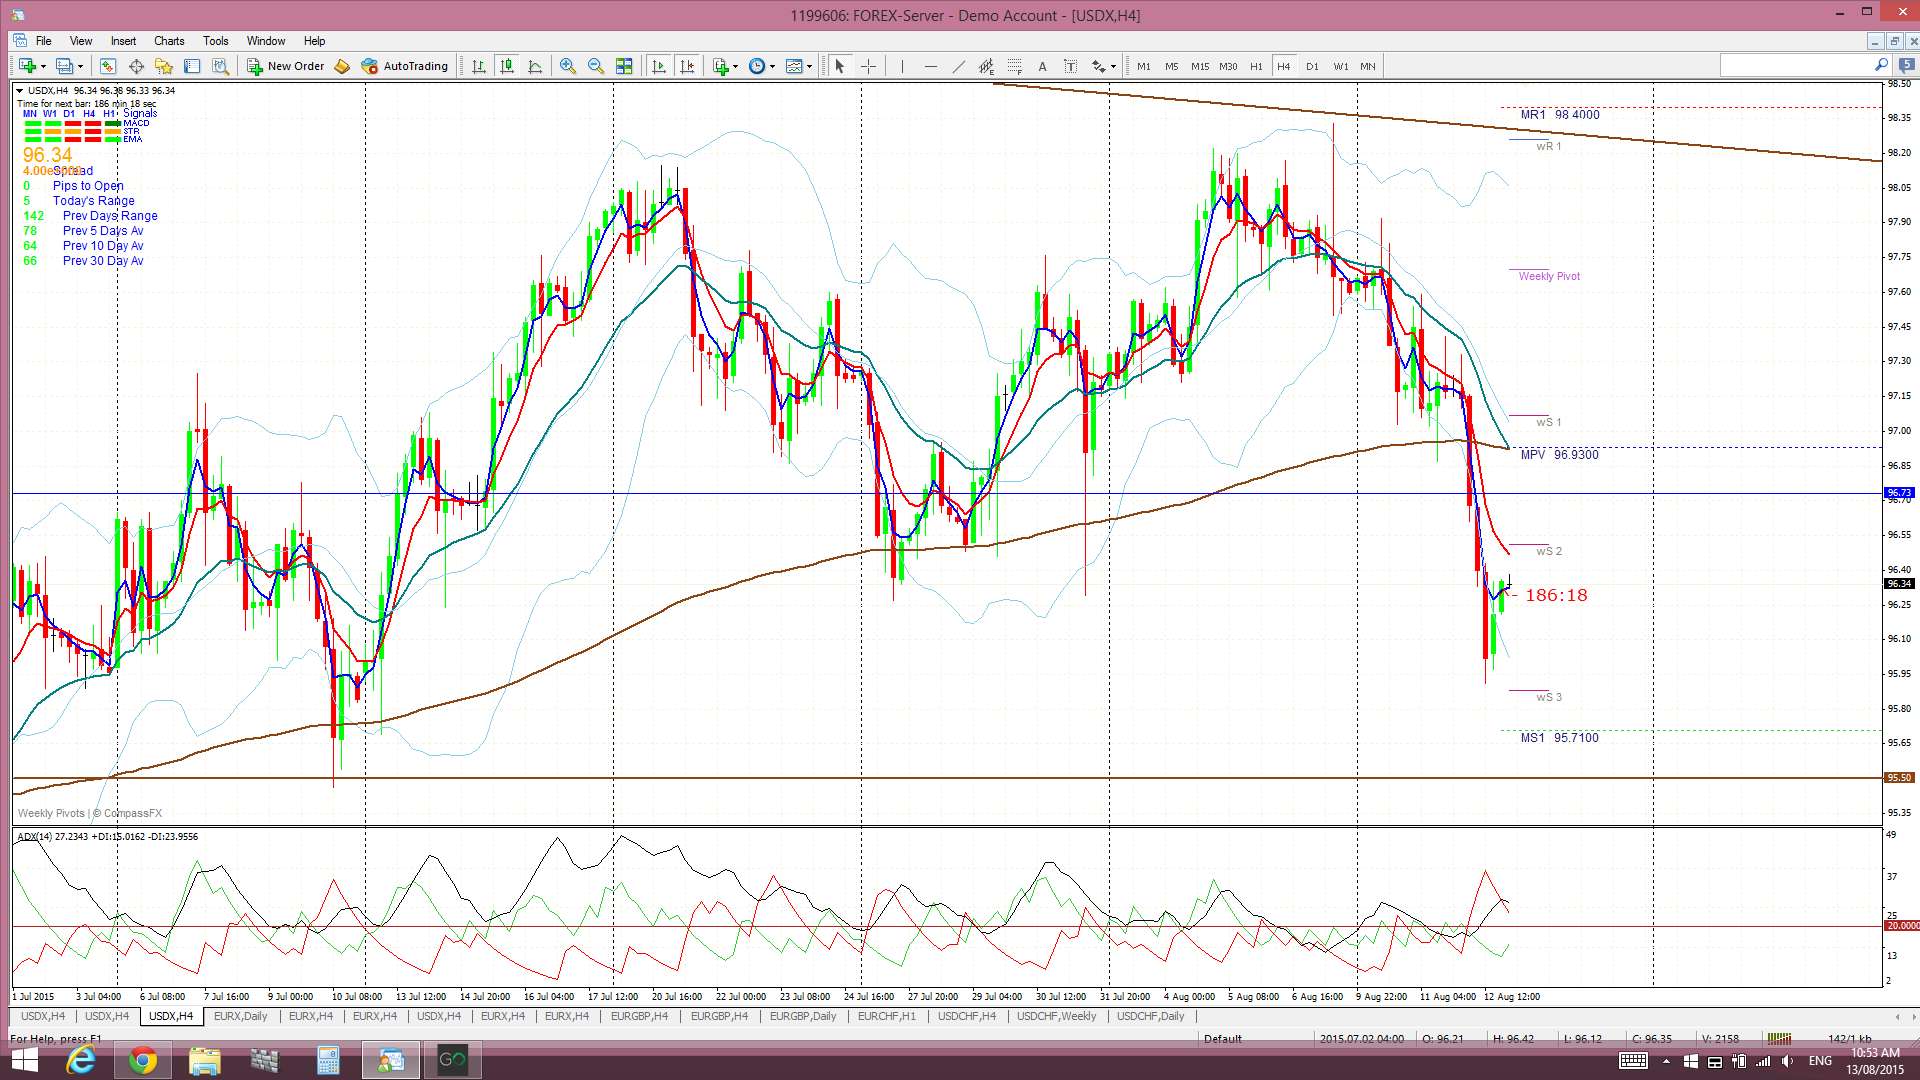
USDX 4hr: I tweeted yesterday how any break of the 4hr 200 EMA, 97 and monthly pivot would leave room for a drop to 95.50…I wasn’t too far off!
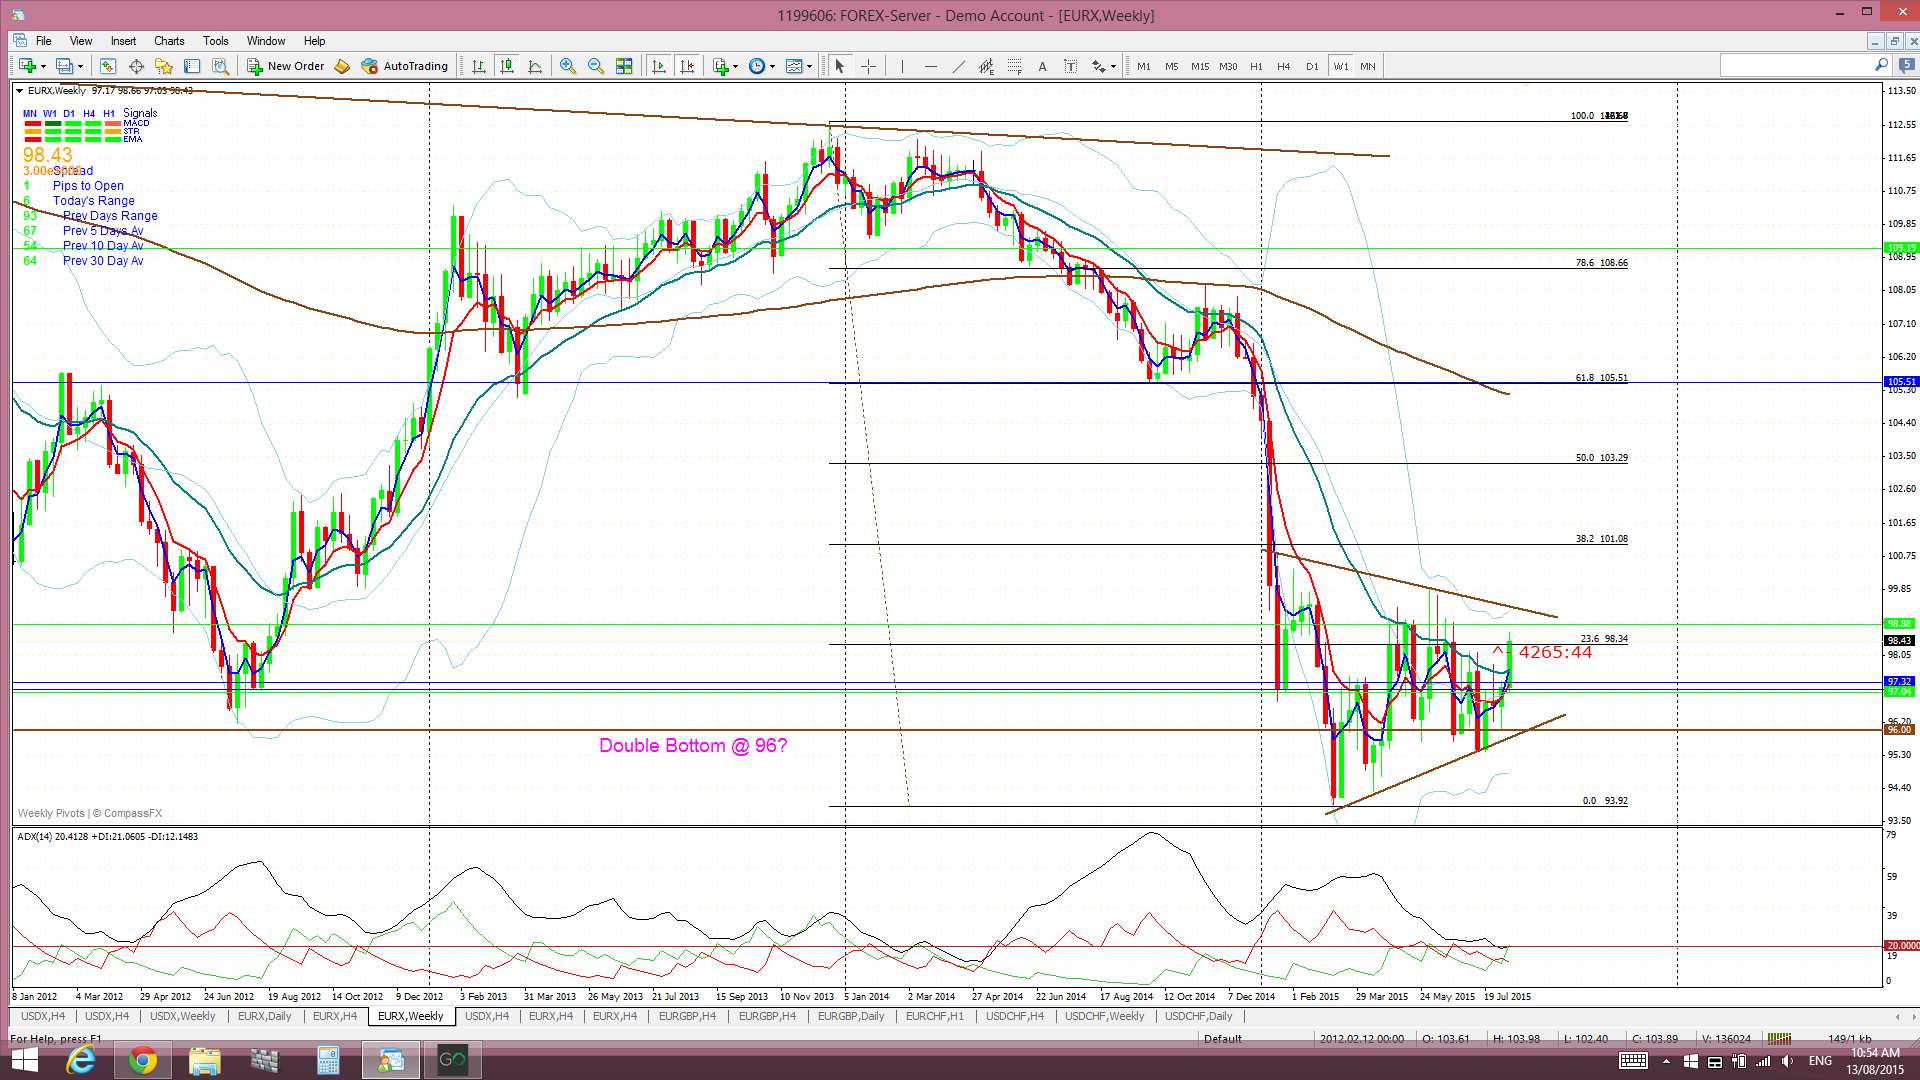
EURX weekly: a basing pattern of Bear Flag? Watch the trend lines for clues:
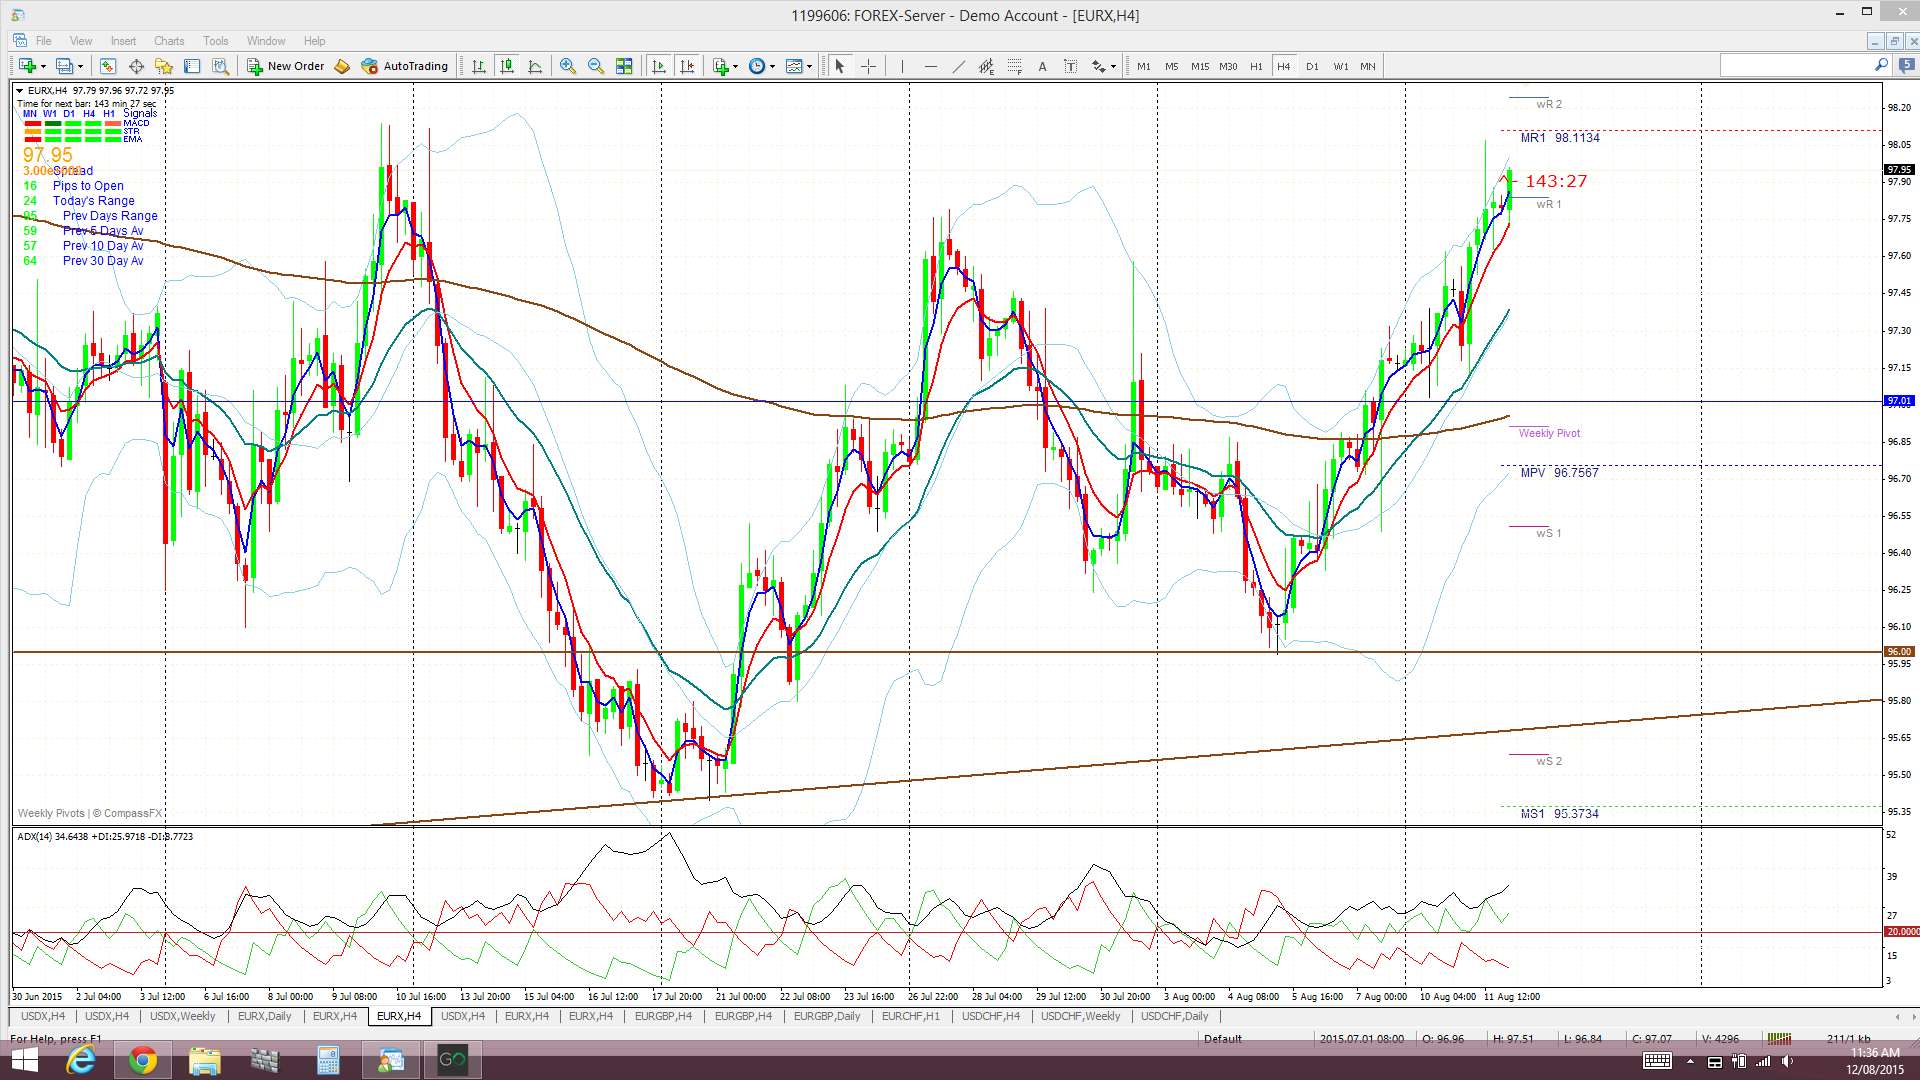
EURX 4hr: a nice bounce off that 96 support level:
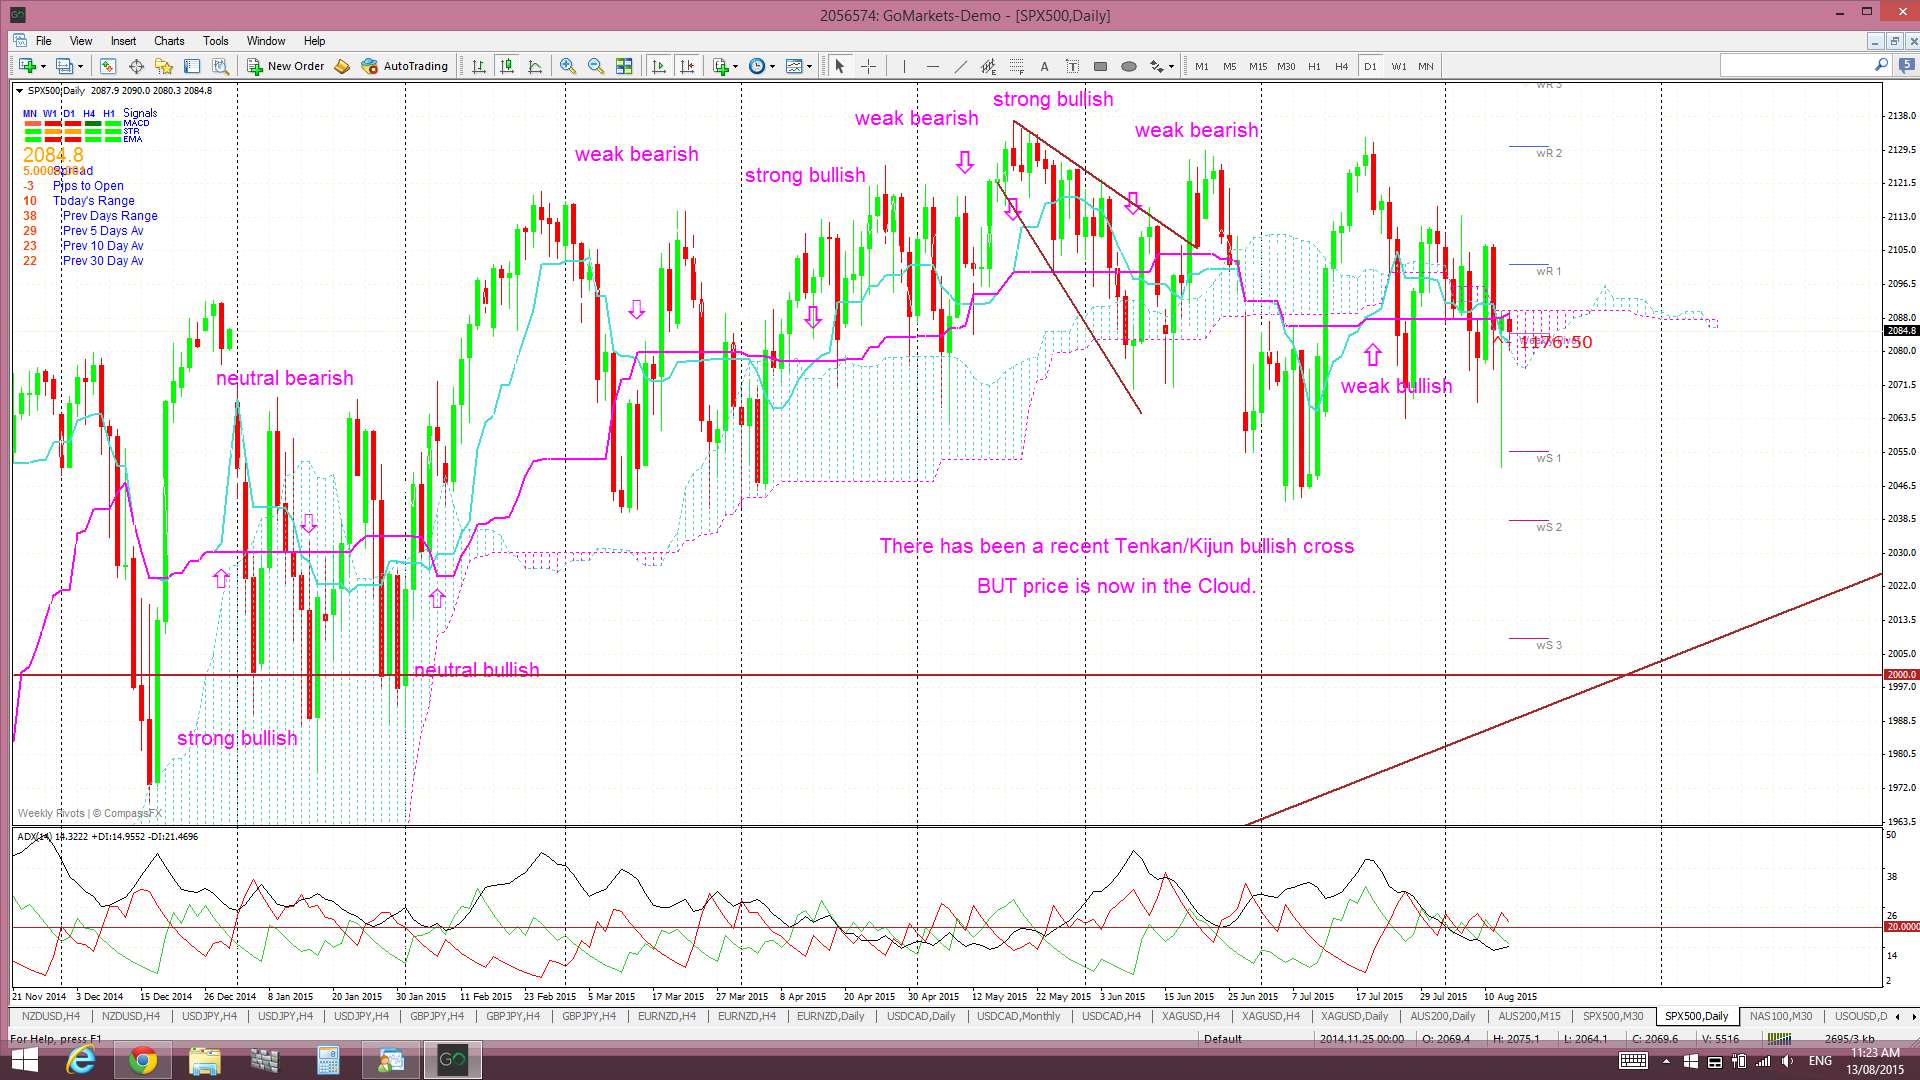
S&P500: price is now in the Cloud but note yesterday’s bullish-reversal ‘Hammer’ candle:
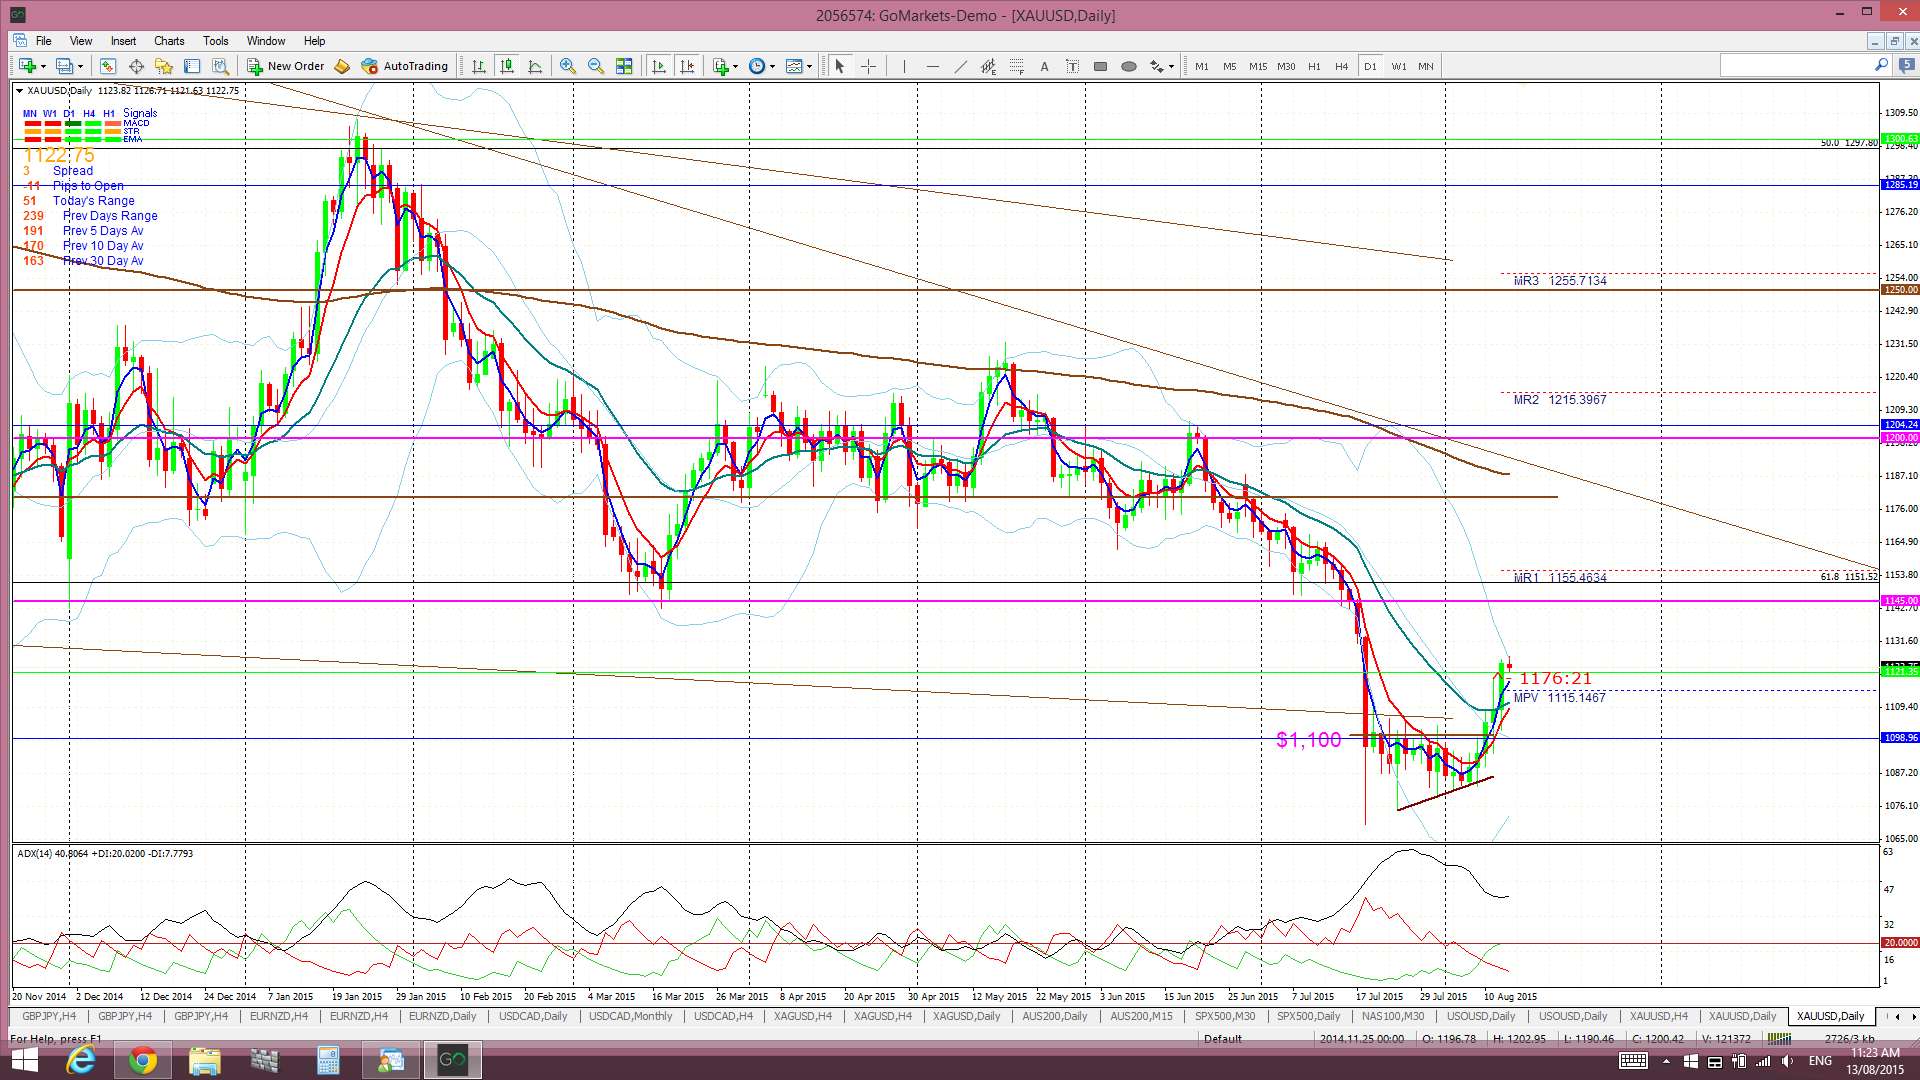
Gold: has continued to recover but many traders will be looking to short this from the $1,145 level as this was a major broken S/R zone:
Gold daily:
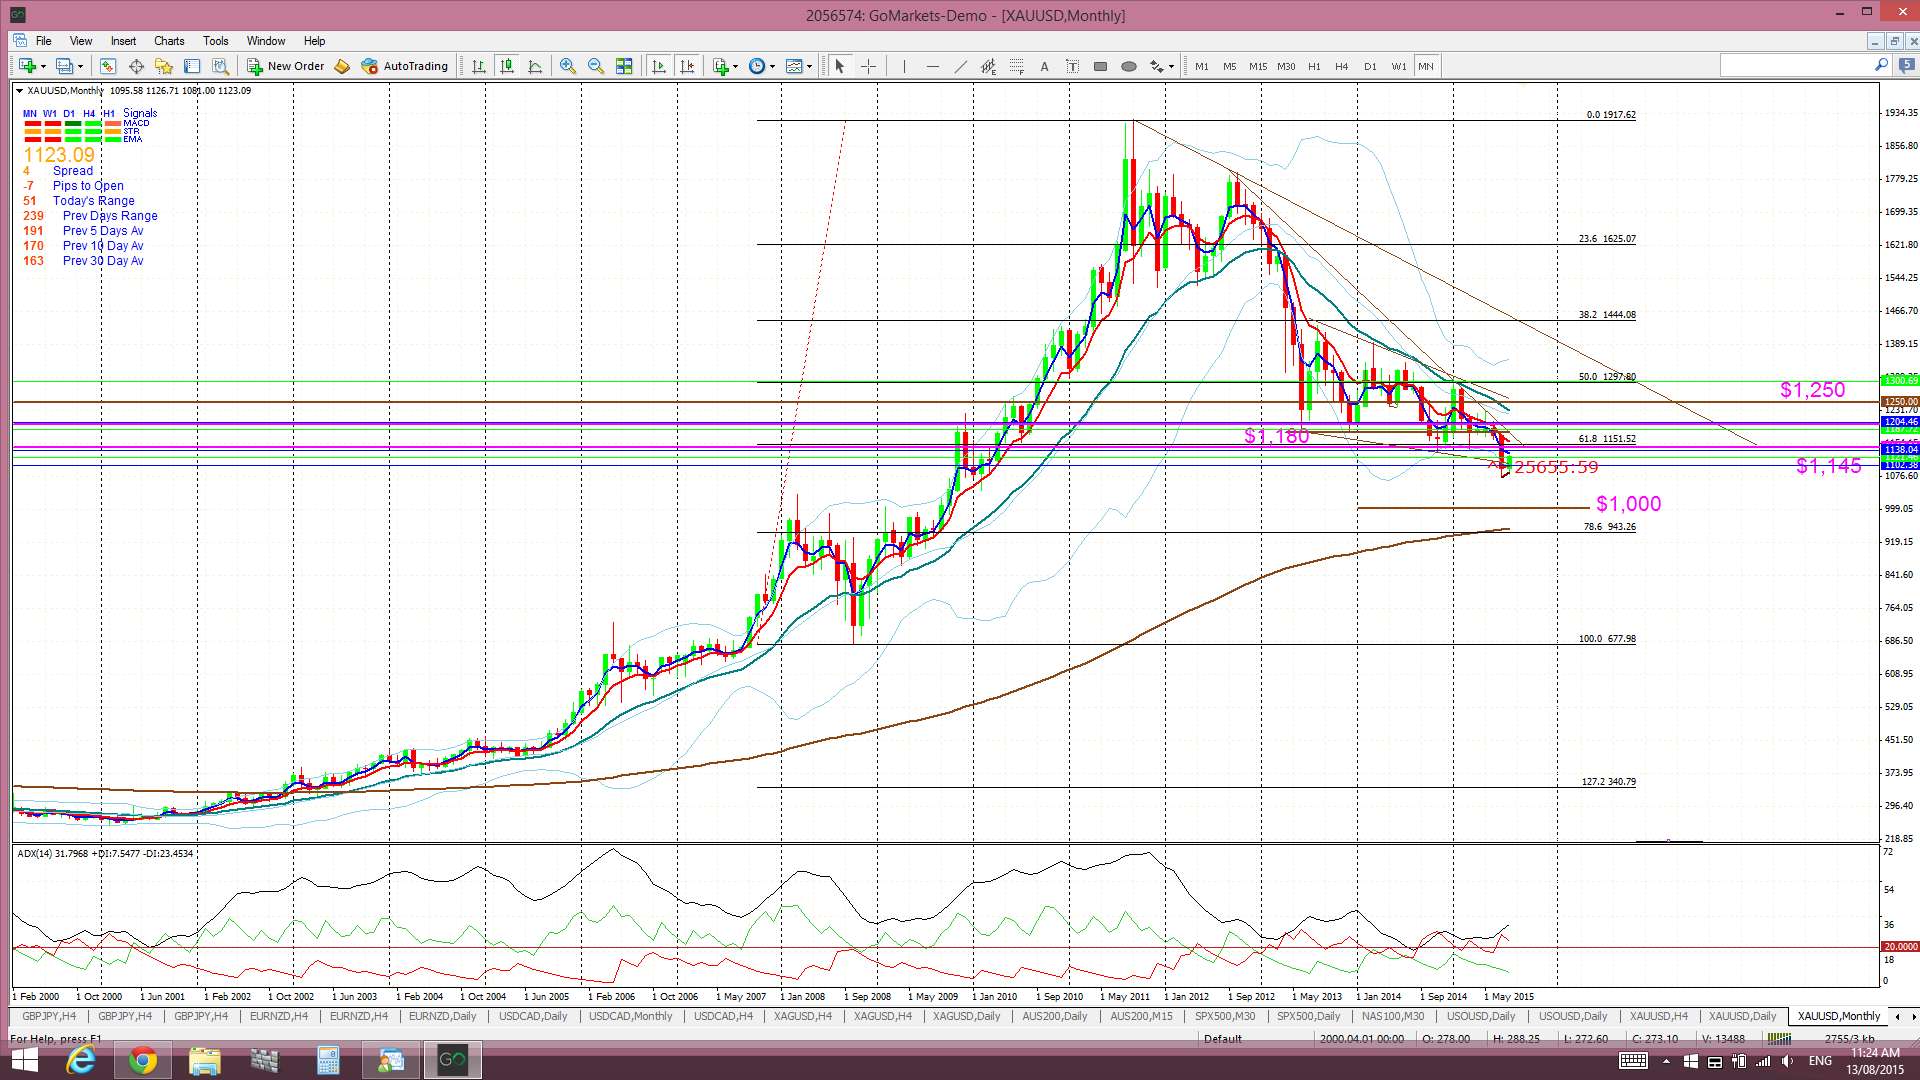
Gold monthly: note the importance of the $1,145 level and that any test of this region might see many traders jump in SHORT. However, if the US$ continues to weaken then Gold may well stay supported:
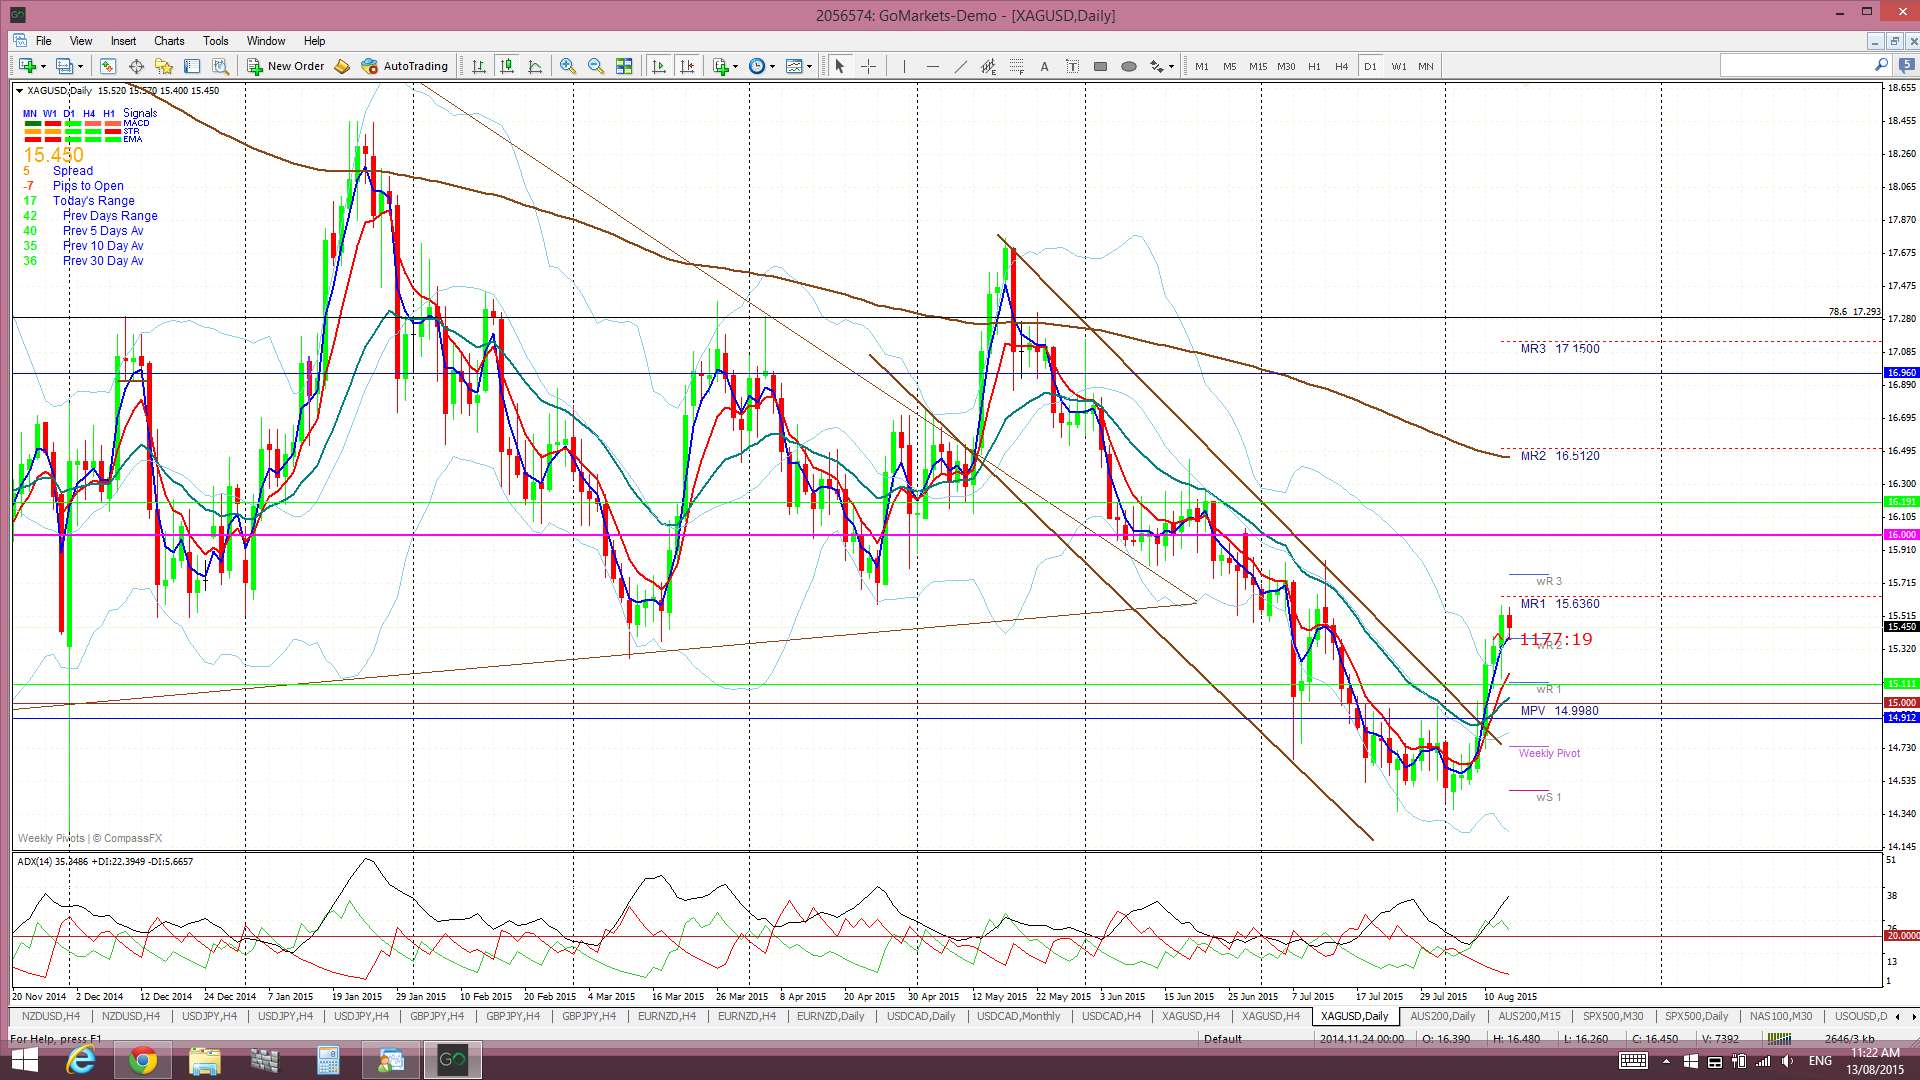
Silver daily: this has bounced up from lows and may head to test the key $16 level:
TC Signals:
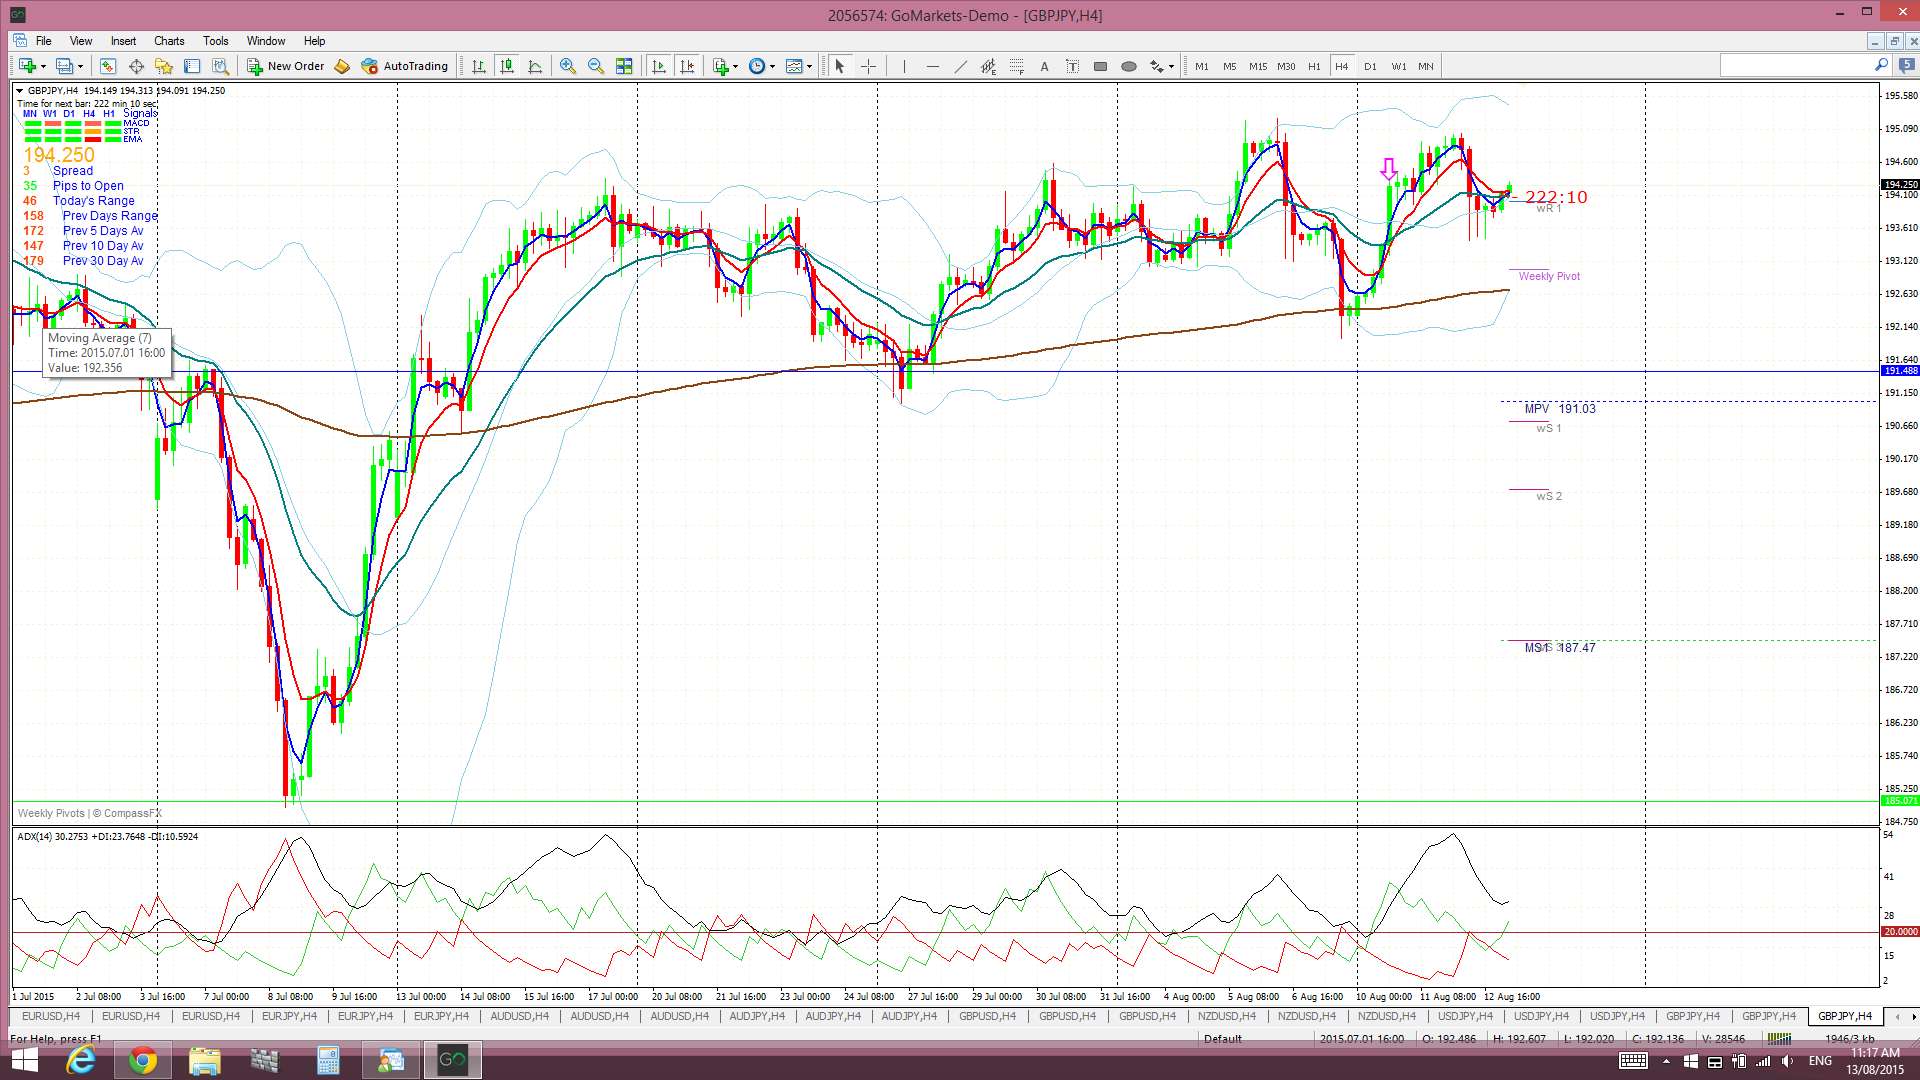
GBP/JPY: this closed off after just 70 pips or so:
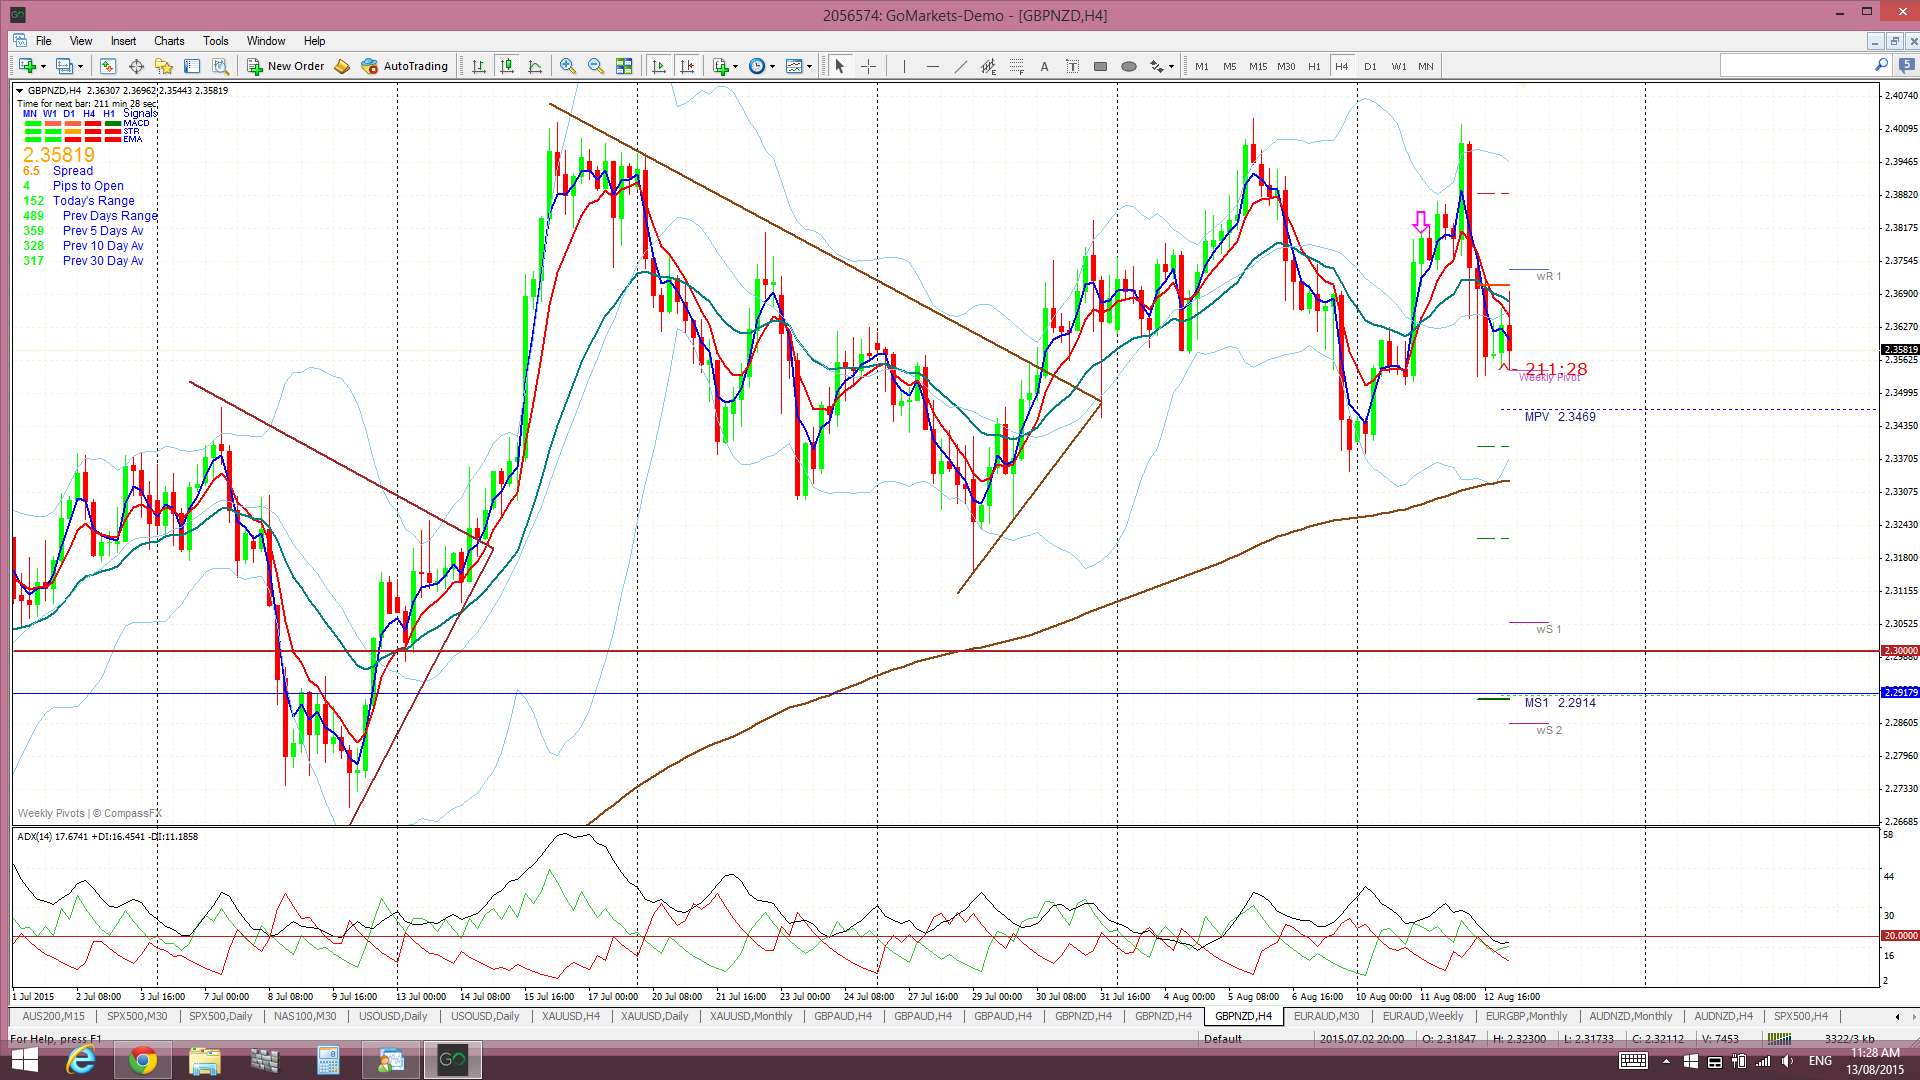
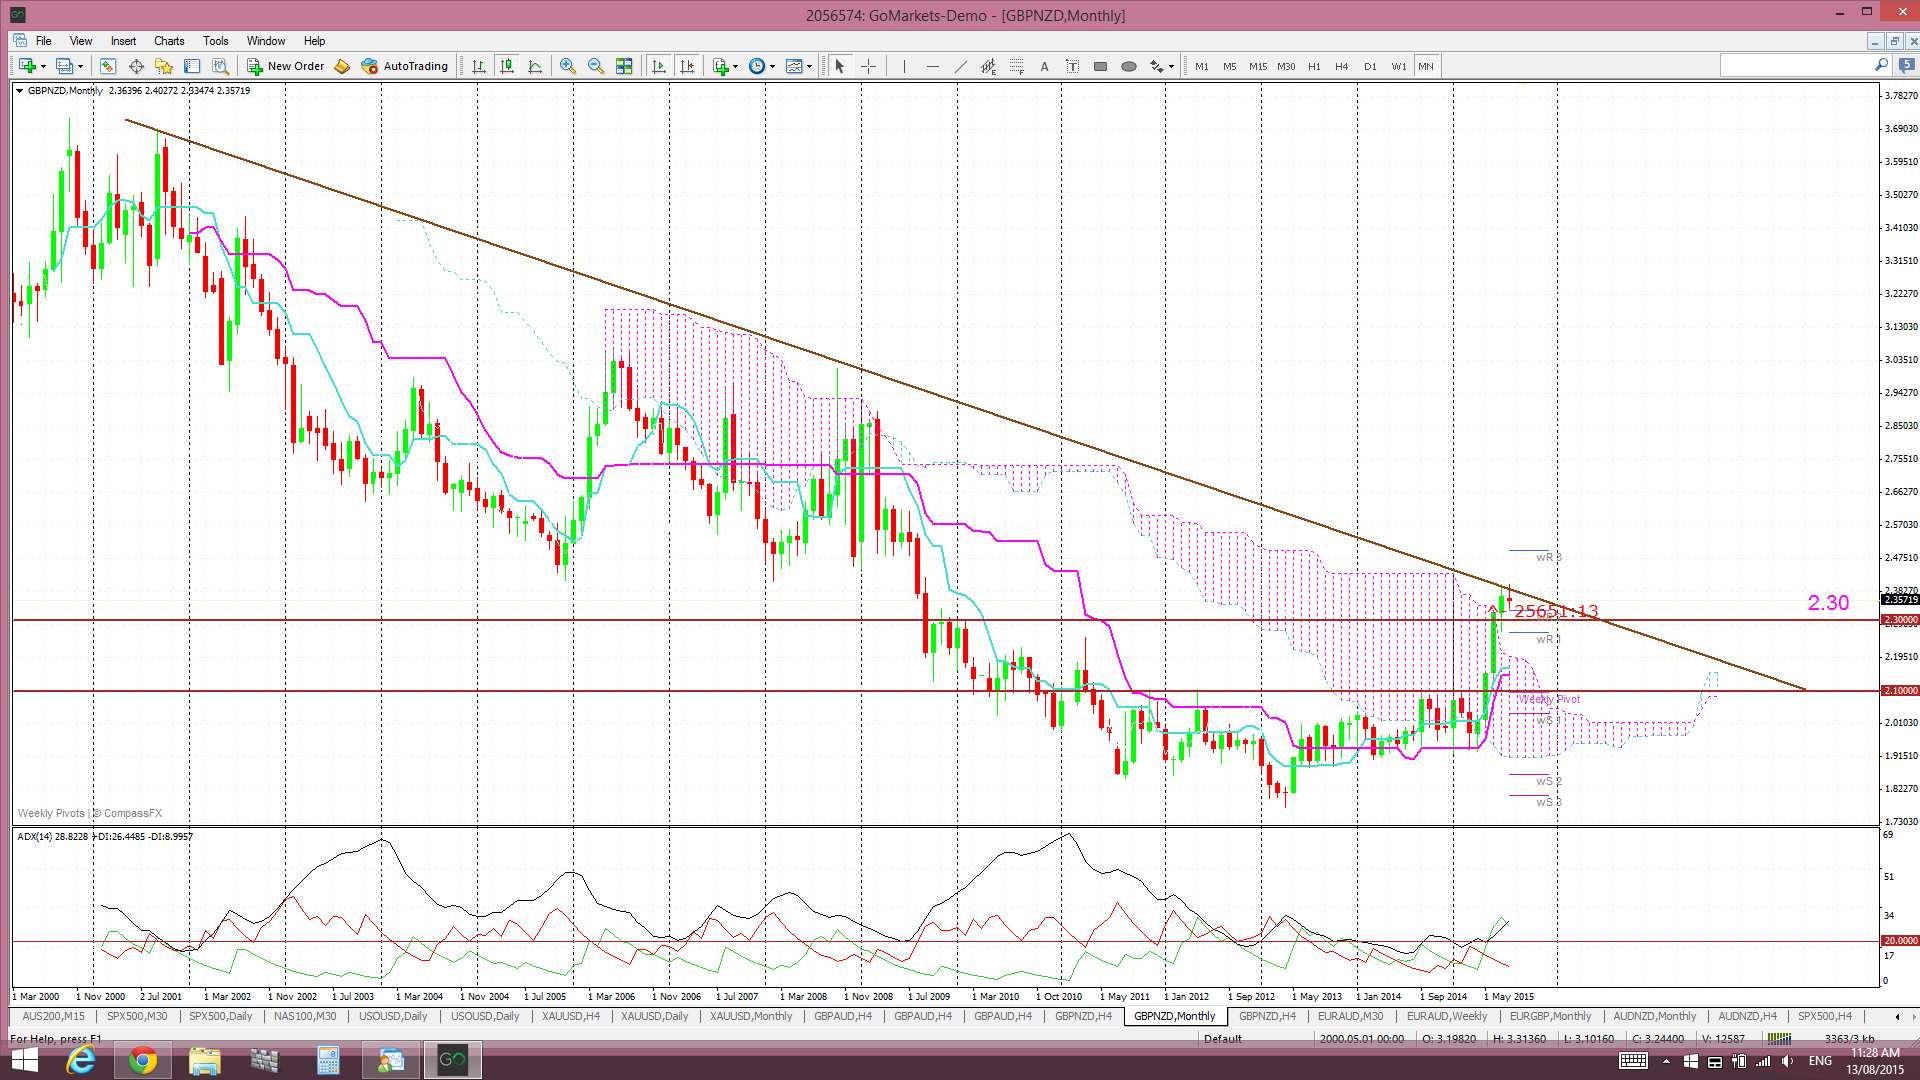
GBP/NZD: this signal closed off after over 200 pips though. Note the respect of the monthly chart’s bear trend line. I am still looking for a possible test of either 2.30 or 2.10 here as these were major trend lines that have been recently broken:
G/N 4hr:
G/N monthly:
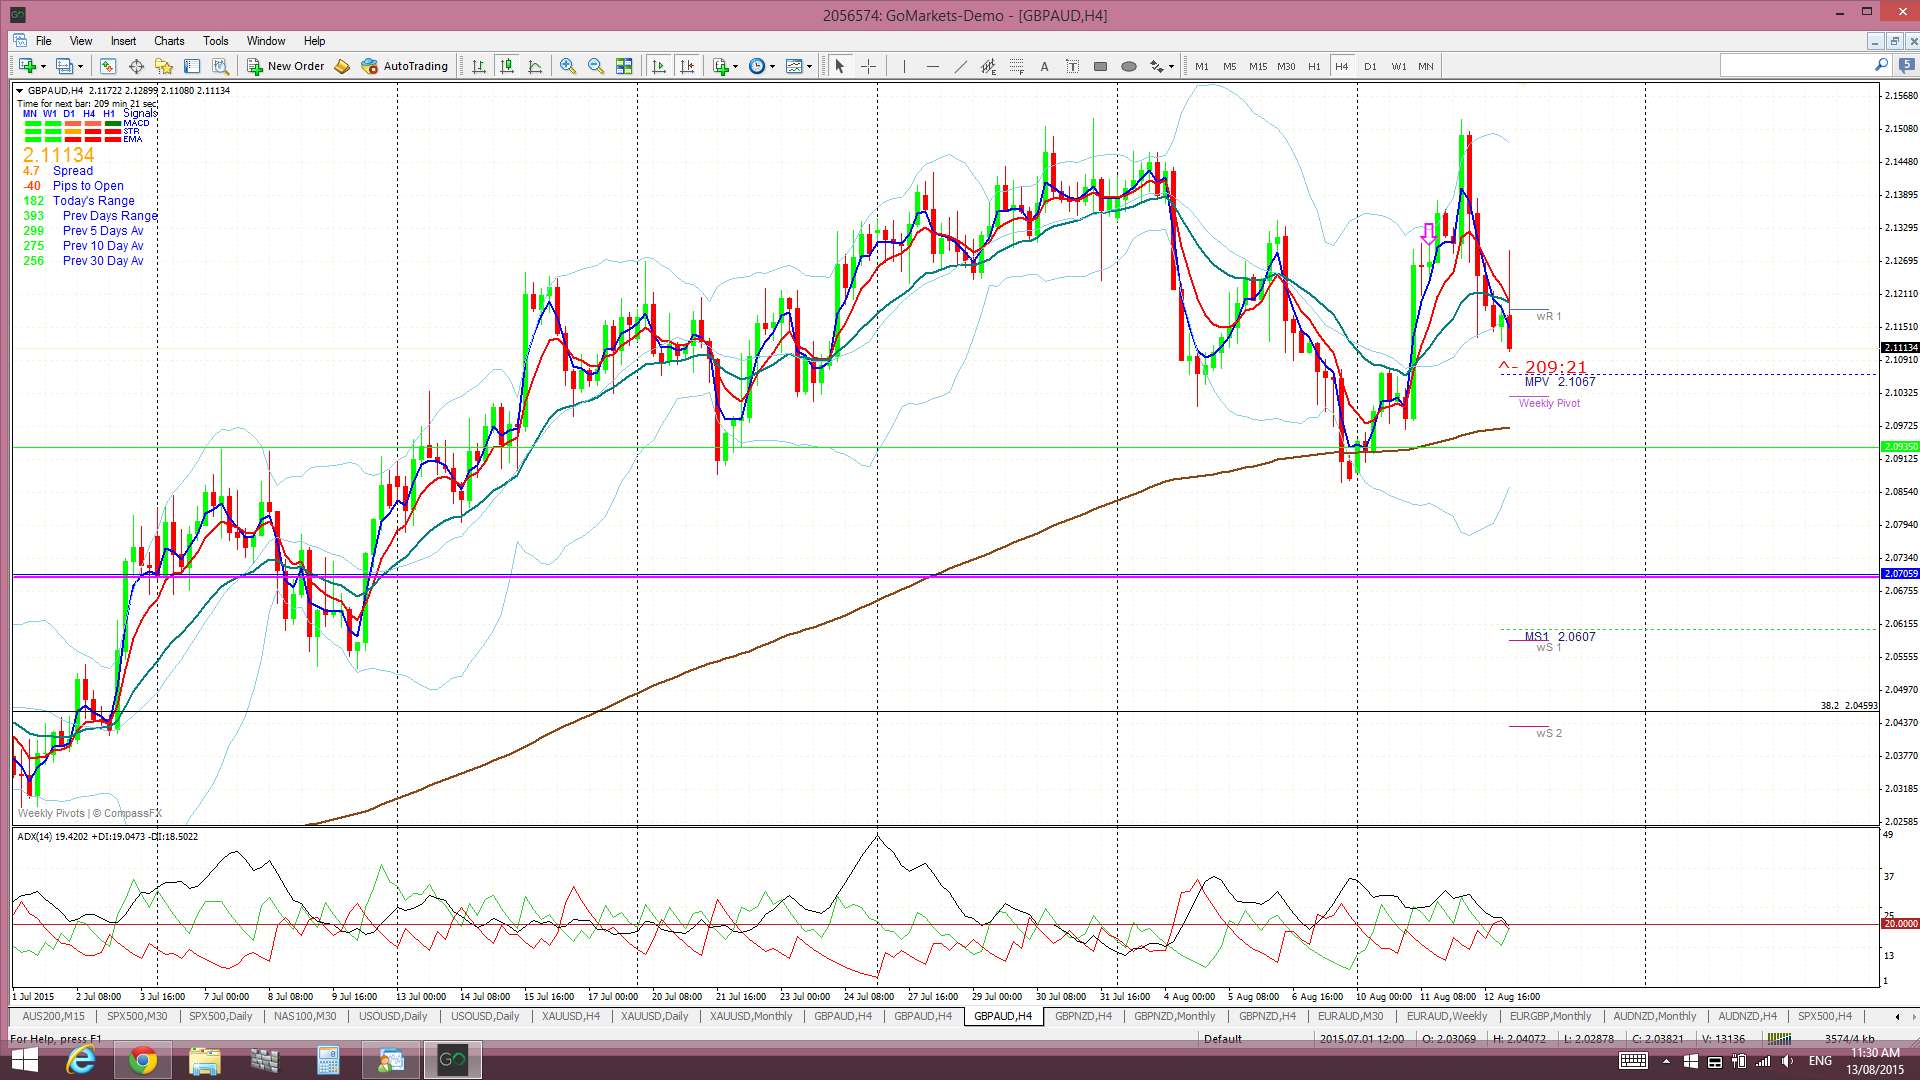
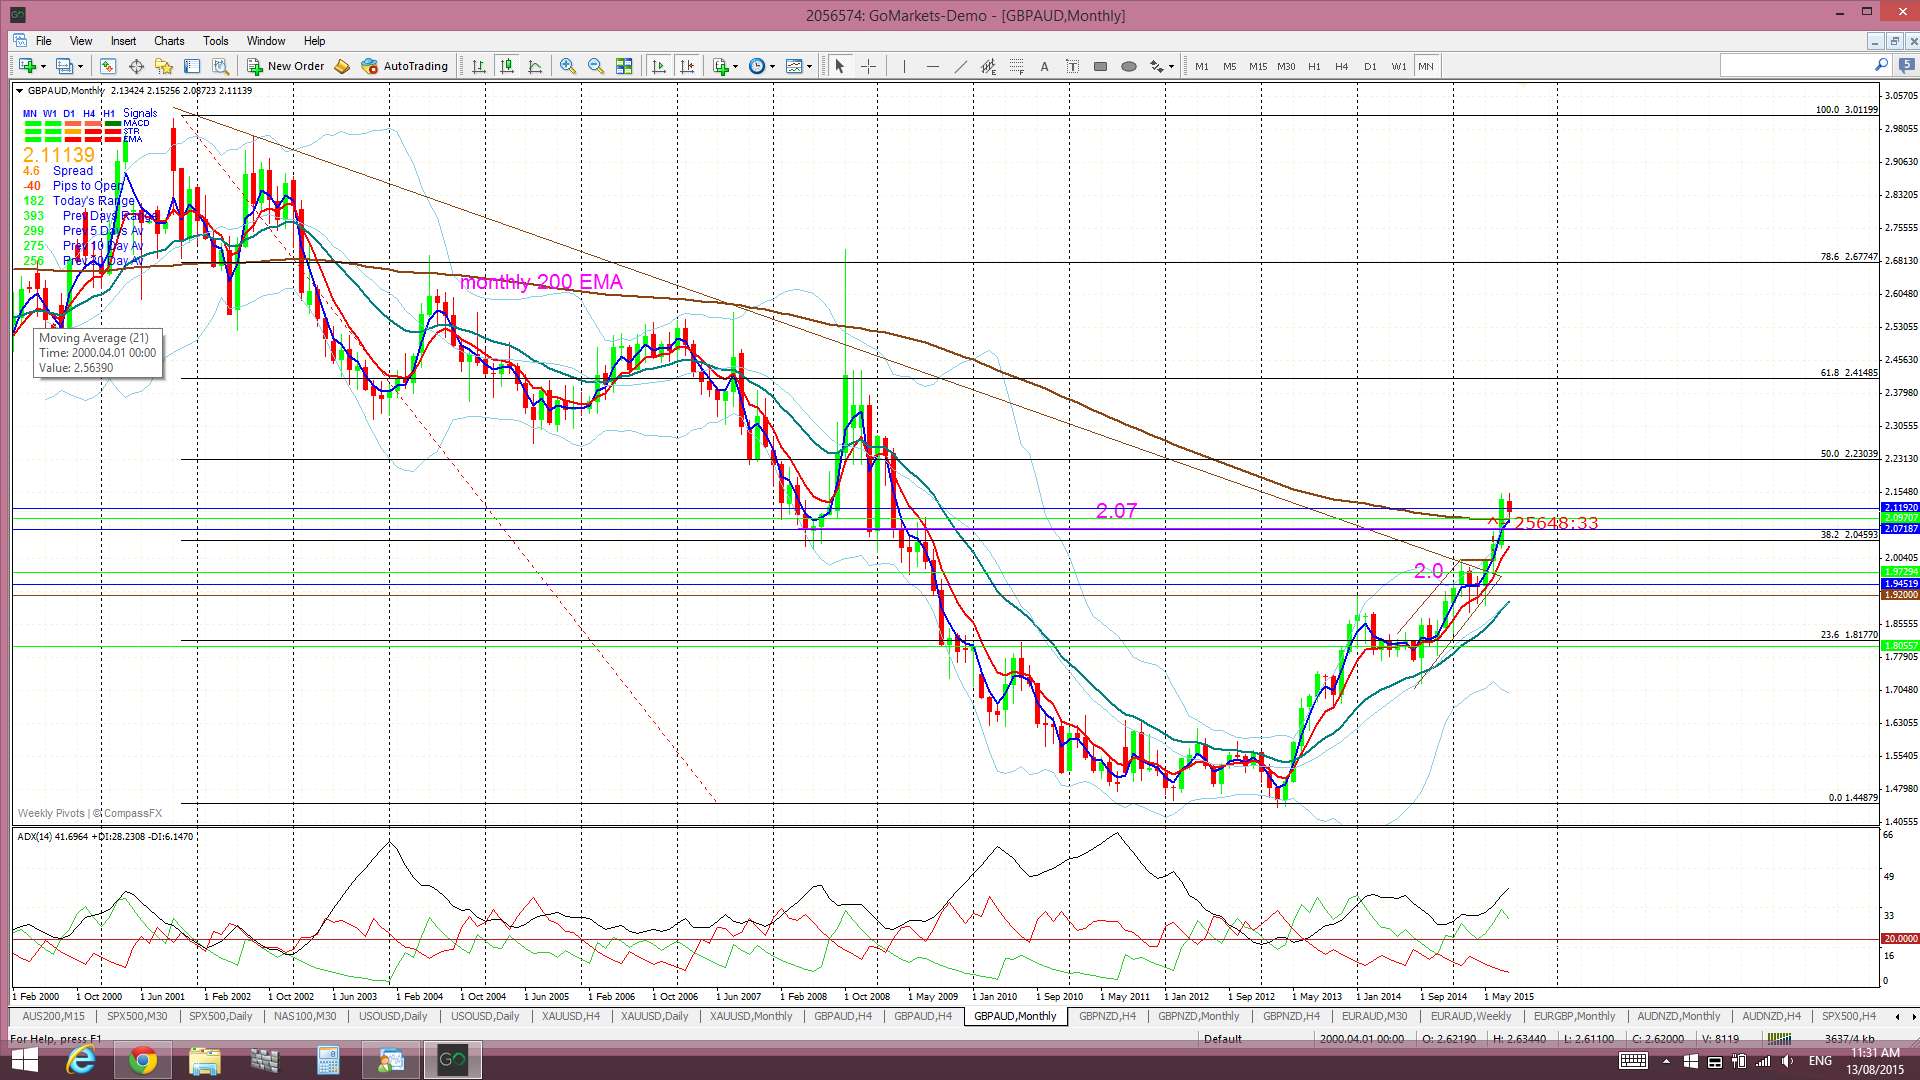
GBP/AUD: this too has pulled back. Note the monthly chart though and how a ‘Cup’ pattern can also be seen here. the 2.07 level is a major S/R zone and I continue to see potential for choppiness around this region.
G/A 4hr:
G/A monthly:
Forex:
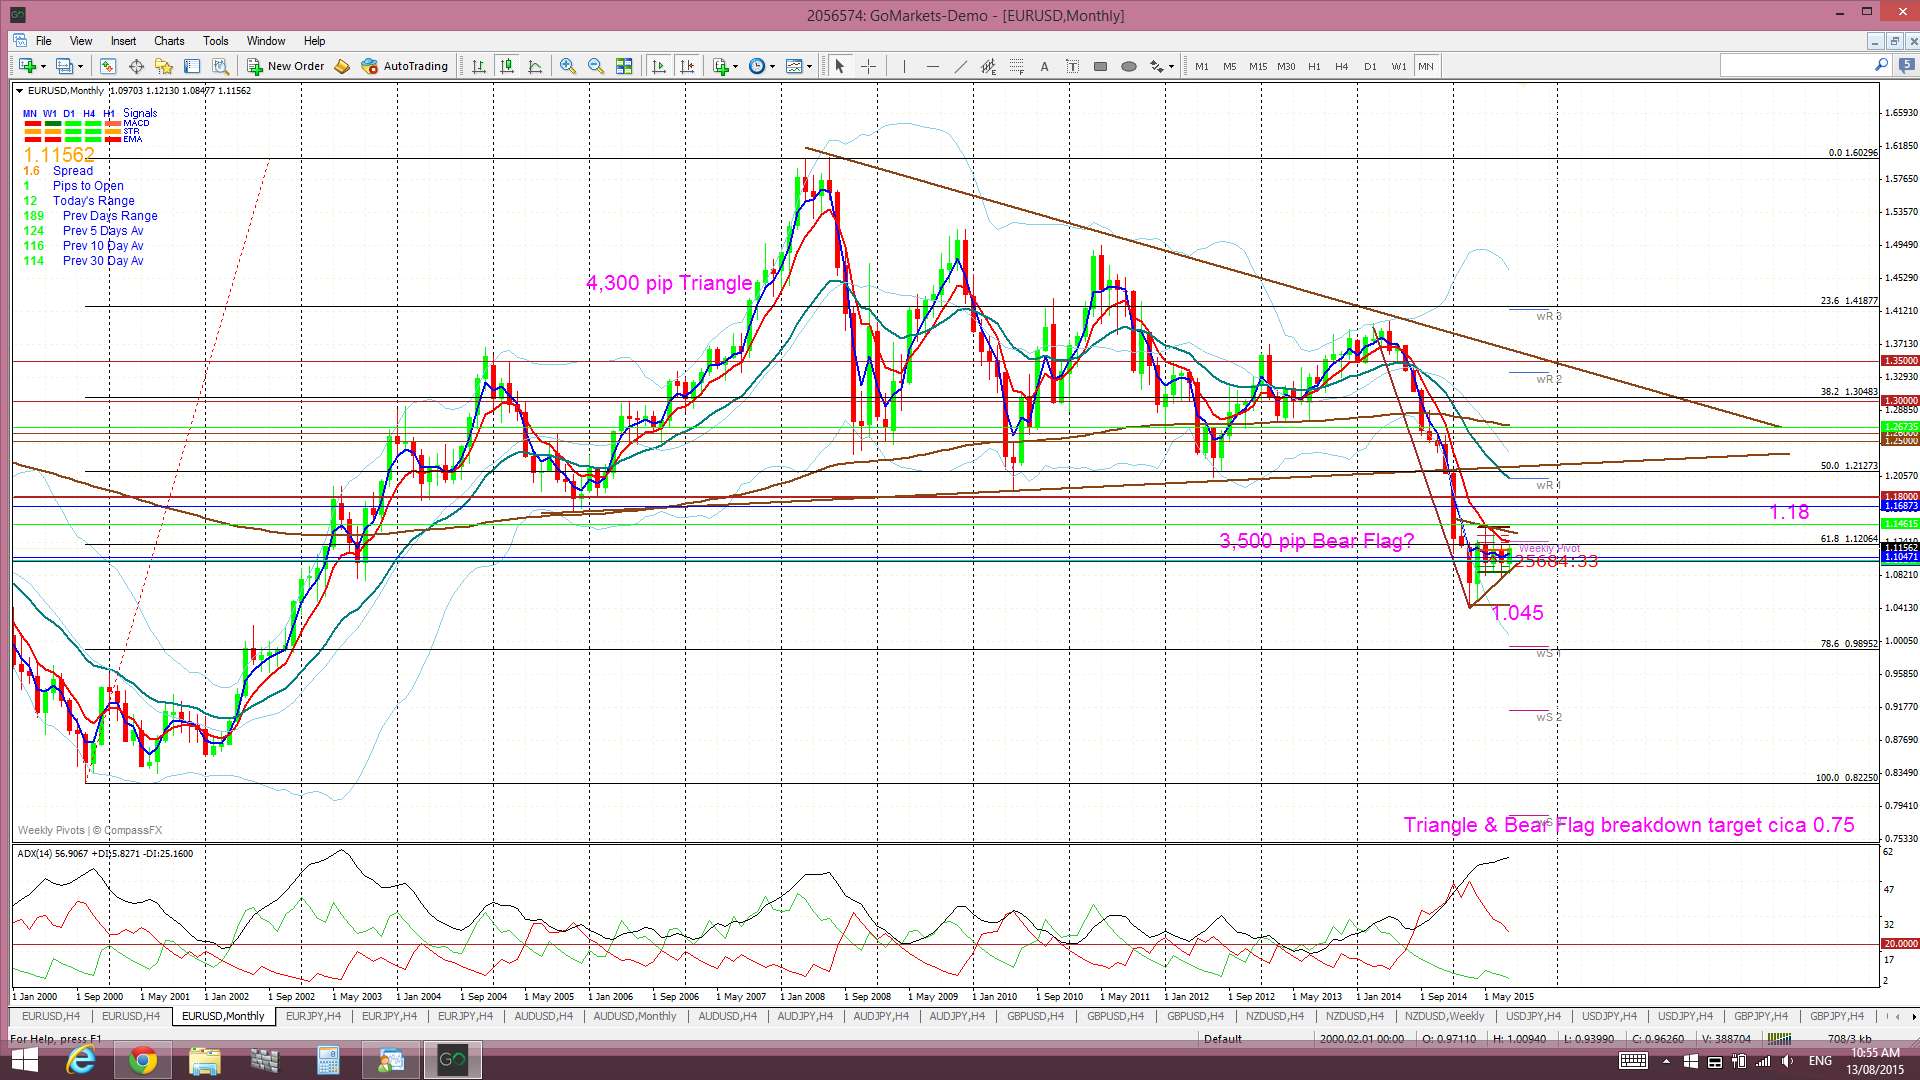
E/U: has bounced up off a weekly trend line and is now back at the junction of a major monthly-based Fibonacci level: the 61.8% retrace of the 2000-2008 swing high move. Don’t think that I’m the only person aware of this and I’d ignore it at your peril. Many traders will be looking to SHORT here as this represents a test, albeit another one, of a major broken support and these traders will be looking for bearish continuation:
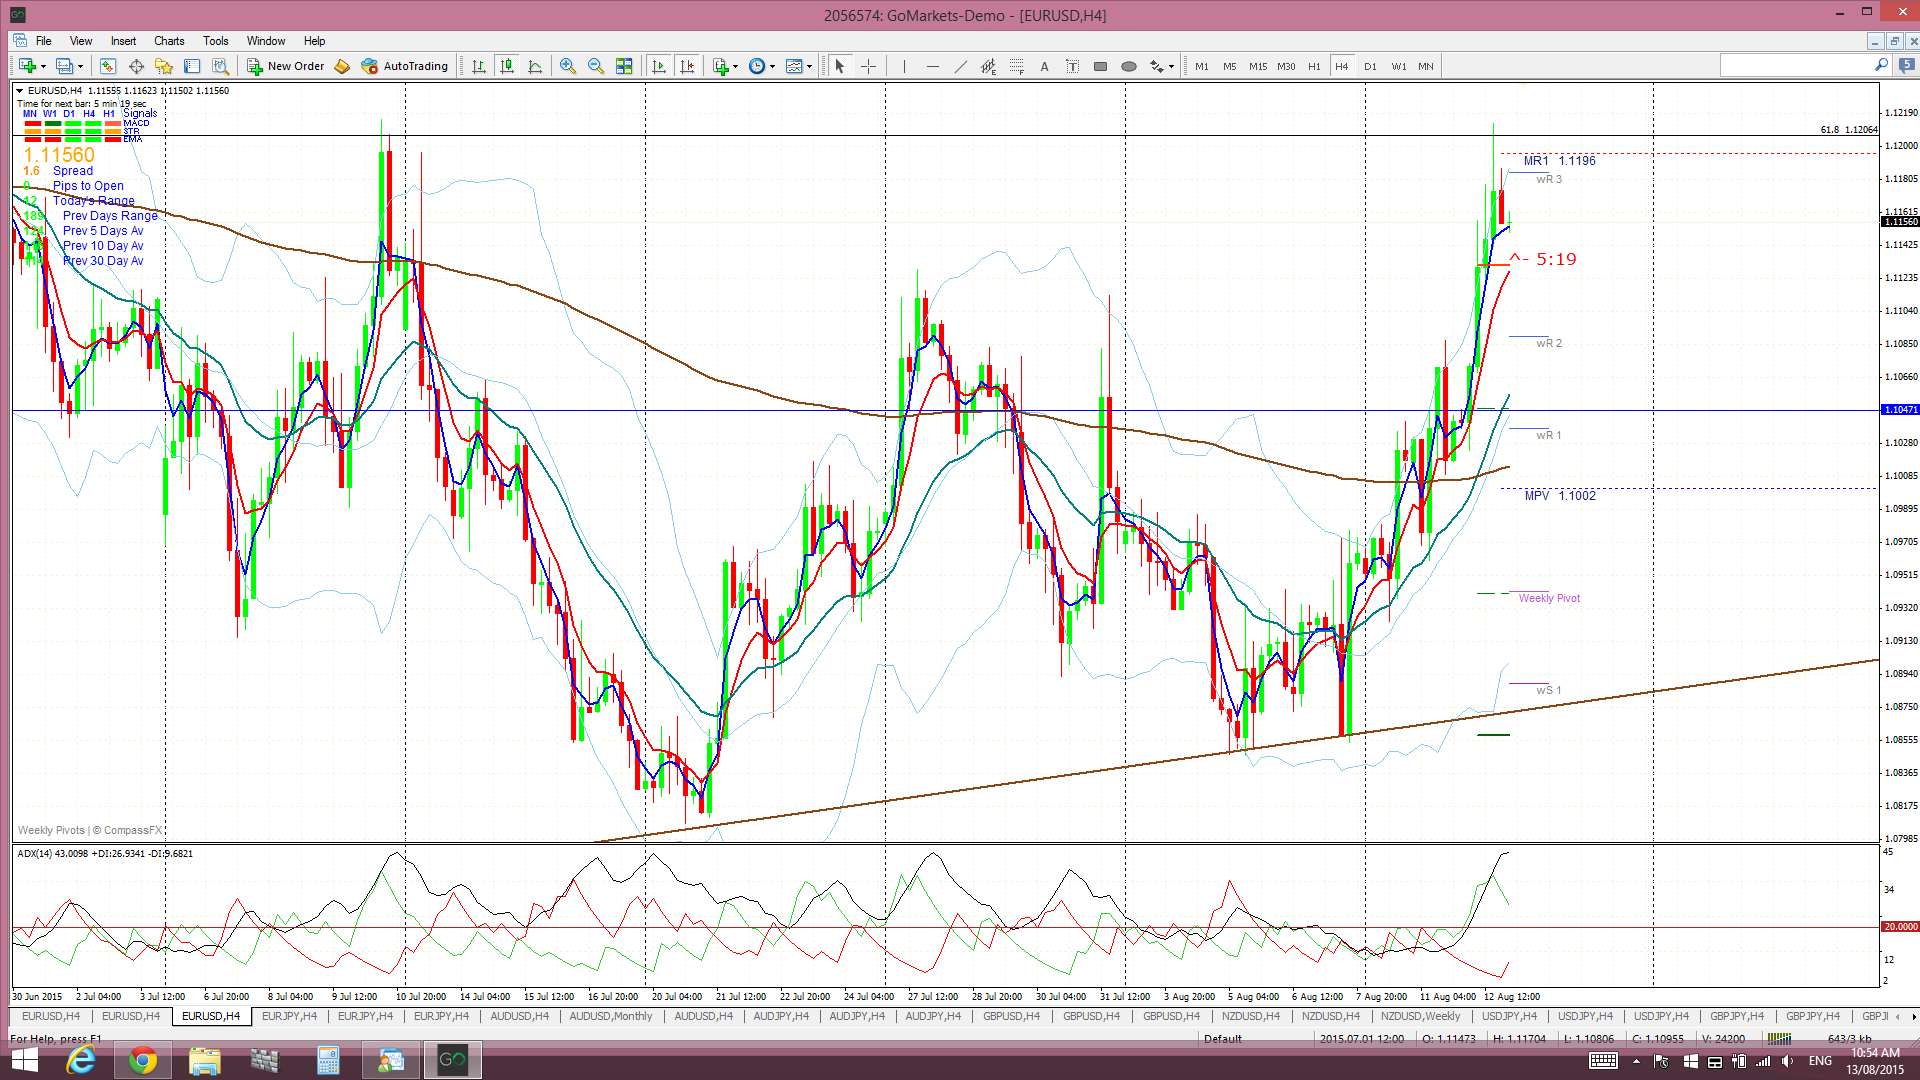
E/U 4hr: has rallied up to near the 1.12 region which is the 61.8% fib:
E/U monthly: the major Fib and S/R region has been tested again so many will be looking for bearish continuation now. However, if the US$ starts to roll over then this bearish E/U move is not guaranteed:
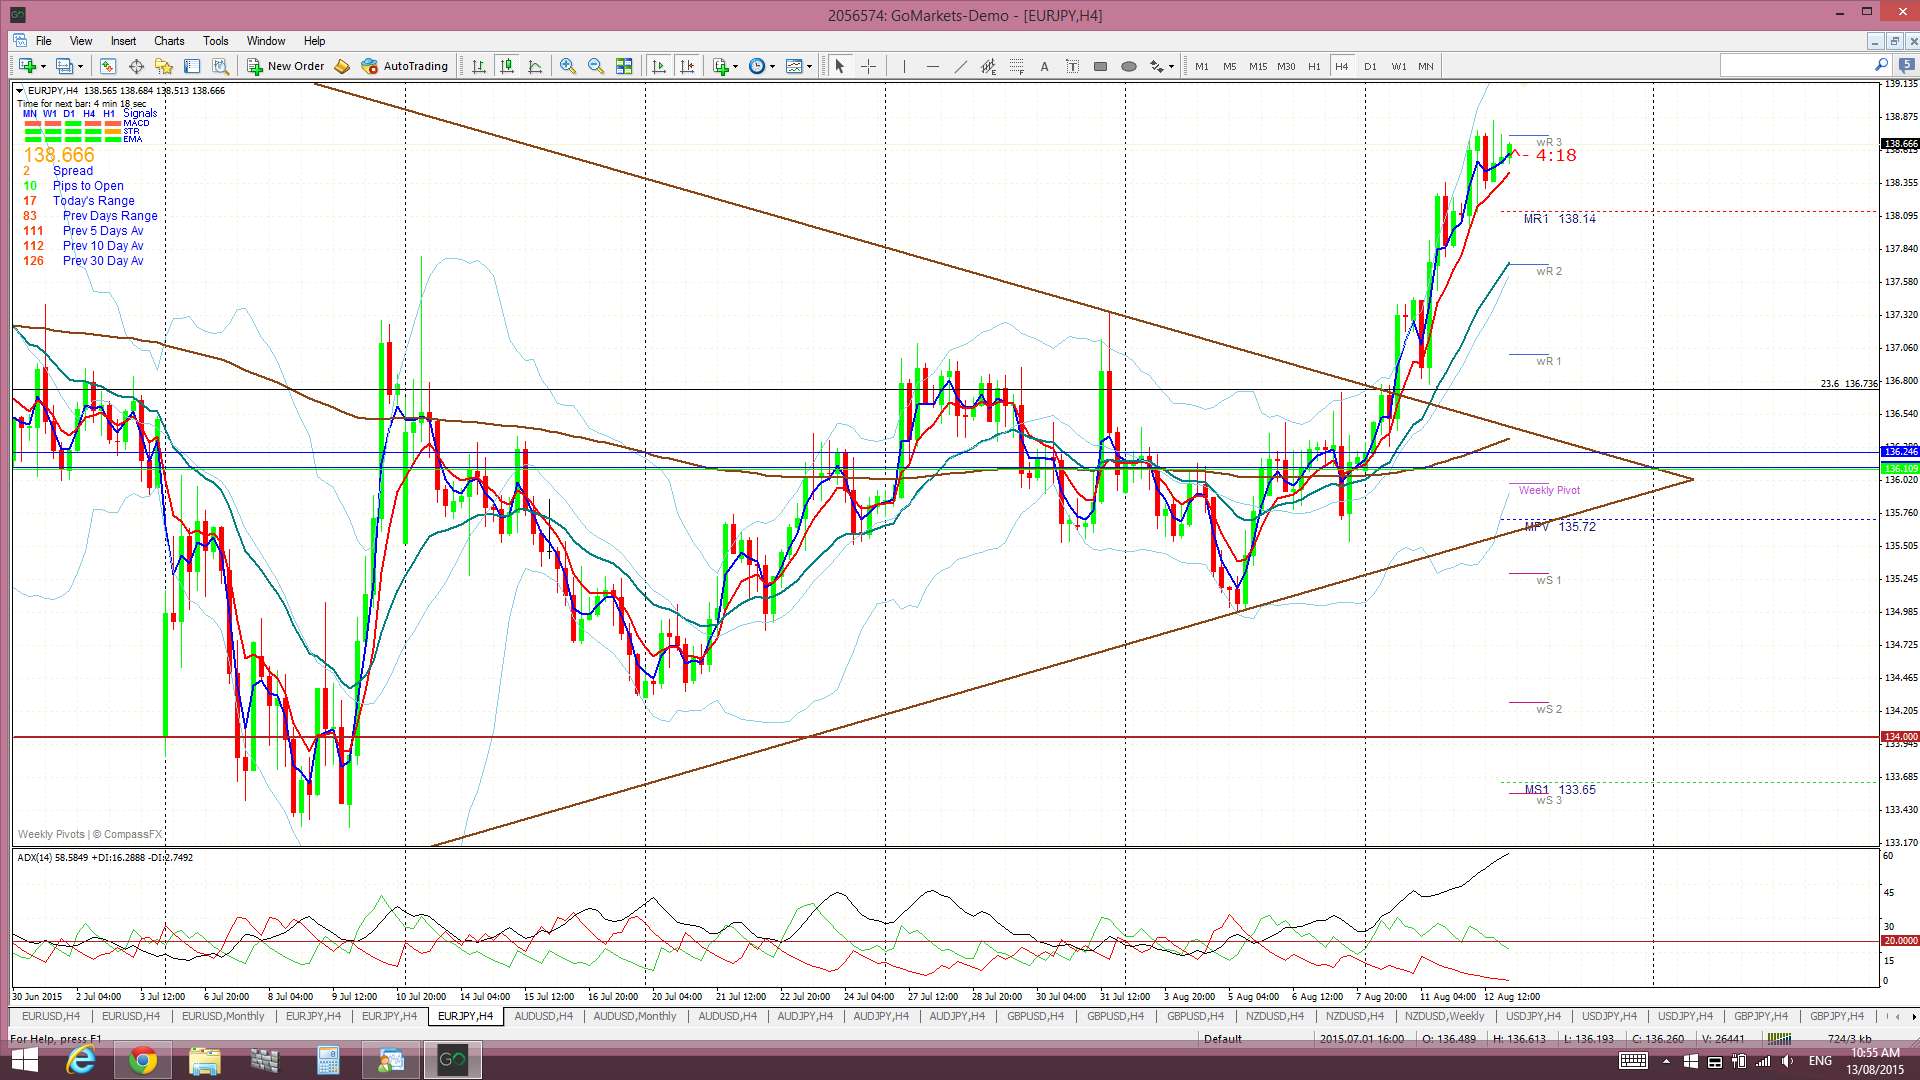
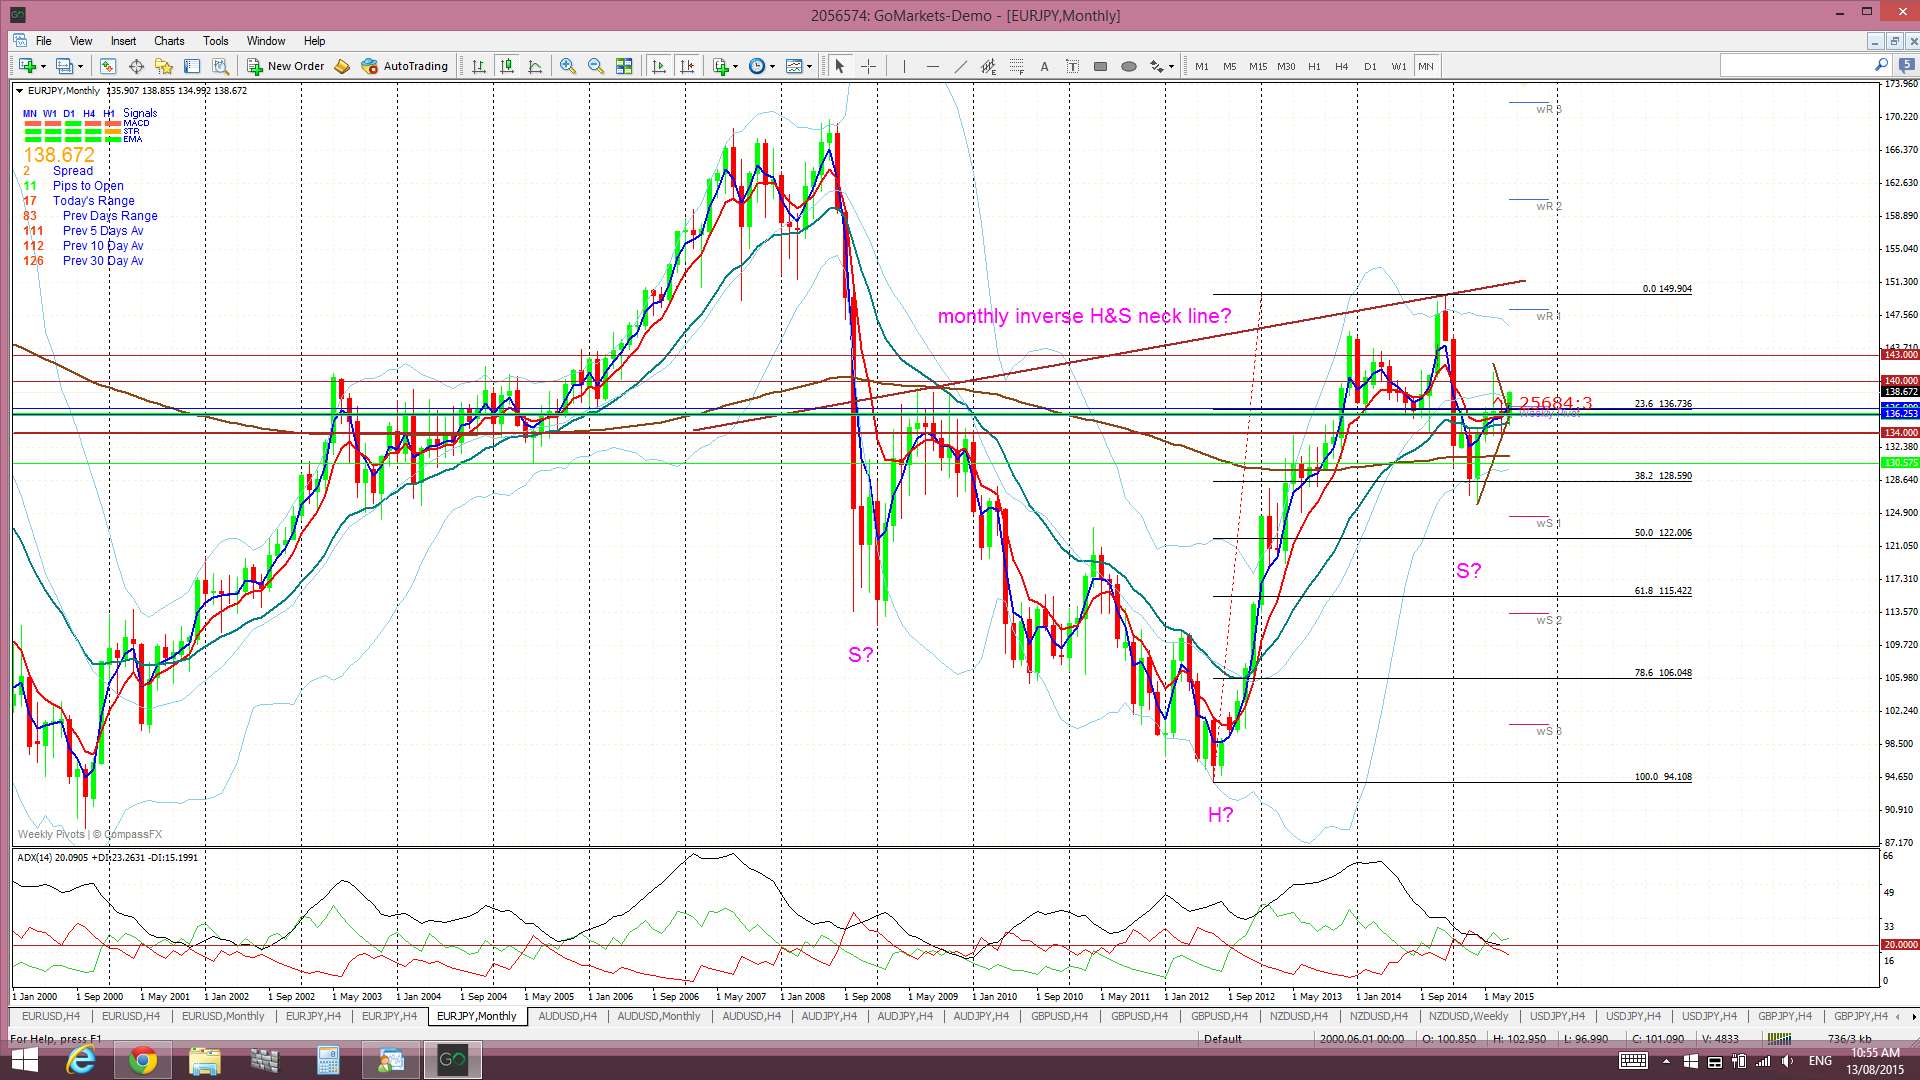
E/J: the triangle breakout has continued and remember I’m seeing a bullish pattern on the monthly chart:
E/J 4hr:
E/J monthly:
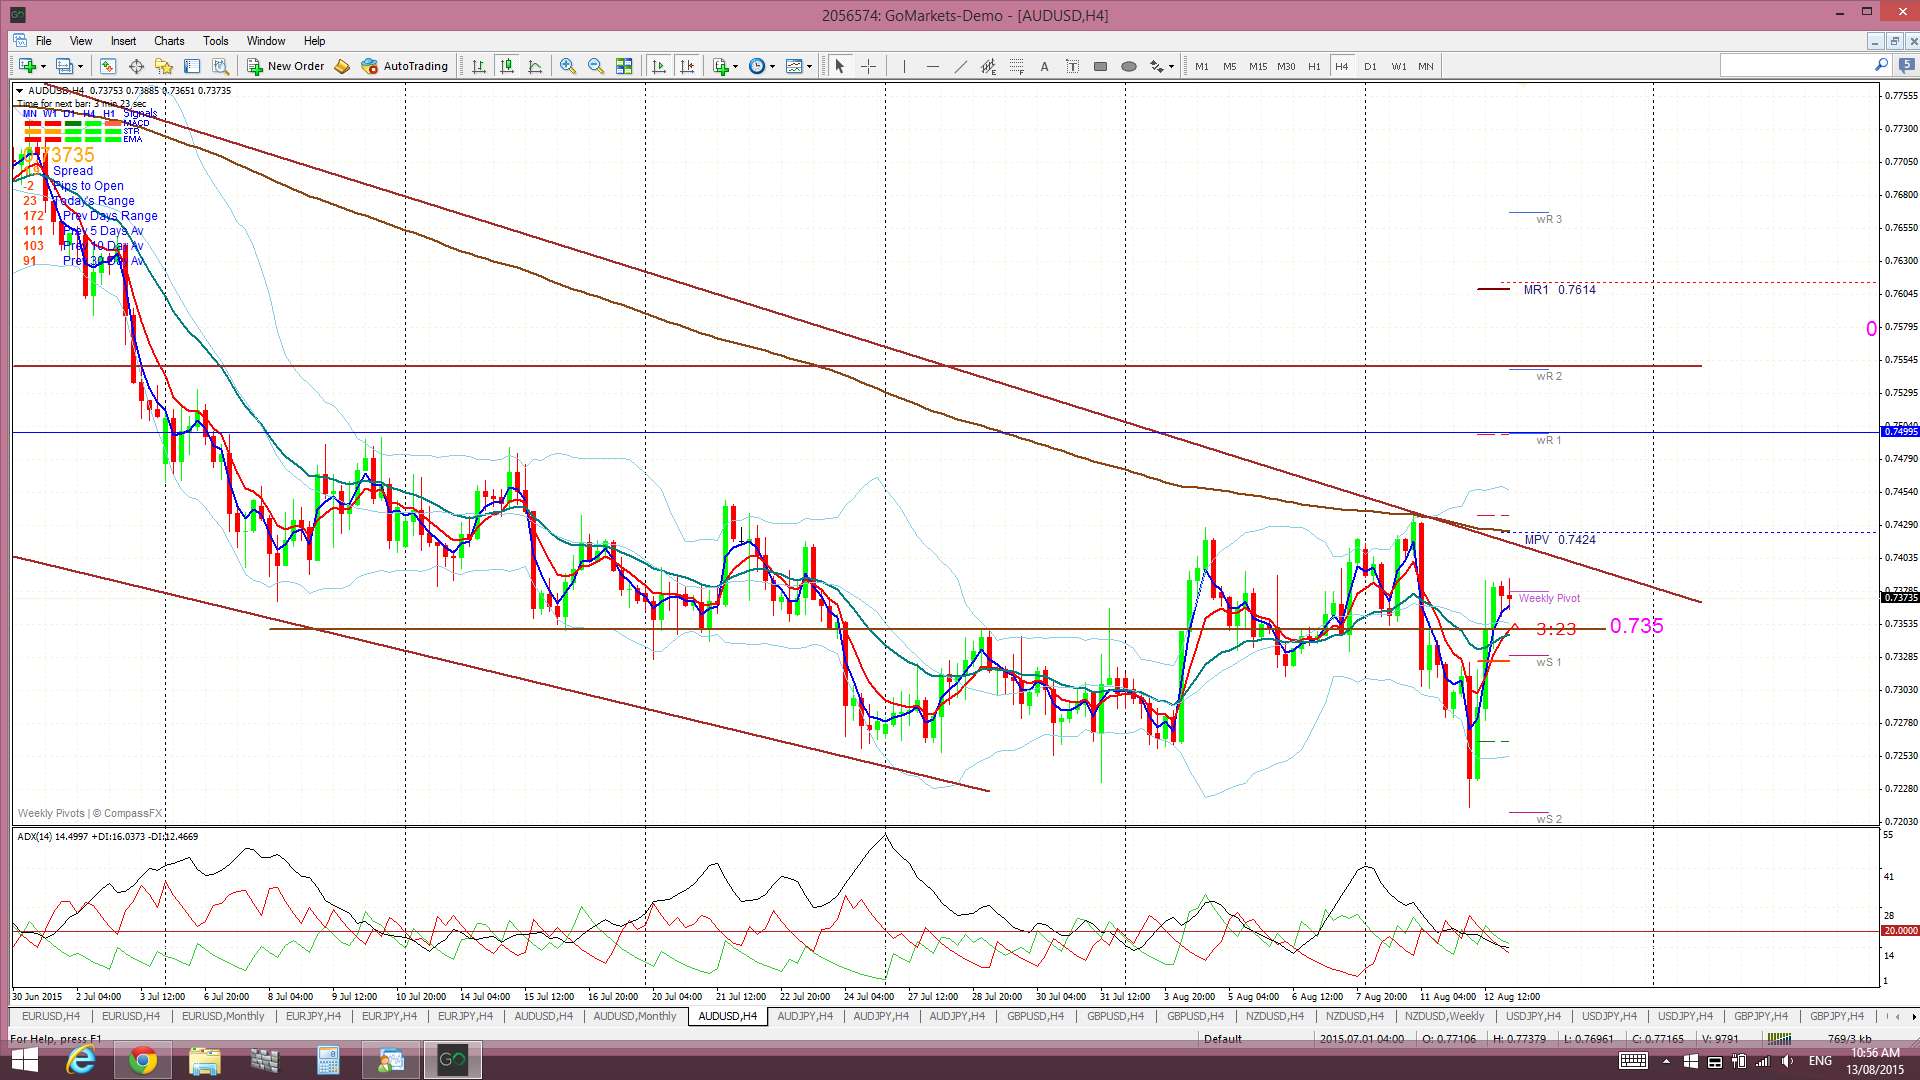
A/U: this continues to chop around the 0.735 region and, hey, Henny Penny…the sky hasn’t fallen in! If this pair is going to bounce at all then this seems to be the best place to attempt it. There are three zones of support below current price that and these are best seen on the monthly chart:
A/U 4hr:
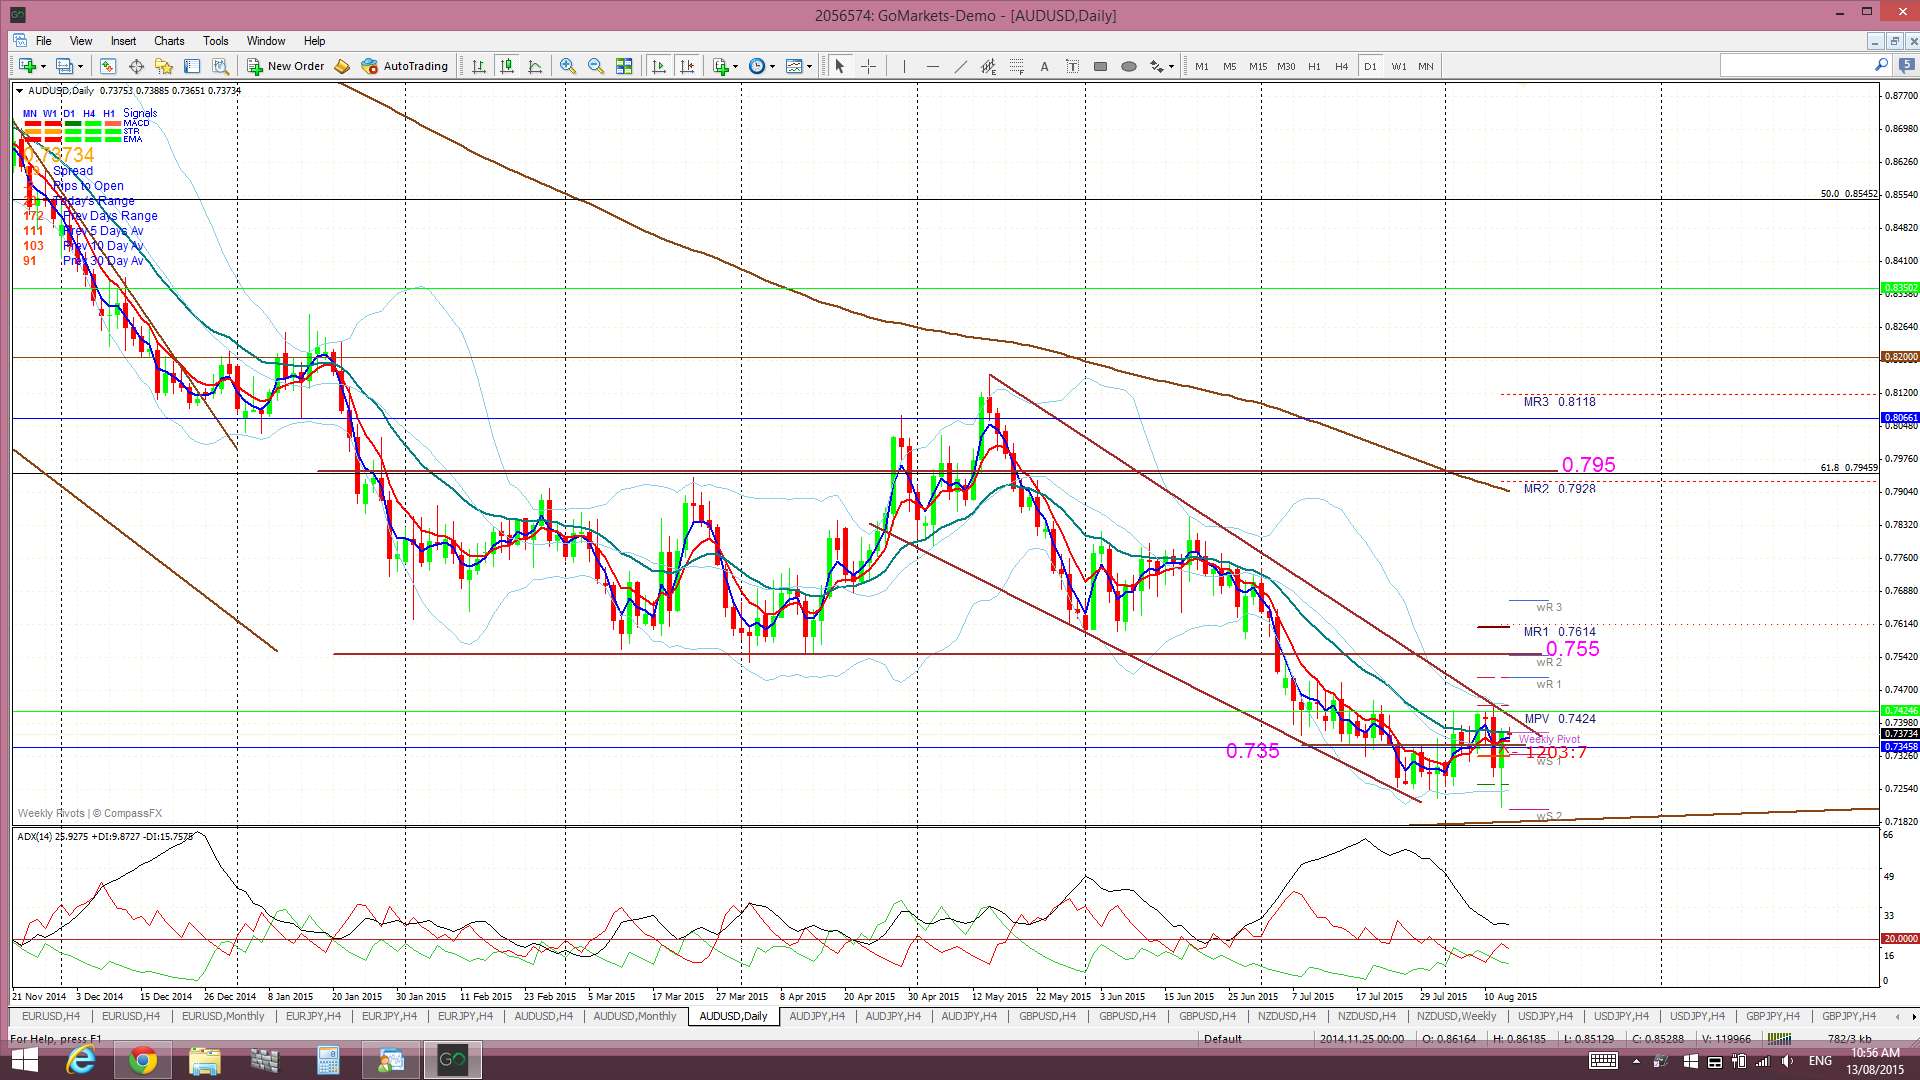
A/U daily: note the amended trend line:
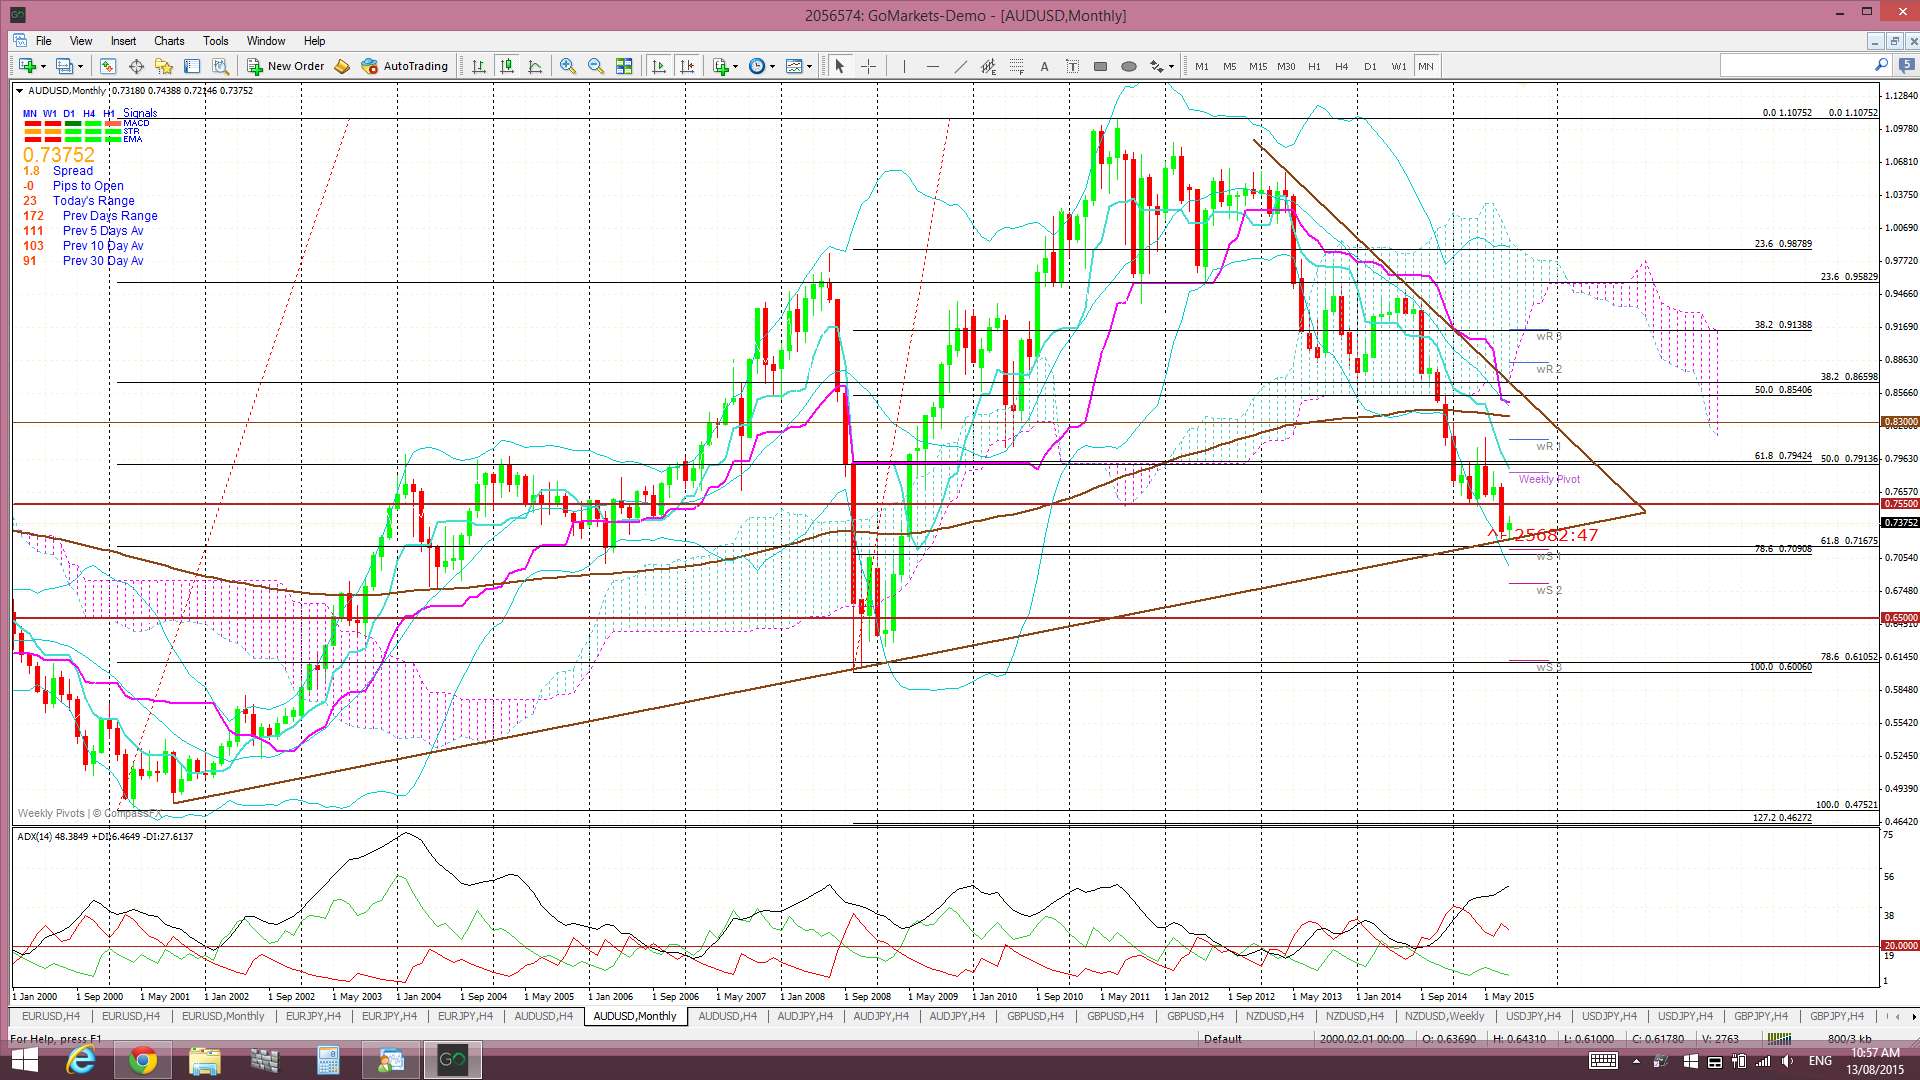
A/U monthly: note the trend line and two Fib regions of support. However, any break of these 3 support levels would have to bring 0.65 into focus:
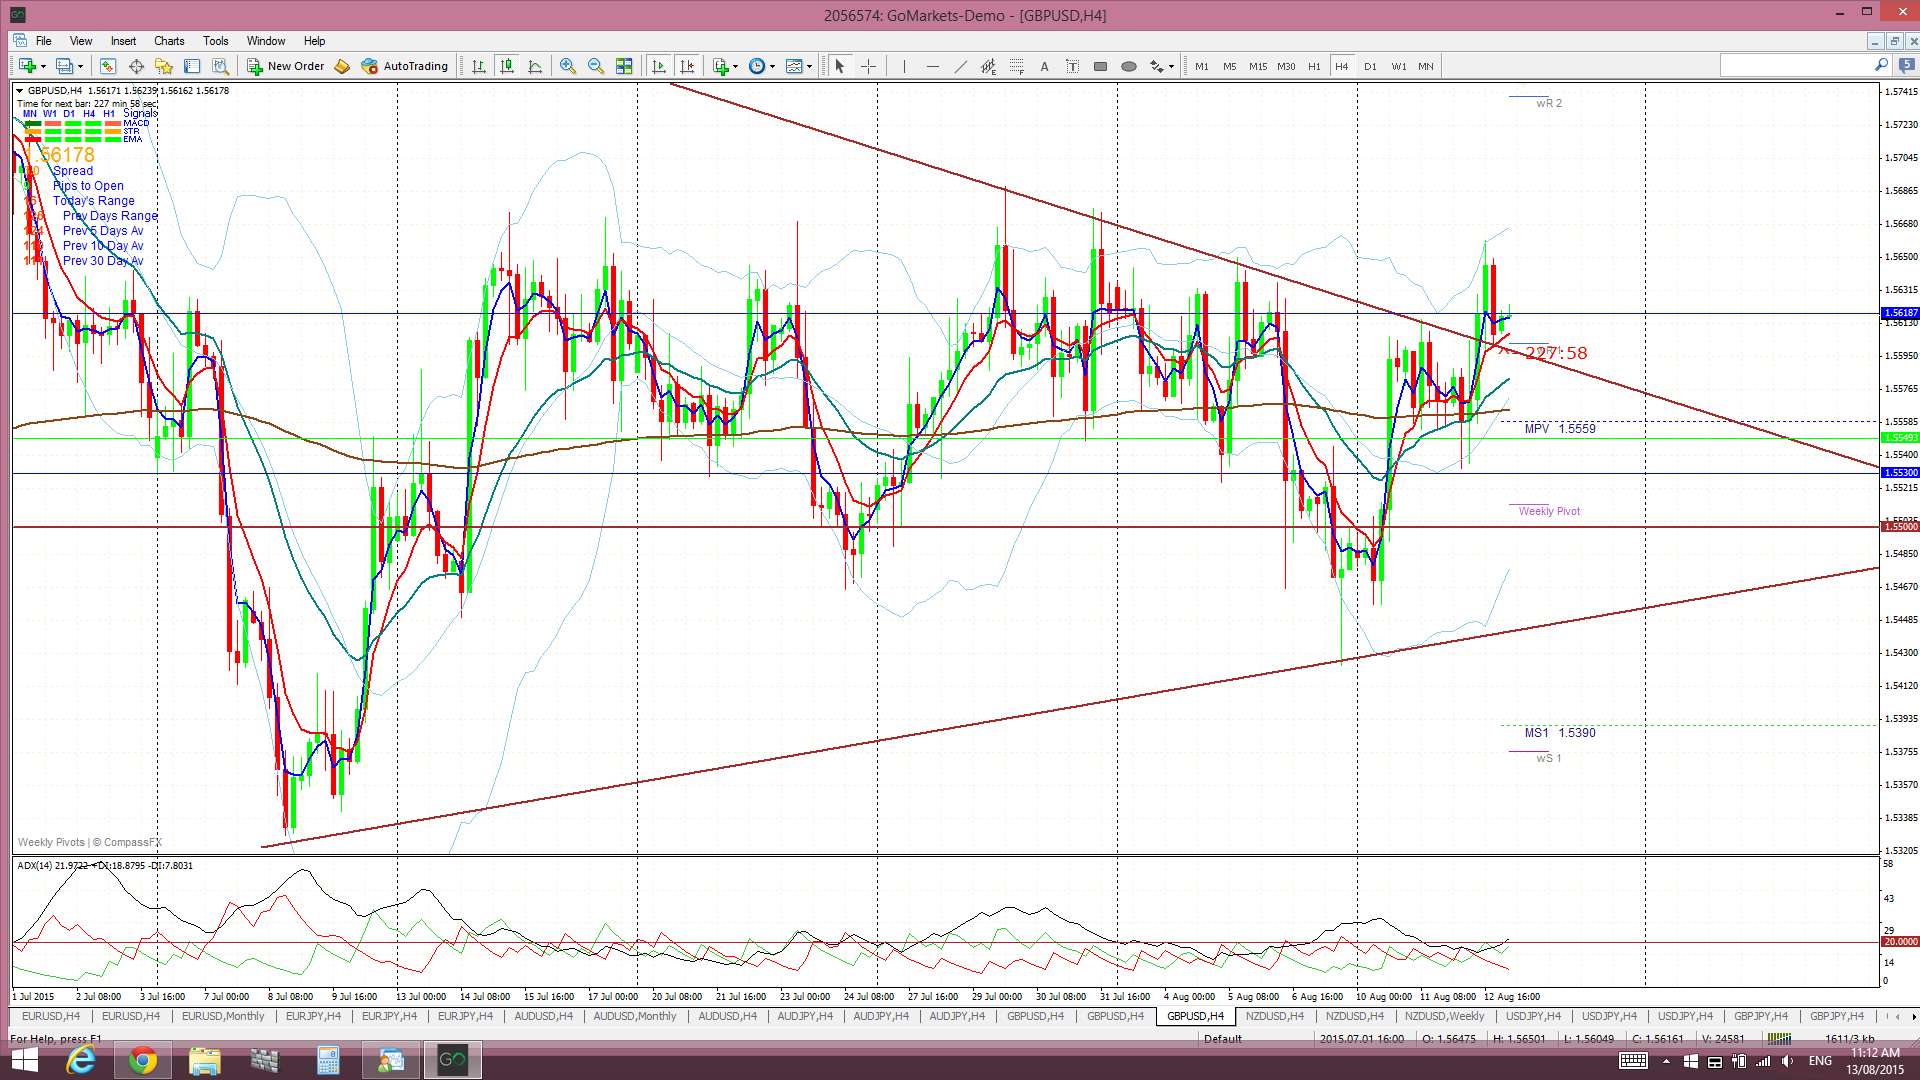
Cable 4hr: this is a bit tricky. We’ve had a triangle breakout but momentum, whilst picking up, is a bit slow. This could be a breakout and test of trend line before bullish continuation. The GBP would have to be getting more upbeat about its prospects in the global currency scheme of things:
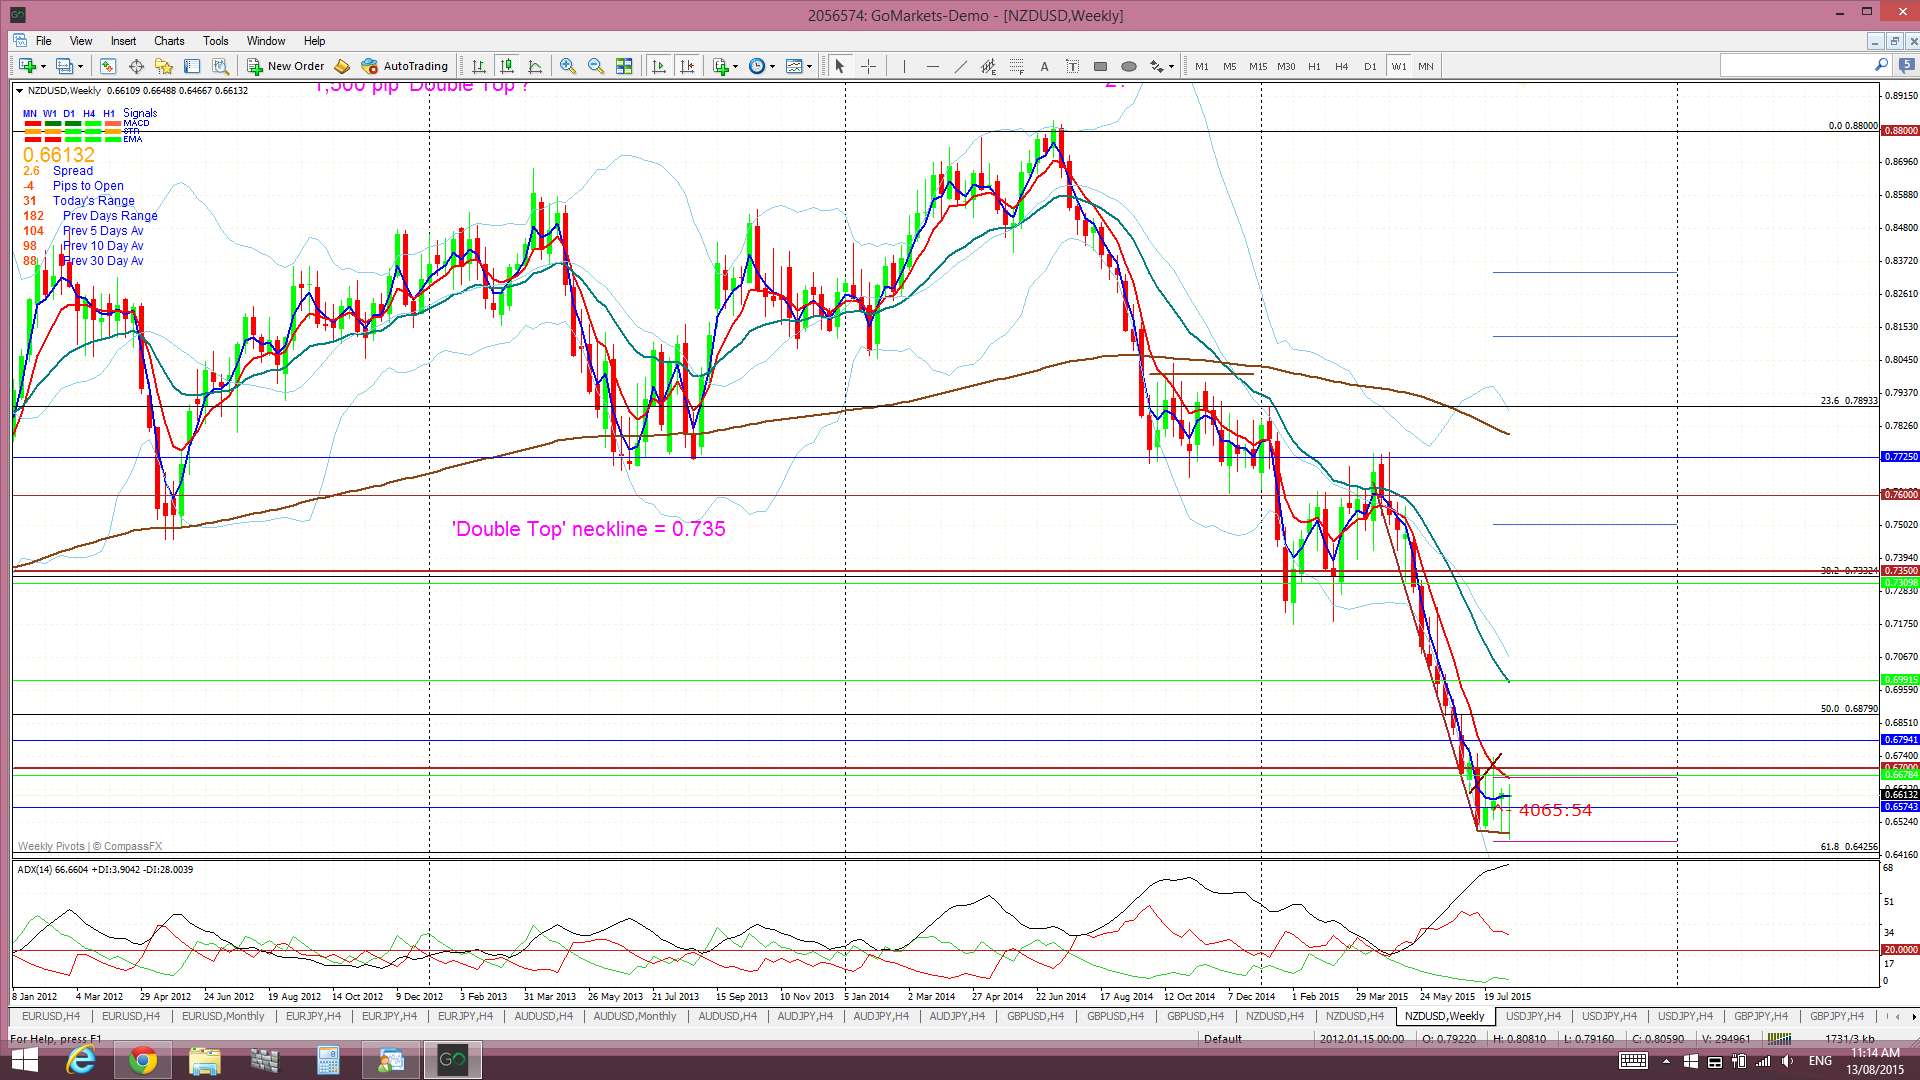
Kiwi weekly: this chart sums things up here for the Kiwi…choppy and indecisive action.
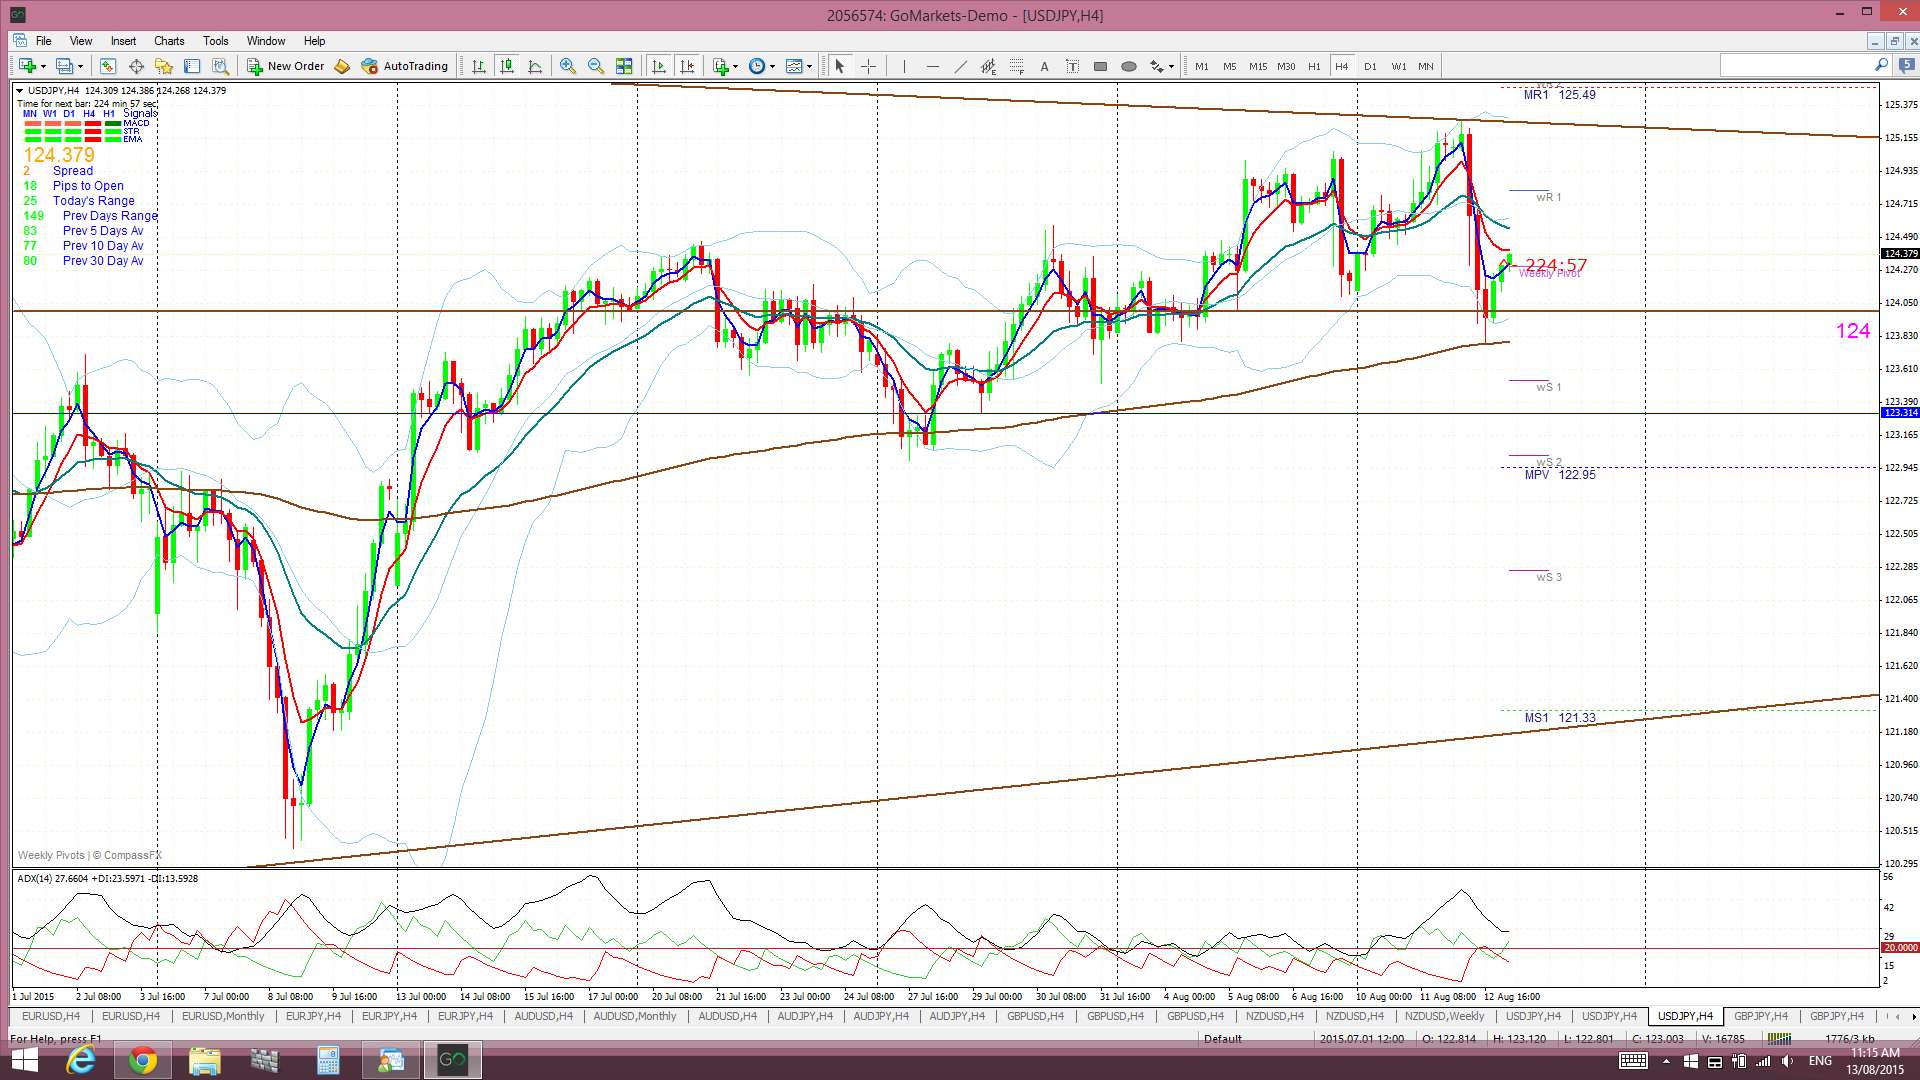
U/J 4hr: so much for any triangle breakout…price has once again tested the key 124 level. Remember…I am on the lookout for ongoing choppiness around 124 here to add a potential ‘Handle’ to a ‘Cup’ pattern:
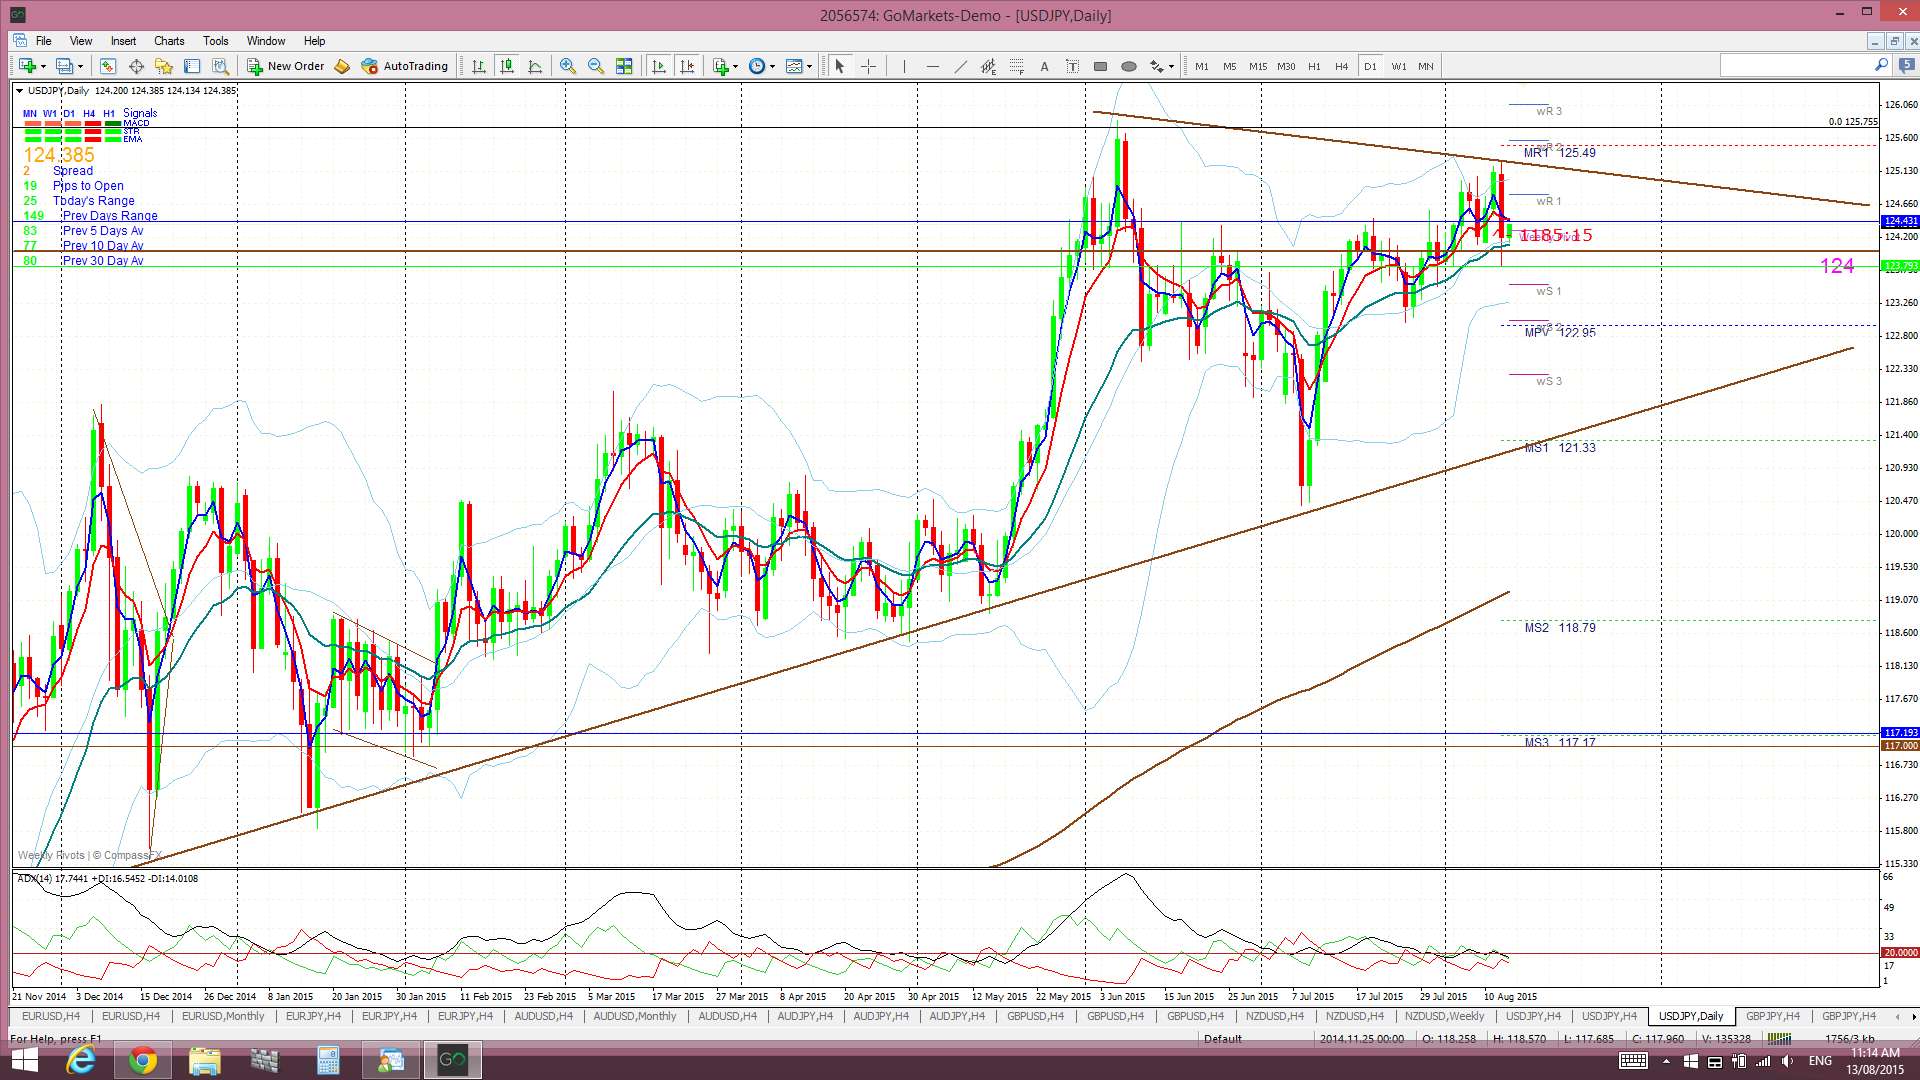
U/J daily: trend lines relaxed once again:
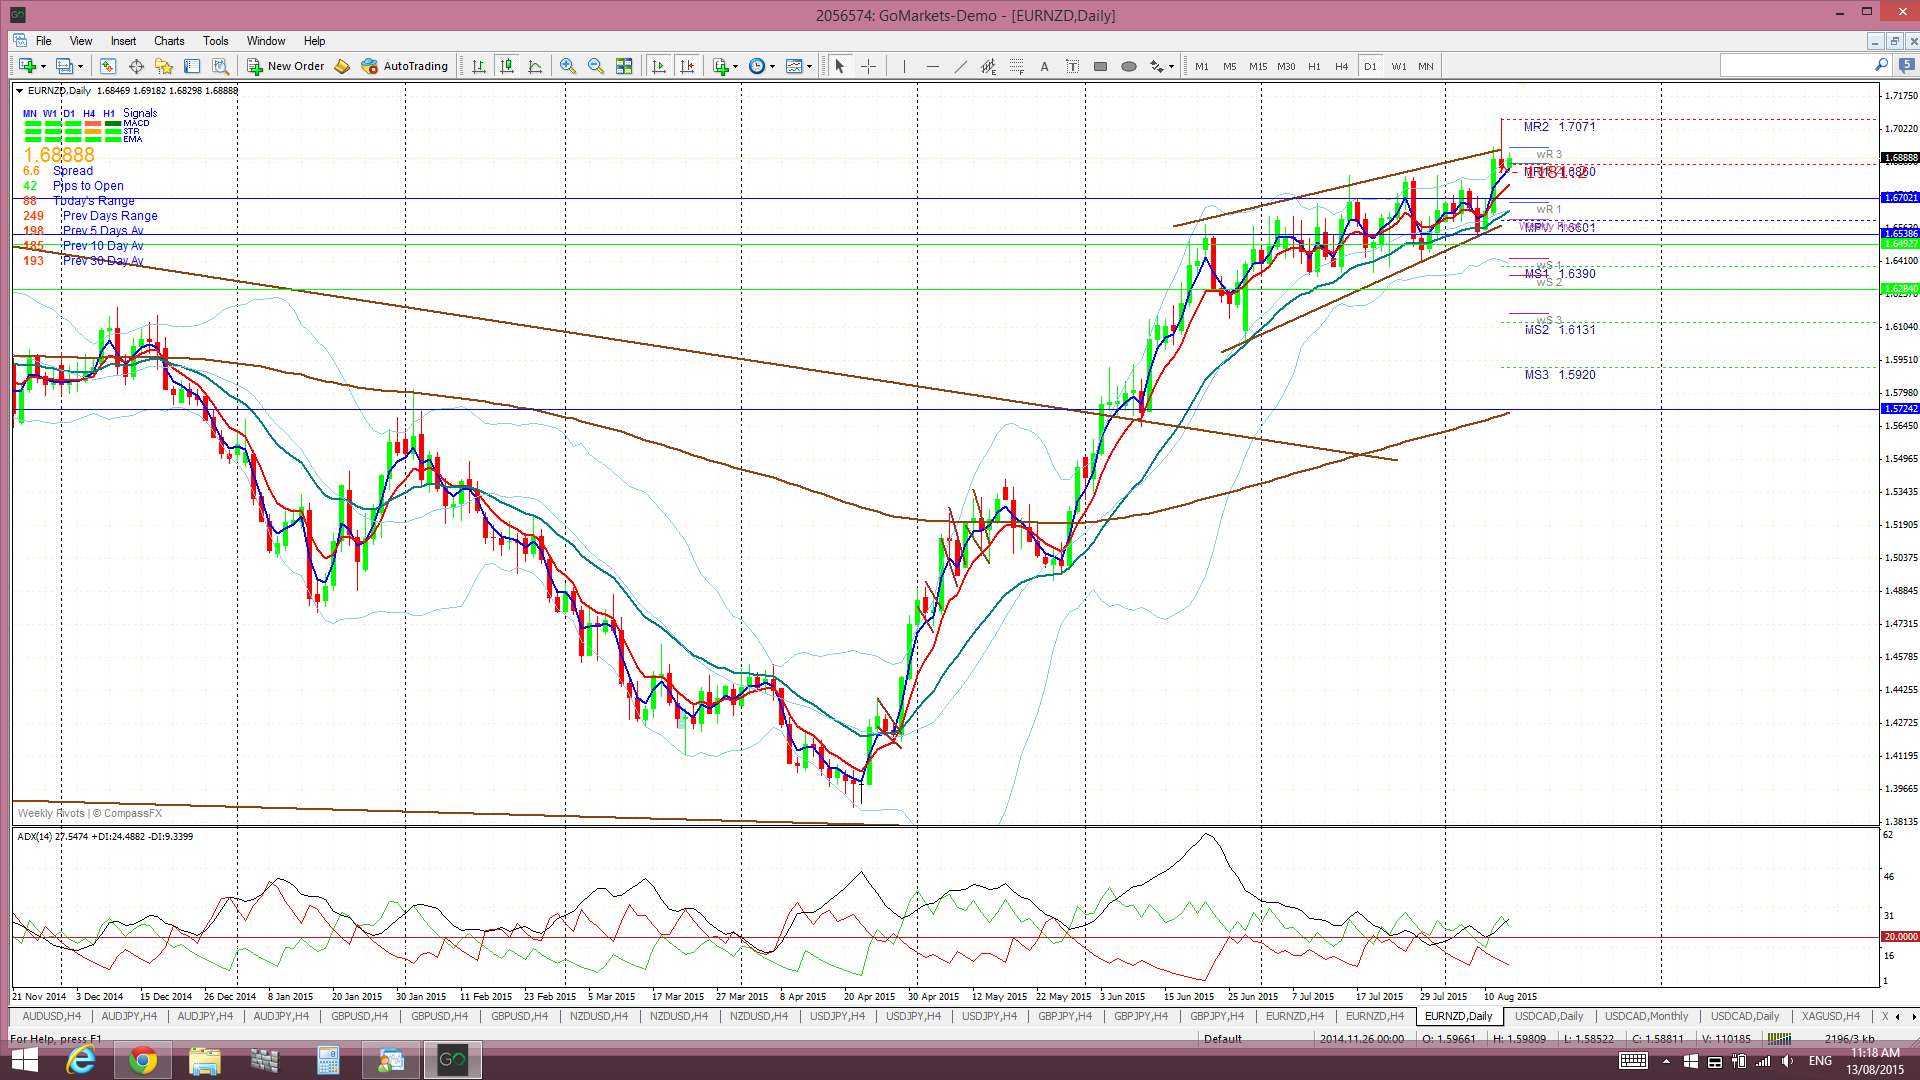
EUR/NZD daily: price retreated here and note how it is conforming to a daily channel:
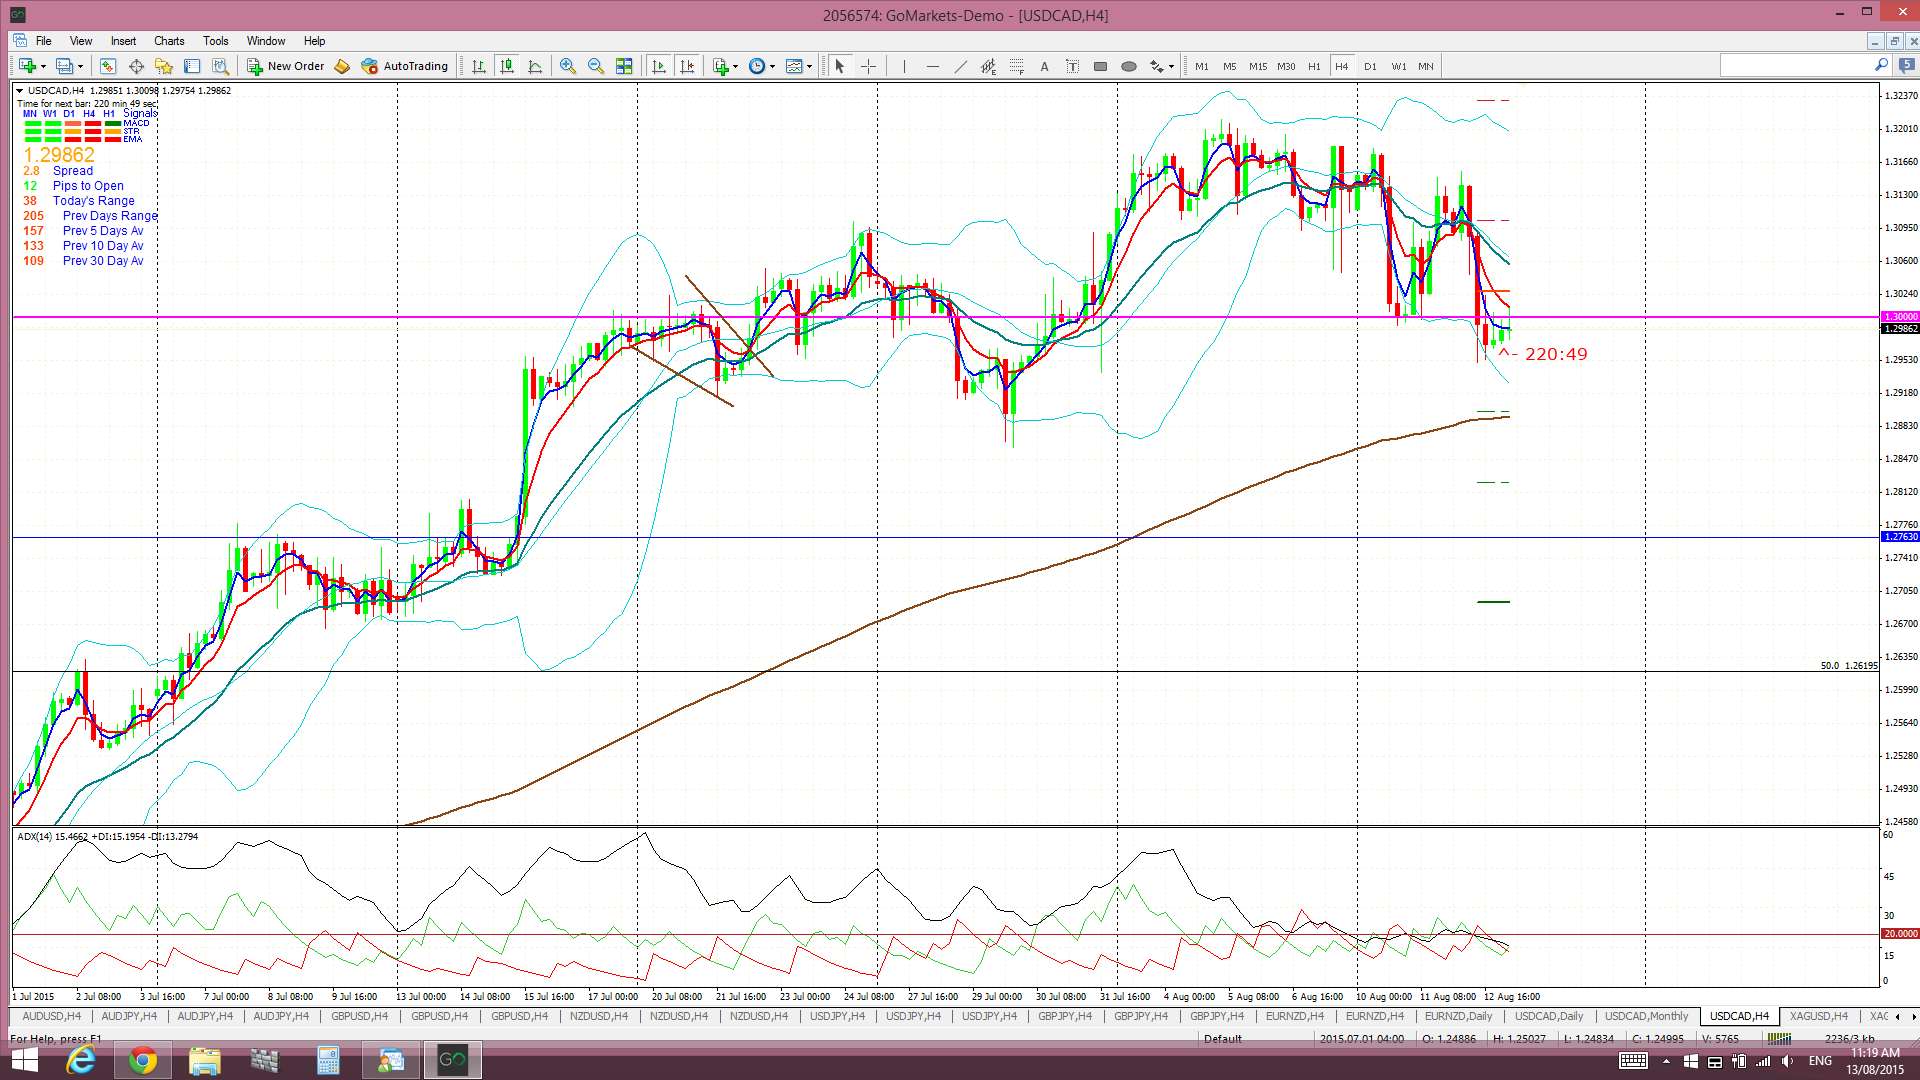
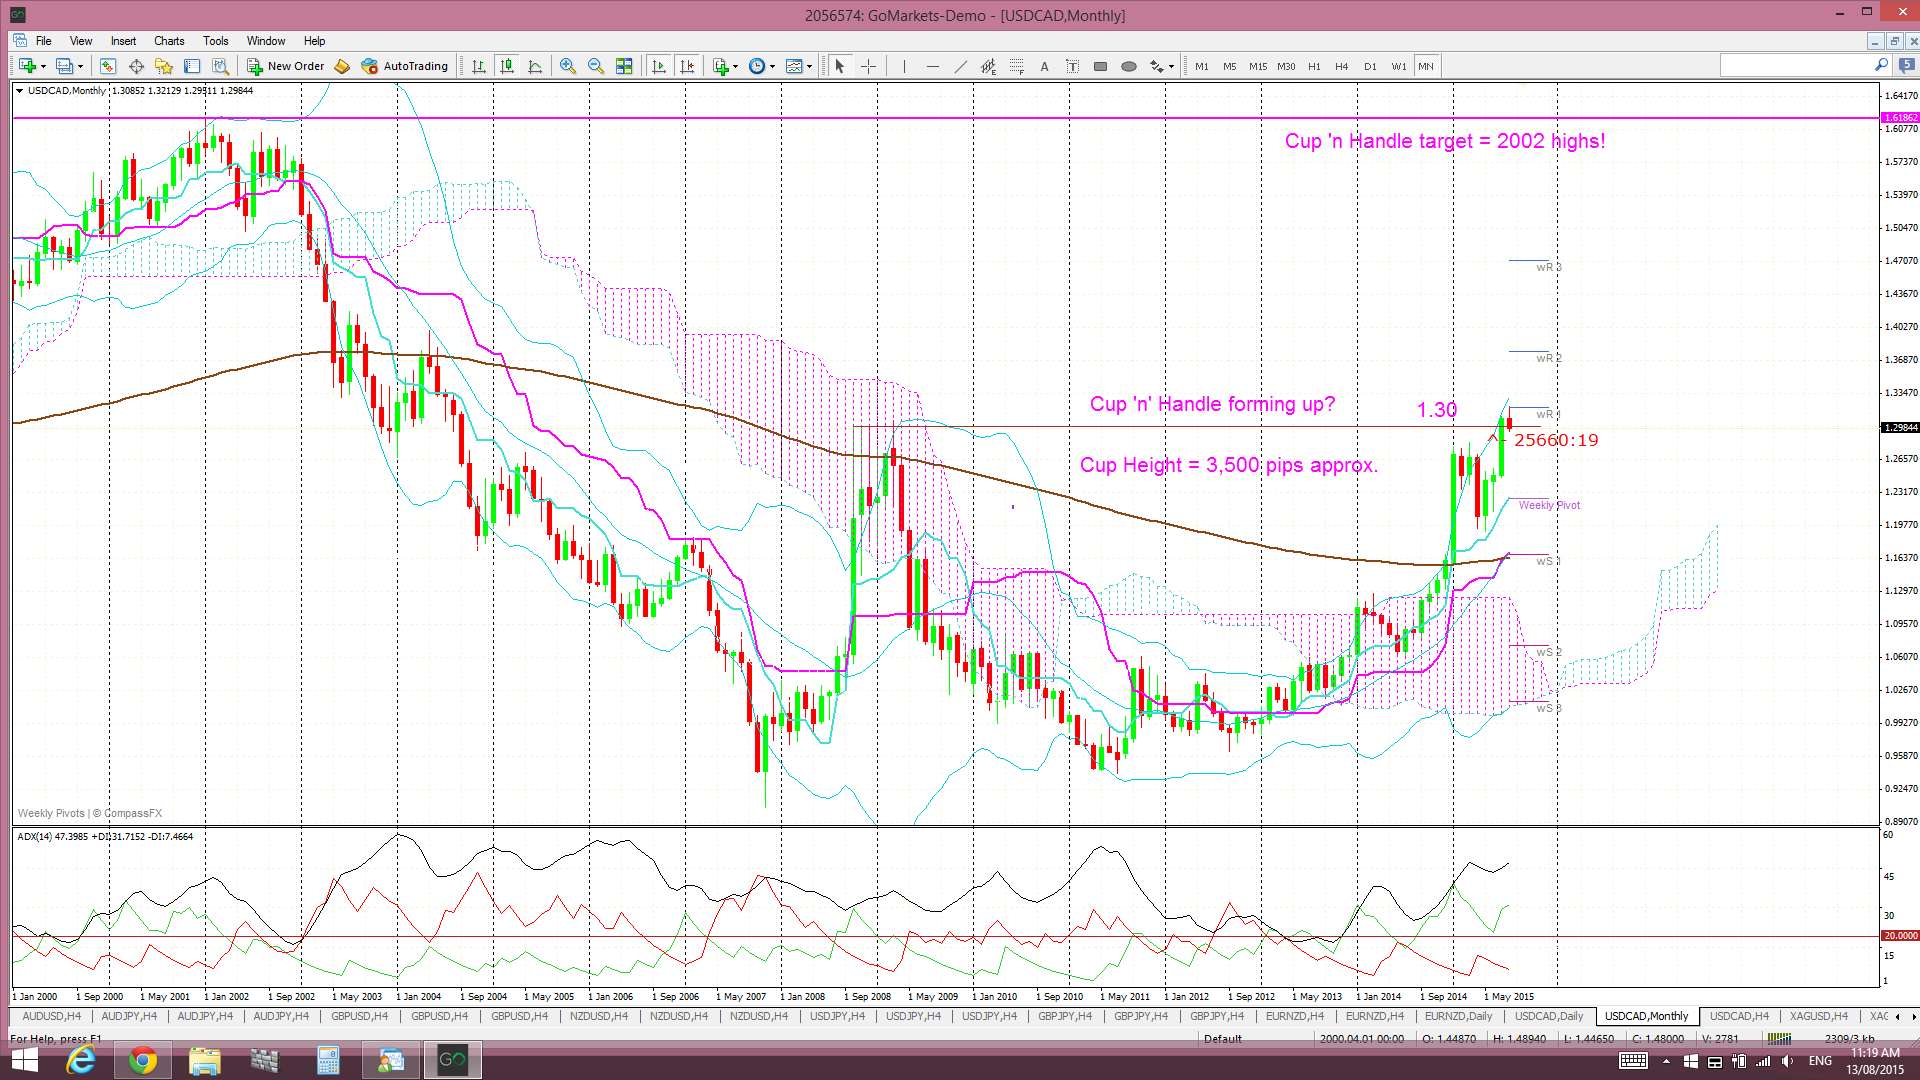
Loonie: no surprise here that 1.30 has been tested again. Remember here too, as with the U/J and the 124 level, I’m looking out for any choppiness around the 1.30 level to add a potential ‘Handle’ to a monthly chart based ‘Cup’.
Loonie 4hr: back testing 1.30:
Loonie monthly: 1.30 is a major level on this pair and the battle might continue here for some time:
The post FX: keep the bigger charting picture in mind. appeared first on www.forextell.com.