Last week: My FX trading regime is currently based on 4 hour charts but price action on this time frame has continued to be choppy. I only had one TC signal last week (until Friday) and this was for a 45 pip losing trade on the U/J. This prompted me to take a deeper look at the USD/JPY and in my subsequent analysis I reflected on the potential for this pair to remain choppy for a reasonably lengthy period. I’m wondering if this outcome will evolve and, if so, whether this sentiment might spill over into other currency pairs and markets?
This week:
The US$ index and EURX previously triggered triangle breakouts but both indices experienced pull backs last week. However, I’ll be watching for any continuation with these patterns in a week that brings FOMC. Many analysts seem to be expecting a US interest rate hike this year and any endorsement of that view coming from this week’s FOMC could help to rejuvenate the US$ rally. This is ‘rock and hard place’ stuff for sure for the Fed as the stronger US$ is already being blamed for some of the disappointing company earning results and a strengthening US$, if triggered by any rate-hike news, would only exacerbate these issue for those companies. Add to this that many other Central Banks around the globe are easing and then it make the Fed’s position even more complex. An update on the FX Indices can be found through this link.
Next Friday is the last day of the trading month so watch for monthly candle formations and for new monthly pivots in the following week.
Gold and Silver: there has been a lot of recent commentary following the fall with these two commodities. Both metals have made another weekly close below key support levels: below $15 for Silver and below $1,145 for Gold. However, these levels are important monthly chart regions as well and so I would urge a bit of caution here and for traders to wait and see where these two actually close on Friday; the close for July. Any pullback and close above these key S/R levels on Friday would be rather bullish but, conversely, a monthly close below these levels would be bearish and these regions would then mark a good place at which to SHORT on a pullback. Whilst both metals printed bearish weekly candles they also both printed a bullish-reversal Hammer candle on Friday.
Kiwi: the NZD/USD has been bearish of late but printed a bullish-reversal ‘Inverted Hammer’ candle last week. Thus, watch for any surprise bullish follow-through next week.
Stocks: Most had a bearish week but many key indices are still trading above daily support trend lines.
The official Chinese Manufacturing PMI is released next Saturday, after the markets are close.
Stocks and broader market sentiment:
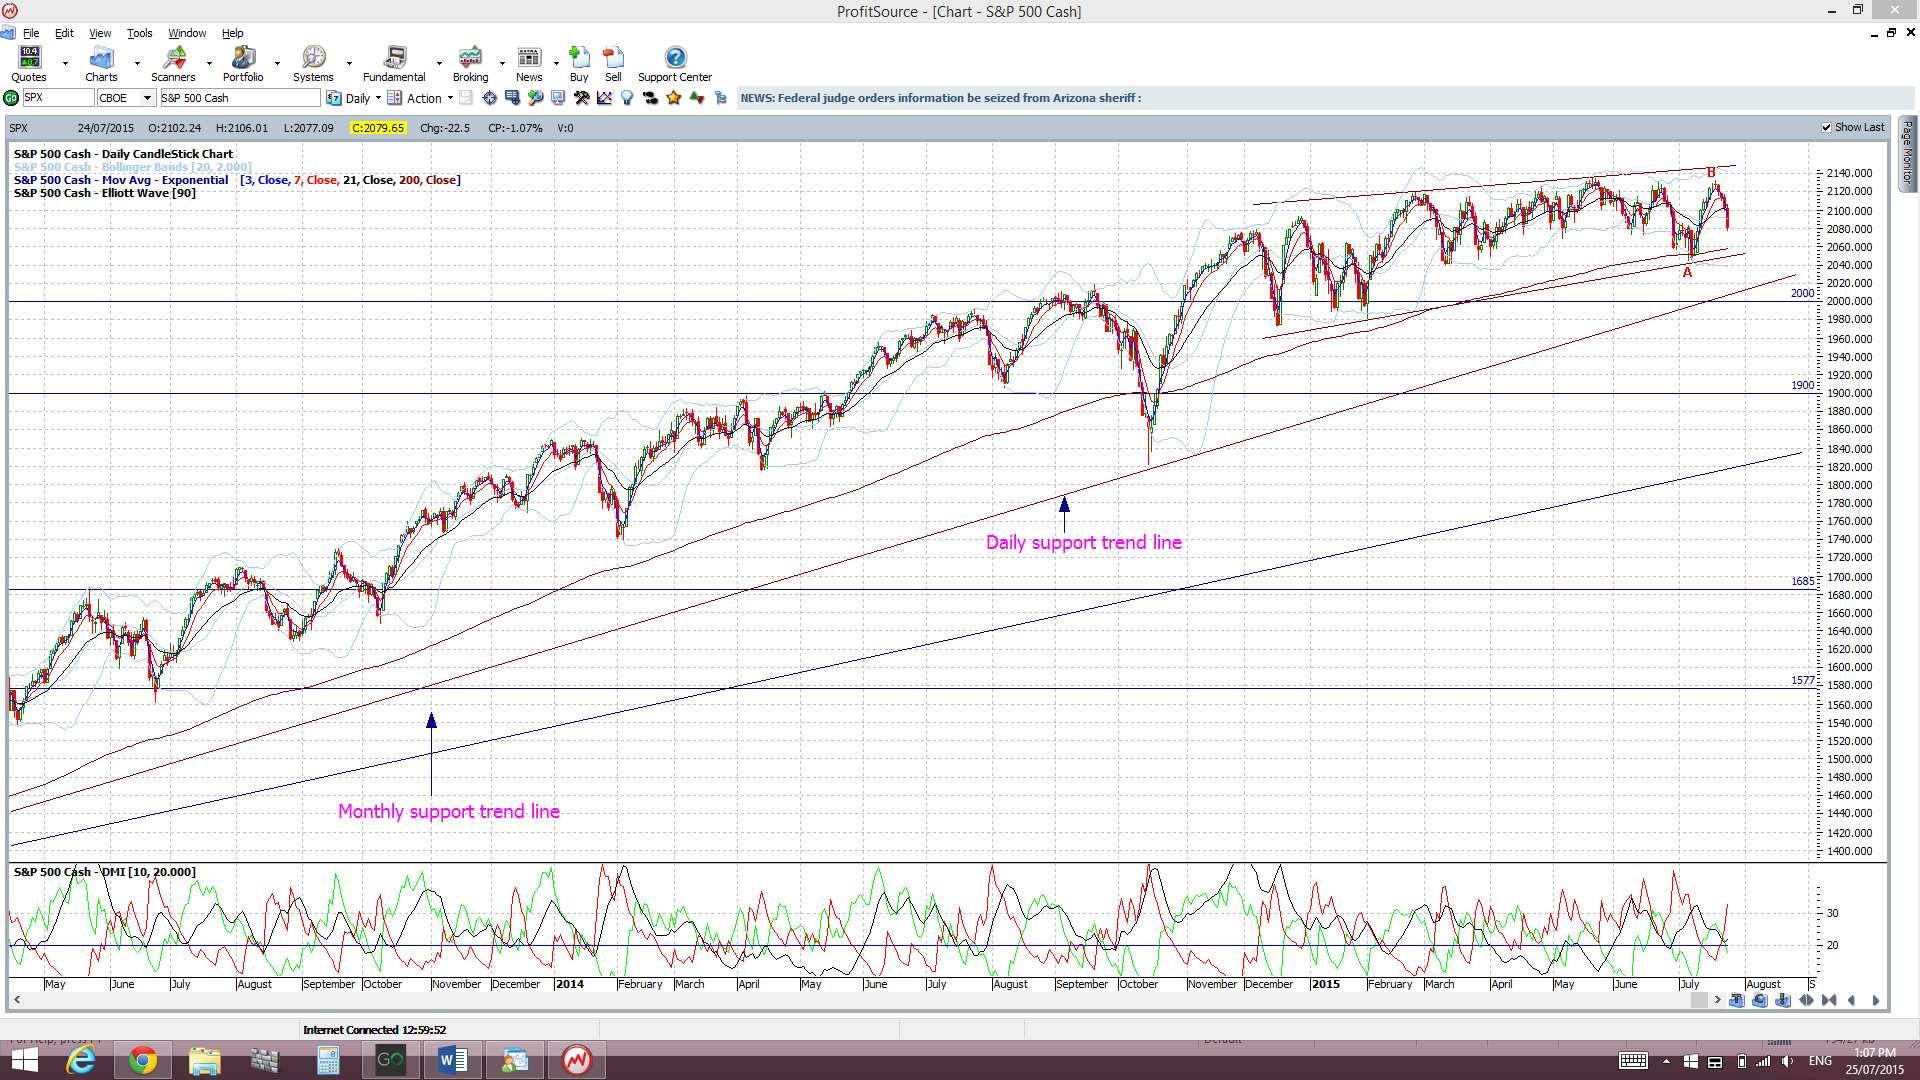
Global stocks sold off last week following a few key events: some disappointing blue-chip earnings results, the Gold, Silver and Oil sell off and some weaker than expected manufacturing data out of China all leading to global growth concern. However, the larger and more informative Chinese Manufacturing PMI survey isn’t released until next week and this is more the one to watch. With all of this bearish sentiment the S&P500, DJIA, NASDAQ, Russell 2000, FTSE and DAX posted bearish weekly candles, however, they all are still trading above daily support trend lines!
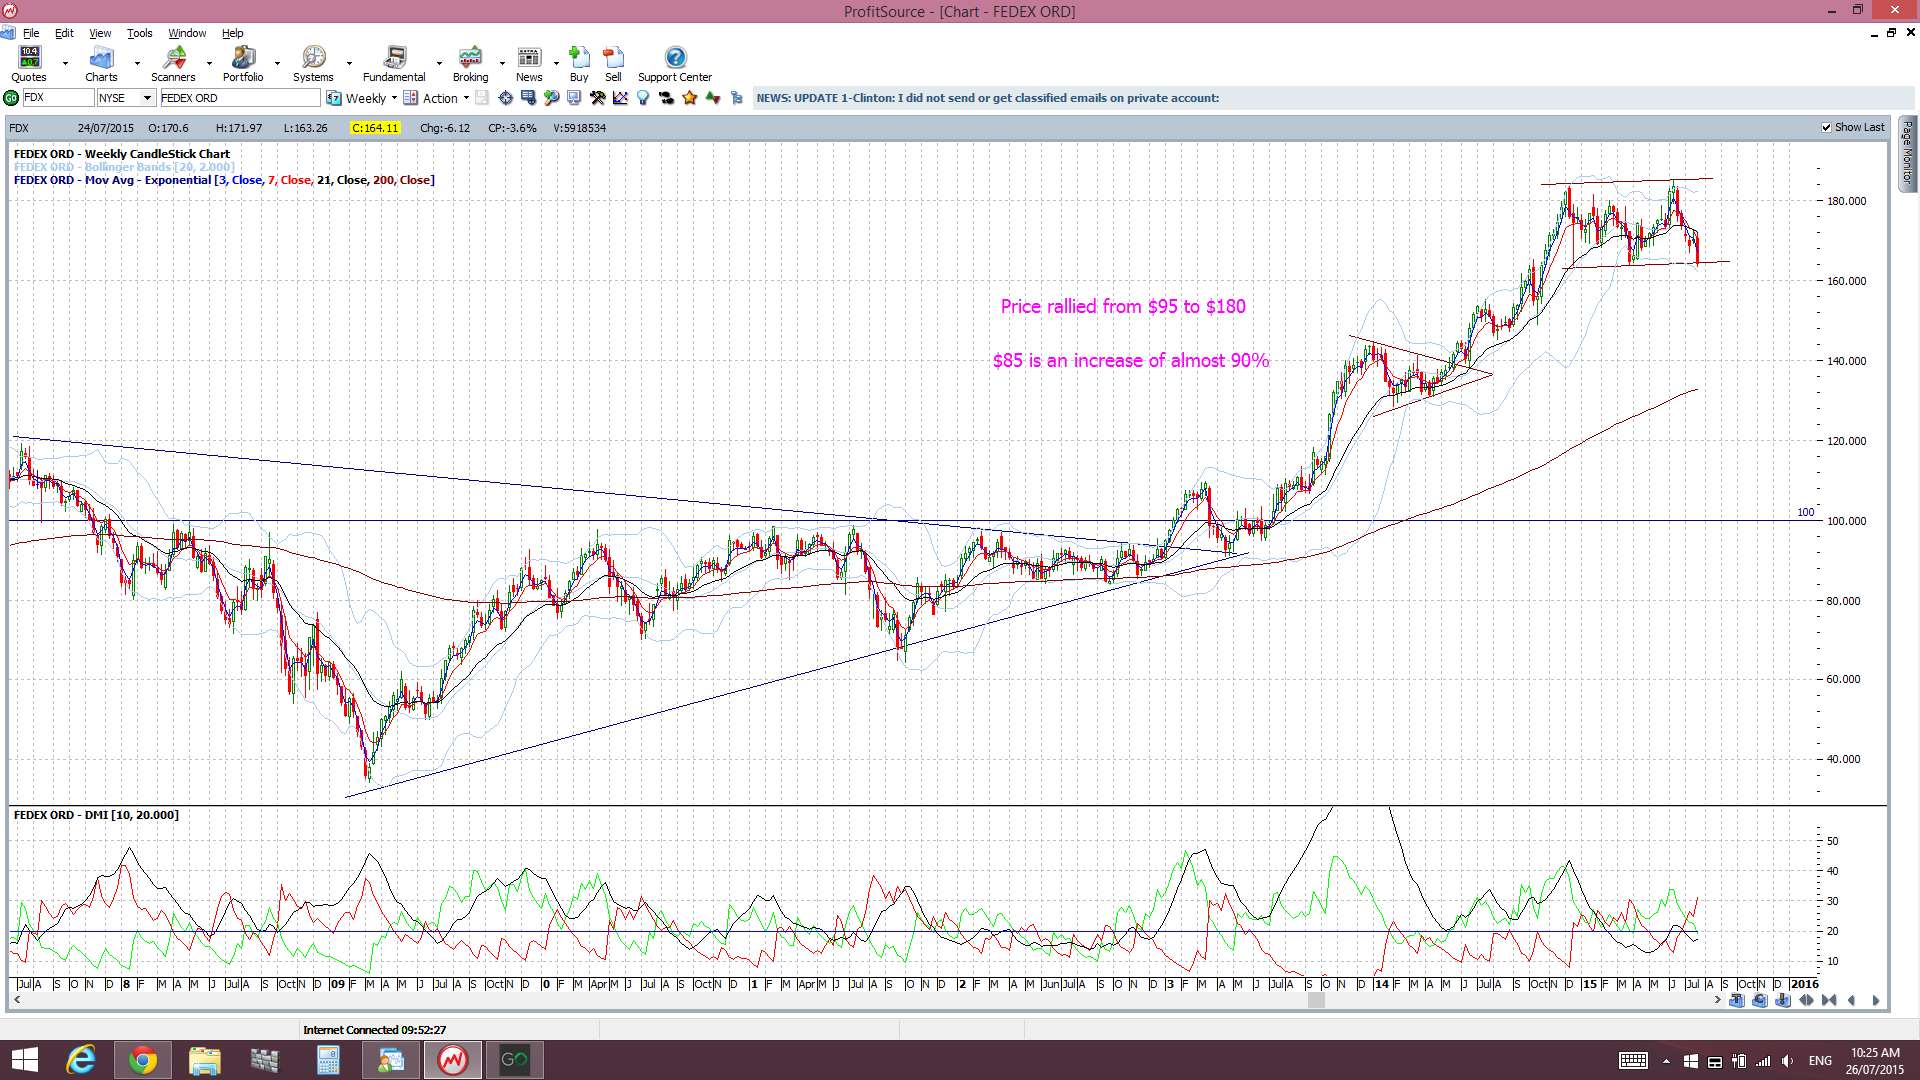
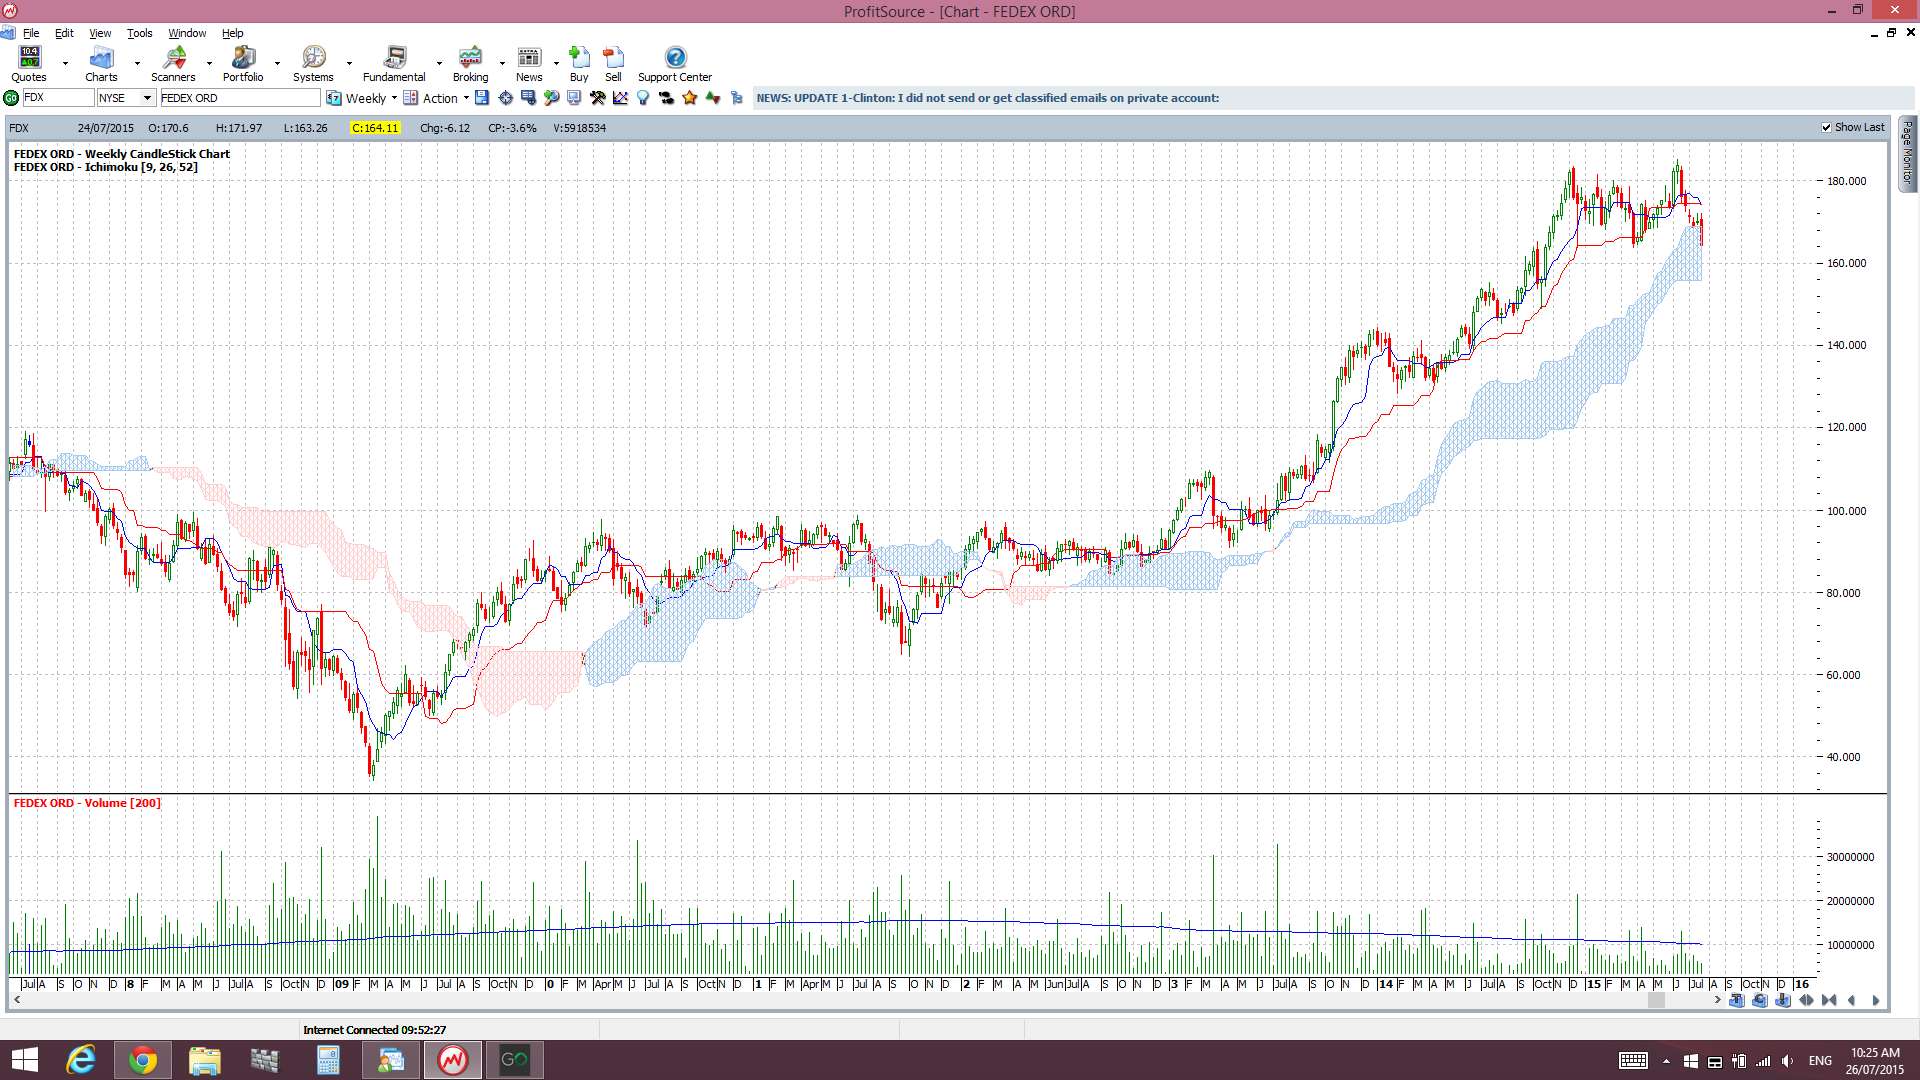
One market barometer is the US stock Fedex and, although this is chopping lower, it is holding above support from a Flag trend line and the weekly Ichimoku Cloud for now. Watch for any bounce or bearish breakdown from here though:
Fedex weekly:
Thus, I continue to watch out for further clues as to any new momentum move, long or short though! In particular I’m looking out for:
S&P500 daily chart: The index closed below the psychological 2,100 level but is still above daily trend line support. The possible bearish ascending wedge is still in play and so I’ll keep watching these trend lines:
Ichimoku S&P500 chart: a clear cross of the blue Tenkan-sen line below the pink Kijun-sen line. There was a bullish Tenkan/Kijun cross here recently but this evolved below the Cloud and so was deemed a ‘WEAK’ signal. Price is back below the Cloud though now:

S&P500 monthly chart: a break of the monthly support trend line. The monthly trend line remains intact but a break of this support level would suggest to me of a more severe pull back or correction. I am still seeing divergence on the monthly chart for now though.

Russell 2000 Index: this small caps index is considered a US market ‘bellwether’ and is still trading above the key 1,220 level despite the bearish weekly candle.

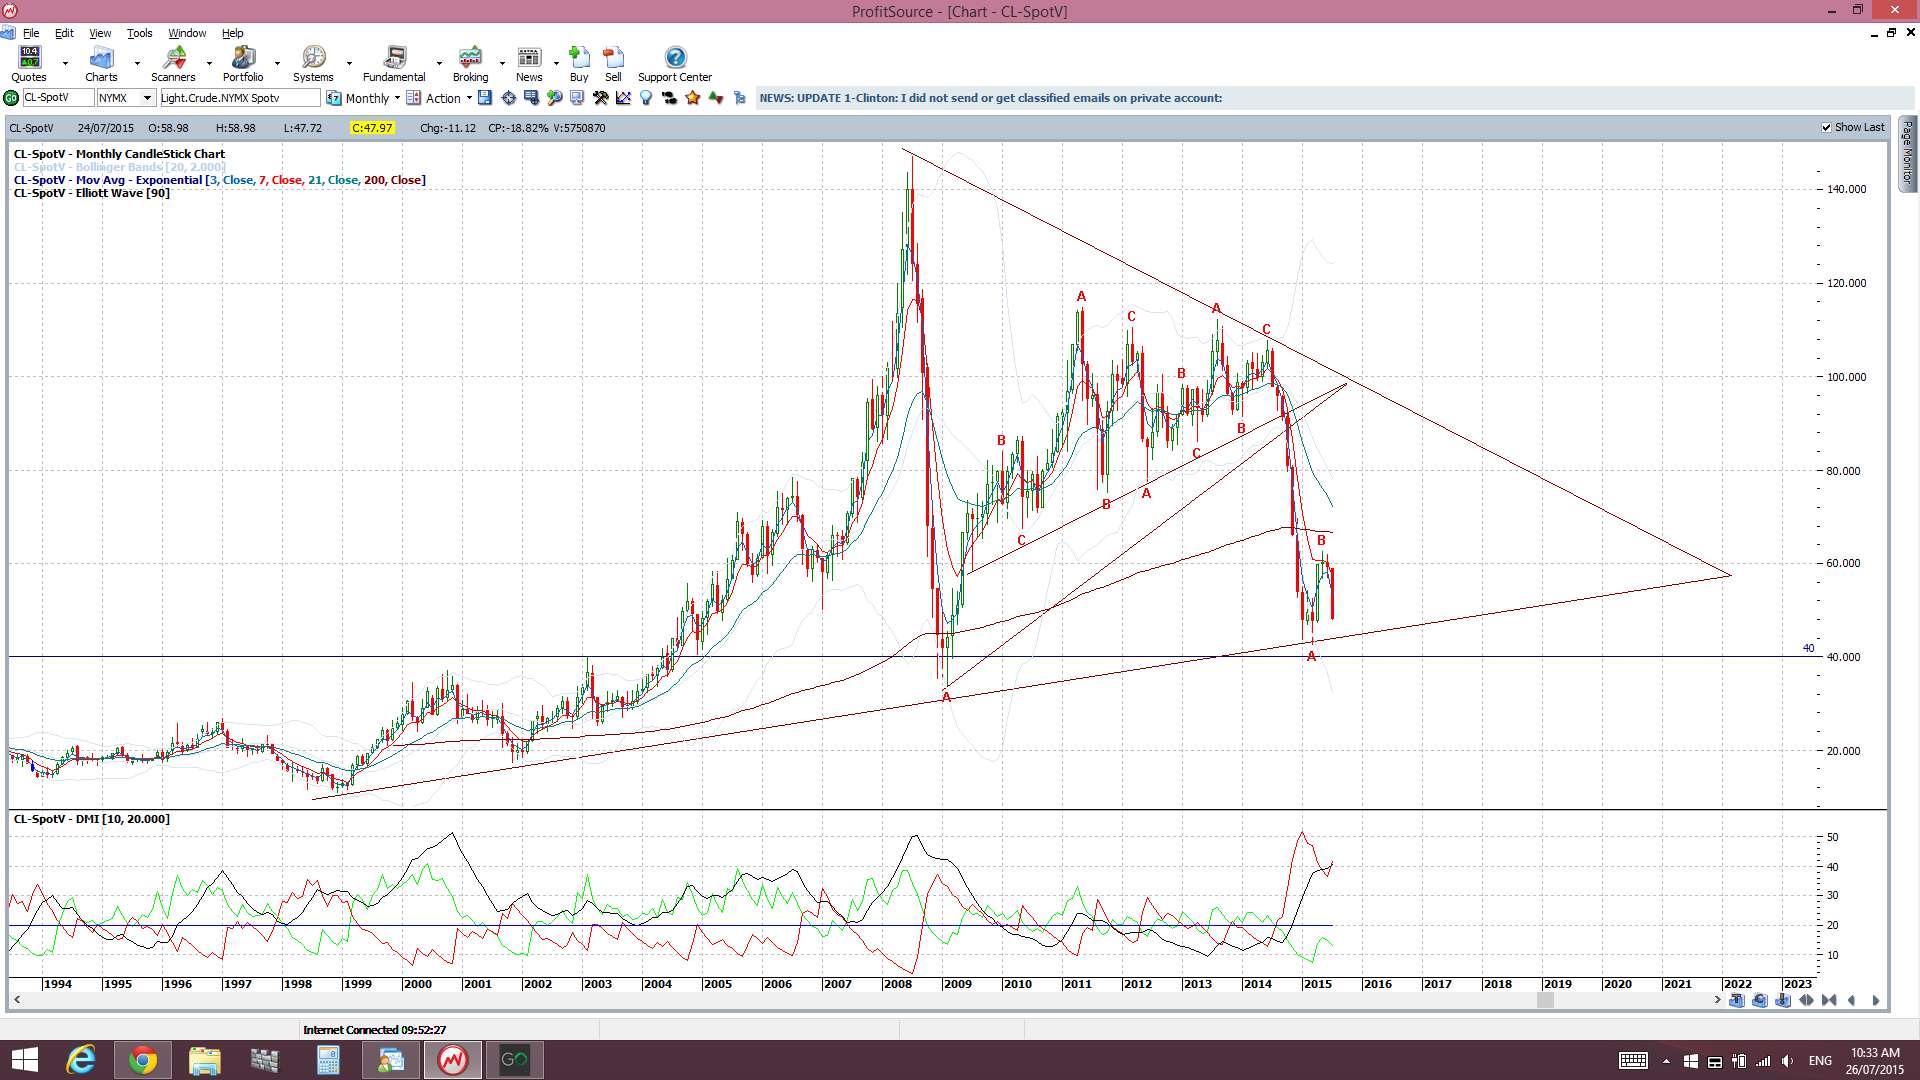
Oil monthly: it sure looks like Oil could test down near the $40 level again:
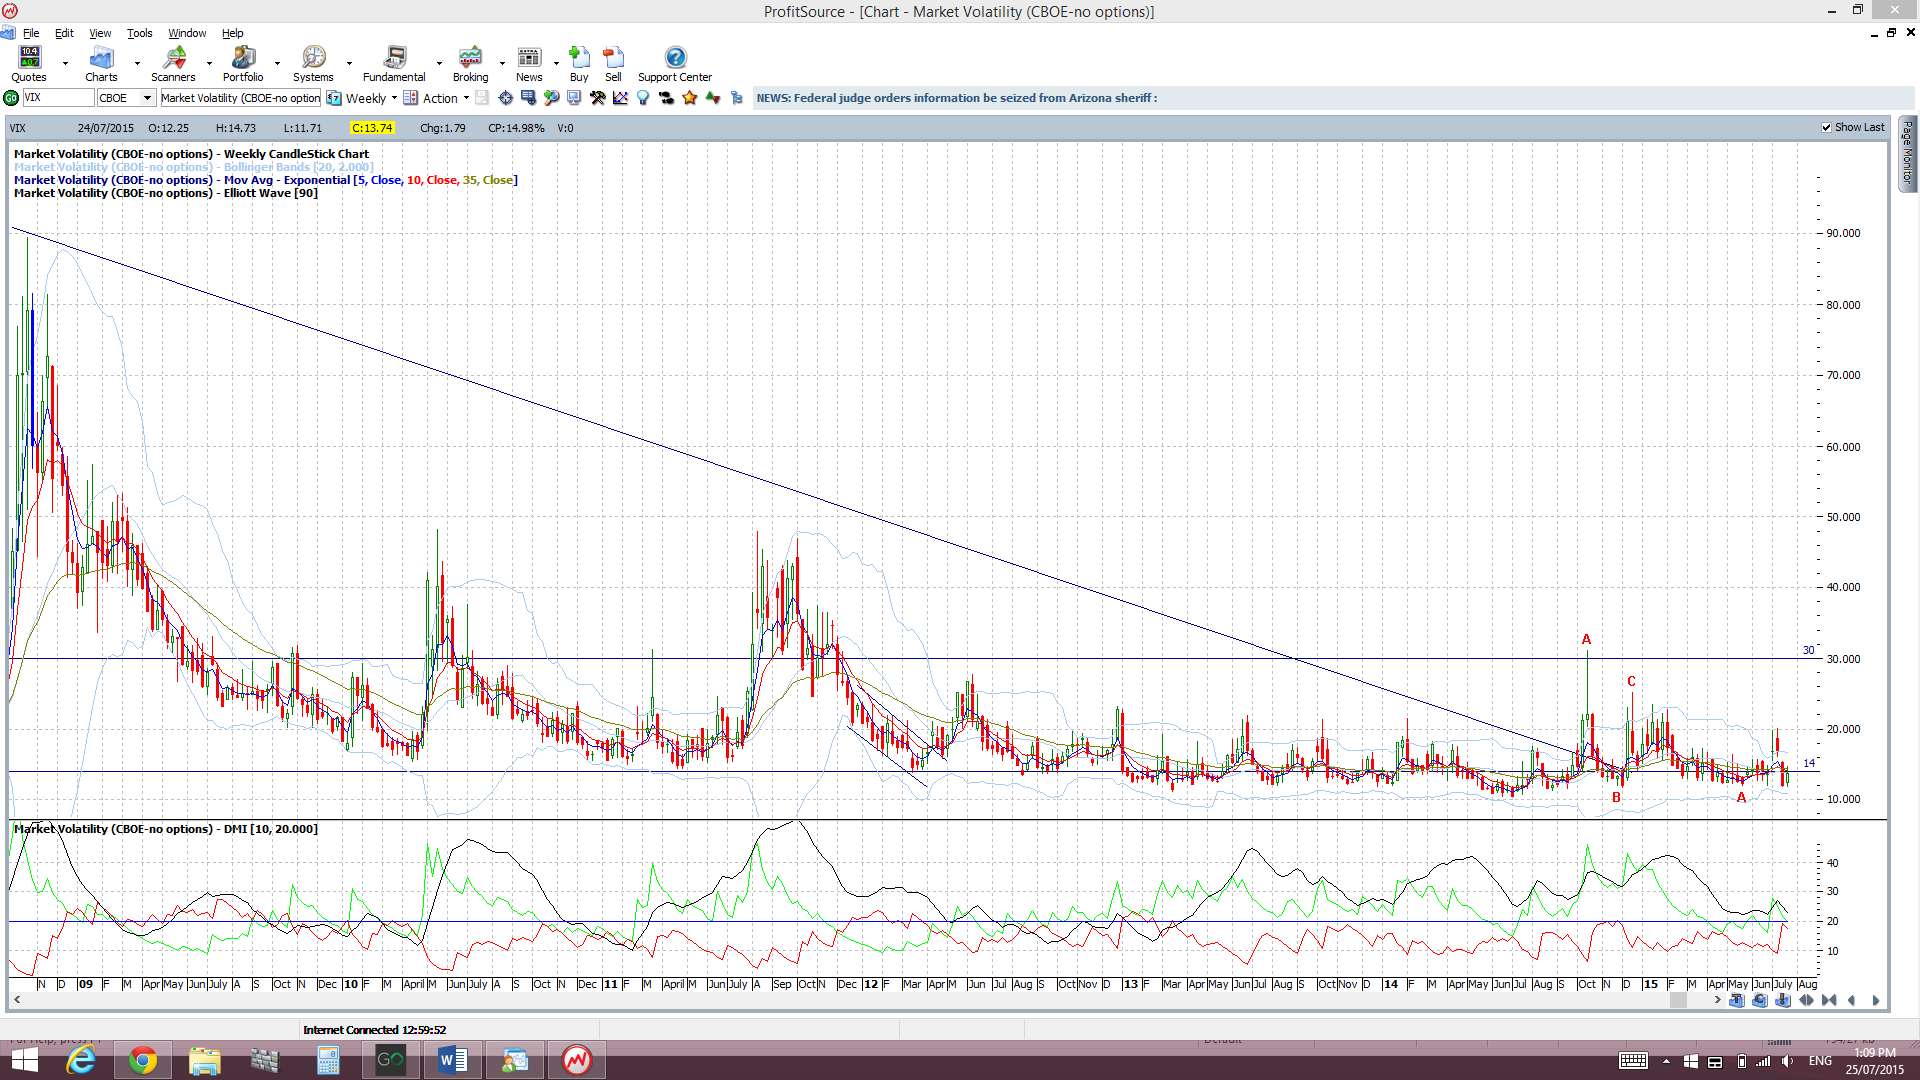
VIX Index: The ‘Fear’ index is still below the 14 level but printed a bullish weekly candle.
Trading Calendar Items to watch out for:
- Mon 27th: EUR German Ifo Business Climate. USD Core Durable Goods.
- Tue 28th: GBP Prelim GDP. USD CB Consumer Confidence.
- Wed 29th: USD FOMC.
- Thurs 30th: AUD RBA Gov Stevens speaks & Building Approvals. USD Advance GDP & Unemployment Claims.
- Fri 31st: NZD ANZ Business Confidence. AUD PPI. CAD GDP.
- Sat 1st: CNY Manufacturing PMI.
Forex:
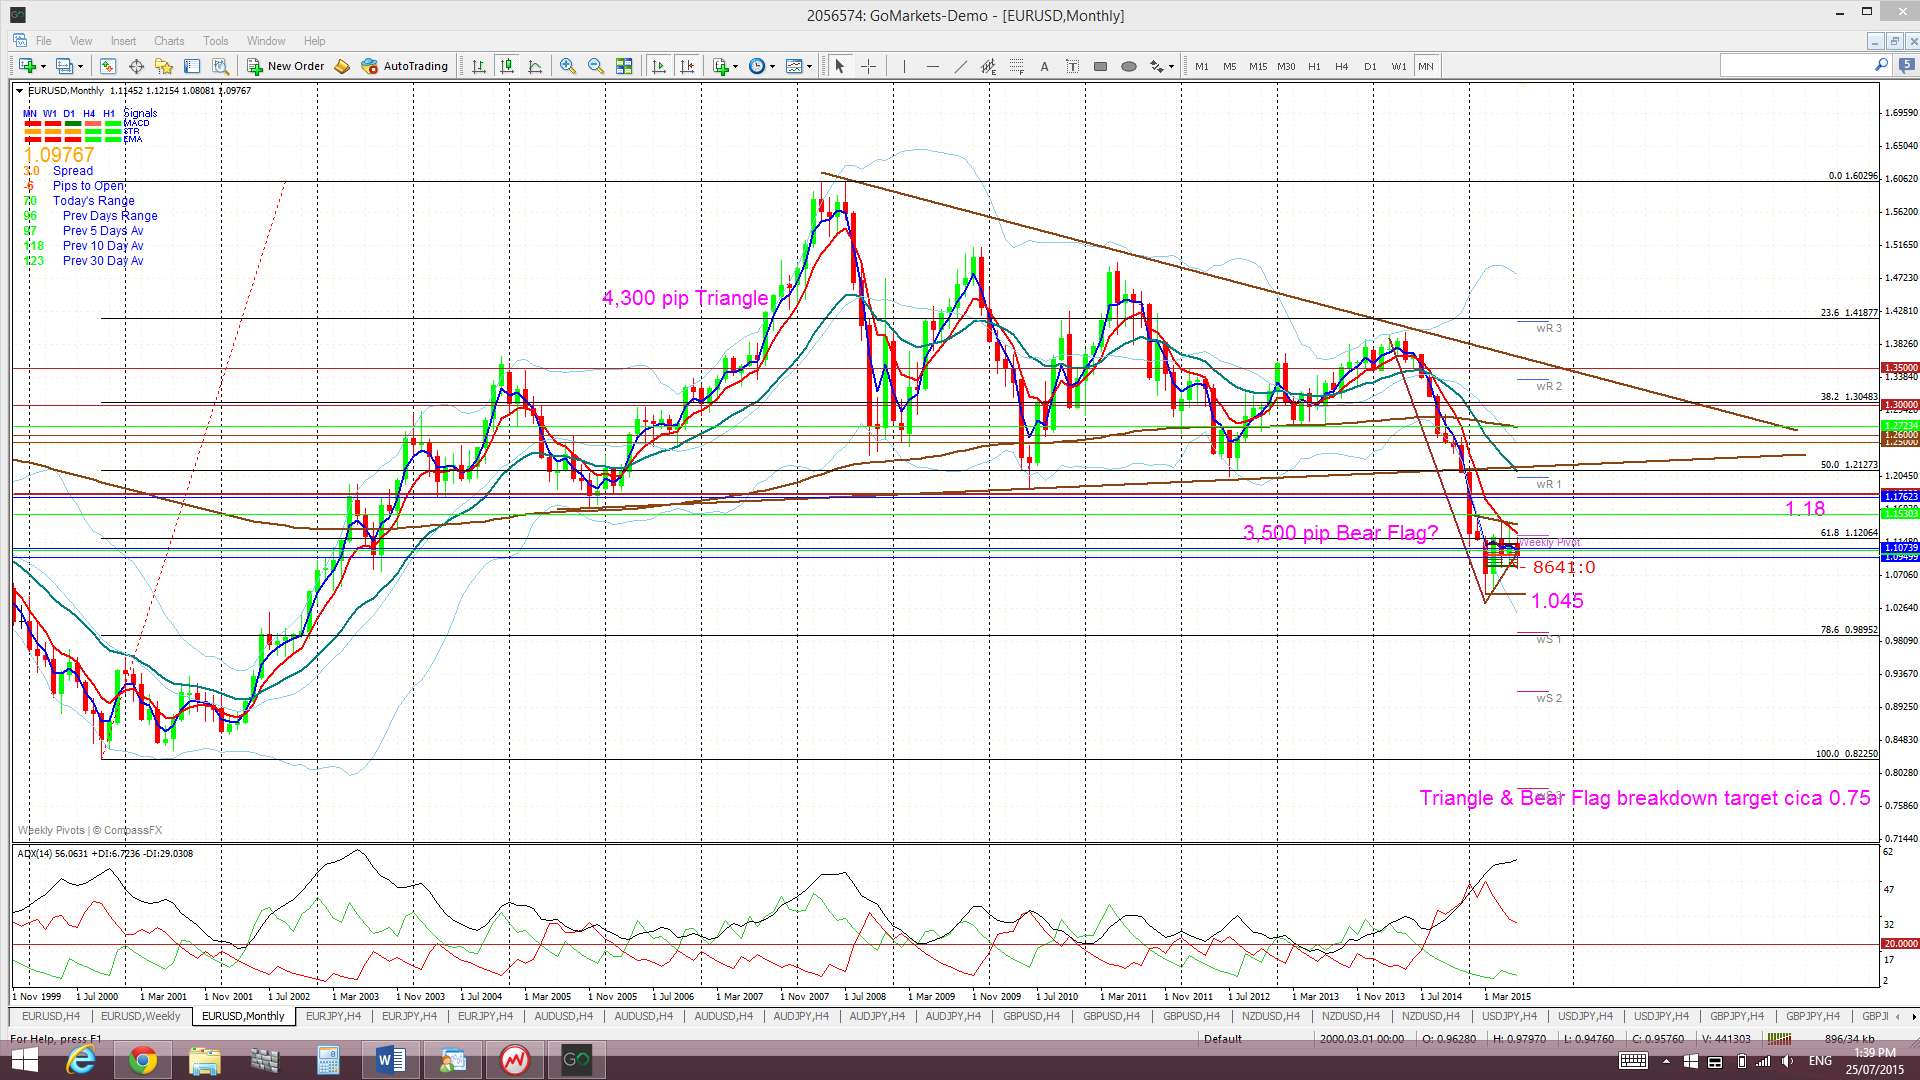
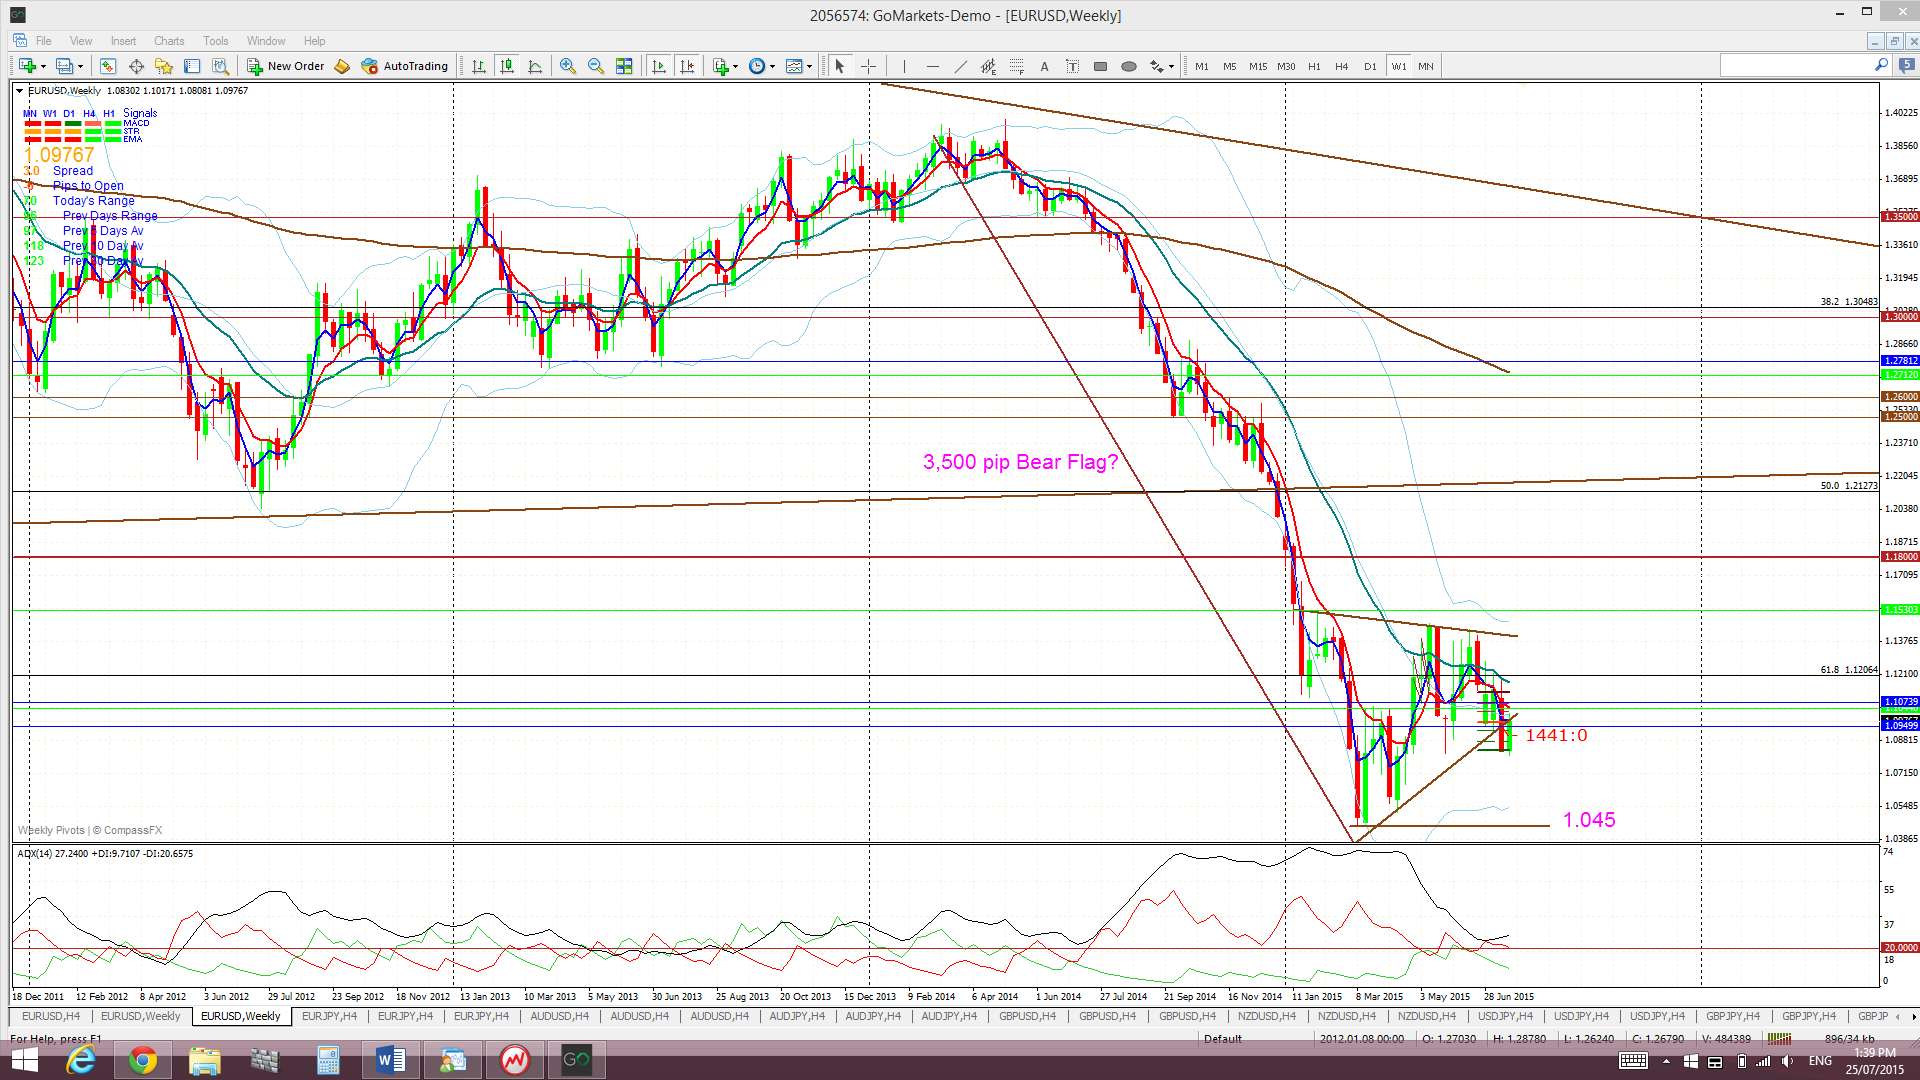
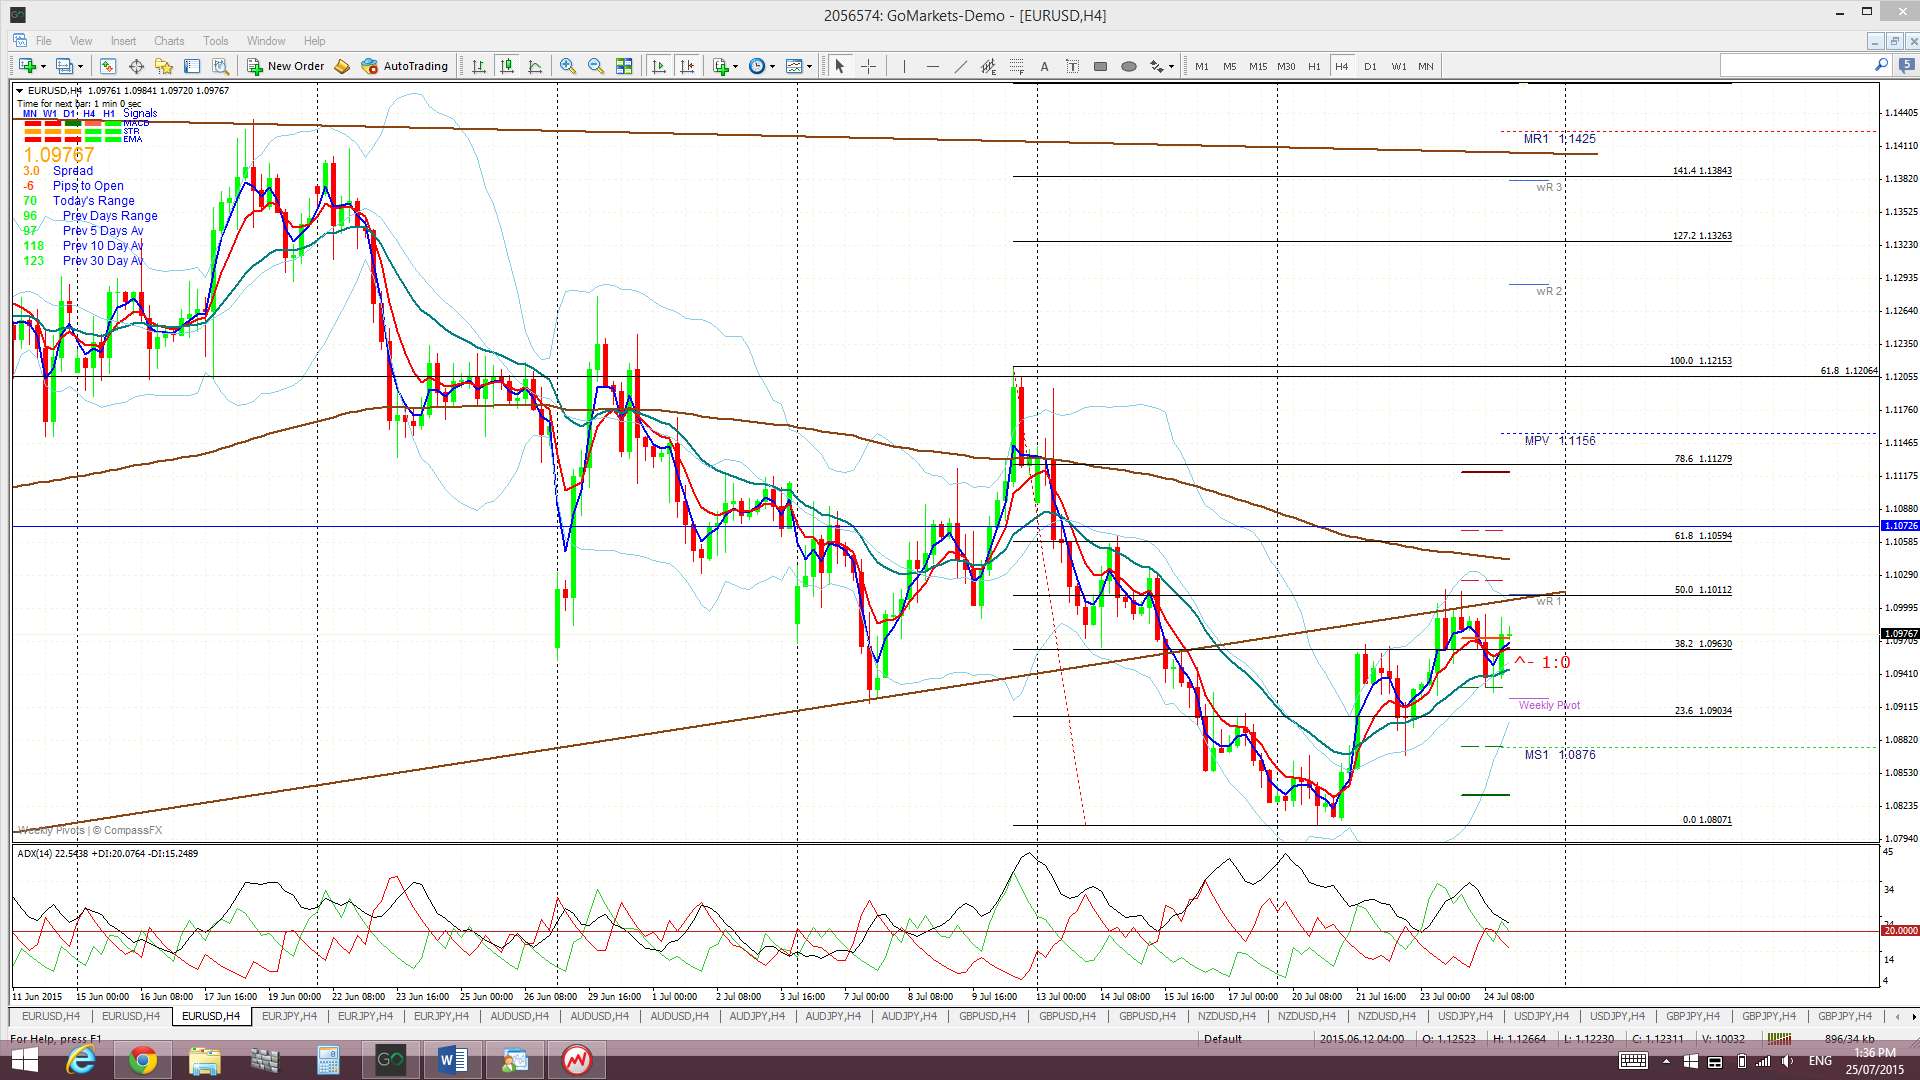
E/U: The E/U recovered lost ground last week after breaking down below a triangle trend line the week before but it still couldn’t manage to print a 4hr candle back above this broken trend line. Thus, at this stage, it is not clear whether this pullback is simply testing the broken trend line region before bearish continuation or the start of a recovery effort and so next week’s action will need to be seen to try and determine the outcome here. Any bearish continuation though could signal the start of a weekly-chart Bear Flag breakdown worth up to 3,500 pips.
The recent low down near 1.045 is also worth keeping an eye on in case it offers up any support.
It is interesting to note that the bearish target for this recent Bear Flag is similar to the target for the larger, monthly descending triangle breakdown….confluence!
Descending triangle on the monthly chart: Despite some recent activity there is still an overall bearish pattern in play on the E/U monthly chart: a 4,000 pip bearish descending triangle breakdown on the monthly chart. The descending triangle pattern is a bearish continuation pattern and has a base at around the 1.18 level. The height of this triangle is about 4,000 pips. Technical theory would suggest that the bearish breakdown of this triangle below 1.18 might see a similar move. It is worth noting that this would bring the E/U down near 0.80 and to levels not seen since 2000/2001!
Price is trading in the Ichimoku Cloud on the 4hr chart but below the Cloud on the daily, weekly and monthly charts.
The weekly candle closed as a bullish coloured ‘inside’ candle reflecting some indecision here.
- I’m watching for any new TC signal on this pair and the weekly chart’s Bear Flag trend lines.

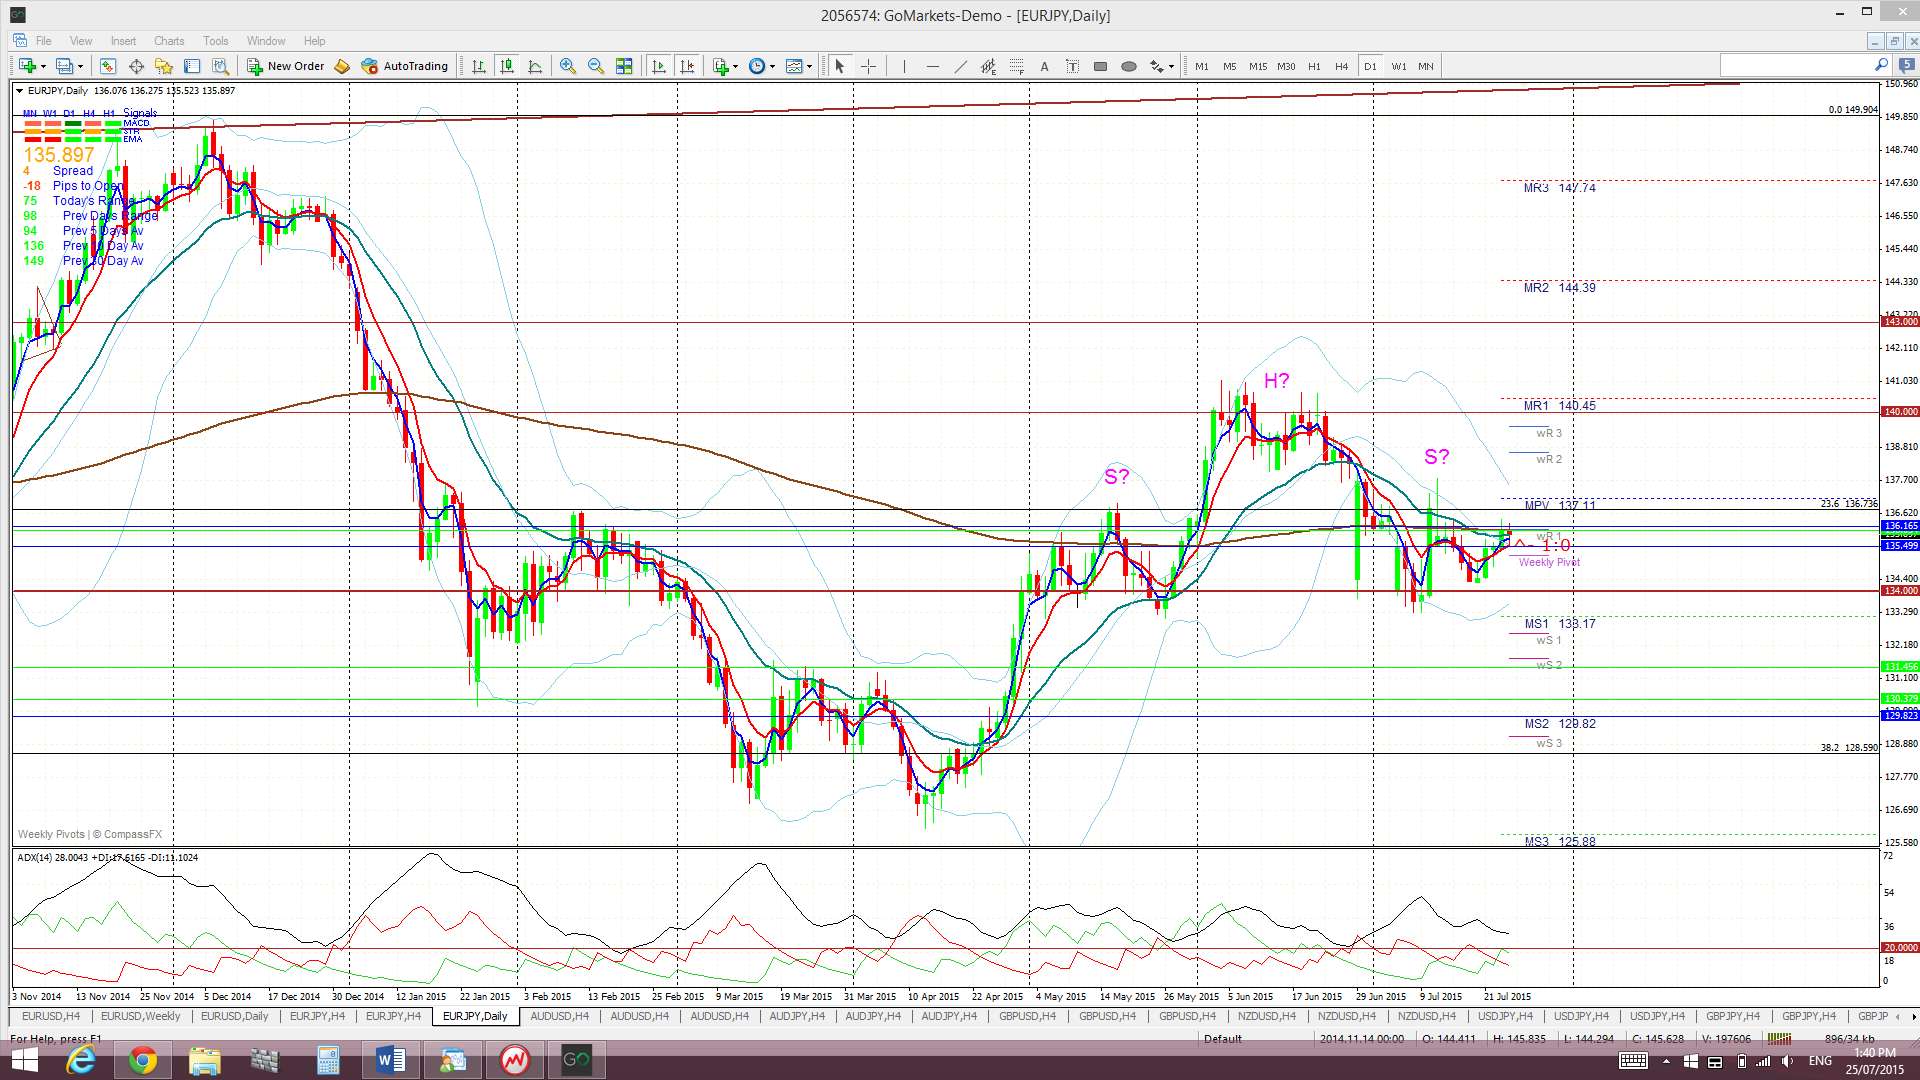
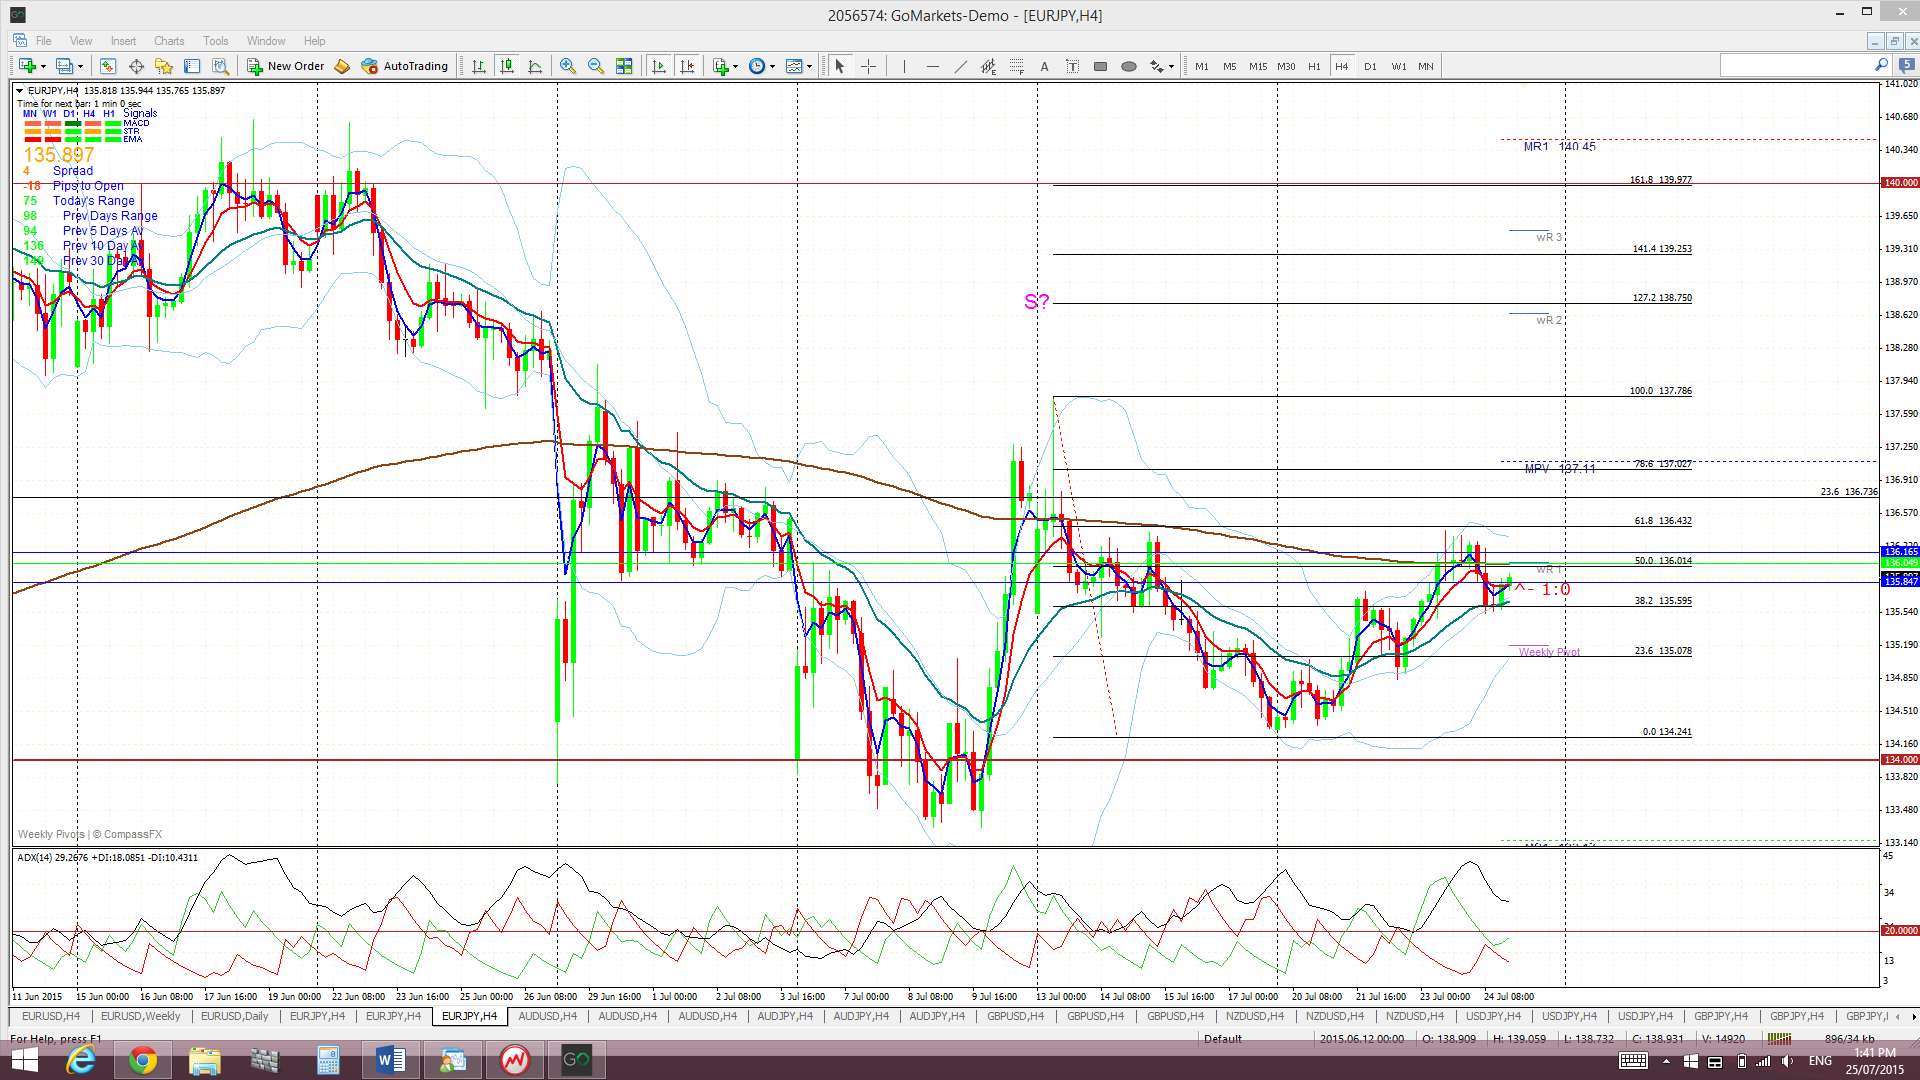
E/J: The E/J is still shaping up with a potential H&S pattern on the daily chart with 134 as the ‘neck line’.
Price is trading above the Cloud on the 4hr chart, in the Cloud on the daily chart, below the Cloud on the weekly chart and above on the monthly chart.
The weekly candle closed as a bullish, almost ‘engulfing’ candle.
- I’m watching for any new TC signal on this pair and the 143 level.
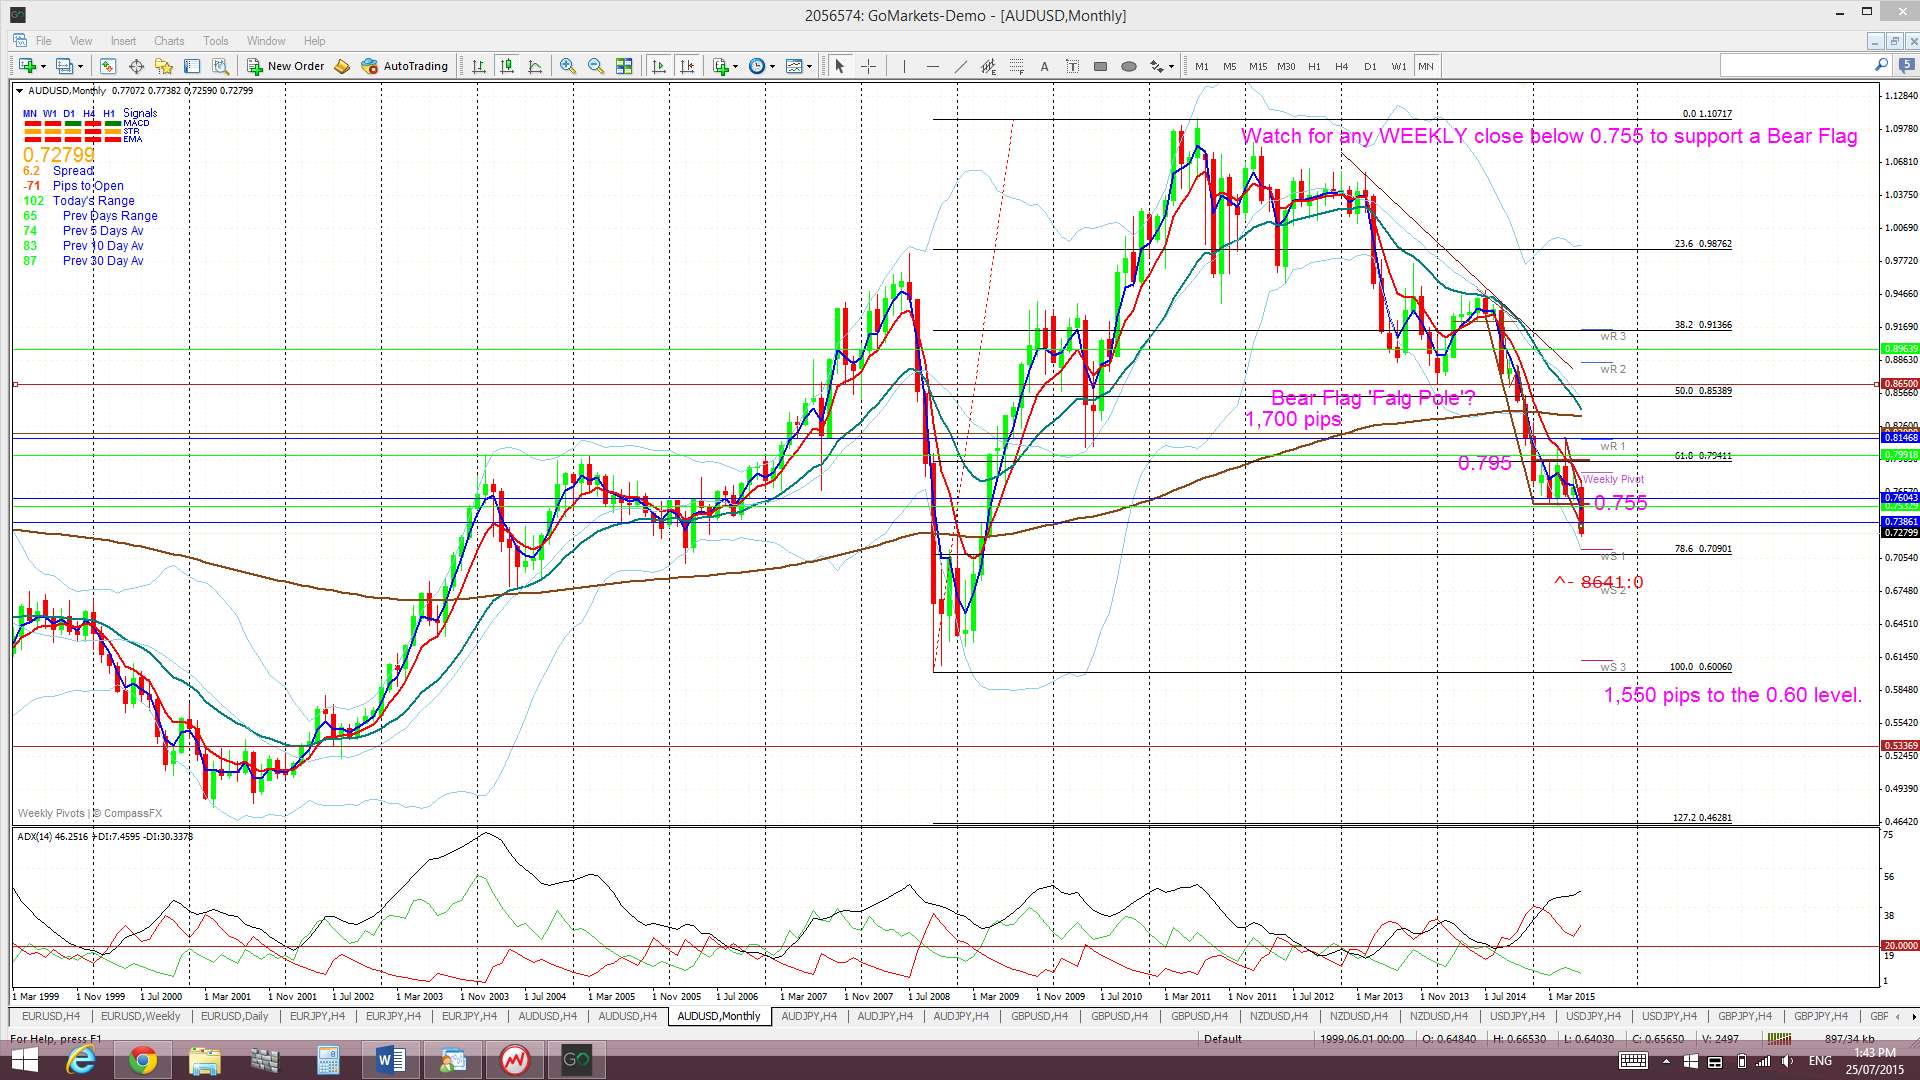
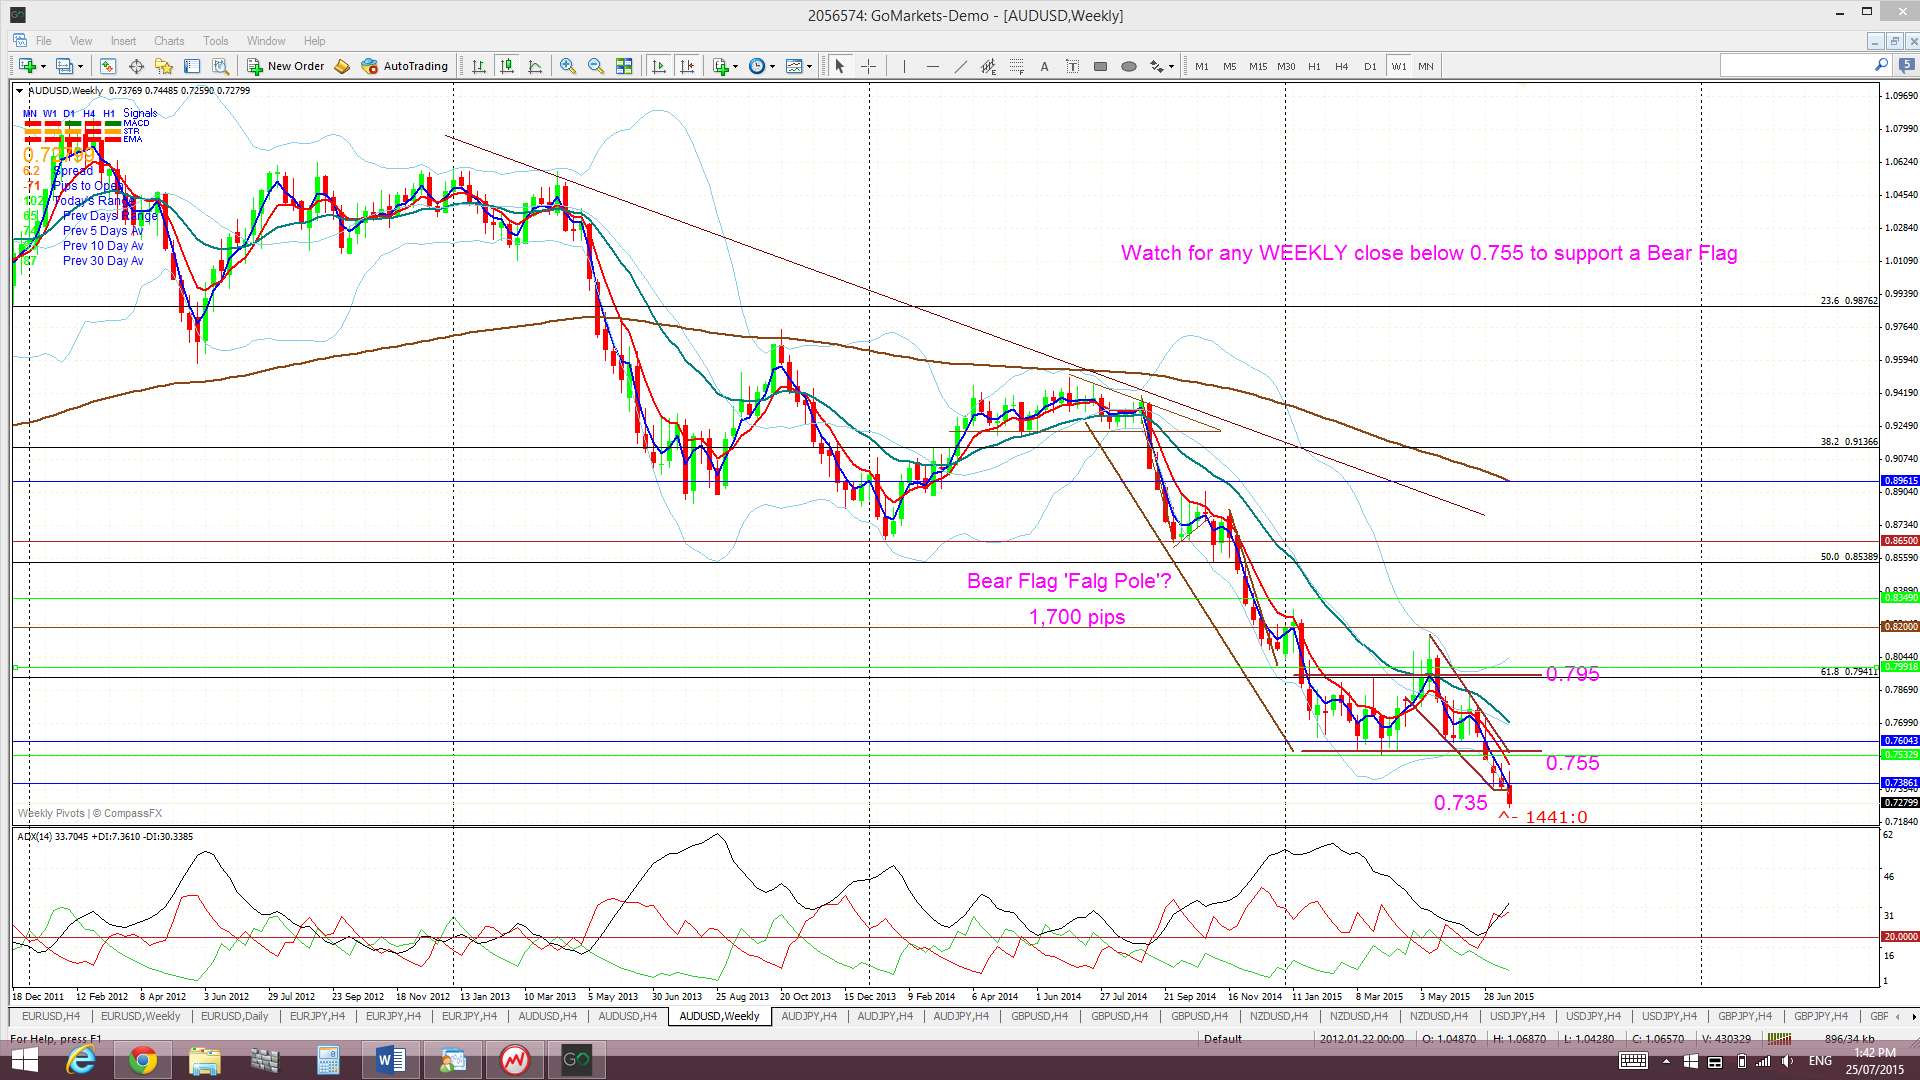
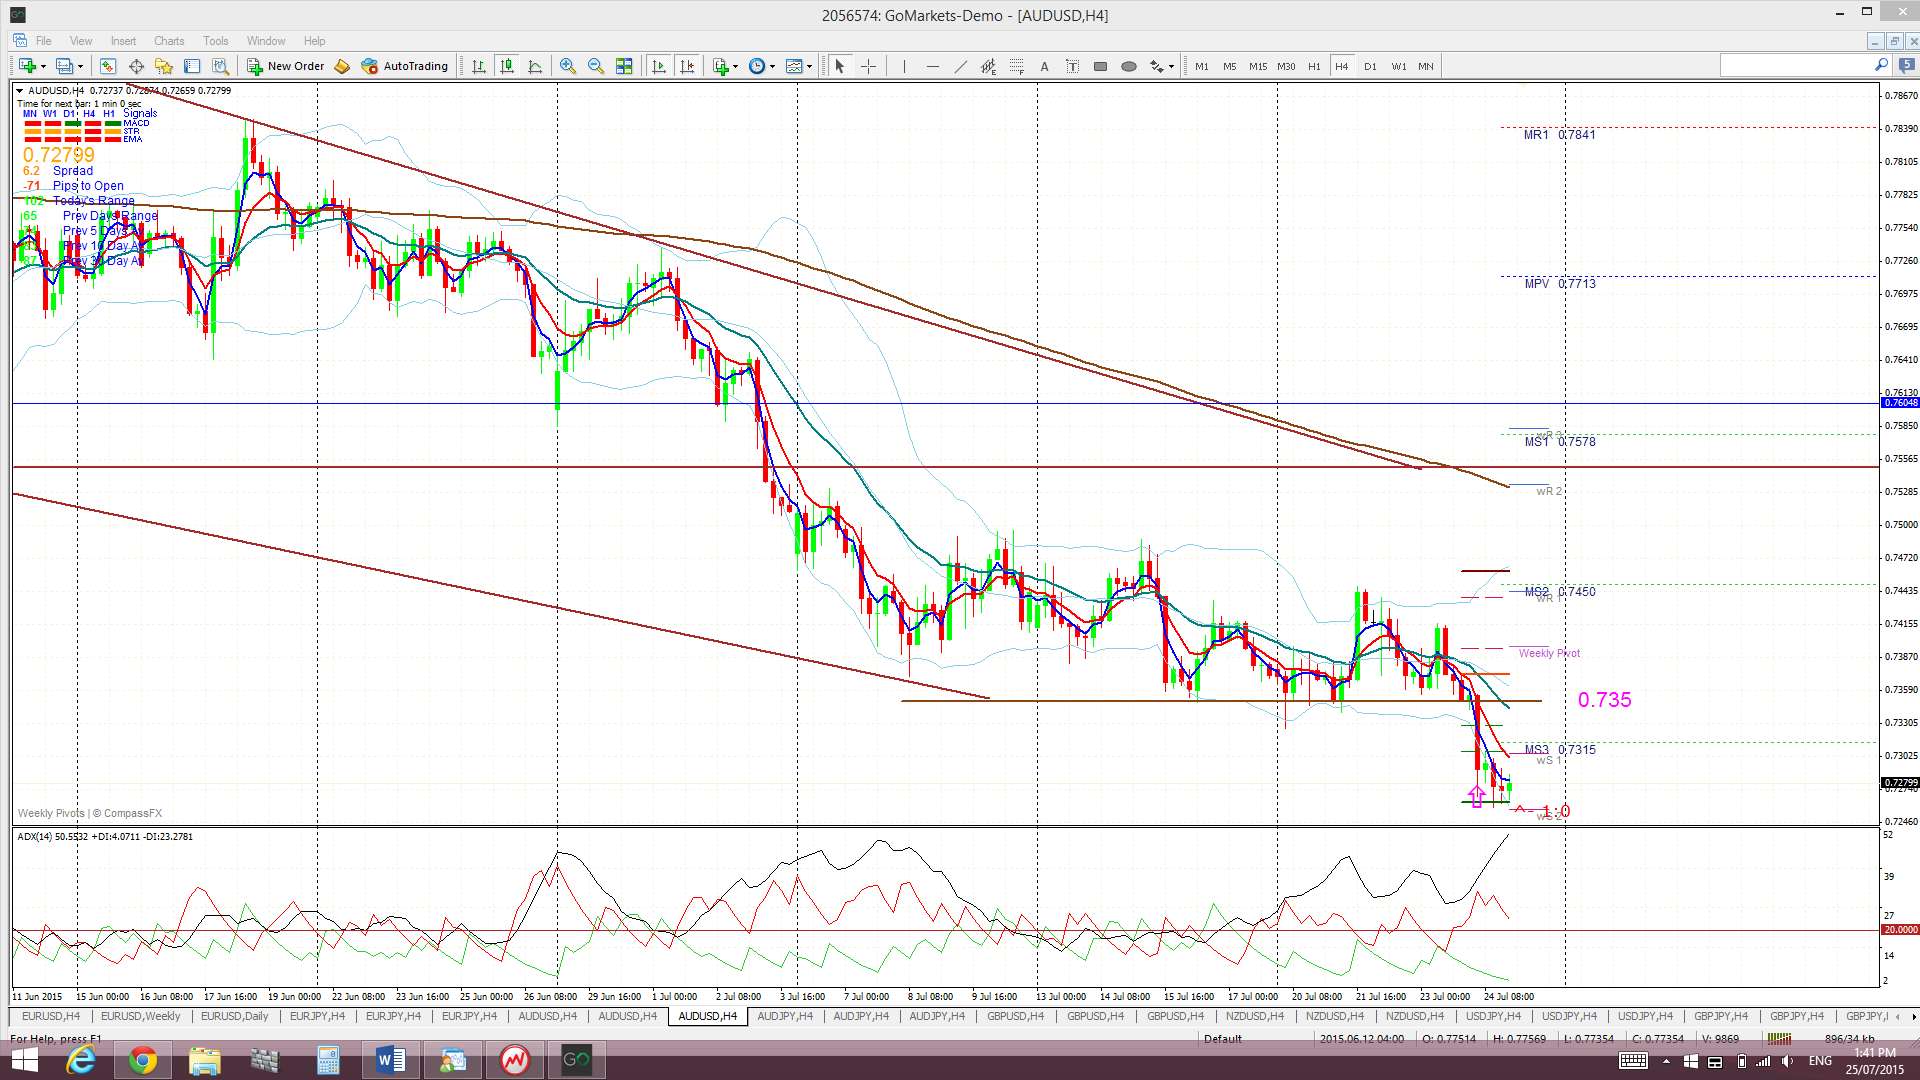
A/U: The A/U remains below the 0.755 level and this is bringing the prospect of a major Bear Flag move into greater focus. The hold below 0.755 is supporting a potential 1,700 pip Bear Flag and the move below the recent low at 0.735 is now lending further support.
The move below 0.735 was triggered following Friday’s weaker than expected Chinese Manufacturing PMI data but the more robust measure of this metric is released next Saturday. Regardless, this bearish move triggered a new TC signal but it hasn’t moved on too far just yet.
The 0.72 level will be the next one to watch as it represents the 61.8% fib of the major swing high move from 2001 to 2011:

After 0.72 the 0.71 will be next to watch as this is the 78.6% fib of the 2008-2011 swing high move:
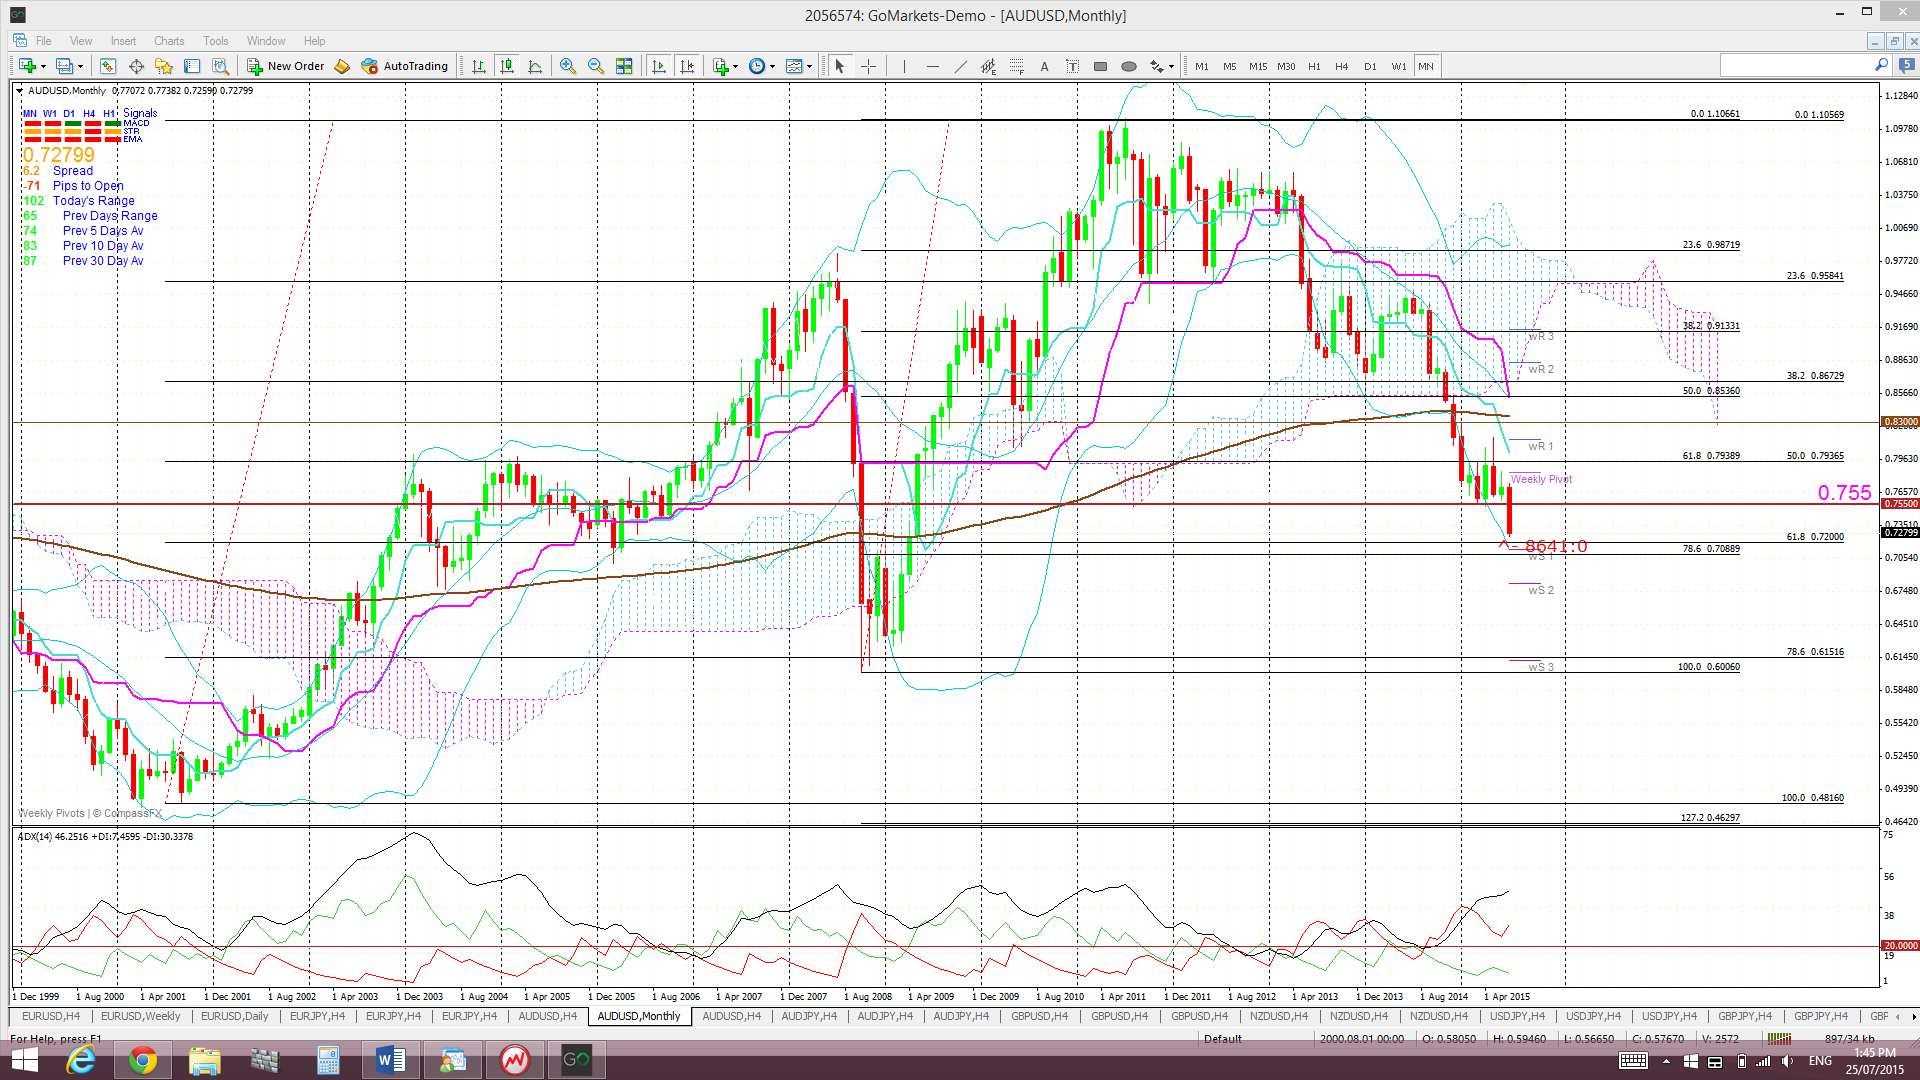
Price is still trading below the Ichimoku Cloud on the 4hr, daily, weekly and monthly charts.
The weekly candle closed as a bearish candle.
- There is an open TC signal on this pair.

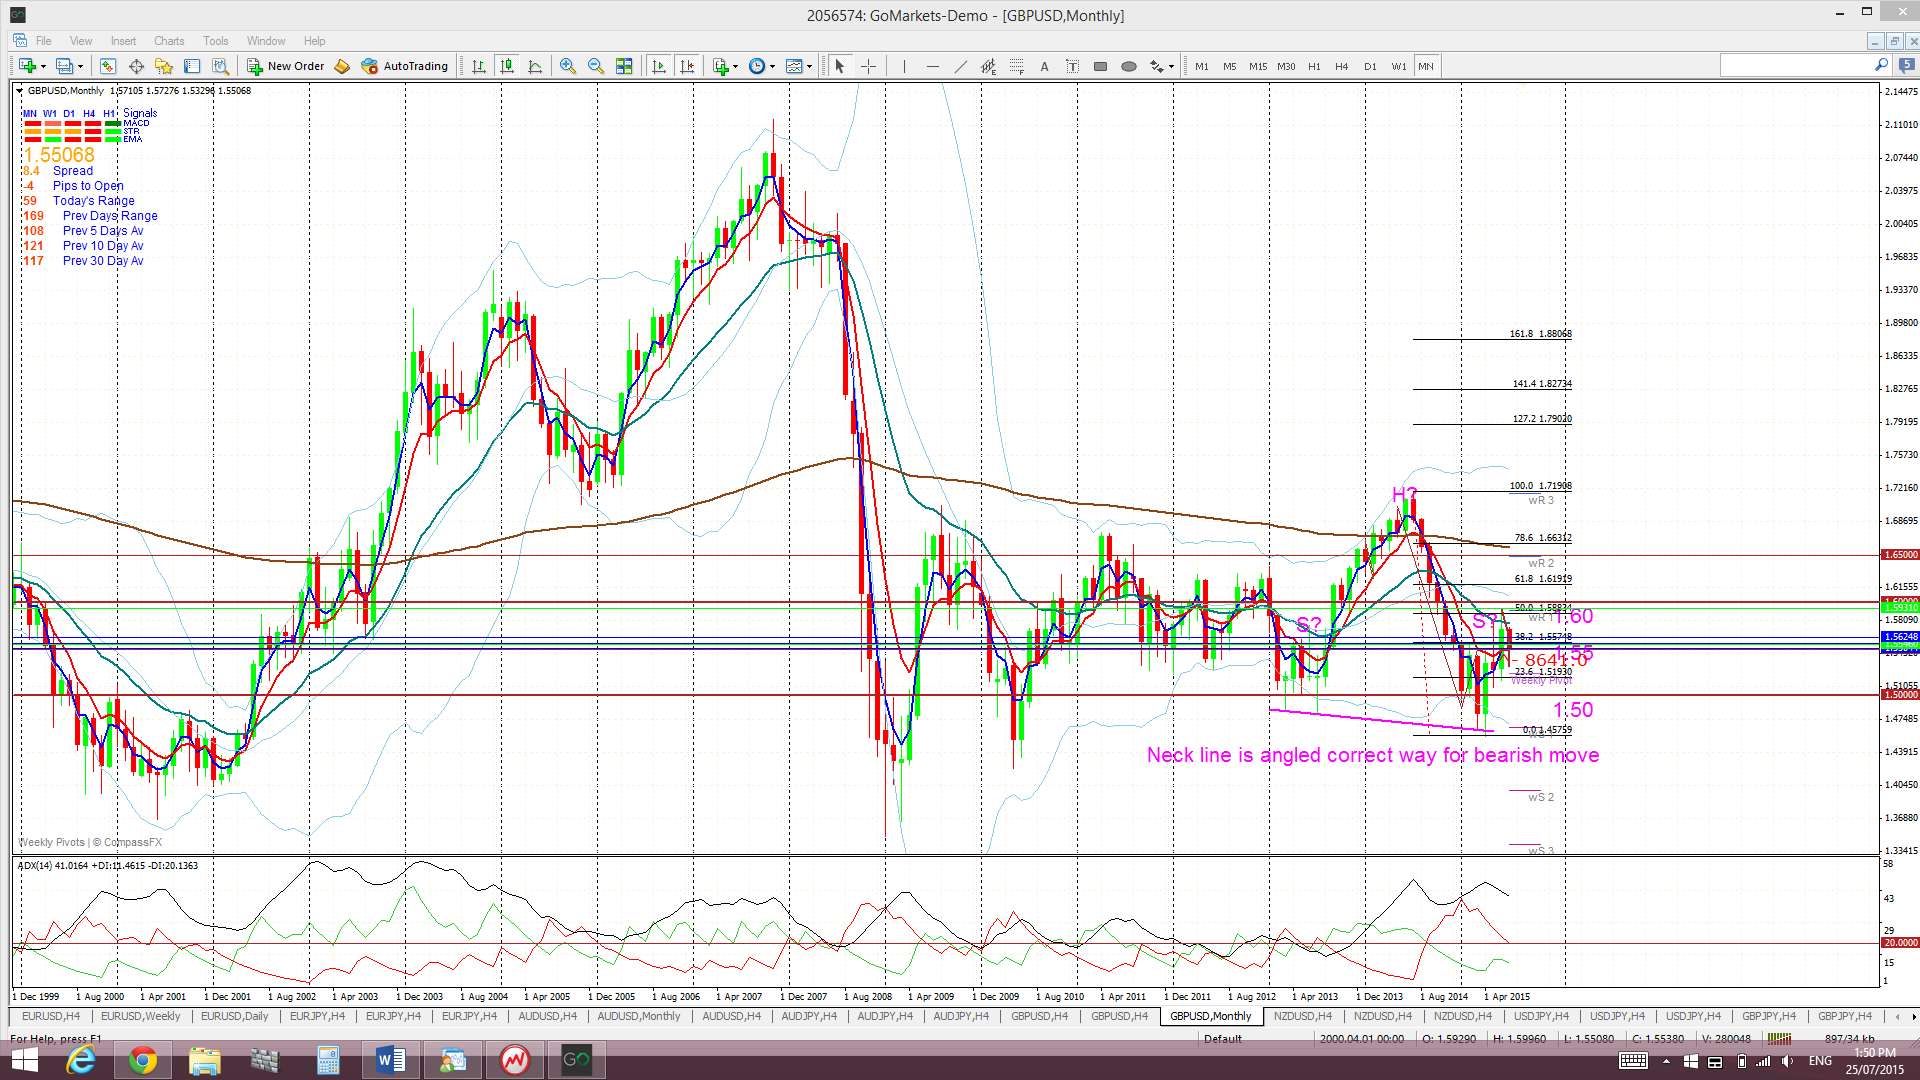
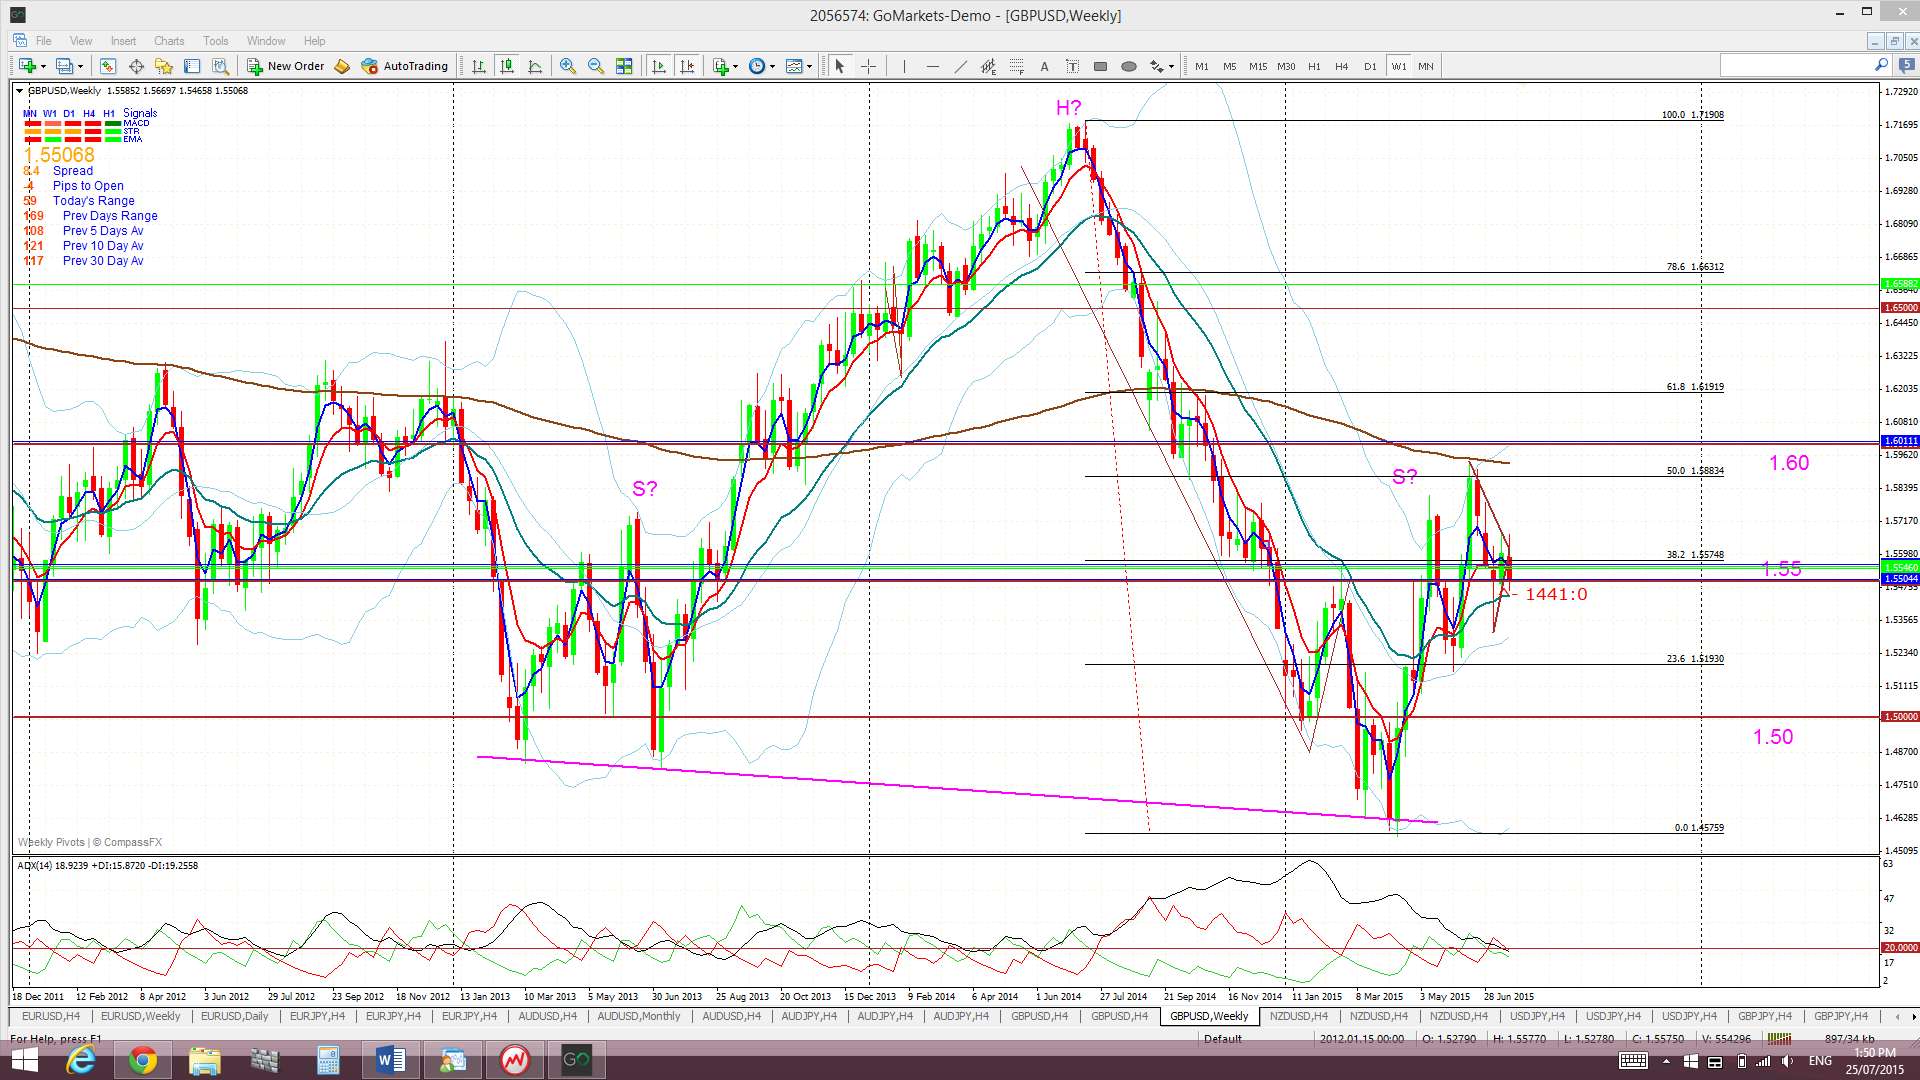
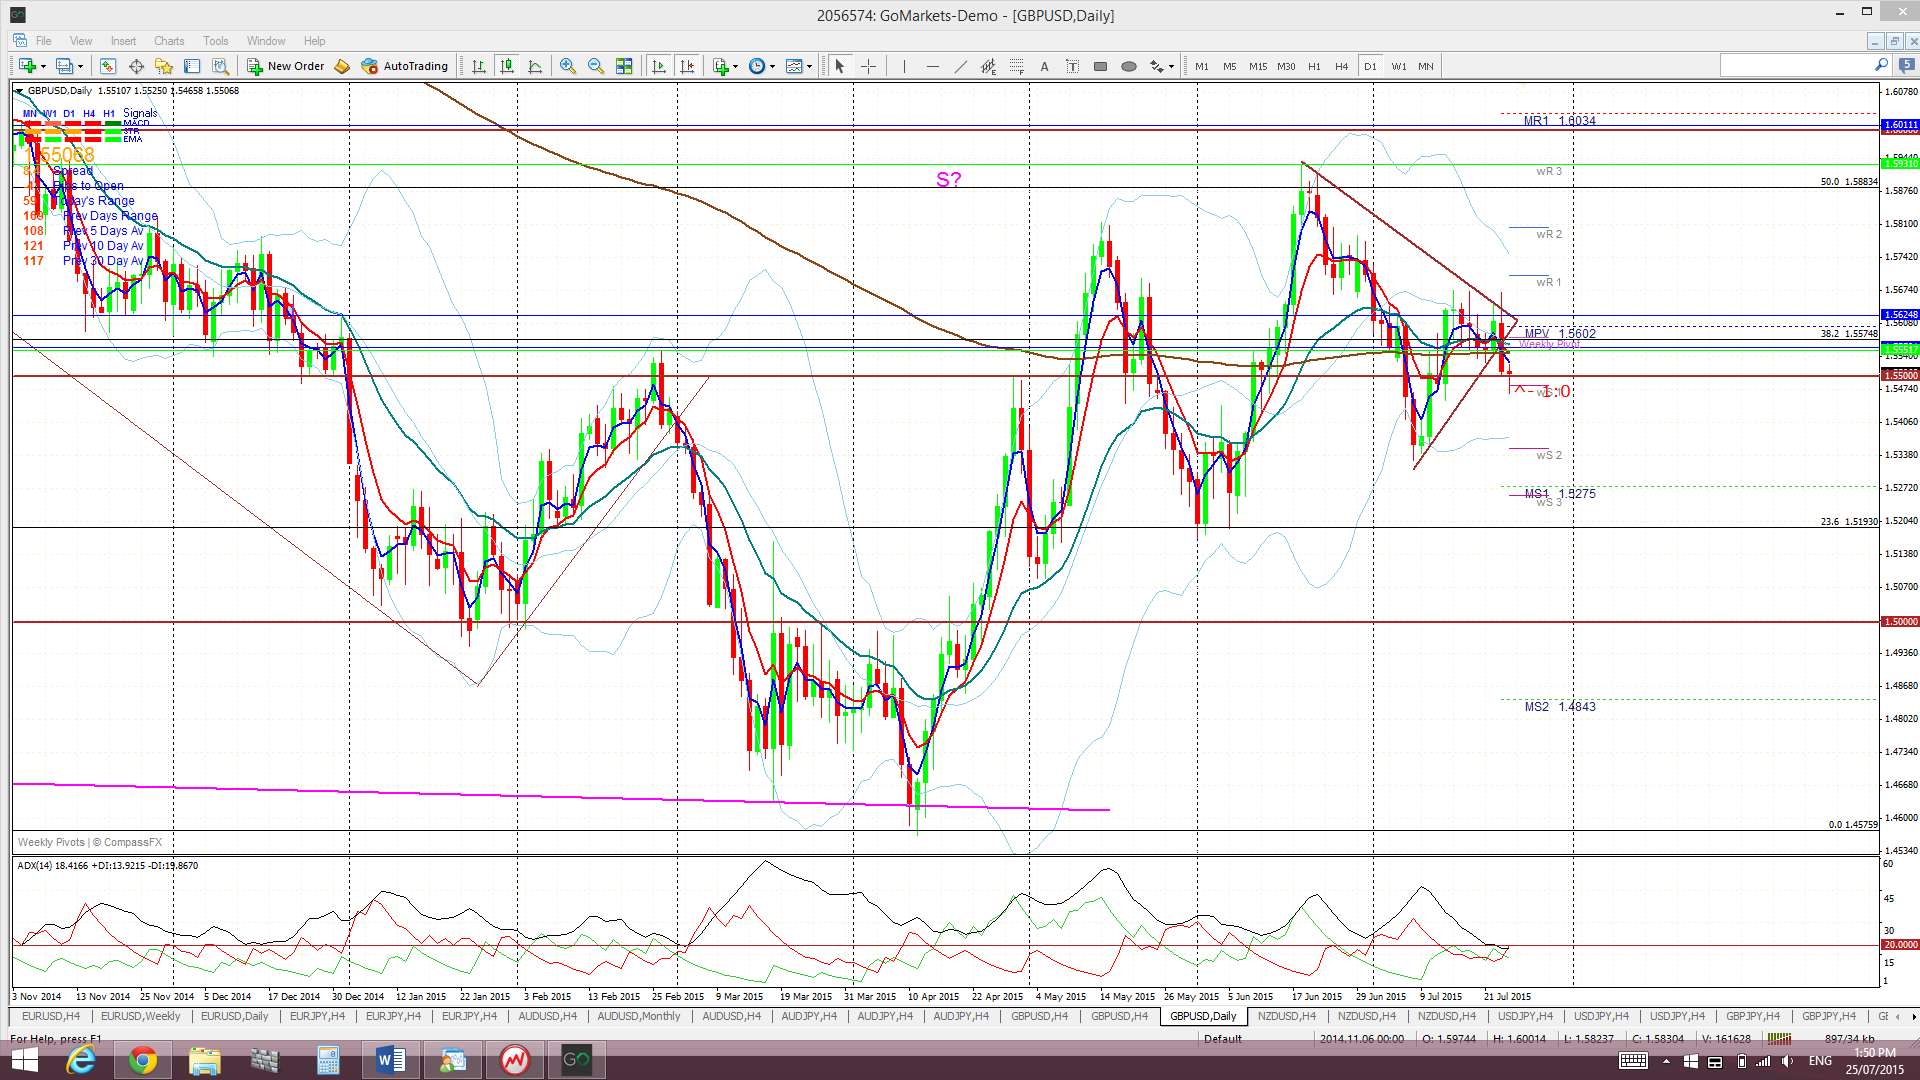
G/U: The Cable remains range bound between 1.55 and 1.60 but had been trading within a symmetrical triangle pattern for much of the week. A bearish breakdown evolved after Thursday’s weaker than expected GBP Retail Sales but there wasn’t much momentum and the 1.55 safety net kicked in shortly after.
Weekly chart H&S: There is still a possible bearish H&S pattern forming on the weekly chart but the failure to break below the ‘neck line’ is holding this pattern off the time being. The height of the pattern is about 2,400 pips and suggests a similar move lower with any break and hold below the ‘neck line’. Recall that the GBP/USD printed a monthly close in March below 1.50, the first since June 2010. This bearish development supports the H&S pattern BUT we will need to see a close and hold below the ‘neck line’ to confirm any such bearish breakdown. I would consider that any close and hold back above 1.60 would void this pattern.
Price is trading in the Cloud on the 4hr and daily charts, below the Cloud on the weekly chart but in the Cloud on the monthly chart.
The weekly candle closed as a bearish coloured, almost, ‘inside’ candle.
There is only one item of high impact GBP news for next week and that is Prelim GDP on Tuesday. FOMC could impact here though too.
- I’m watching for any new TC signal on this pair and the 1.55 level.

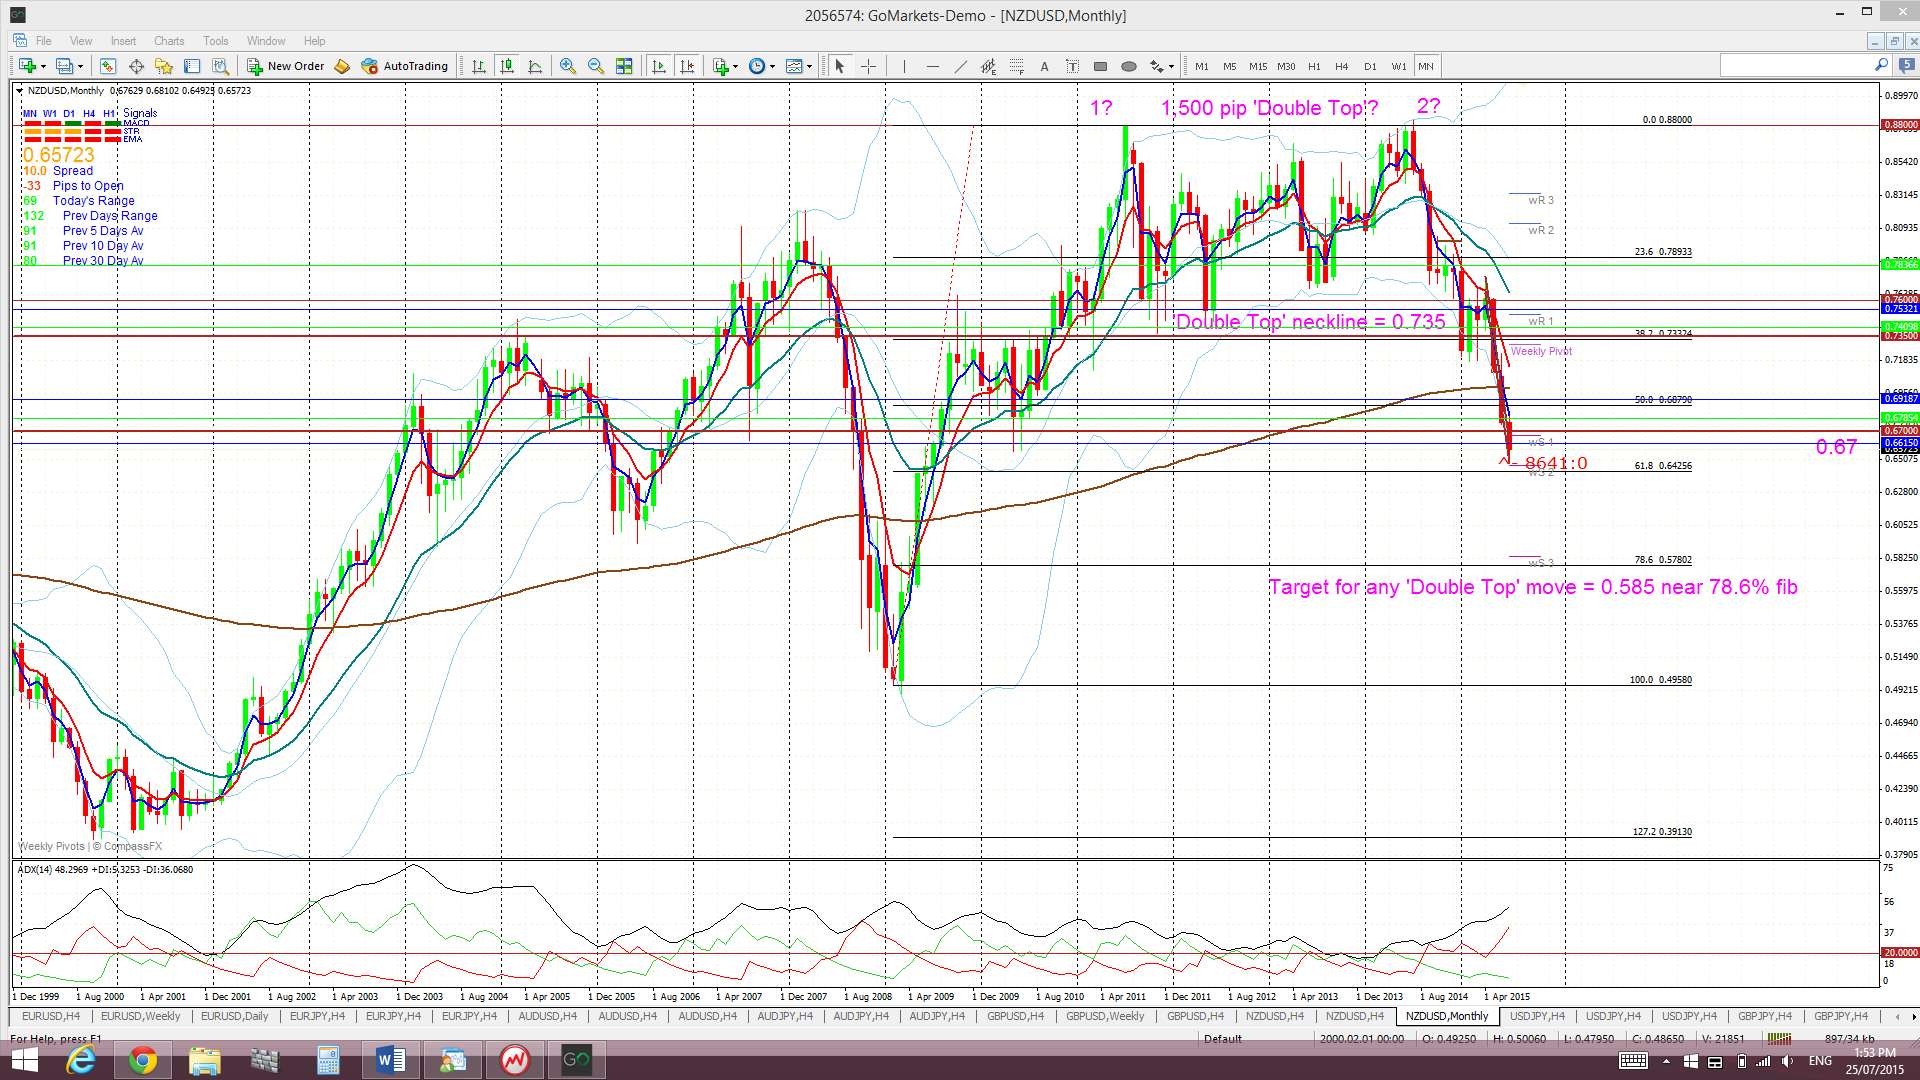
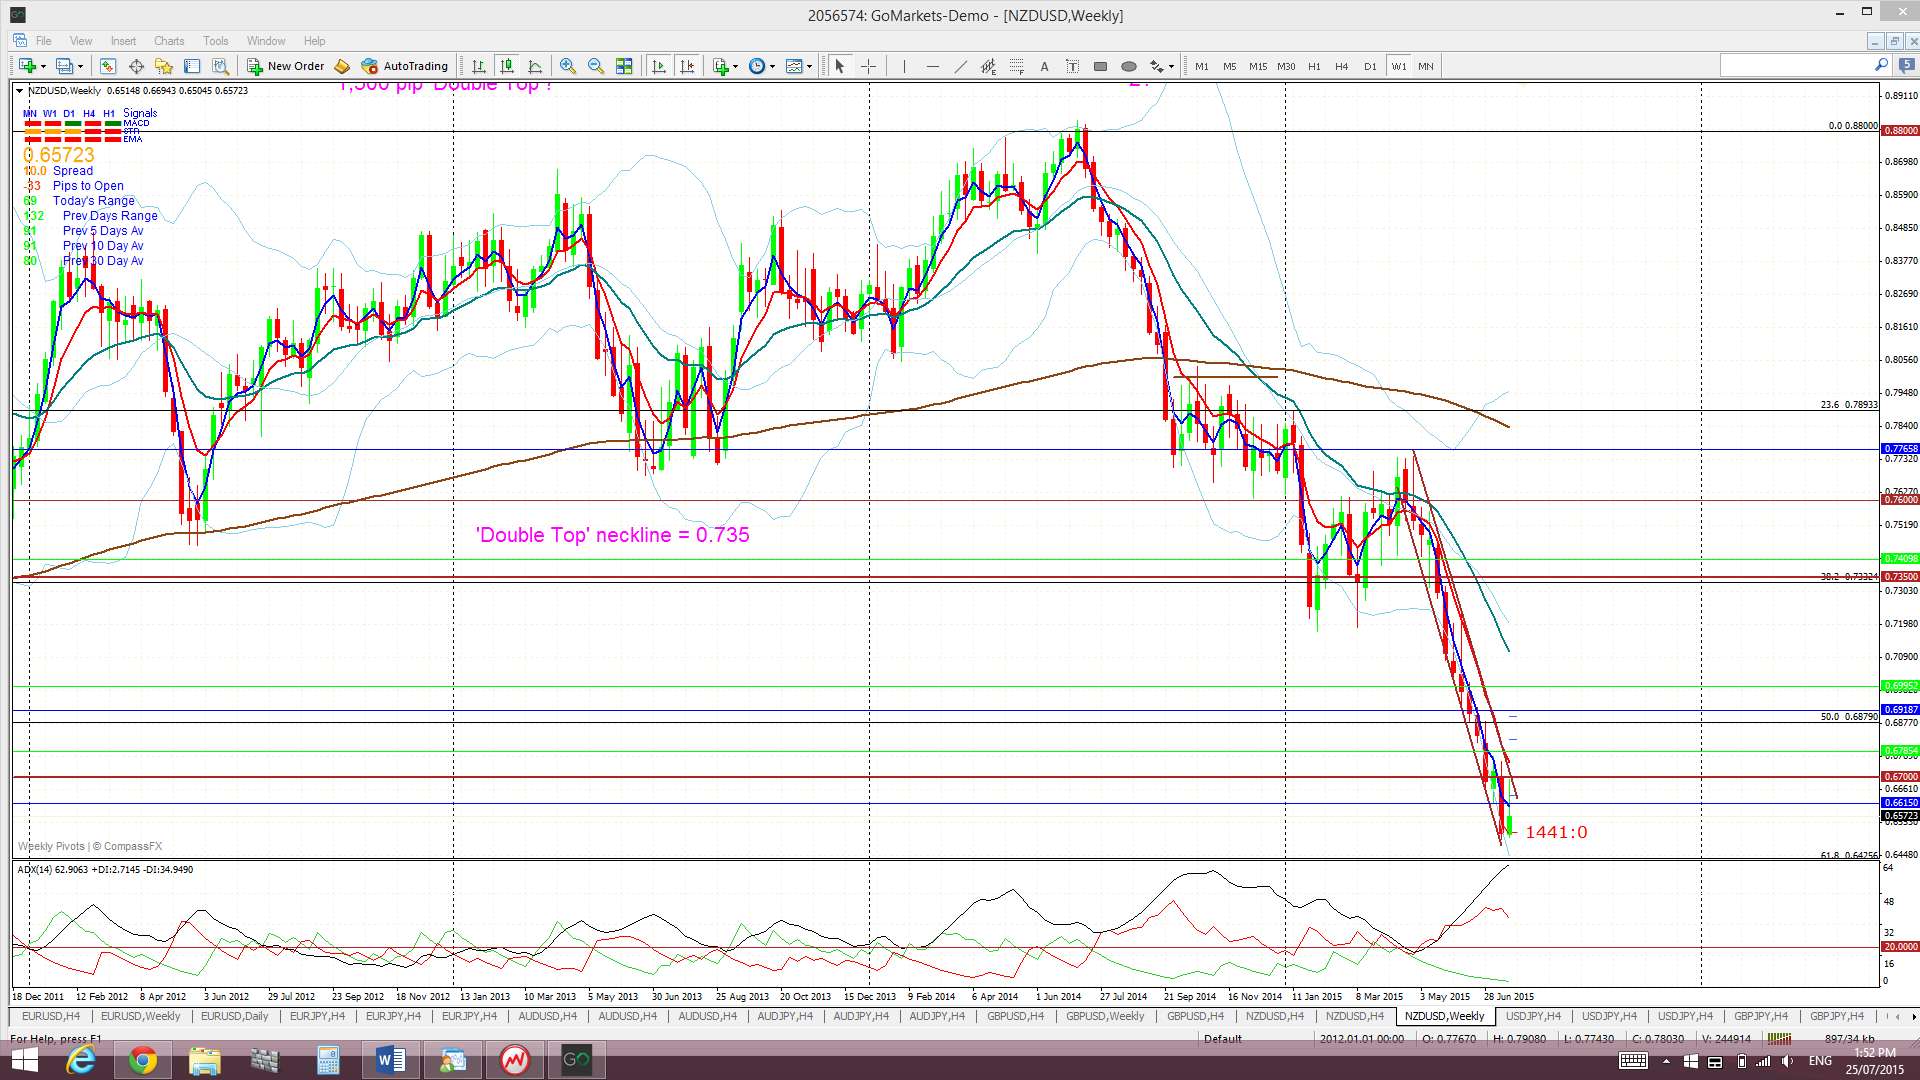
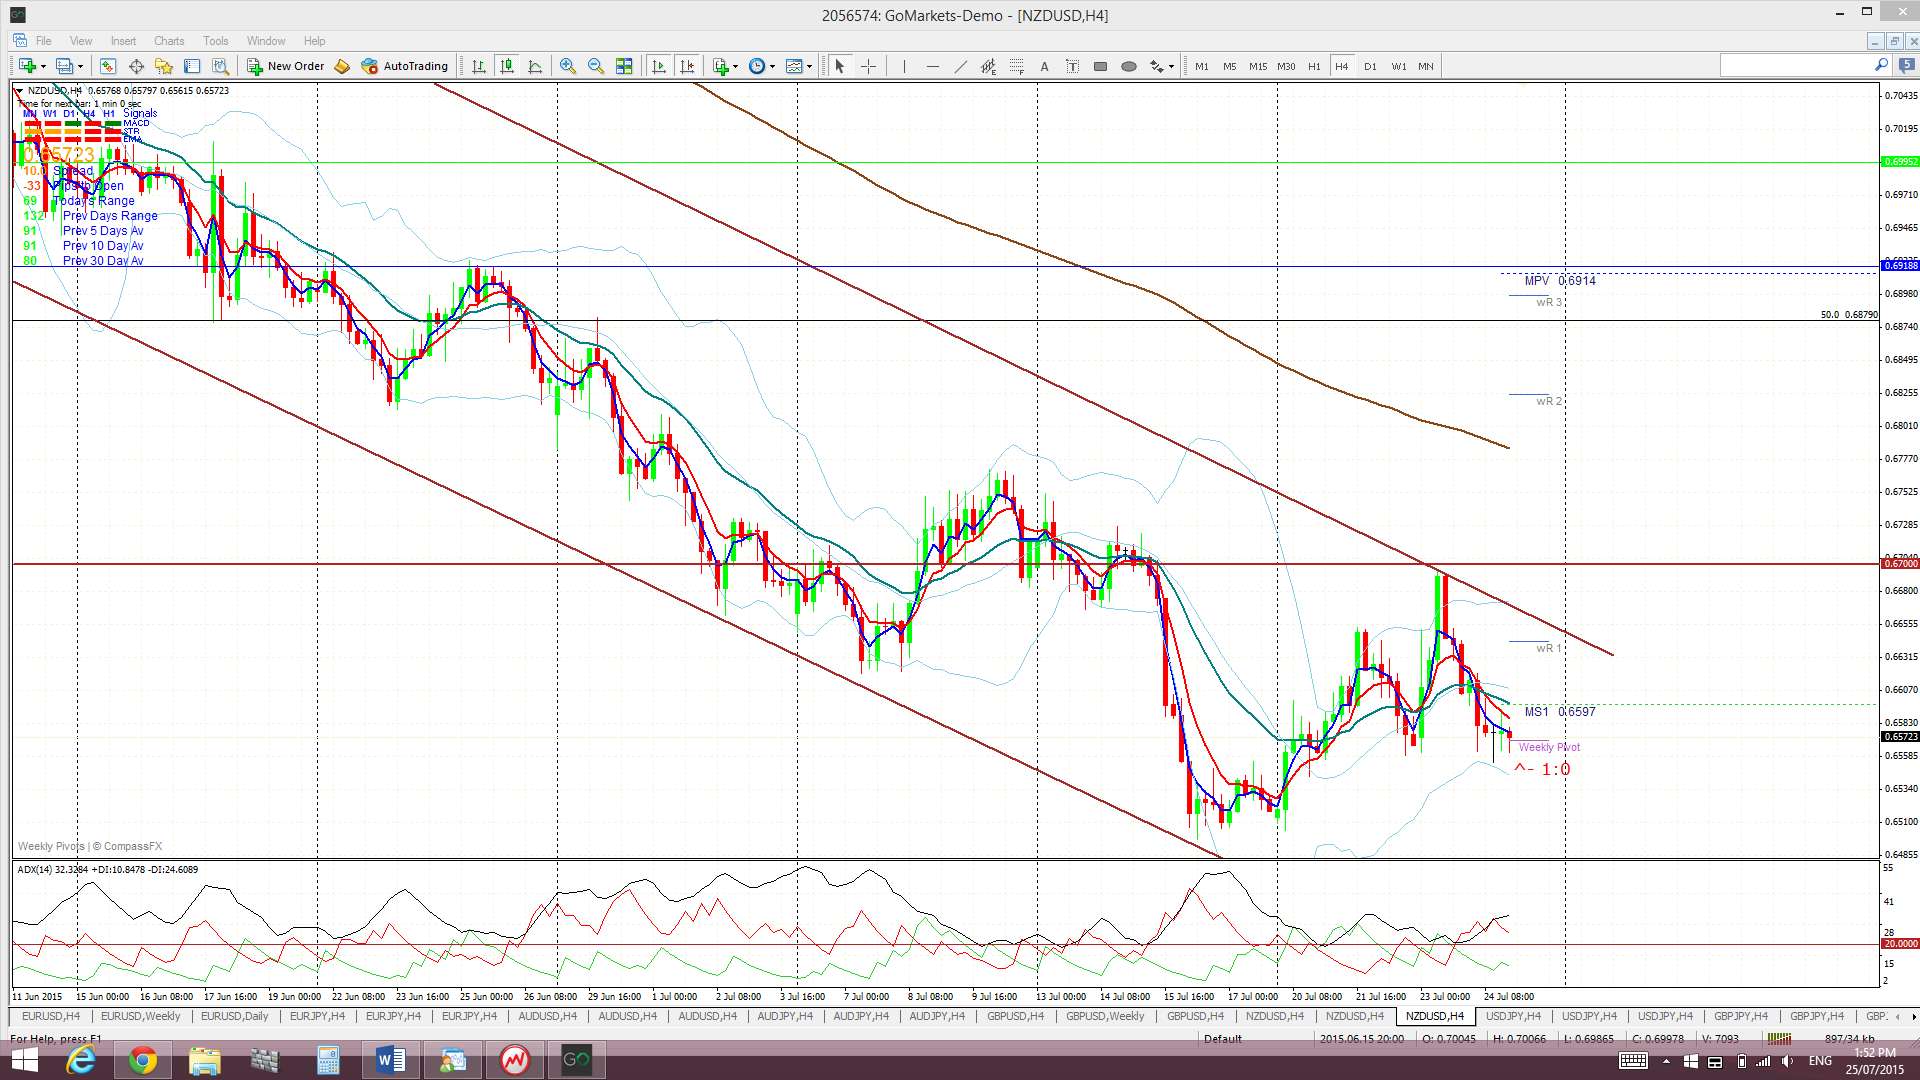
Kiwi: NZD/USD: The Kiwi chopped a bit higher last week but is still trading within a descending trading channel and below the monthly chart’s ‘Double Top’ neck line level of 0.735. I’m on the lookout for any support from the 61.8% fib of the 2008-2011 swing high move and this sits near 0.64.
‘Double Top’ breakdown on Monthly chart? The monthly chart still reveals a possible ‘Double Top’ pattern with a neck line at 0.735. The monthly candle close below this level for January suggested a possible 2,000 pip bearish follow through move as this is the height of the ‘Double Top’. This bearish move has yielded over 800 pips so far.
Price is trading in the Ichimoku Cloud on the 4hr chart but below the Cloud on the daily and weekly charts and monthly charts.
The weekly candle closed as a bullish-reversal ‘Inverted Hammer’ candle so watch out for any bullish follow through from this. There is only NZD ANZ Business Confidence data scheduled for next week that might impact here, other than FOMC that is.
- I’m watching for any new TC signal on this pair and the 61.8% fib level near 0.64.

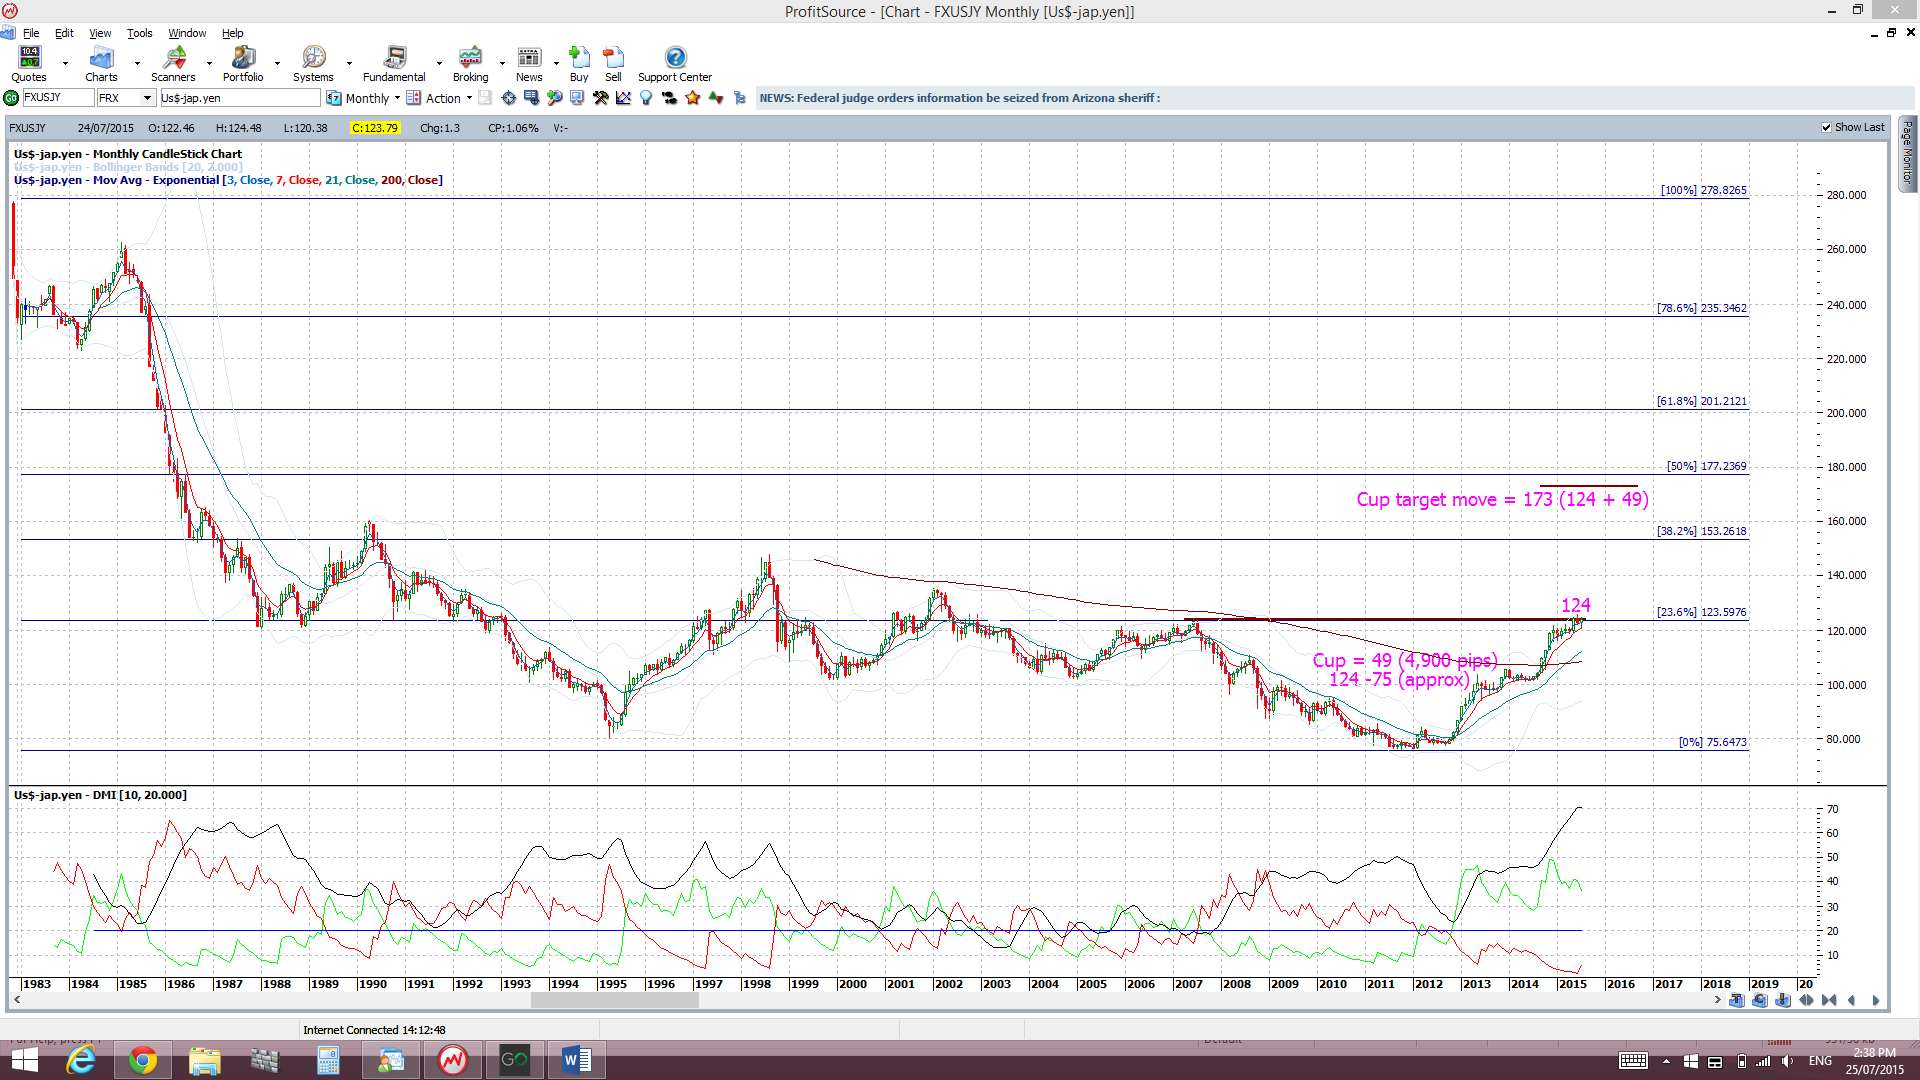
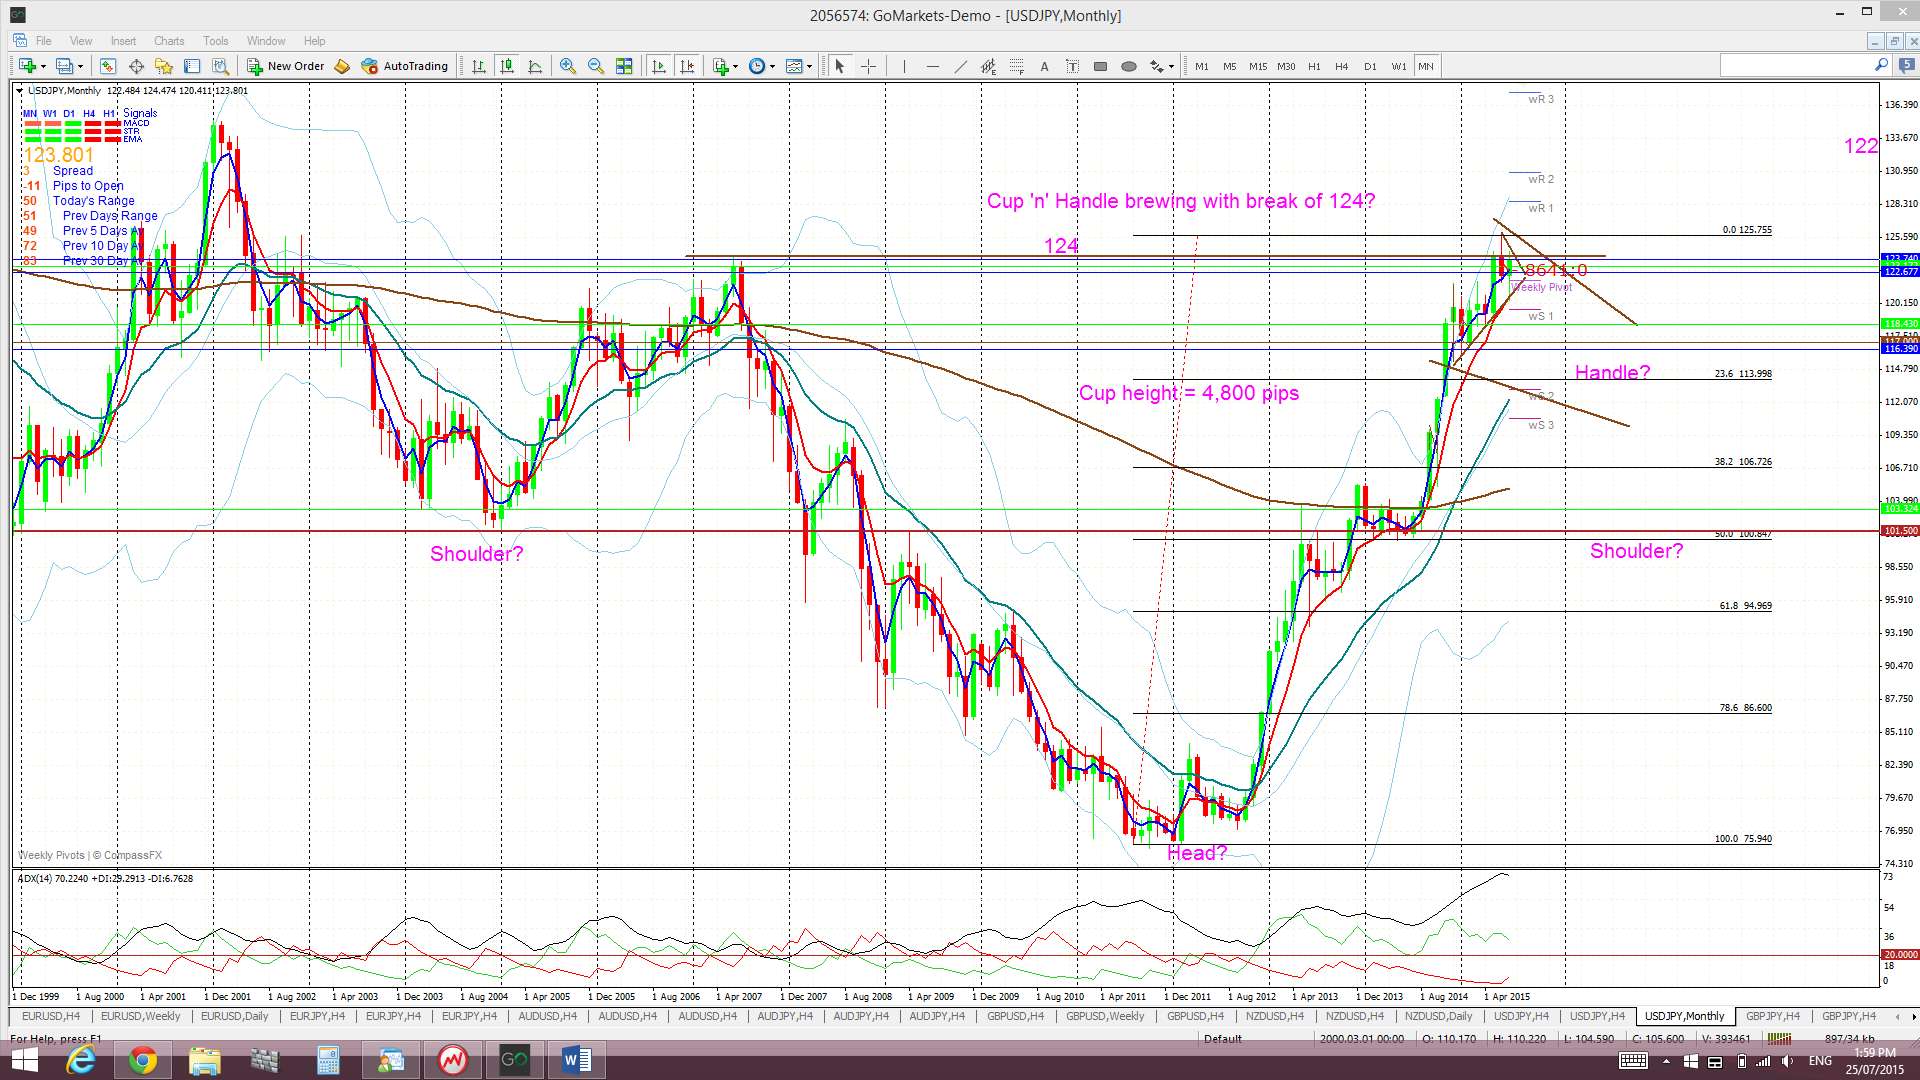
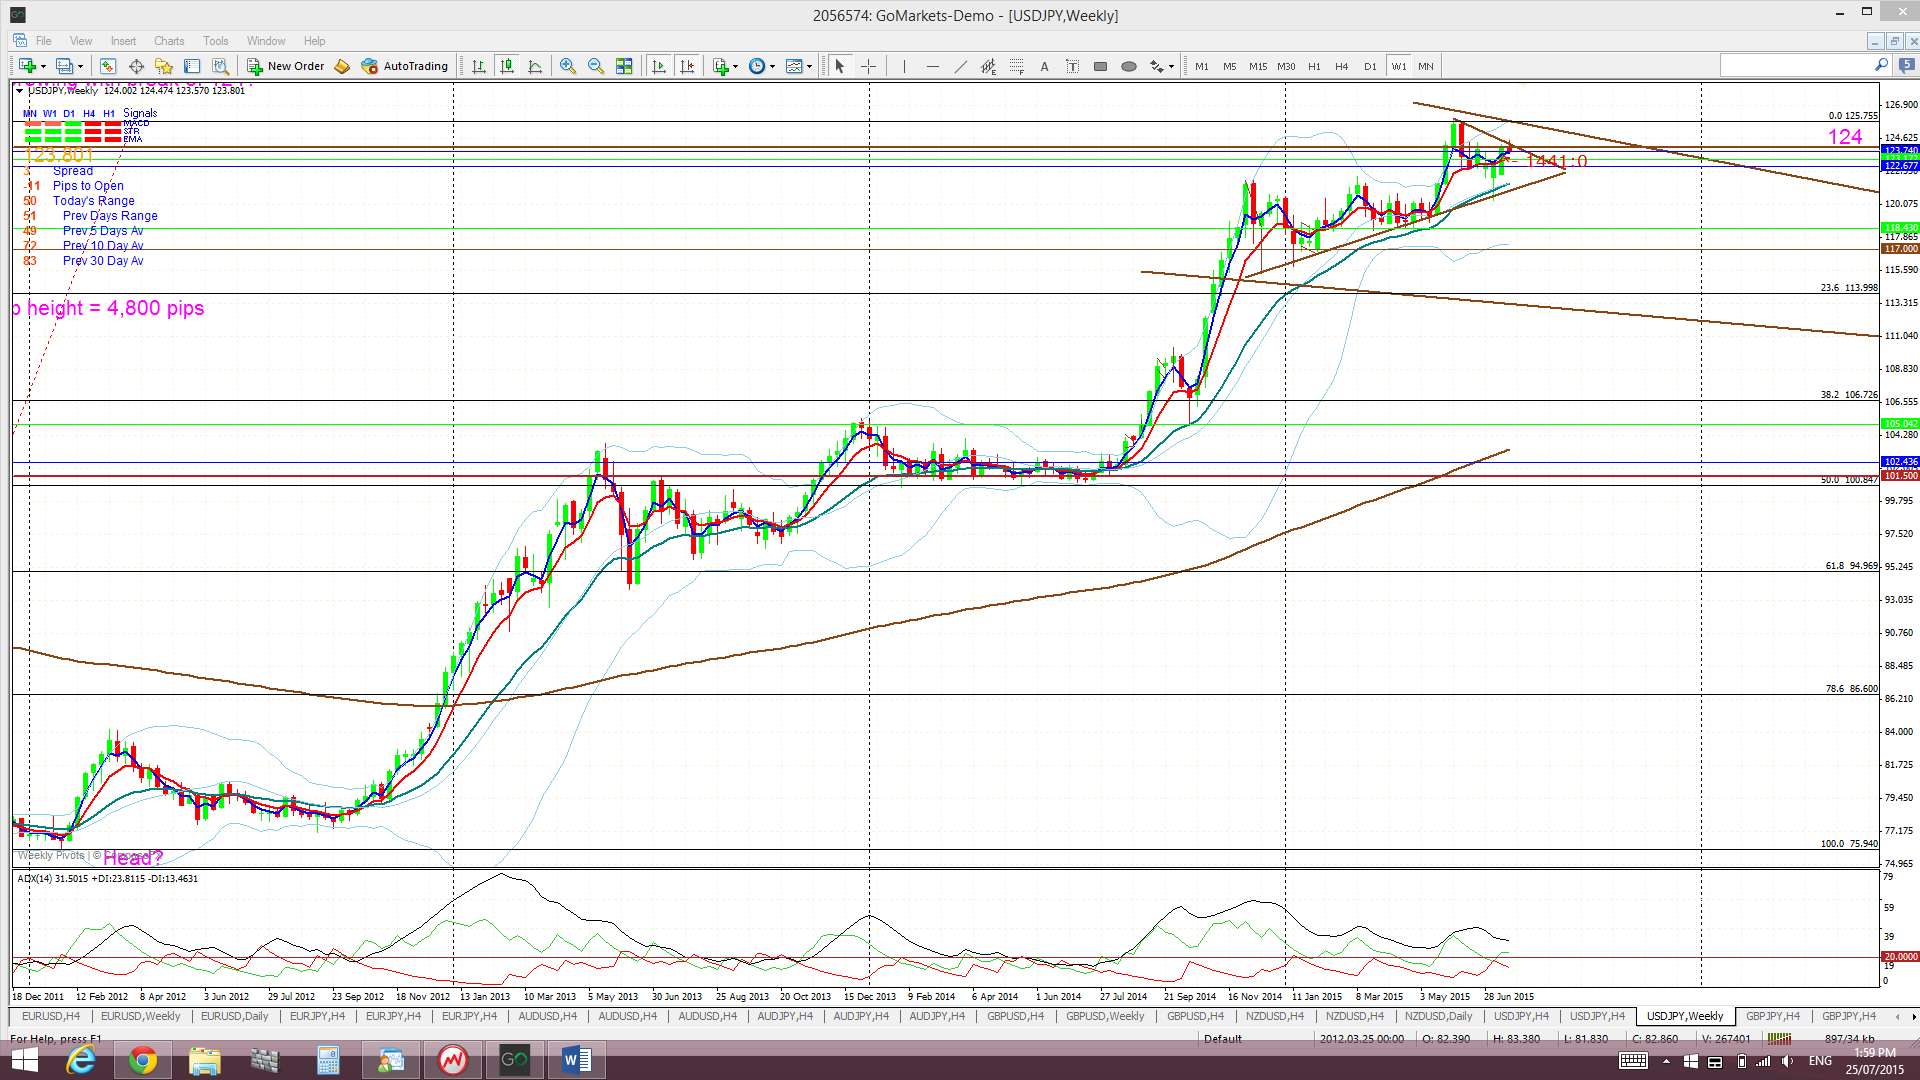
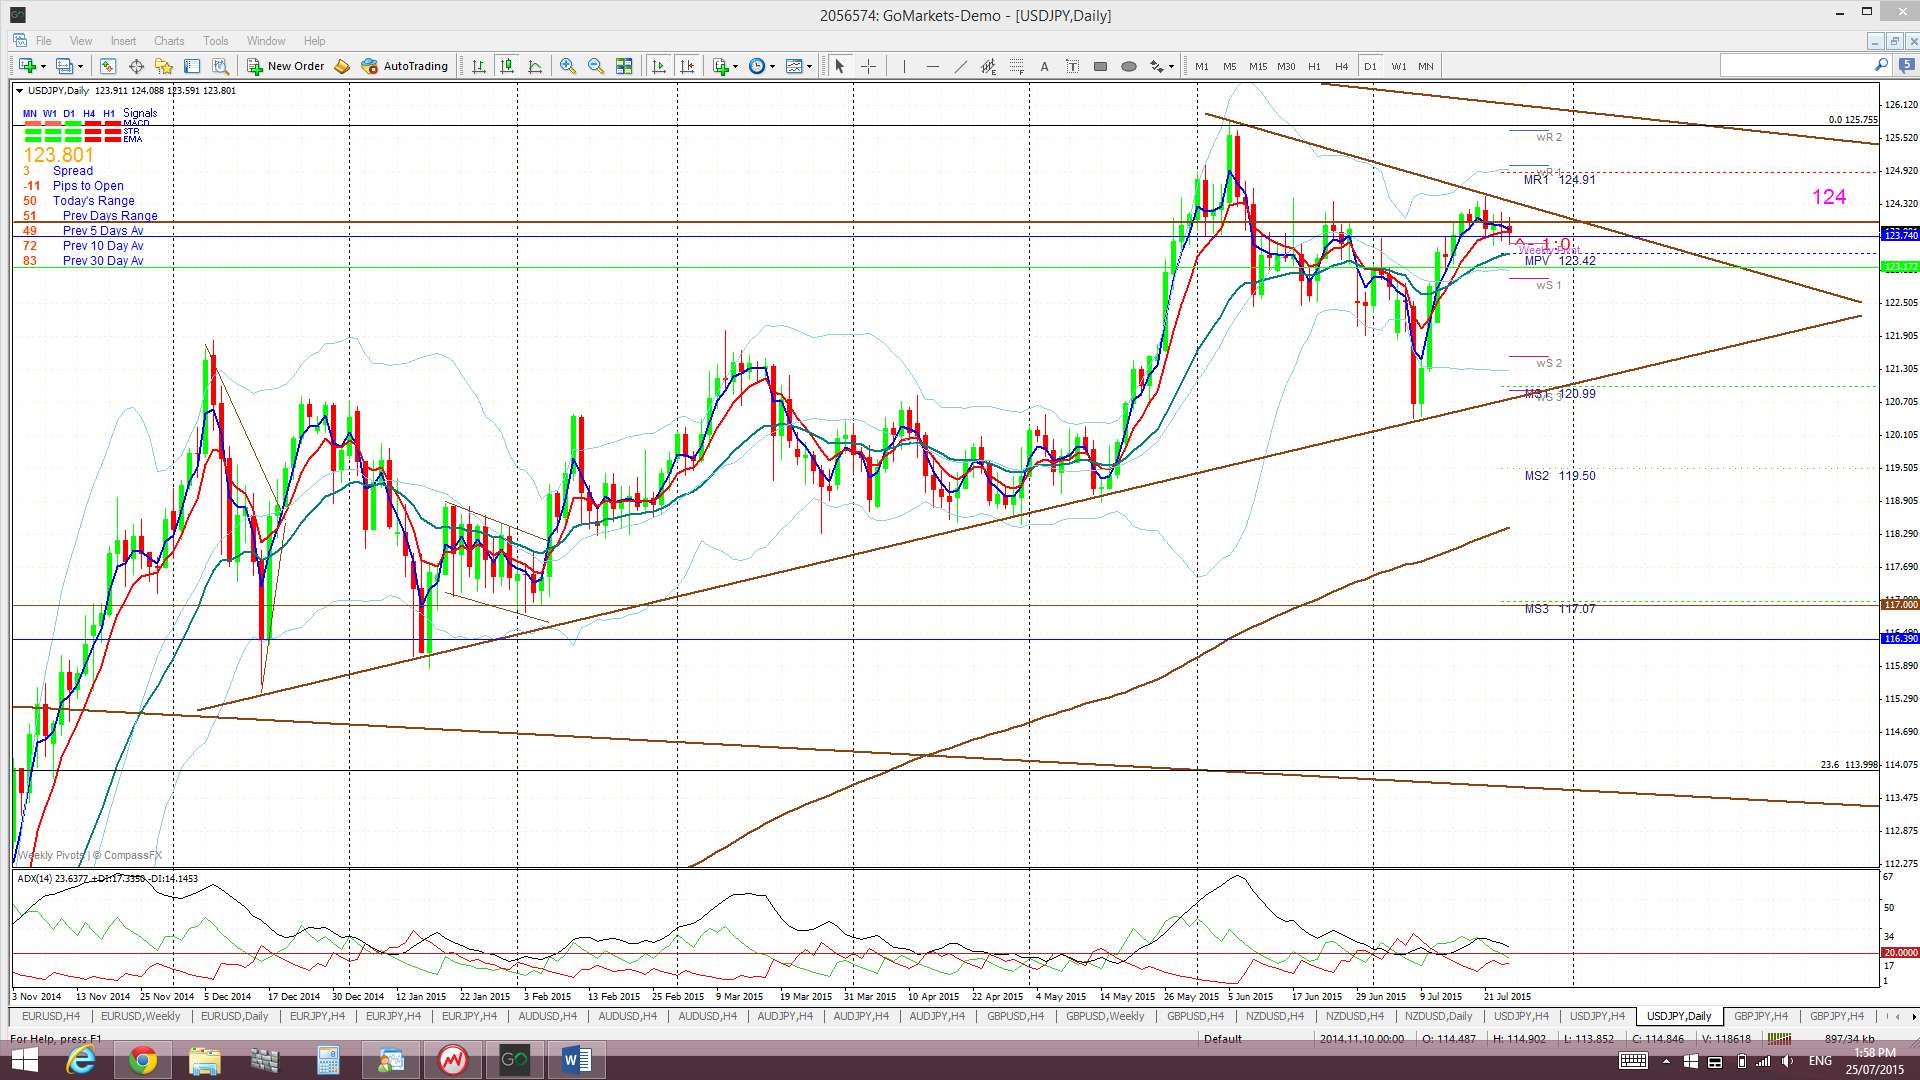
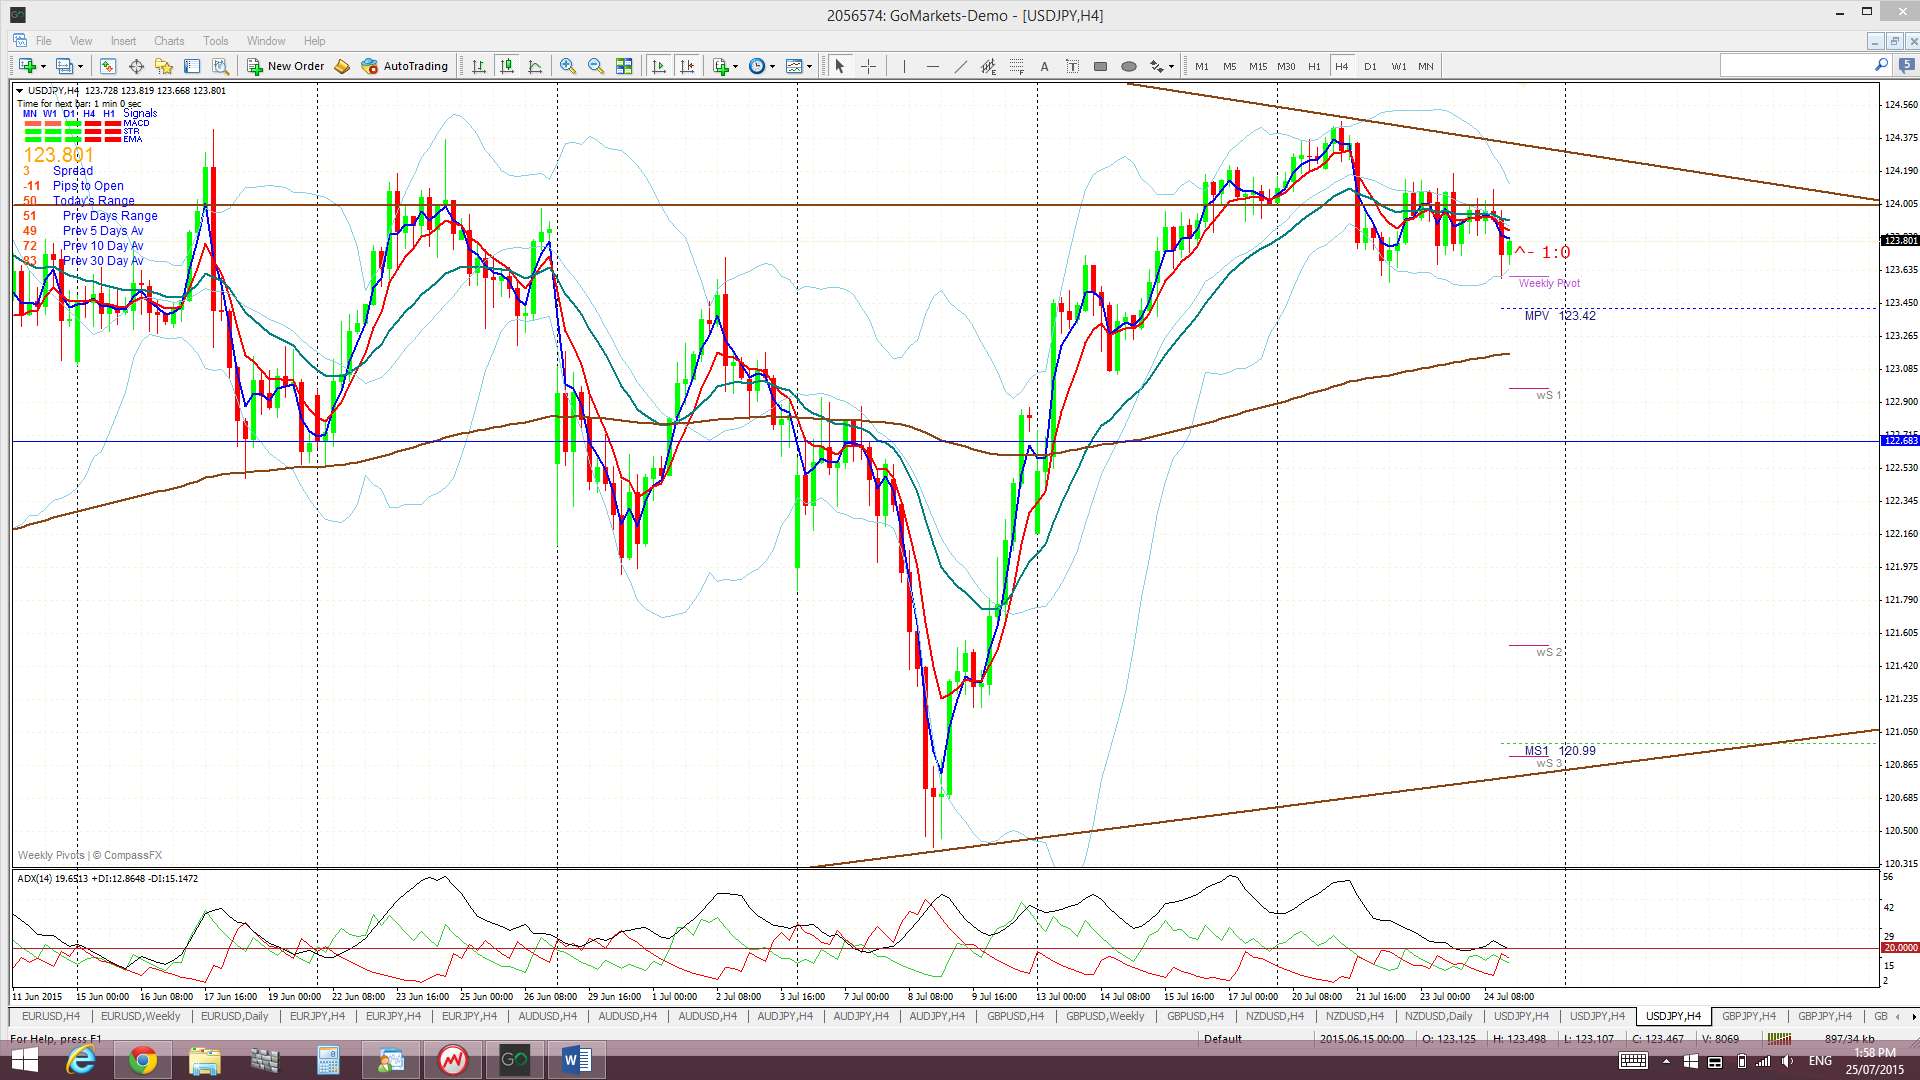
The Yen: U/J: The U/J chopped along either side of the 124 level last week but closed the week below this key S/R level. Remember that 124 represents highs not seen since April 2002 and I have noted over recent weeks how I’m seeing a Cup pattern forming up under this 124 level. I received a new TC long signal above this 124 level during the week but this failed and price action resumed chopping around this key level. At some point though the U/J will depart this 124 region but just ‘when‘ is the $62 question! I wrote a separate article about the U/J during the week and this can be found through the following link.
Price is now trading in the Cloud on the 4hr chart but above the Cloud on the daily, weekly and monthly charts.
The weekly candle closed as a small, bearish coloured Spinning Top/Doji reflecting some indecision here.
Monthly Chart Bullish Cup’ n’ Handle pattern: There looks to be a new bullish Cup ‘n’ Handle forming up on the monthly chart. The theory behind these patterns is that the height of the ‘Cup’ pattern is equivalent to the expected bullish move from the ‘handle’ breakout. The height of the Cup for the U/J weekly chart is around 4,800~ 4,900 pips. This may seem like a massive move but the longer term chart below shows this move to be reasonable as it would take the U/J up near the 50% fib of the 1985-2012 swing low move.
- I’m watching for any new TC signal on this pair and the 124 level.
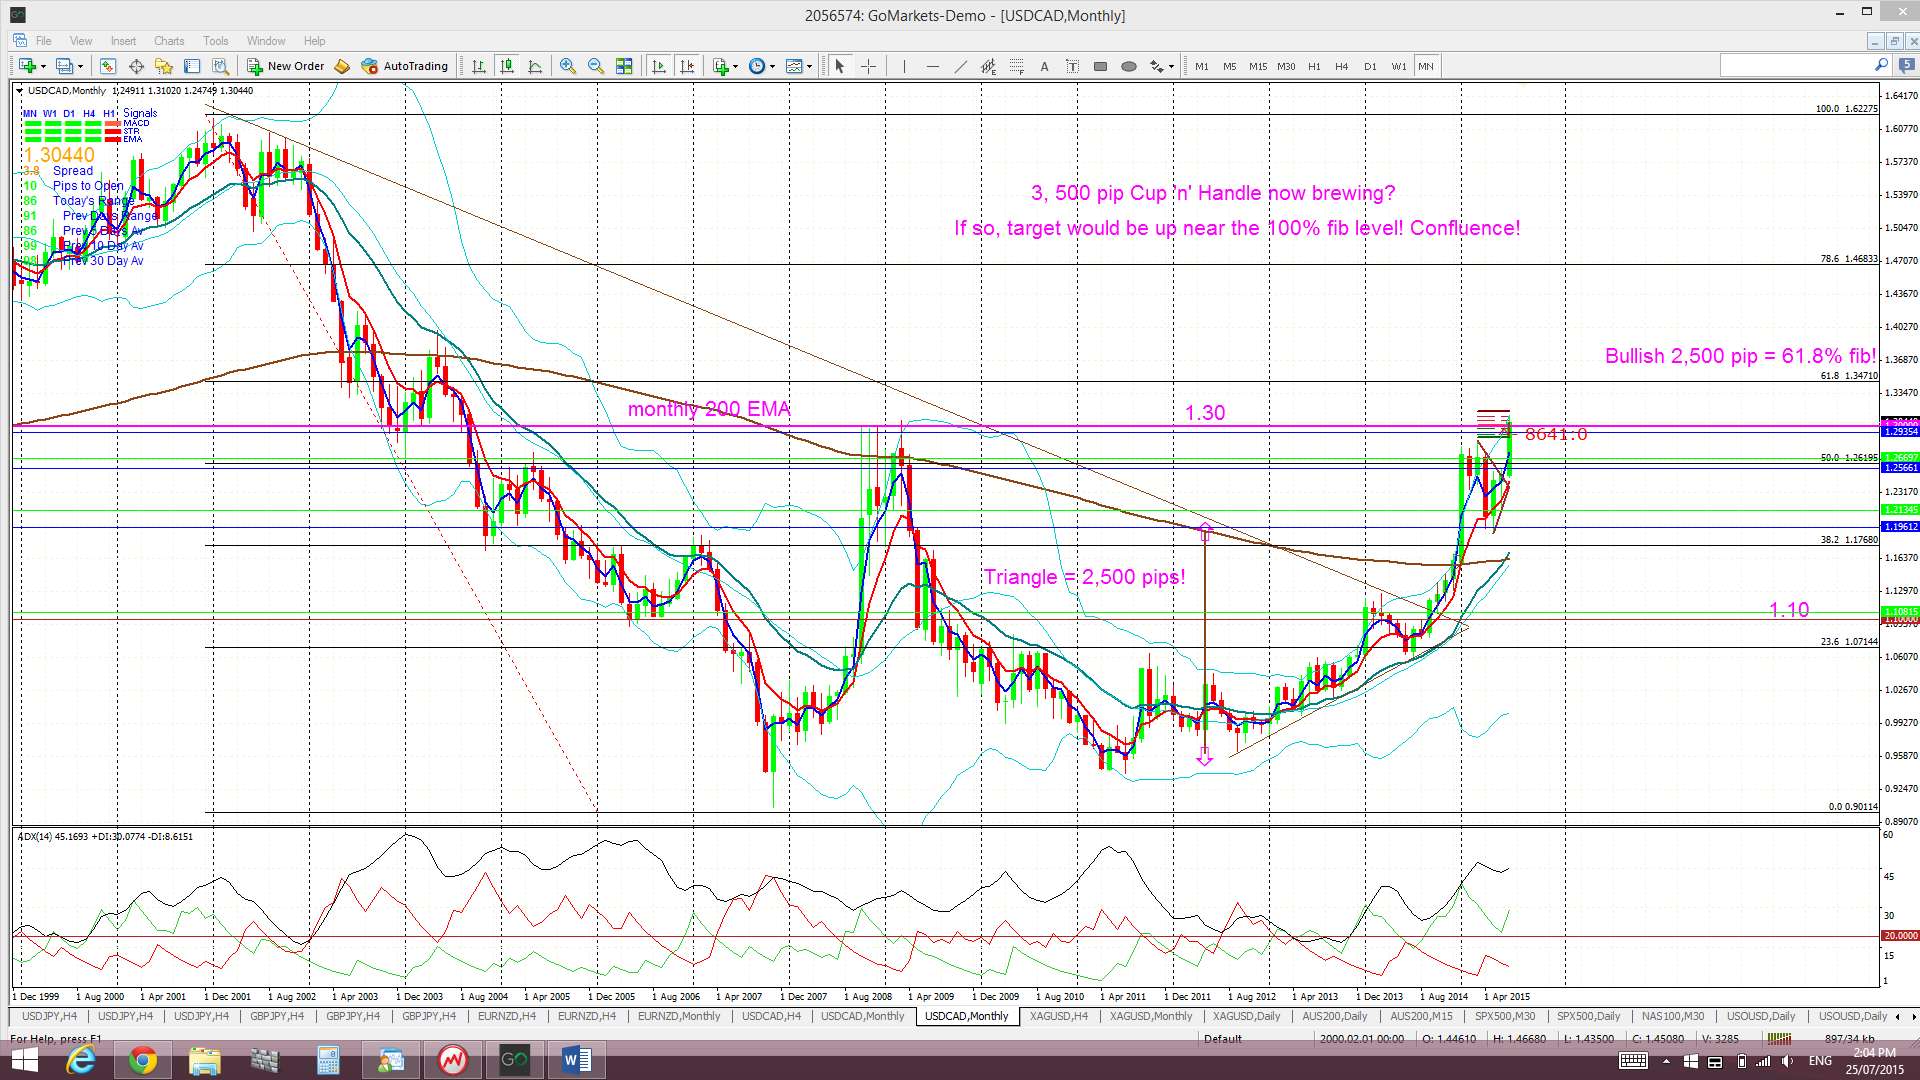
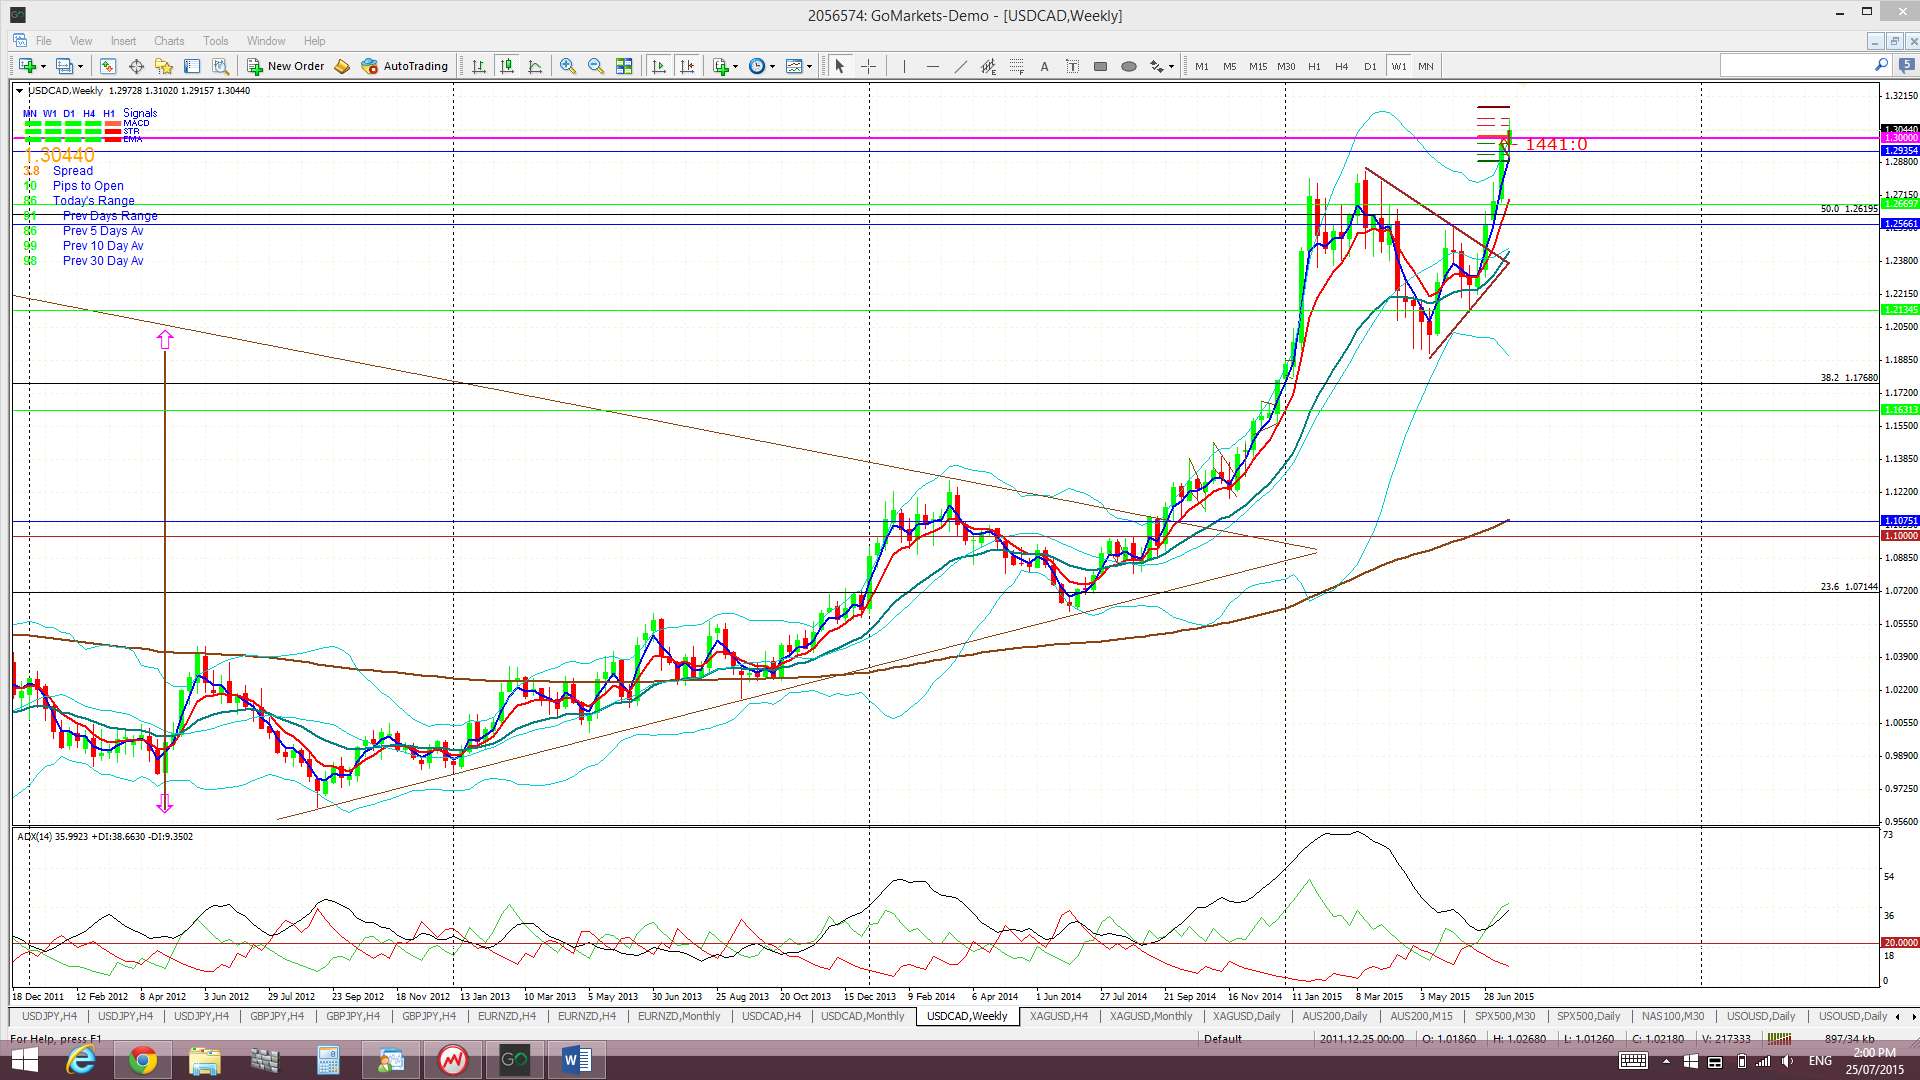
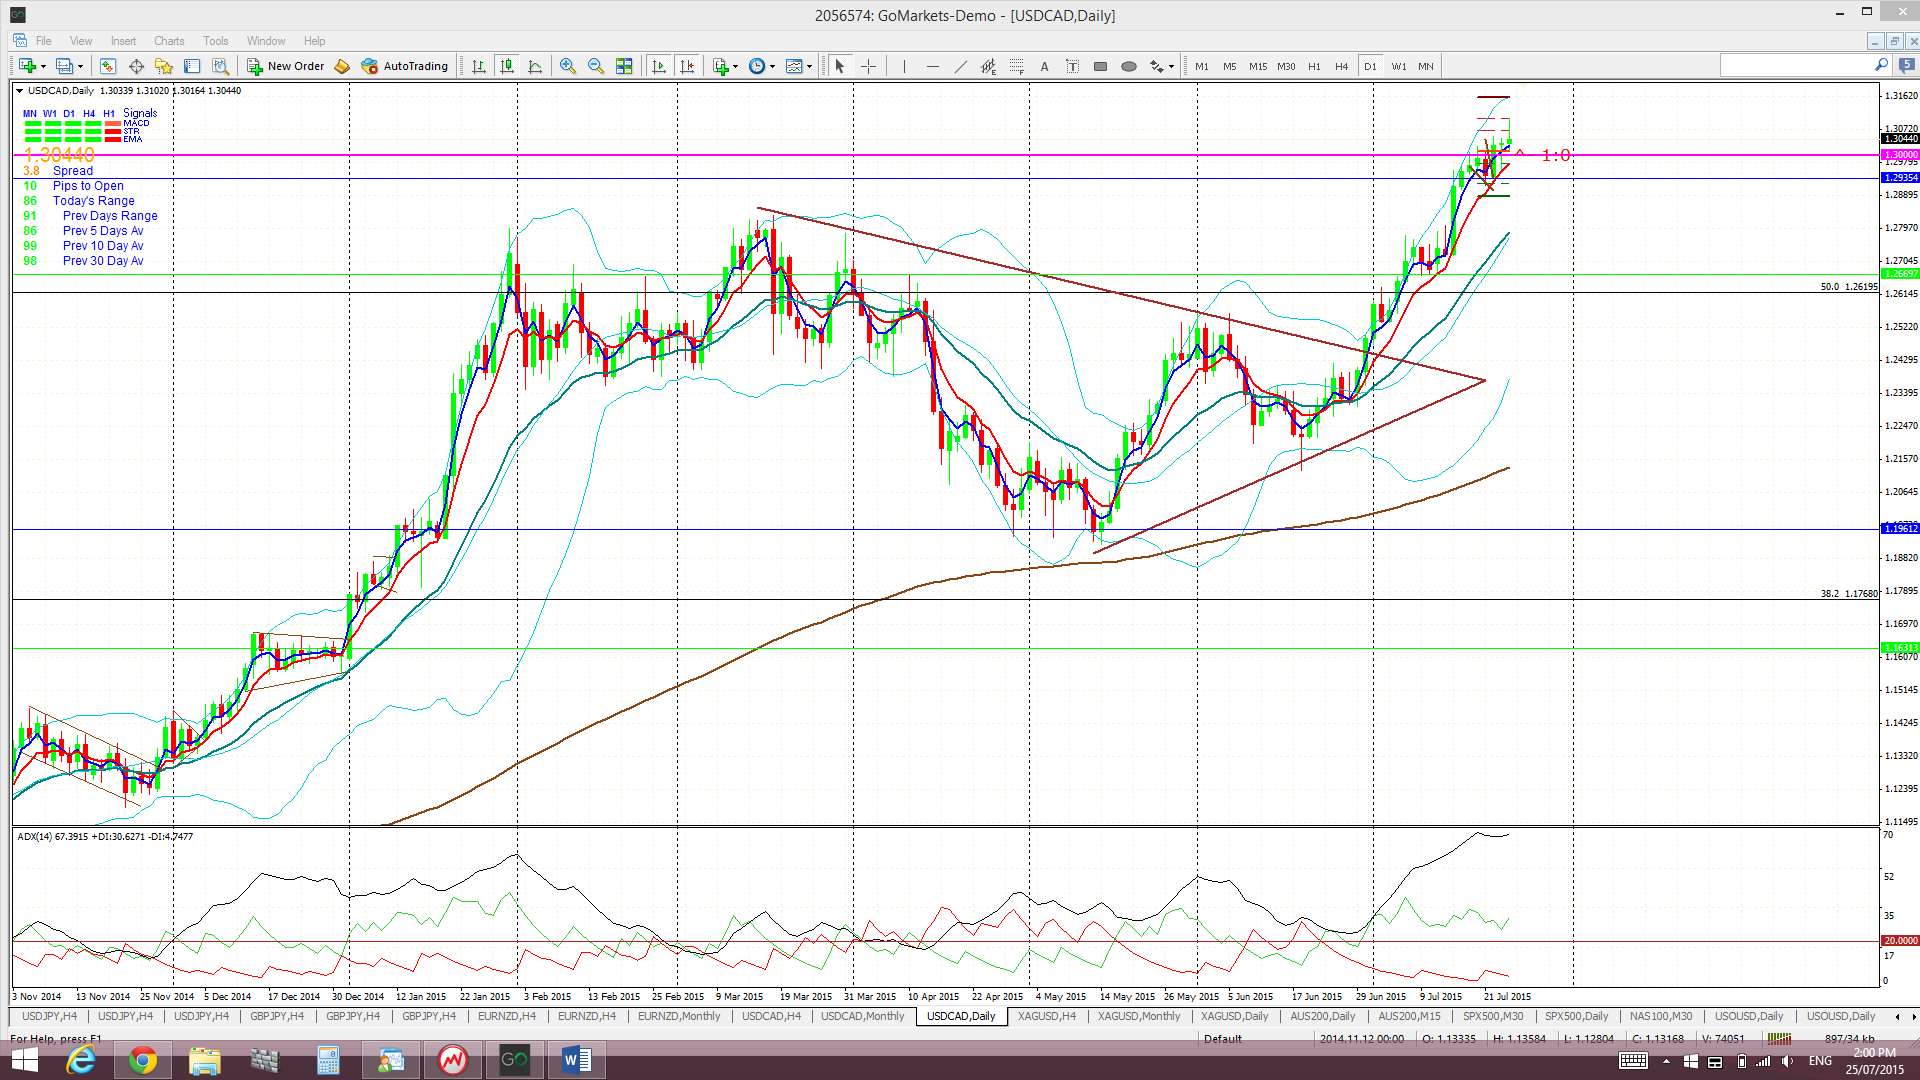
USD/CAD: The USD/CAD has now made a daily and weekly close above the key 1.30 level. The significance of this region can be seen on the monthly chart.
Triangle breakout target: The Loonie had previously broken up and out from a major monthly chart triangle pattern that could deliver up to 2,500 pips. This 2,500 pip figure is evaluated from the height of the triangle. I have used the triangle height from the beginning of the bull trend line, as shown in the monthly chart below. The height of the triangle is around 2,500 pips and, thus, this would be the expected move from any breakout action. Extrapolating a bullish move from this triangle places price up at the 61.8% fib level. These fibs levels are popular targets in retracement moves and so this adds some confluence to this as a possible target. The bullish move has given over 1,900 pips so far.
Monthly Chart Cup ‘n’ Handle? The monthly chart now also shows a possible bullish Cup ‘n’ Handle pattern forming up under the 1.30 level. This is worth keeping an eye on as the pattern would be worth up to 3,500 pips if it was to evolve as this is the height of the ‘Cup’. The interesting point is that the target for this pattern would put price up at the highs reached back in 2002 and this is equal to a 100% Fib retracement of the 2002-2007 bear move.
Price is trading above the Cloud on the 4hr, daily, weekly and monthly charts.
There is CAD GDP data on Friday to watch out for but the price of Oil is also a key factor here. A continued slide with Oil will put pressure on the CAD and help to boost this pair. Watch for impact from FOMC as well.
The weekly candle closed as a bullish candle.
- I’m watching for any new TC signal on this pair and the 1.30 level.

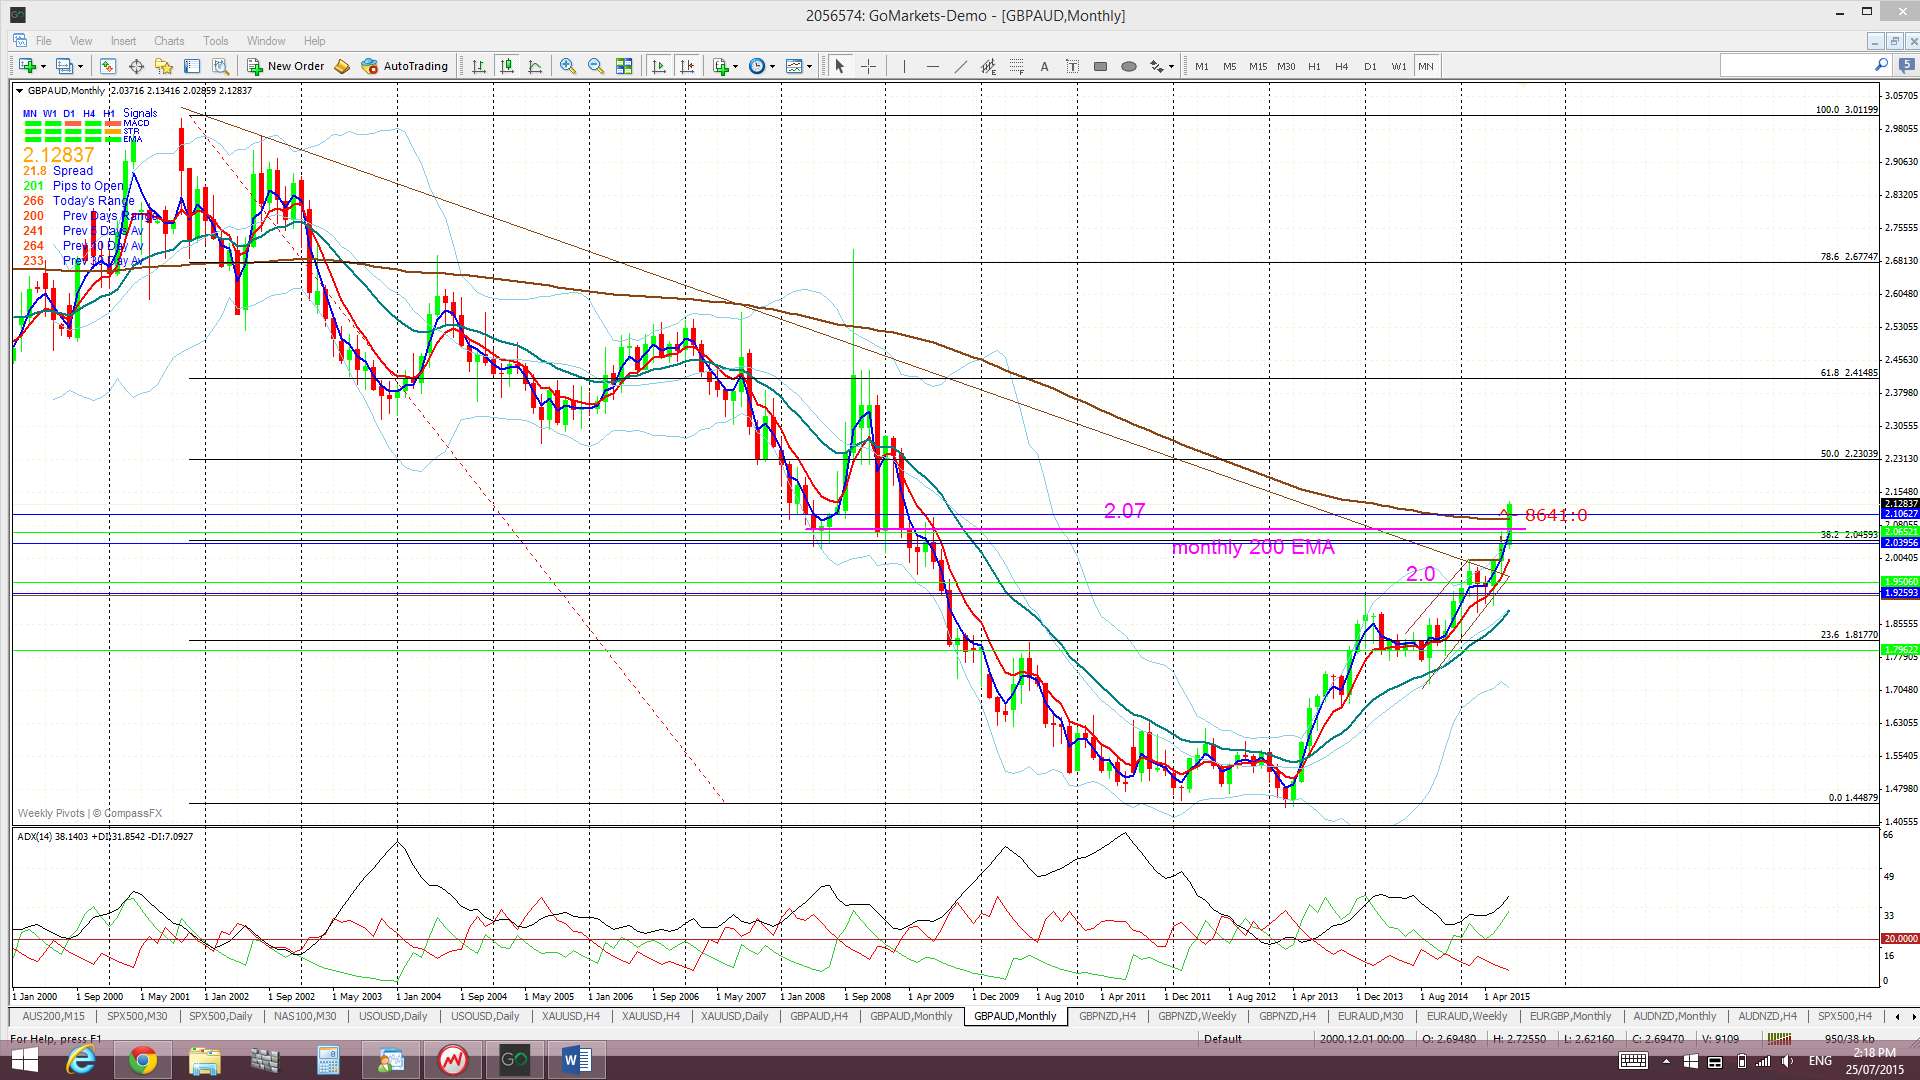
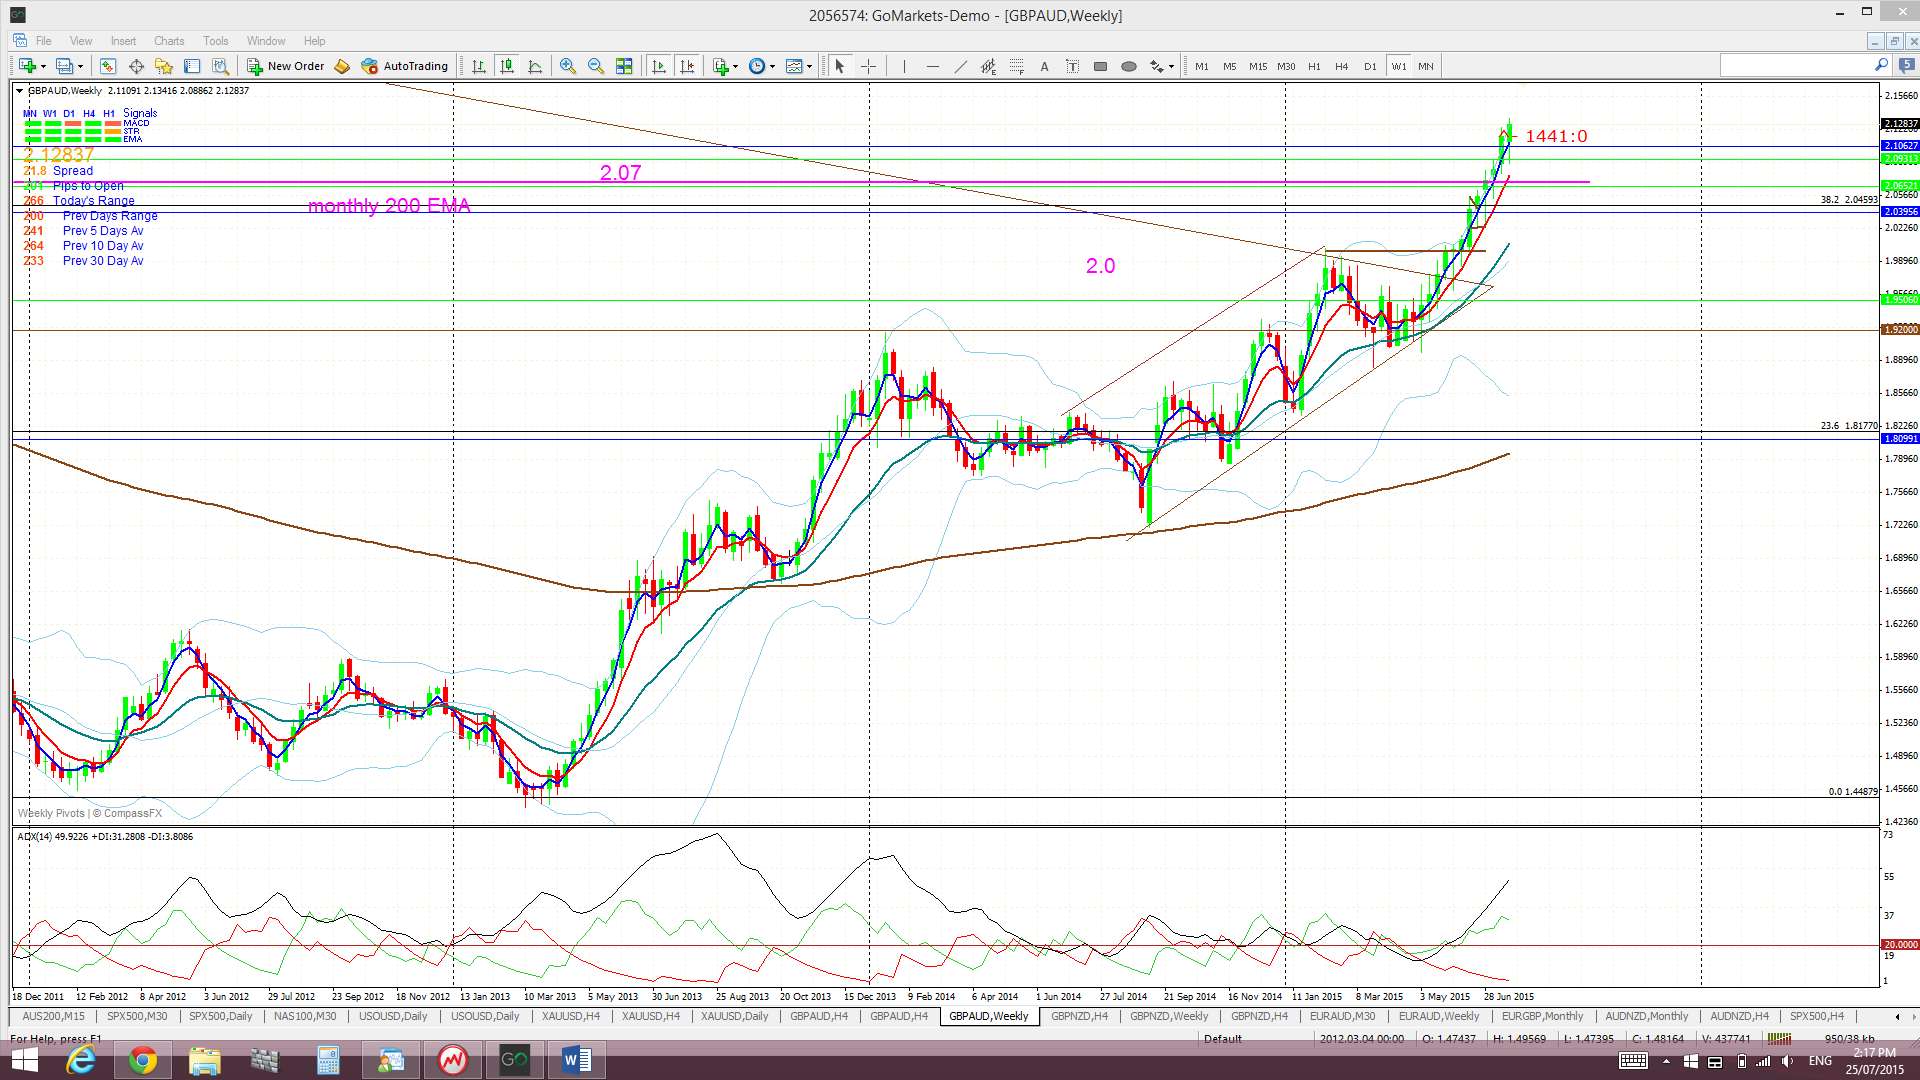
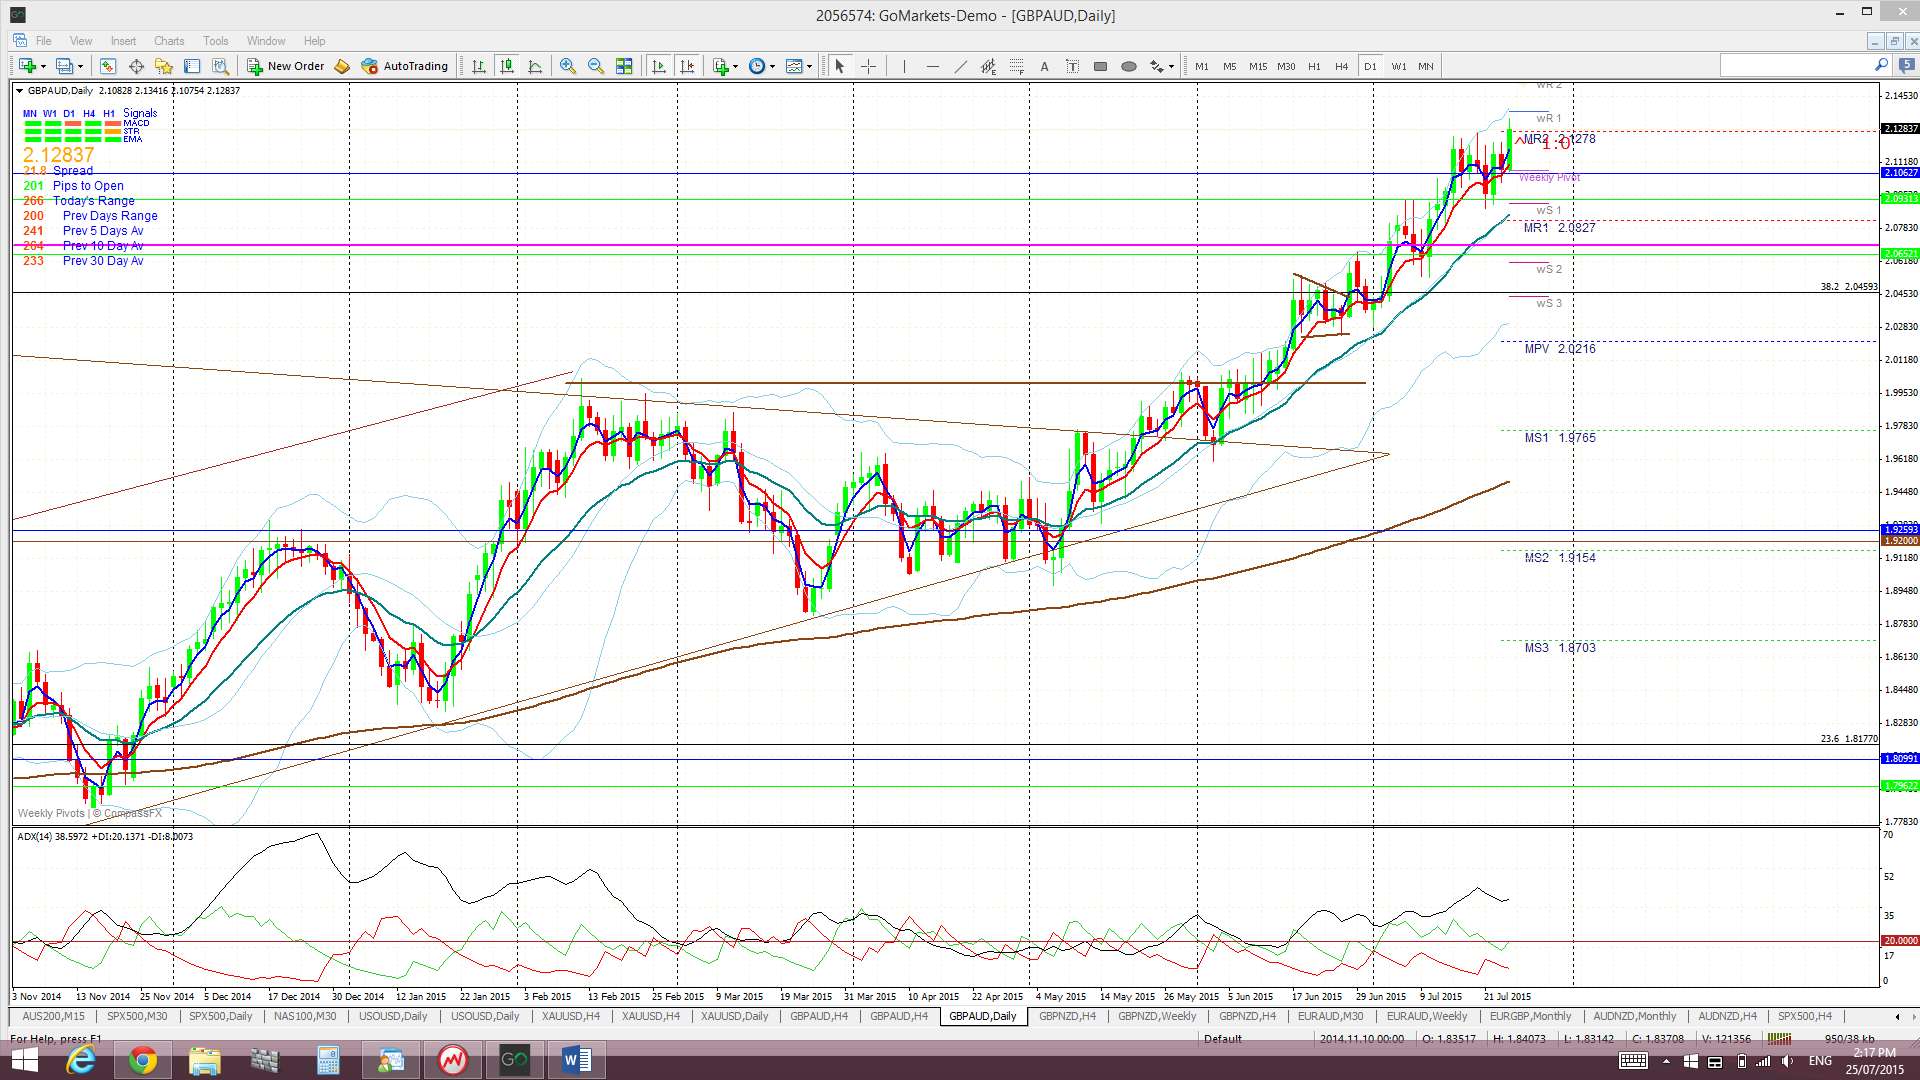
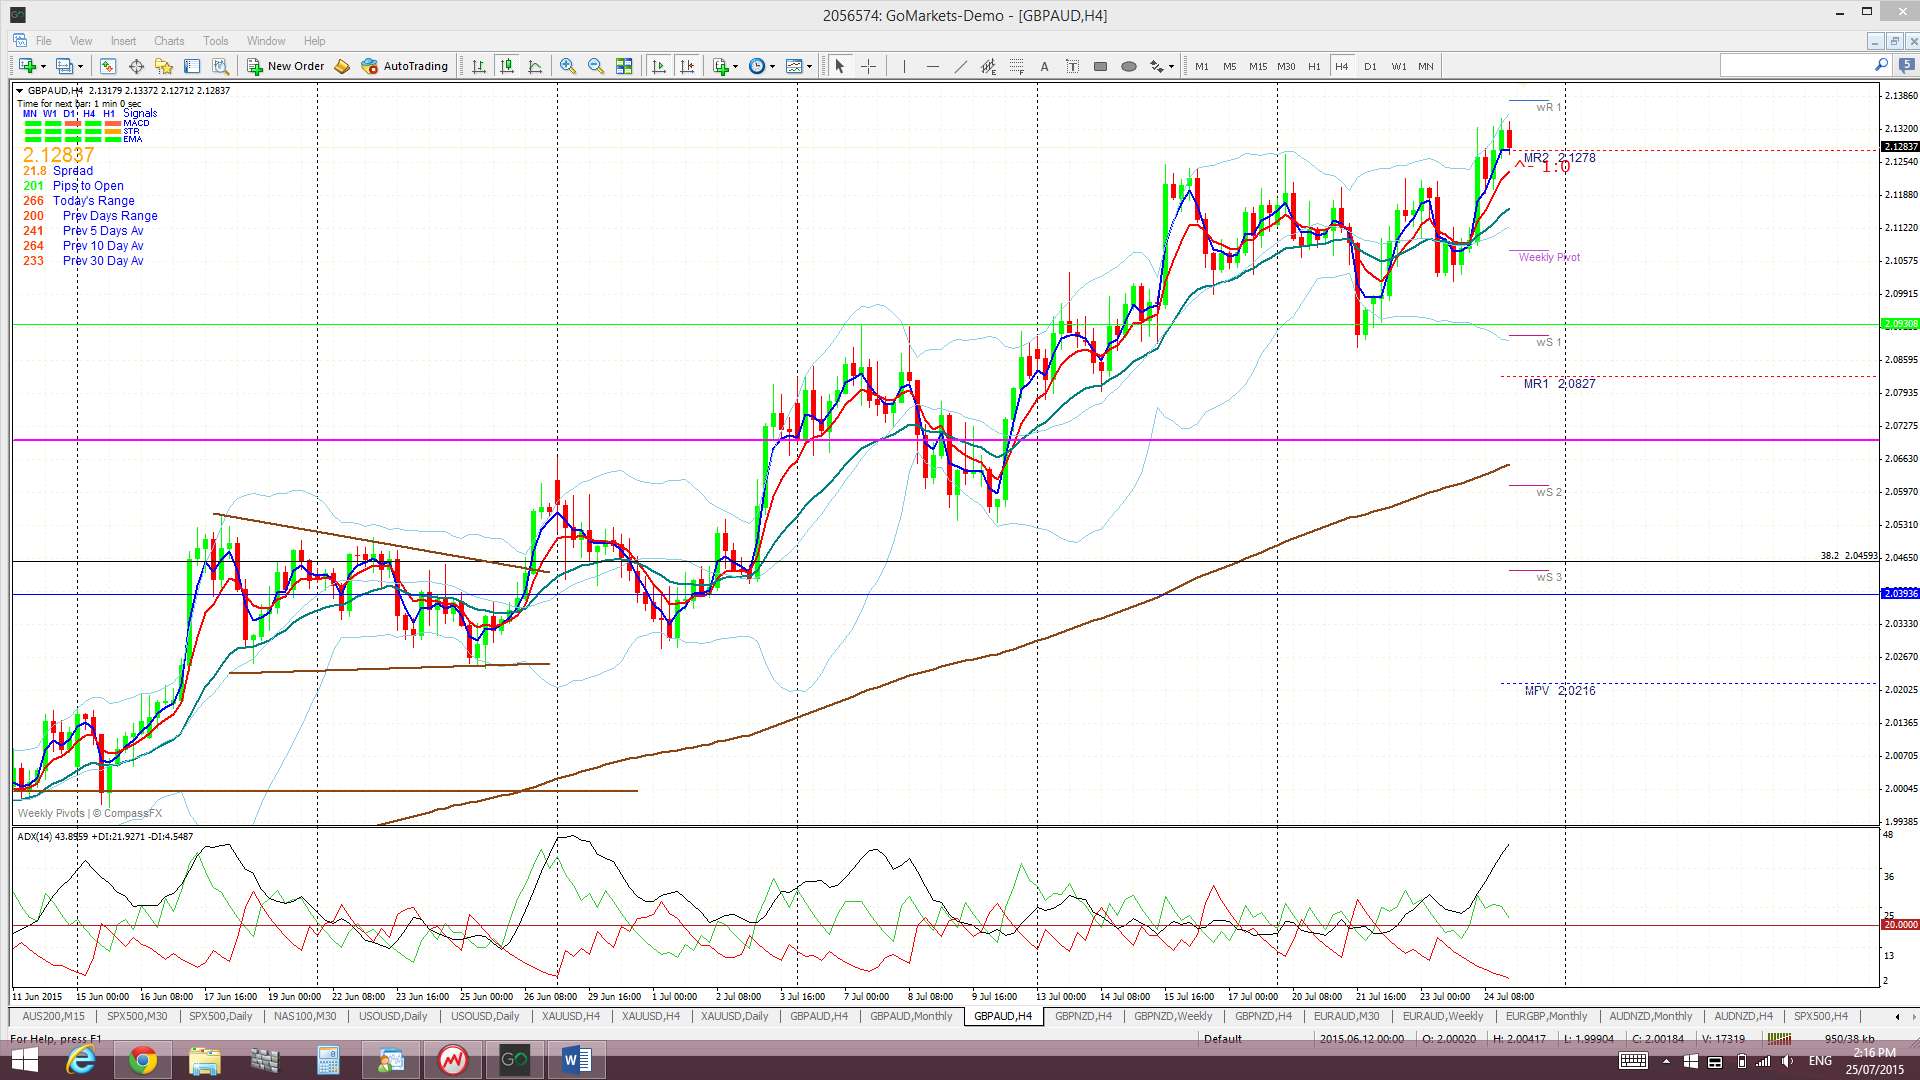
GBP/AUD: This pair has been on a significant bullish run and just printed its 12th consecutive bullish candle. One has to wonder if a bit of a pullback might be in store at all but it isn’t looking likely just yet; maybe after the monthly candle closes next week and then it might think about some re-trace action?
I’ll be on the lookout for any pullback to test either the monthly 200 EMA,, or even 2.07 major S/R level, once the monthly candle closes next week.
Price is still trading above the Ichimoku Cloud on the 4hr, daily, weekly and monthly charts.
The weekly candle closed as a bullish candle.
- I’m watching for any new TC signal on this pair.
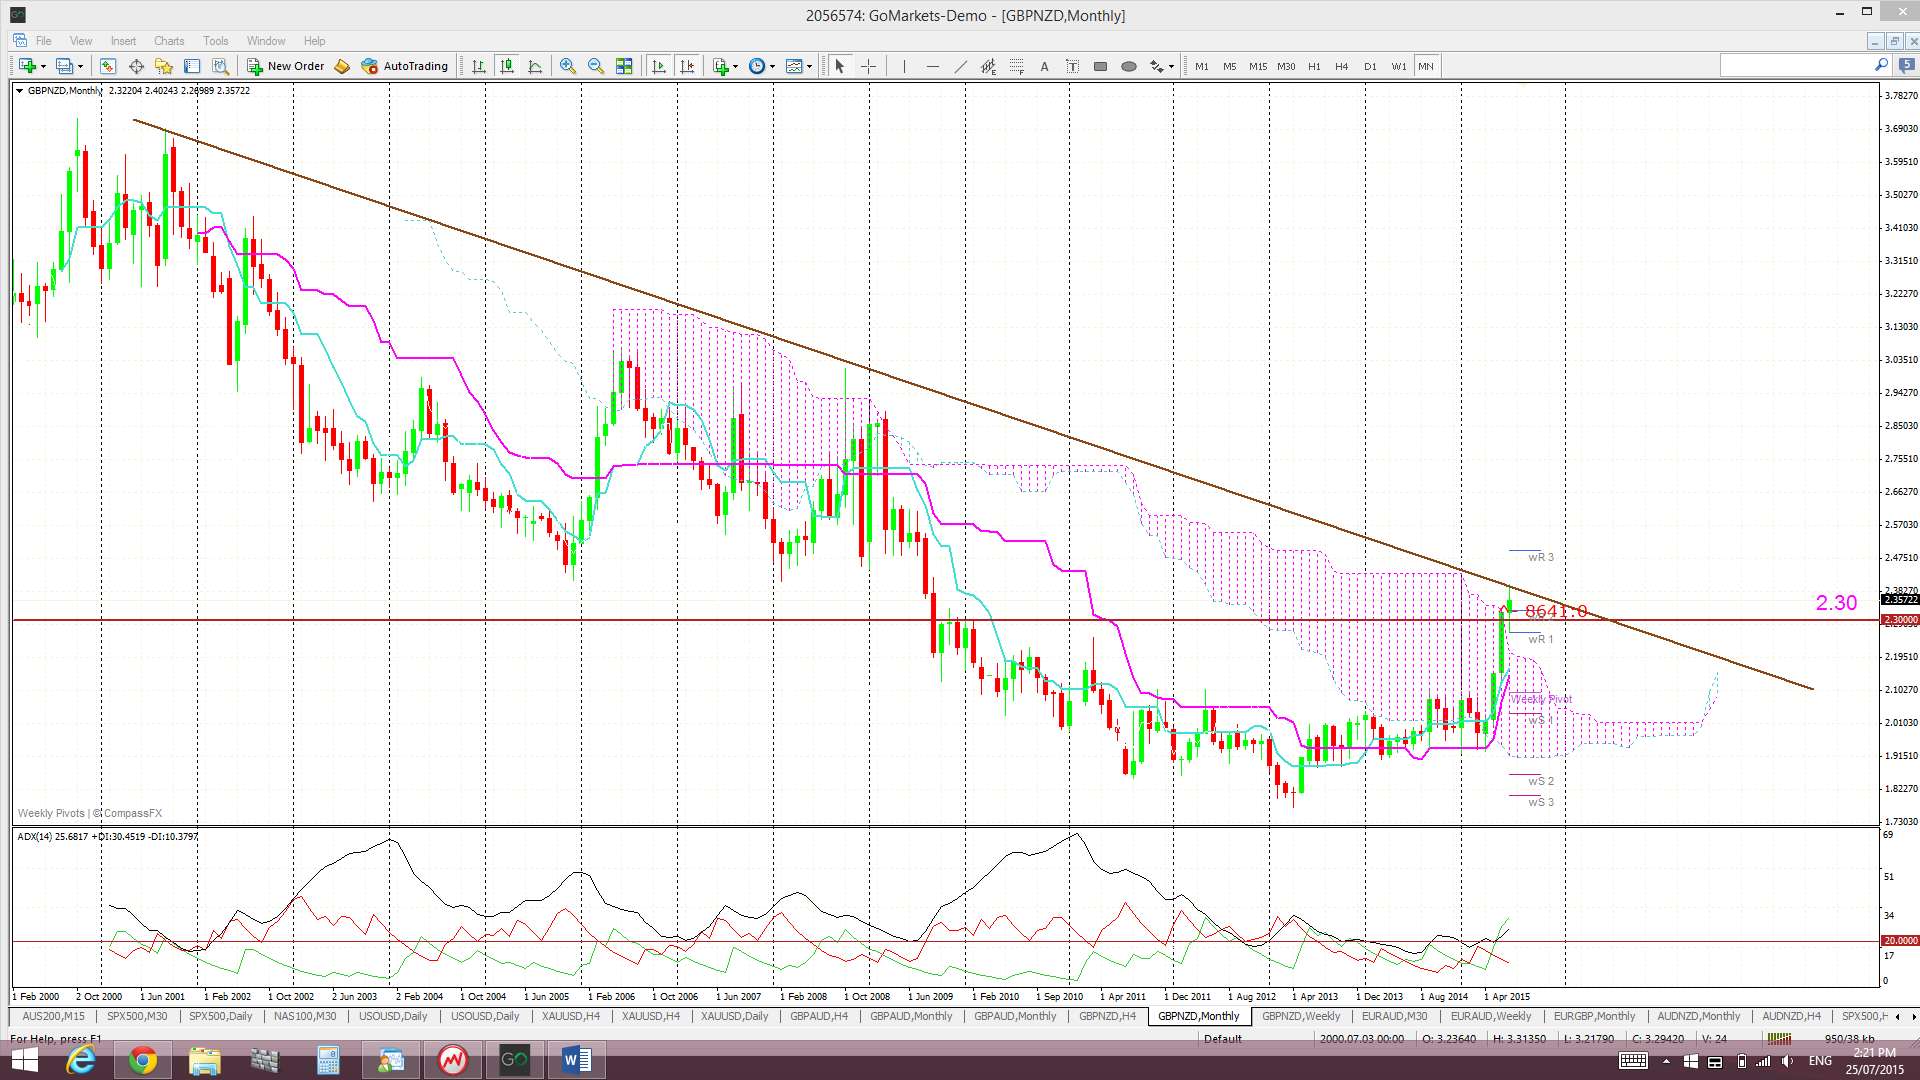
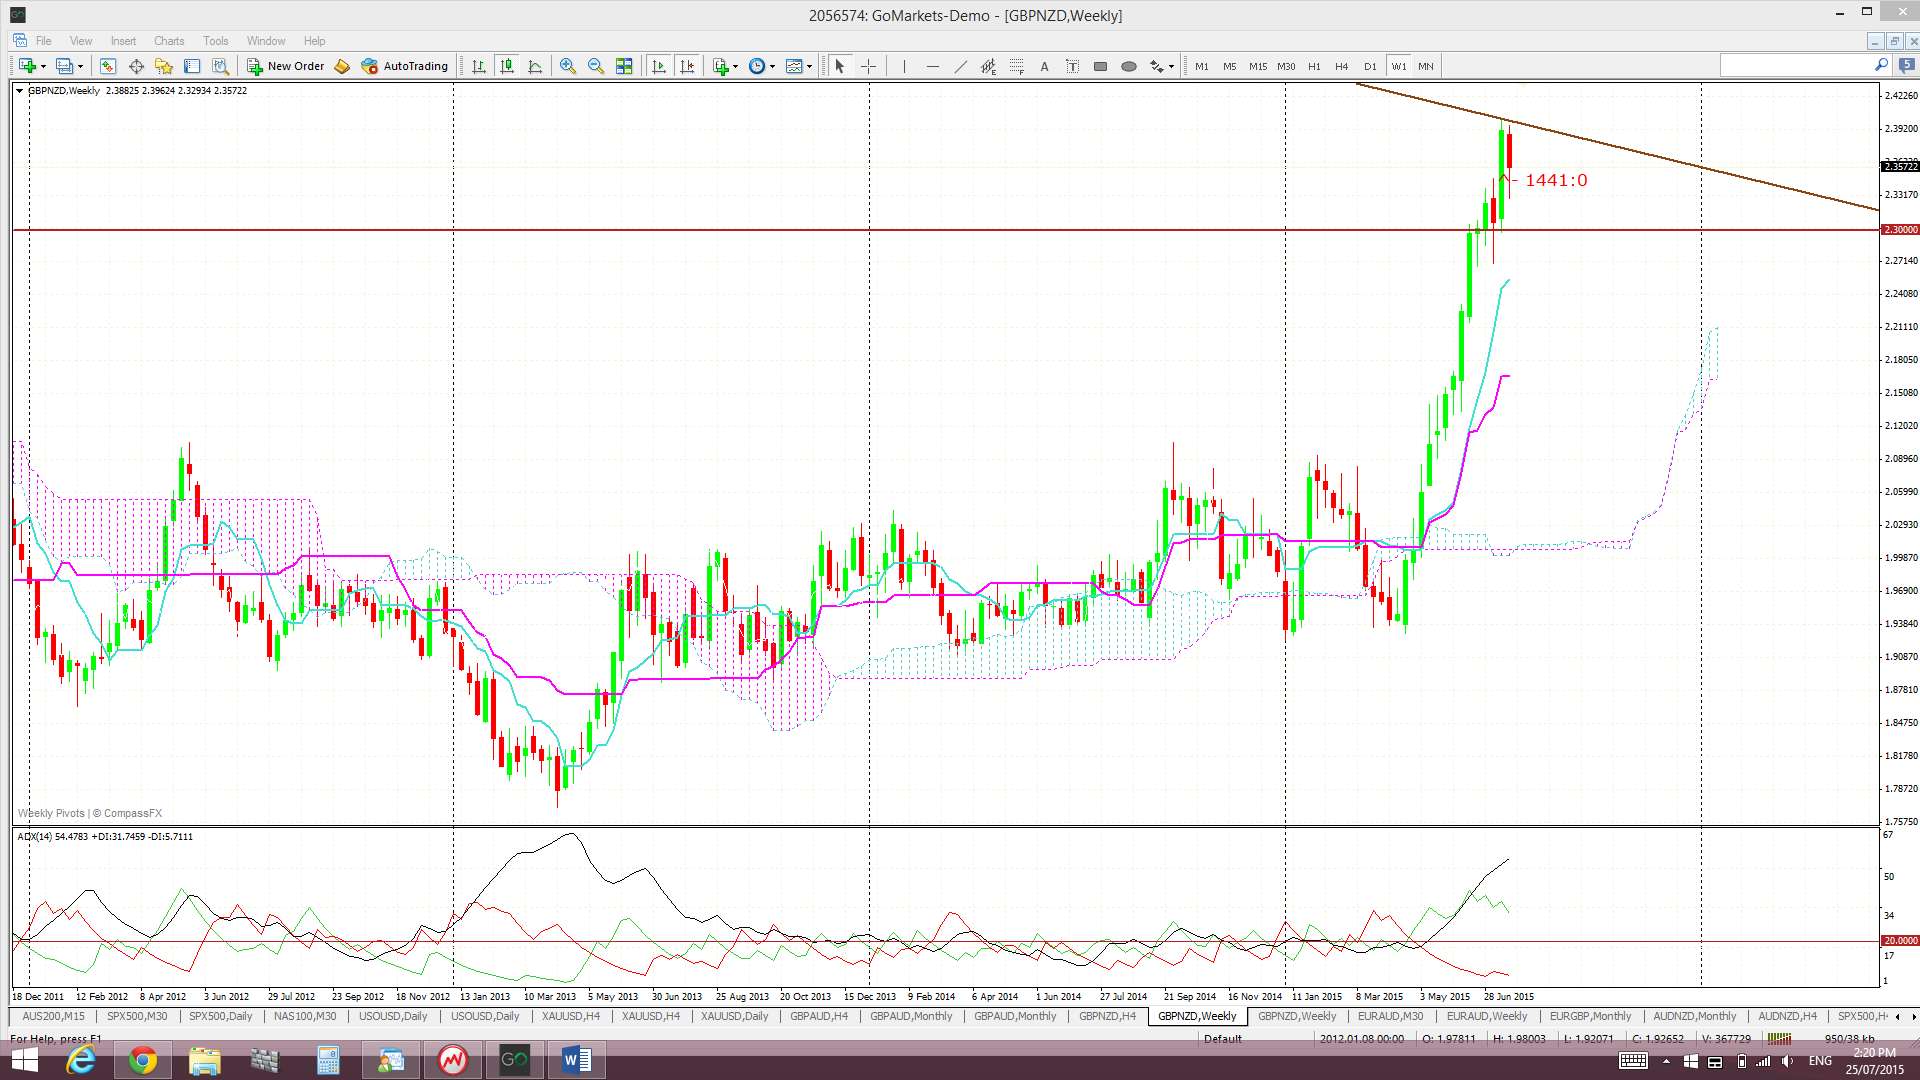
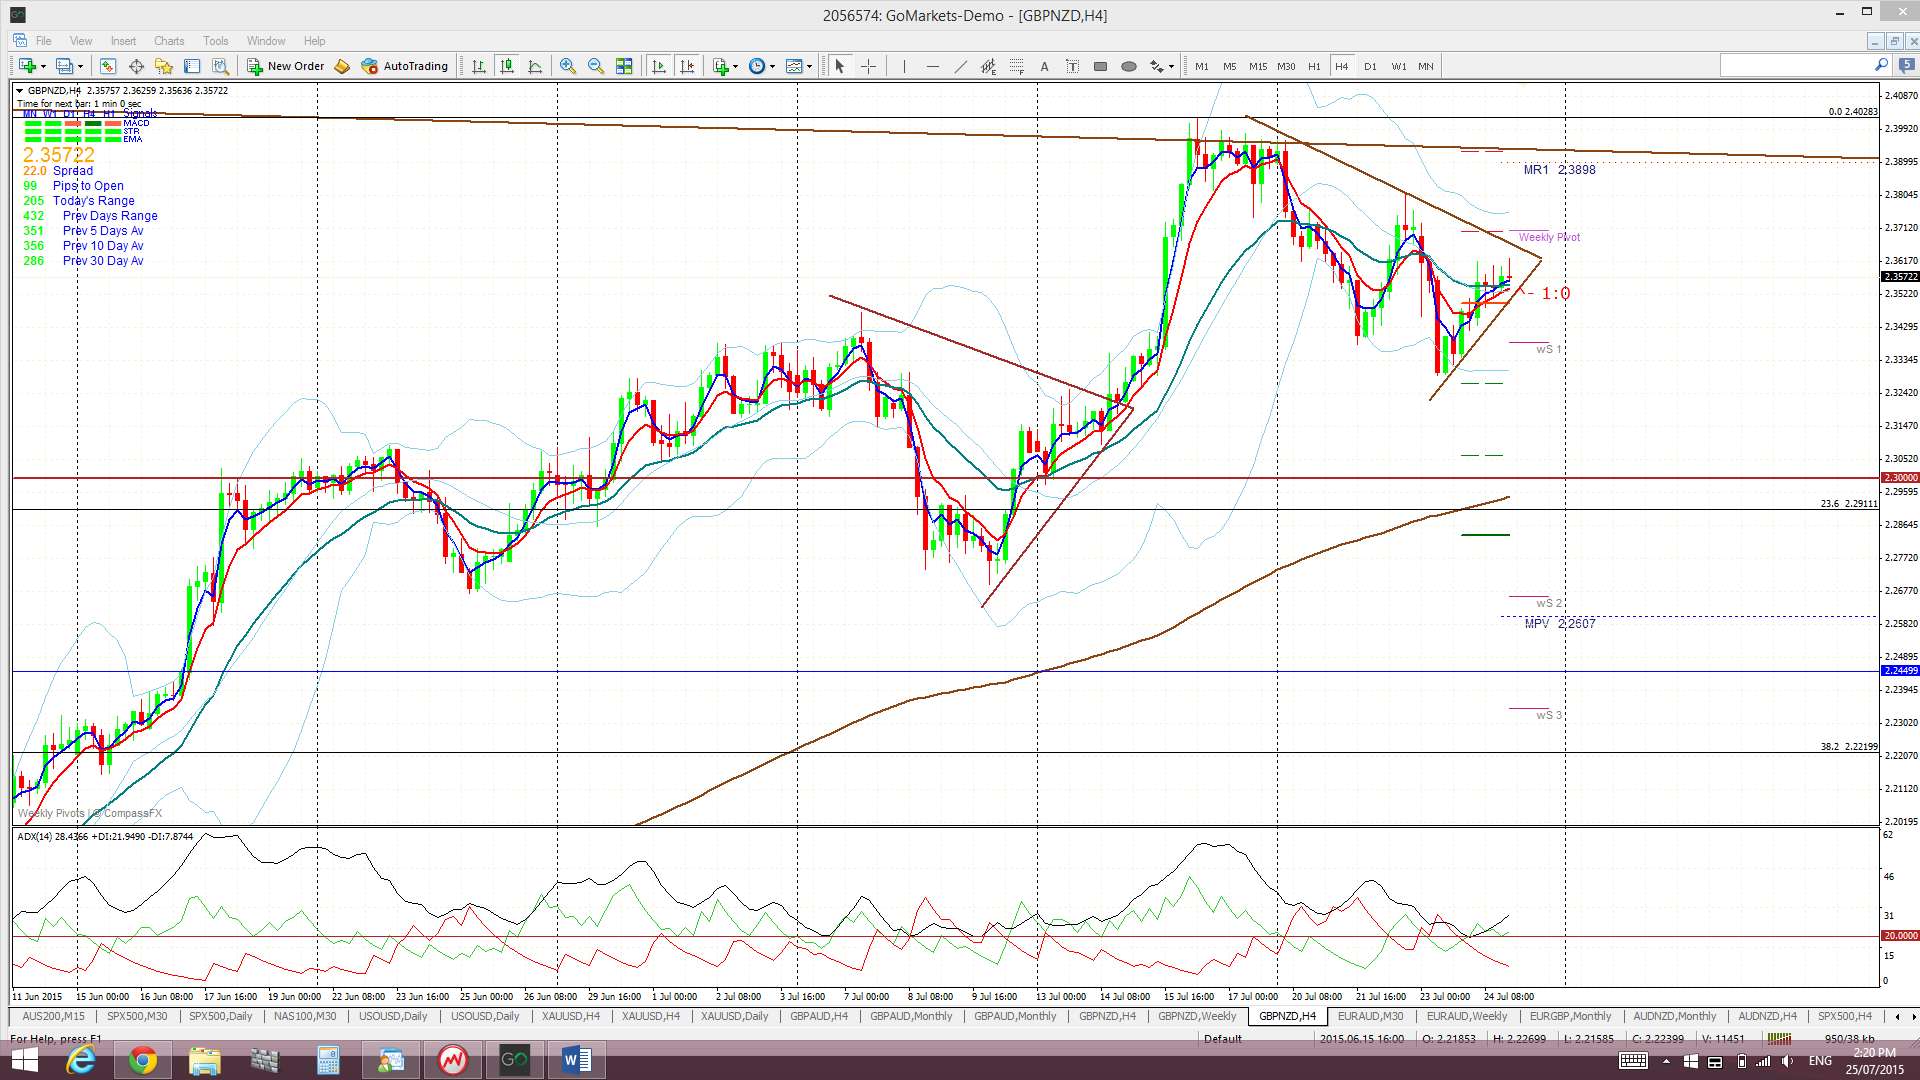
GBP/NZD: The GBP/NZD pulled back a bit last week after reaching up to a major monthly-chart bear trend line the week before. This has proven to be challenging resistance and price is currently consolidating within a triangle just below this region. Fib levels on the recent swing high move show that a 61.8% fib pullback would bring price back down to near the previous S/R region of 2.10.
The GBP/NZD is still trading in the Cloud on the 4hr chart but above the Cloud on the daily, weekly and monthly charts.
The weekly candle closed as a bearish-reversal ‘Hanging Man’ candle.
- I’m watching for any new TC signal, the 4hr chart’s triangle trend lines and the monthly chart’s bear trend line.

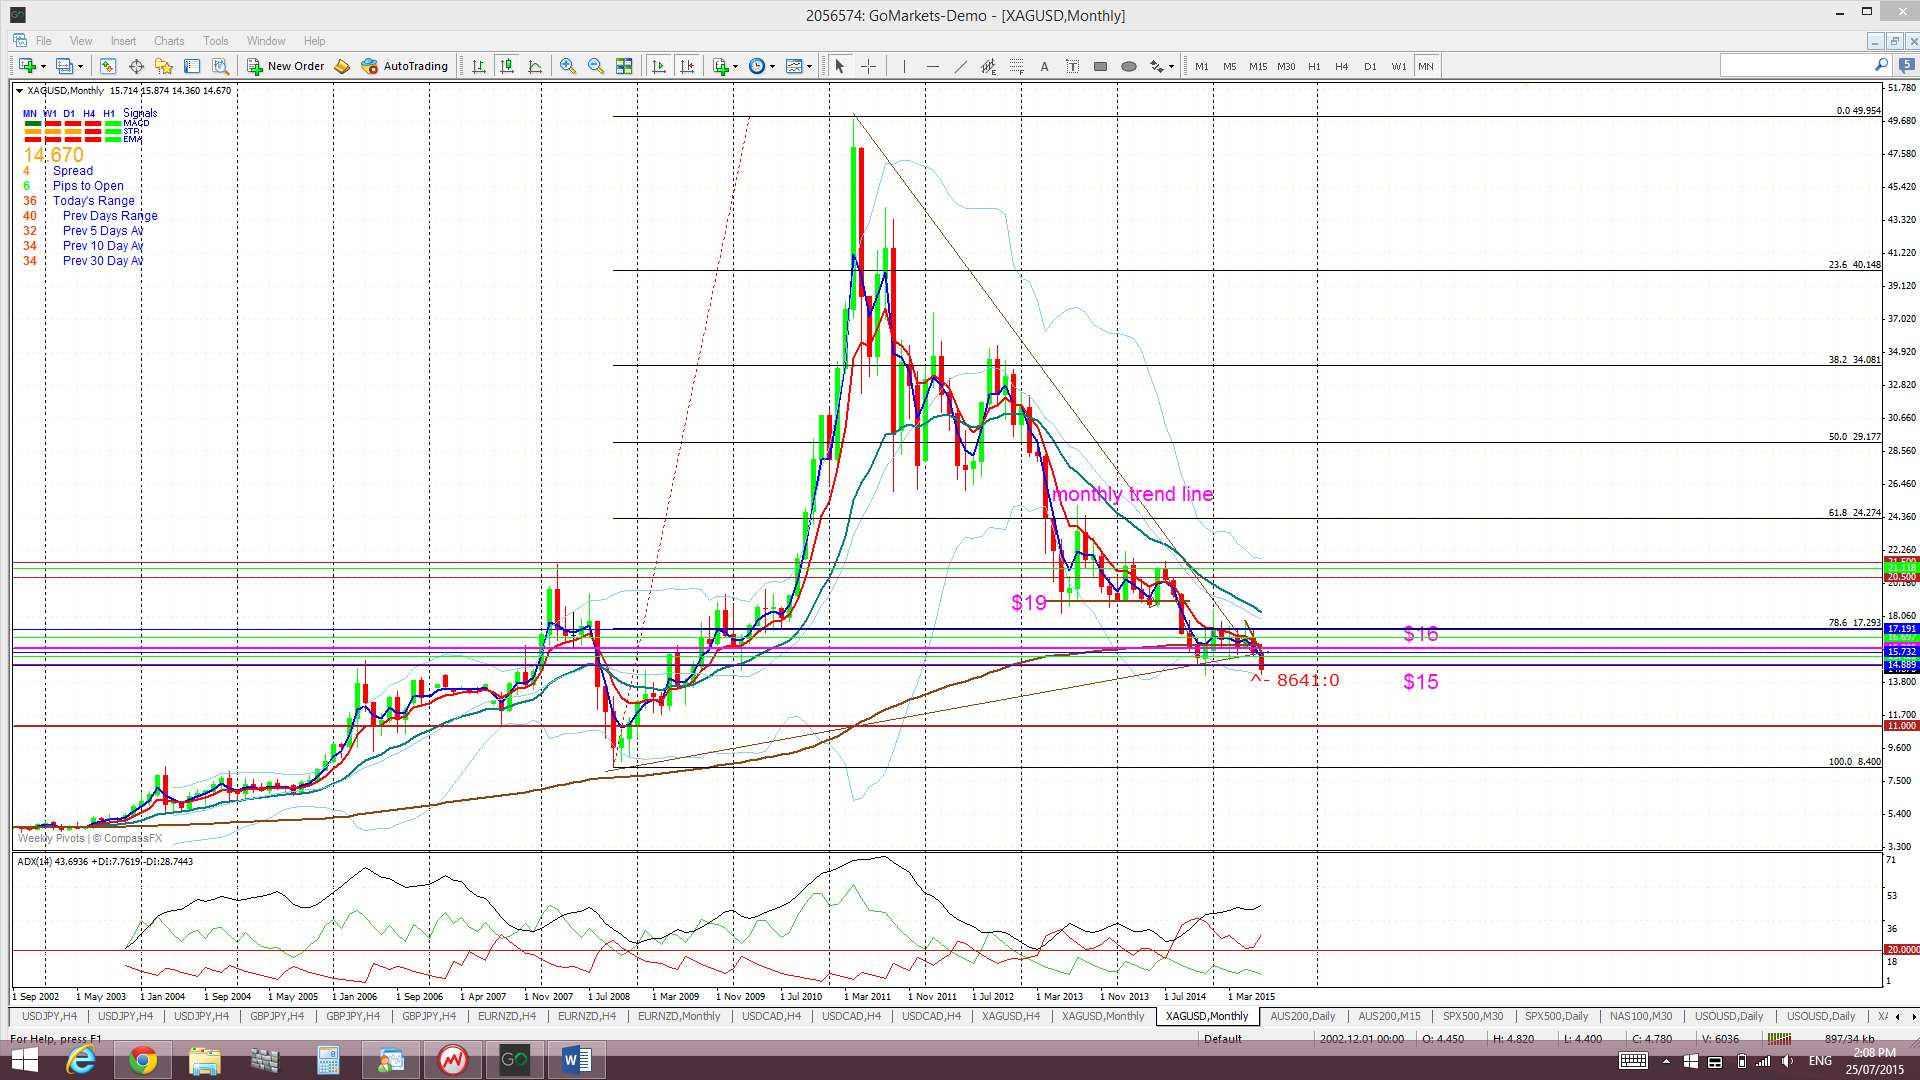
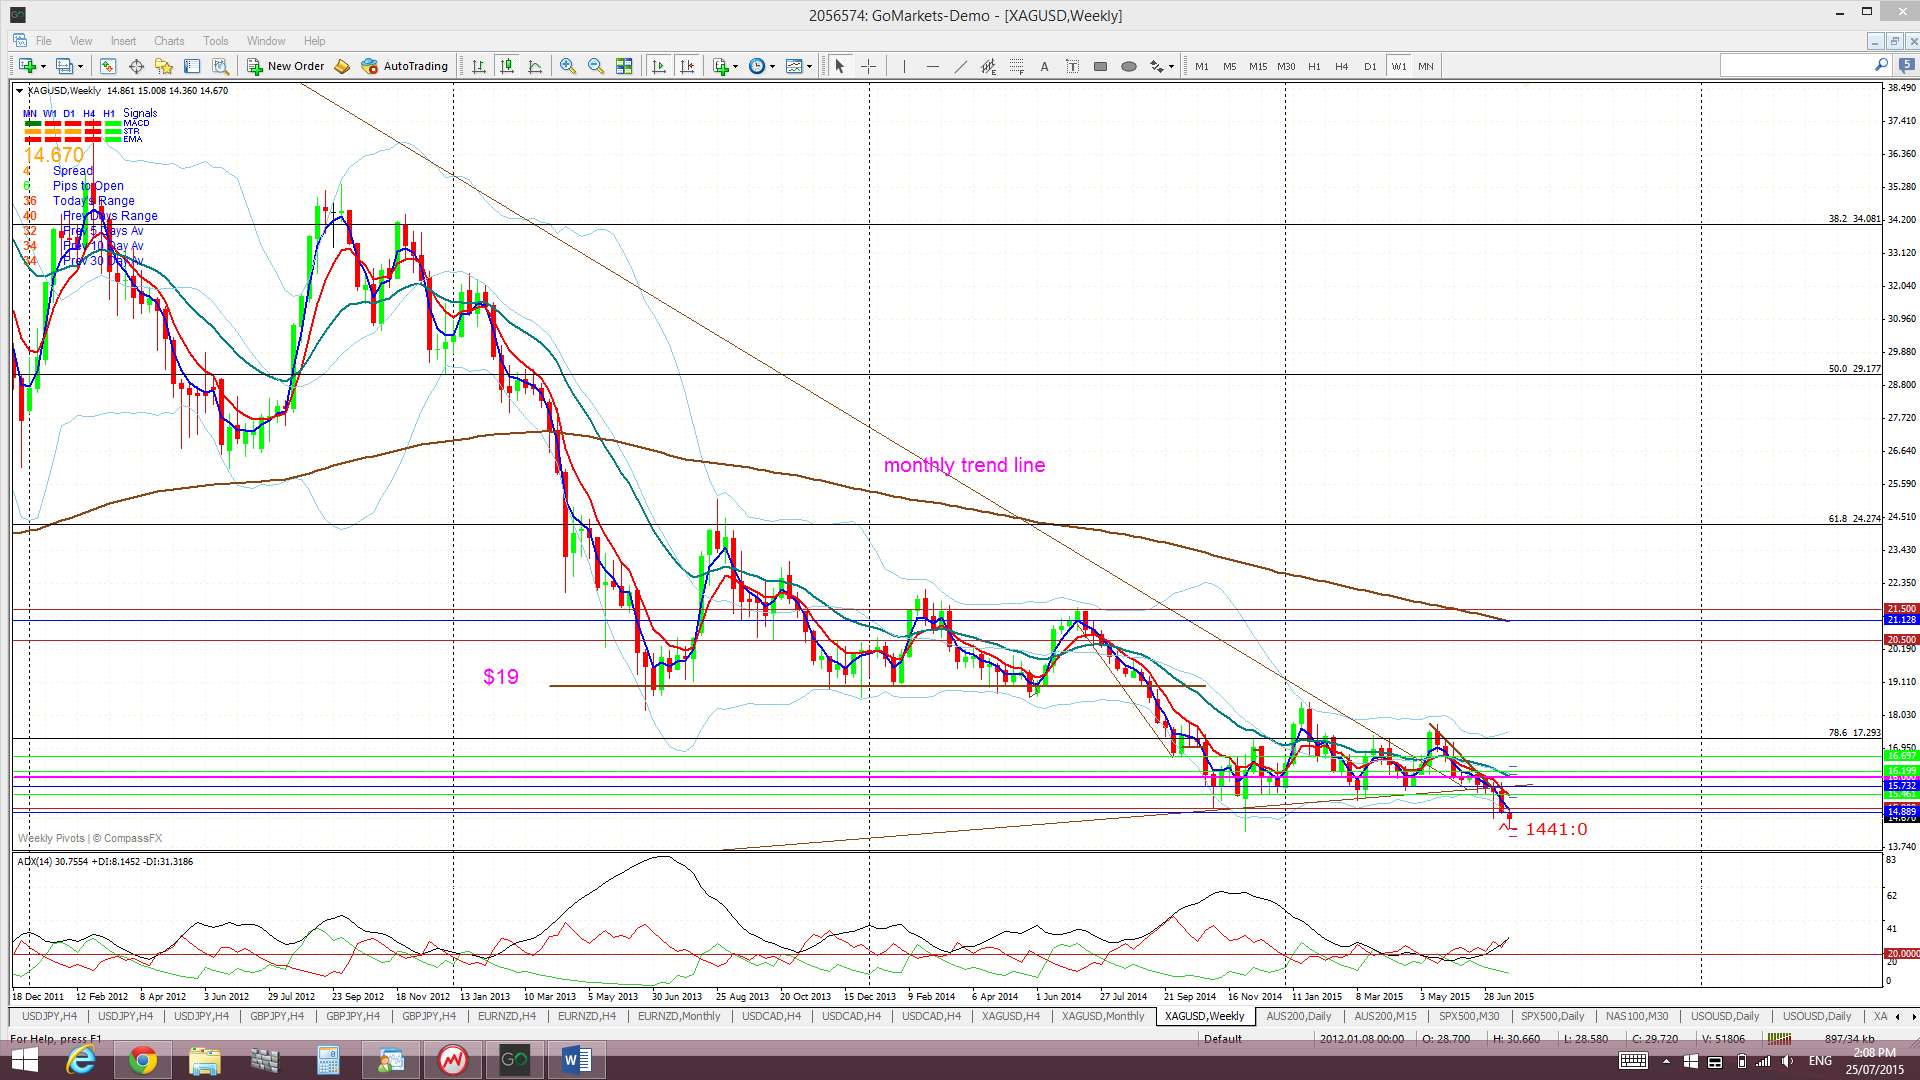
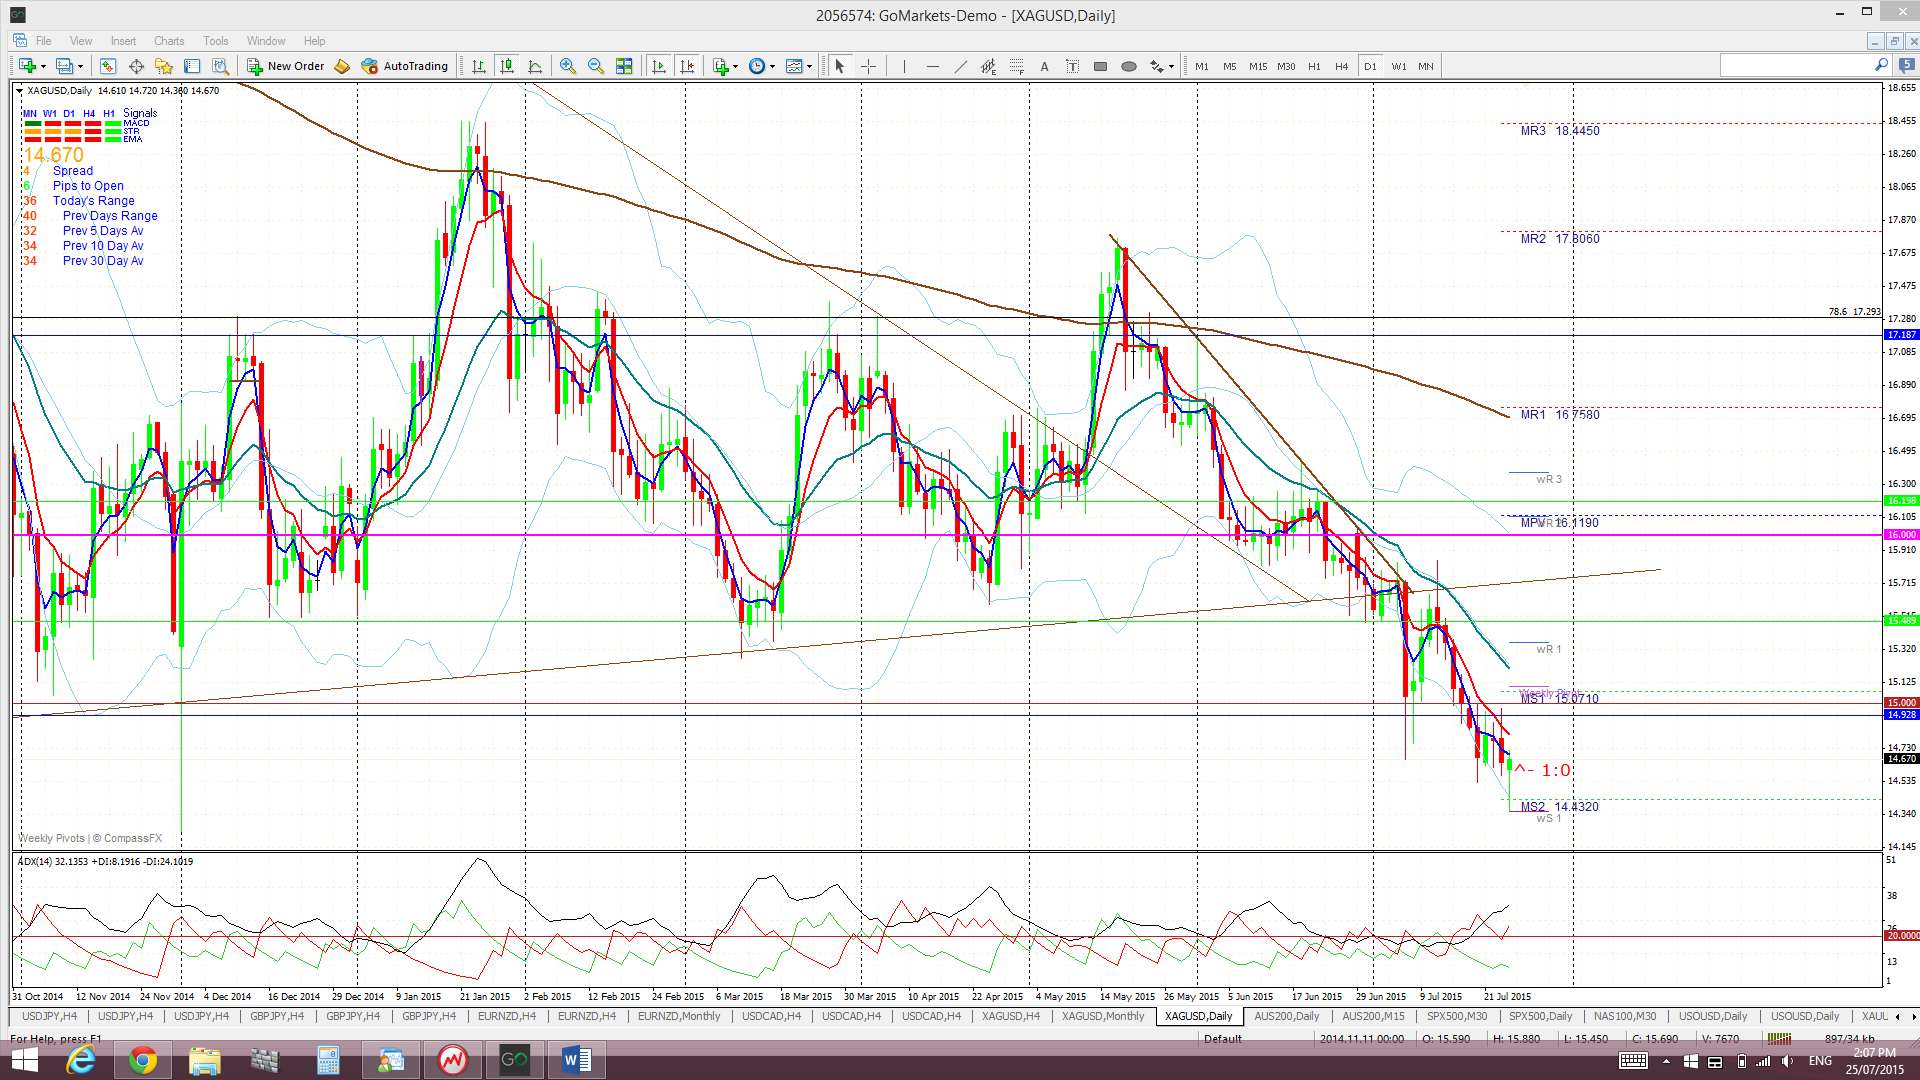
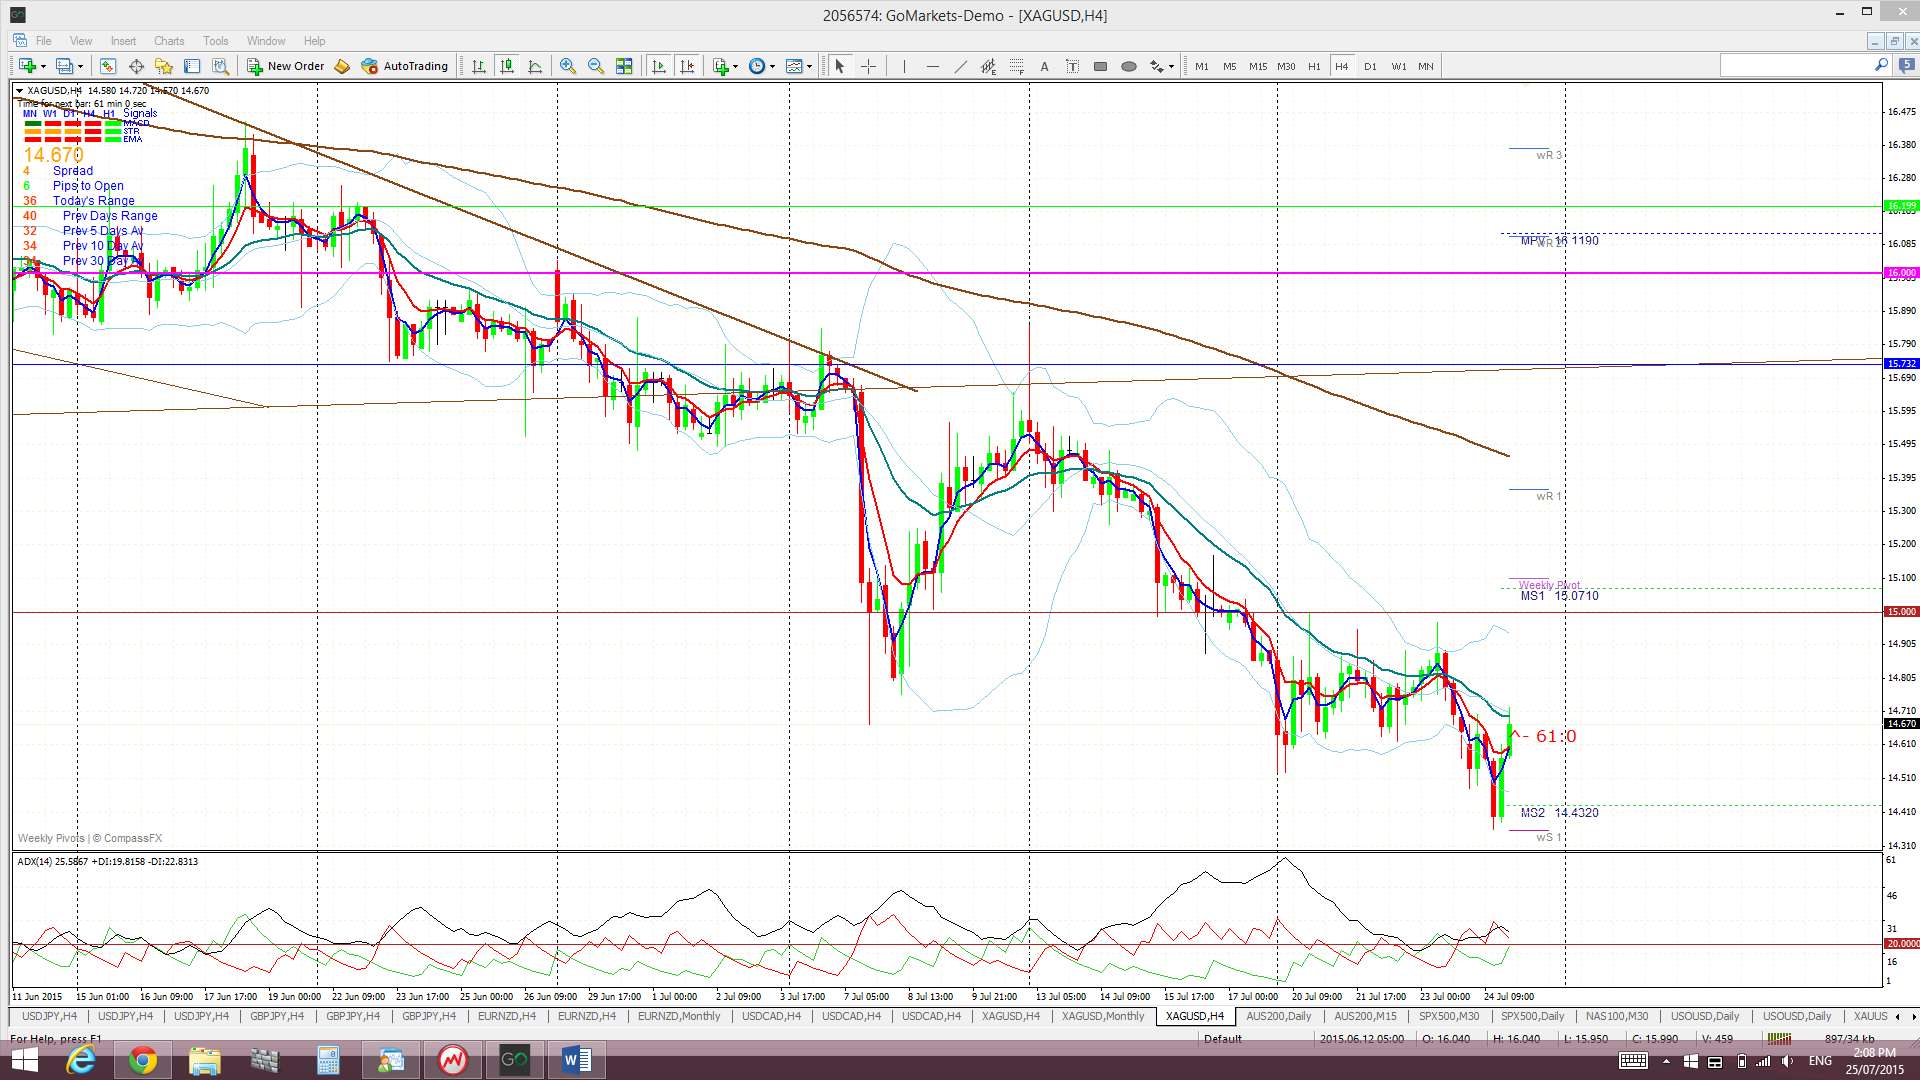
Silver: Despite a bit of US$ weakness last week Silver couldn’t recapture the $15 support level and this seems rather bearish. Traders need to watch to see where this closes after next Friday though as this will form up the monthly candle close. Any close back above $15 on Friday would be bullish but a close below this would be bearish and, thus, shorting at $15 on a pullback would be one way to trade this price action.
Silver is still trading below the Cloud on the 4hr, daily, weekly and monthly charts.
The weekly candle closed as a small bearish ‘Spinning Top’ candle. Friday’s candle was a bullish-reversal ‘Hammer’ candle so watch for any bullish follow through from this.
The second weekly close below $15 is bearish though and keeps the $11 and $9 levels in focus. $11 is previous S/R and the $9 area is the 100% fib level.
- I’m watching for any new TC signal and the $15, 11 and 9 levels.
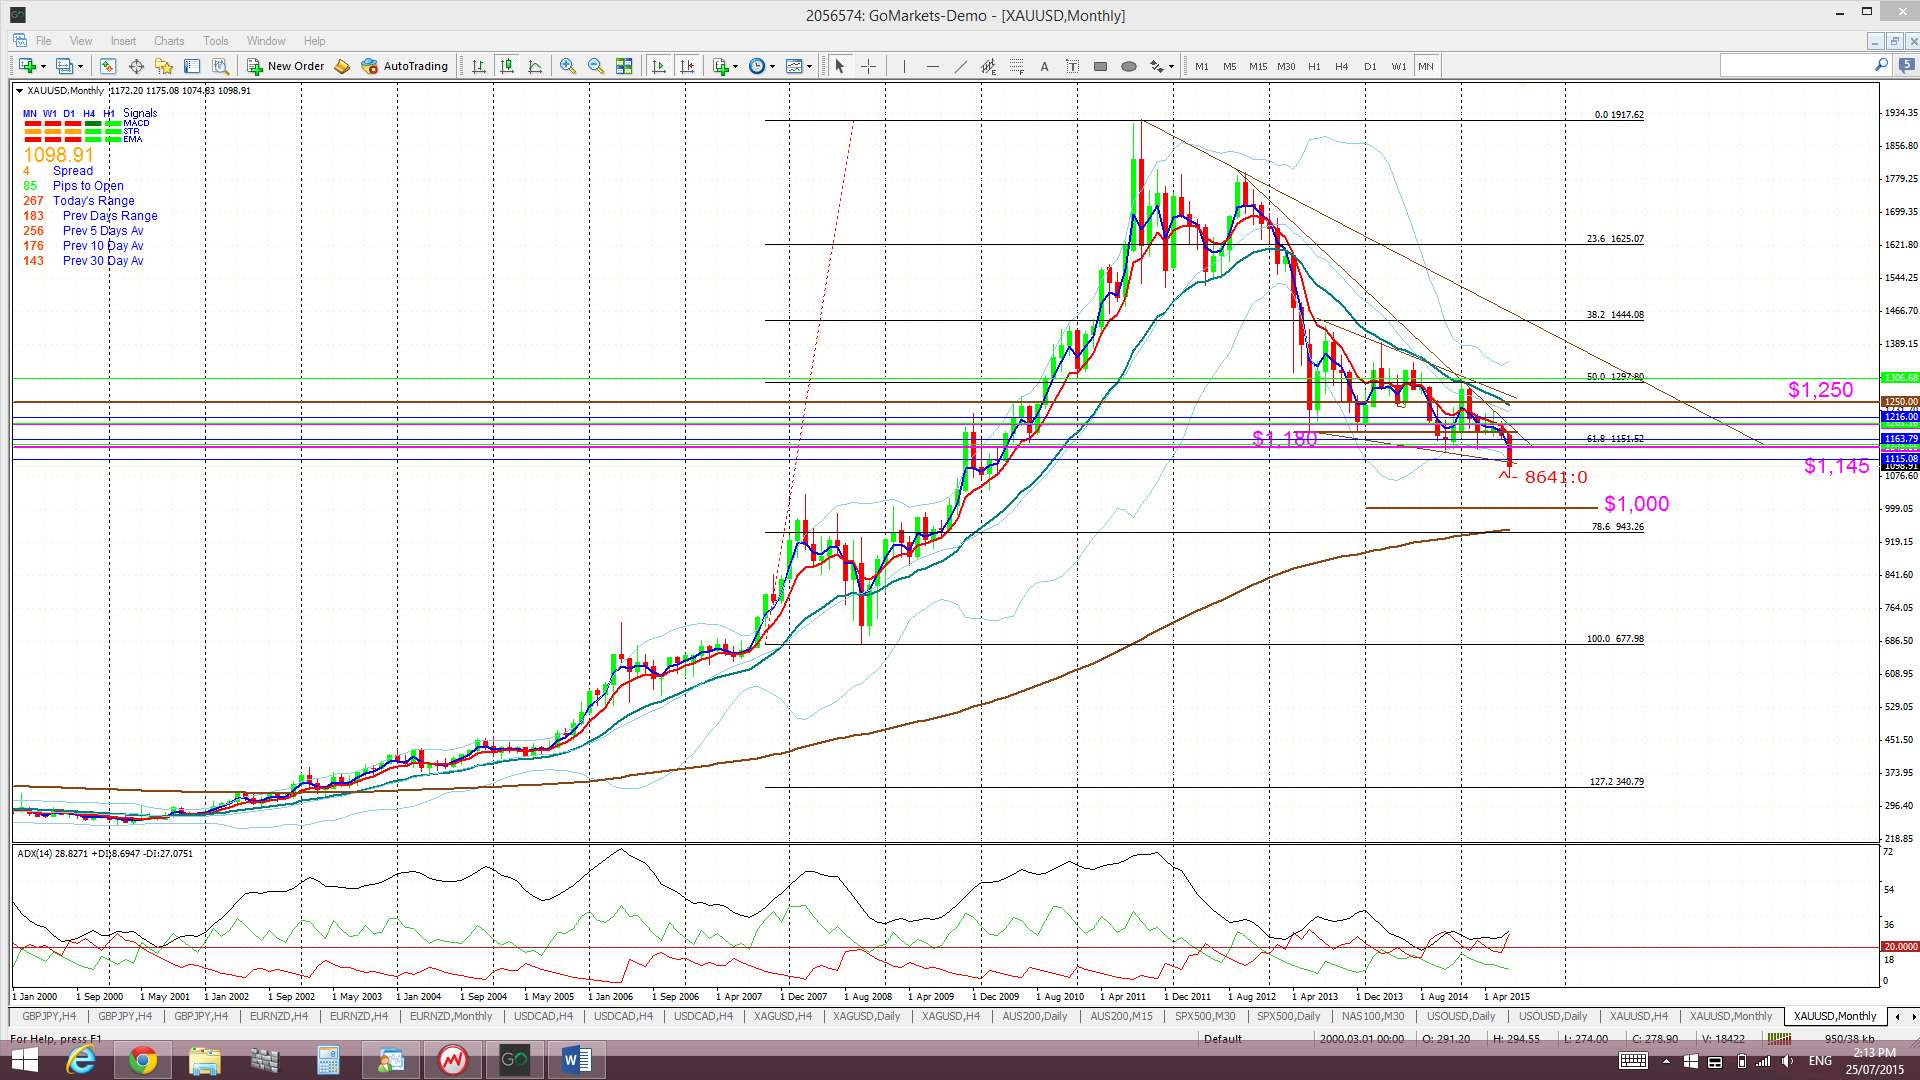
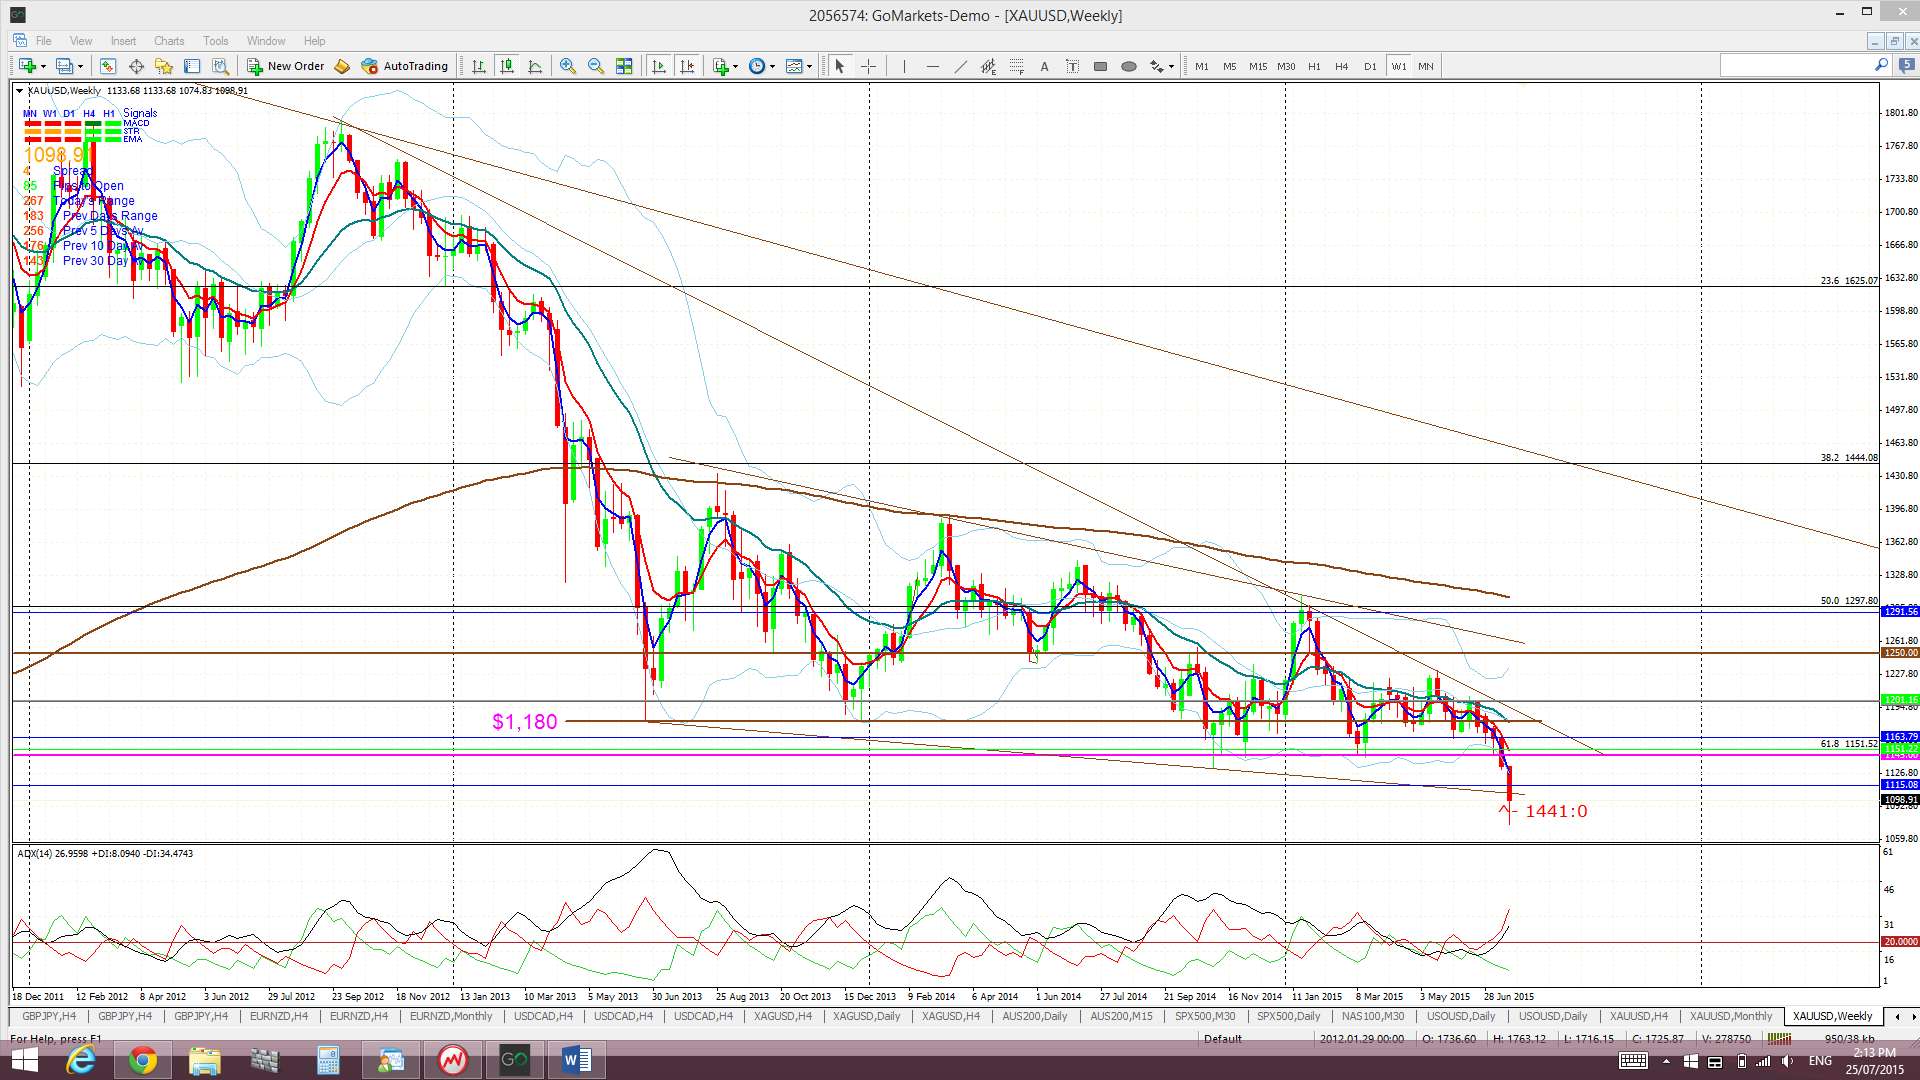
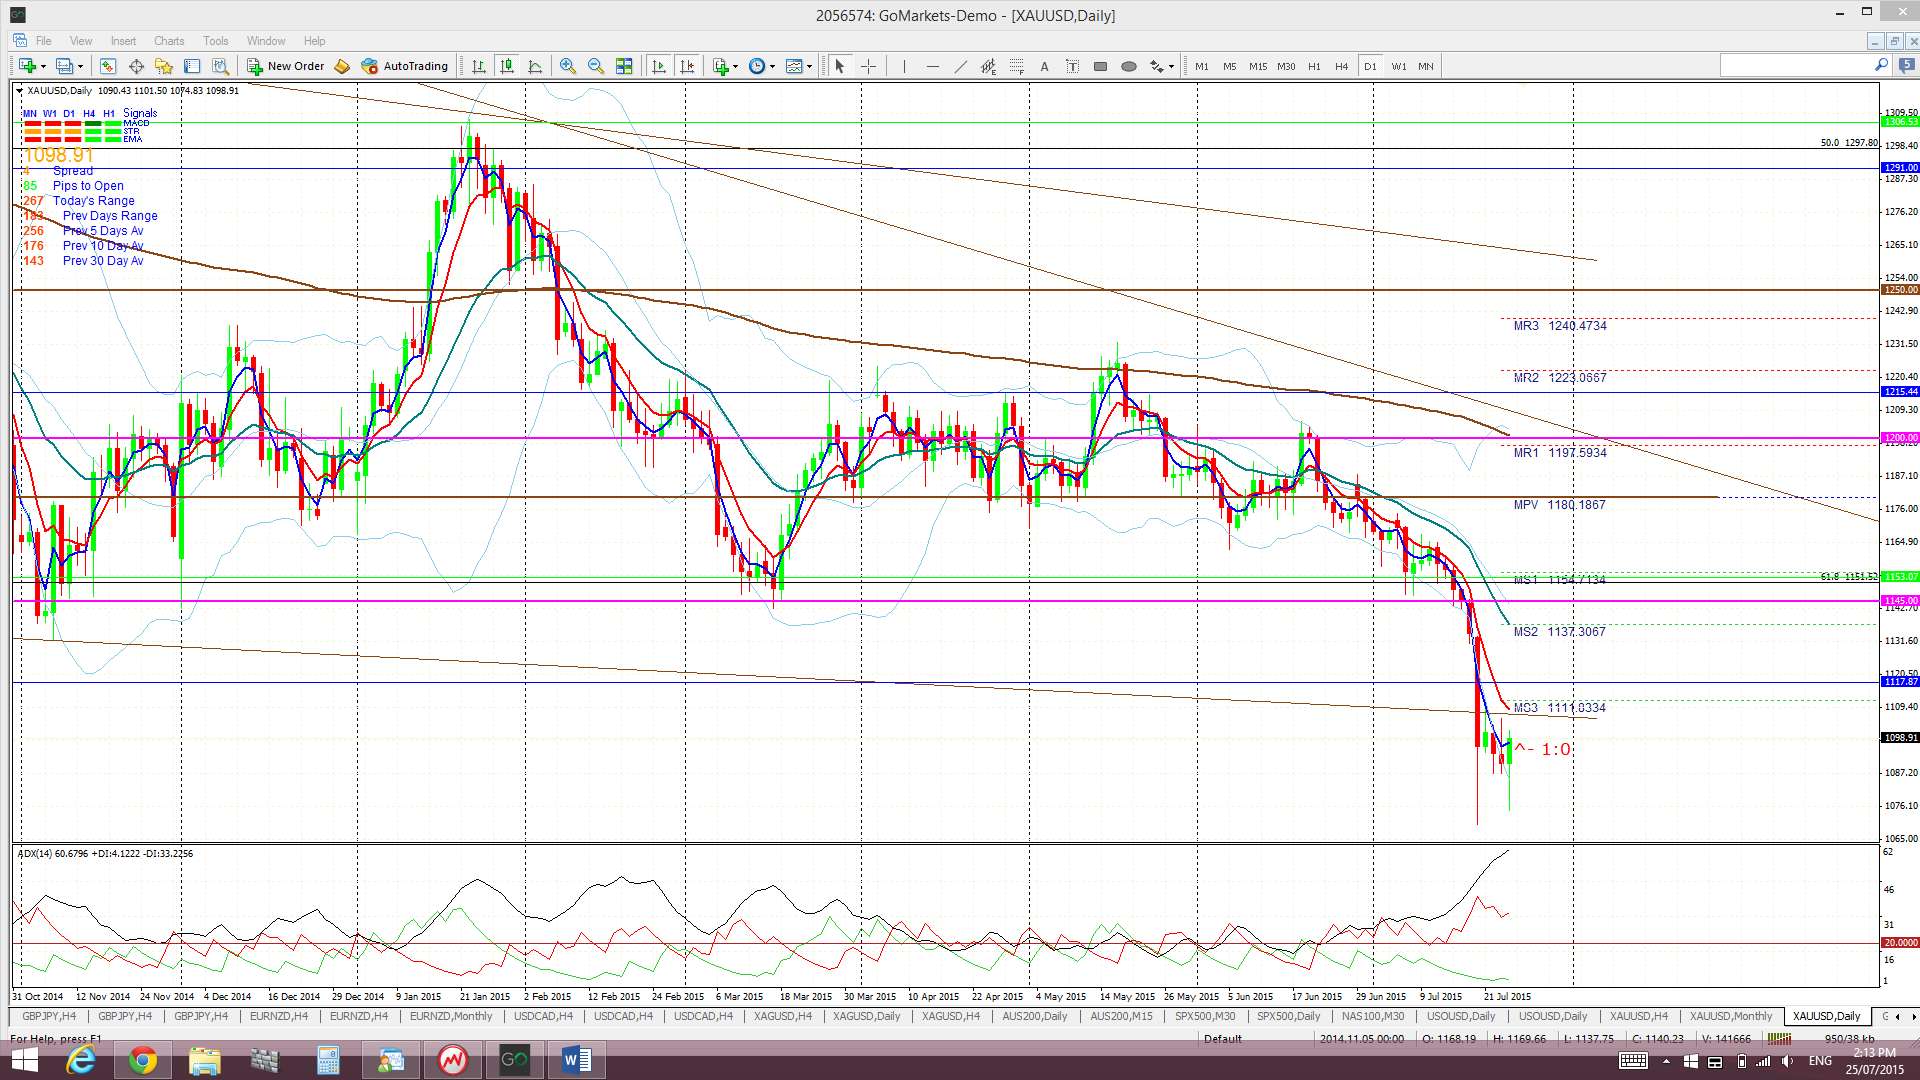
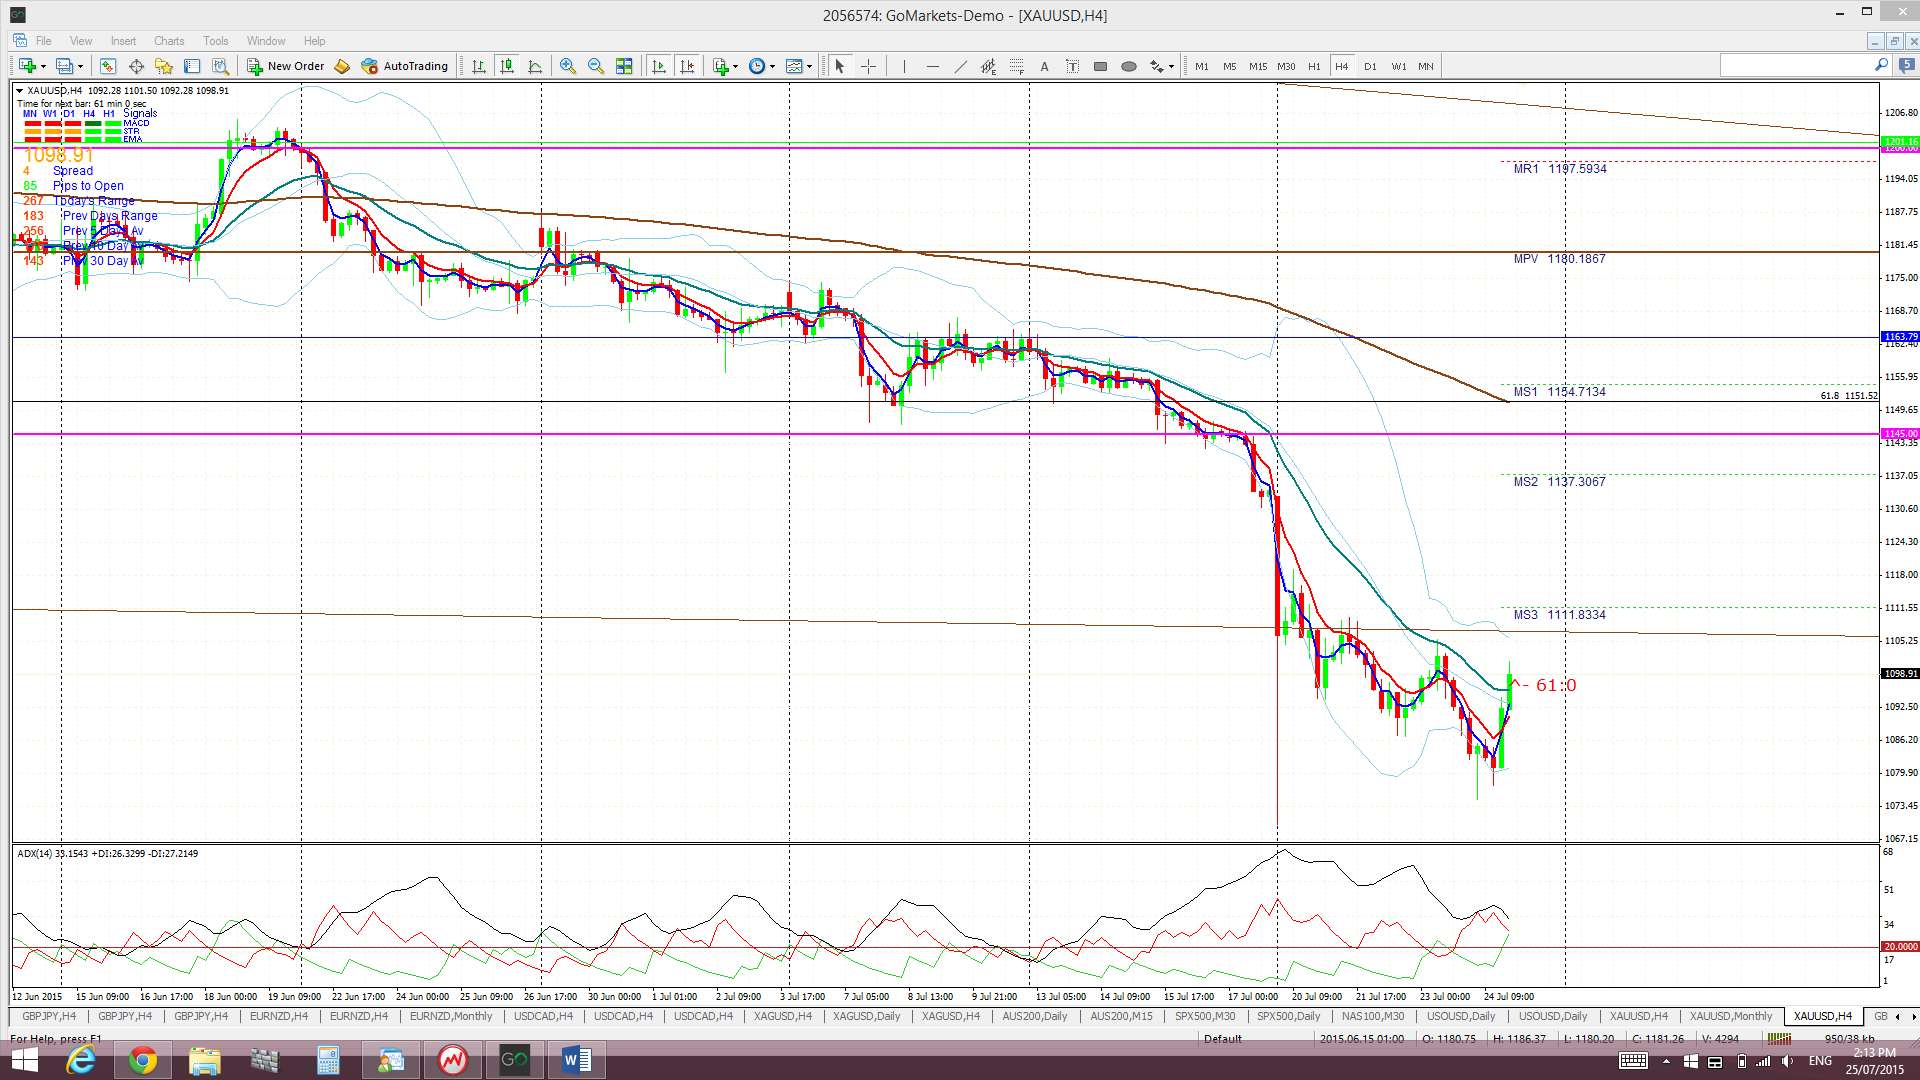
Gold: Like Silver, recent US$ weakness did little to help support the metal and it has not recaptured the major $1,145 support level. Traders also need to watch to see where Gold closes after next Friday as this will form up the monthly candle close and a monthly close below $1, 145 would be very bearish. Any close back above $1,145 on Friday would be bullish but a close below this would be bearish and, thus, shorting at $1,145 on a pullback would be one way to trade this price action.
The weekly chart shows that price has also closed below a recent descending wedge trend line.
The hold below $1,145 suggests that a deeper pull back could be in store for Gold. Bearish targets below $1,145 include the $1,000 psychological level and, then, the 78.6% fib near $950.
Gold is trading below the Cloud on the 4hr, daily, weekly and monthly charts.
The weekly candle closed as a large bearish candle but Friday’s candle was also a bullish-reversal ‘Hammer’ candle so watch out for any bullish follow through from this.
I’m watching for any new TC signal and the $1,000 level.
The post FX & market analysis in FOMC week. appeared first on www.forextell.com.