Last week: There were two TC signals last week. The A/J delivered up to 250 pips and is still open but the EUR/GBP, although not on my radar, was a 50 pip loss.
This week:
The USD index has struggled to break above major 90-level resistance. Weaker than expected US PPI data put pressure on the US$ on Friday and so next Wednesday’s CPI data will no doubt be in focus. FOMC will impact here too and this may be the week that we finally get a definitive move on the USD index, either a significant move higher or lower. If so, we might get some flow-on effect definitive movement across the broader FX market. An update on the FX indices can be found through this link.
Traders need to watch YEN pairs for any reaction to the w/e Japanese elections and Friday’s Monetary Policy news.
Silver is getting back up close to a four-year bear trend line and is worth watching as any bullish breakout would suggest a polarity shift for the metal.
The GBP/USD is back trading just under a bear trend line that has been in effect for over 5 months. There is a lot of high impact GBP and USD data next week so we could see some reaction around this key S/R level.
The bonds ETF, TLT, has made another bullish breakout move and the Tenkan/Kijun lines on the S&P500 daily Ichimoku chart have fused and are, thus, open to another signal cross. This all paints a rather gloomy picture for risk appetite across stocks BUT I’m surprised to see that the ‘canary in the coal mine’ Russell 2000 hasn’t fallen further.
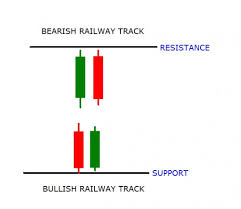
There are a few technical patterns worth noting this week: the on-going Cup ‘n’ Handle on the U/J and the one trying to form on the Swissie. There was a bullish-reversal ‘Railway Track weekly candle on the E/U and bearish-reversal one on the U/J. A bullish engulfing weekly candle formed on the GBP/USD and triangles (aka: we haven’t got a clue what we’re doing!) have formed up on the 4hr charts of the U/J, GBP/JPY, Kiwi, Gold and the EUR/GBP. As per usual, watch for trend line breaks with momentum/volume.
Events in the Ukraine and the Middle East, as well as with Ebola, continue to have the potential to undermine any developing ‘risk’ appetite and need to be monitored.
Stocks and broader market sentiment:
US stocks have had their worst week for 2014 triggered, primarily, by the collapse of the price of oil and the flow-on effect of this for oil stocks. The S&P500, DJIA, NASDAQ and Russell 2000 all printed large bearish candles. I have been saying for the last few weeks though that I would not be surprised to see the S&P500 test 2,000 and this is what we have seen. It is worth noting also that a test of previous S/R at 1,900 would still not break daily support.
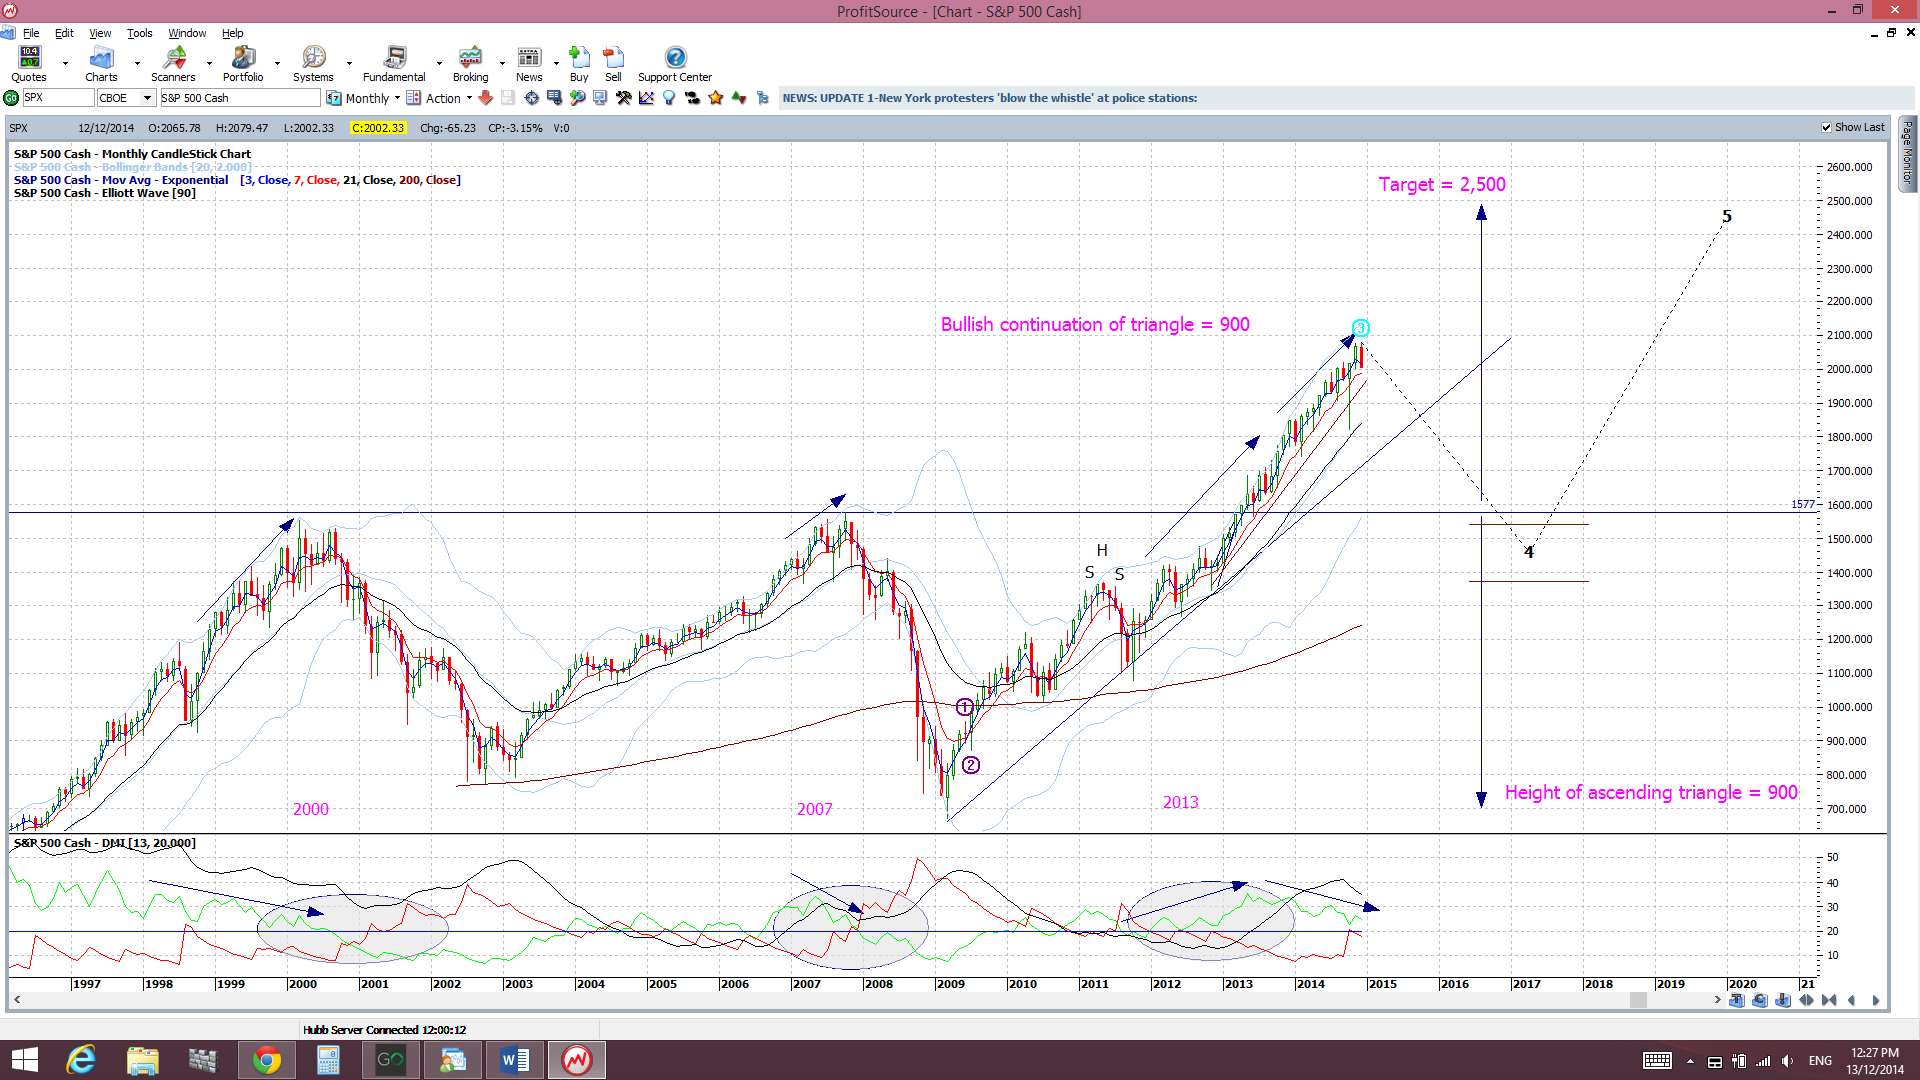
I continue seeing divergence on the monthly S&P500 monthly chart and whilst this might just be warning of a pause, as the index navigates these new highs up circa 2000, the chance of a pullback cannot be ruled out either. There has not been any real deep pull back since the major break up through the 1,577 / 1,600, region with the 1,577 level being tested only once.
Thus, with all of this, I continue to watch out for further clues as to any new momentum move, long or short though! In particular I’m looking out for:
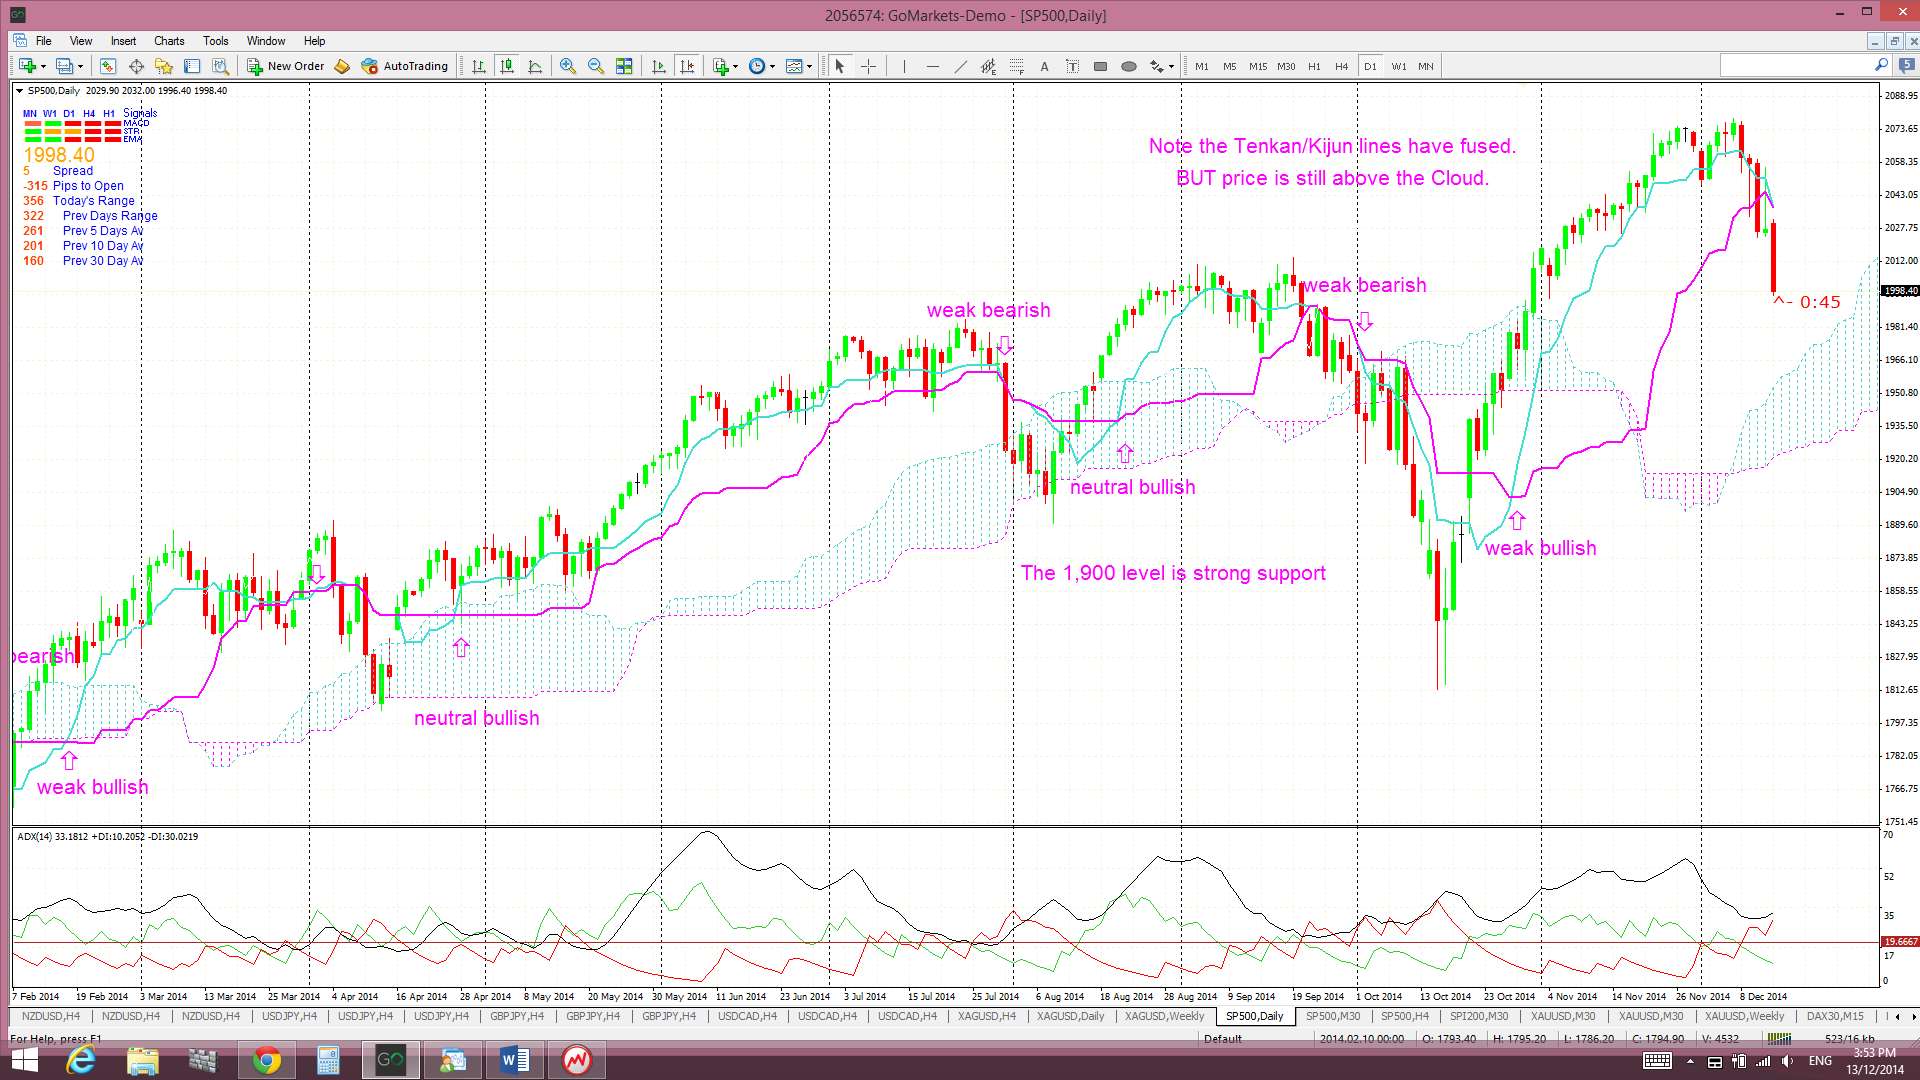
S&P500 daily chart: The index is back above the previous daily trend line and is holding above the key 2,000 level for now. A test of 1,900 wouldn’t break daily support though:

Ichimoku S&P500 chart: a clear cross of the blue Tenkan-sen line below the pink Kijun-sen line. The Tenkan/Kijun lines have fused but price is still trading above the Cloud for now. Watch for any new T/K cross:
S&P500 monthly chart: a break of the monthly support trend line (see monthly chart). The monthly trend line remains intact for now.
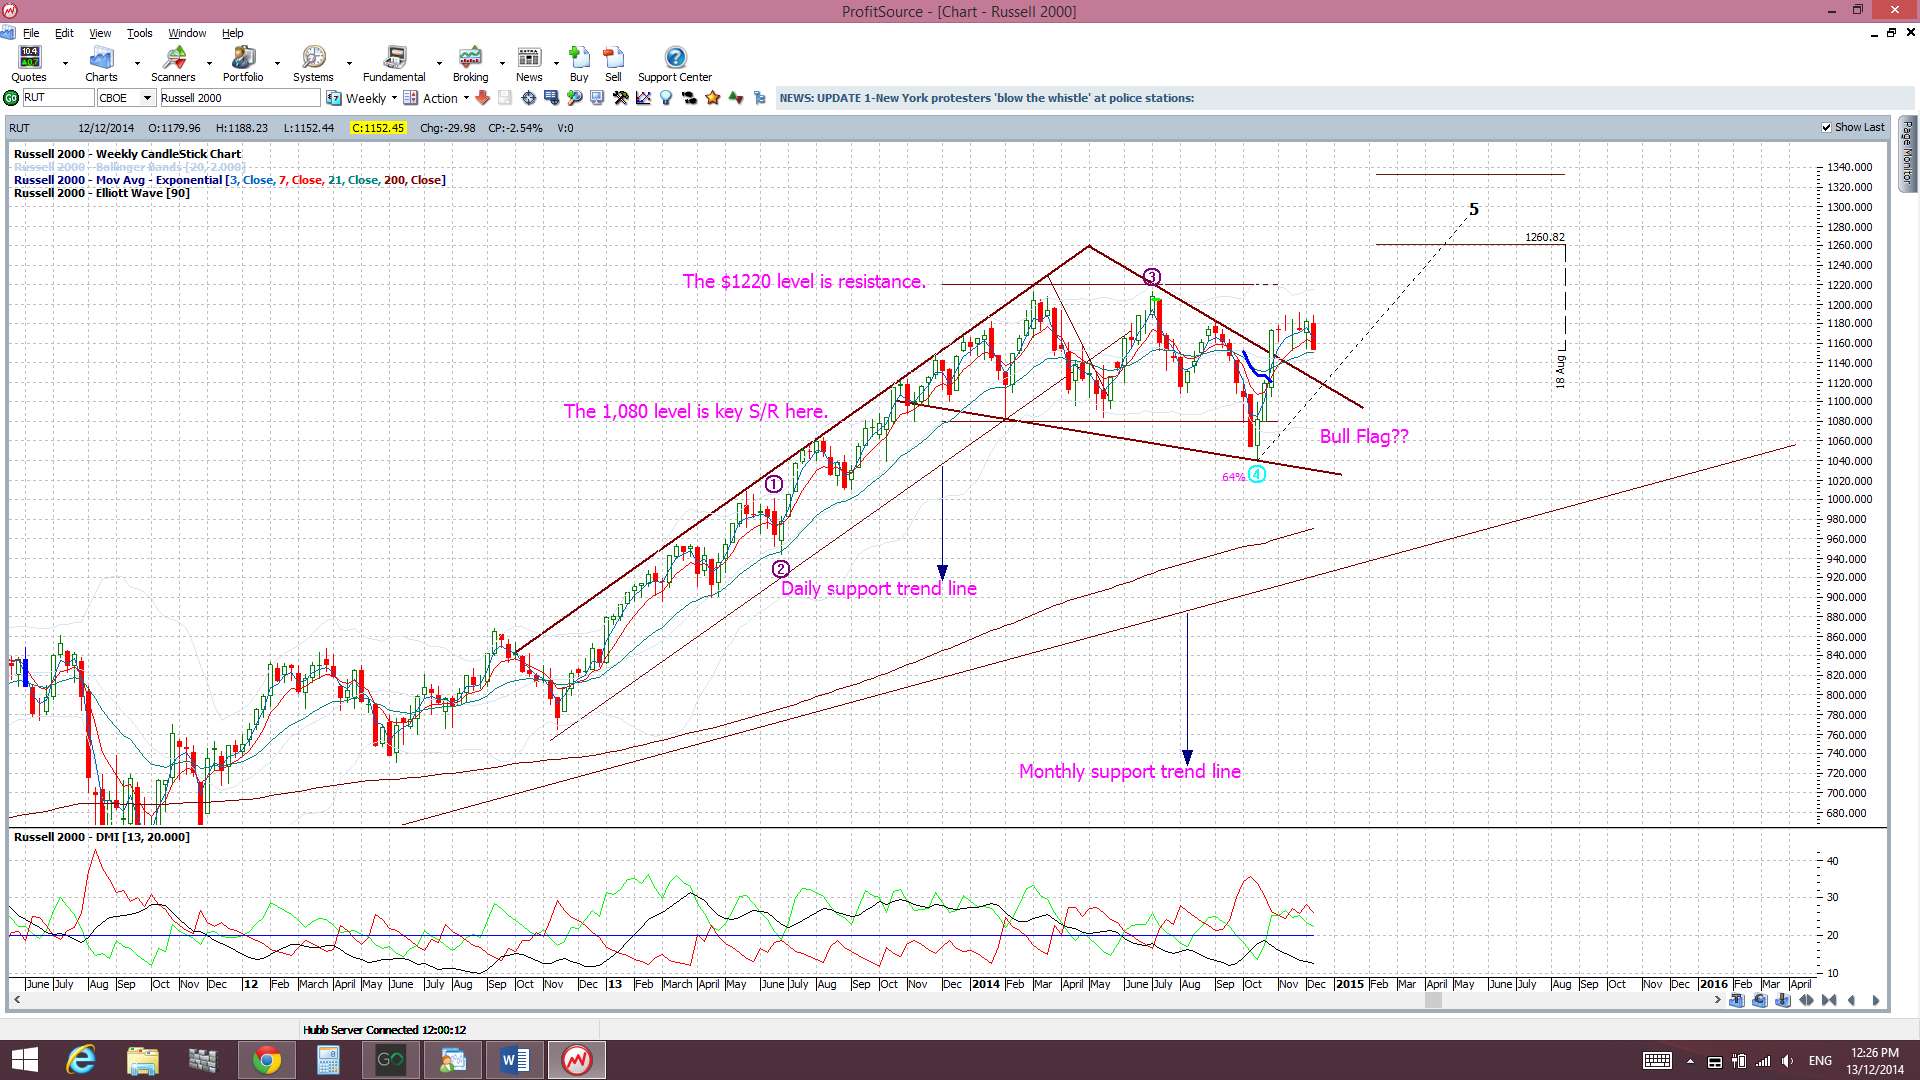
Russell 2000 Index: this small caps index is a bit of a US market ‘bellwether’ and I see the 1,080 level as key support here. The index continues to hold up and out from a ‘Bull Flag’ breakout for the time being. I’m actually surprised that this index hasn’t fallen further given the rout across other indices. This makes me a little suspect of just how much further stocks might fall:
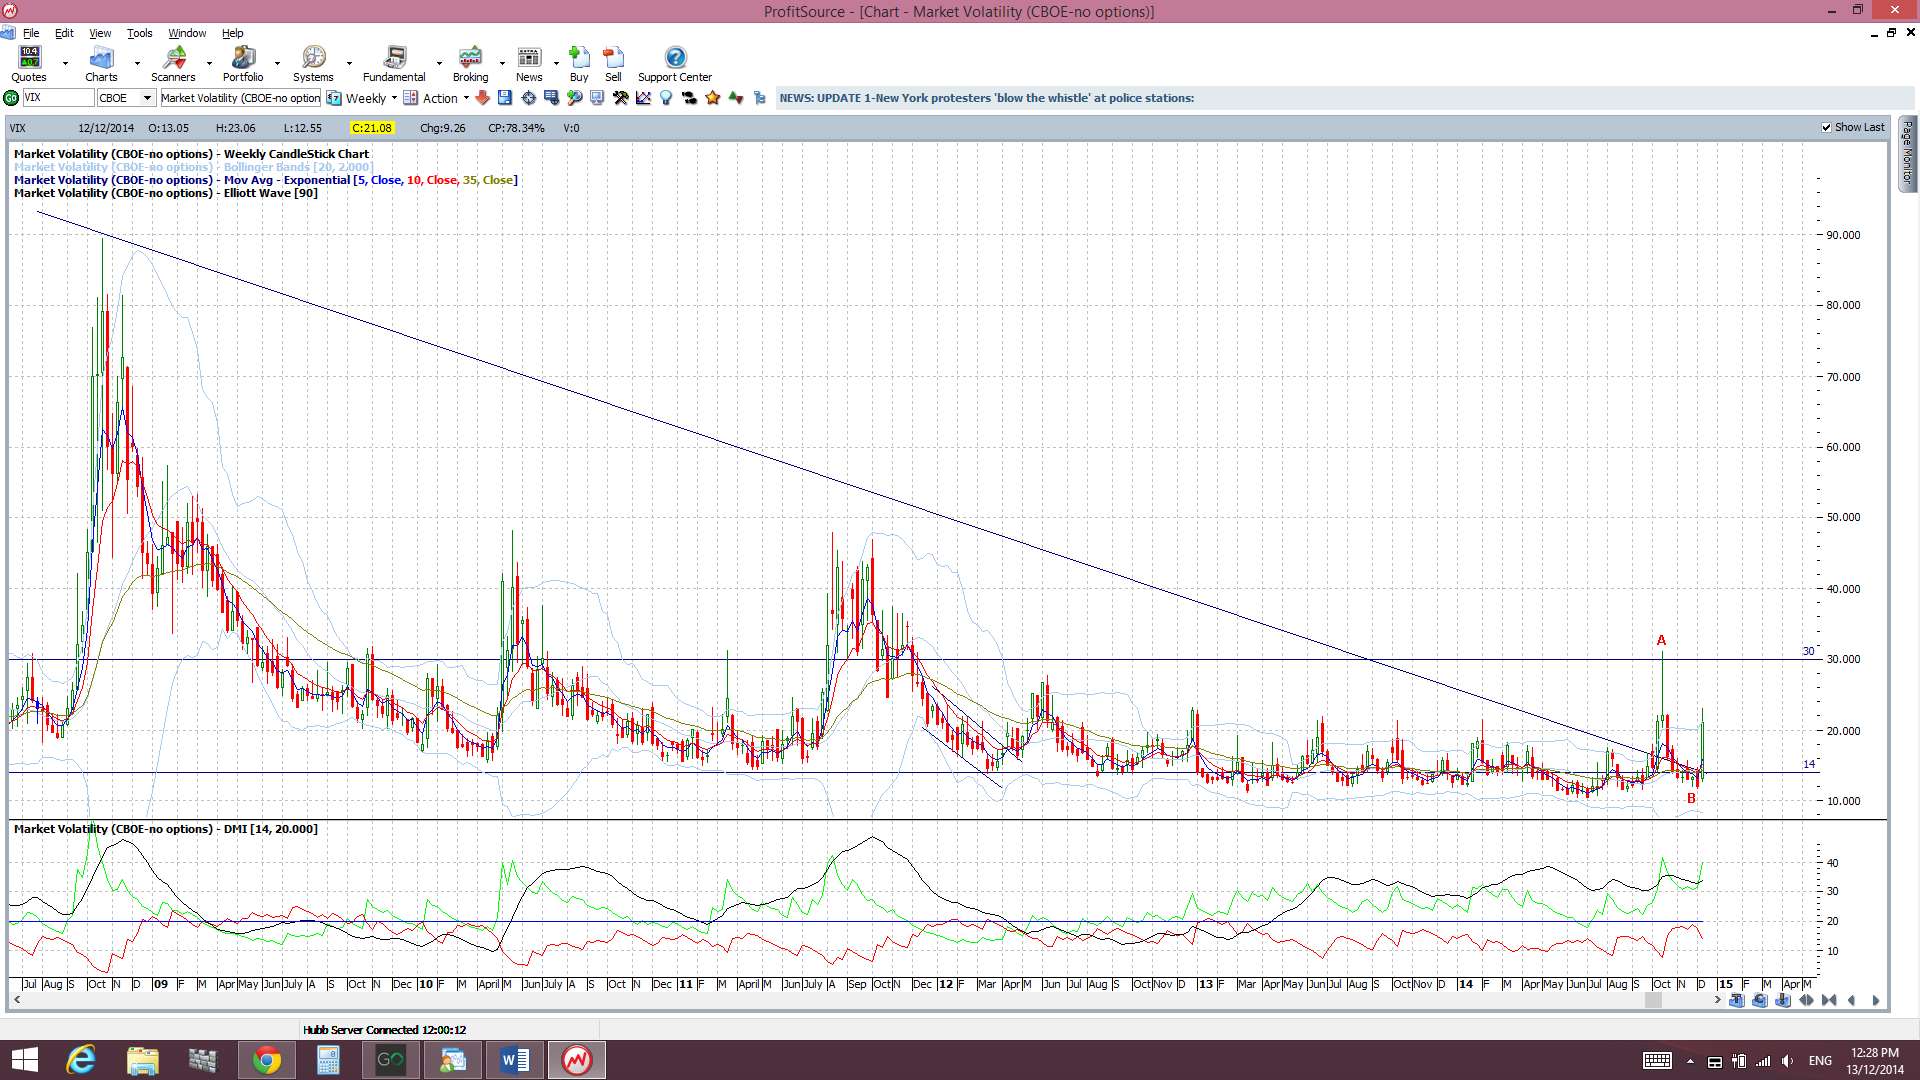
VIX Index: this is back above the 14 level but still below 30:
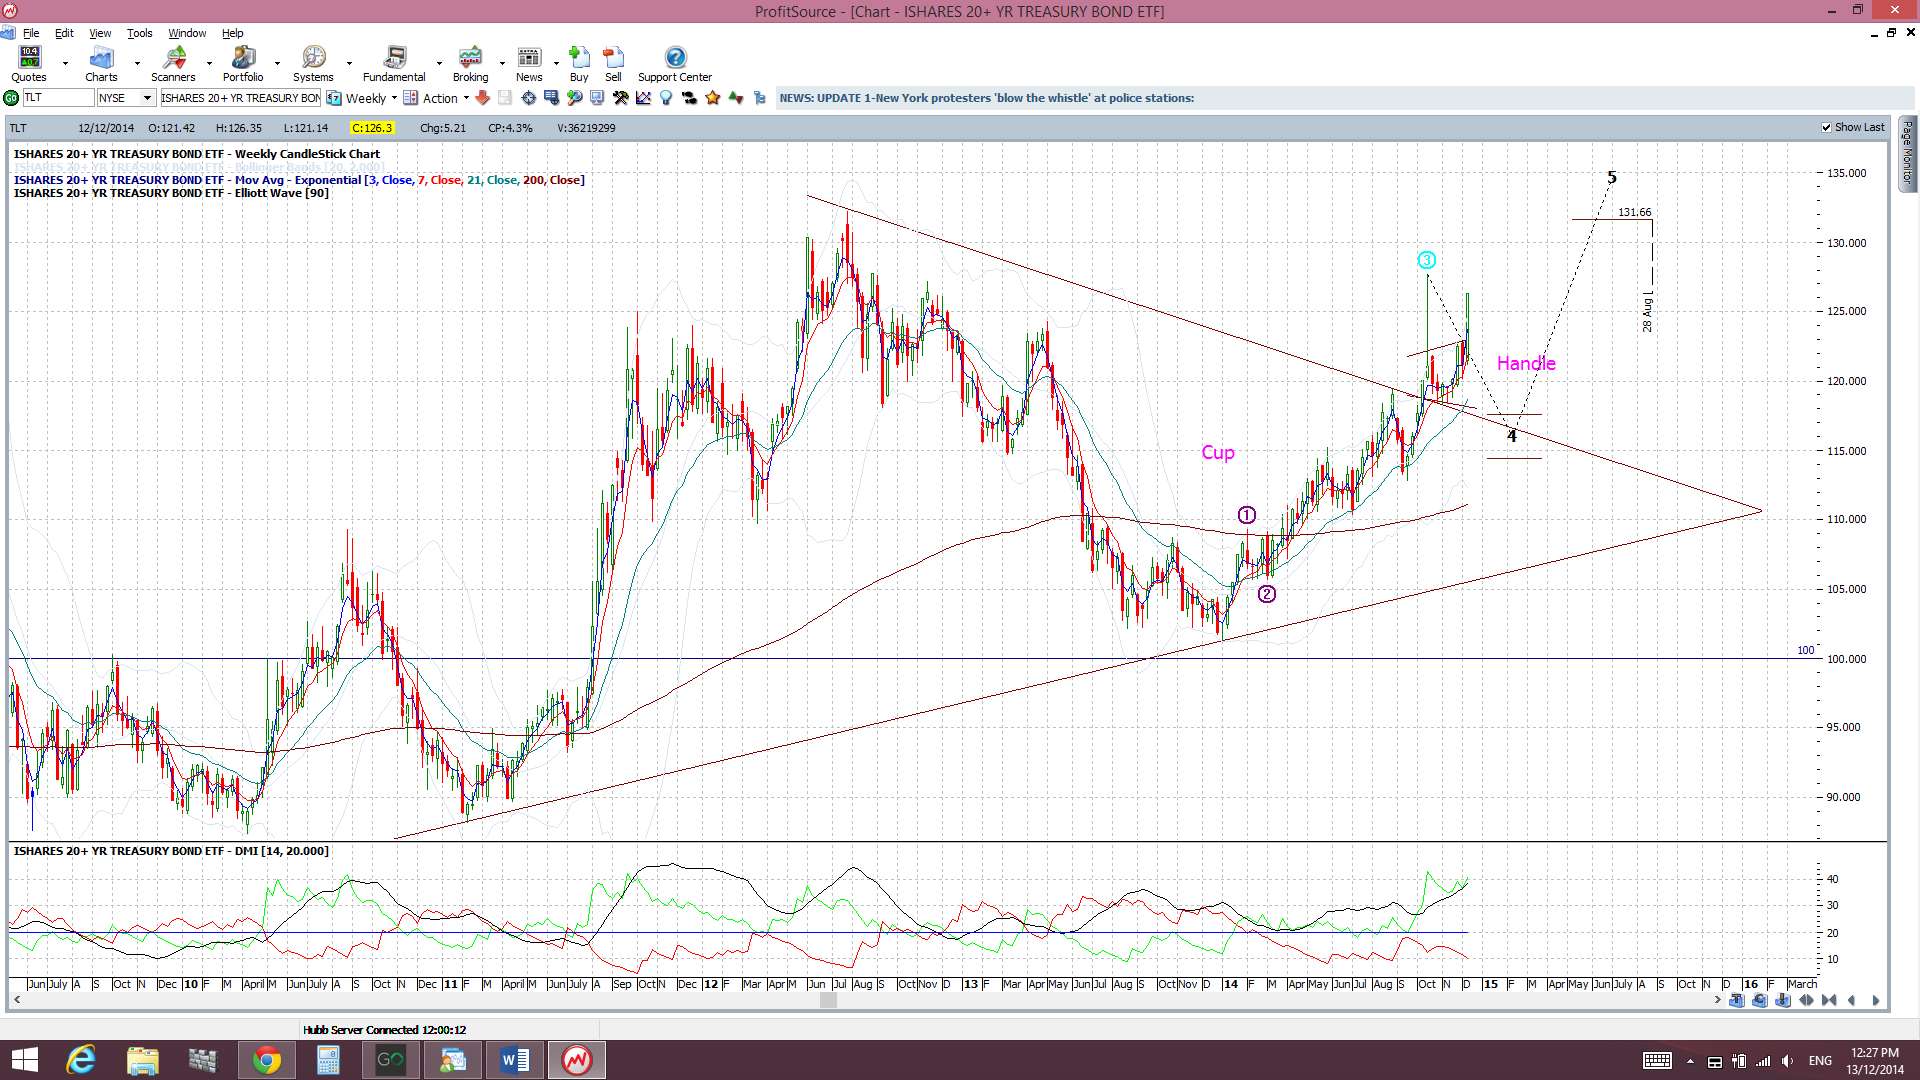
Bonds: The bond ETF remains above the triangle breakout and rallied higher last week. There has been a new bullish breakout from the Cup ‘n’ Handle pattern here now too:
Oil: Oil continues to pull back and I see a test of $40 as entirely feasible:

Trading Calendar Items to watch out for:
- Sun 14th: JPY Lower House elections.
- Mon 15th: AUD MYEFO.
- Tue 16th: AUD Monetary Policy Meeting Minutes. HSBC Flash Manufacturing PMI. GBP Bank Stress Test Results, CPI & Bo E Gov Carney speaks. EUR French & German Flash Manufacturing PMI & German ZEW Economic Sentiment. CAD Manufacturing Sales. USD Building Permits. NZD GDT Price Index.
- Wed 17th: GBP Average Earnings, Claimant Count Change & Bank Rate Votes. CAD Wholesale Sales. USD CPI, FOMC & FOMC Press Conference.
- Thurs 18th: NZD GDP. EUR German Ifo Business Climate. GBP Retail Sales. USD Unemployment Claims & Philly Fed Manufacturing Index.
- Fri 19th: JPY Monetary Policy Statement & BoJ Press Conference. CAD Core CPI & Retail Sales.
Forex:
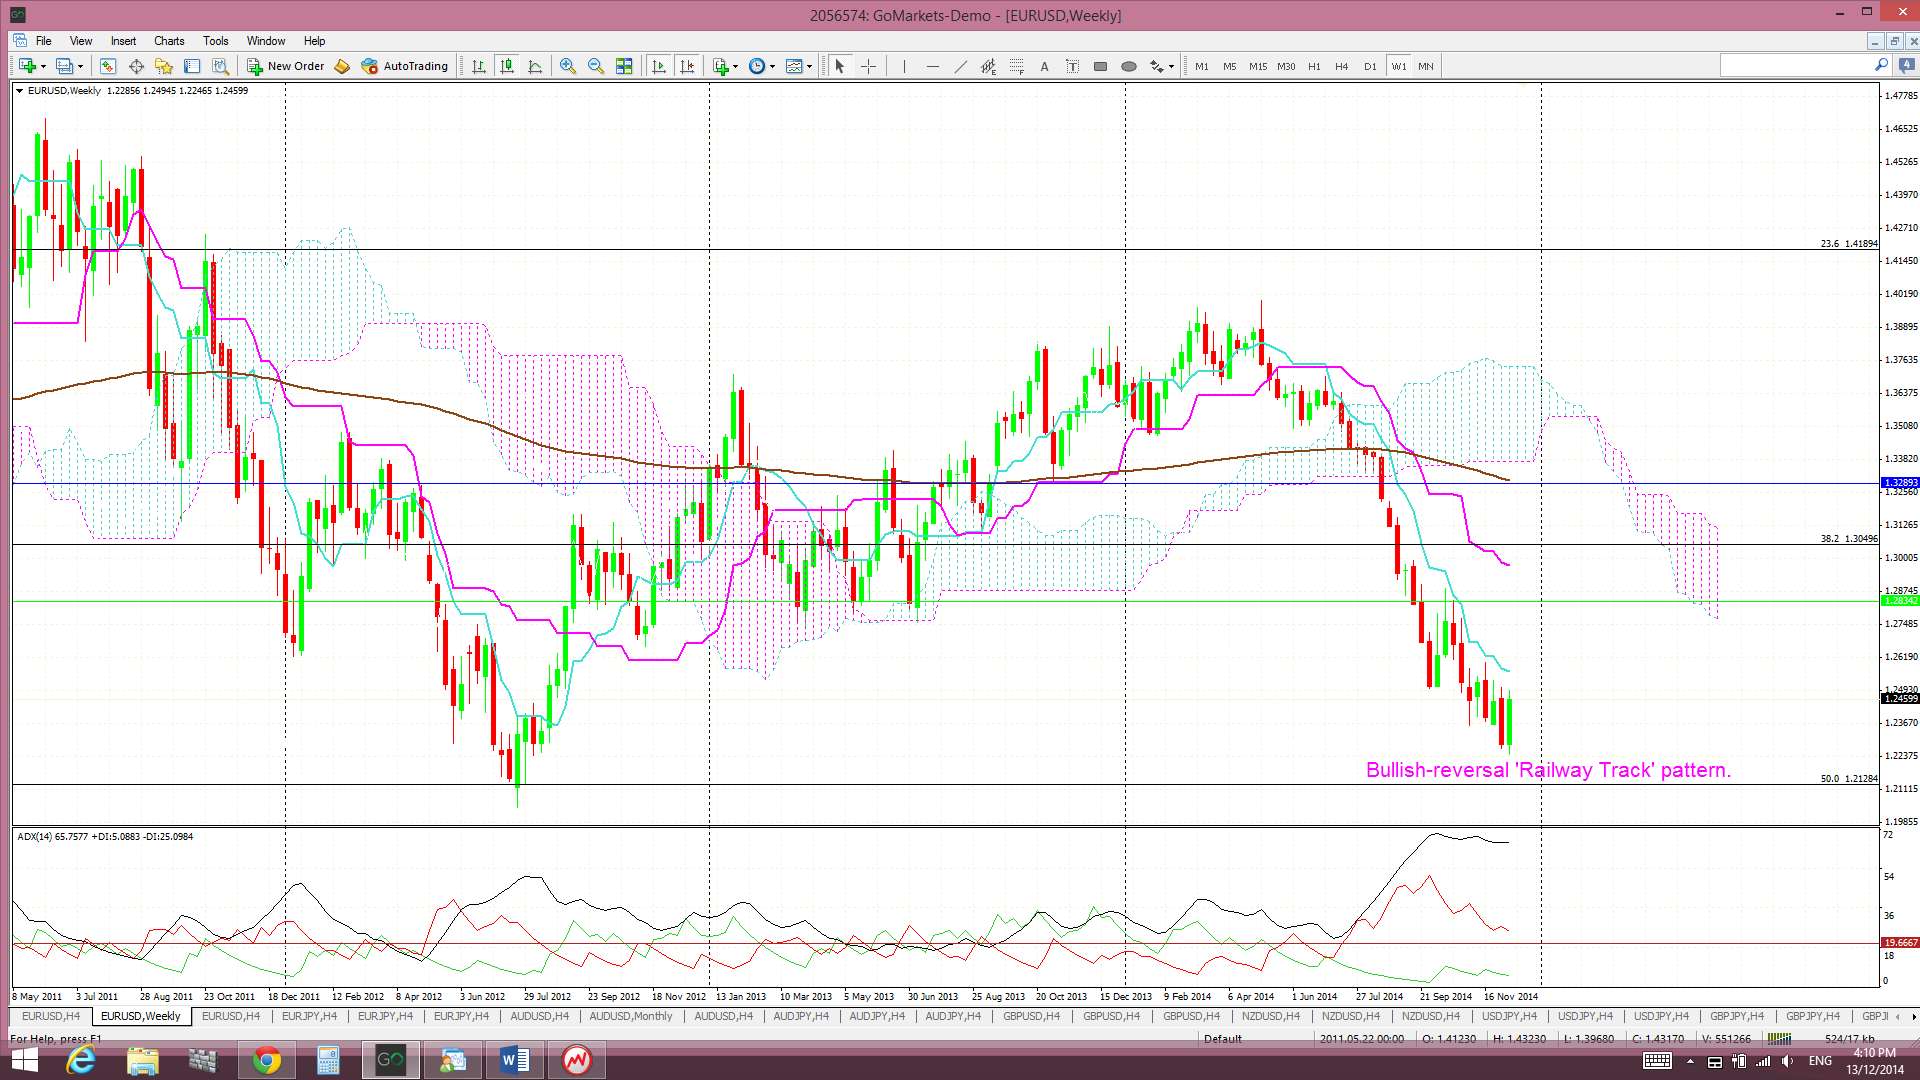
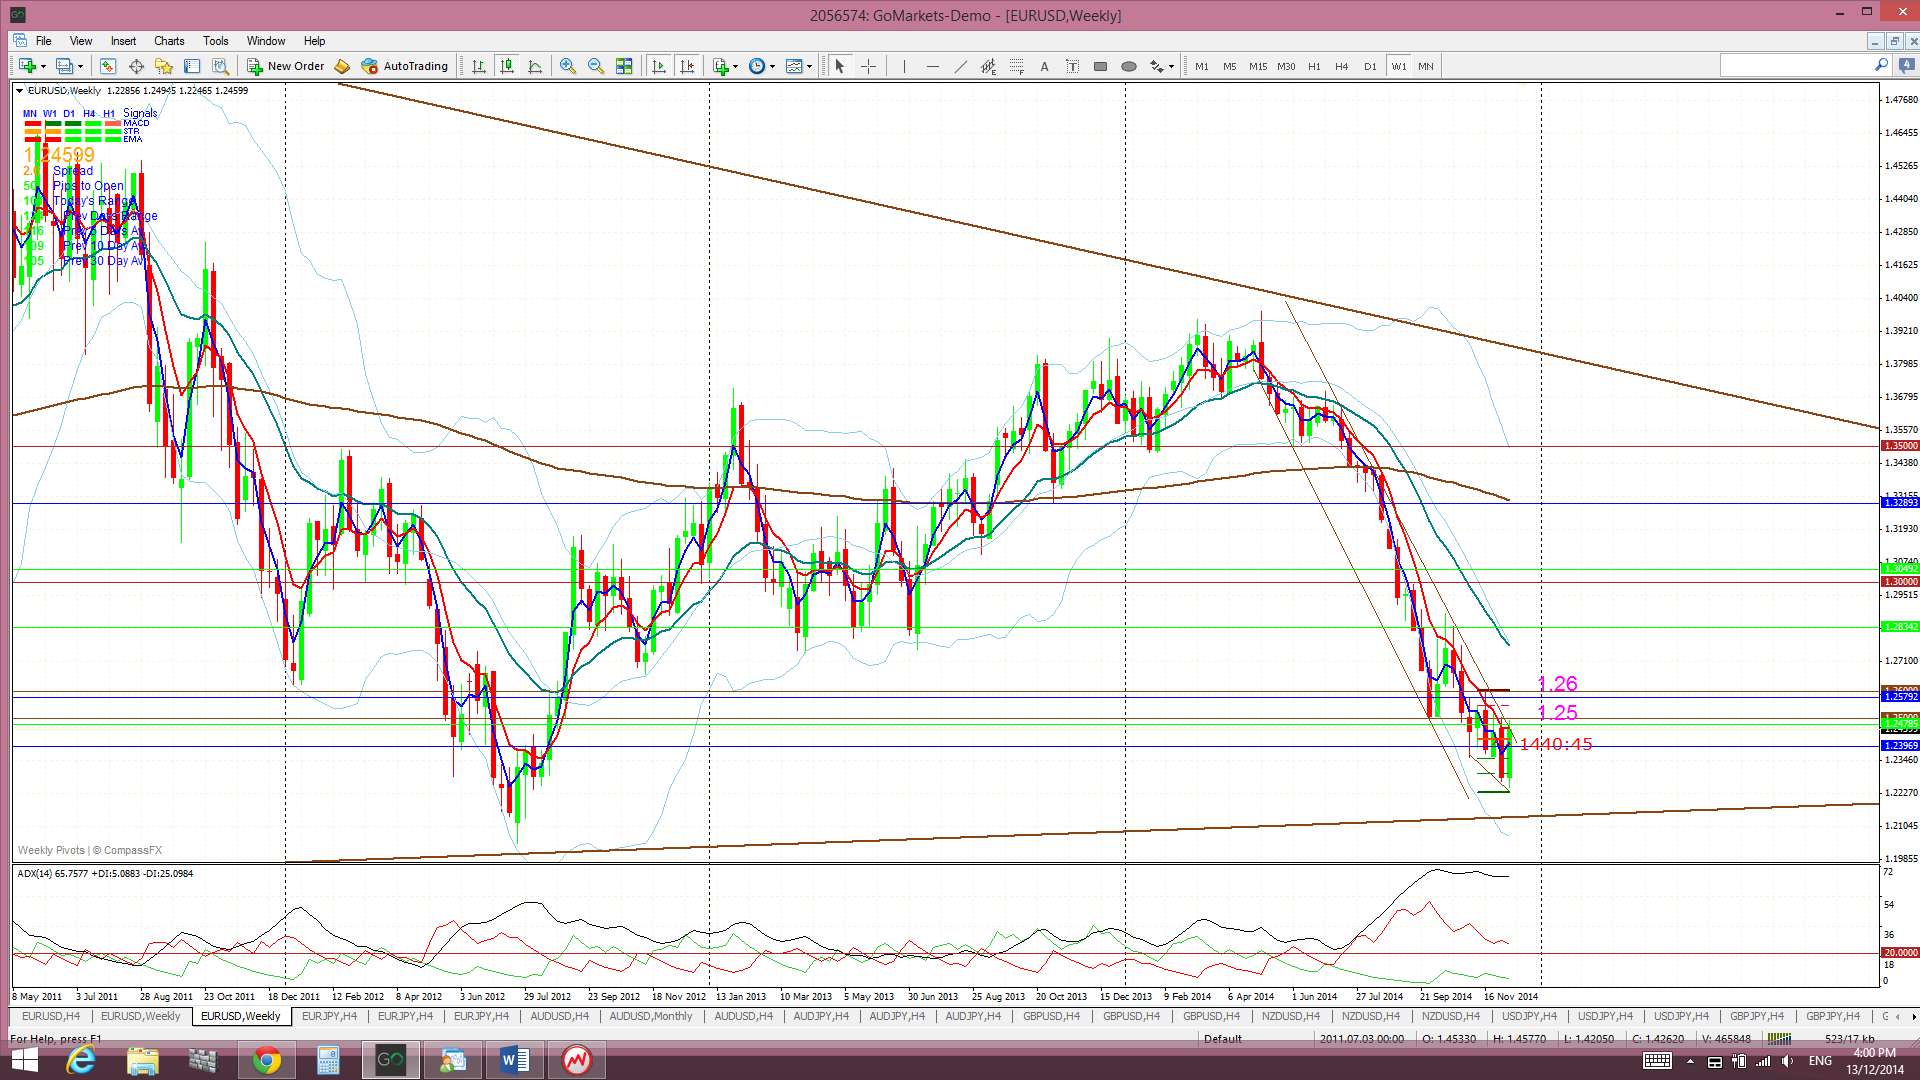
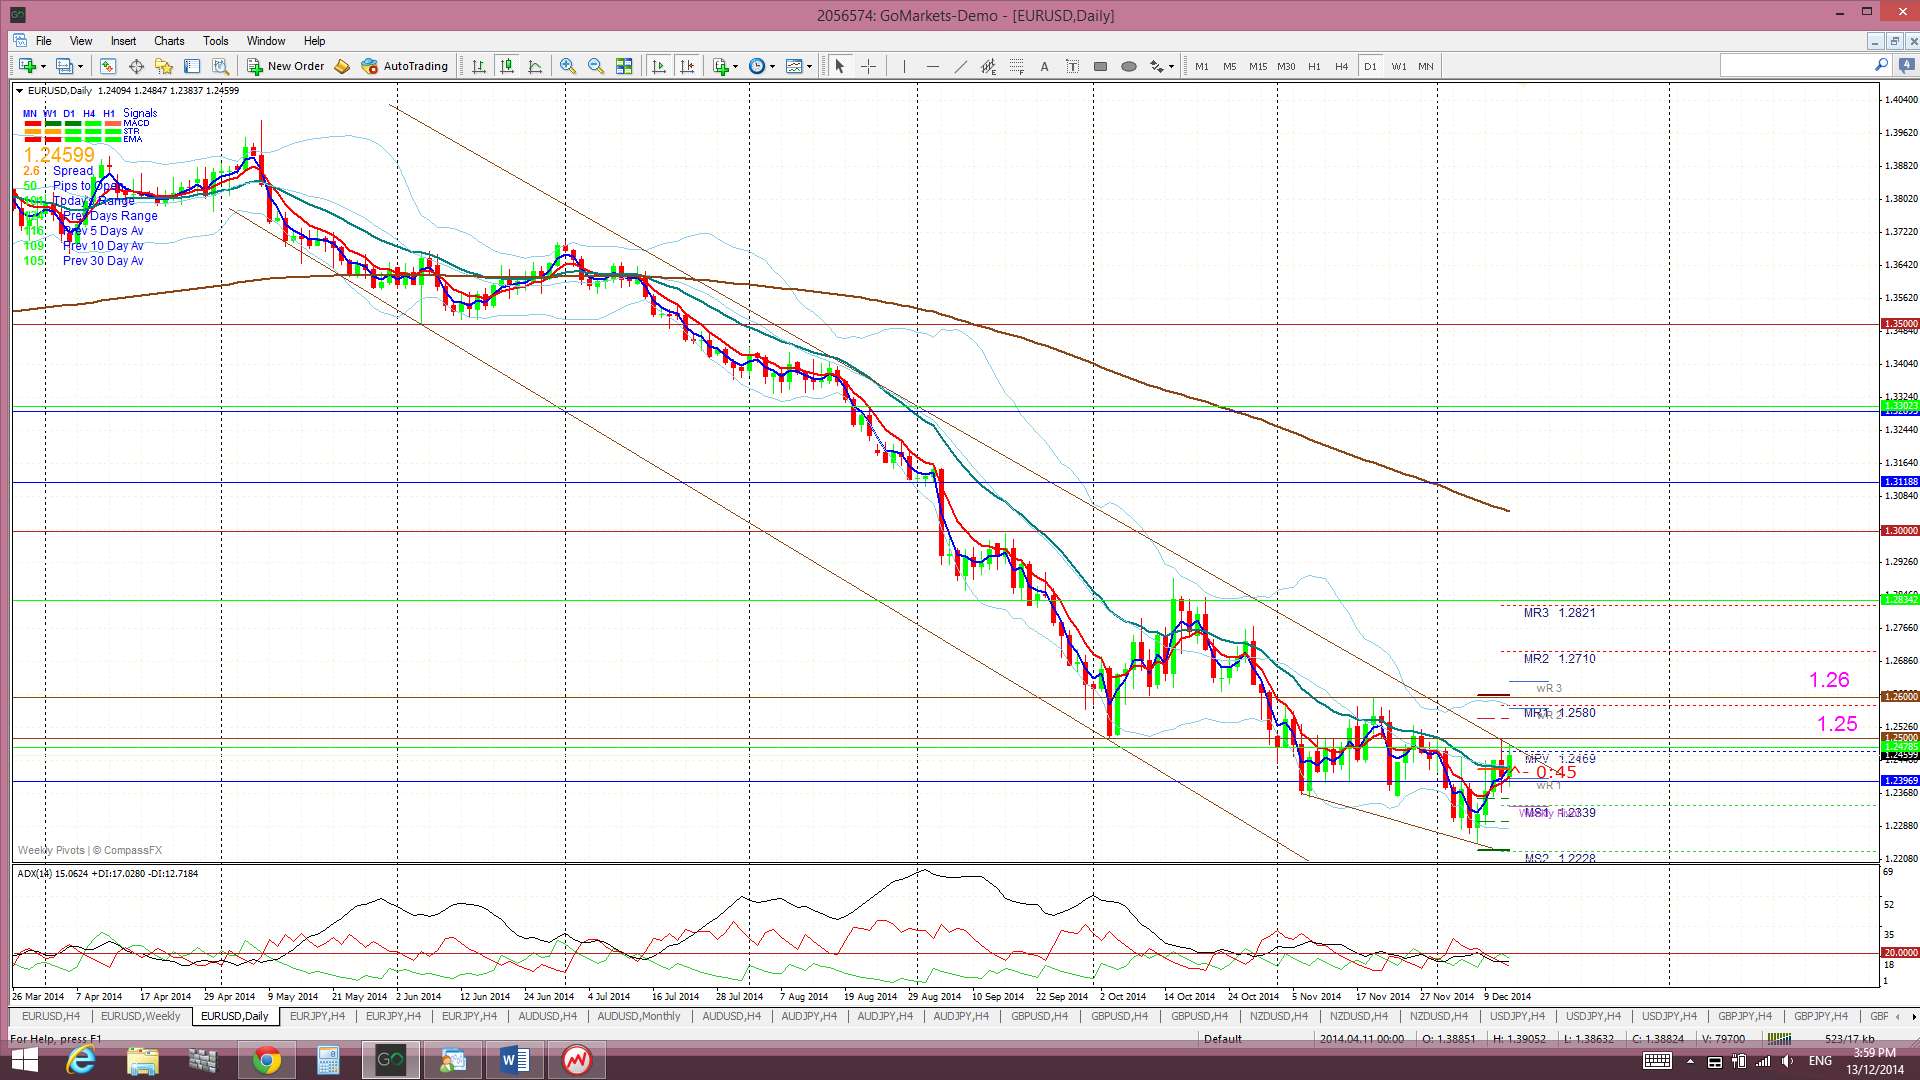
E/U: The E/U rallied last week but couldn’t manage a close back above the 1.25 level. Price made a bullish breakout from the descending trading channel but this was short lived and the trend lines have now been adjusted accordingly. However price recovered on Friday and ended the week back up just under the revised channel trend line and the 1.25 level.
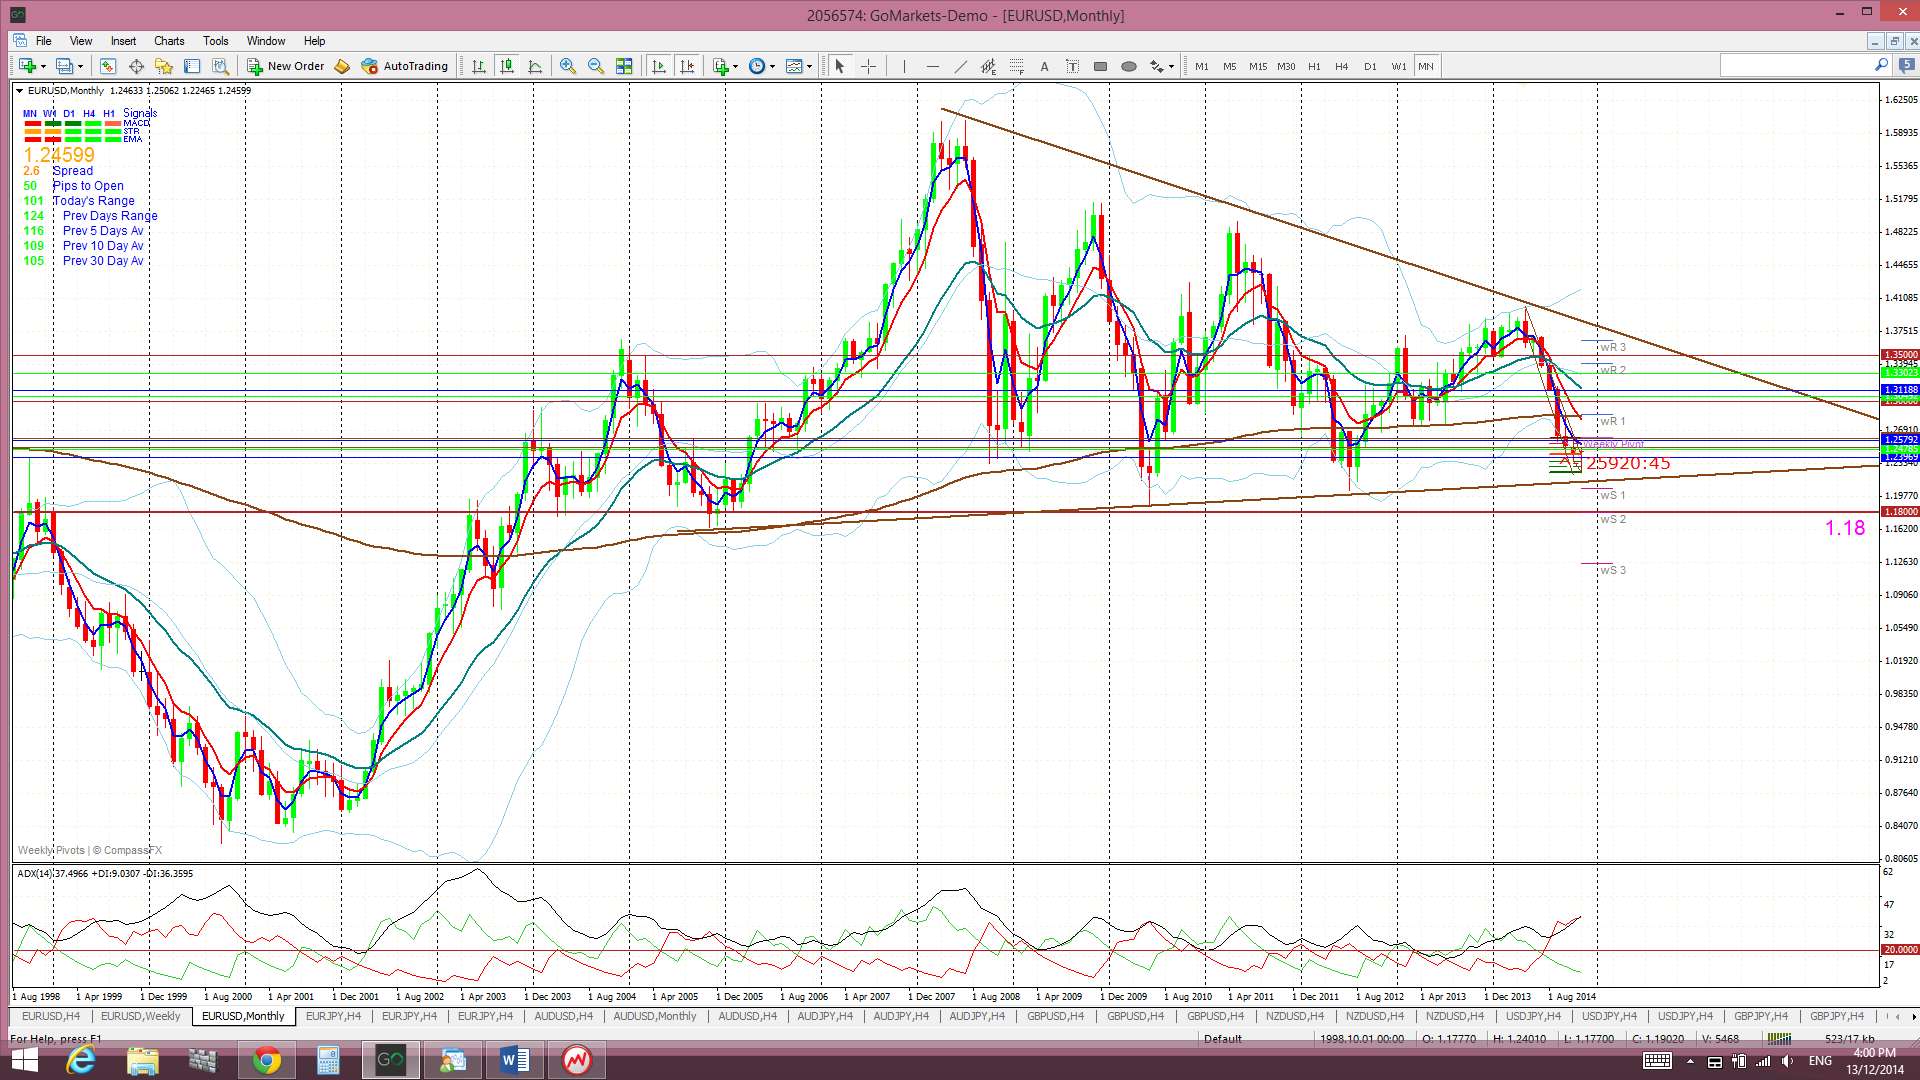
It is worth remembering though that this daily chart’s descending trading channel is set within a bearish descending triangle on the larger-scale monthly chart.
Descending triangle on the monthly chart: the descending triangle pattern is a bearish continuation pattern and has a base at around the 1.18 level. The height of this triangle is about 4,000 pips. Technical theory would suggest that any bearish breakdown of this triangle below 1.18 might see a similar move. It is worth noting that this would bring the E/U down near 0.80 and to levels not seen since 2000/2001!
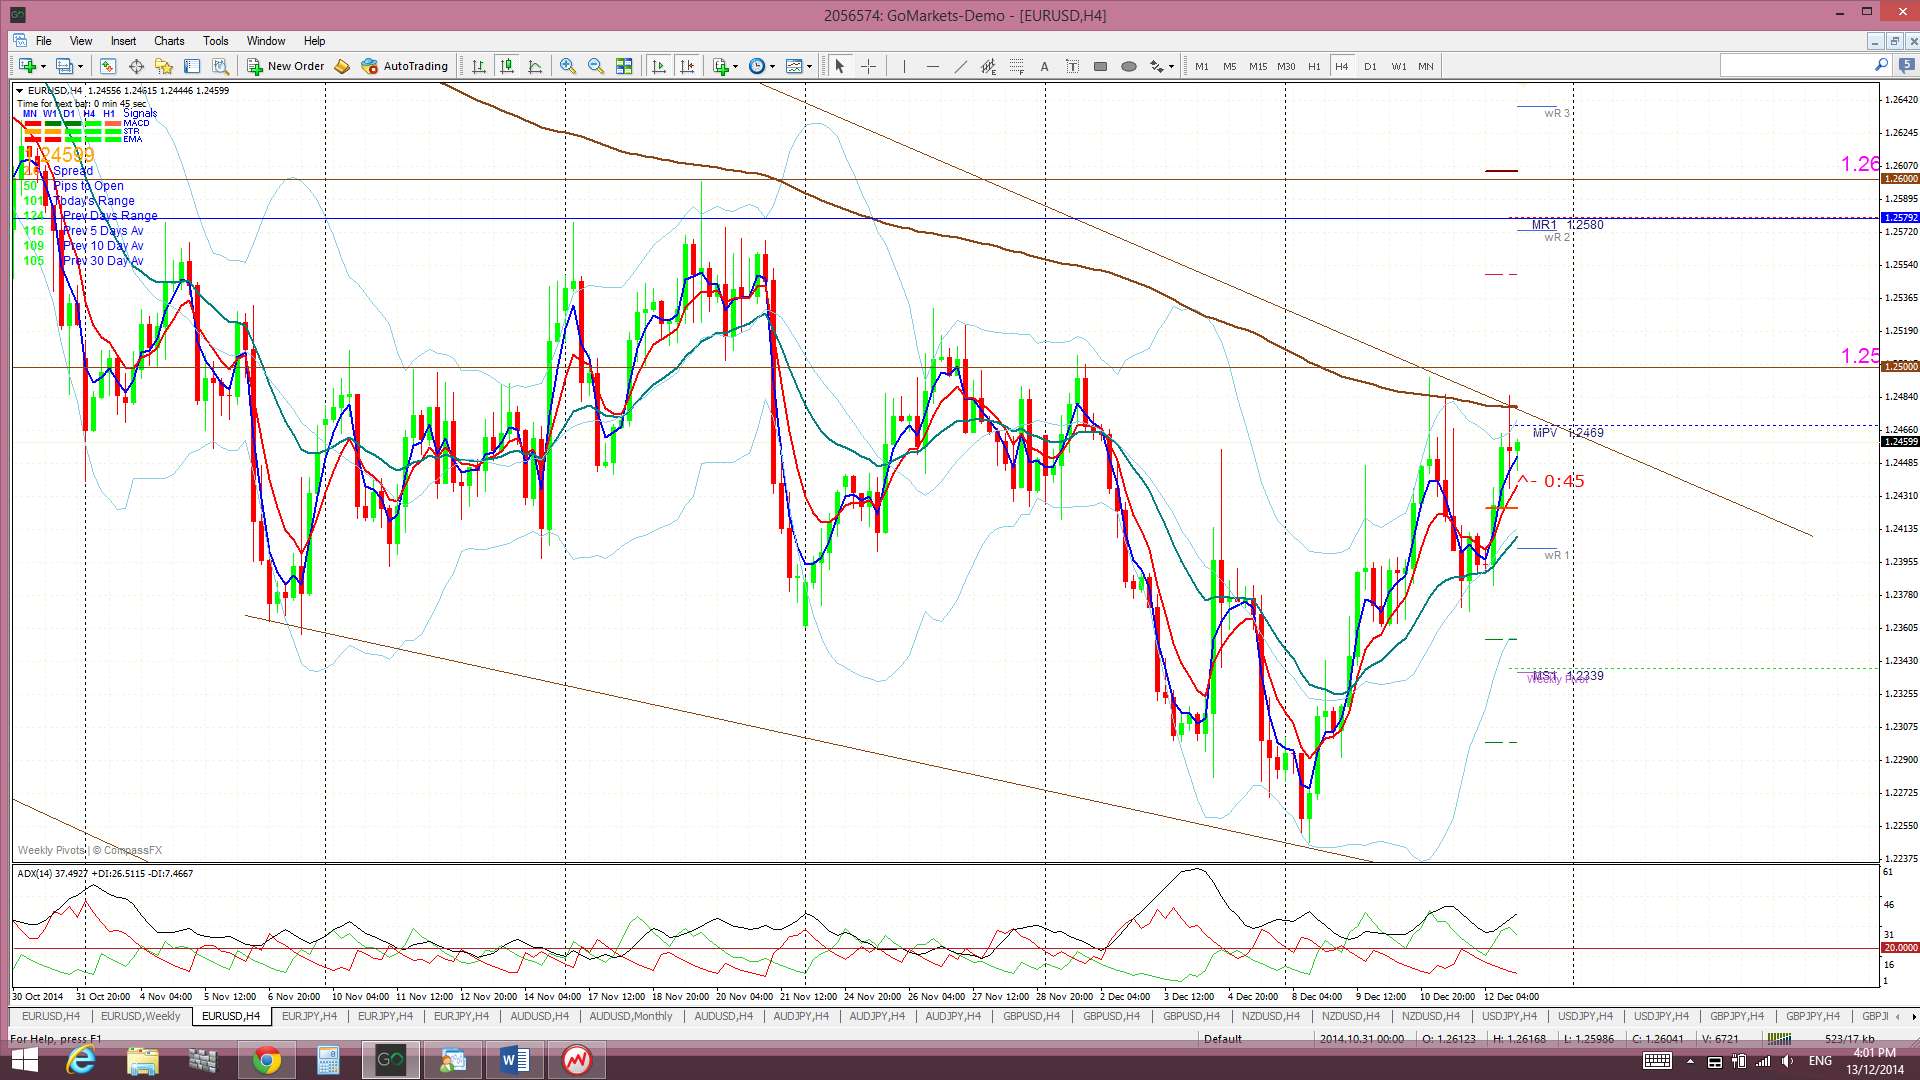
Price is trading above the Ichimoku Cloud on the 4hr chart but below on the daily, weekly and monthly.
The weekly candle closed as a bullish-reversal ‘Railway Track’ candle. This pattern has formed up just above the 50% fib of the 200-2007 bull run:
- I’m watching for any new TC signal on this pair and the daily chart’s trading channel trend lines.
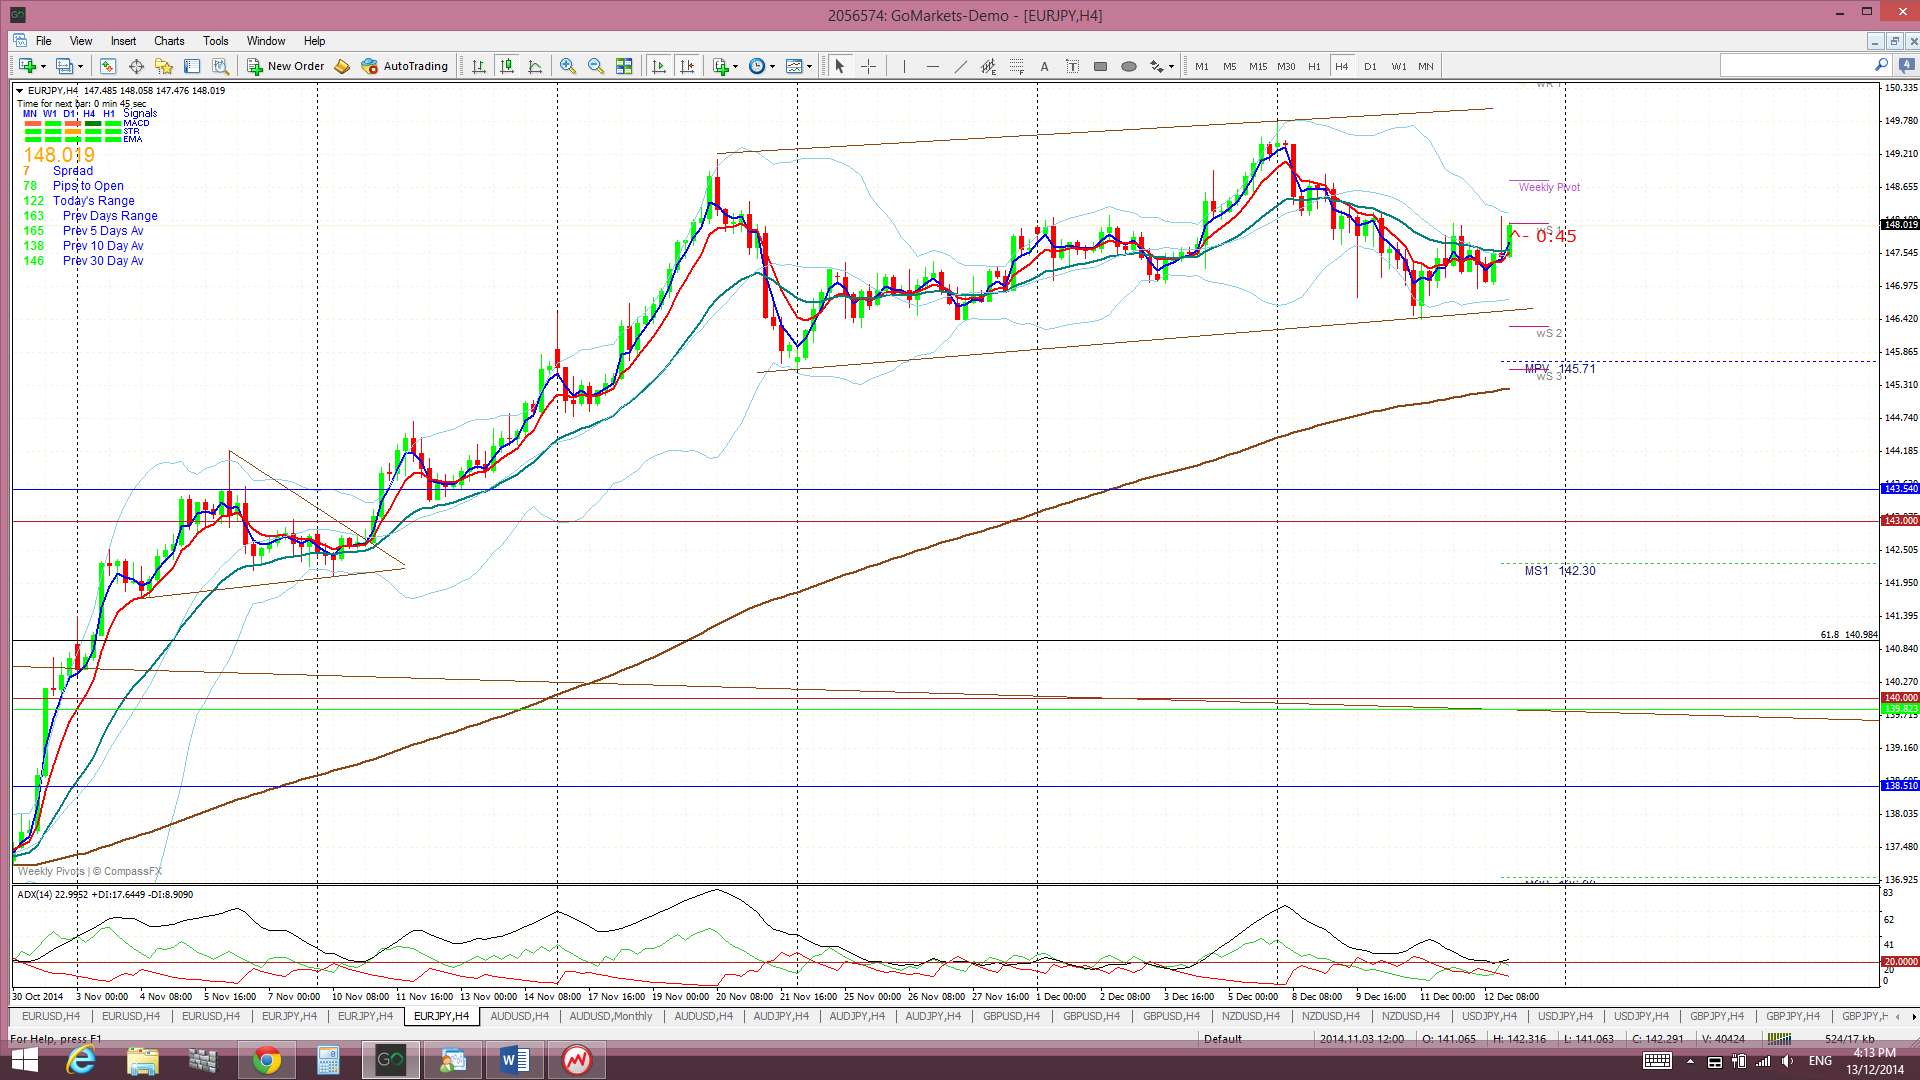
E/J: The E/J chopped lower last week but within an ascending trading channel.
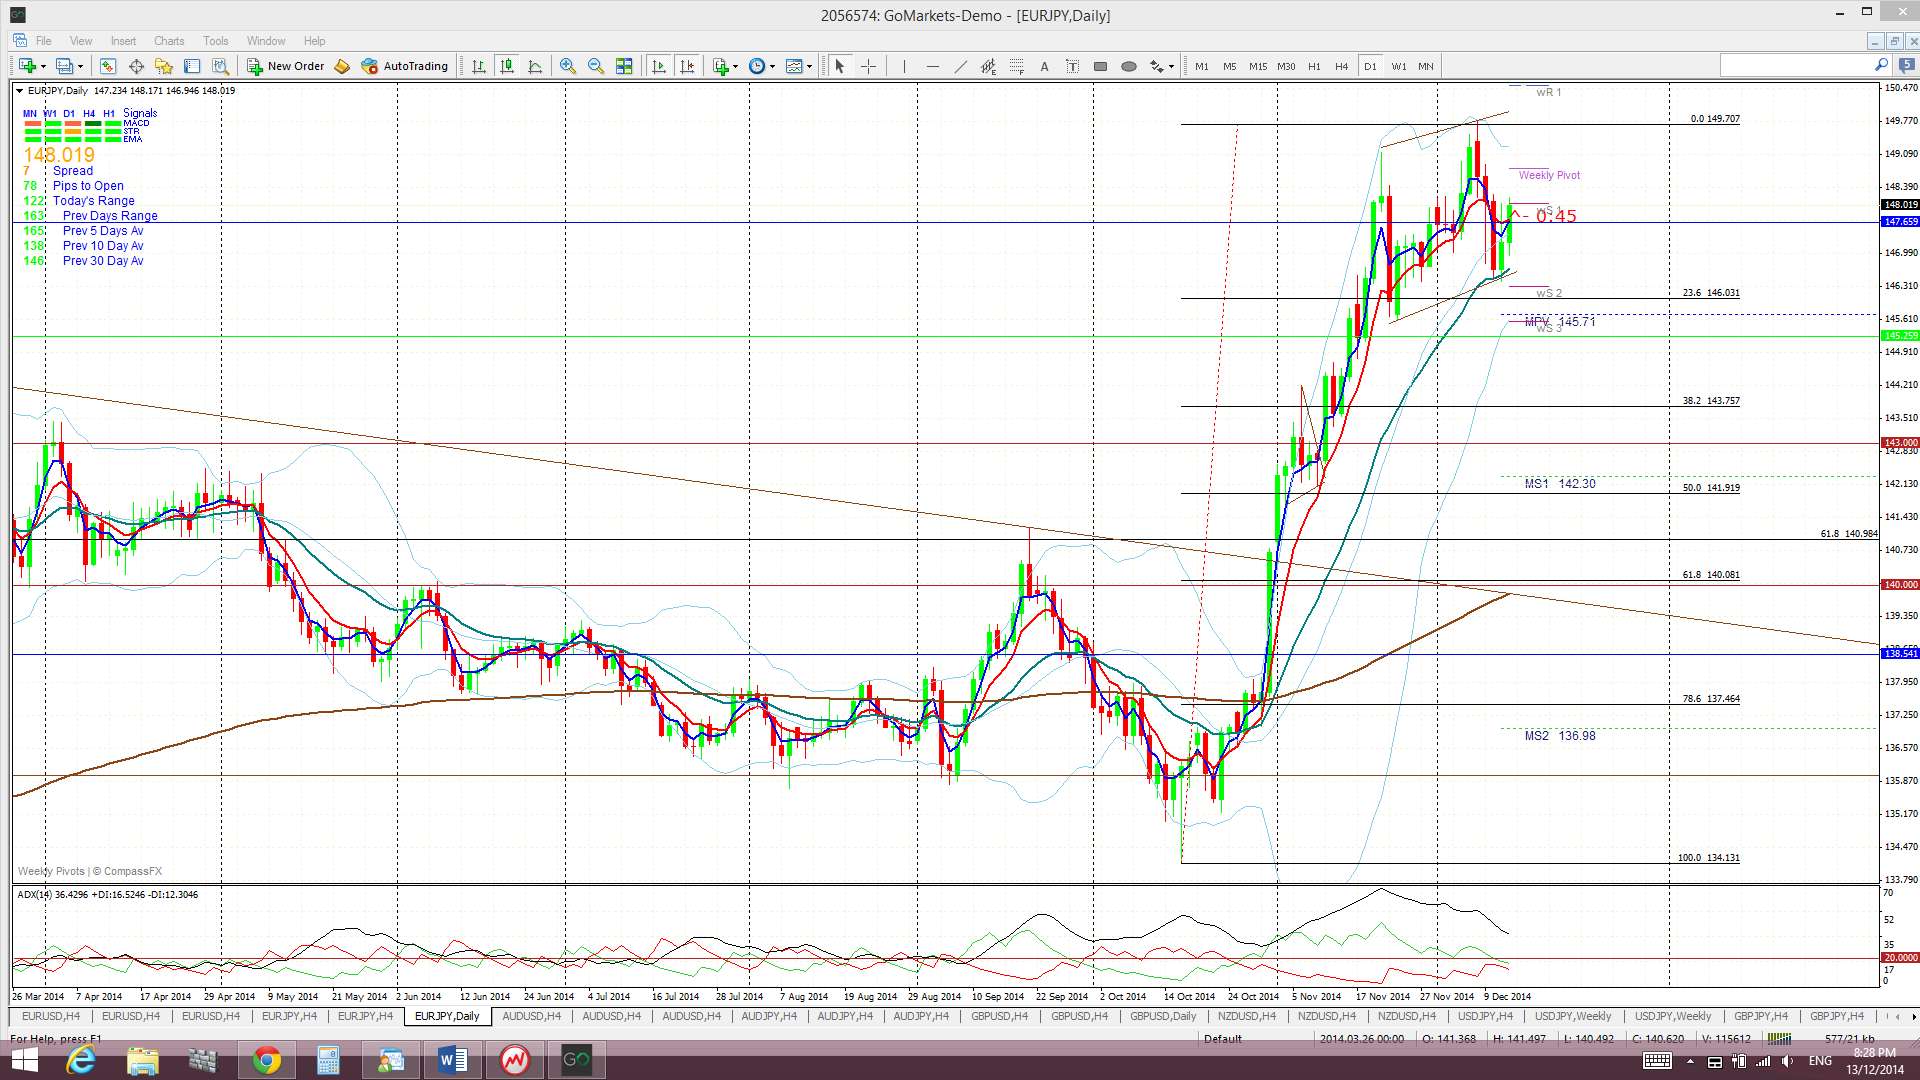
The channel has a bearish look to it though and possible pull back targets for any move lower can be seen from the daily chart and include:
- The 38.2% fib near the key 143 level.
- The 50% fib near the daily 200 EMA circa 142.
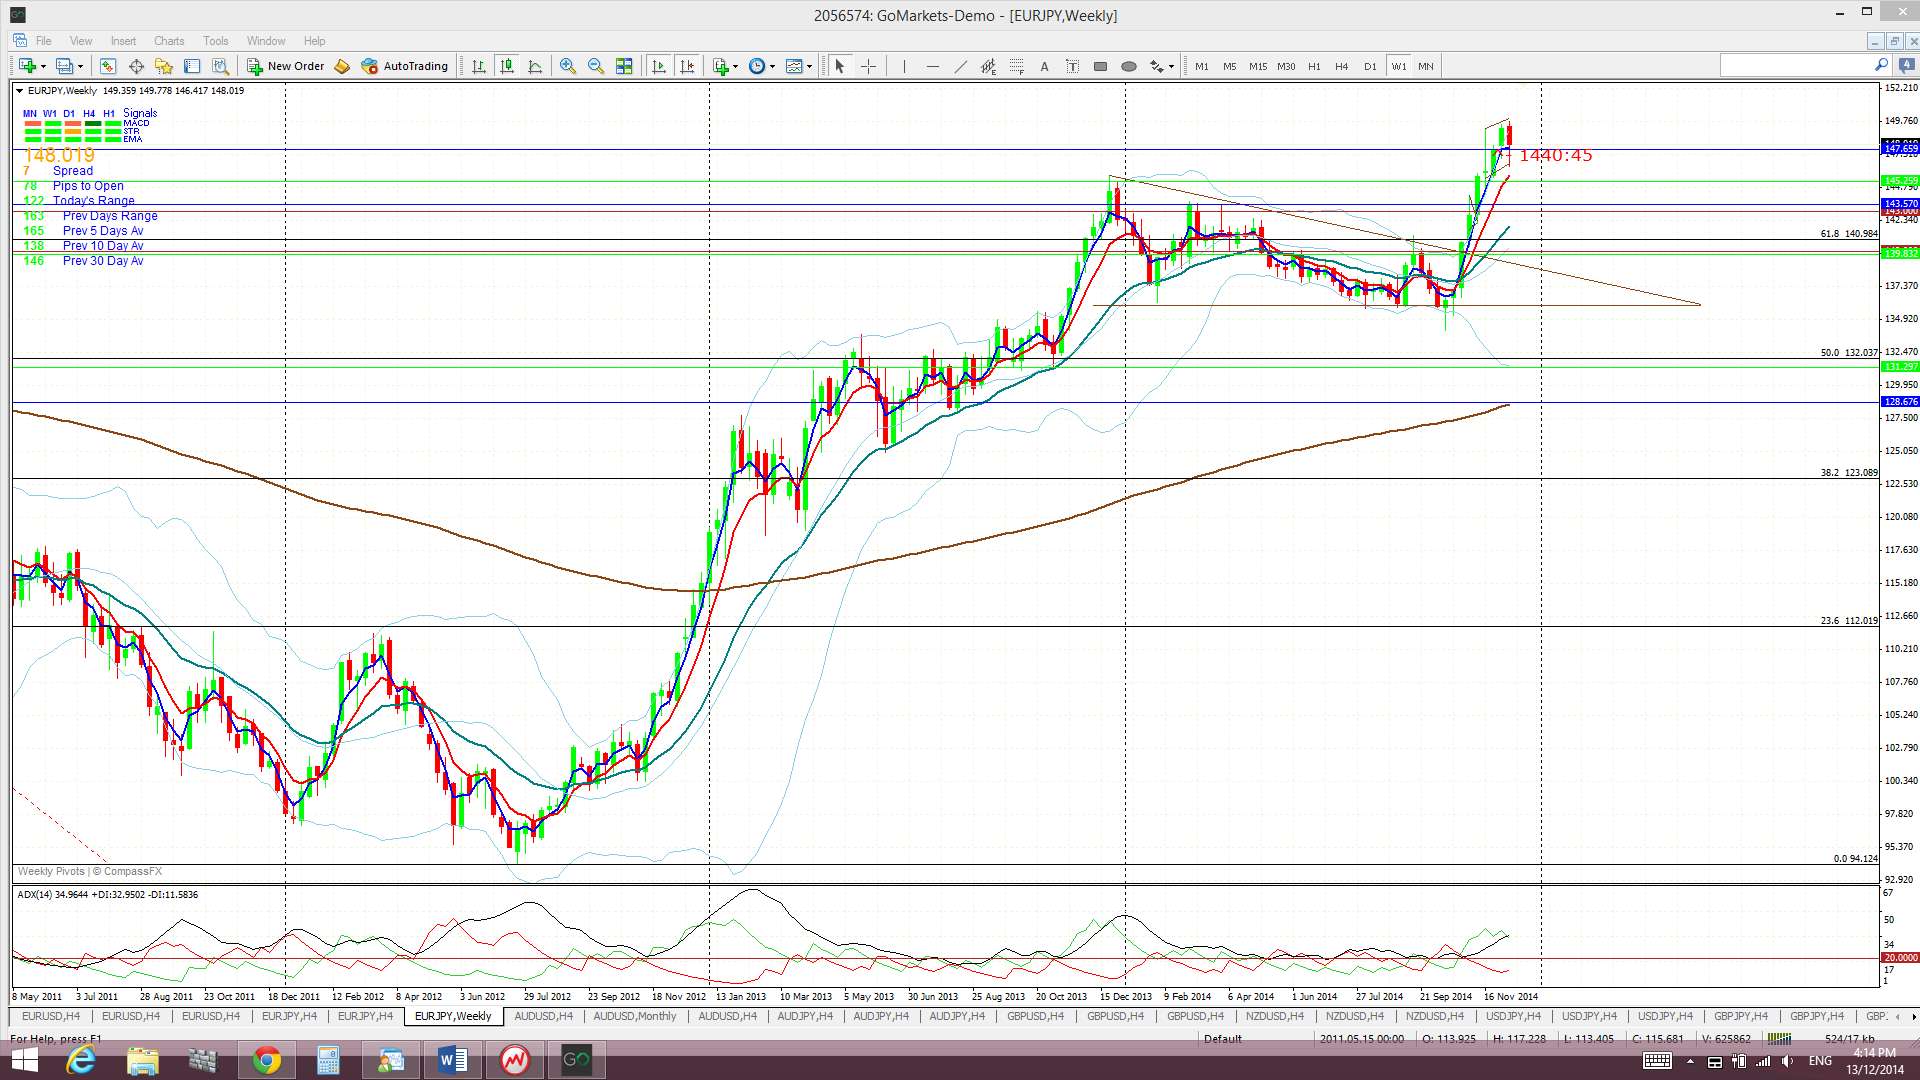
- The 61.8% fib near the key 140 level. This level is also near the trend line from the previous weekly chart’s triangle breakout and it is near the 61.8% fib of the monthly charts major bear move. Thus, there is a lot of confluence in this region.
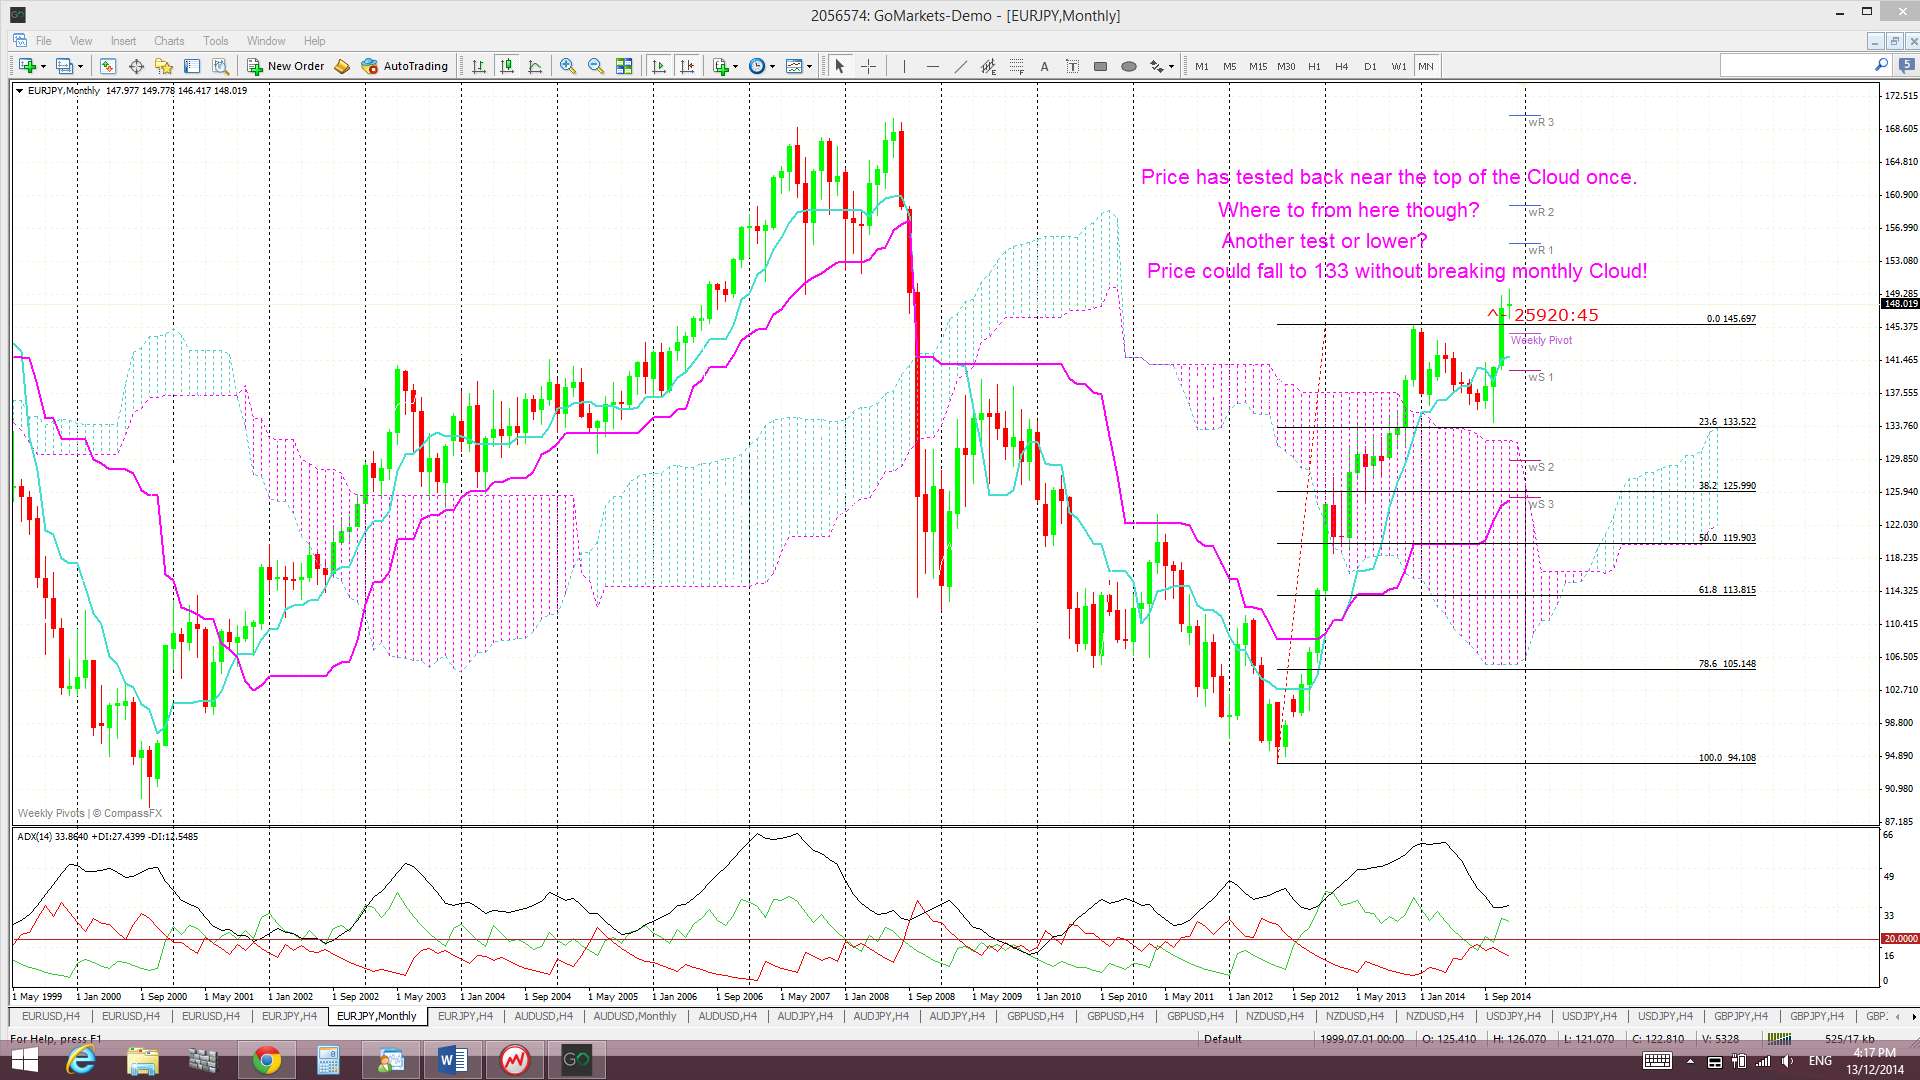
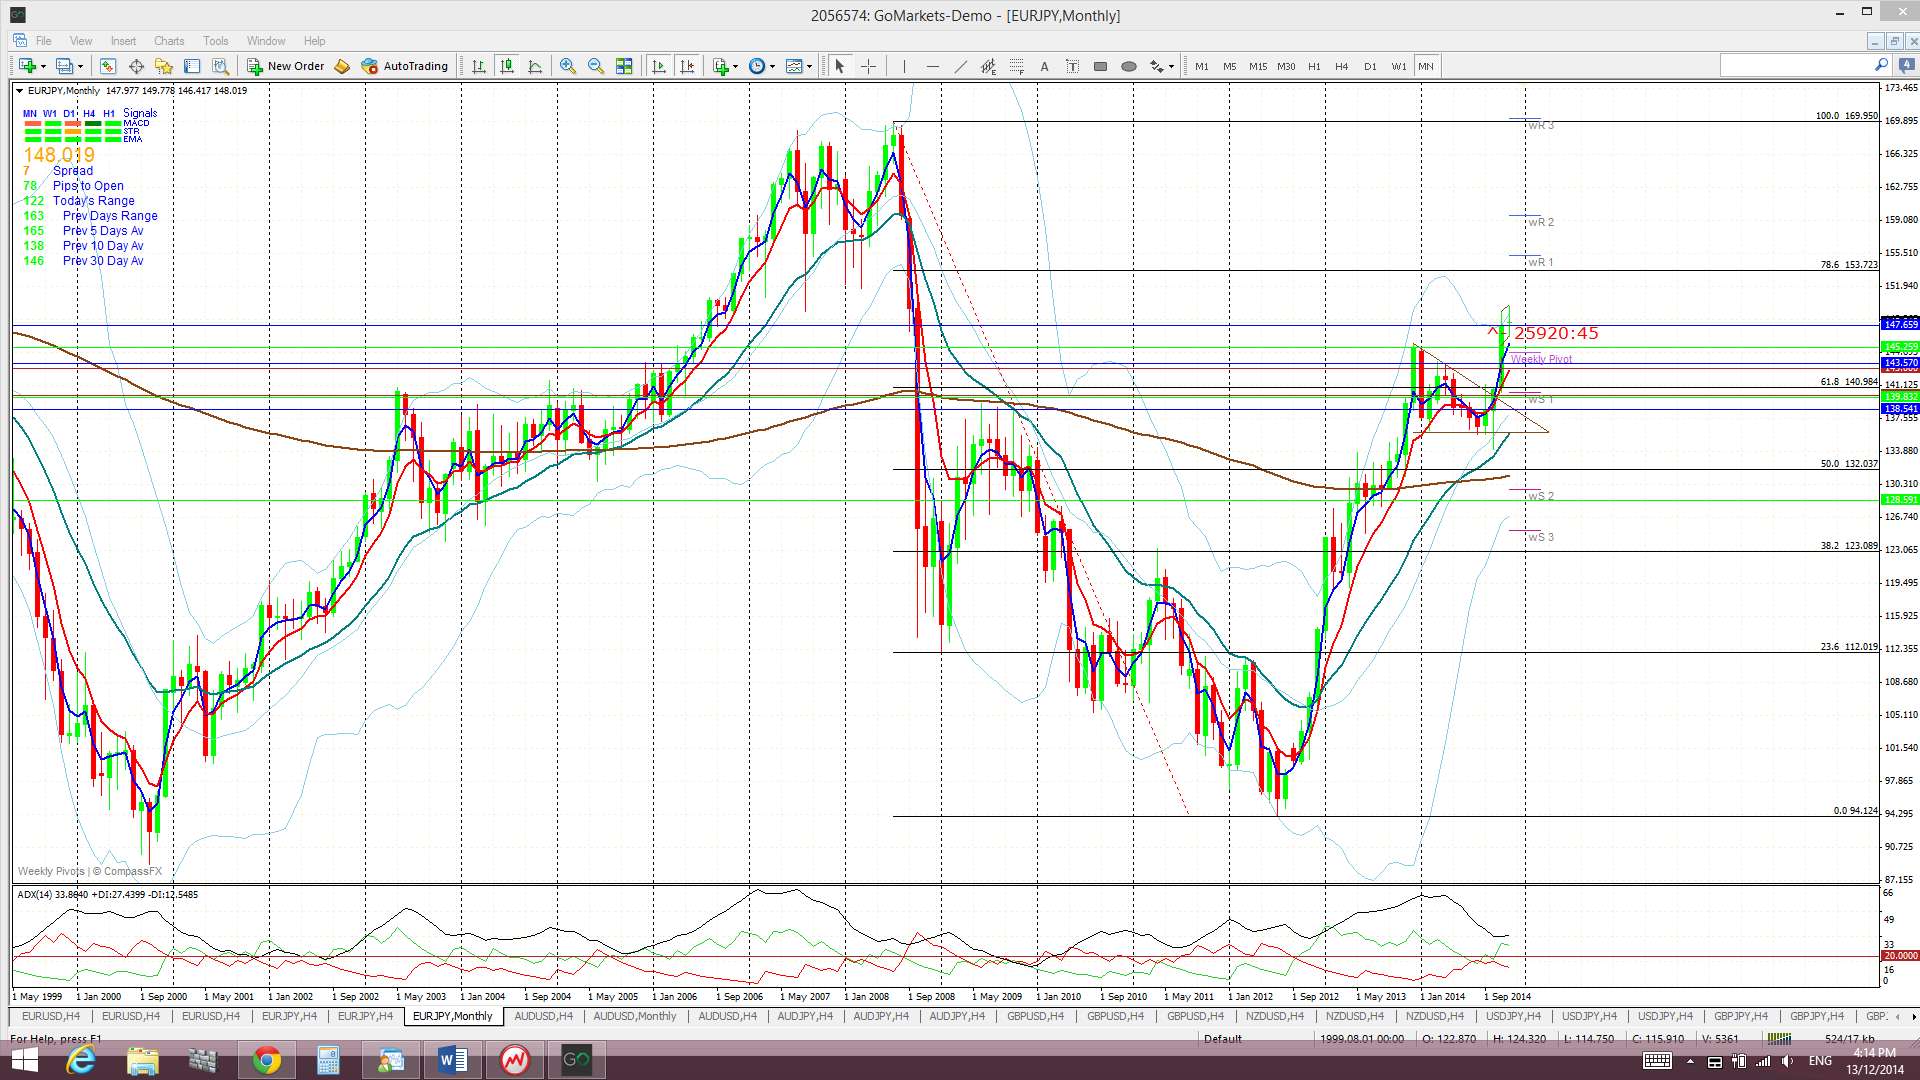
Price is now trading just below the Cloud on the 4hr but above the Cloud on the daily, weekly and monthly charts. The November and December candles were the first to close above the resistance of the monthly Ichimoku Cloud since 2008. Check out the monthly Cloud chart below. The E/J made its last break back above the monthly Cloud in 2003 and the consolidation pattern following that breakout is very similar to the consolidation we’re seeing now. Note how, back then, price eventually rallied and I wonder if history will repeat itself here?
The weekly candle closed as a bearish candle with a long lower shadow and this has given it a bearish-reversal ‘Hanging Man’ appearance. However, the daily chart has a bit of a Bull Flag look to it!
- I’m watching for any new TC signal on this pair and the trading channel trend lines.
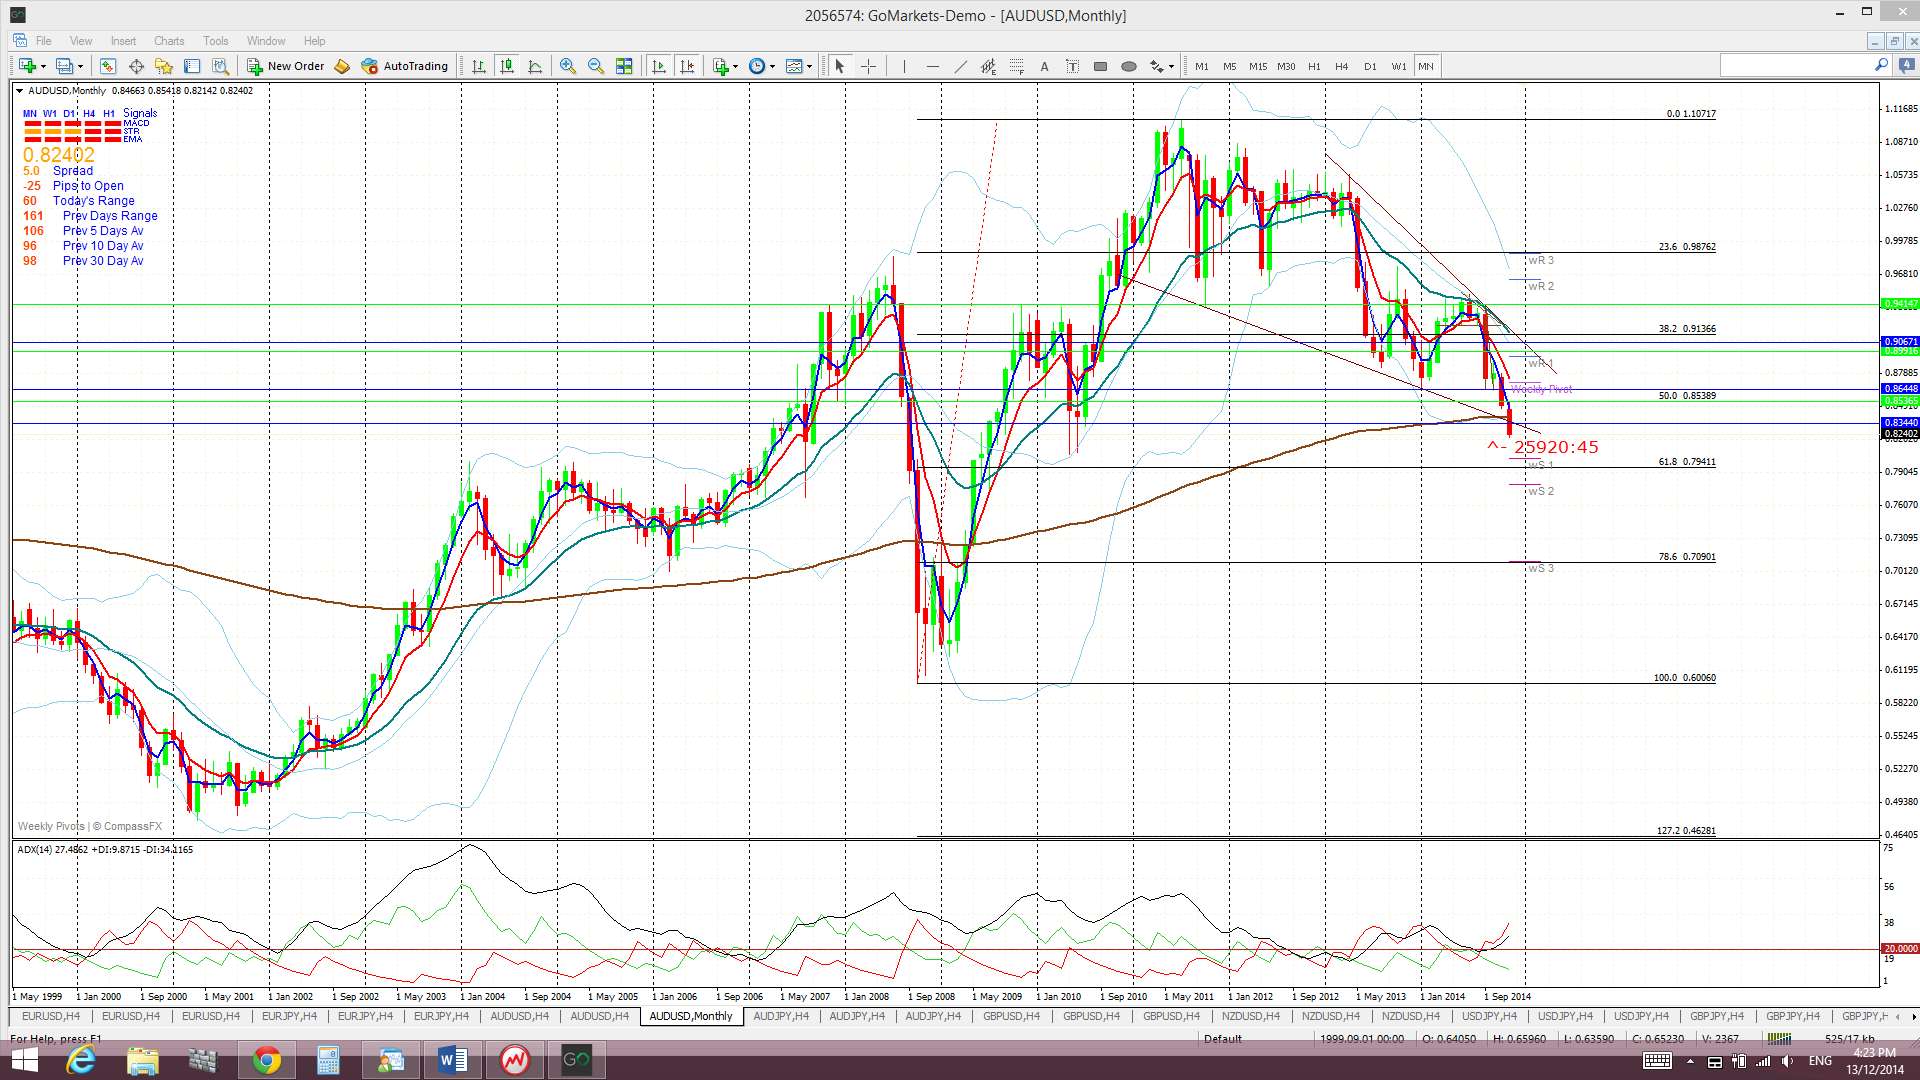
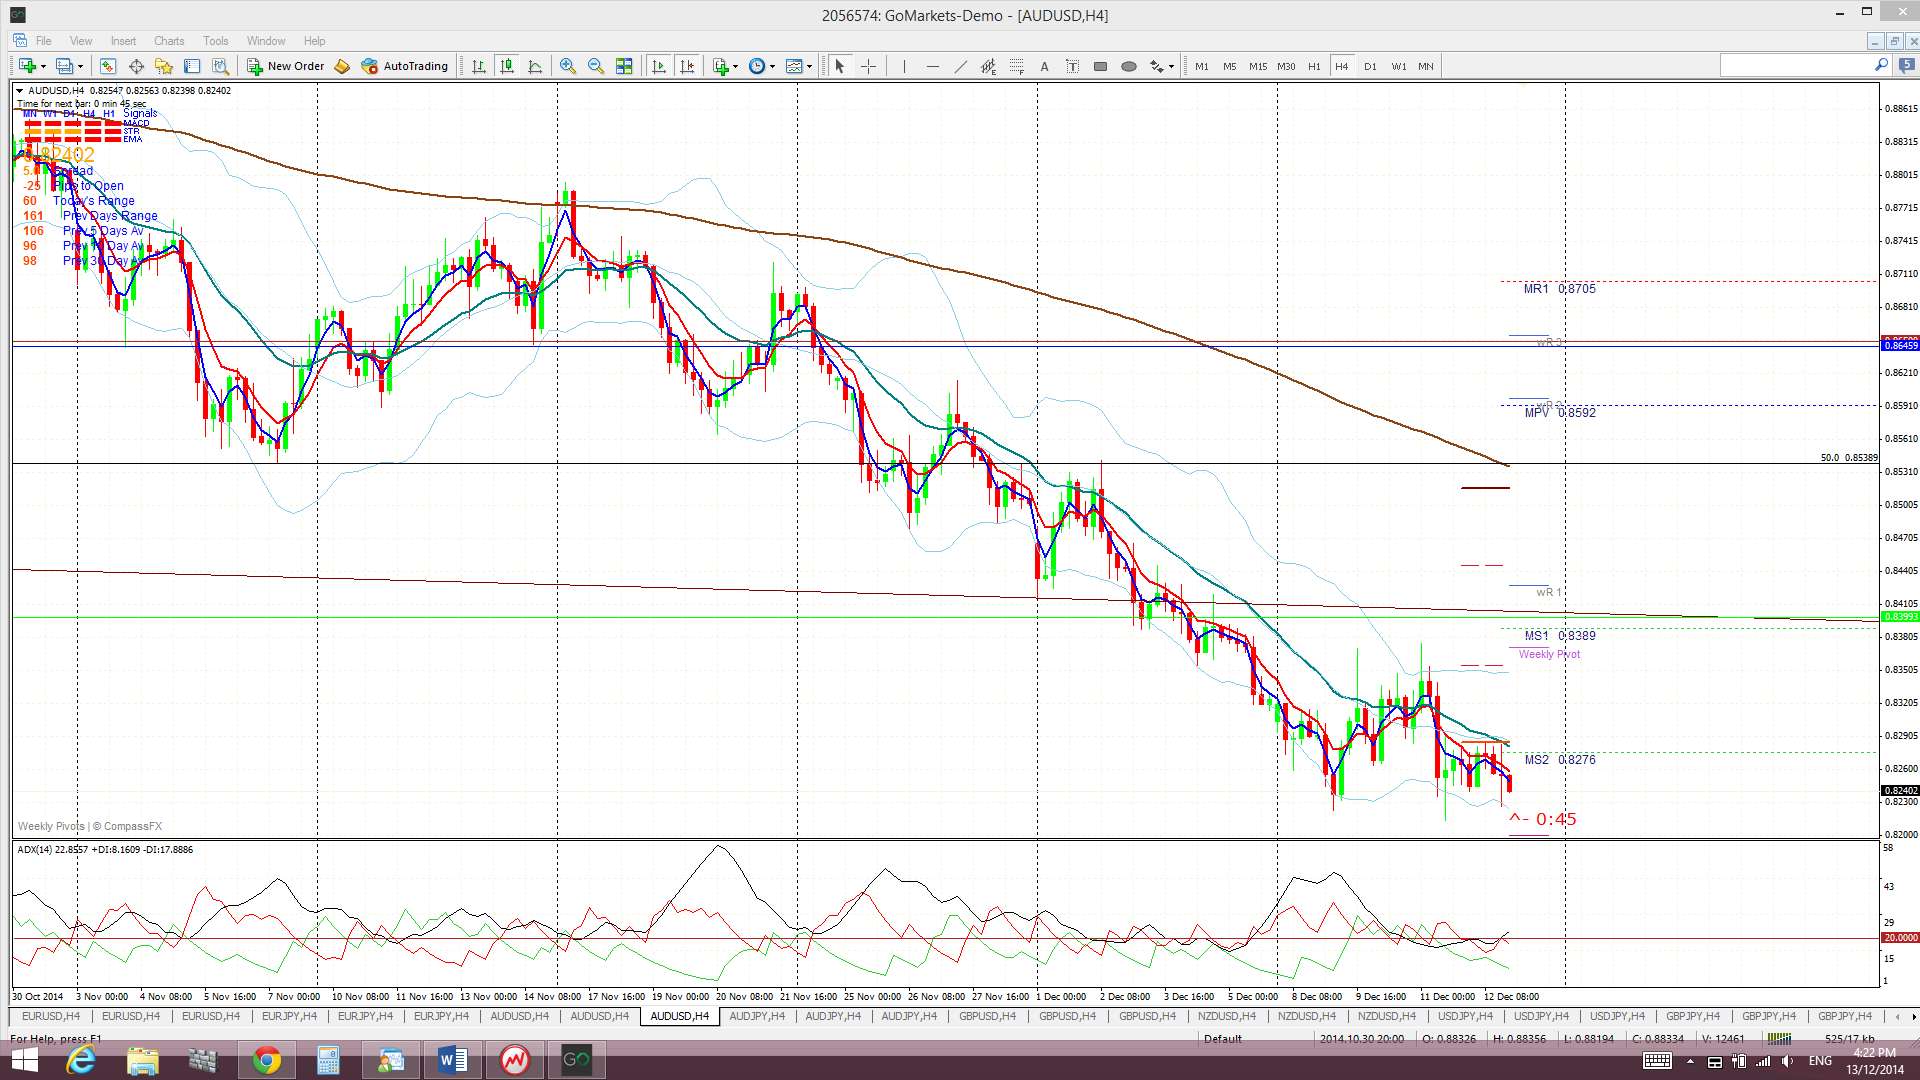
A/U: The A/U chopped around either side of the 0.83 level last week but ended the week below this support. It continues to trade below the support of the 50% fib of the 2008-2011 bull run and the bottom of the monthly Ichimoku Cloud as well:
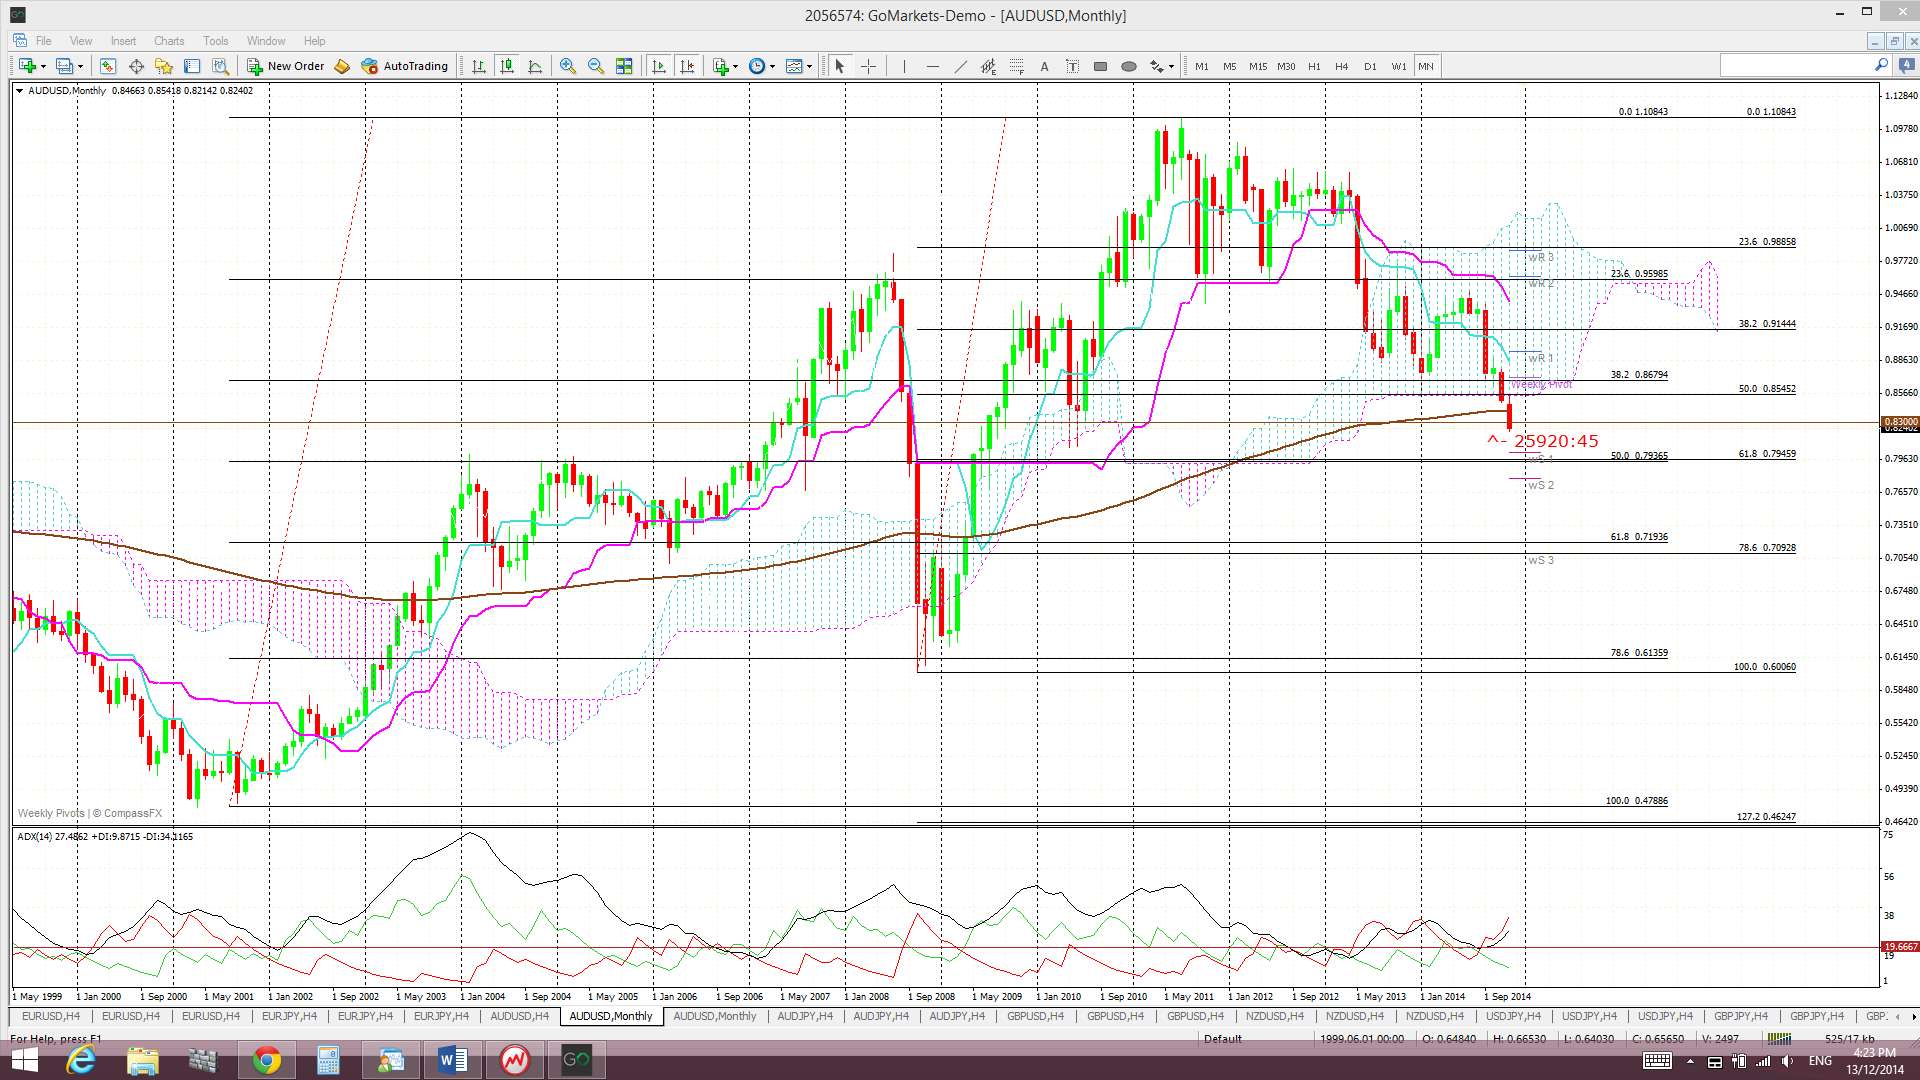
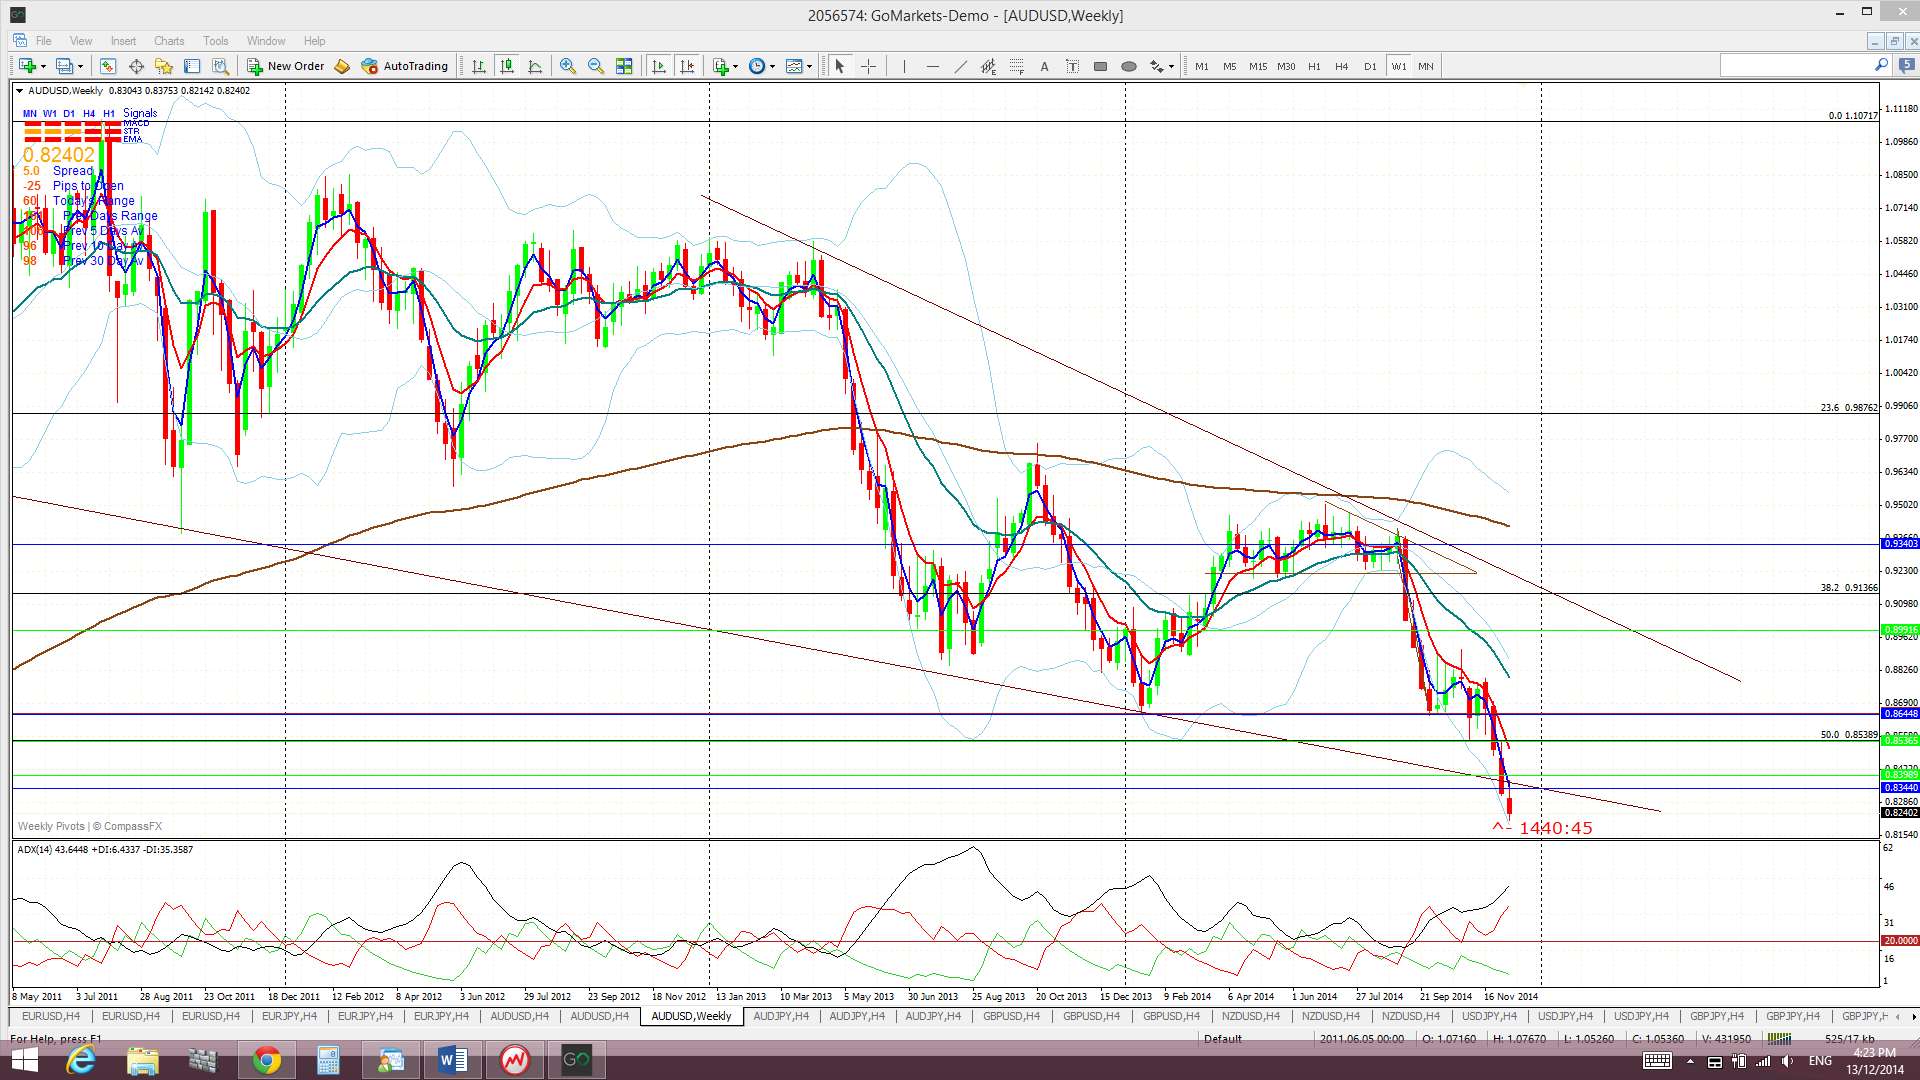
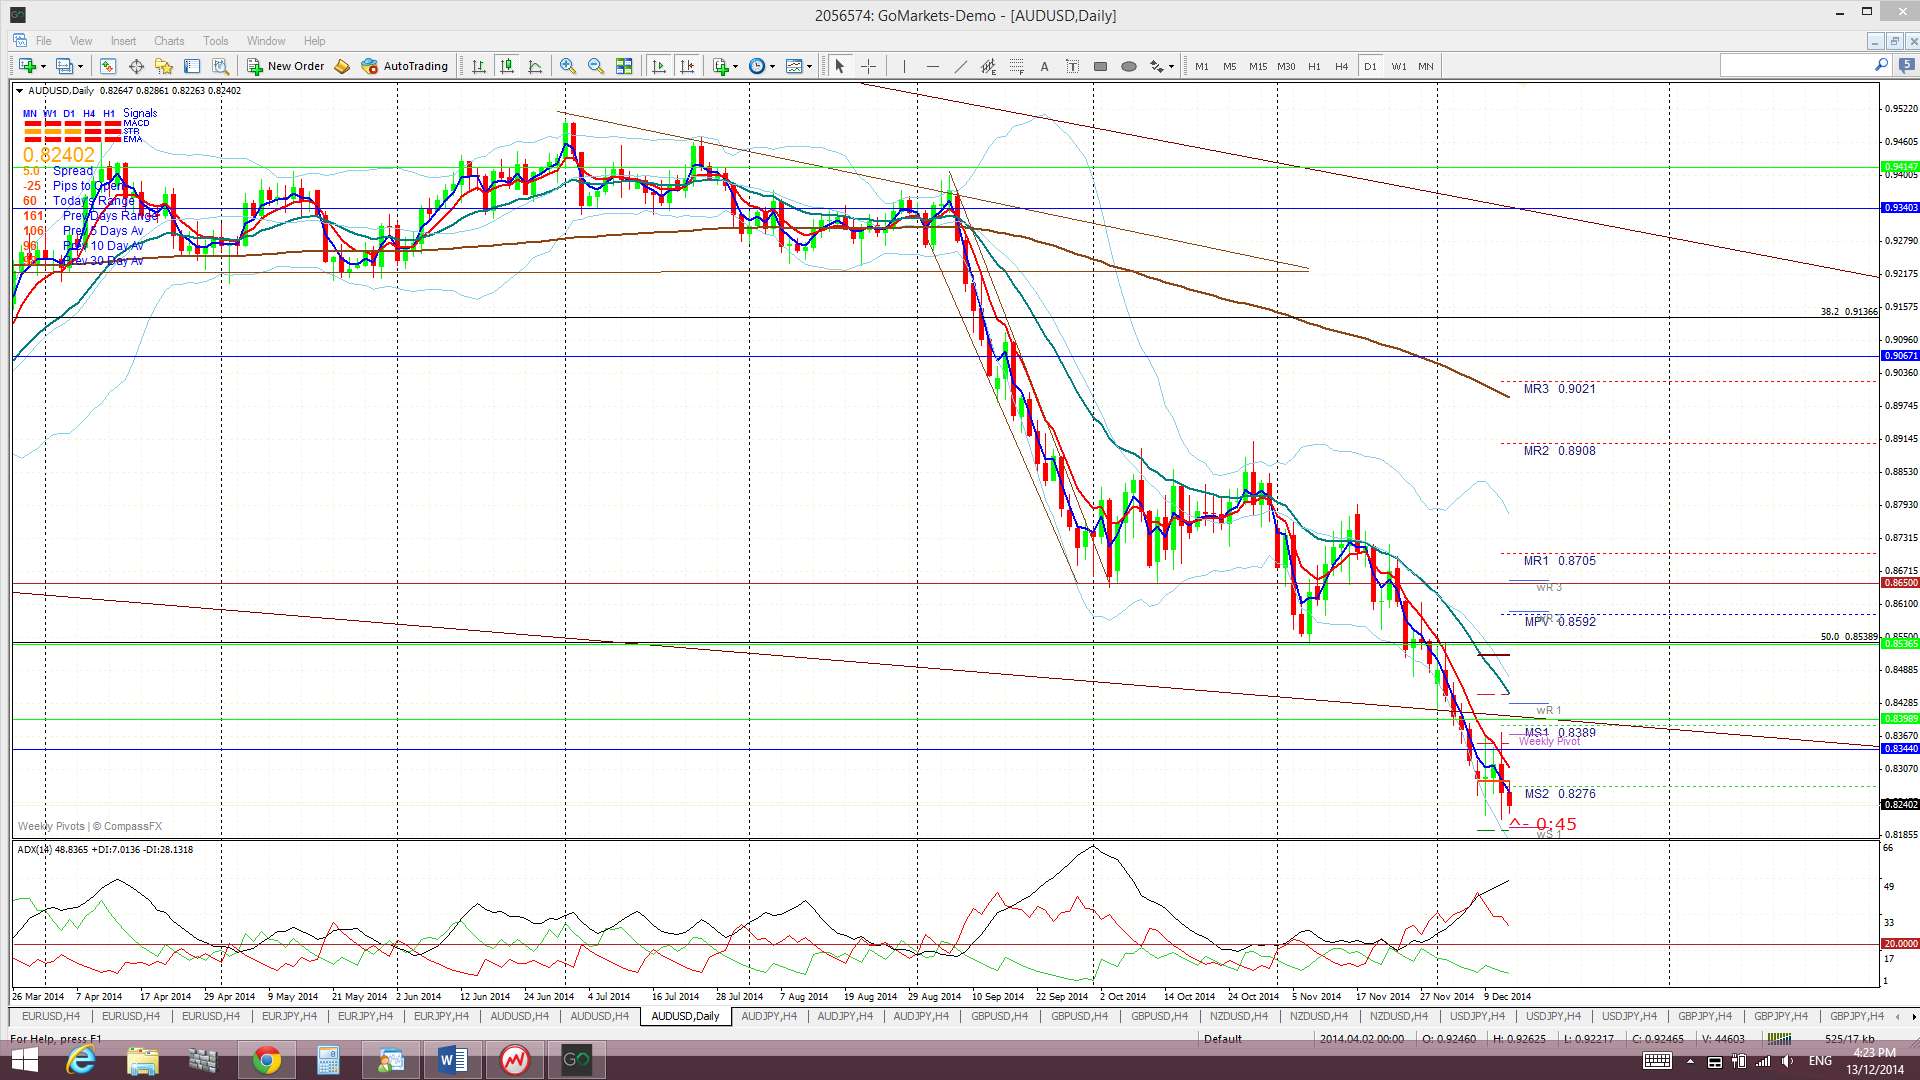
Bear Flag? The Bear Flag is looking very messy but the 0.865, monthly 50% fib and bottom of the monthly Cloud remains as key support levels to watch. The break and hold below these three support levels would suggest the Bear Flag move might be back in contention. The ‘Flag Pole’ for any A/U Bear Flag has a height of about 630 pips. Thus, the expected move for any bearish breakdown is expected to be of about 630 pips as well. This projects a bearish target down near the 0.80 level. This is significant as this is also the 61.8% pull back for the 2008-2011 bull run.
Price is trading below the Cloud on the 4hr, daily, weekly charts and monthly charts.
The weekly candle closed as a bearish candle.
I’m expecting bearish sentiment to continue here with this pair this week especially given the anticipated dire MYEFO report due on Monday. That is unless USD weakness steps up to rescue the poor A/U. I could write an essay here on my thoughts about issues facing Australia at the moment but it would most likely put you all to sleep!
- I’m watching for any new TC signal on this pair.
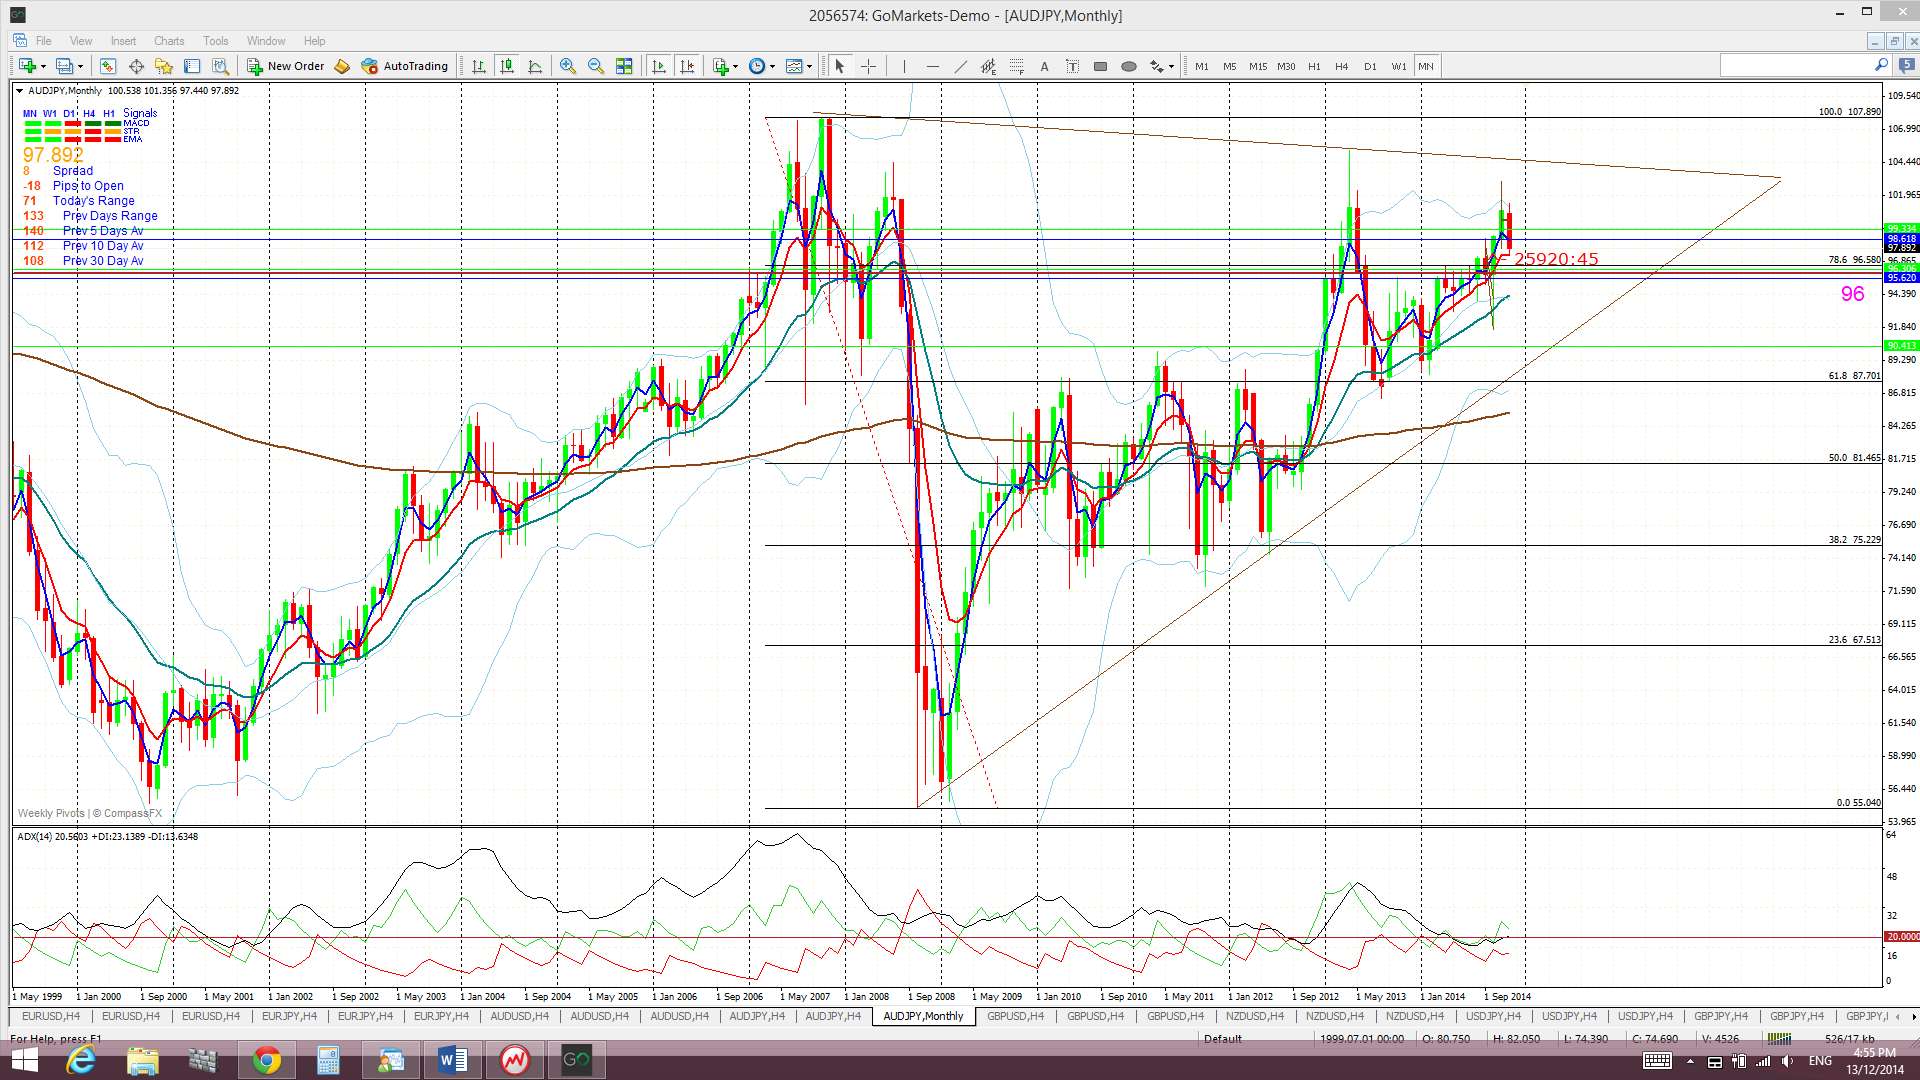
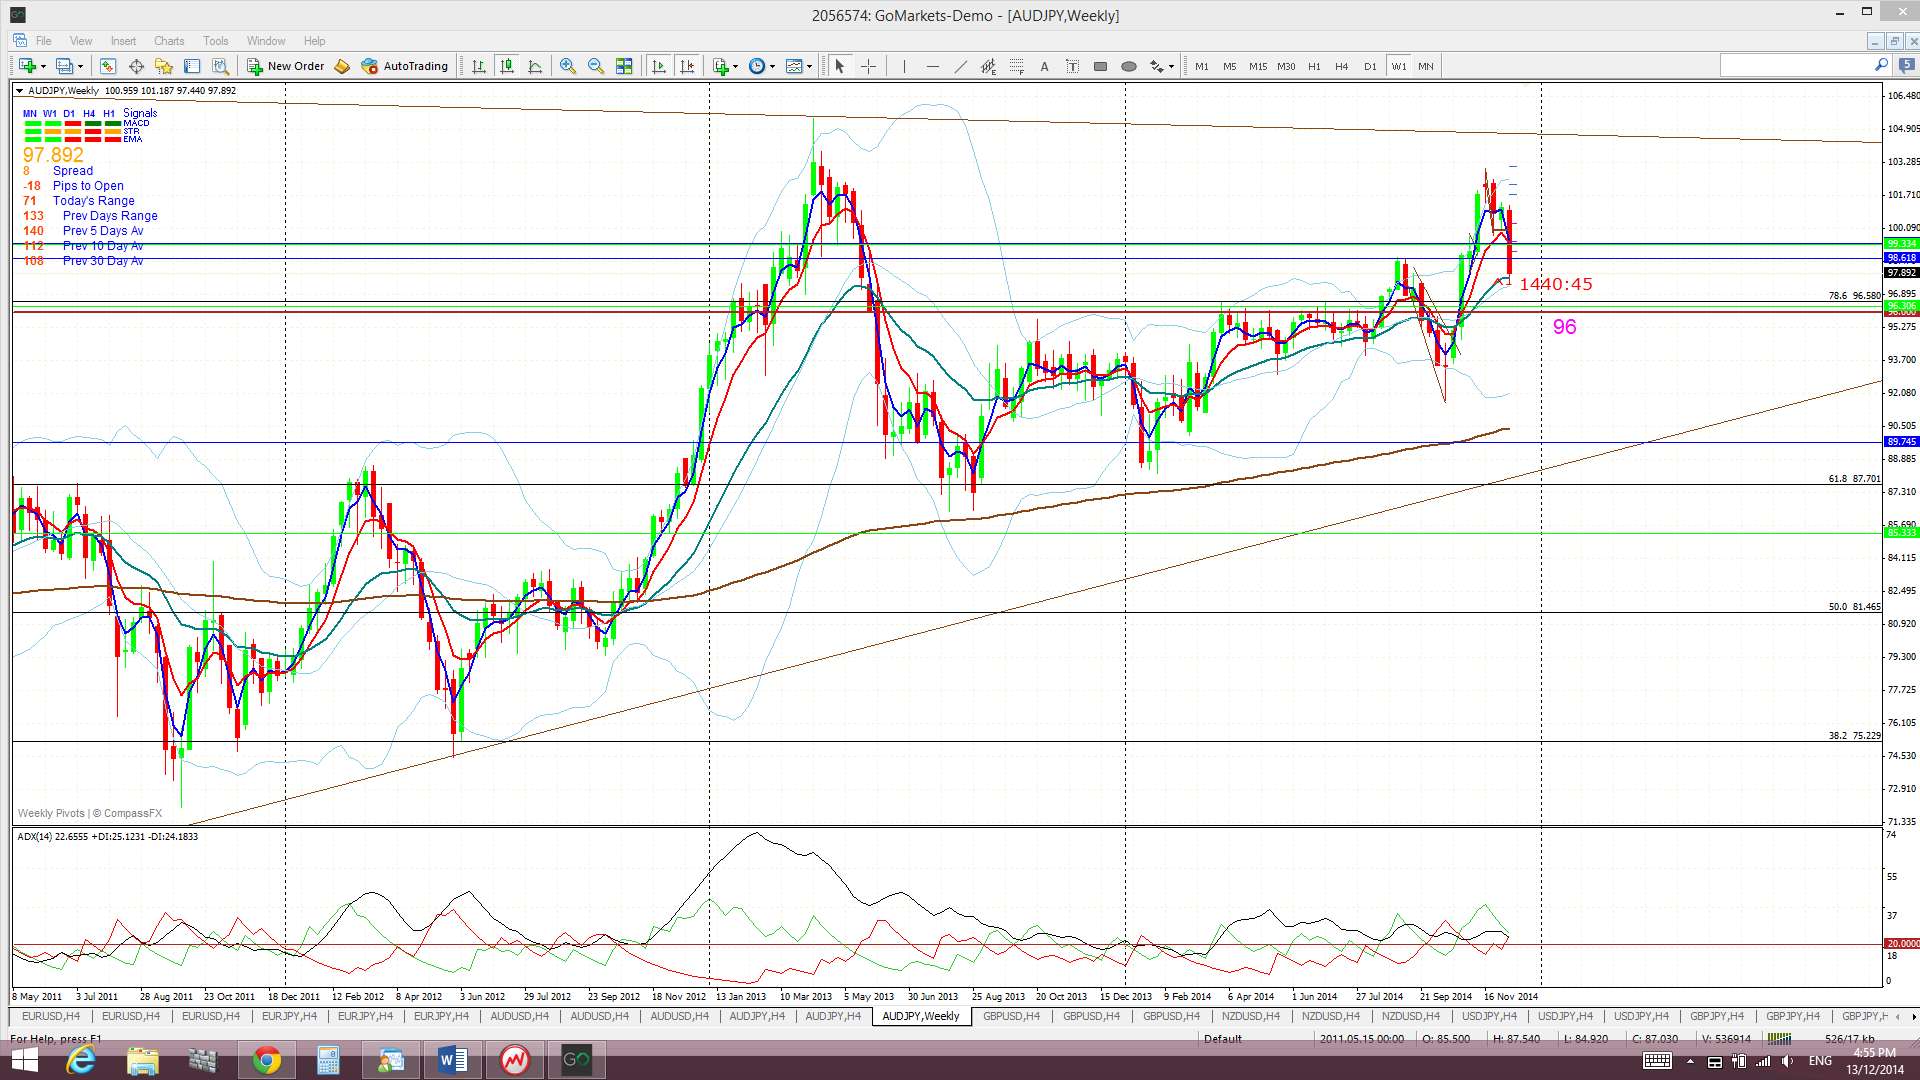
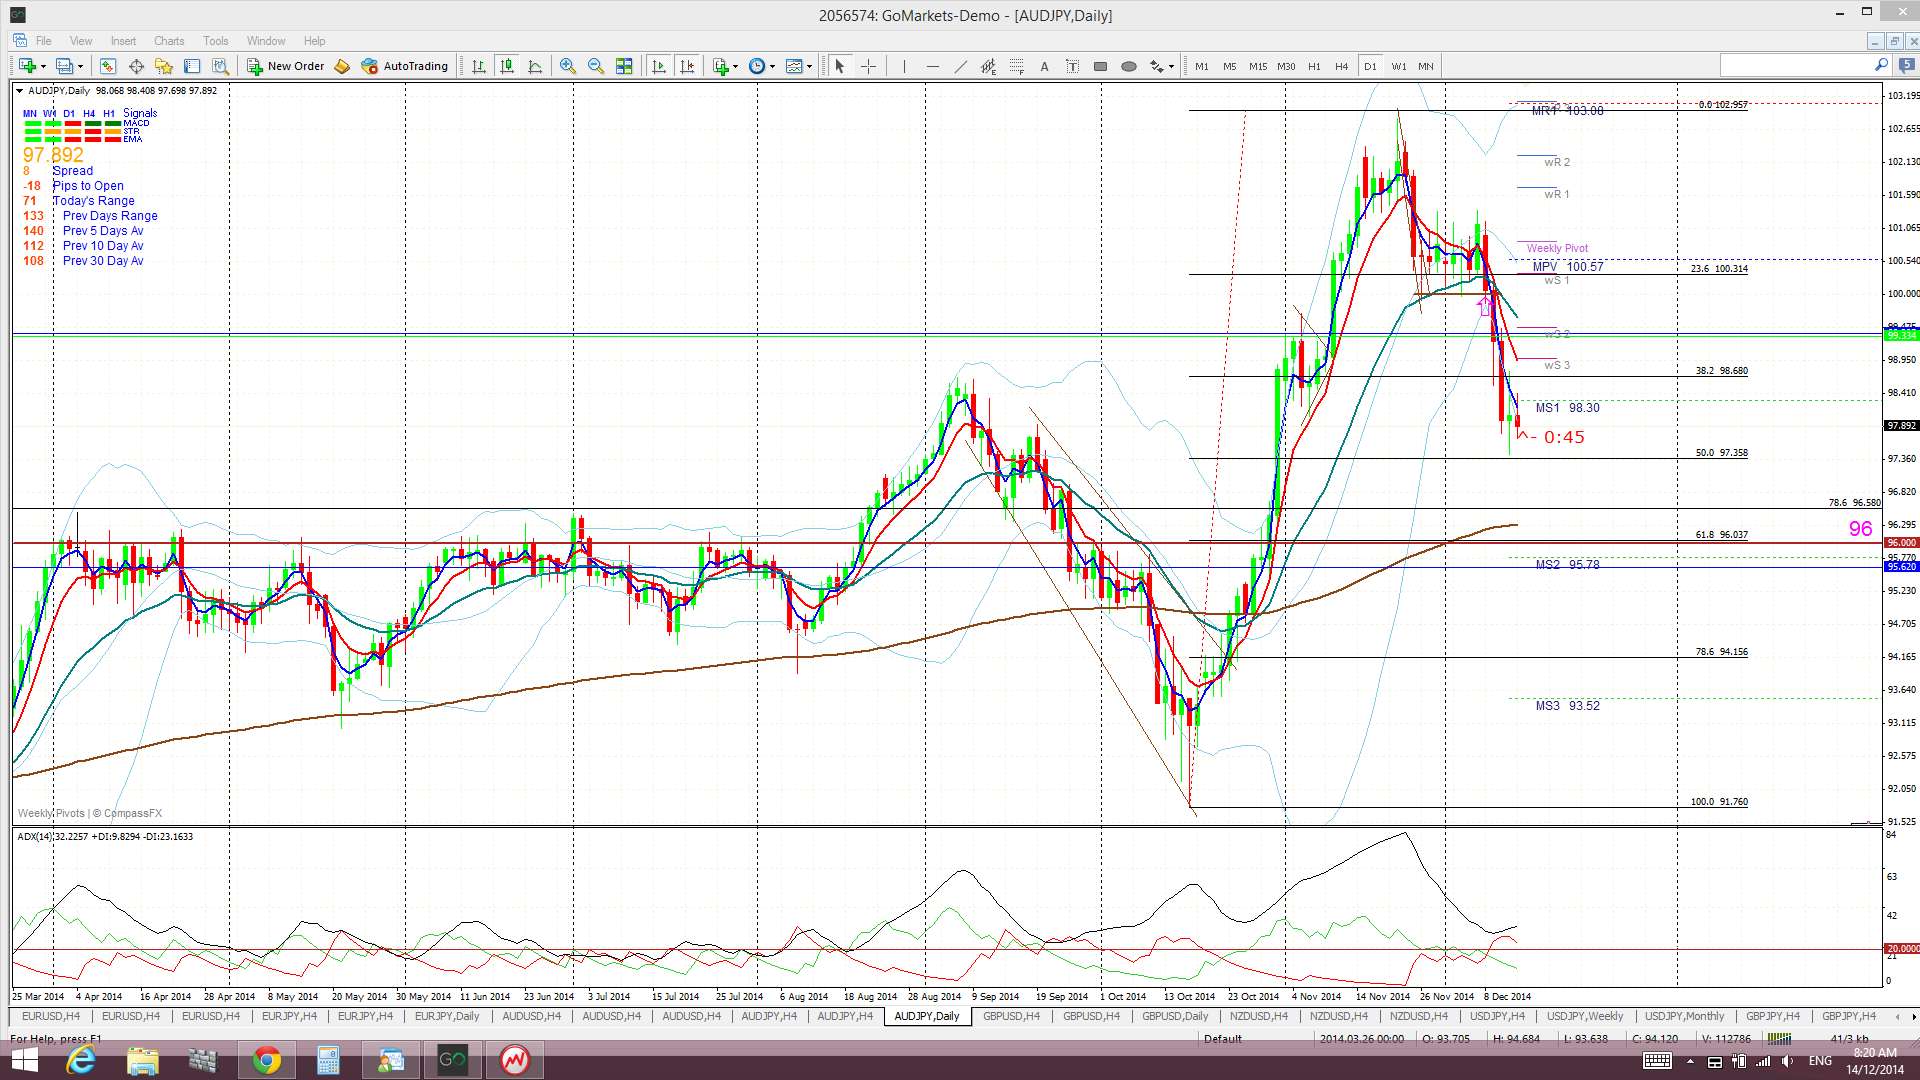
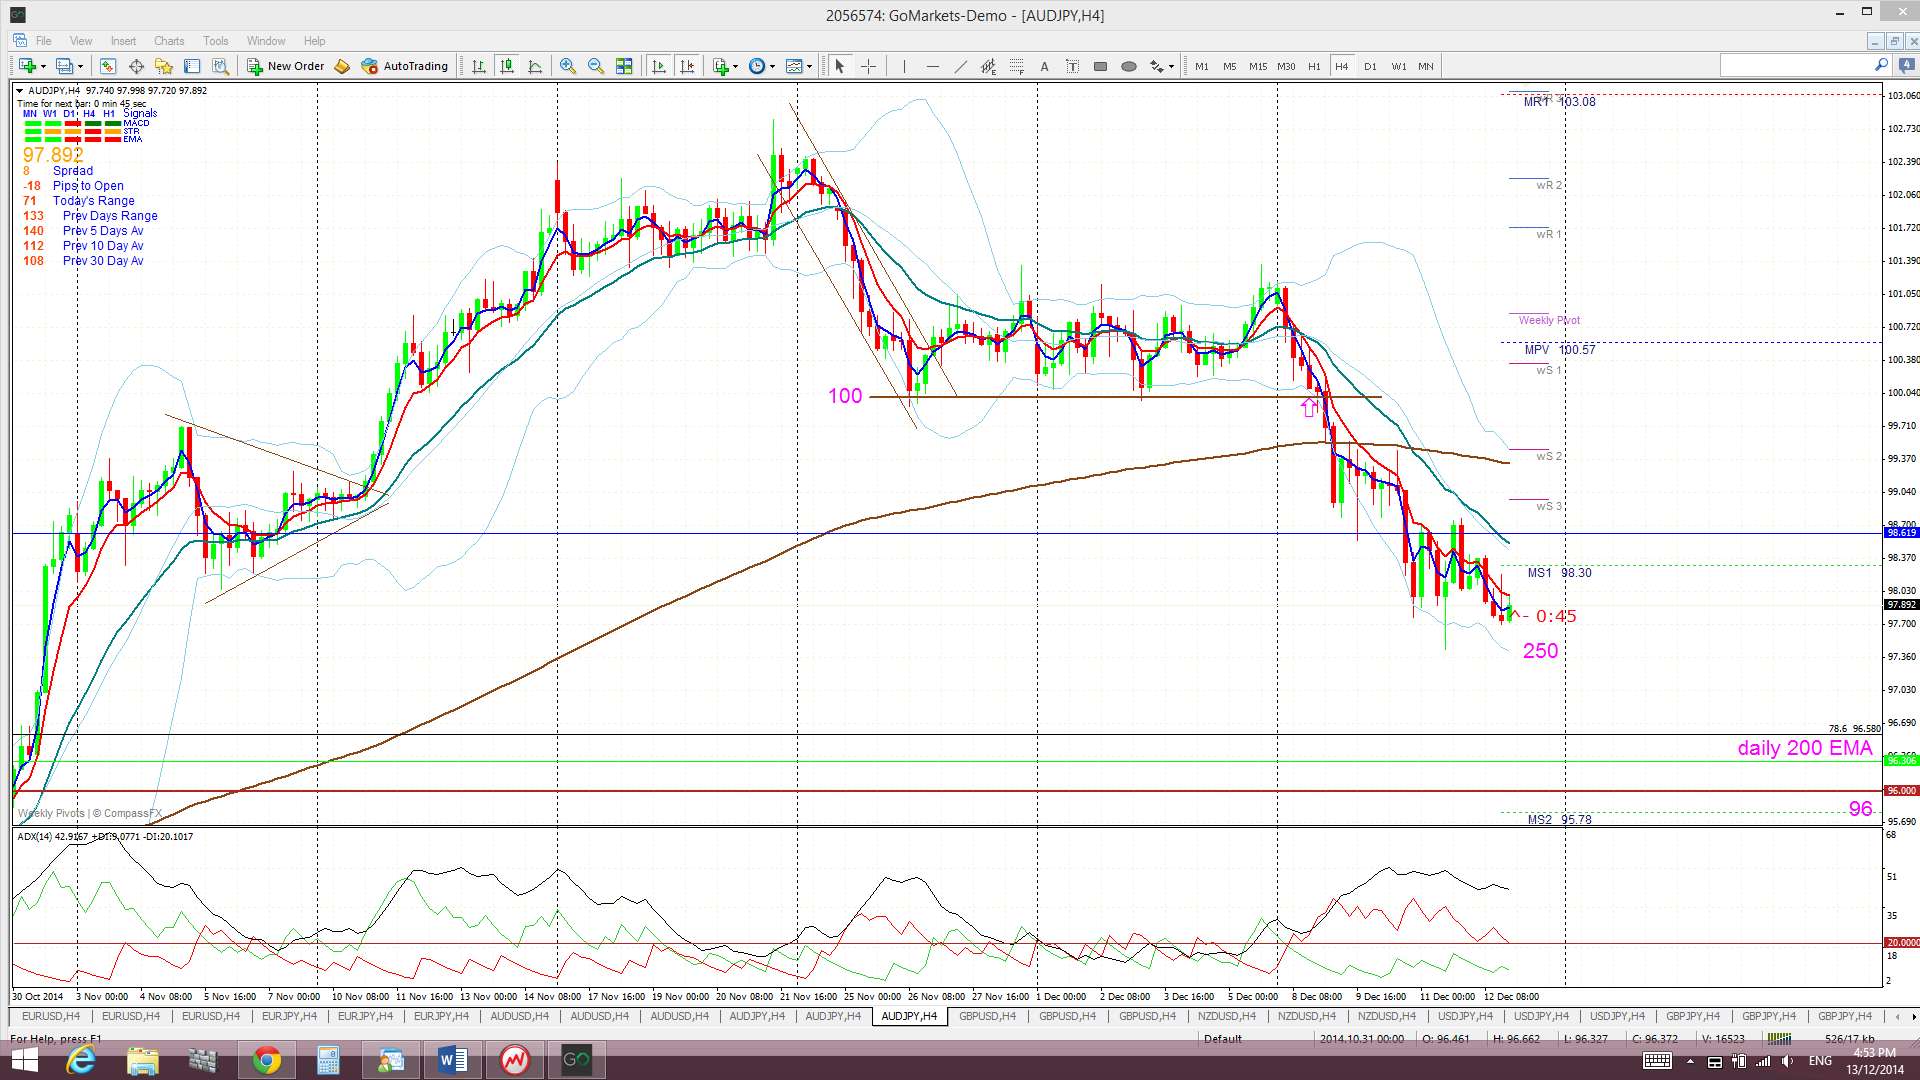
A/J: The A/J chopped lower last week and triggered a new TC signal that has delivered up to 250 pips.
As mentioned over recent weeks, this pair is at an interesting level. It is now back down about 700 pips below a major monthly triangle trend line and I’m still seeing the 96 level as a possible pull back target. This is a previous S/R level (see weekly chart) and near the 61.8% fib of the recent bull run (see daily chart).
Price is trading below the Cloud on the 4hr chart but above on the daily, weekly and monthly charts.
The weekly candle closed as a large bearish candle.
- There is an open TC signal on this pair and I am expecting this to target the 96 level.
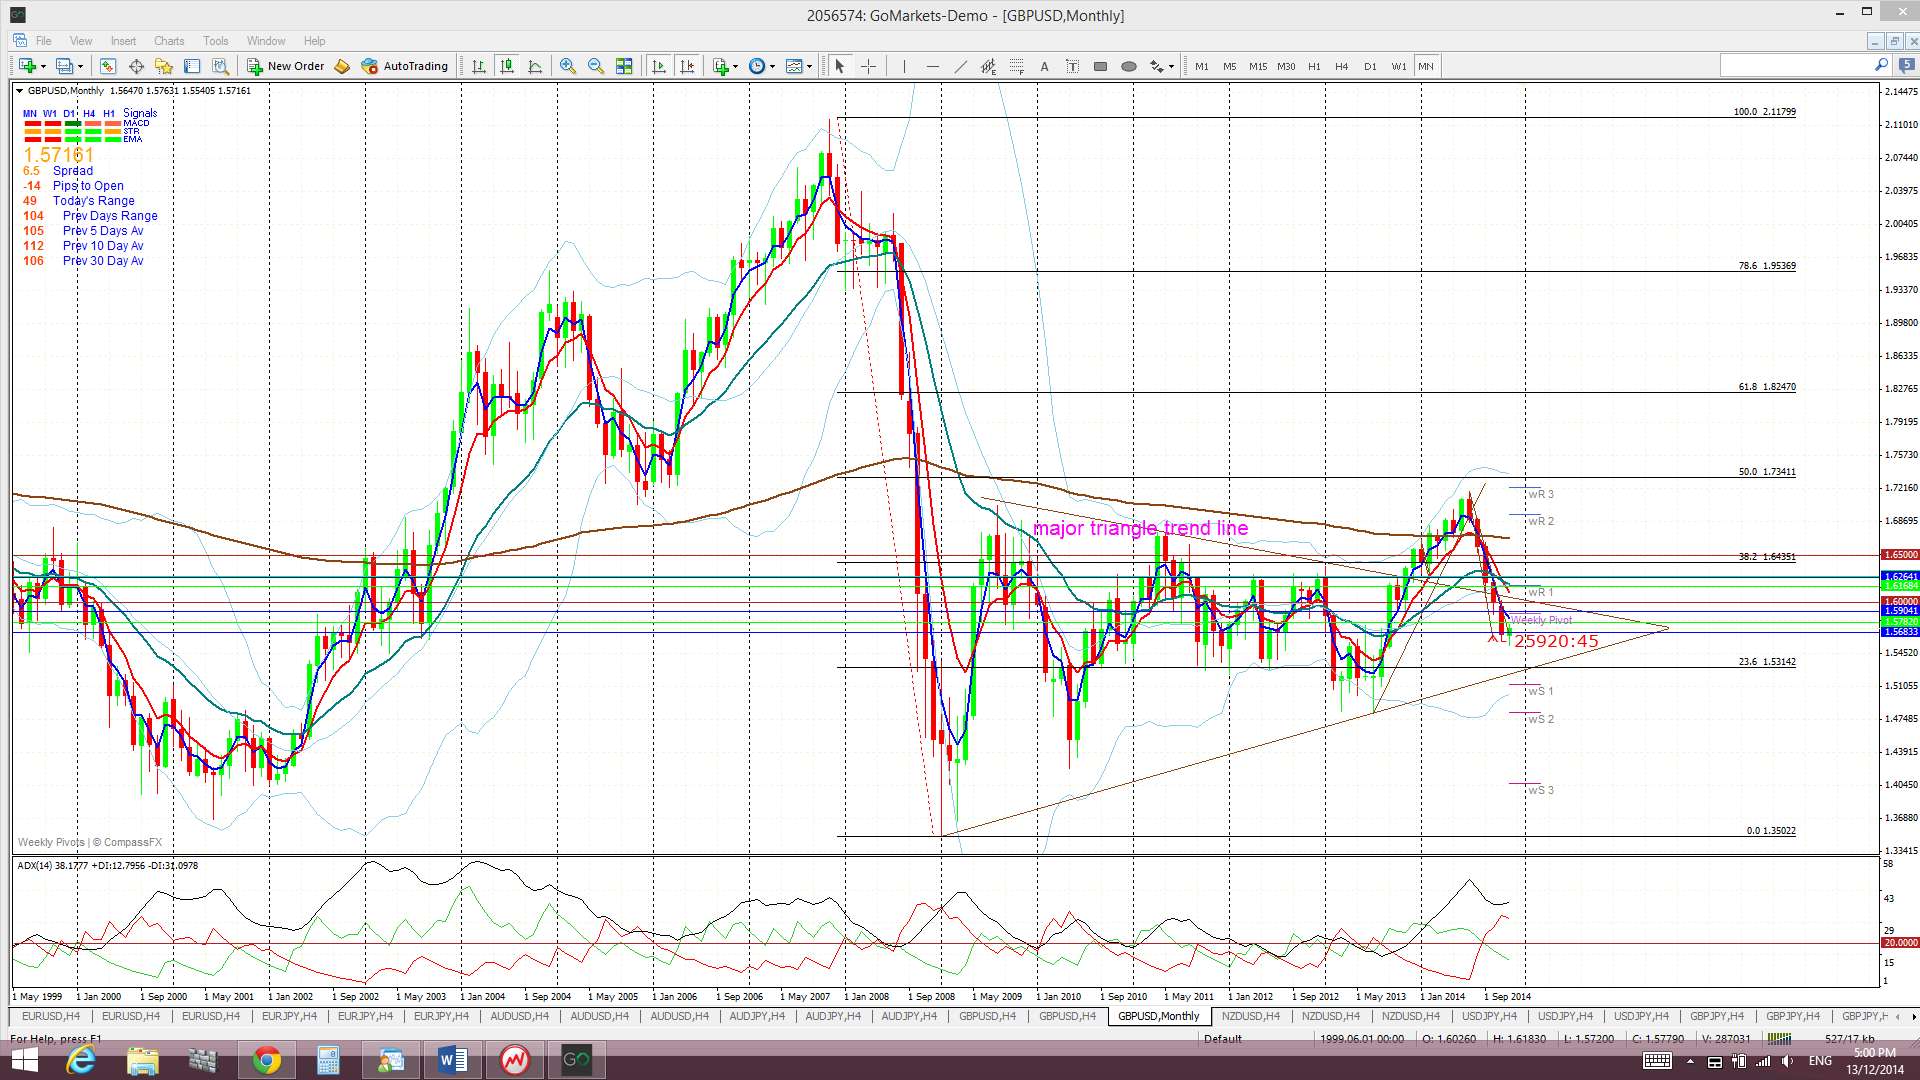
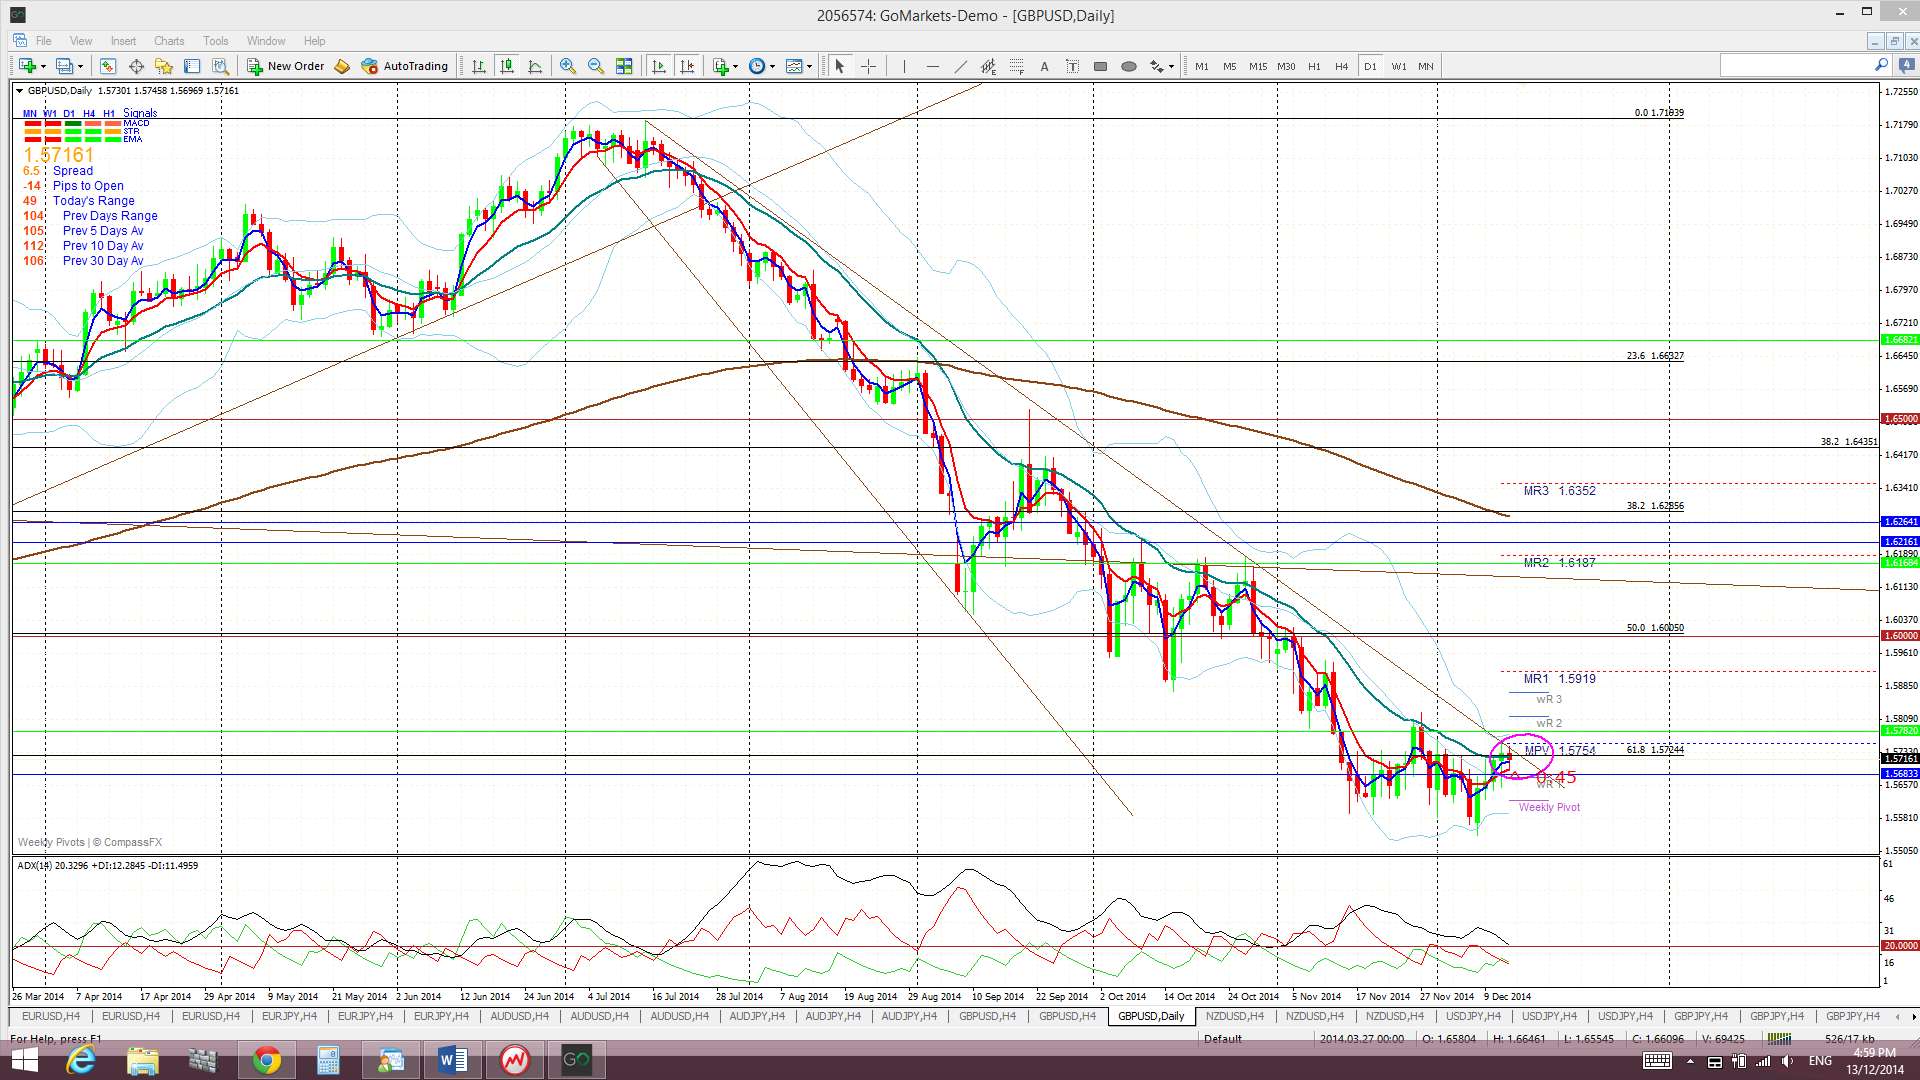
G/U: The Cable chopped higher last week on the back of USD weakness and moved back up to near the 61.8% fib level of the 2013-2014 bull run. This bullish action has brought it back near the bear trend line of the descending wedge pattern. This intersection will be worth watching next week as there will most likely be some price reaction at this key junction given all of the scheduled high impact GBP and USD news.
Price is now trading above the Cloud on the 4hr but below on the daily, weekly and monthly charts.
The weekly candle closed as a large bullish engulfing candle.
- I’m watching for any new TC signal on this pair and the intersection of the descending wedge trend line and the 61.8% fib.


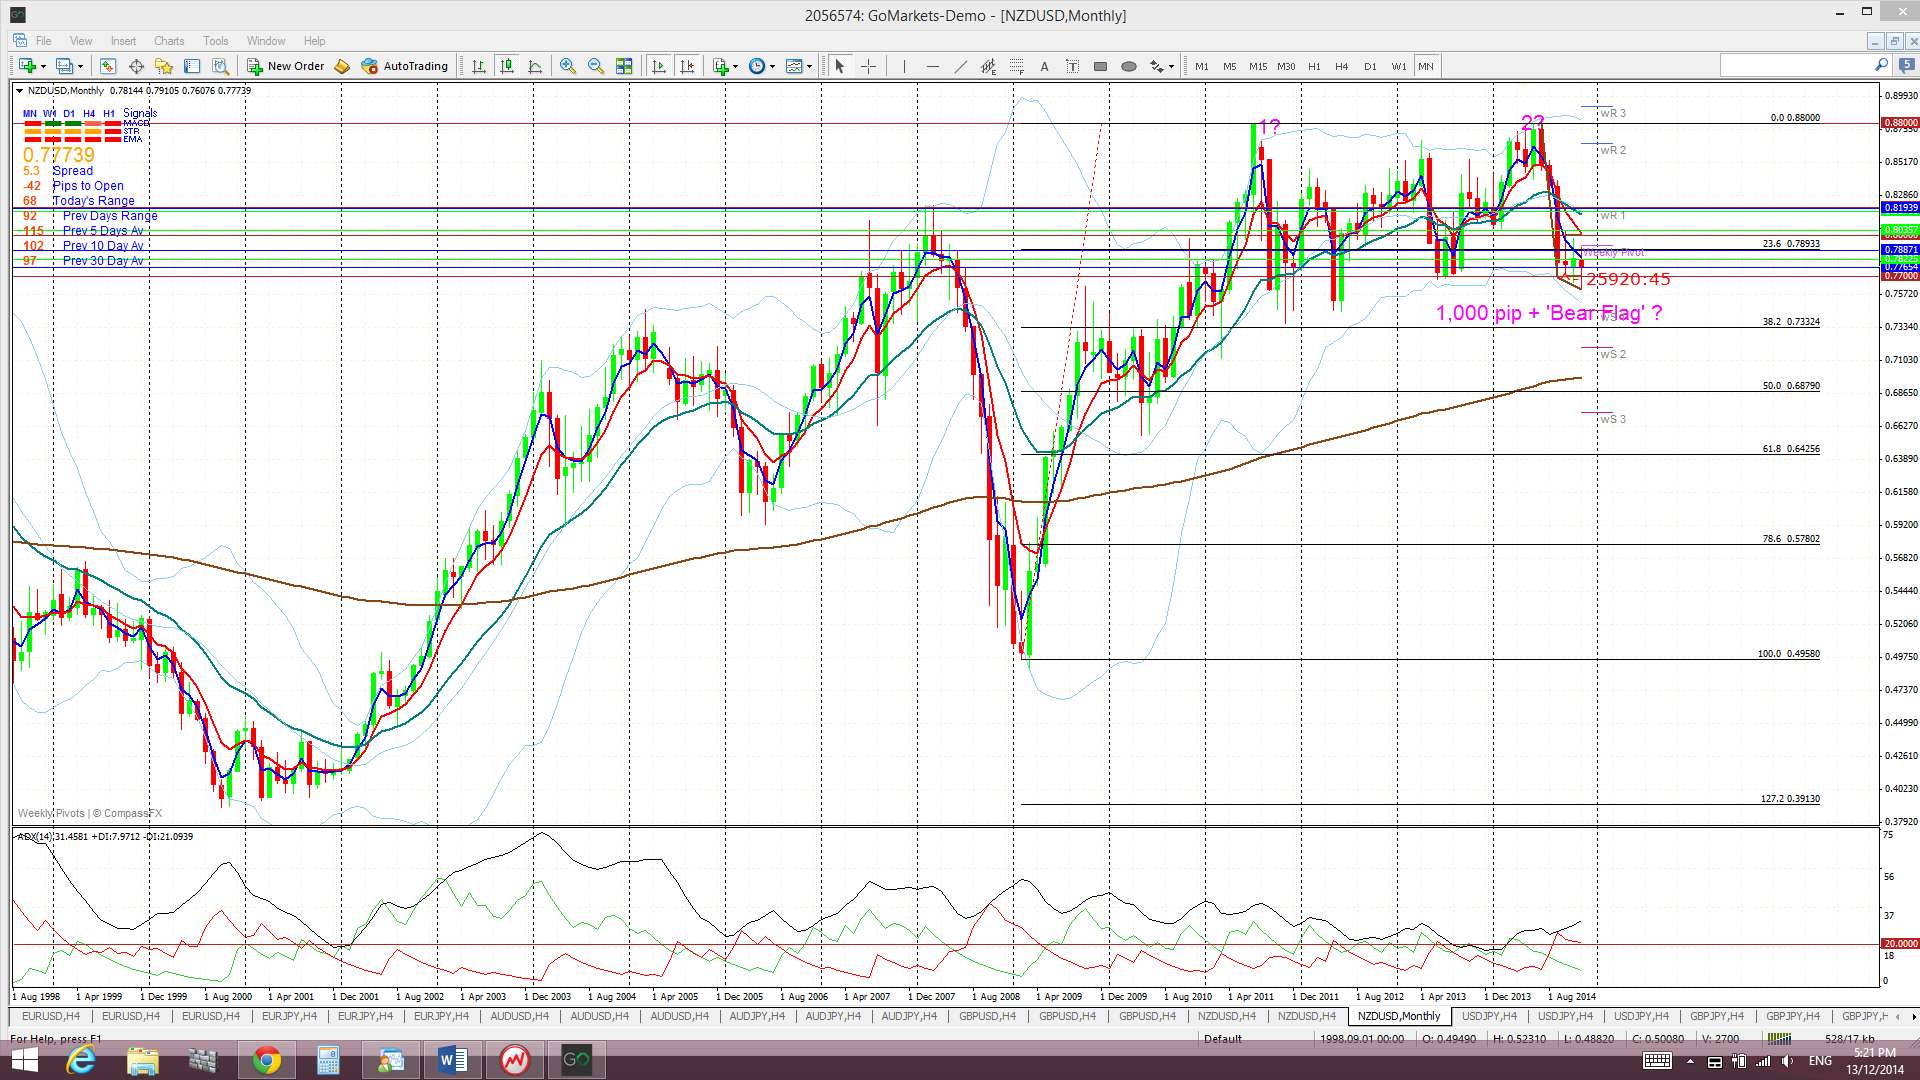
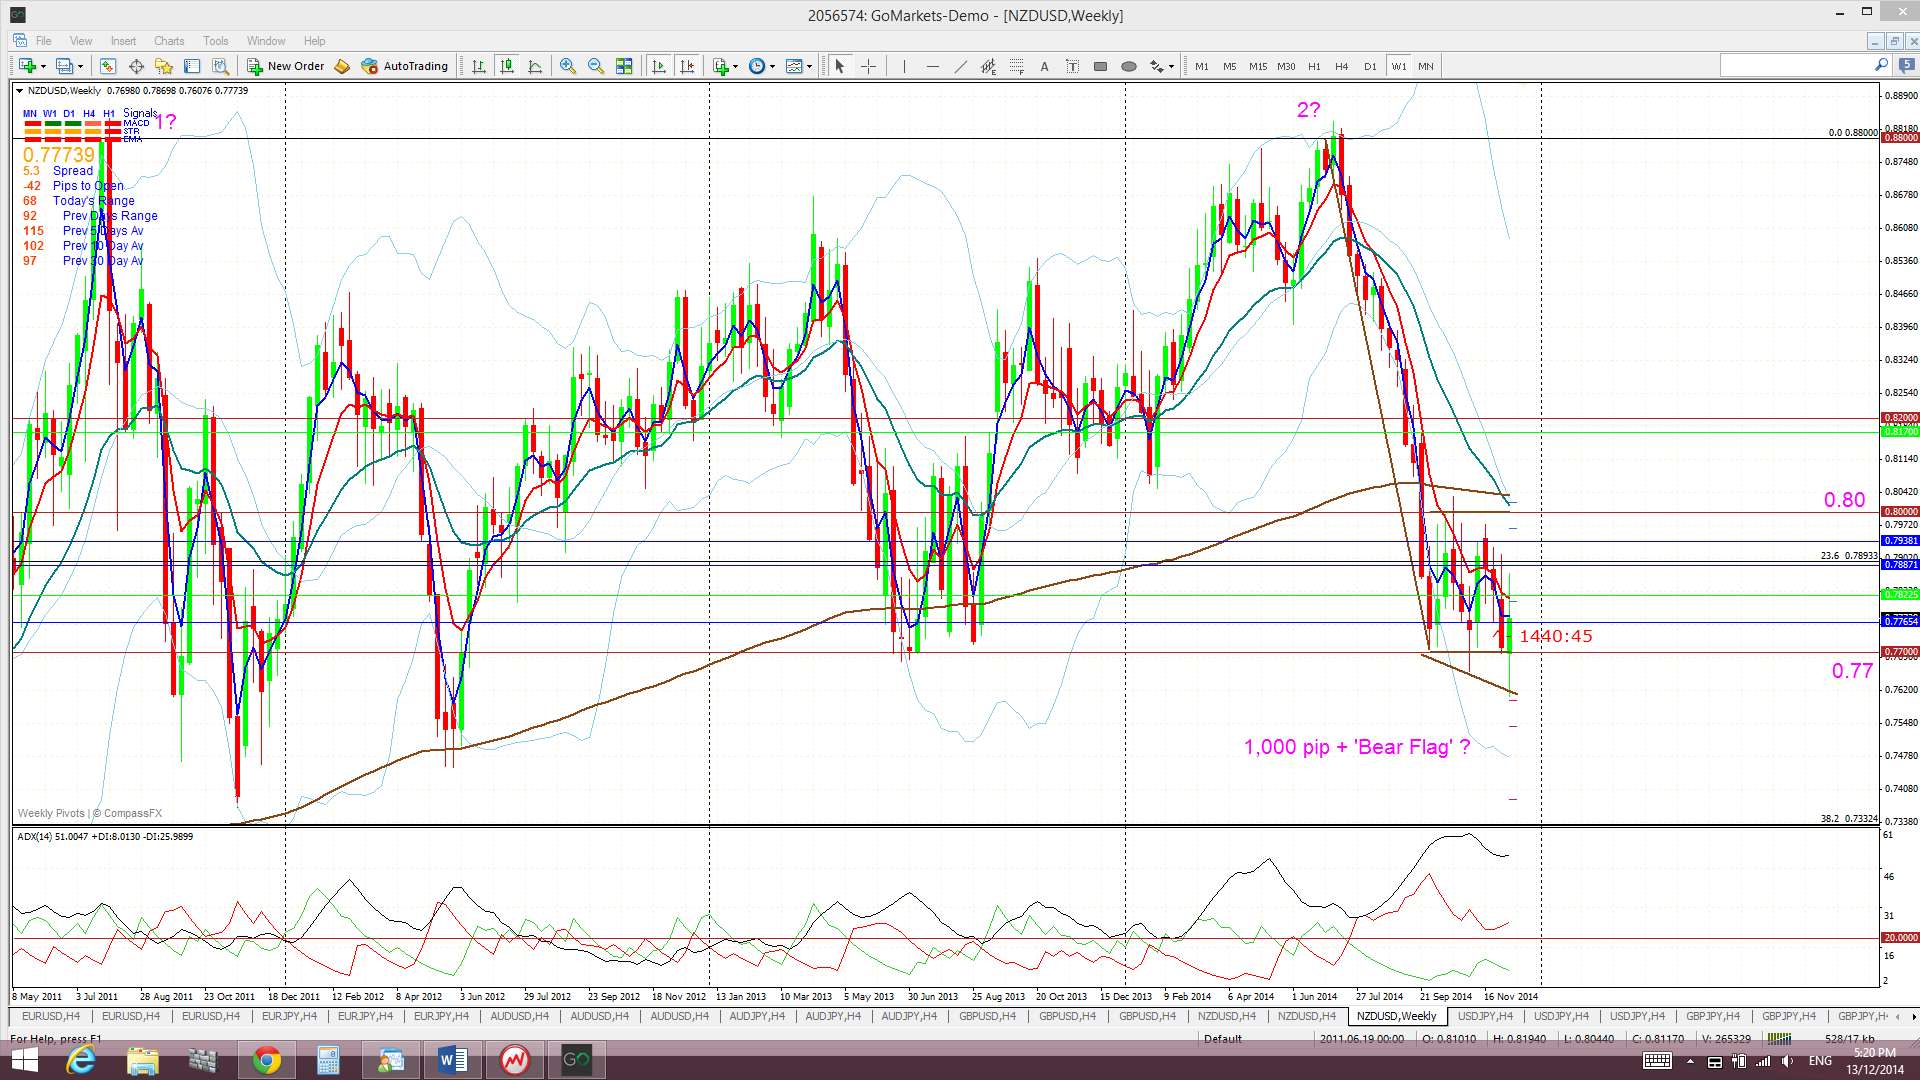
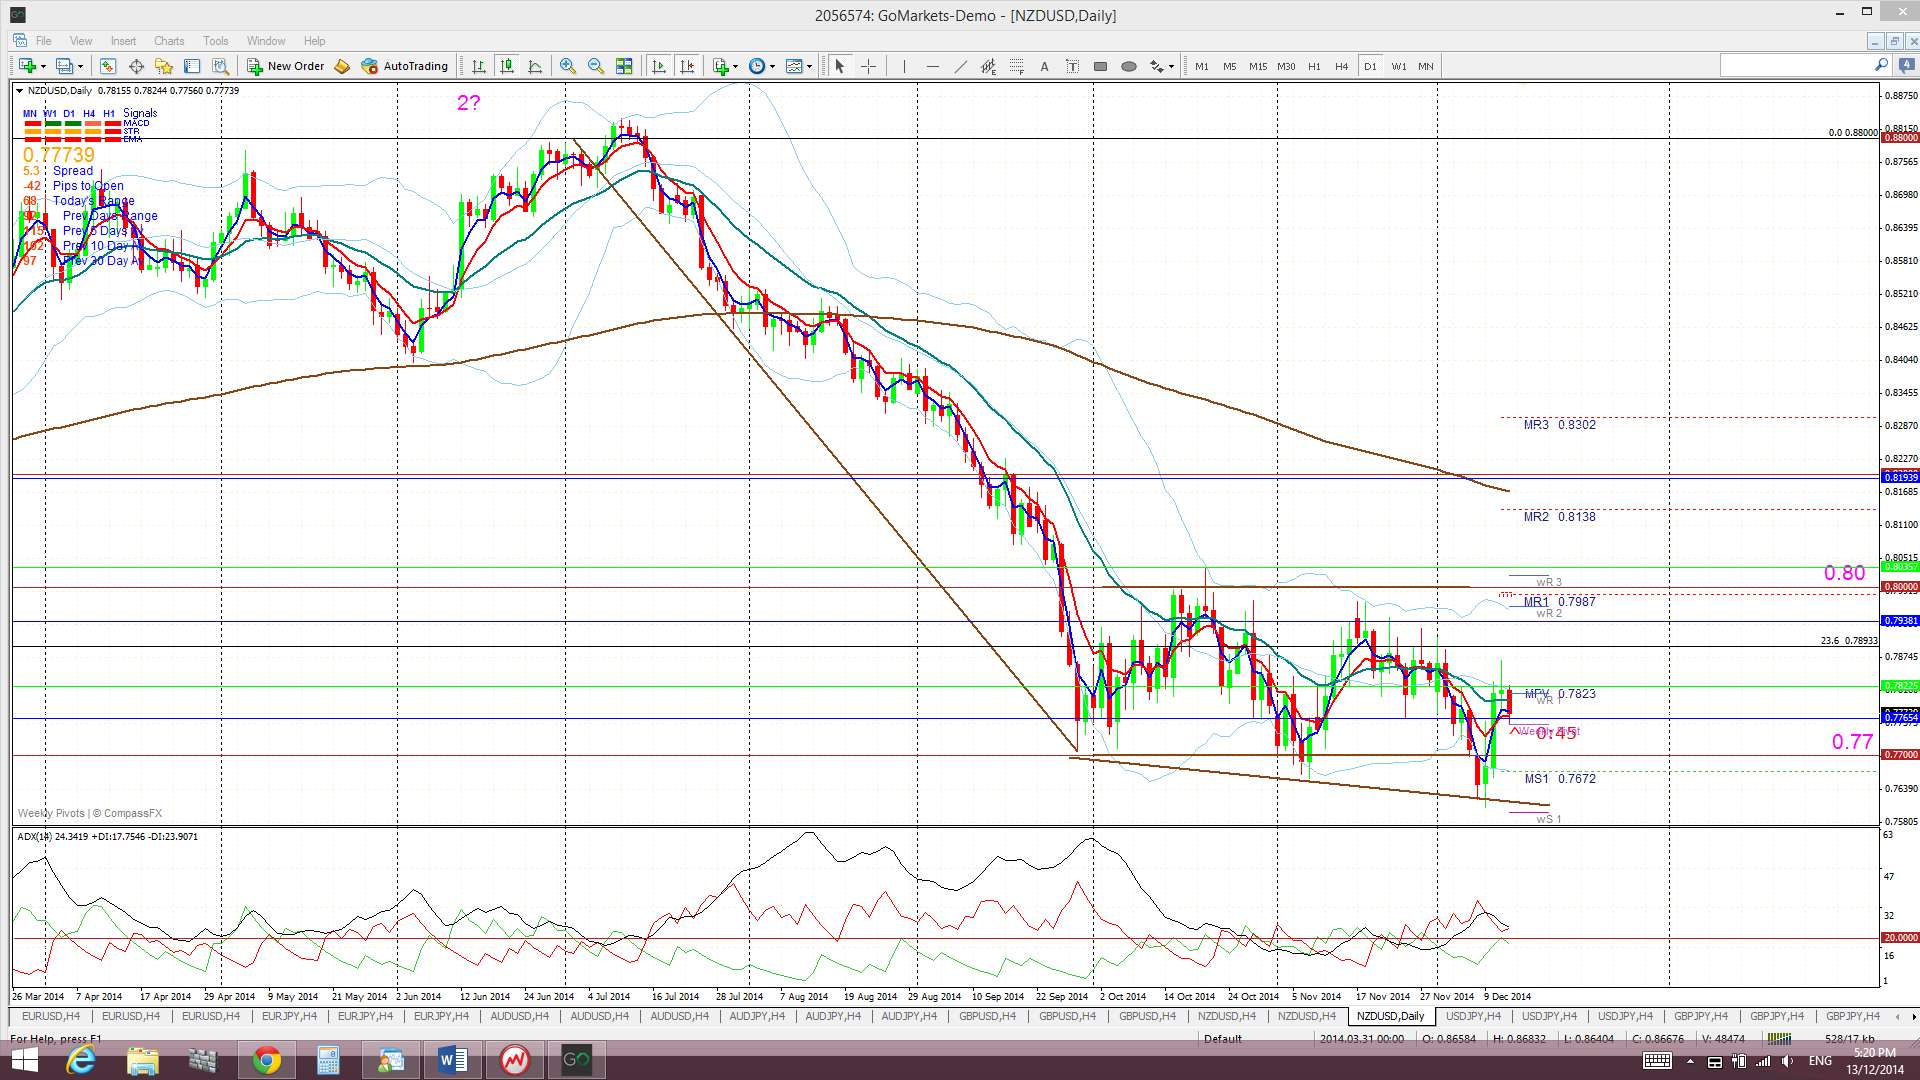
Kiwi: NZD/USD: The Kiwi rallied last week following less dovish than usual RBNZ comments and it finished above the 0.77 level. I had noted earlier in the week how this pair has failed to print a weekly close below 0.77 for over two years and this remains the case today.
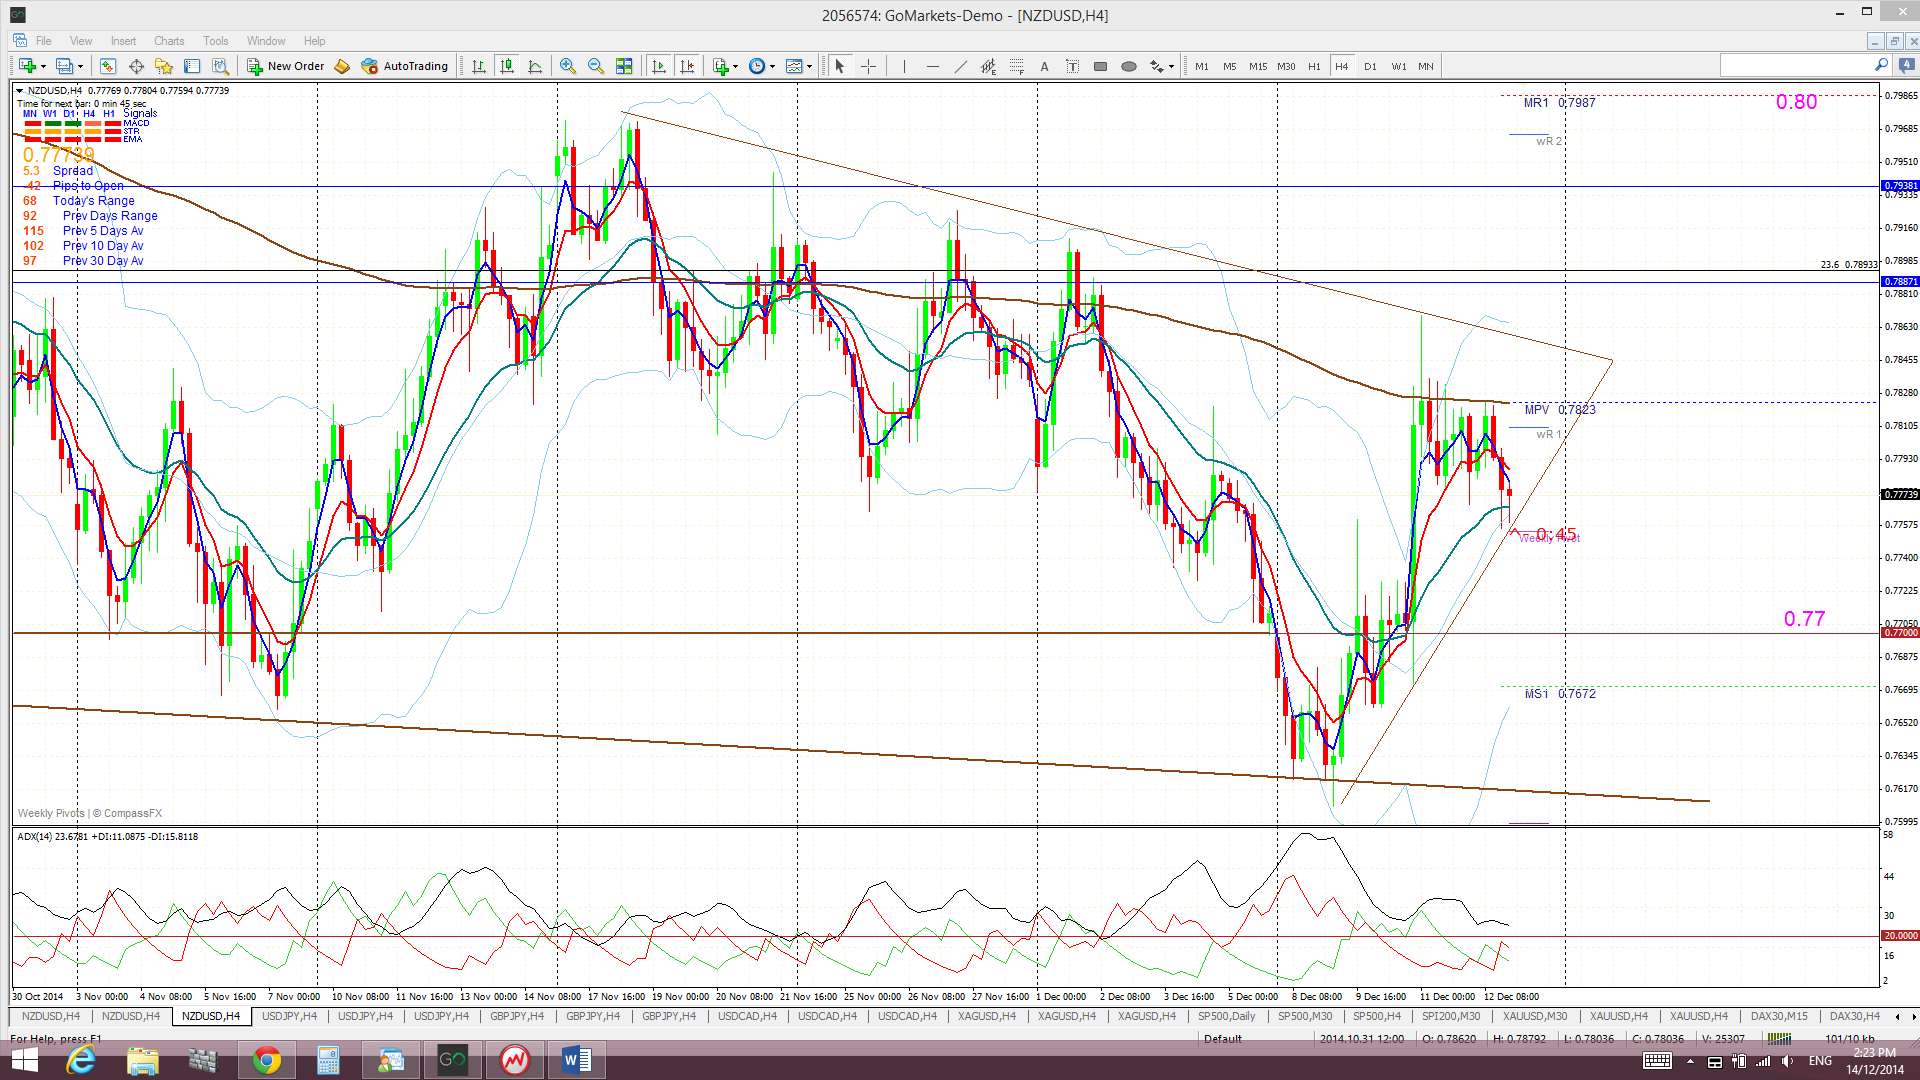
The Kiwi has failed to move back above 0.80 and remains choppy between these two S/R levels of 0.80 and 0.77. Price action has formed up within a triangle, of sorts, on the 4hr chart. As per usual, watch for any trend line break with momentum!
Bear Flag for Kiwi: The 0.77 remains the key level to watch here as any break and hold below this level would trigger the start of a possible ‘Bear Flag’ move. The ‘Flag Pole’ for the Kiwi’s ‘Bear Flag’ is about 1,100 pips. Thus, any bearish breakdown and continuation below the ‘Flag’ trend line may be expected to extend by 1,100 pips as well. This would bring the Kiwi down to near 0.67 cents. This level is between the 61.8 and 78.6% fibs of the 2009-2014 bull run. Given that the 0.77 is strong support I would still prefer to wait to confirm any possible ‘Bear Flag’ move until there is a close and hold below this 0.77 level. The 0.77 remains a significant S/R level for the Kiwi. This level represents the previous swing low for the period during mid-2013 and, prior to then, from mid-2012.
Fib levels shows other possible targets for any bearish continuation below 0.77 as being the:
- 38.6% fib near 73.5.
- 50% fib near 70 and the weekly 200 EMA.
- 68.1% fib near 0.65.
Price is trading on the top edge of the Ichimoku Cloud on the 4hr but below on the daily and weekly charts and in the top edge of the Cloud on the monthly chart.
The weekly candle closed as a bullish candle with long upper and lower shadows.
There is NZD GDP & GDT Price data as well as USD CPI and FOMC this week that will be the main risk events for this pair.
- I’m watching for any new TC signal on this pair, the 4hr chart triangle trend lines and the 0.77 and 0.80 levels.
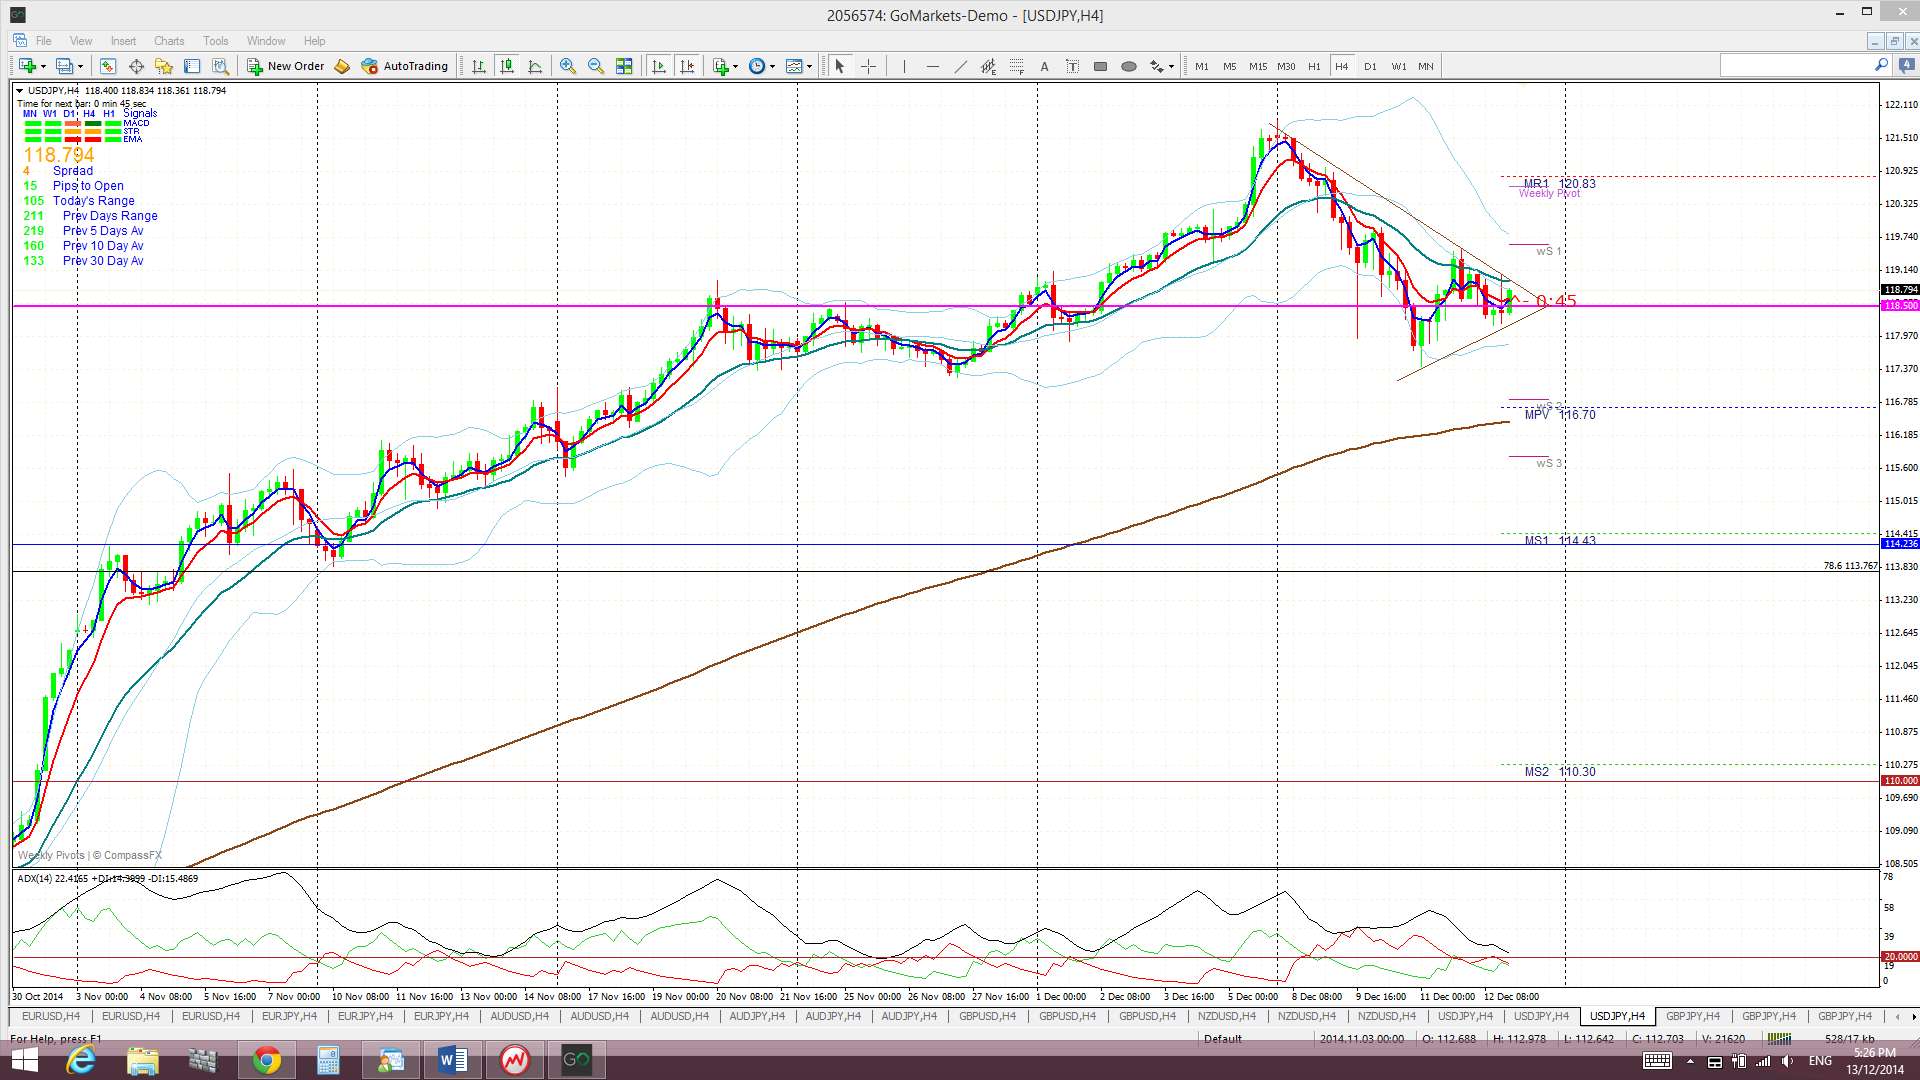
The Yen: U/J: The U/J chopped lower last week and this price action formed up into a symmetrical triangle on the 4hr chart.
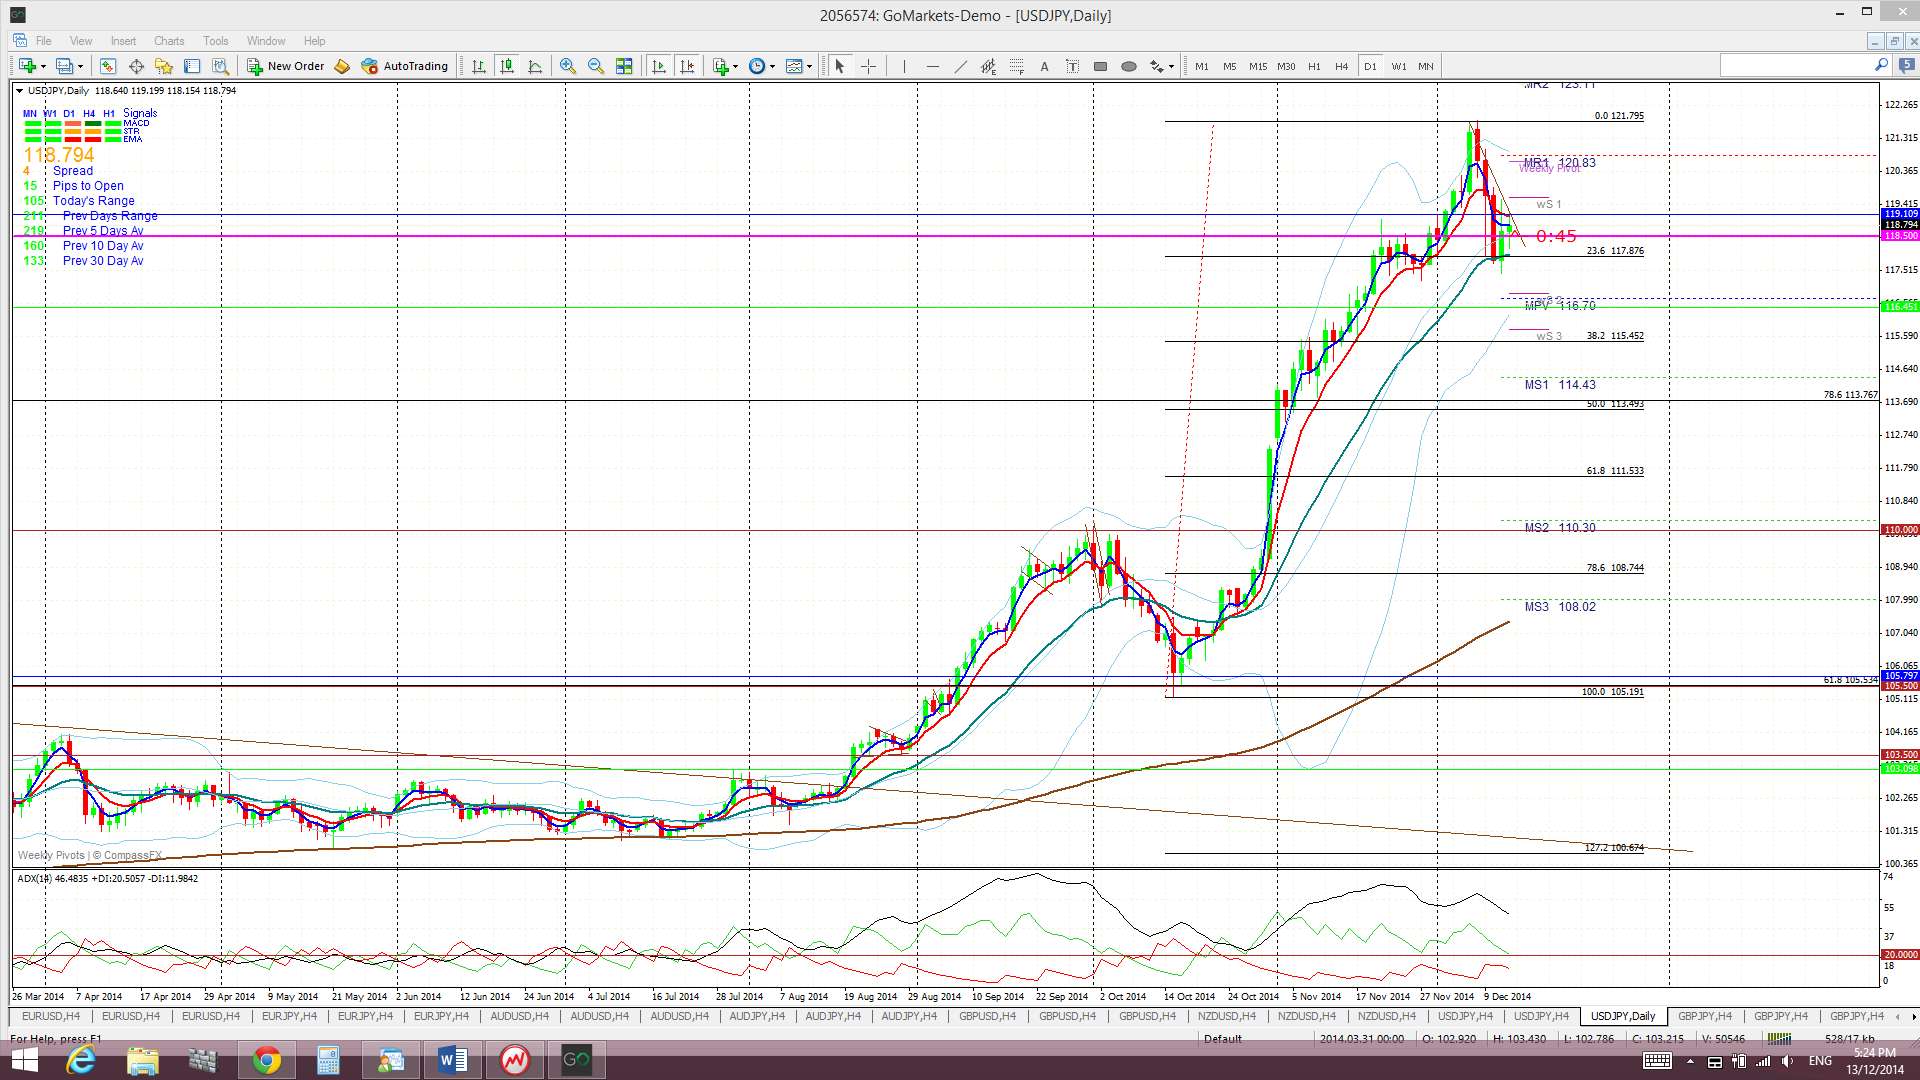
It is worth noting that price has dipped below the 4hr Ichimoku Cloud for the first time in seven weeks and this may be signalling an even deeper pull back following a rather lengthy bull run. Pull back targets would include the whole number 110 level and, then, the previous S/R levels of 105.5 and 103.5.
U/J 4hr Cloud:
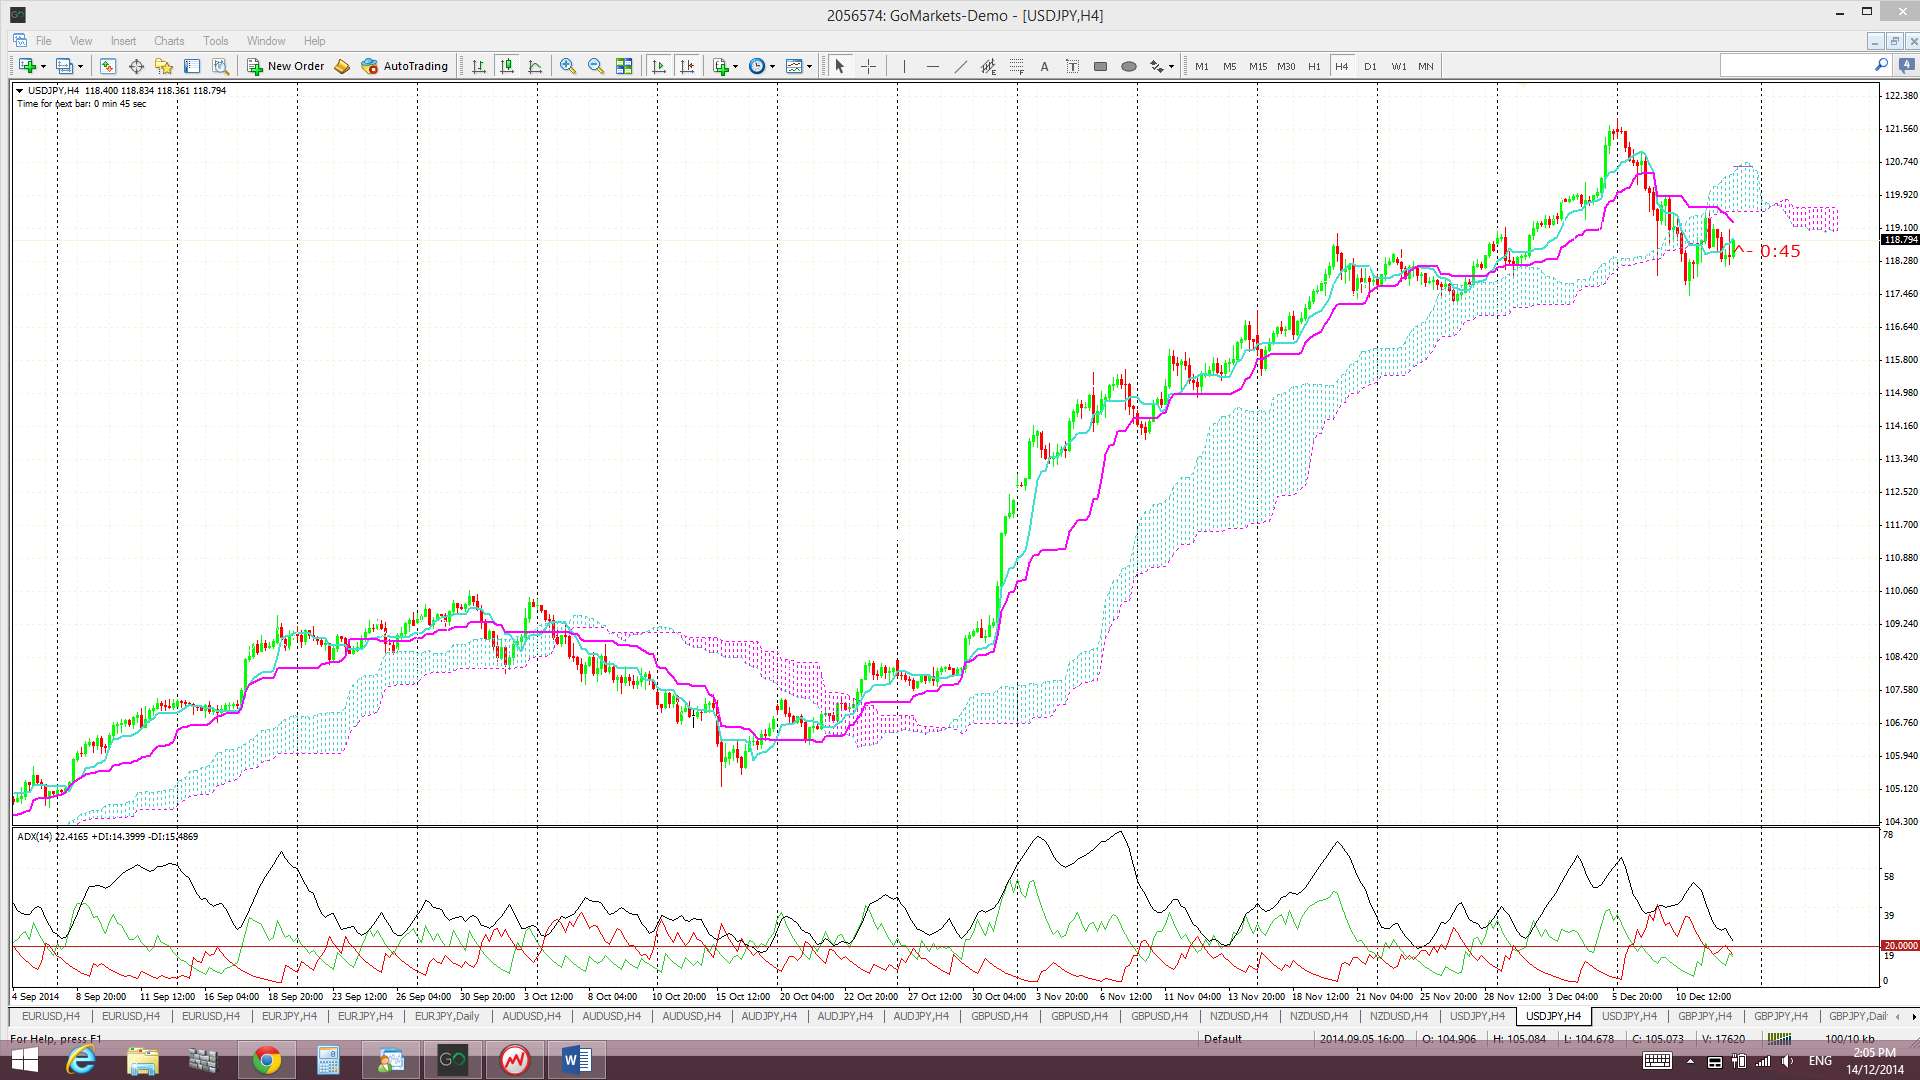
Price is now trading below the Cloud on the 4hr but above on the daily, weekly and monthly charts. November 2013 was the first monthly candle close above the Ichimoku Cloud since mid-2007 and the bullish hold above the monthly Cloud continues to be noteworthy.
The weekly candle closed as a large bearish candle and this has given the weekly chart a bit of a bearish-reversal ‘Railway Track’ appearance.

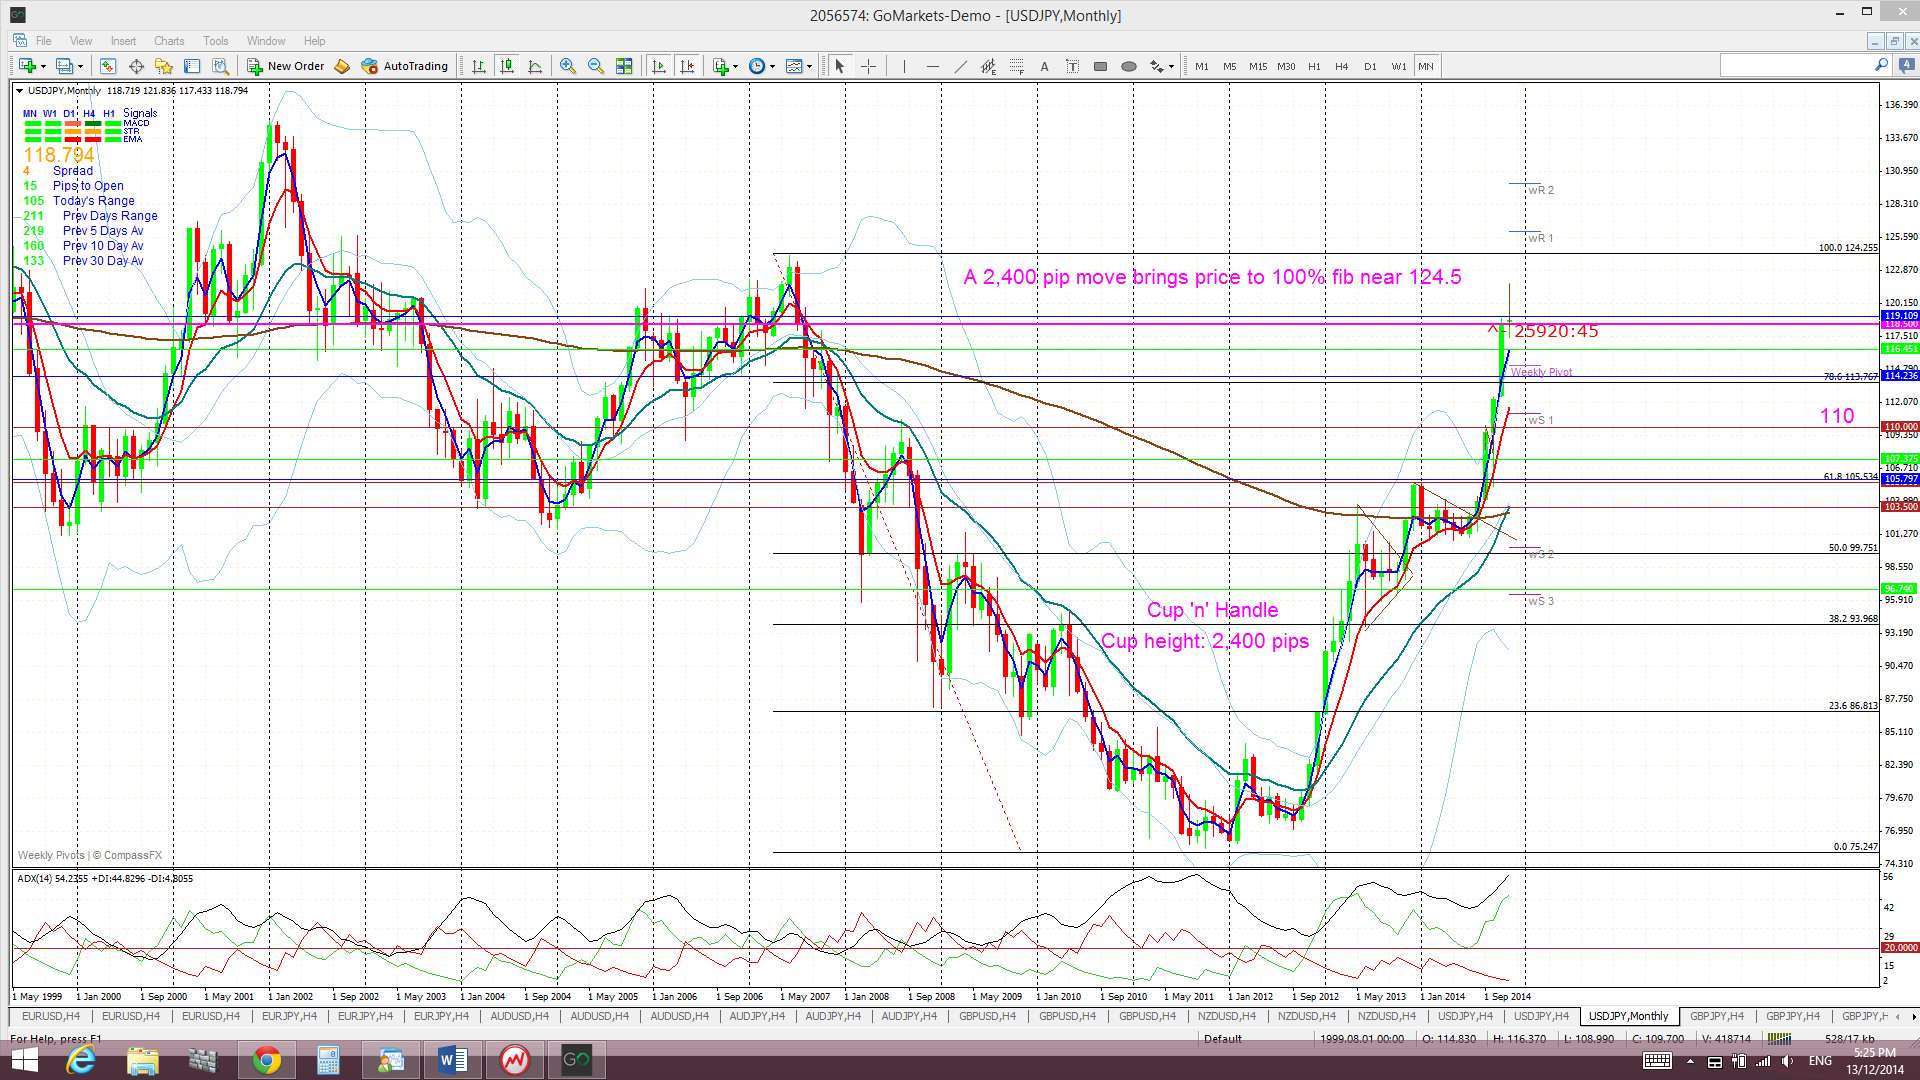
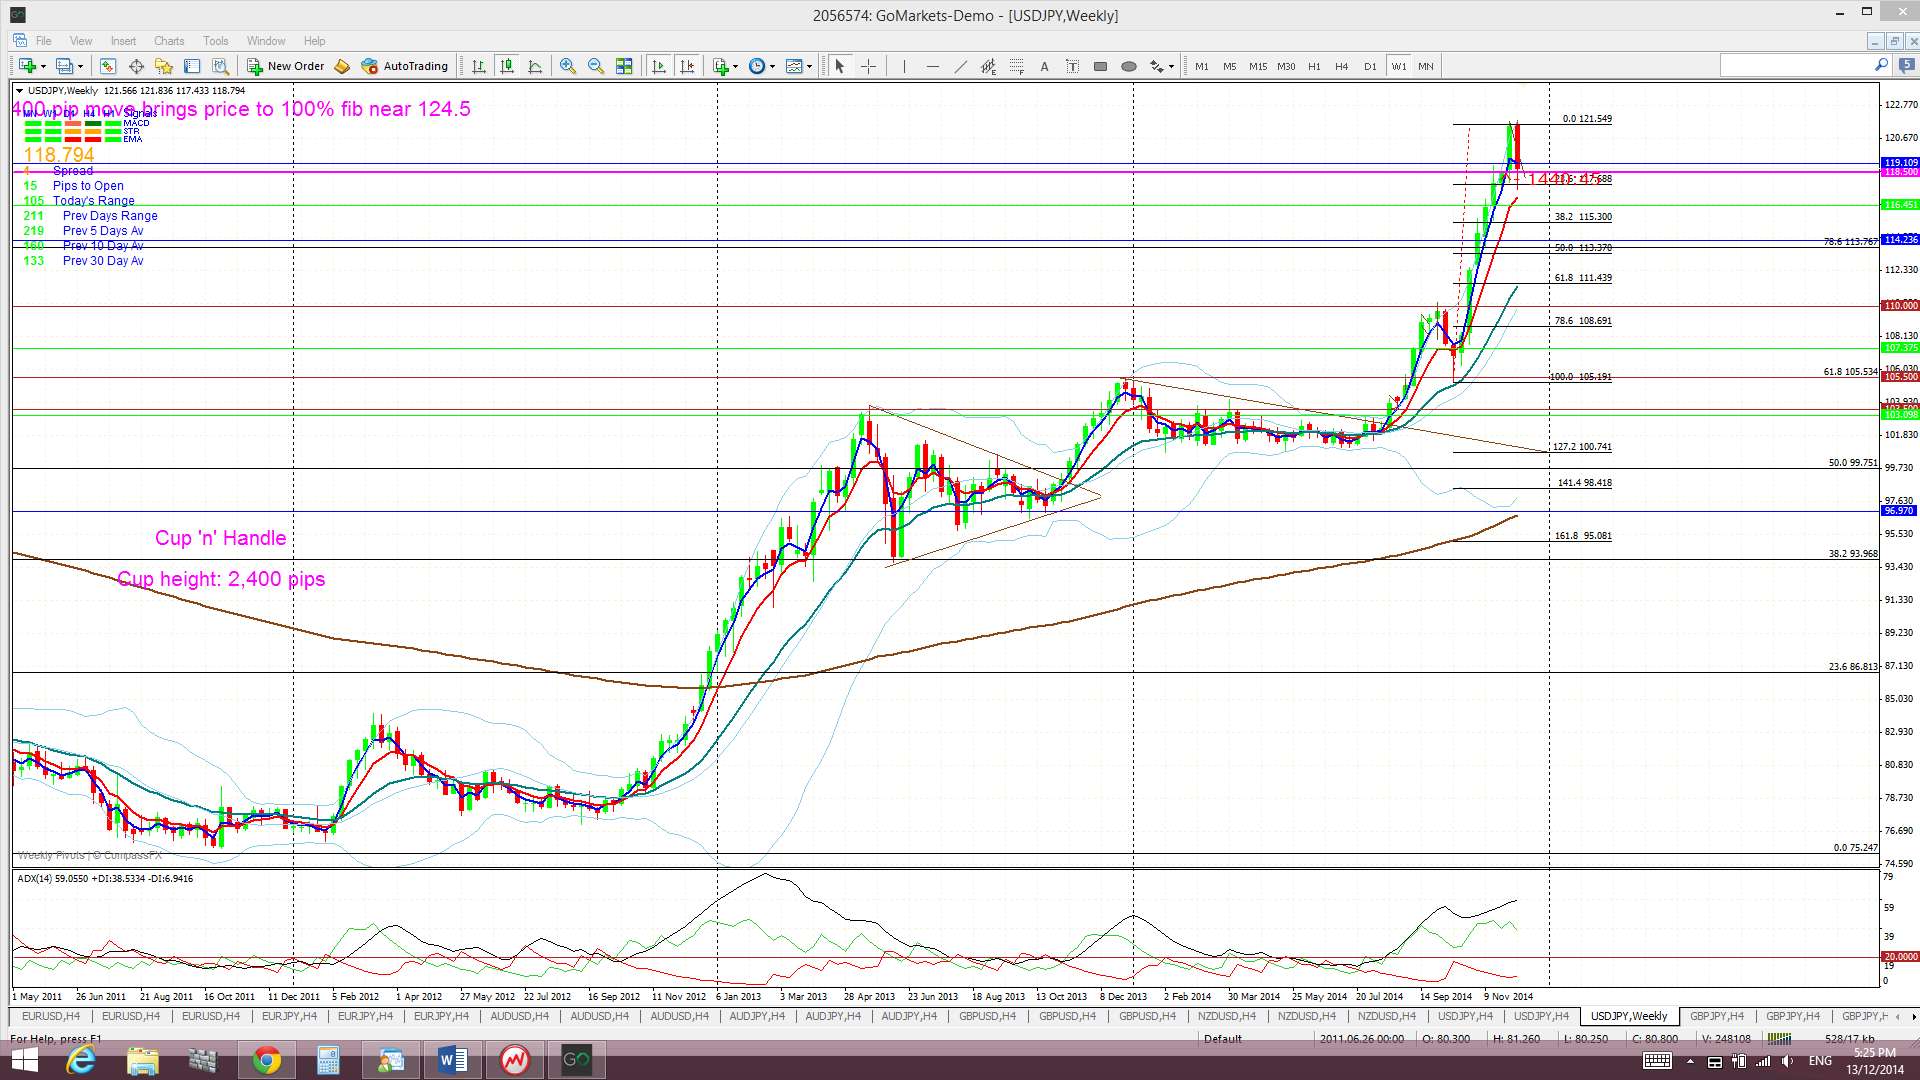
Weekly Chart Bullish Cup’ n’ Handle pattern: This pattern is close to its climax! The theory behind these patterns is that the height of the ‘Cup’ pattern is equivalent to the expected bullish move from the ‘handle’ breakout. The height of the Cup for the U/J weekly chart is around 2,400 pips. The interesting point here is that a 2,400 pip bullish move up from the ‘Handle’ would put price up near the 124 level. This level is the last major swing high for the U/J from back in 2007 and represents the 100% fib pullback for the move down in 2007 to the lows of 2012. I noted a possible huge bullish Cup ‘n’ Handle back in October 2013, long before all of the recent BoJ easing and the target move of 2,400 pips has already delivered over 2,000 pips!
- I’m watching for any new TC signal.
GBP/JPY: The GBP/JPY chopped around a bit last week and, like the U/J, formed up into a triangle pattern.
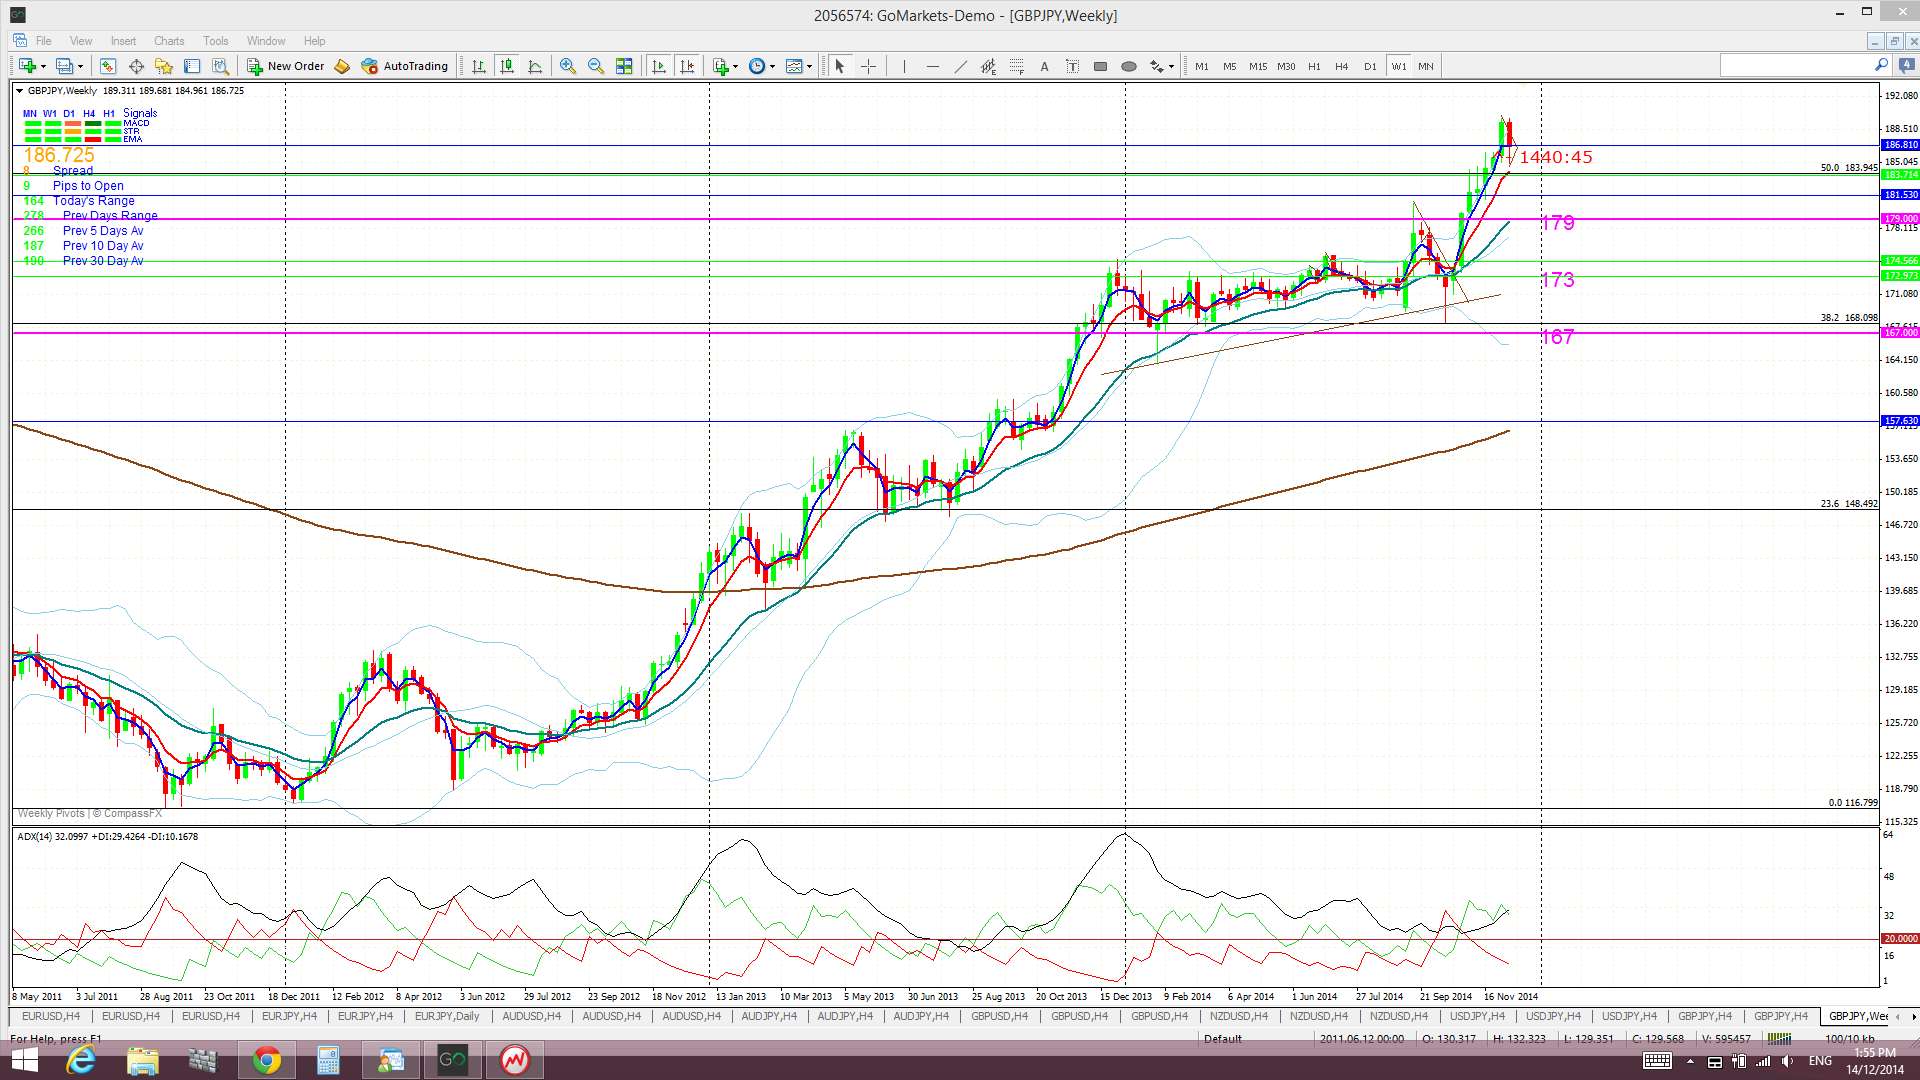
A bearish pull back here has failed to take hold here yet but a possible target would be the 179 level which is near the 50% fib of the recent bull run. Deeper pull back targets would include the 173 and then 167 levels.
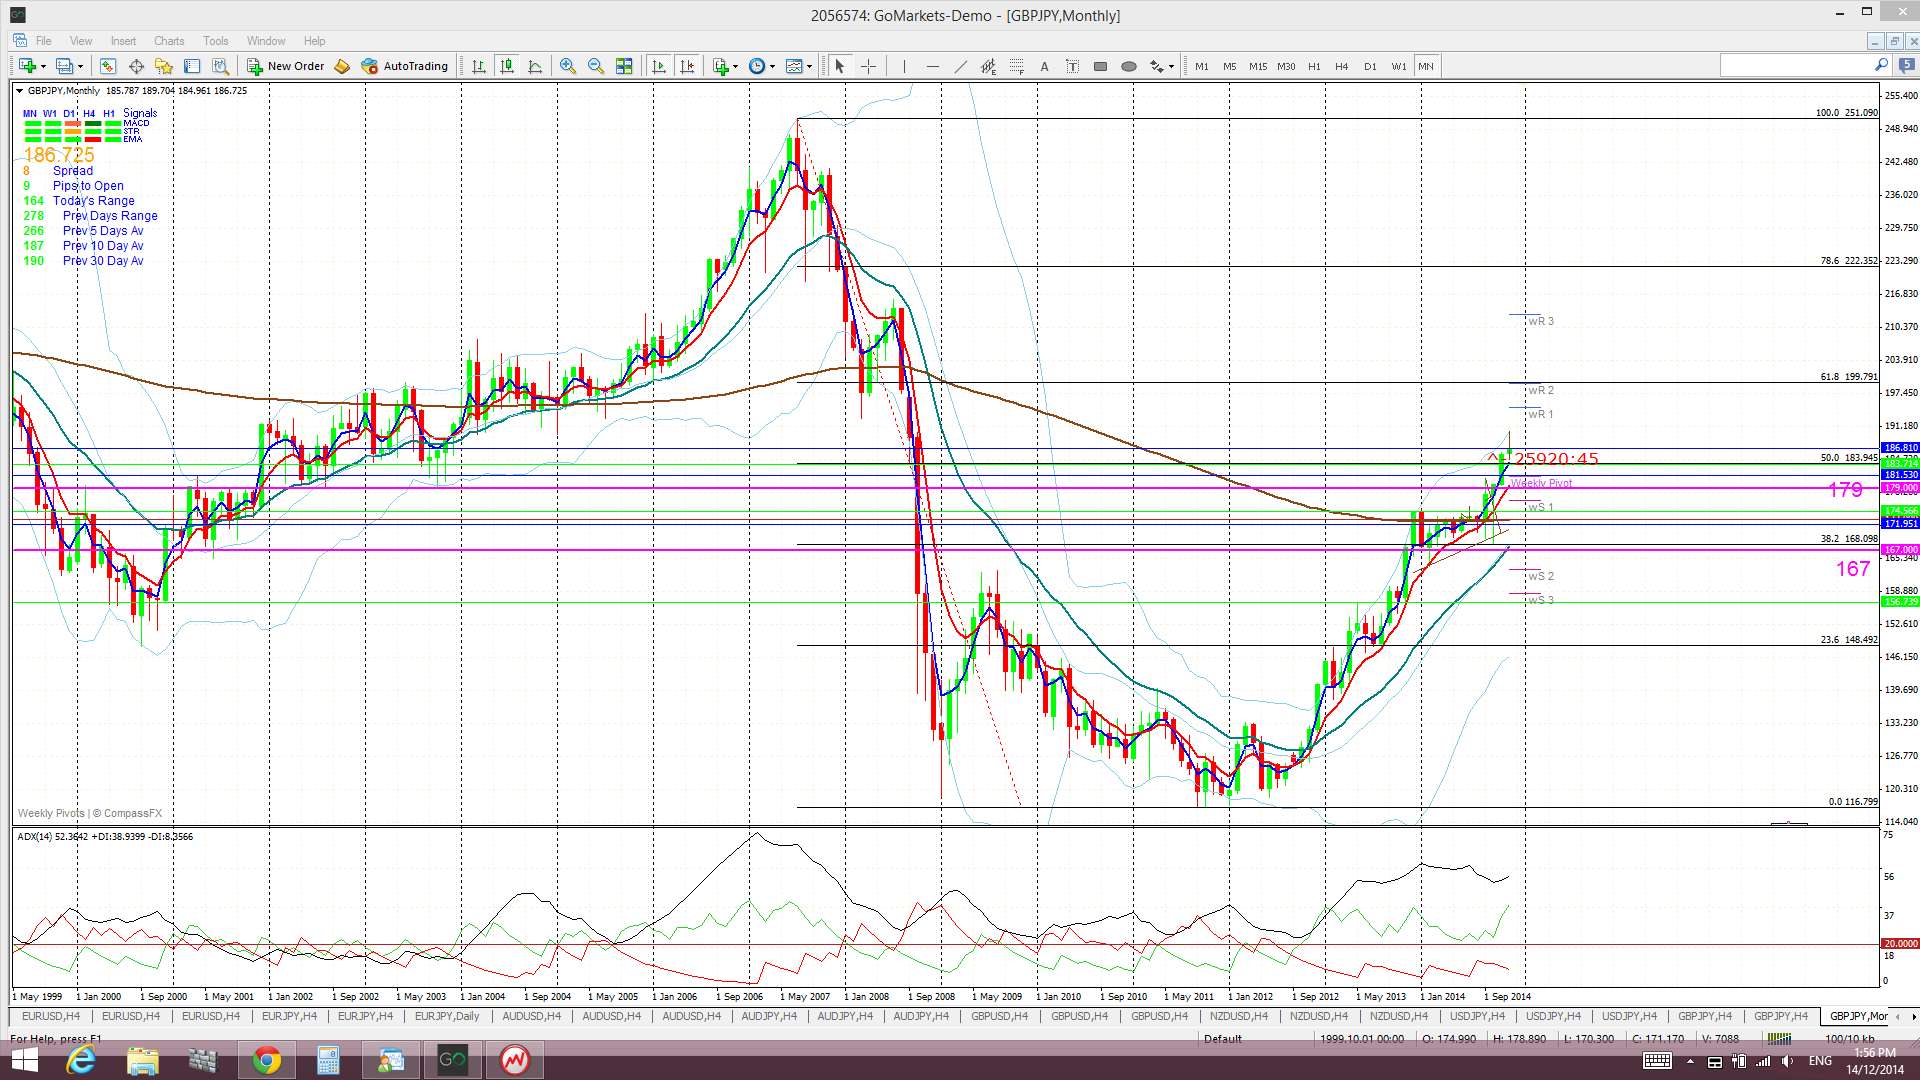
Two key S/R levels on the G/J chart: The monthly chart shows a band of choppy congested activity across the chart. This band is defined by rather strong S/R levels at 179 and 167. The 179 level seems to be a key demarcation level and a close and hold above this would suggest bullish continuation. The key 173 level lies midway between these two S/R levels. Targets for any bullish break and hold above the 179 level, apart from obvious whole number levels, include the 50% fib near 184, the 61.8% fib near 200 and the 78.6% fib near 222.
Price is now trading below the Ichimoku Cloud on the 4hr chart but above on the daily, weekly and monthly charts. It is worth noting that this is the first dip back below the 4hr Cloud in over 8 weeks!
GBP/JPY 4hr Cloud:
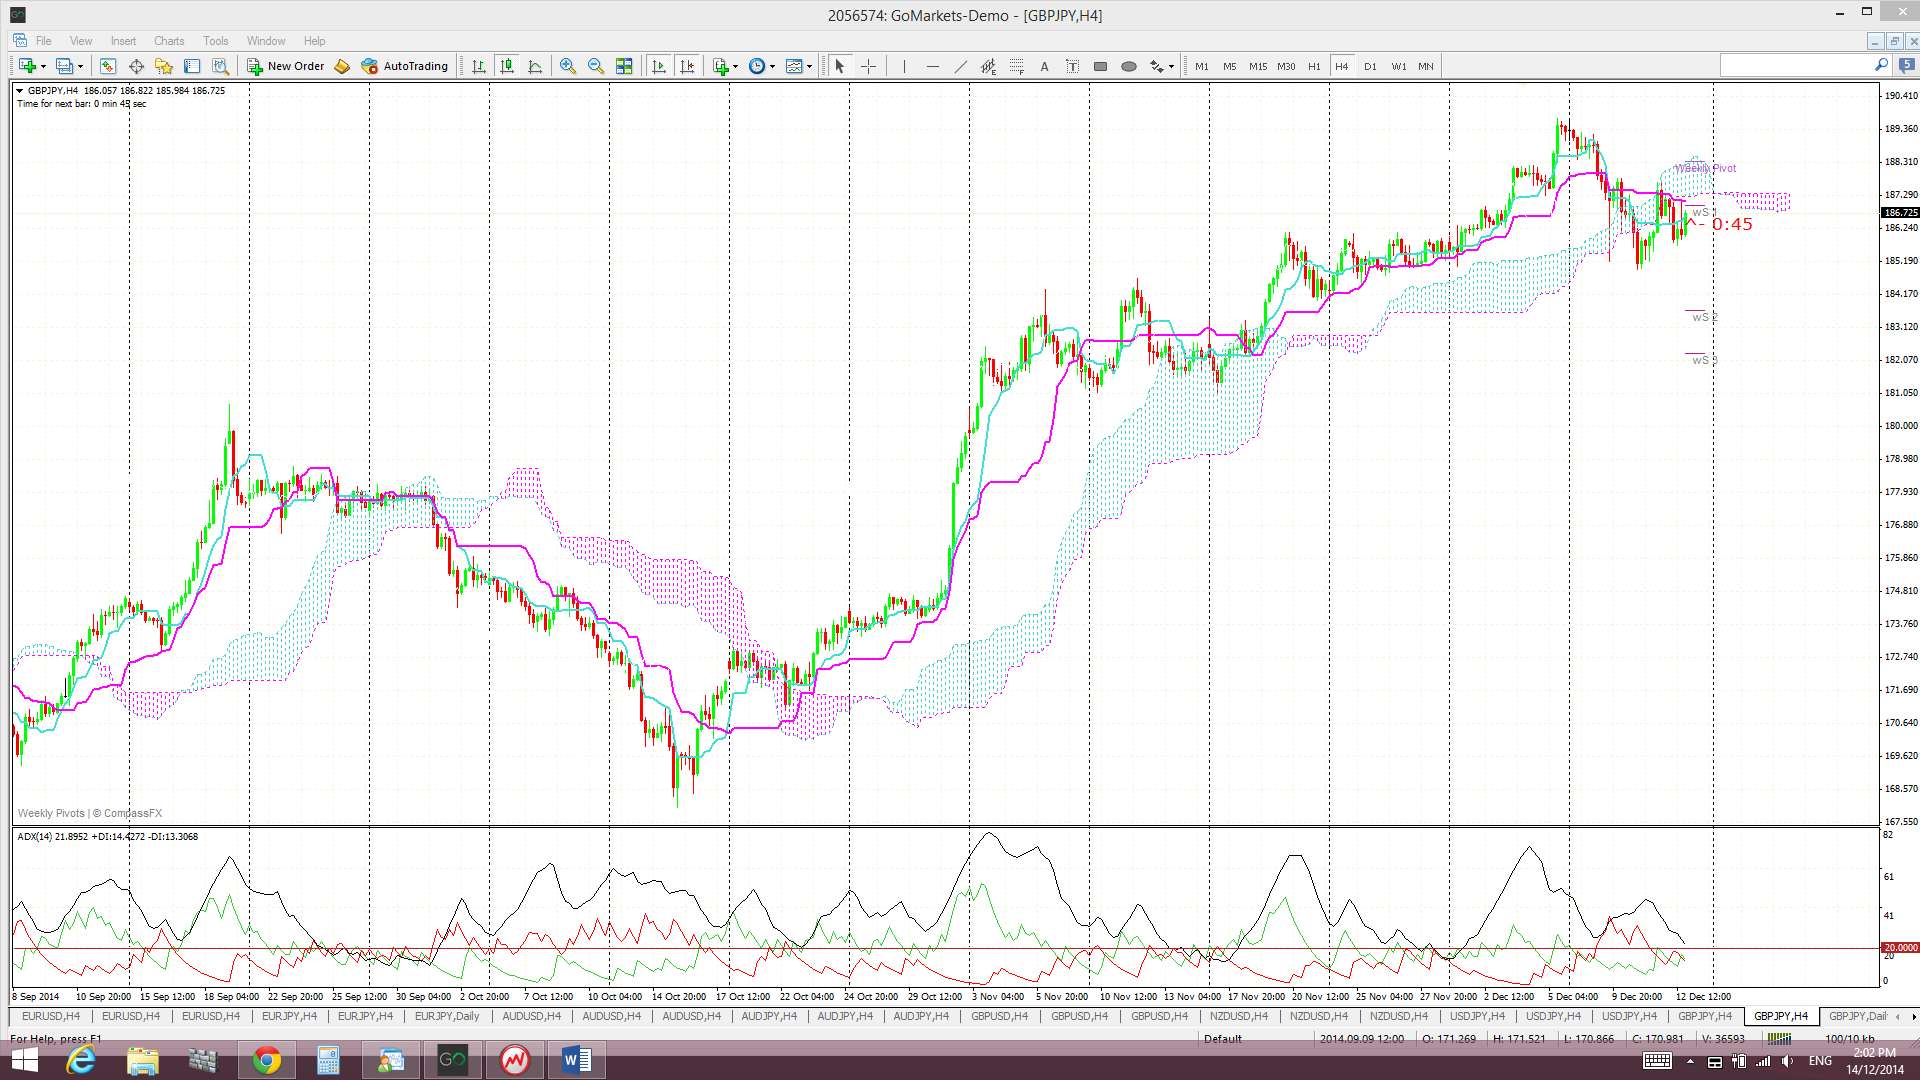
The weekly candle closed as a bearish coloured ‘inside’ candle.
- I’m watching for any new TC signal on this pair and the 179, 176 & 173 levels.


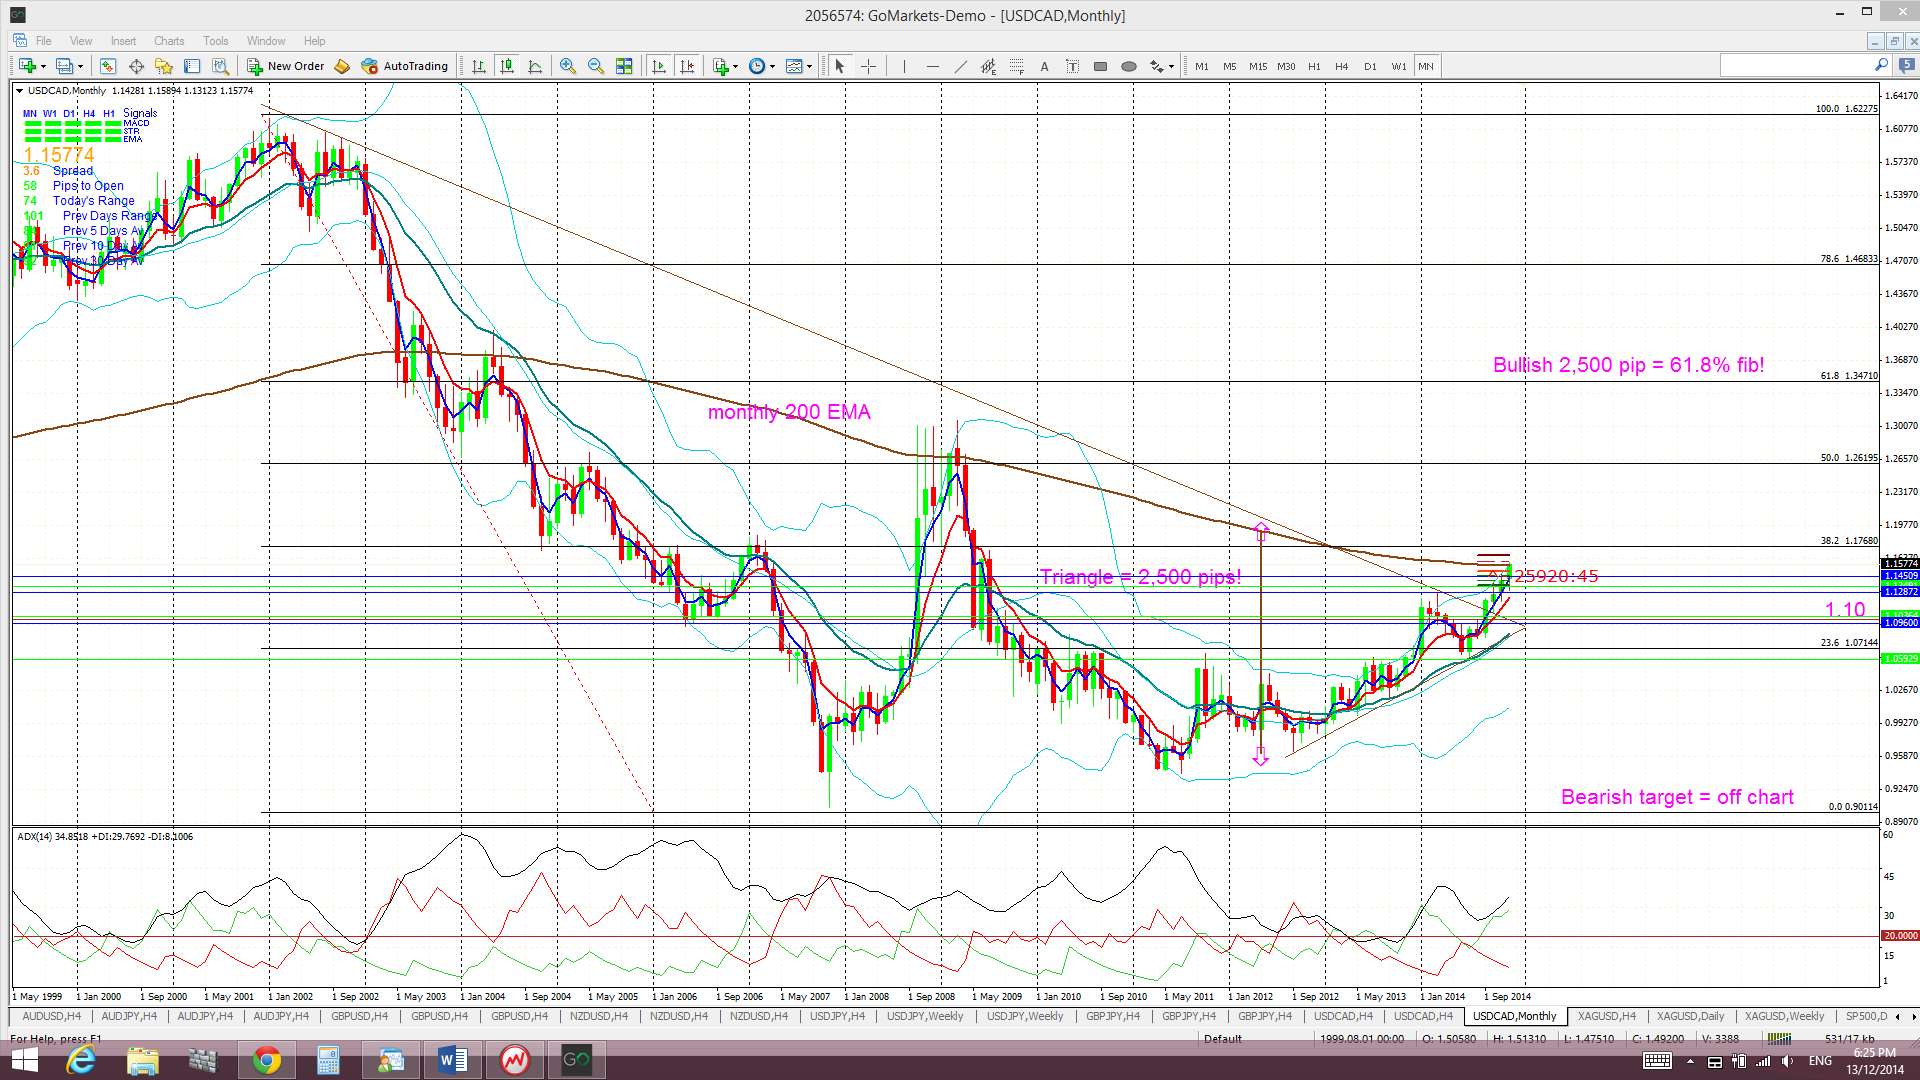
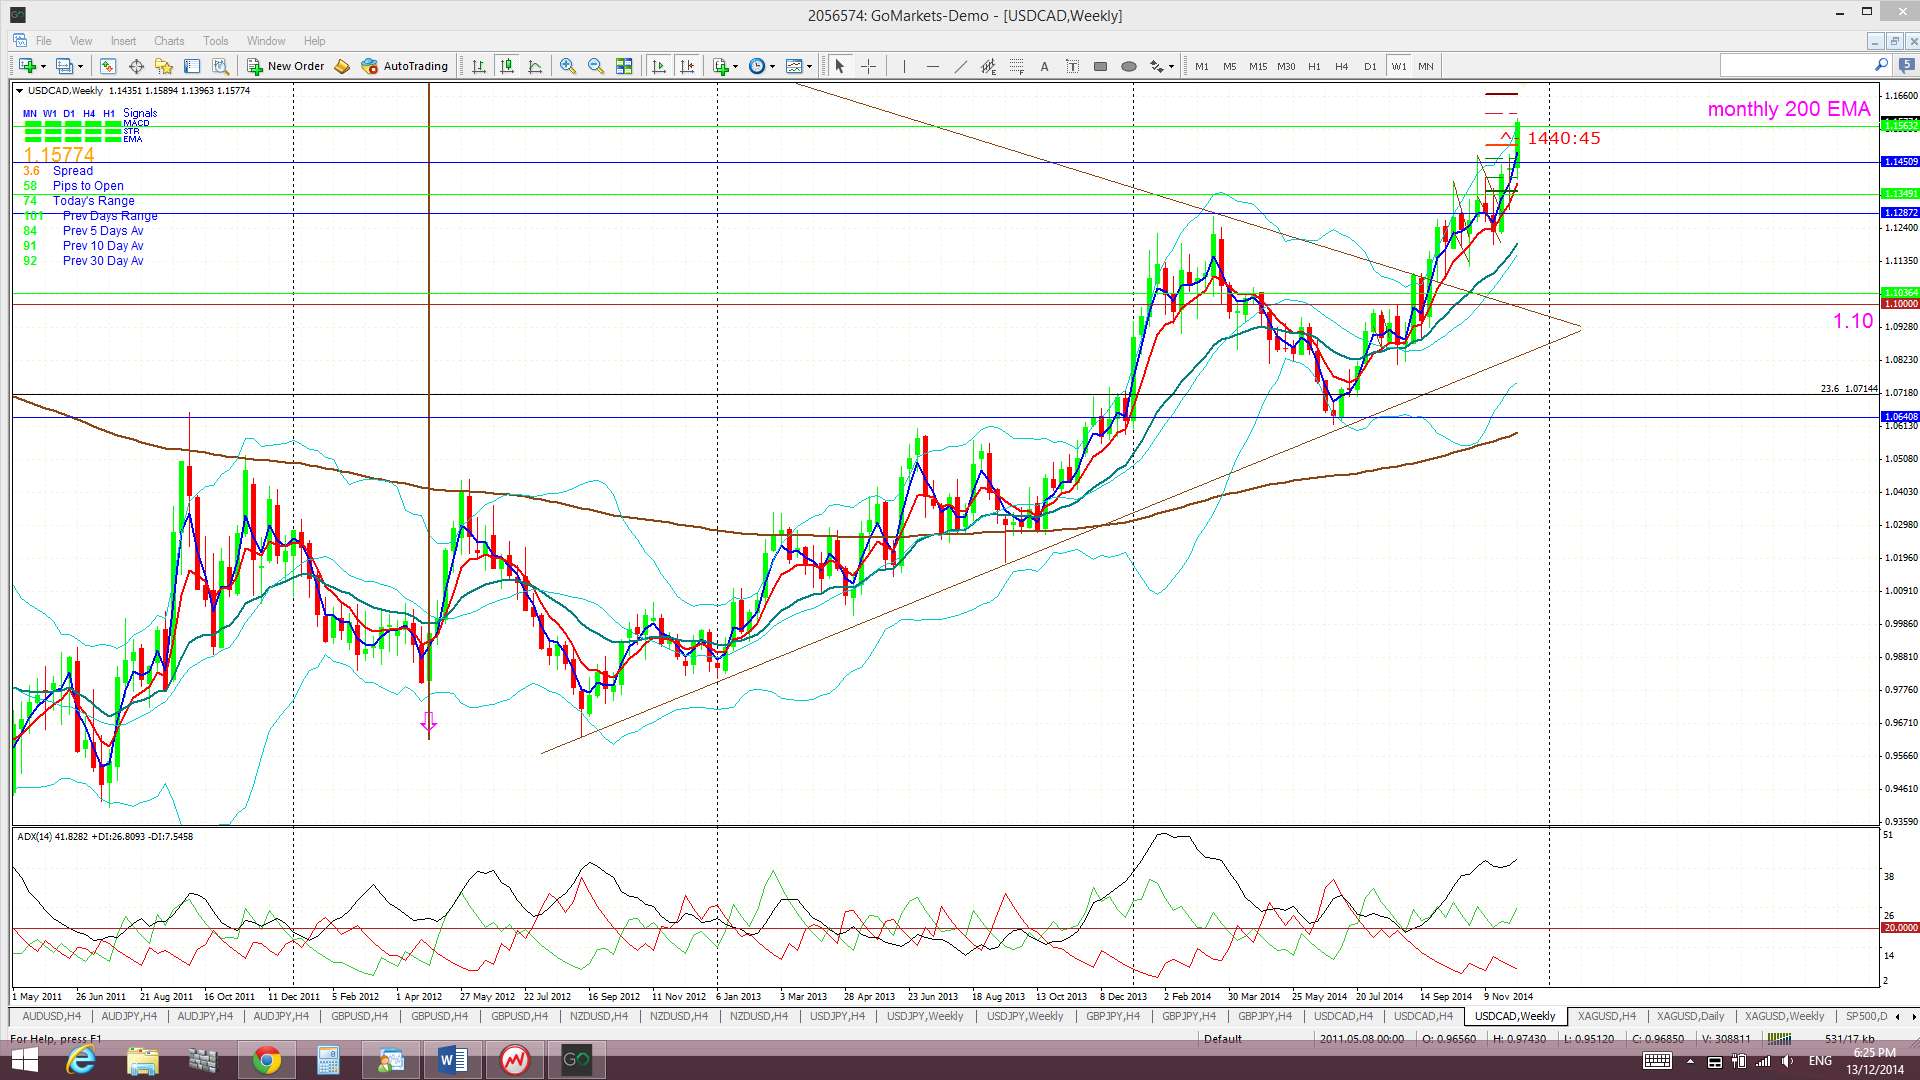
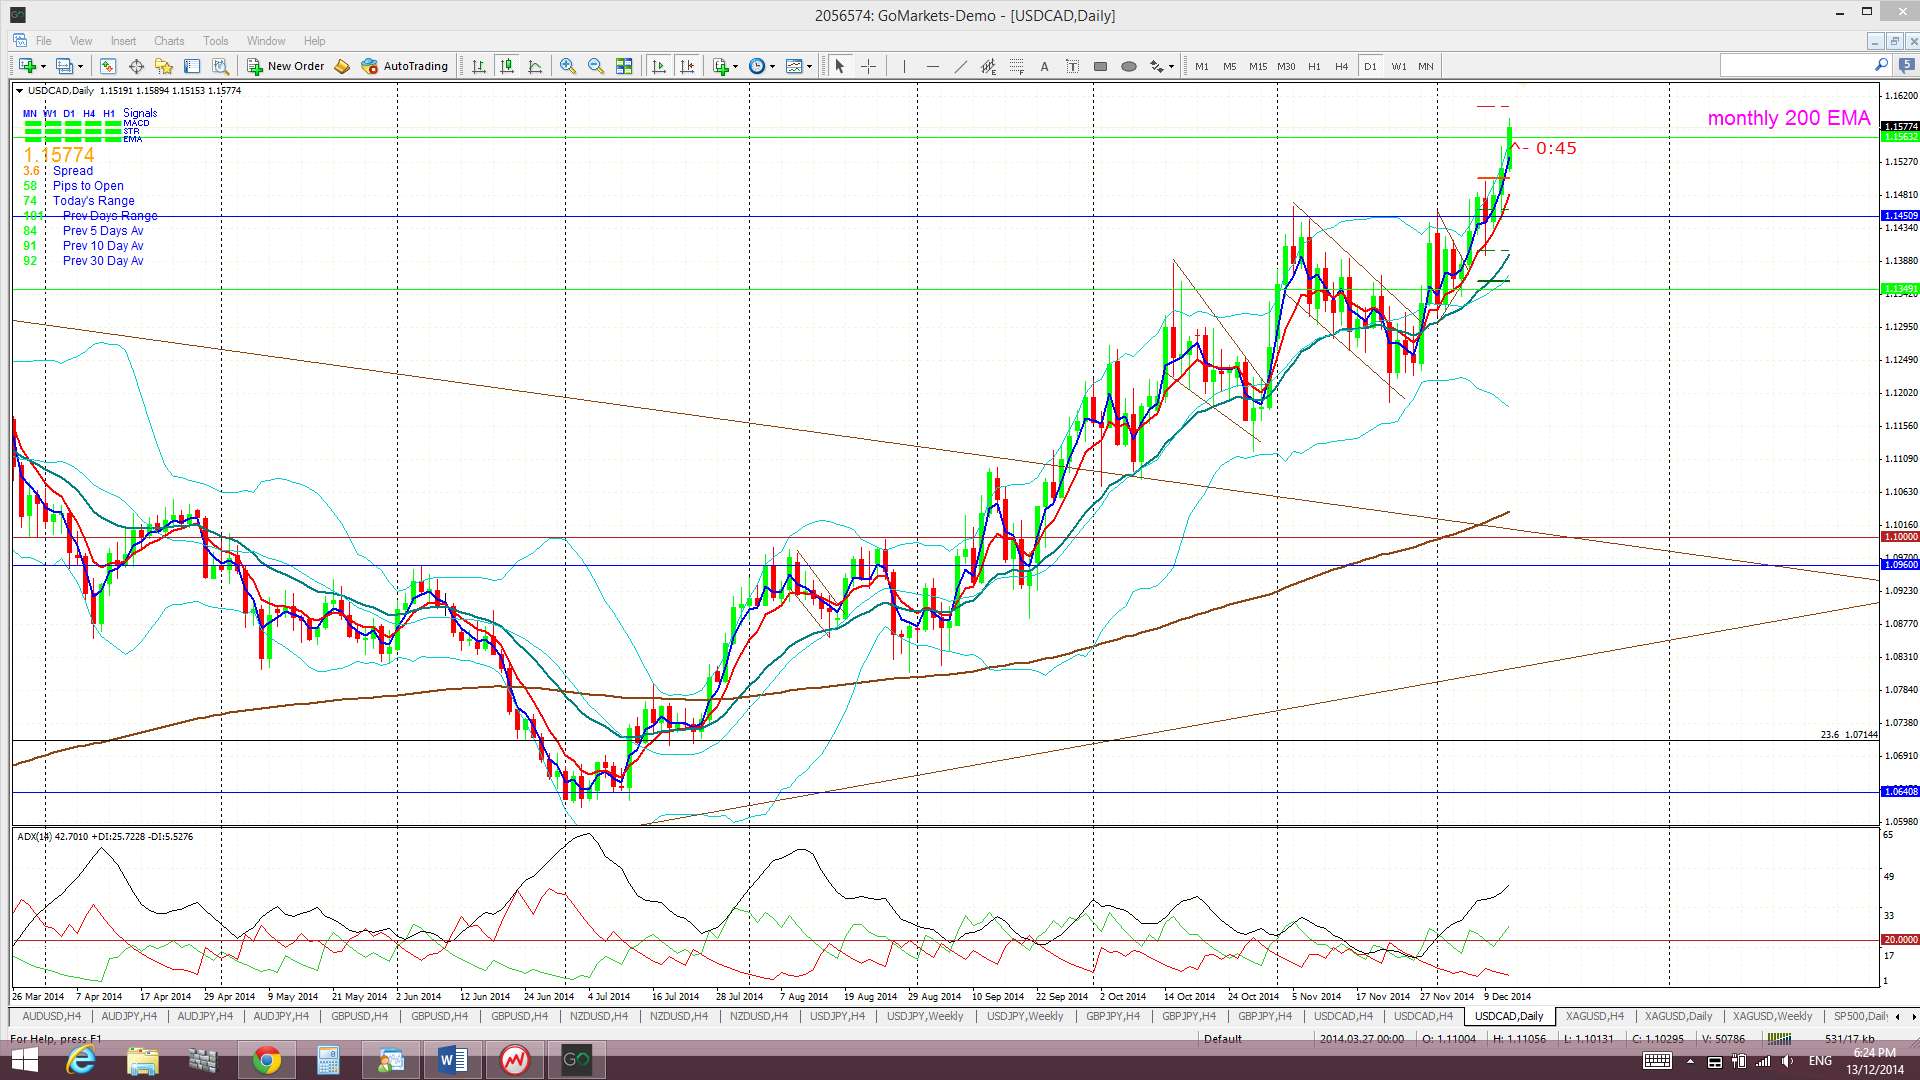
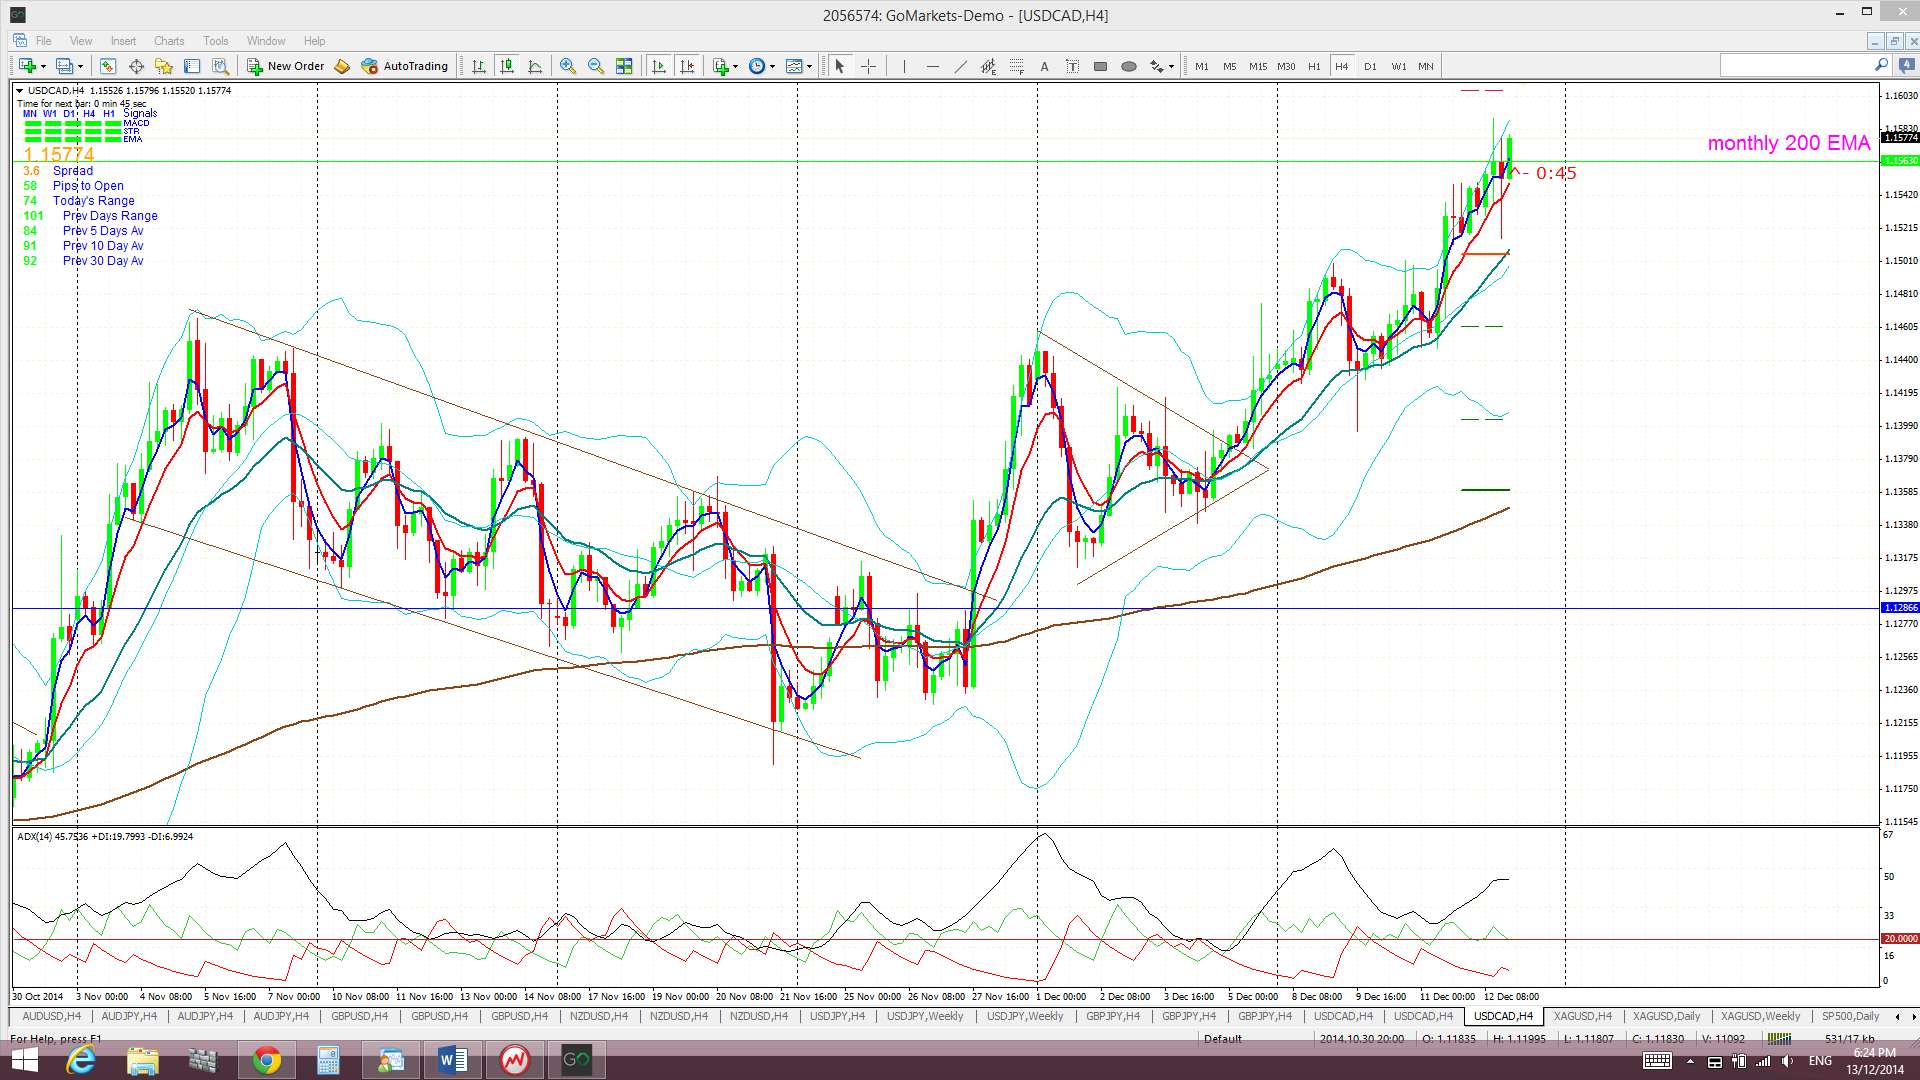
USD/CAD: The USD/CAD chopped higher last week following a triangle breakout during the previous week. Falling oil prices continue to put pressure on the CAD and this has helped to lift this pair.
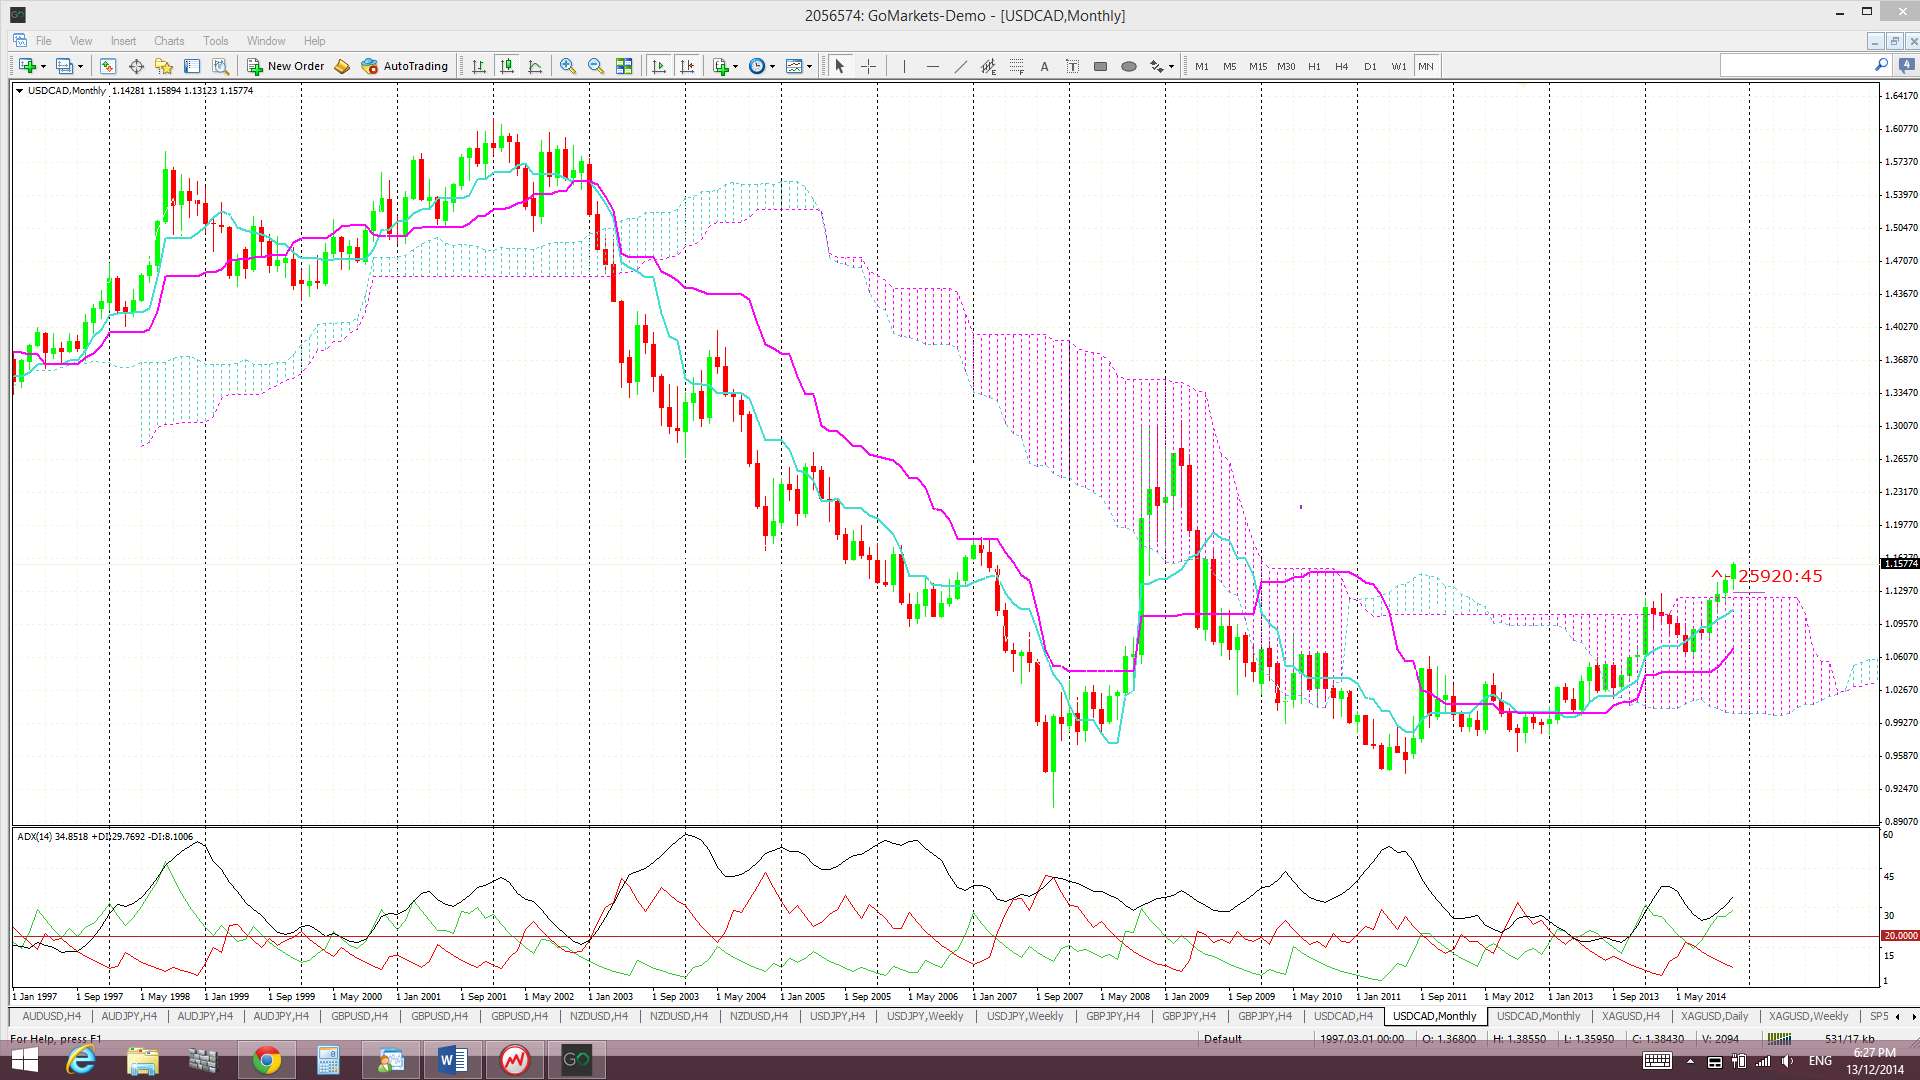
The USD/CAD has already made a triangle breakout but is trading up near the major resistance of the monthly 200 EMA AND this may offer traders another entry point into this trade. Price closed above this level last week but any pullback to test this ‘resistance turned support’ may offer a trade entry opportunity.
Triangle breakout target: The Loonie has broken up and out from a major monthly chart triangle pattern that could deliver up to 2,500 pips. This 2,500 pip figure is evaluated from the height of the triangle. I have used the triangle height from the beginning of the bull trend line, as shown in the monthly chart below. The height of the triangle is around 2,500 pips and, thus, this would be the expected move from any breakout action. Extrapolating a bullish move from this triangle places price up at the 61.8% fib level. These fibs levels are popular targets in retracement moves and so this adds some confluence to this as a possible target. This triangle move has already delivered up to 500 pips of the possible 2,500.
Price is trading above the Cloud on the 4hr, daily, weekly and monthly charts which is bullish. The monthly Cloud chart is particularly noteworthy as price hasn’t held above the monthly Cloud, for more than one month, in over 12 years!
The weekly candle closed as a large bullish candle.
- I’m watching for any new TC signal on this pair and the monthly 200 EMA.
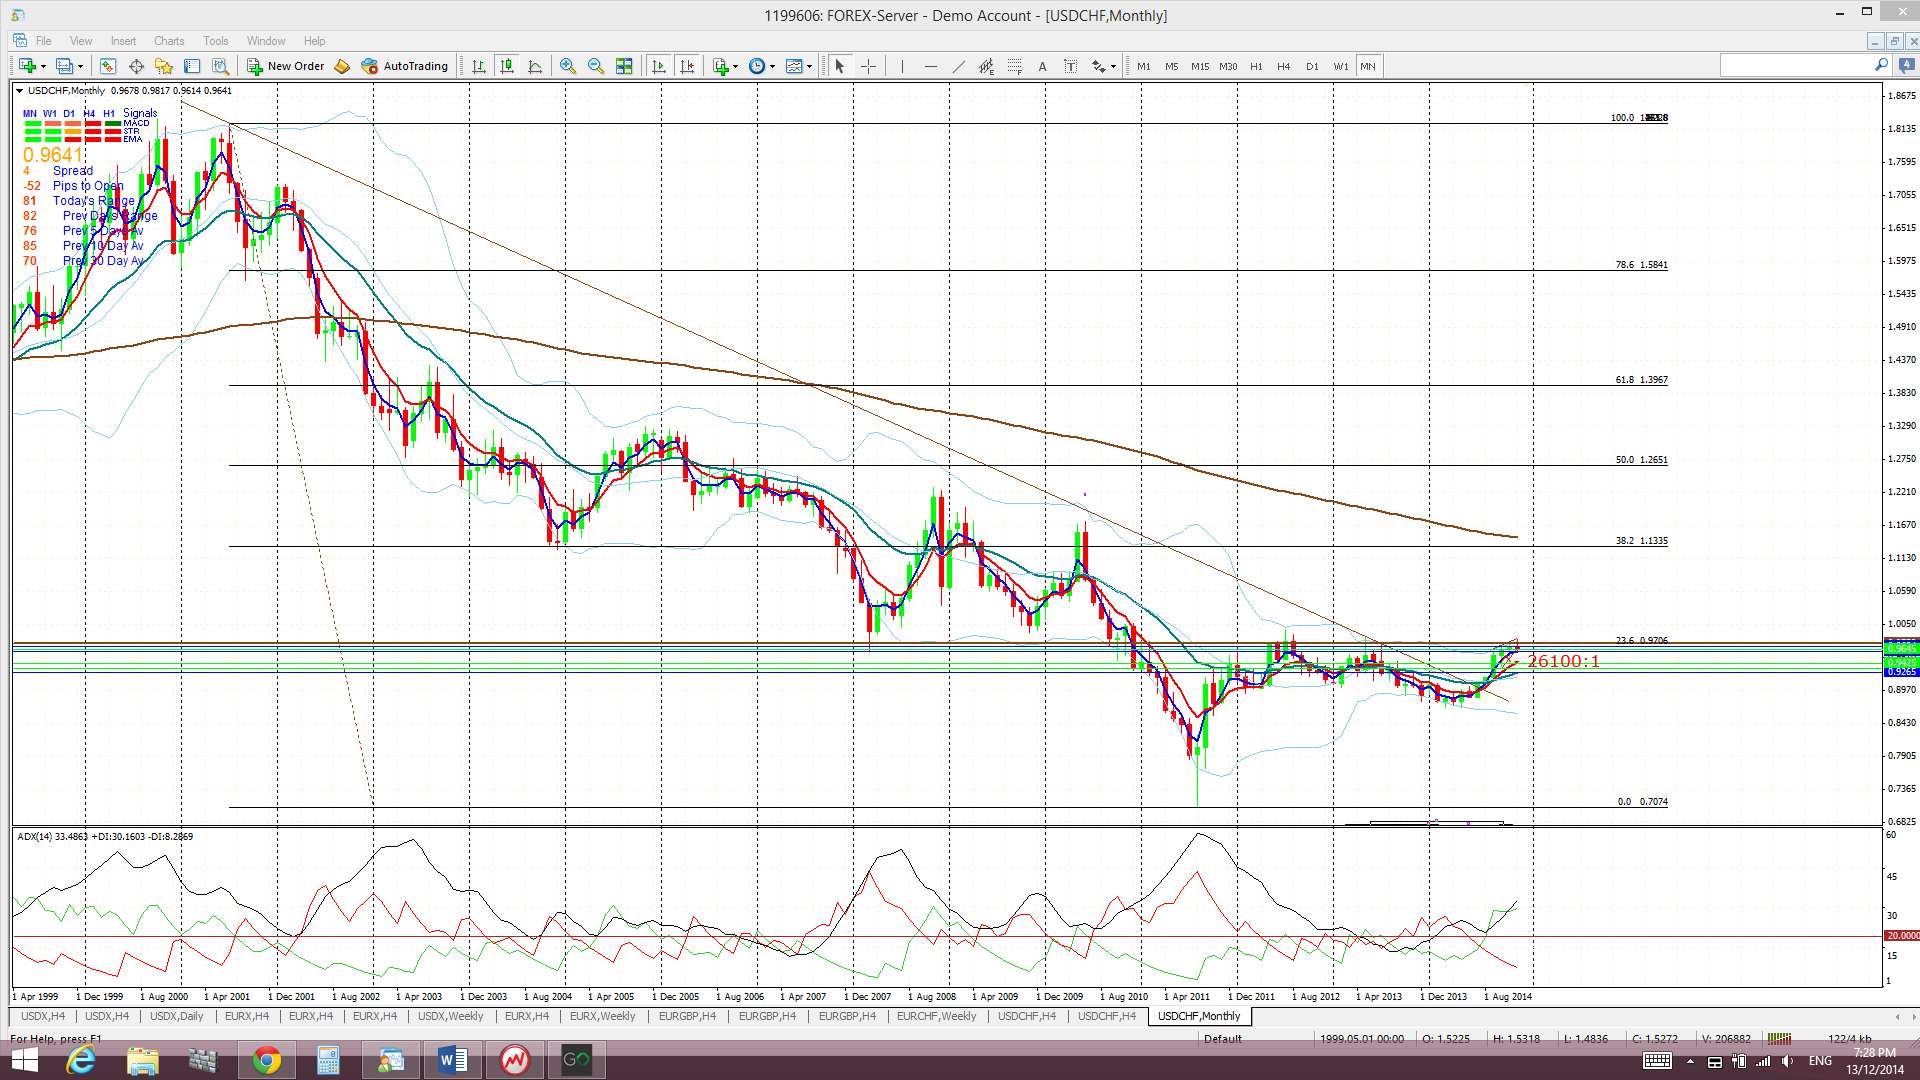
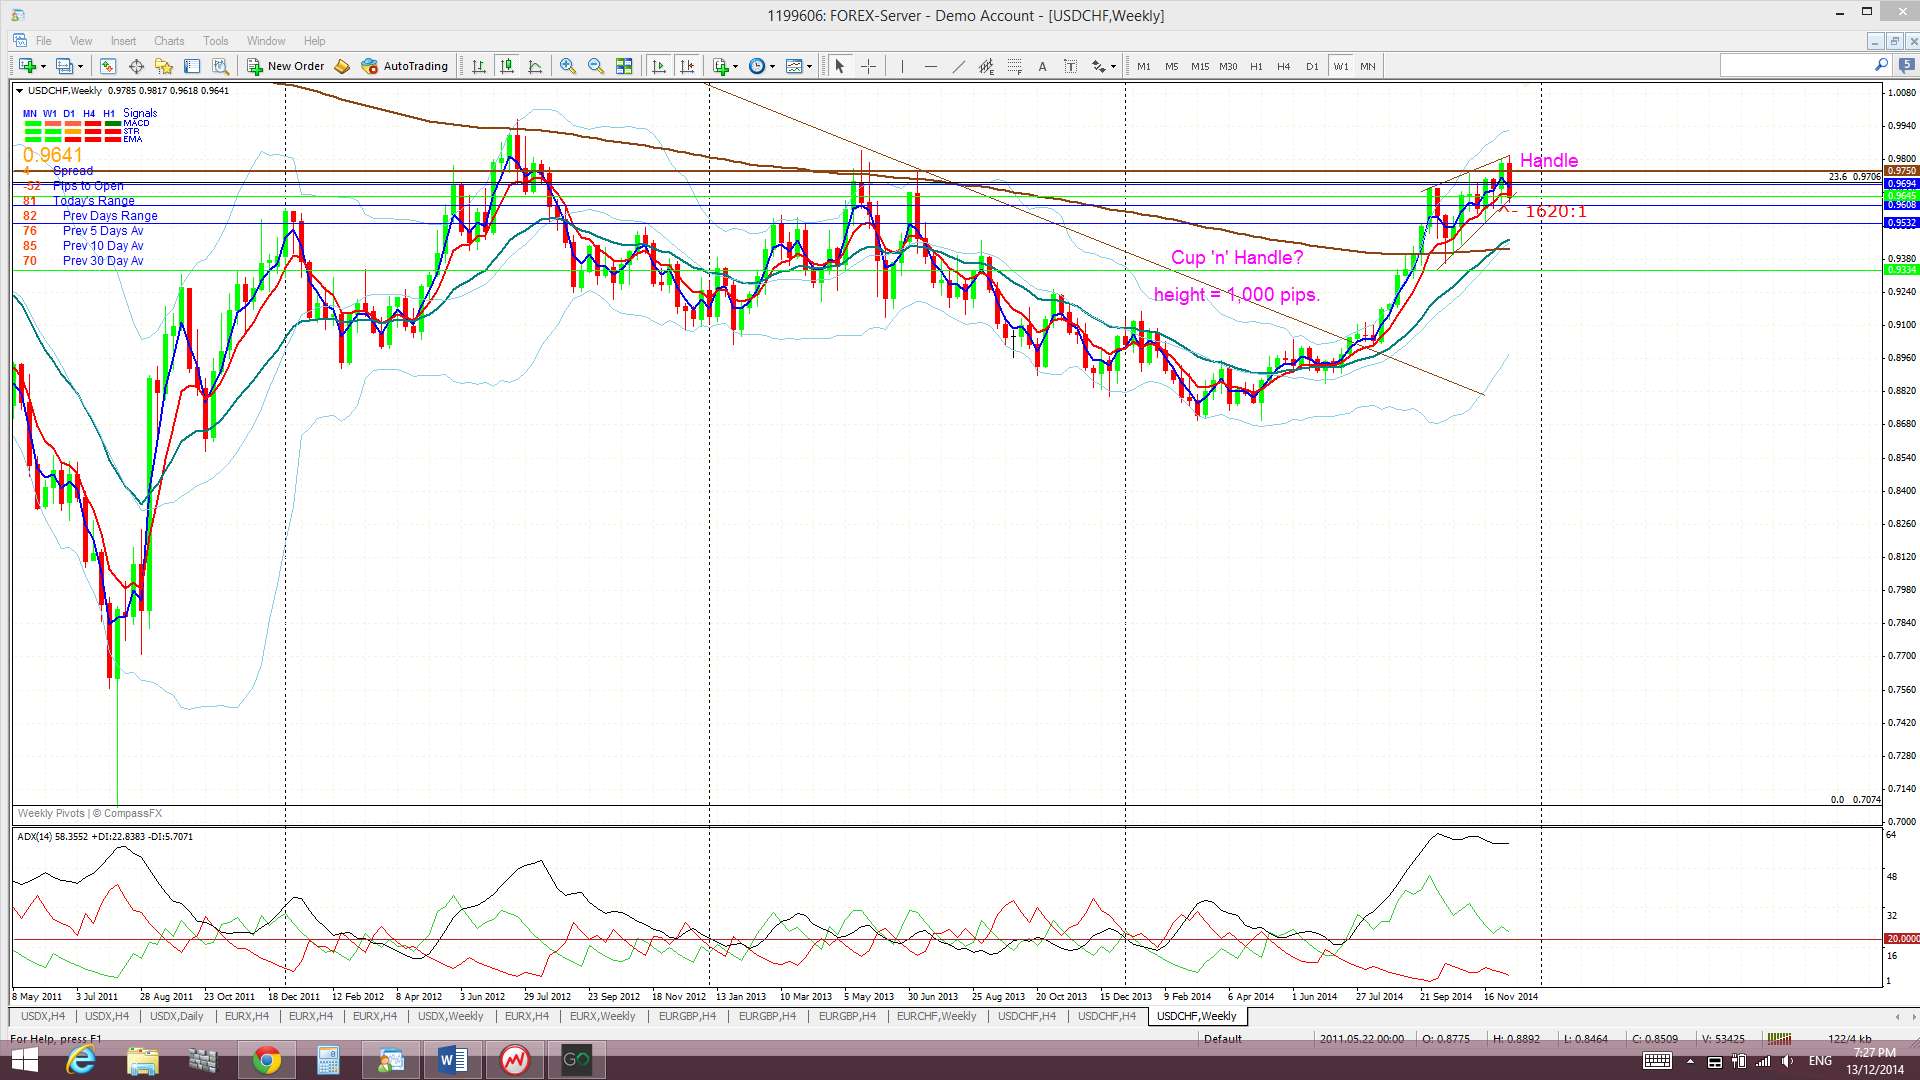
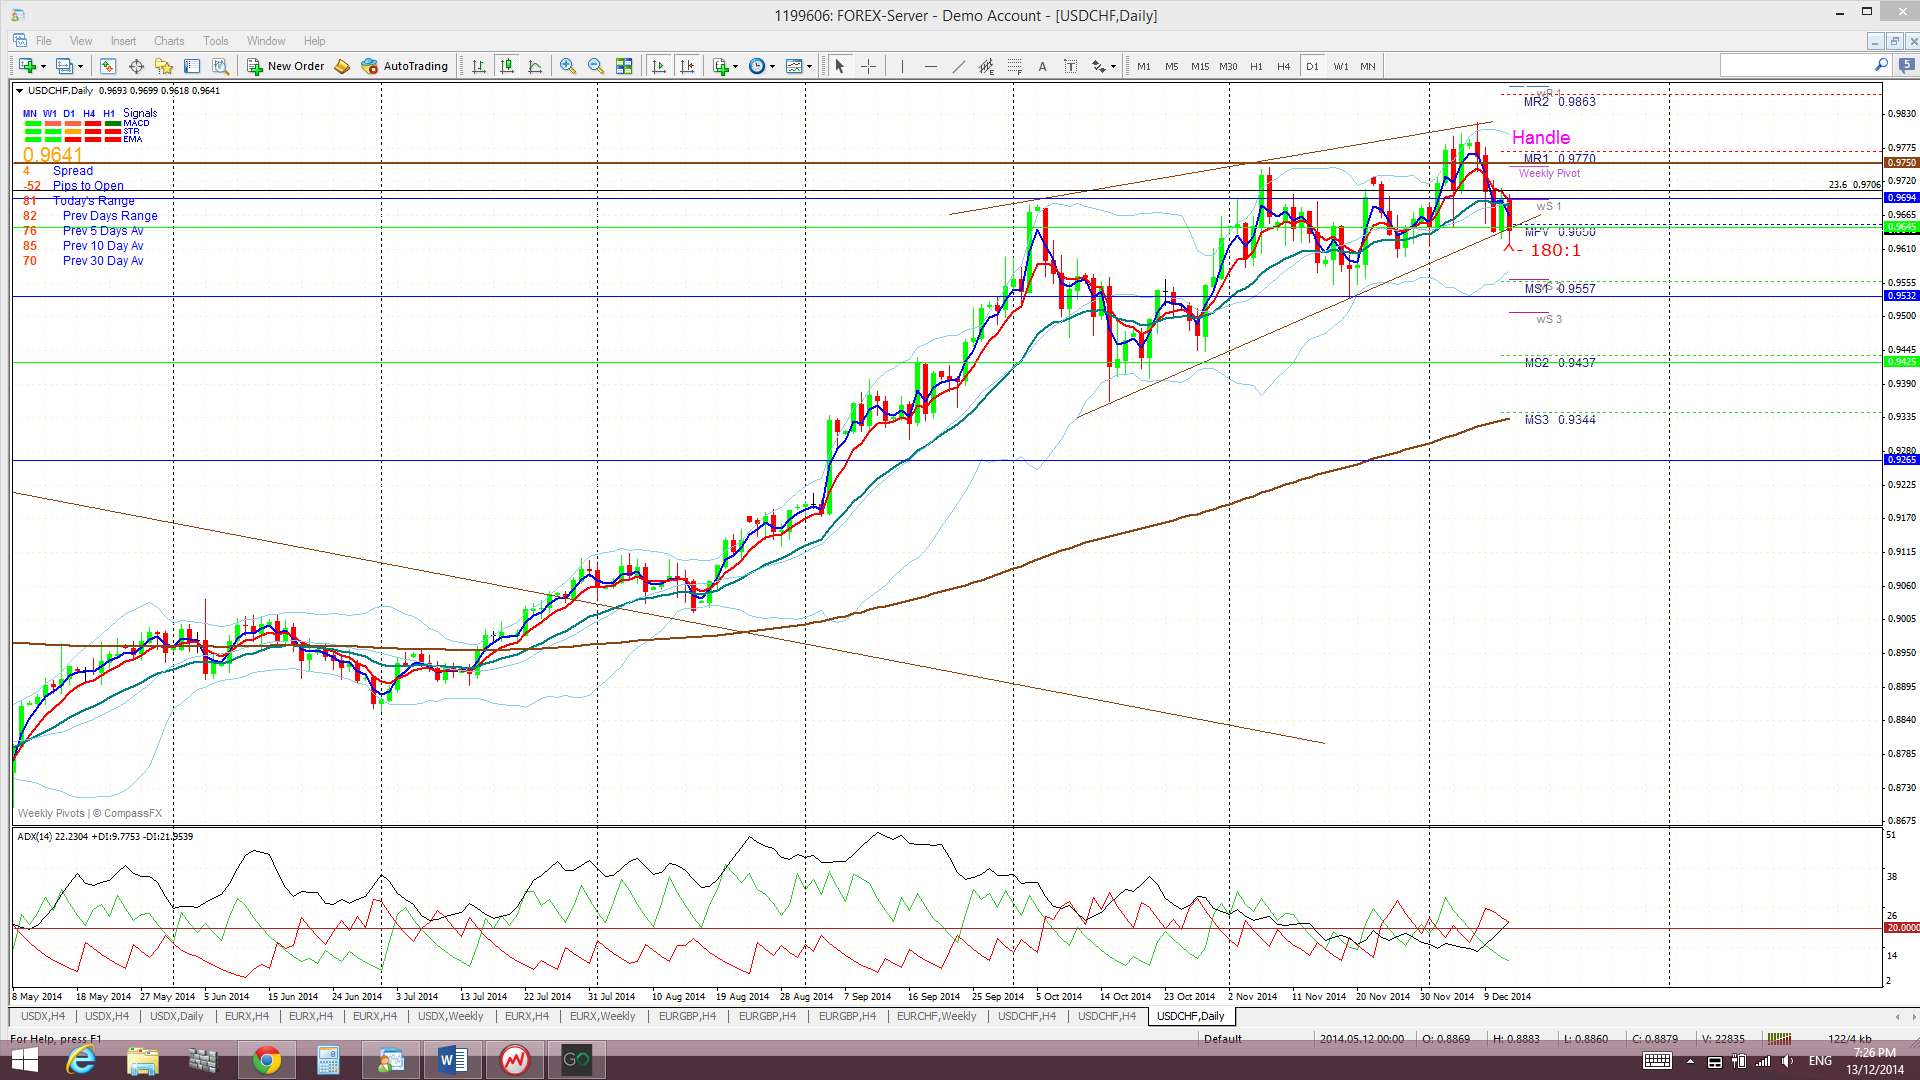
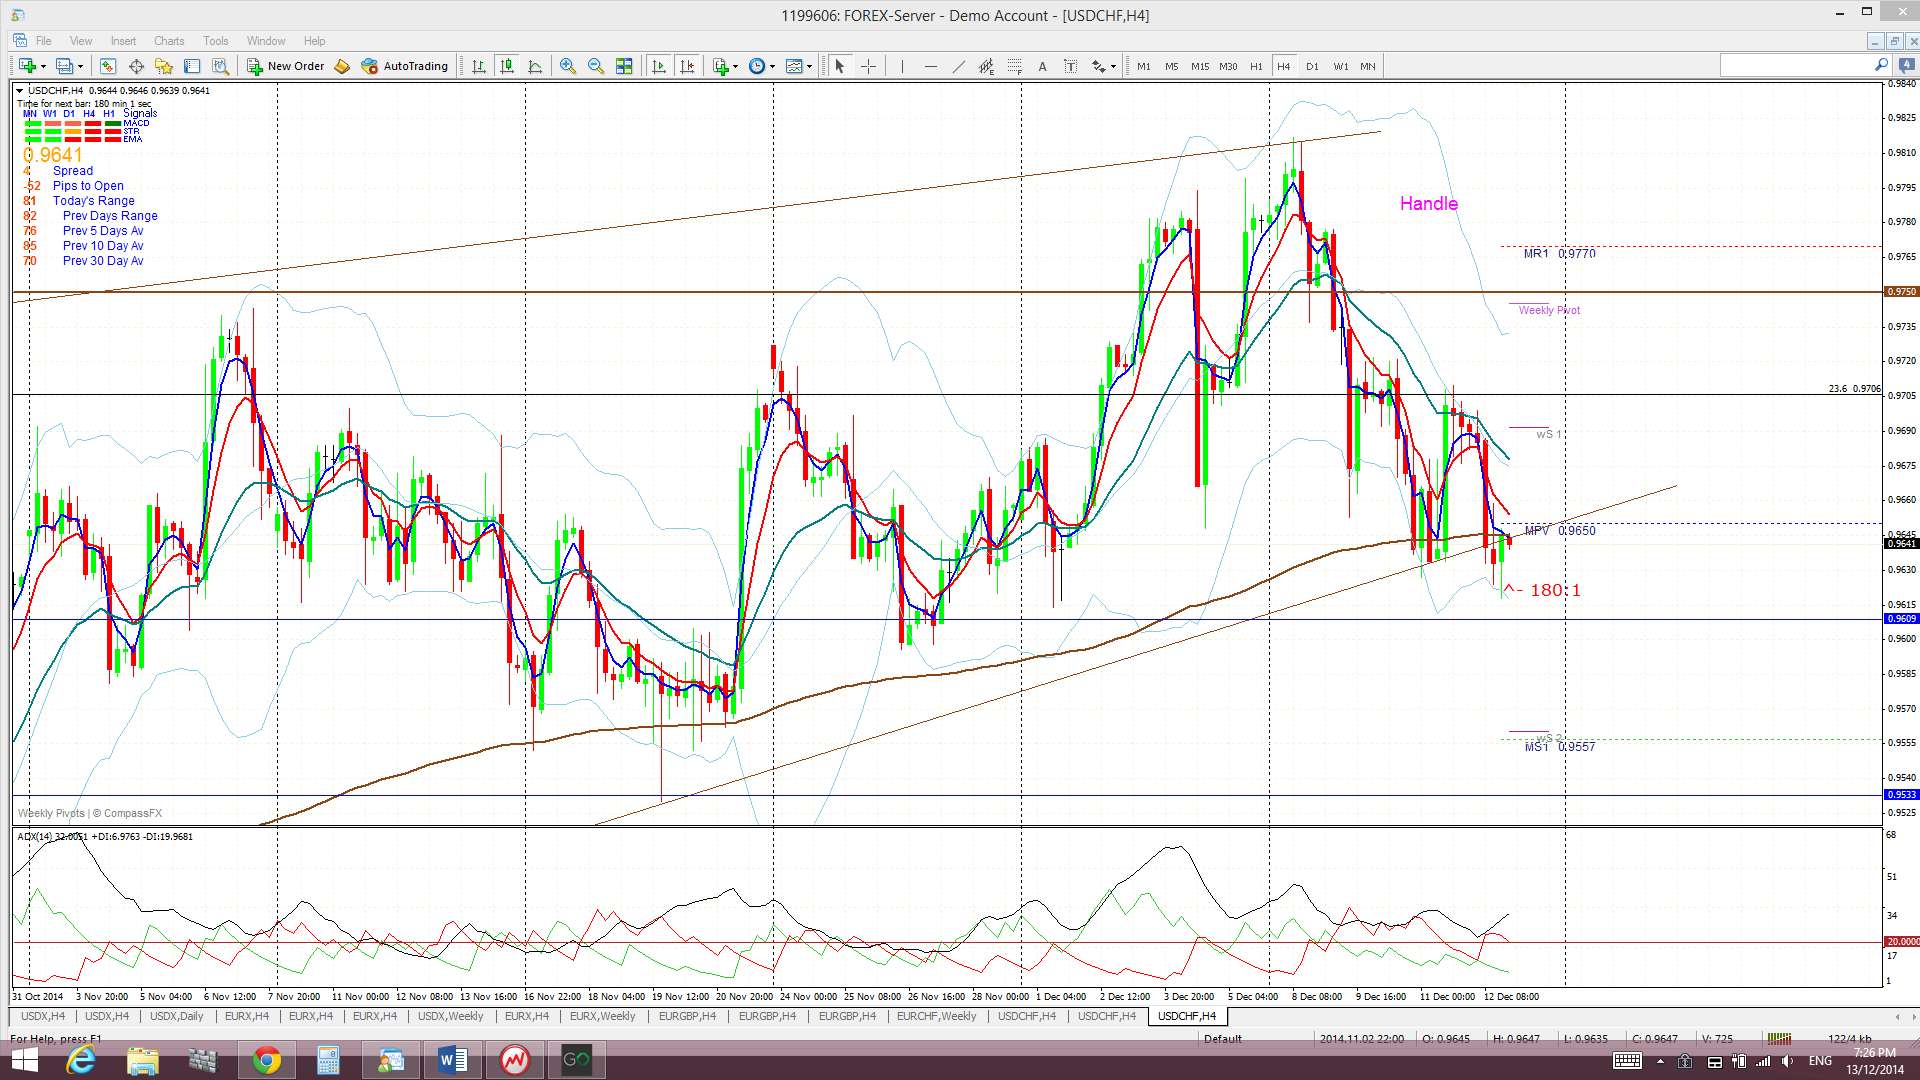
USD/CHF: The Swissie continued to trade within the ‘Handle’ of the weekly chart’s bullish Cup ‘n’ Handle pattern for most of last week. However, USD weakness saw price move lower and close just below the bottom trend line of this pattern. It is worth noting that this bearish move didn’t trigger any new TC signal.
The other technical feature of note here is the inflection-point shift seen on the monthly chart. A 14 year bear trend line was broken back in July and this major shift was associated with strong momentum, as reflected by the ADX. This polarity shift alone supports a long trade focus but I continue to wait for any ‘Handle’ breakout of the Cup ‘n’ Handle pattern!
The Swissie is now trading below the Cloud on the 4hr chart but above the Cloud on the daily, weekly and monthly charts. The more interesting chart is the monthly Ichimoku chart with the Swissie trading above the Cloud. There was one brief pop above the Cloud in 2010 but prior to that you’d have to go back to 2002 to see price trading above the monthly Cloud!
The weekly candle closed as a large bearish, almost engulfing, candle.
- I’m watching for any new TC signal and the ‘Handle’ trend lines.
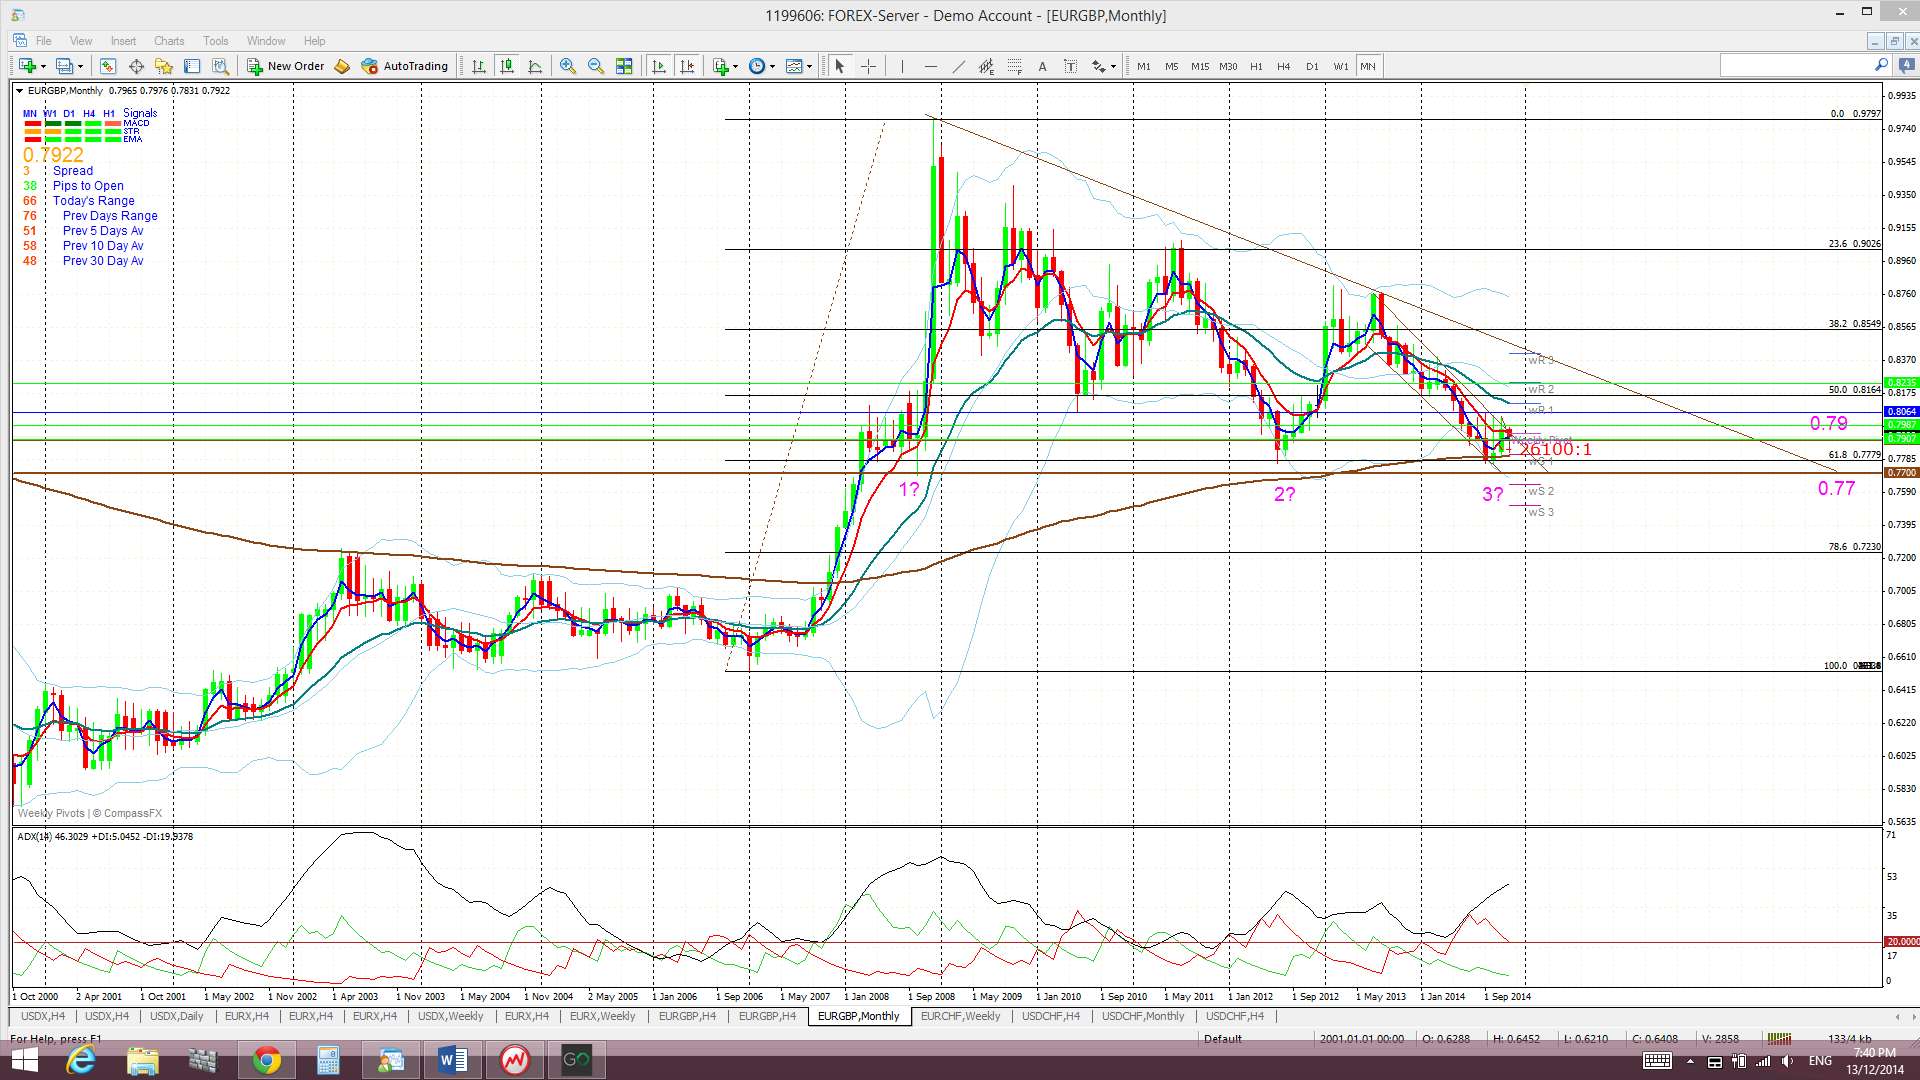
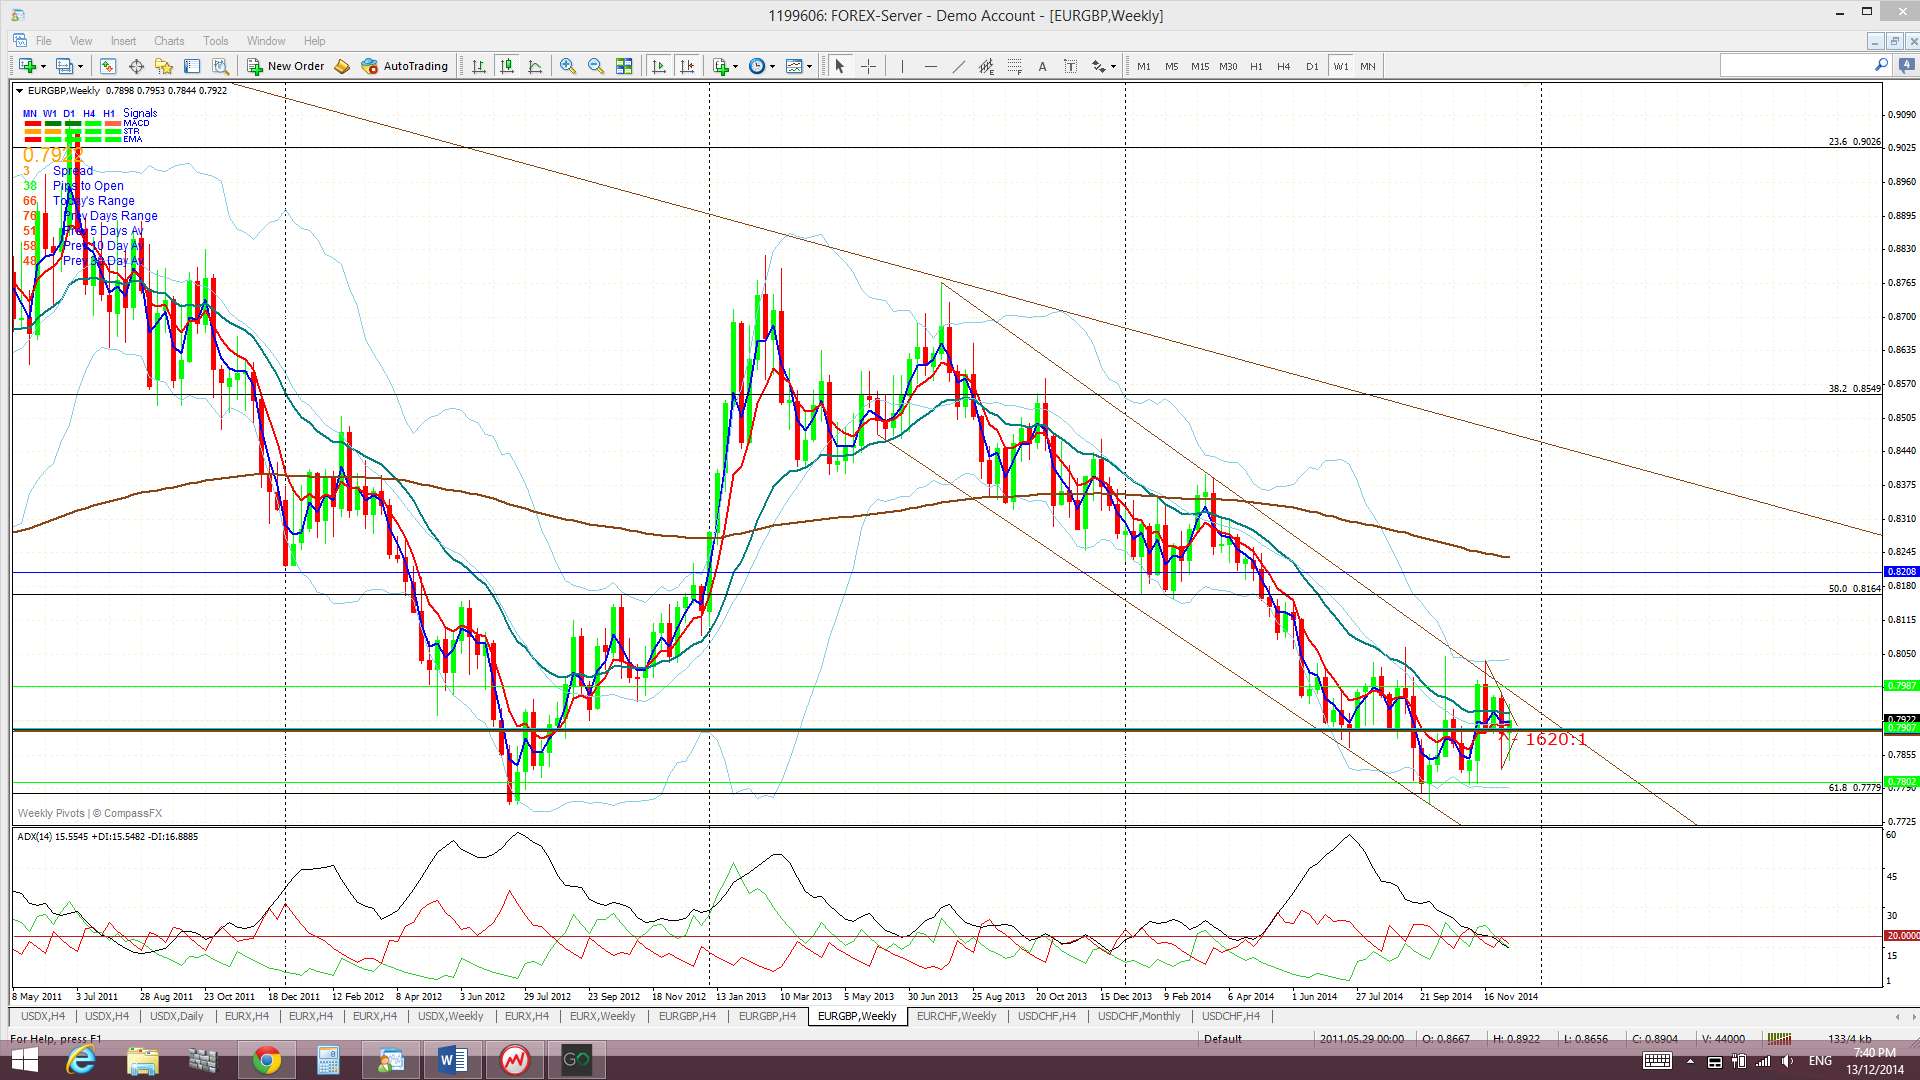
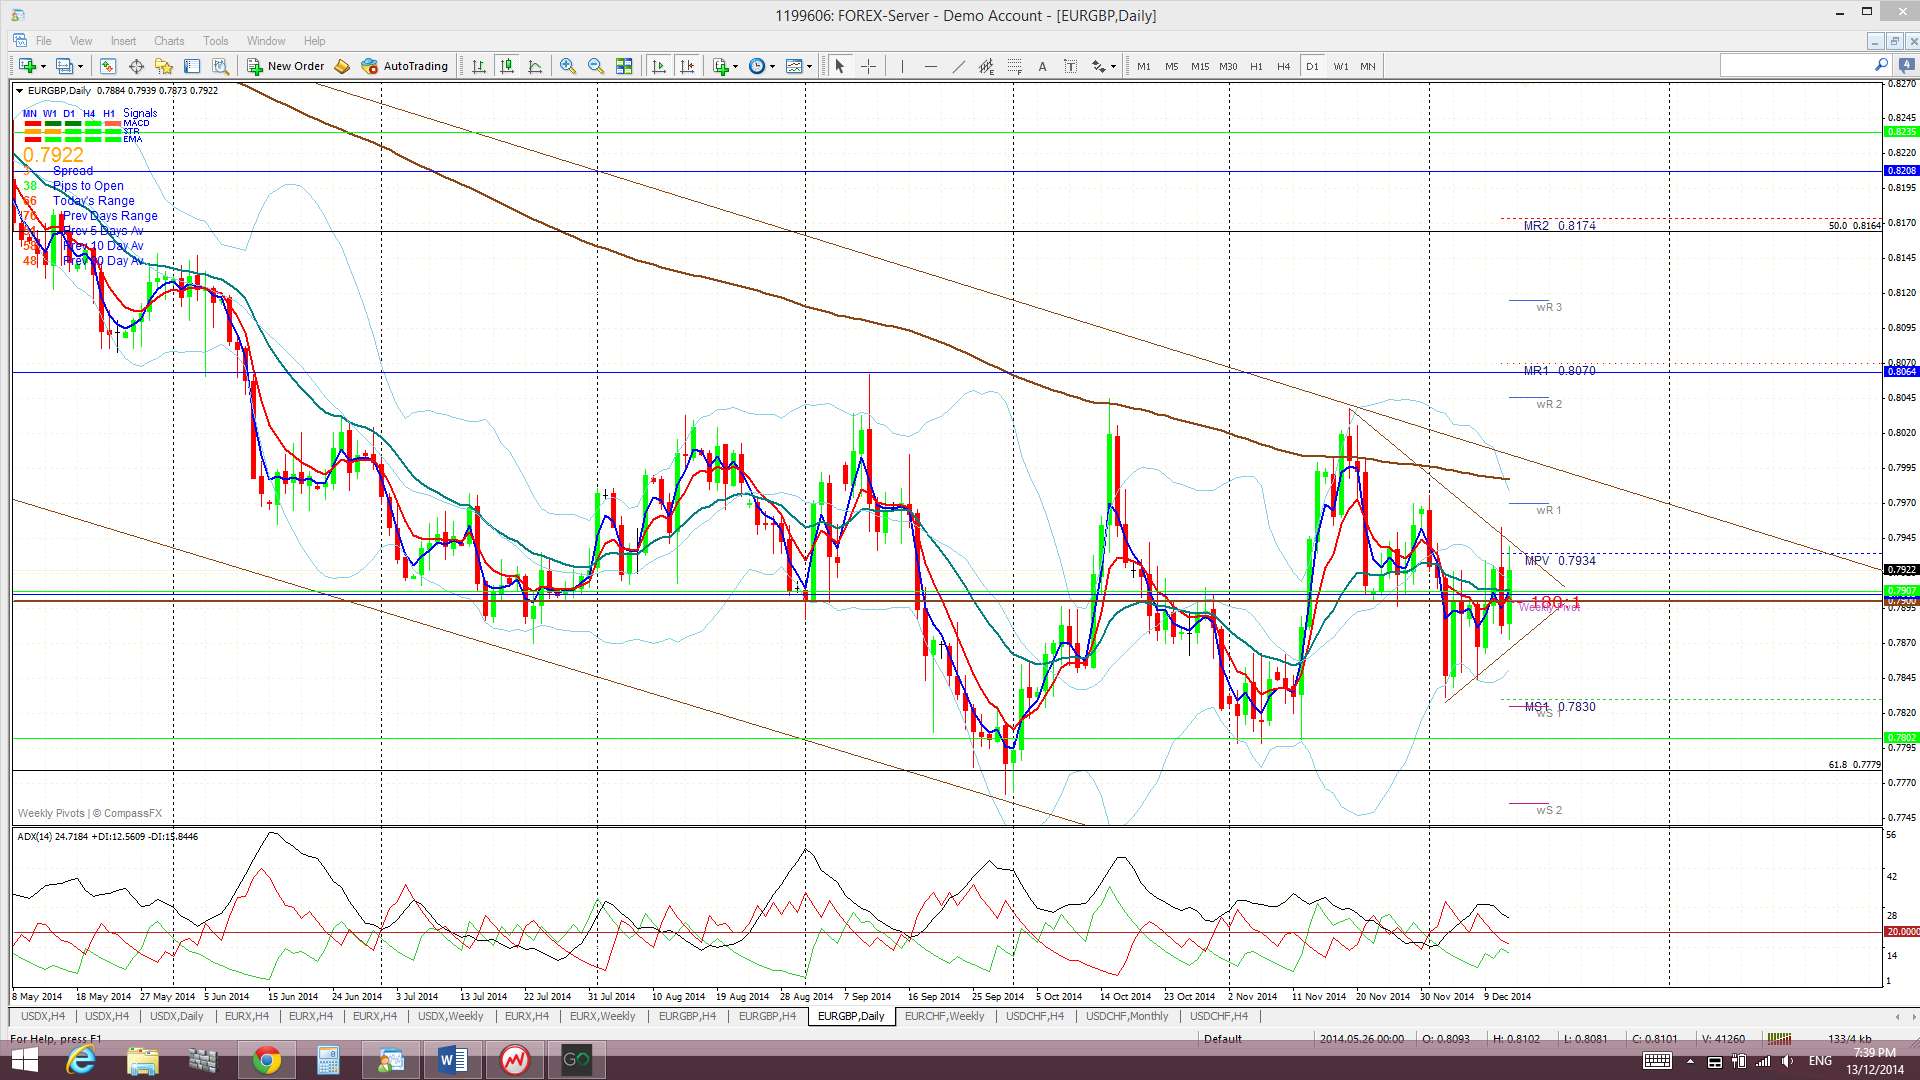
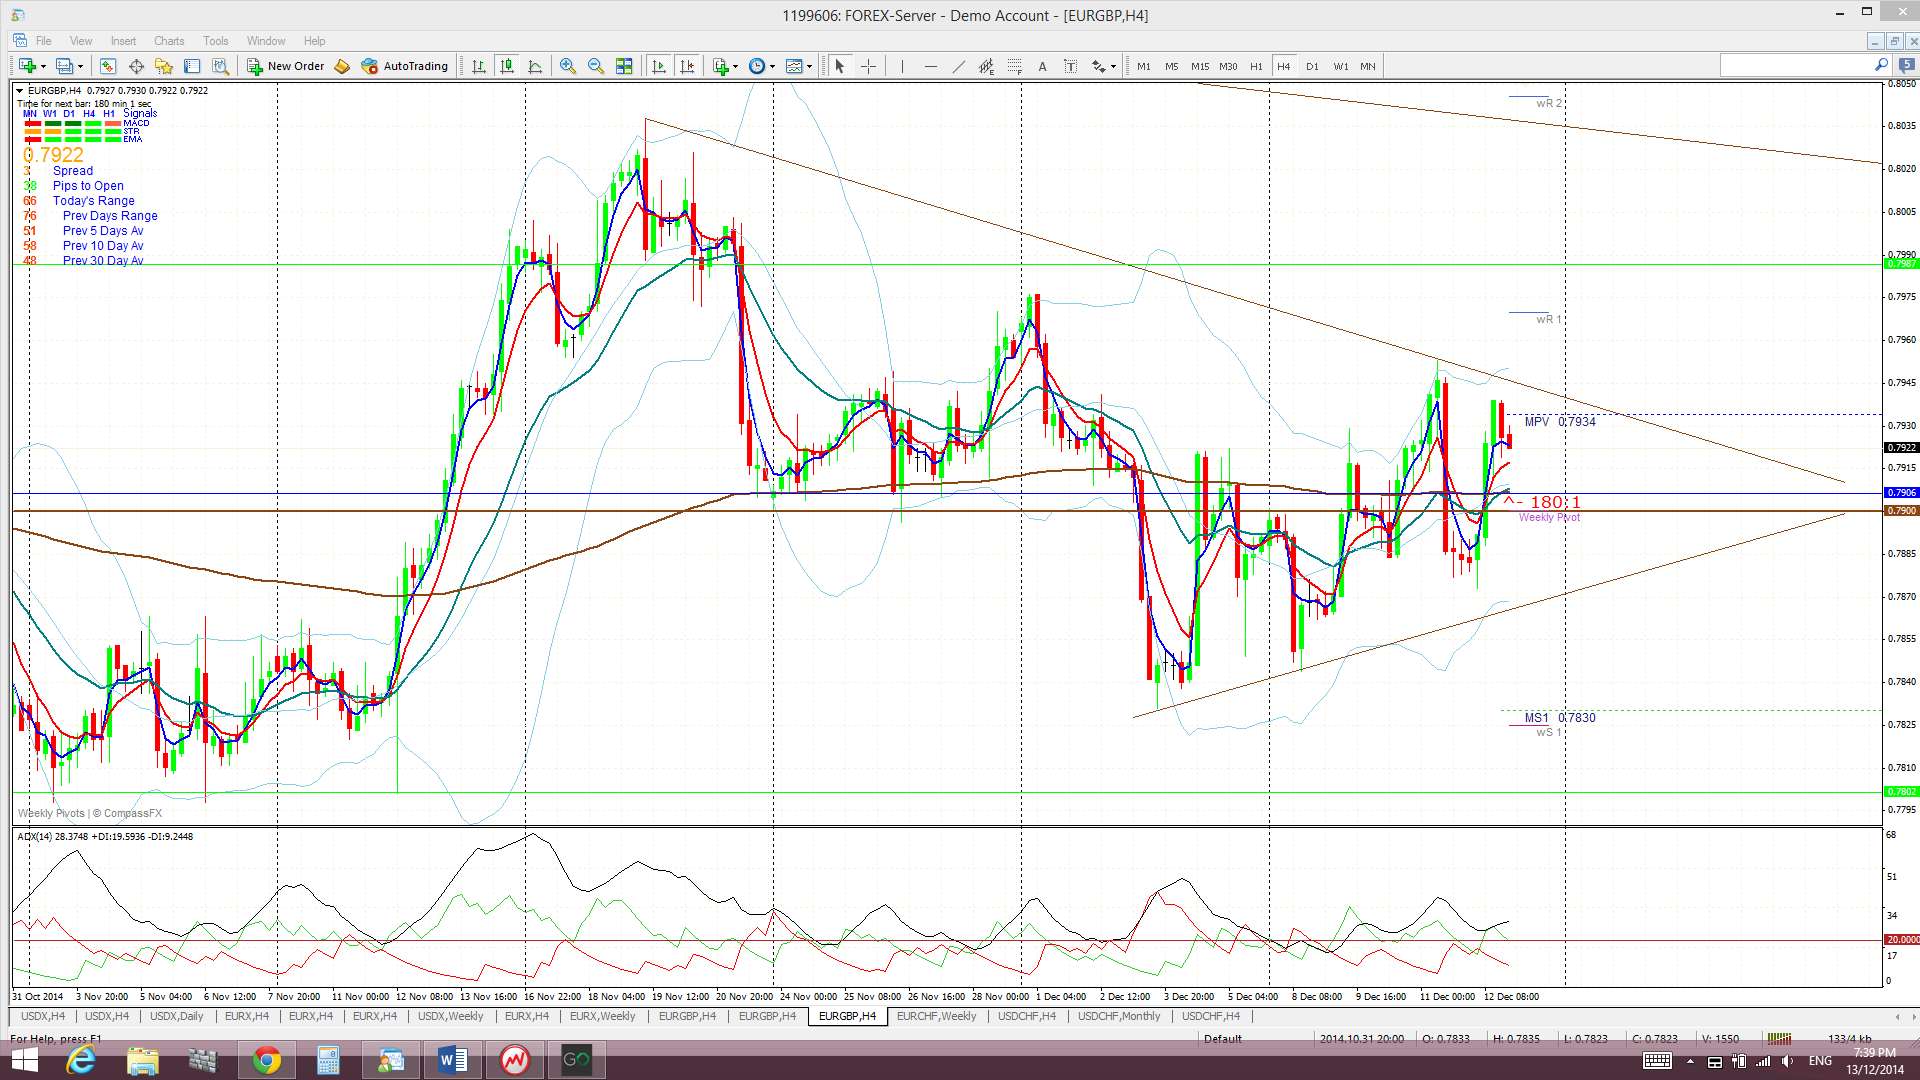
EUR/GBP: This pair failed in one triangle breakout attempt last week but is setting up within another such triangle that has a midpoint near the key 0.79 level.
This 4hr chart triangle is set within a weekly chart descending trading channel and that is set within a monthly chart descending triangle. This pair is geometric if nothing else!
The E/G is trading above the Cloud on the 4hr and daily charts but below the Cloud on the weekly and monthly charts.
The weekly candle closed a small bullish candle with long upper and lower shadows.
- I’m watching for any new TC signal and the 4 hr chart’s triangle trend lines.
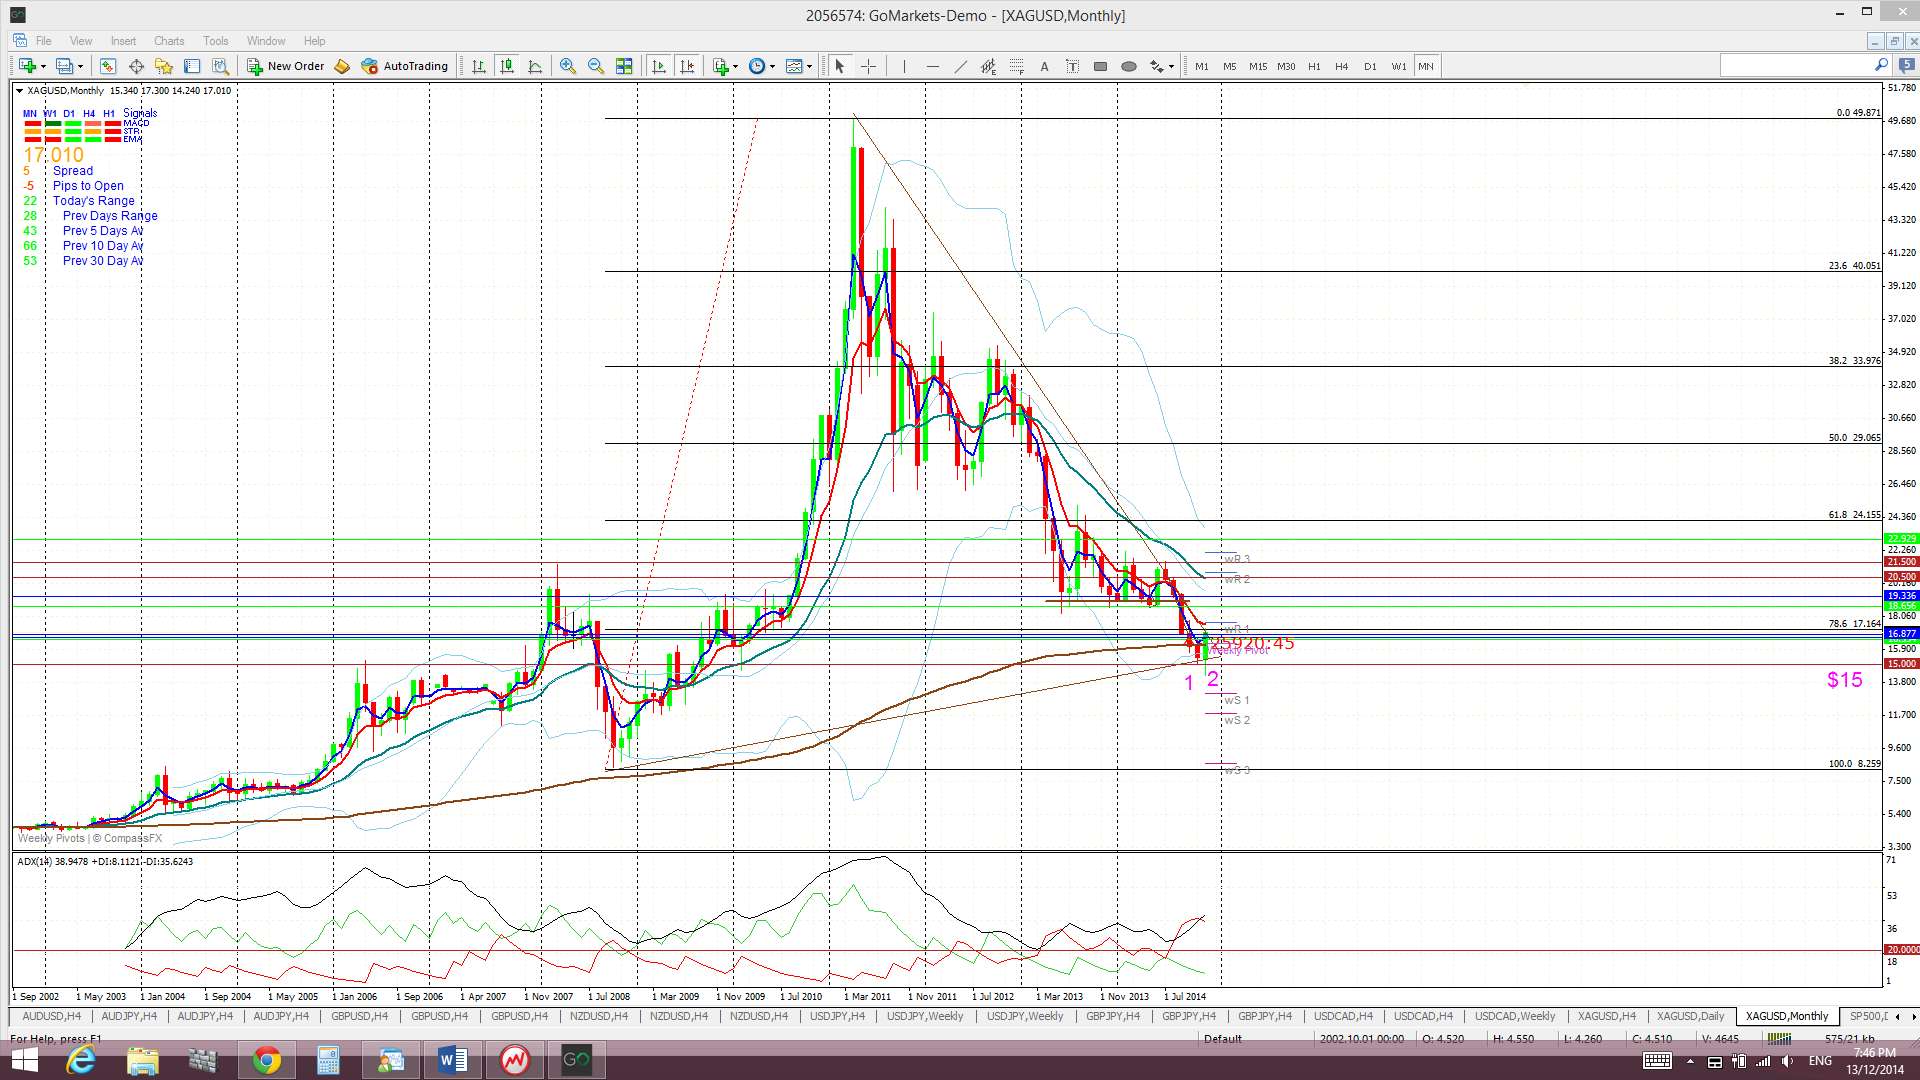
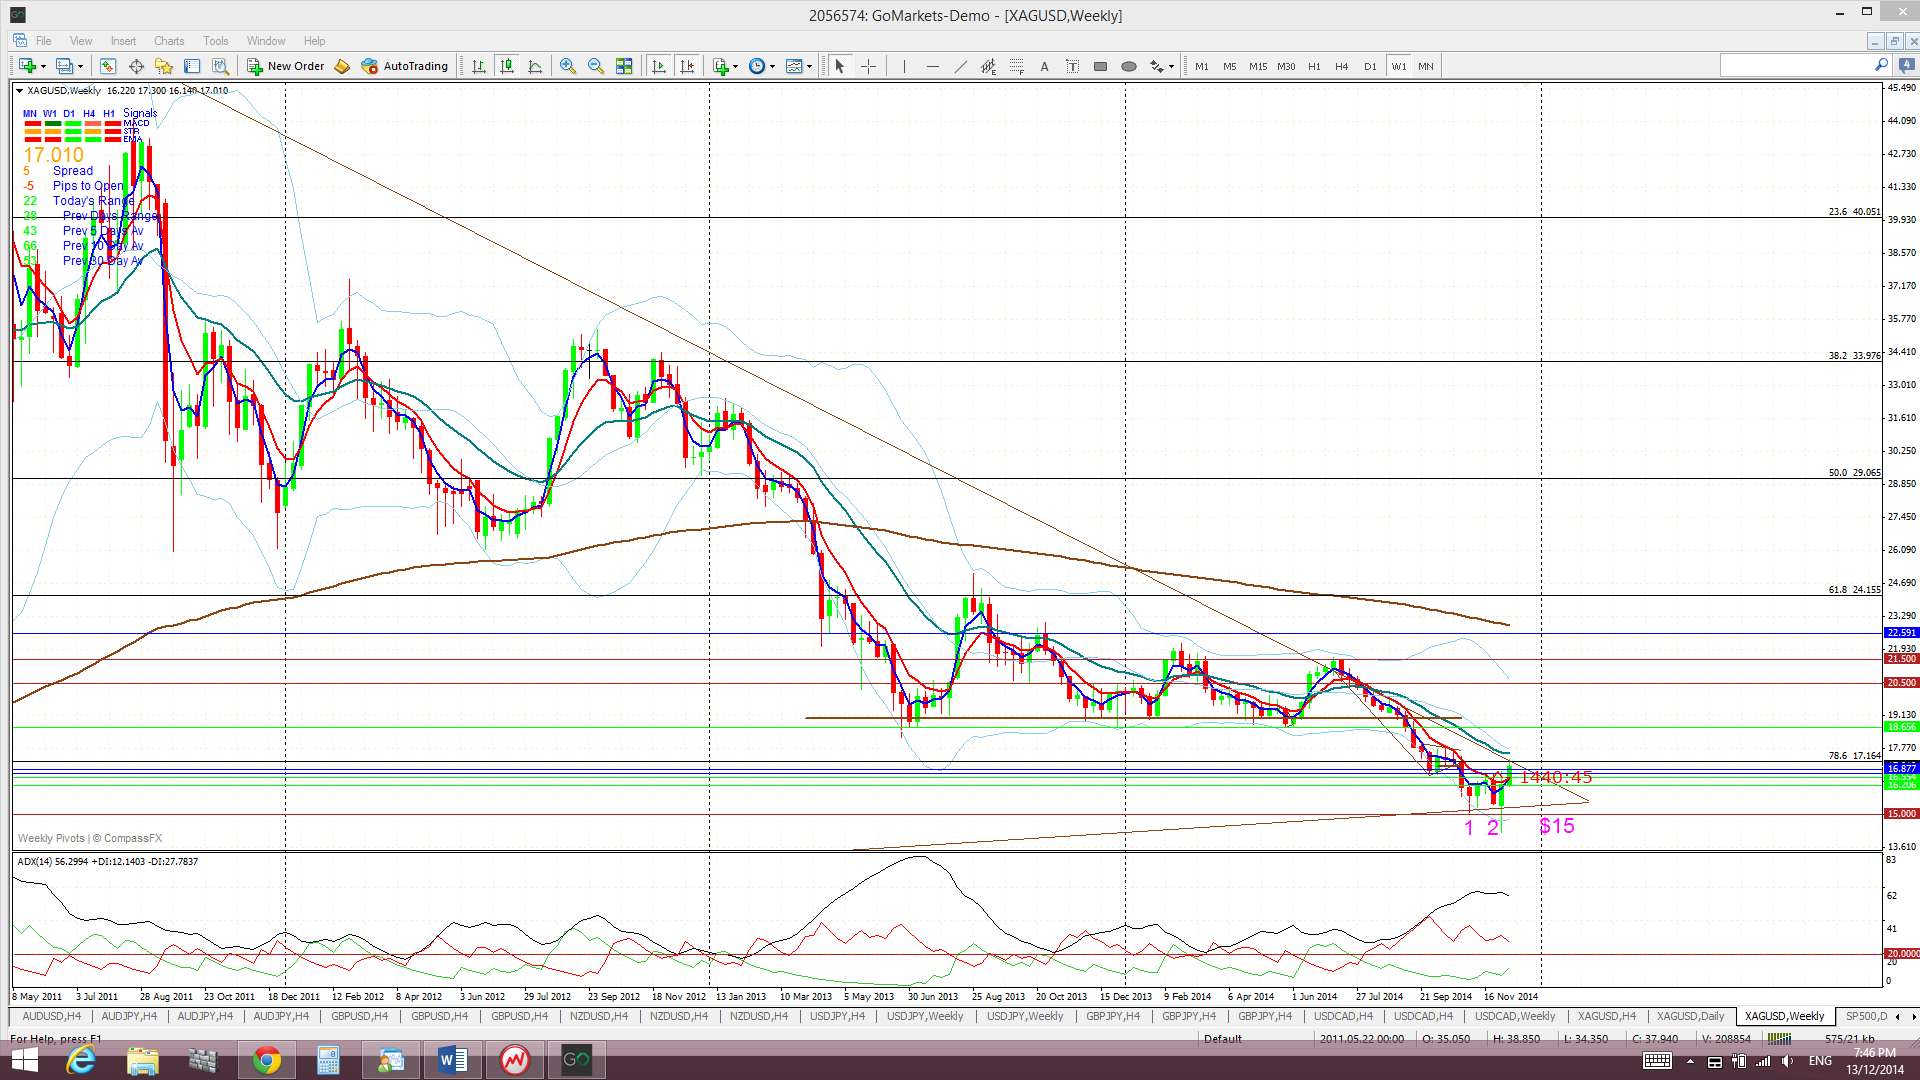
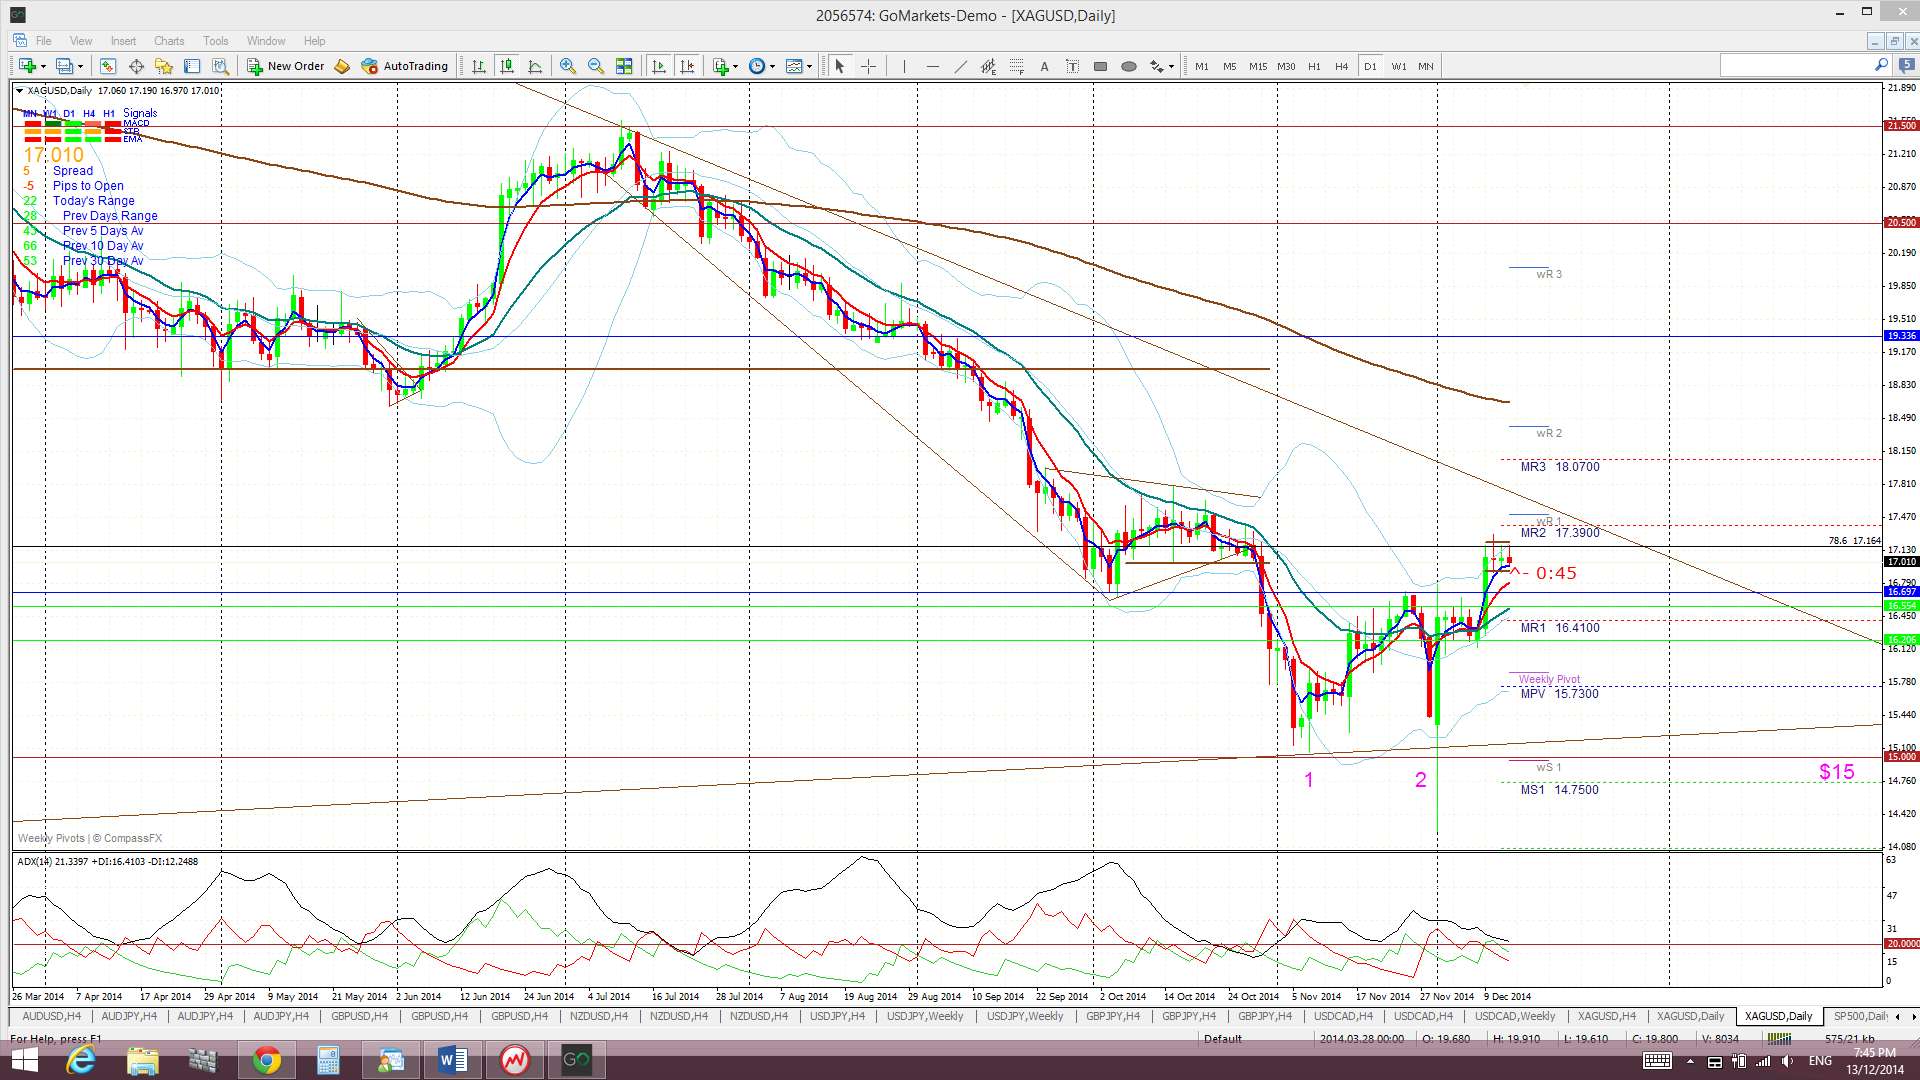
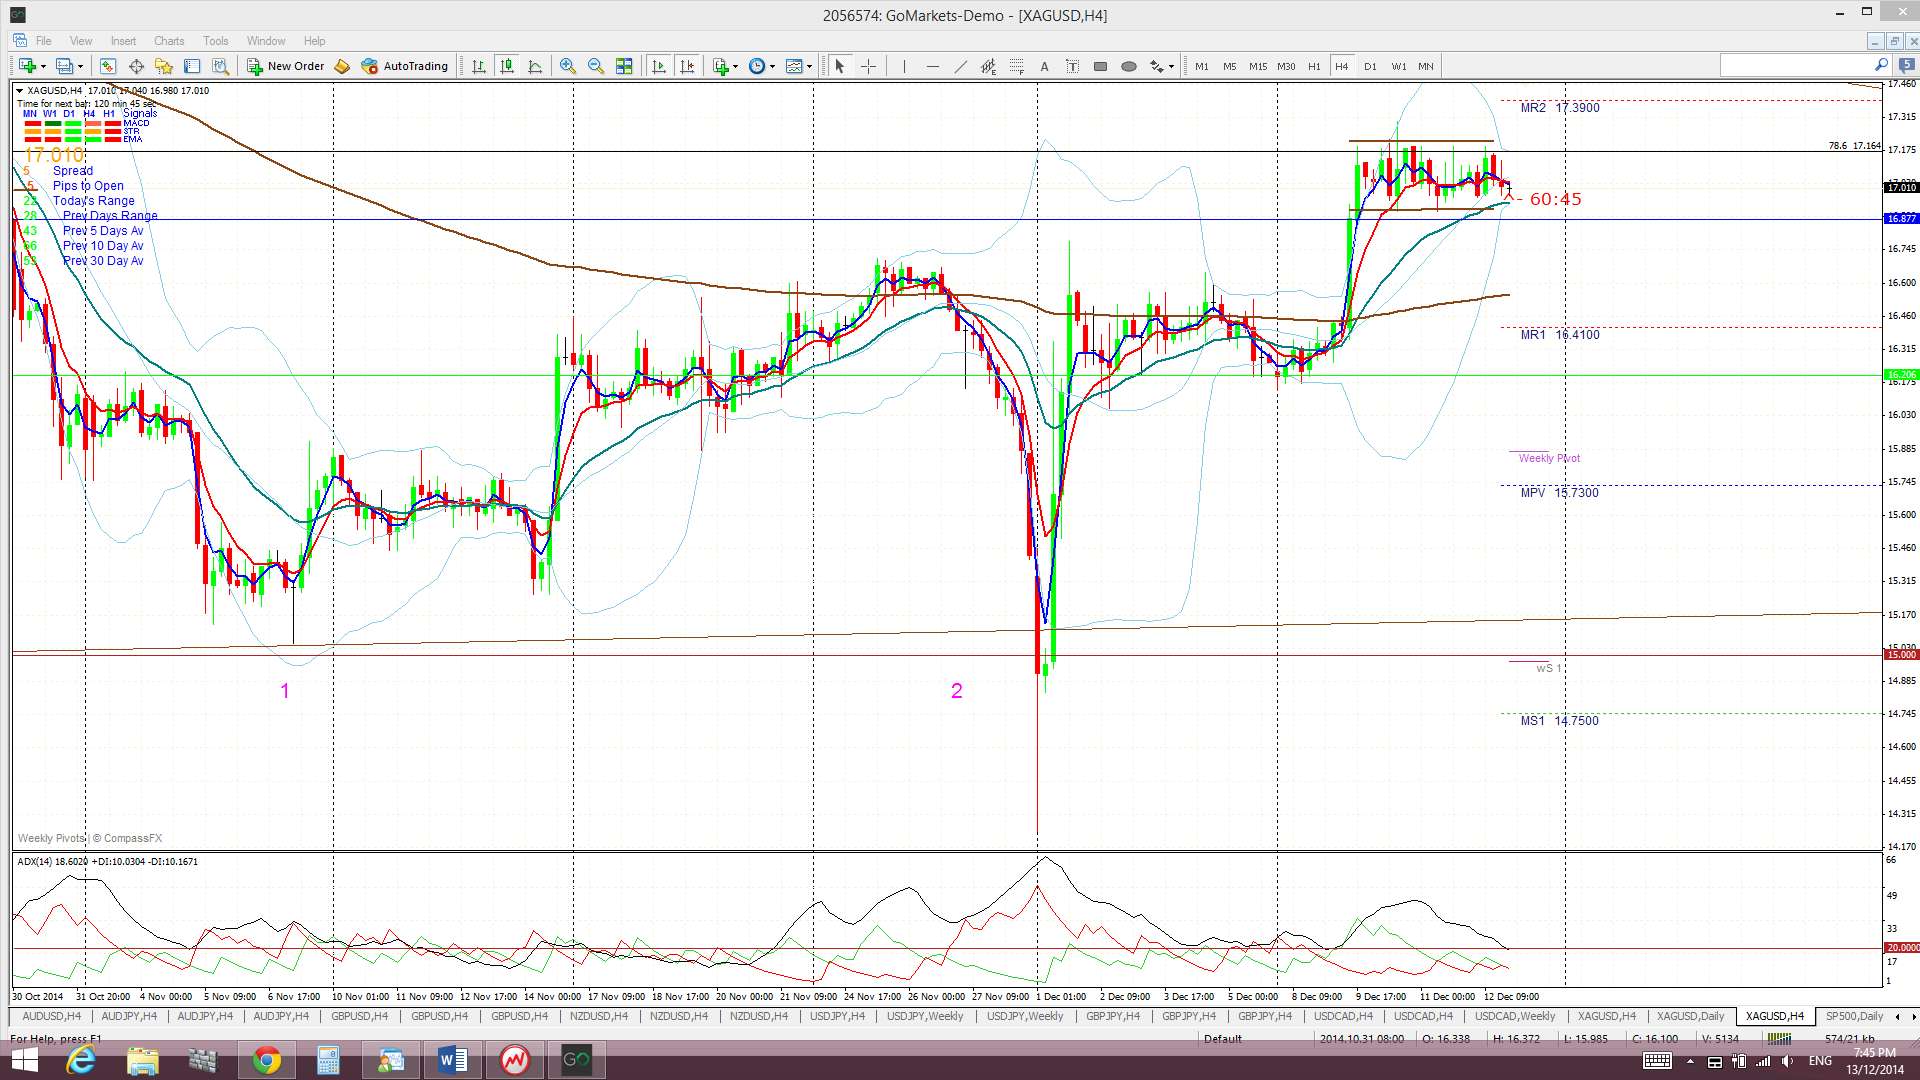
Silver: Silver had a bullish week and the weekly chart’s ‘Double Bottom’ is looking more convincing. This bullish pattern has formed up off the major support of the $15 level.
Silver is also only about 50 pips below a major bear trend line that has been in effect for almost four years; since the 2011 highs. Any close and hold above this trend line would suggest a significant polarity shift for Silver.
Silver is trading above the Ichimoku Cloud on the 4hr chart, in the Cloud on the daily chart but below the Cloud on the weekly and monthly charts.
The weekly candle closed as a bullish candle.
- I’m watching for any new TC signal, the $15 level and the daily Cloud and monthly chart’s bear trend line.
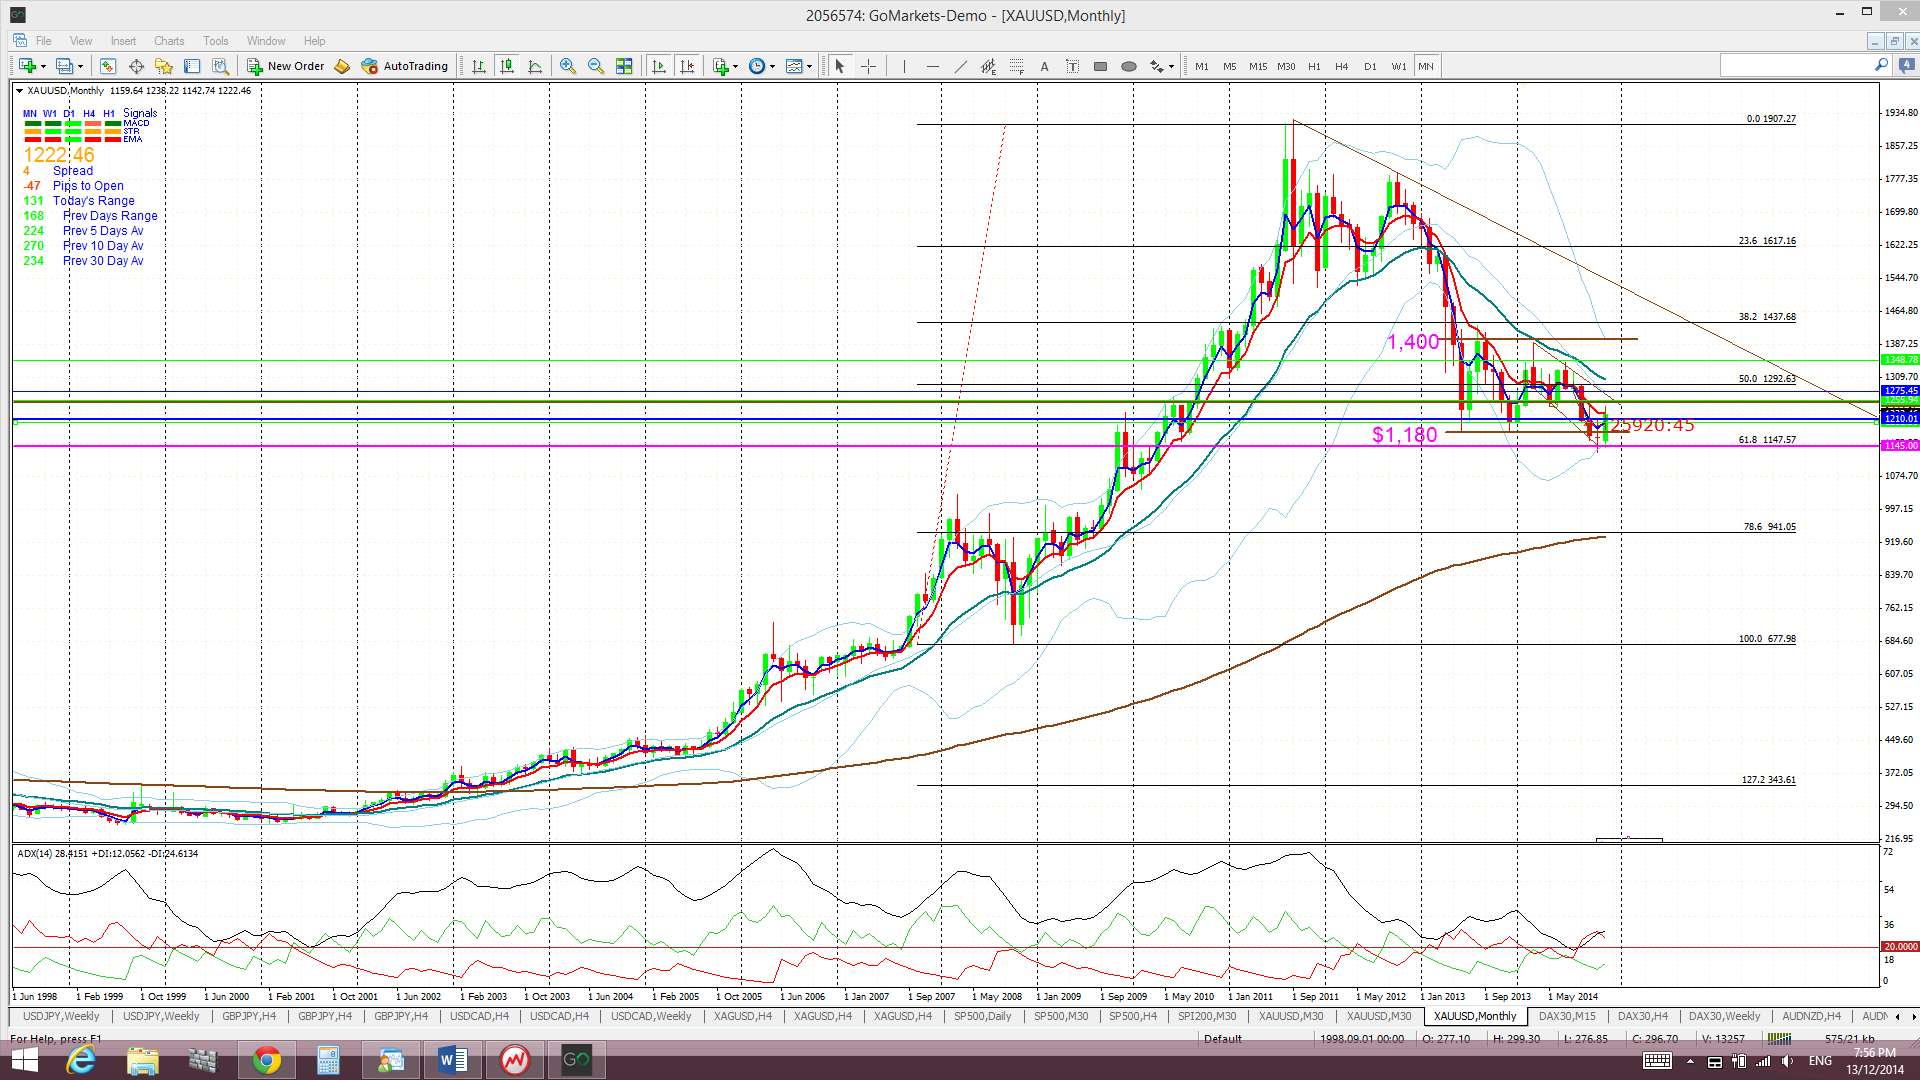
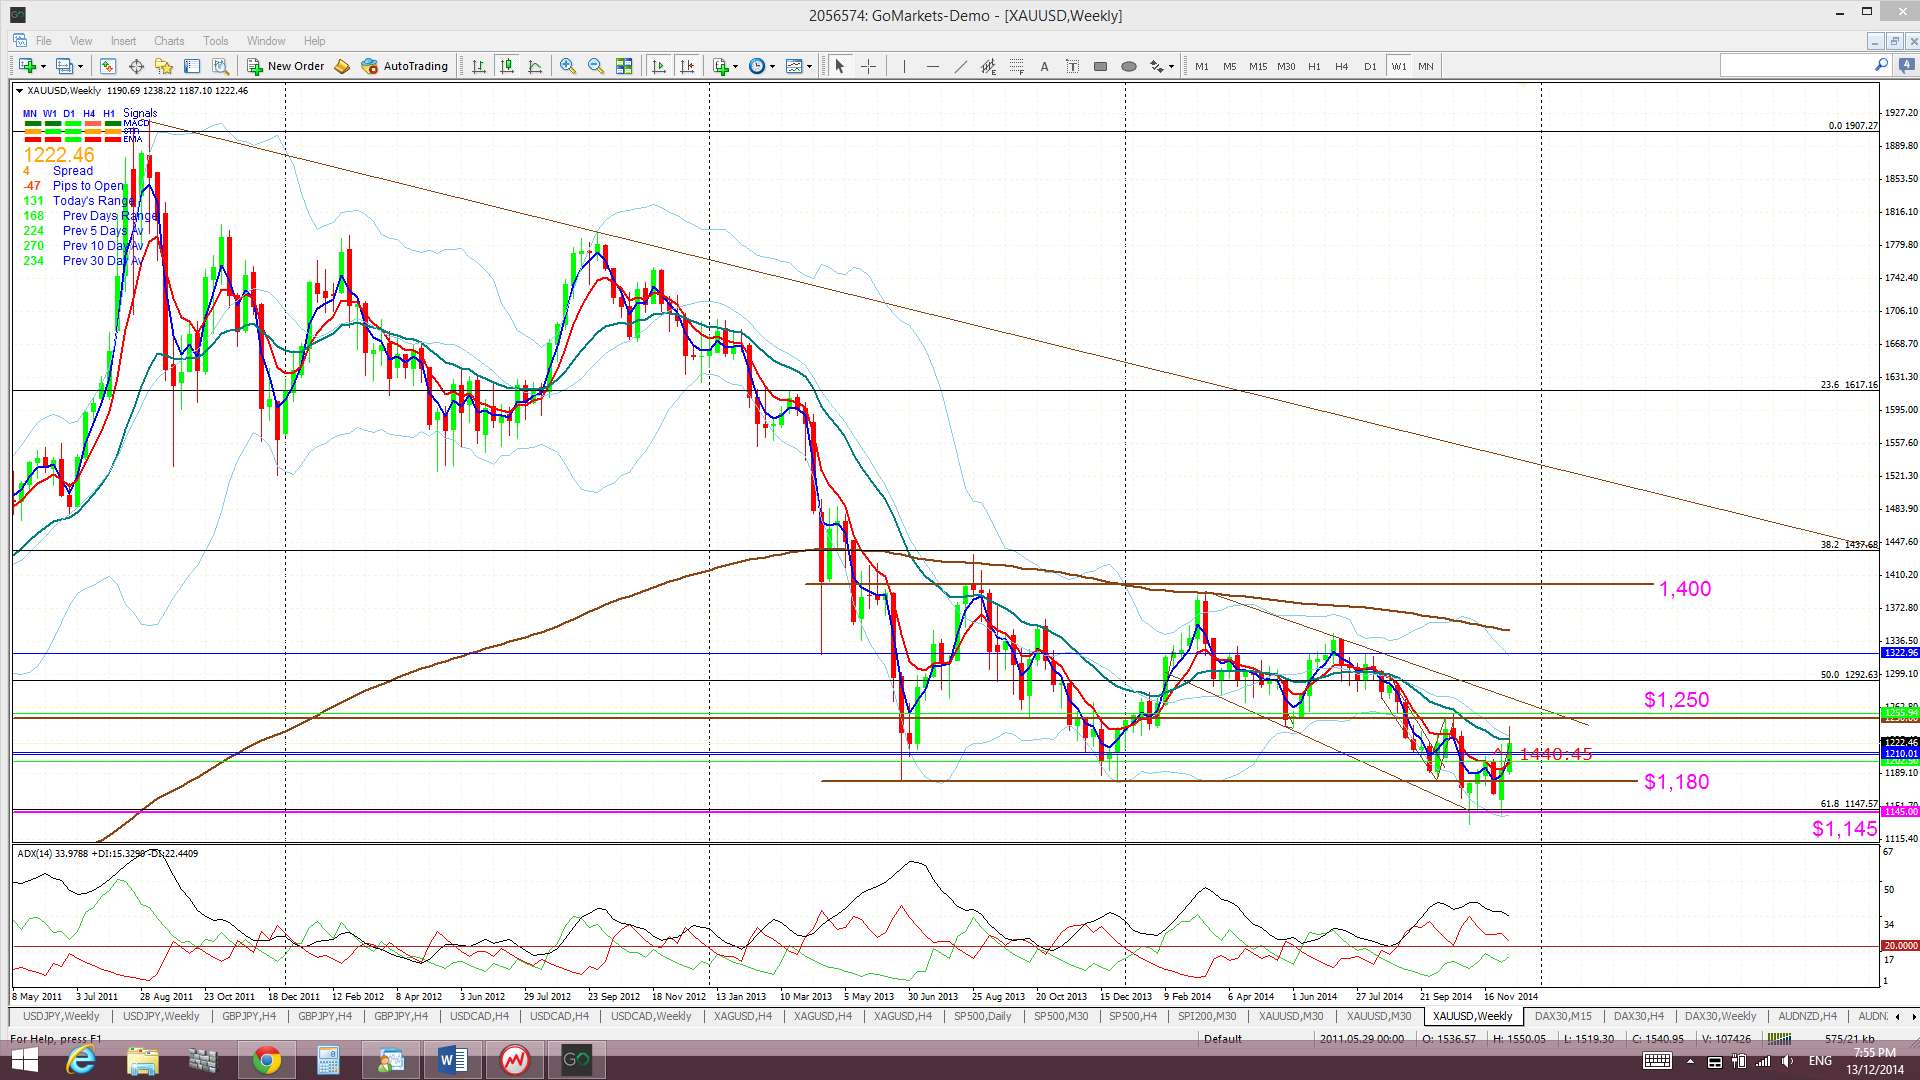
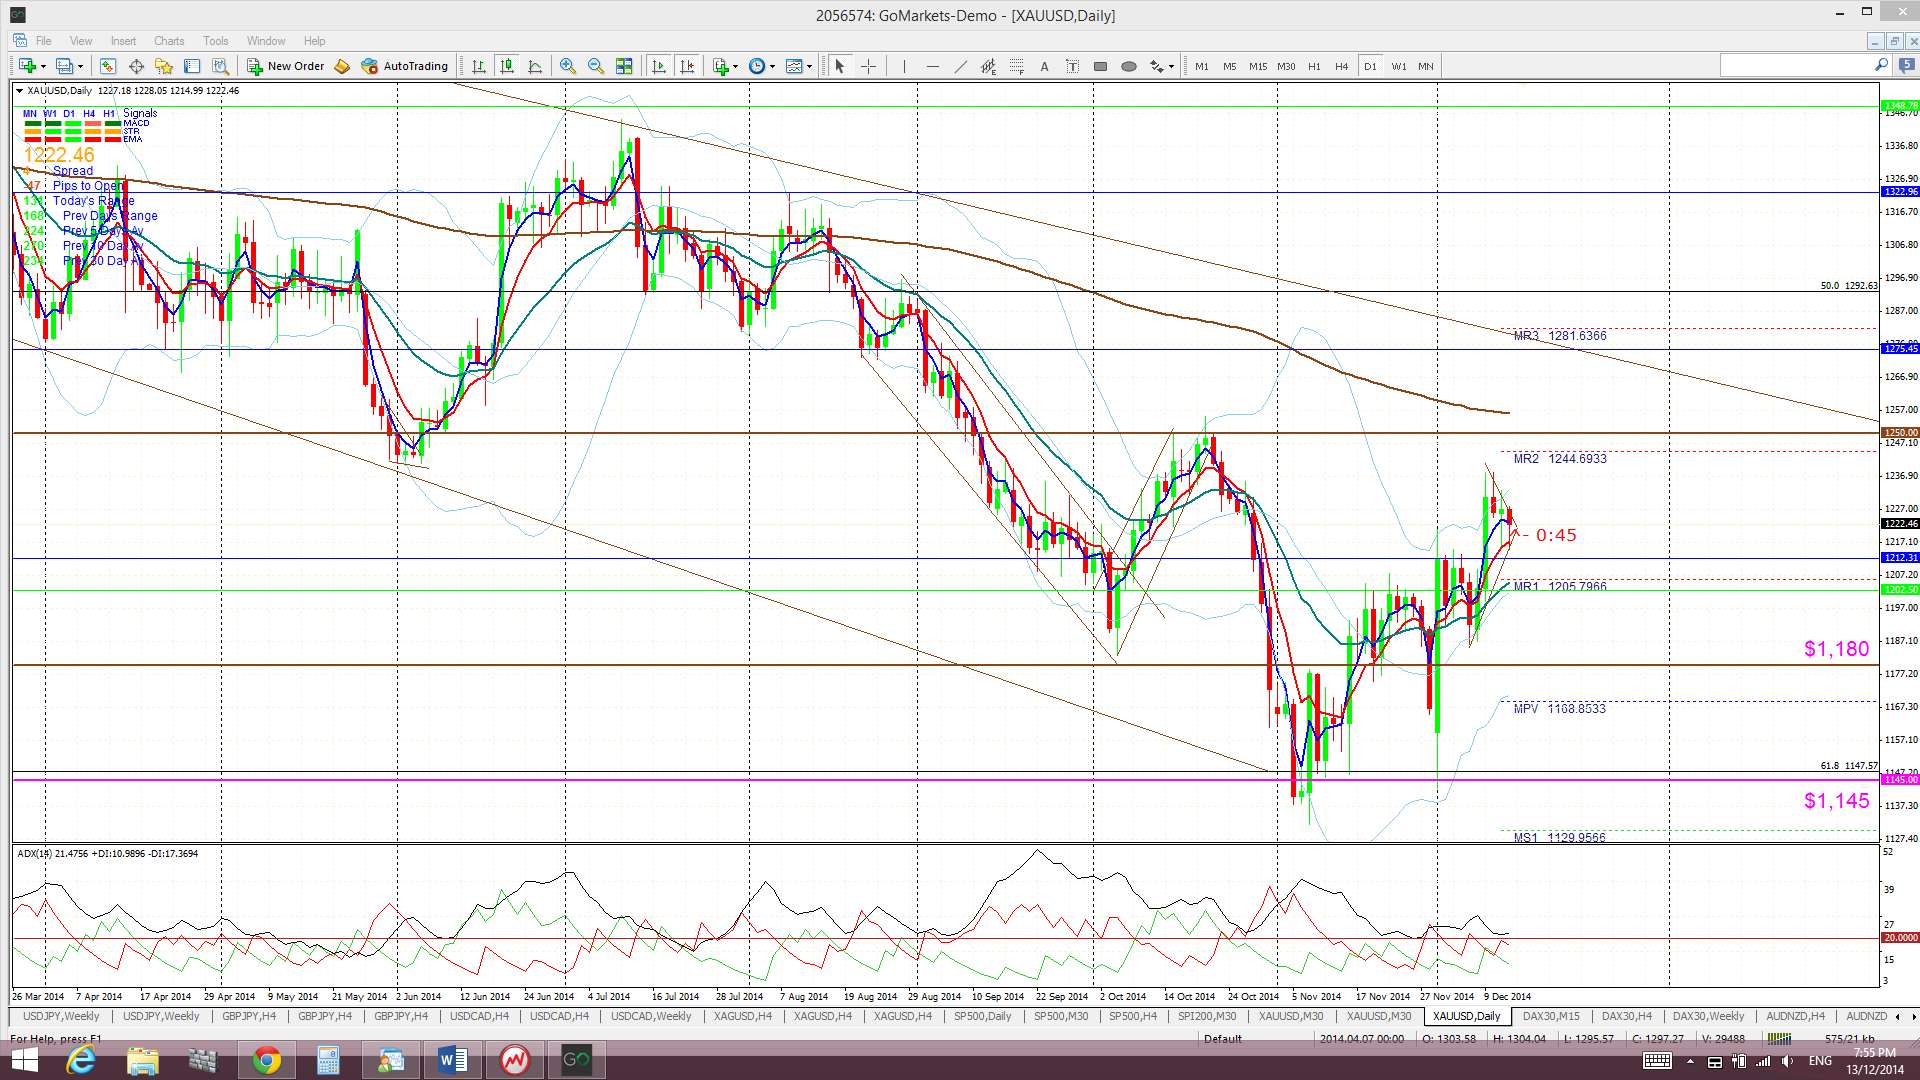
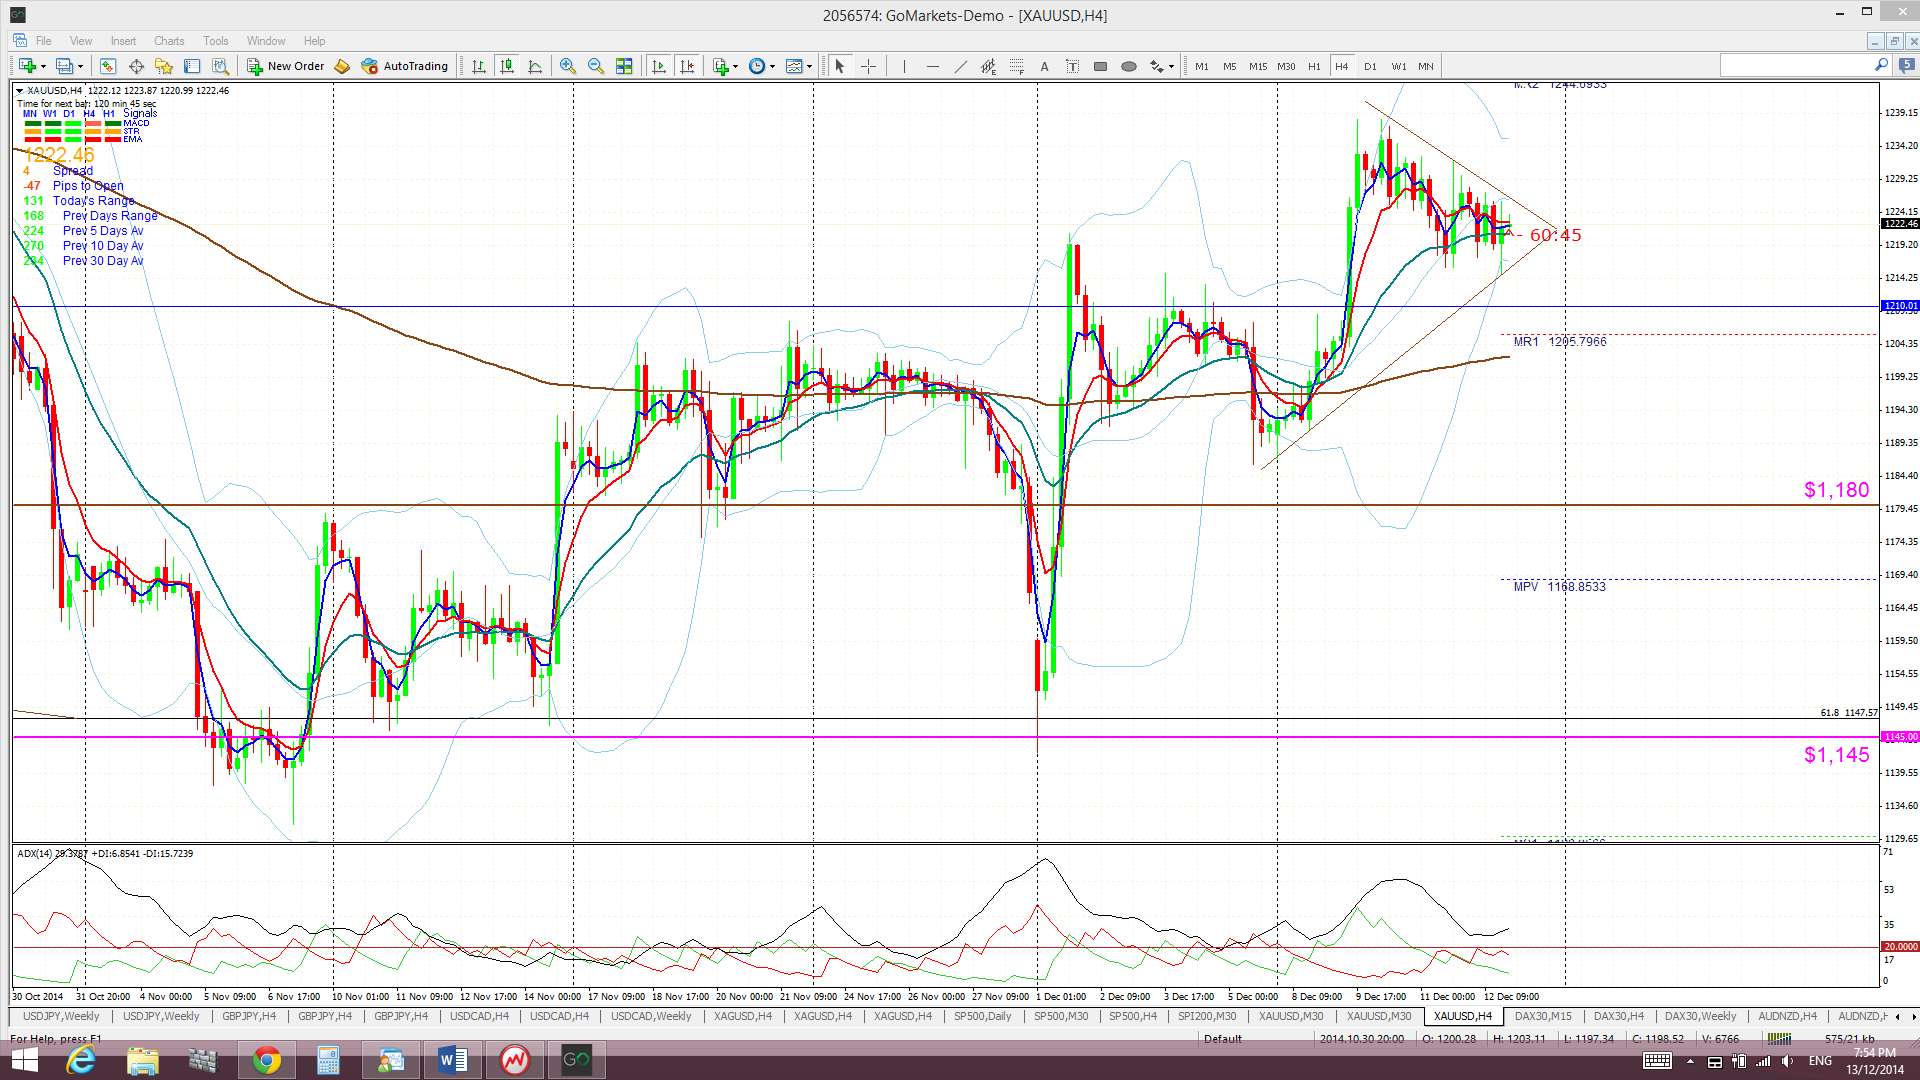
Gold: Price chopped higher last week and formed up within a triangle pattern on the 4hr chart. This triangle is set within a descending trading channel on the weekly chart. The weekly chart of Gold, like that for Silver, shows that this metal also seems to have formed a bullish ‘Double Bottom’ off major support. Support here comes from the $1,145 level.
Gold is trading above the Ichimoku Cloud on the 4hr and daily charts but is below the Cloud on the weekly and monthly charts.
The weekly candle closed as a bullish candle.
This week’s US CPI and FOMC may have a significant effect on the USD which could, in turn, impact heavily on both Gold and Silver. Commodity traders need to keep an eye on the reaction to both of these news events.
- I’m watching for any new TC signal on this pair, the 61.8% fib near $1,145 level and the $1,180 level.
The post FX moves at the mercy of the USD, CPI and FOMC? appeared first on www.forextell.com.