Last week: It was another choppy week again with FOMC doing little to help clear up the uncertainty with the range-bound USD. There was only one valid TC signal on the U/J that lost 50 pips and another weaker signal on the A/J for a loss of 40 pips. I will record these as a loss even though I had advised against these two signals. Stocks have taken centre stage though as rallies continue across the globe.
This week:
The USD and EUR indices are both trading within consolidation style triangle patterns on their 4hr / daily charts and I don’t believe we will see any decent FX trends return until there is a breakout on one or both indices. A review of the FX Indices can be found through the following link.
Many FX currency pairs are similarly consolidating in sideways trading patterns and thus have the potential to breakout either way depending on how the USD and EUR react to news items in the coming week. There are two key news items to watch out for in the coming week:
- The outcome of a potential Greek-debt deal may lift EUR pairs BUT there is further negotiation scheduled for early next week.
- The key risk event for the USD will be the Fed Chair testimony on the economy and monetary policy. This event will be closely watched by many as they try to understand just when US interest rates are likely to rise. Traders need to monitor how this testimony impacts the USD.
There are other risk events for the EUR as well next week including speeches from ECB President Draghi, the Targeted LTRO news and the ‘Yin and Yang’ movement that may flow as a result of any USD reaction following the Janet Yellen testimonies.
The EUR/USD, AUD/USD, GBP/USD and NZD/USD have all been punished over recent months and have potential bearish patterns forming on their monthly charts. This week may prove pivotal for these pairs as any breakout on the USDX and EURX may define the next major direction for these pairs. Any reversal with the USD rally and favourable Greek-debt news could undermine these bearish set-ups and trigger bullish bounce/recovery style moves, even if only temporarily. Conversely, any Grexit talk and / or continued USD rally could accelerate losses here. Traders need to be prepared for either outcome.
Loonie: there is Cup ‘n’ Handle pattern looking like it might be trying to form on the USD/CAD. The frustration here might be that there there could be a lot of choppy consolidation action here to form up the ‘Handle’.
Cable: The 1.55 level will be in focus on the GBP/USD in the coming weeks. A break and hold above this would support continued recovery BUT failure might signal the start of a major Bear Flag!
Next Friday is the last day of the trading month so watch for monthly candle formations and for new monthly pivots thereafter.
The NASDAQ and Russell 2000 US stock indices look to be attempting bullish monthly breakouts. The candles won’t be confirmed until after next week BUT, any ‘risk on’ continuation move here could impact risk appetite with currencies pairs as well. Something to watch out for at the end of next week!
Events in the Ukraine and the Middle East, as well as with Greek Debt talks, continue to have the potential to undermine any developing ‘risk’ appetite and need to be monitored.
Stocks and broader market sentiment:
News of a potential Greek debt deal sent US stocks higher on Friday with the S&P500, DJIA and Russell 2000 closing at all-time highs.
The NASDAQ also closed higher and above the key 4,800 level that I have been stalking for months. The NASDAQ has now printed three weekly candles above the key 4,800 level over the last couple of months. The monthly candle won’t close off until next week but the current hold above 4,800 is encouraging. I have written many posts about what I am looking for here. Three of these articles can be found through the links here and here but the most recent article is here.
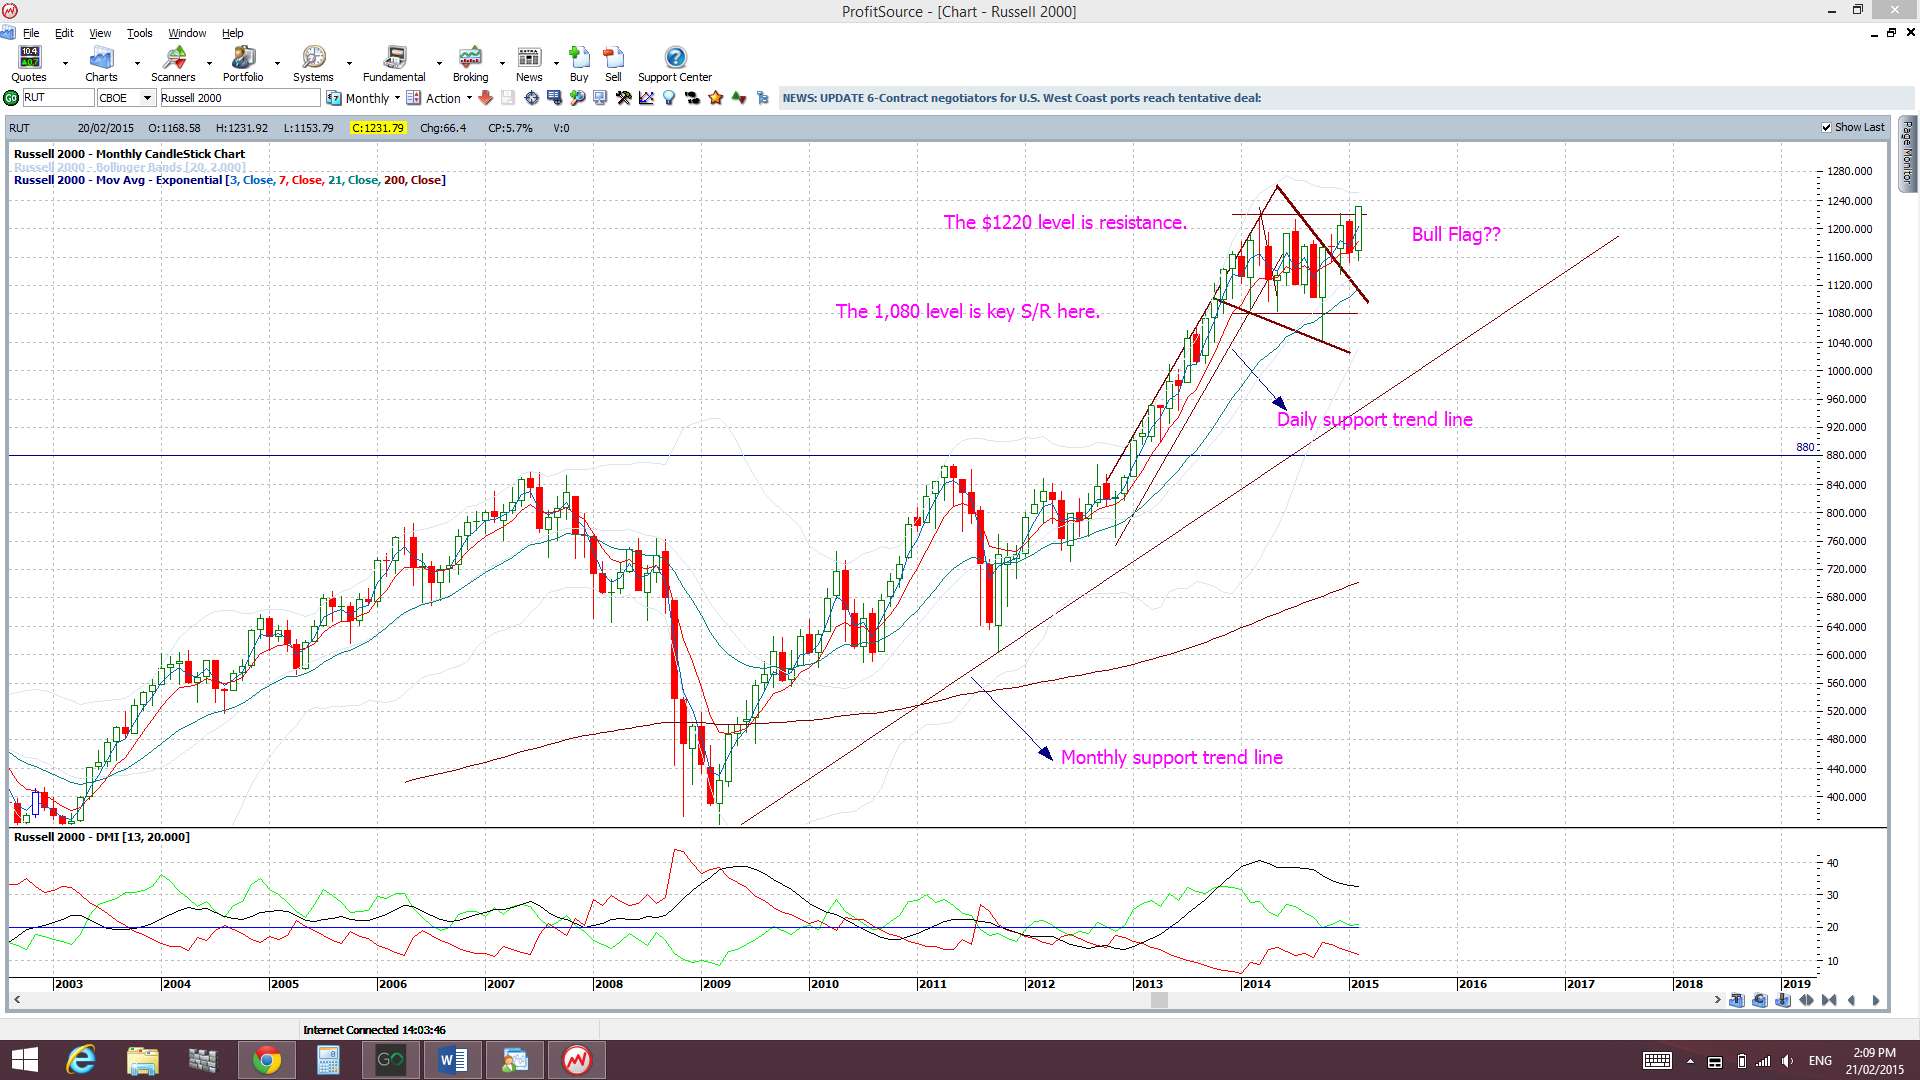
The ‘bellwether’ Russell 2000 has also broken and held above 1,220 resistance for two weeks now and it is hard to see this as a signal of any bearish reversal for US stocks!
Russell 2000:
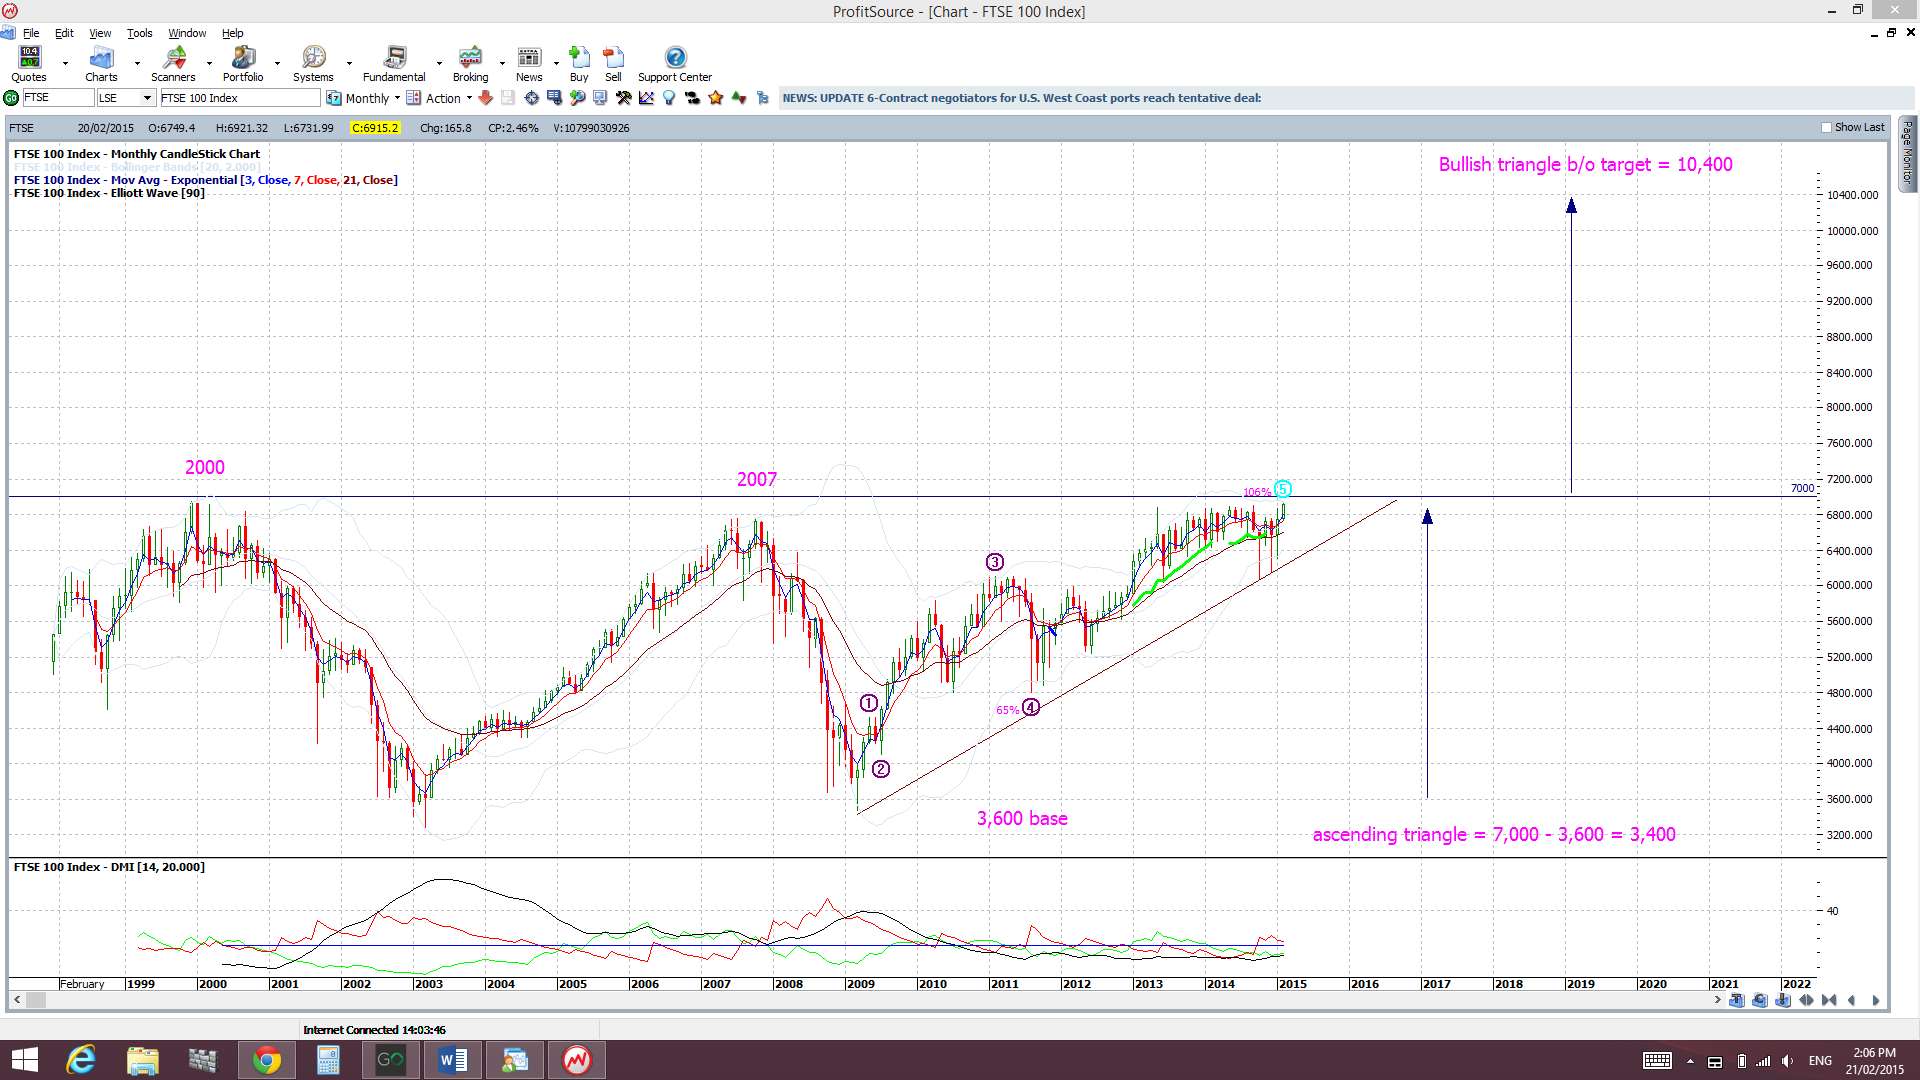
European stock indices have also continued to rally following the ECB’s recent QE and I am still watching for any bullish 7,000 breakout on London’s FTSE index. An article about what I’m looking for here can be found through this link:
FTSE monthly:
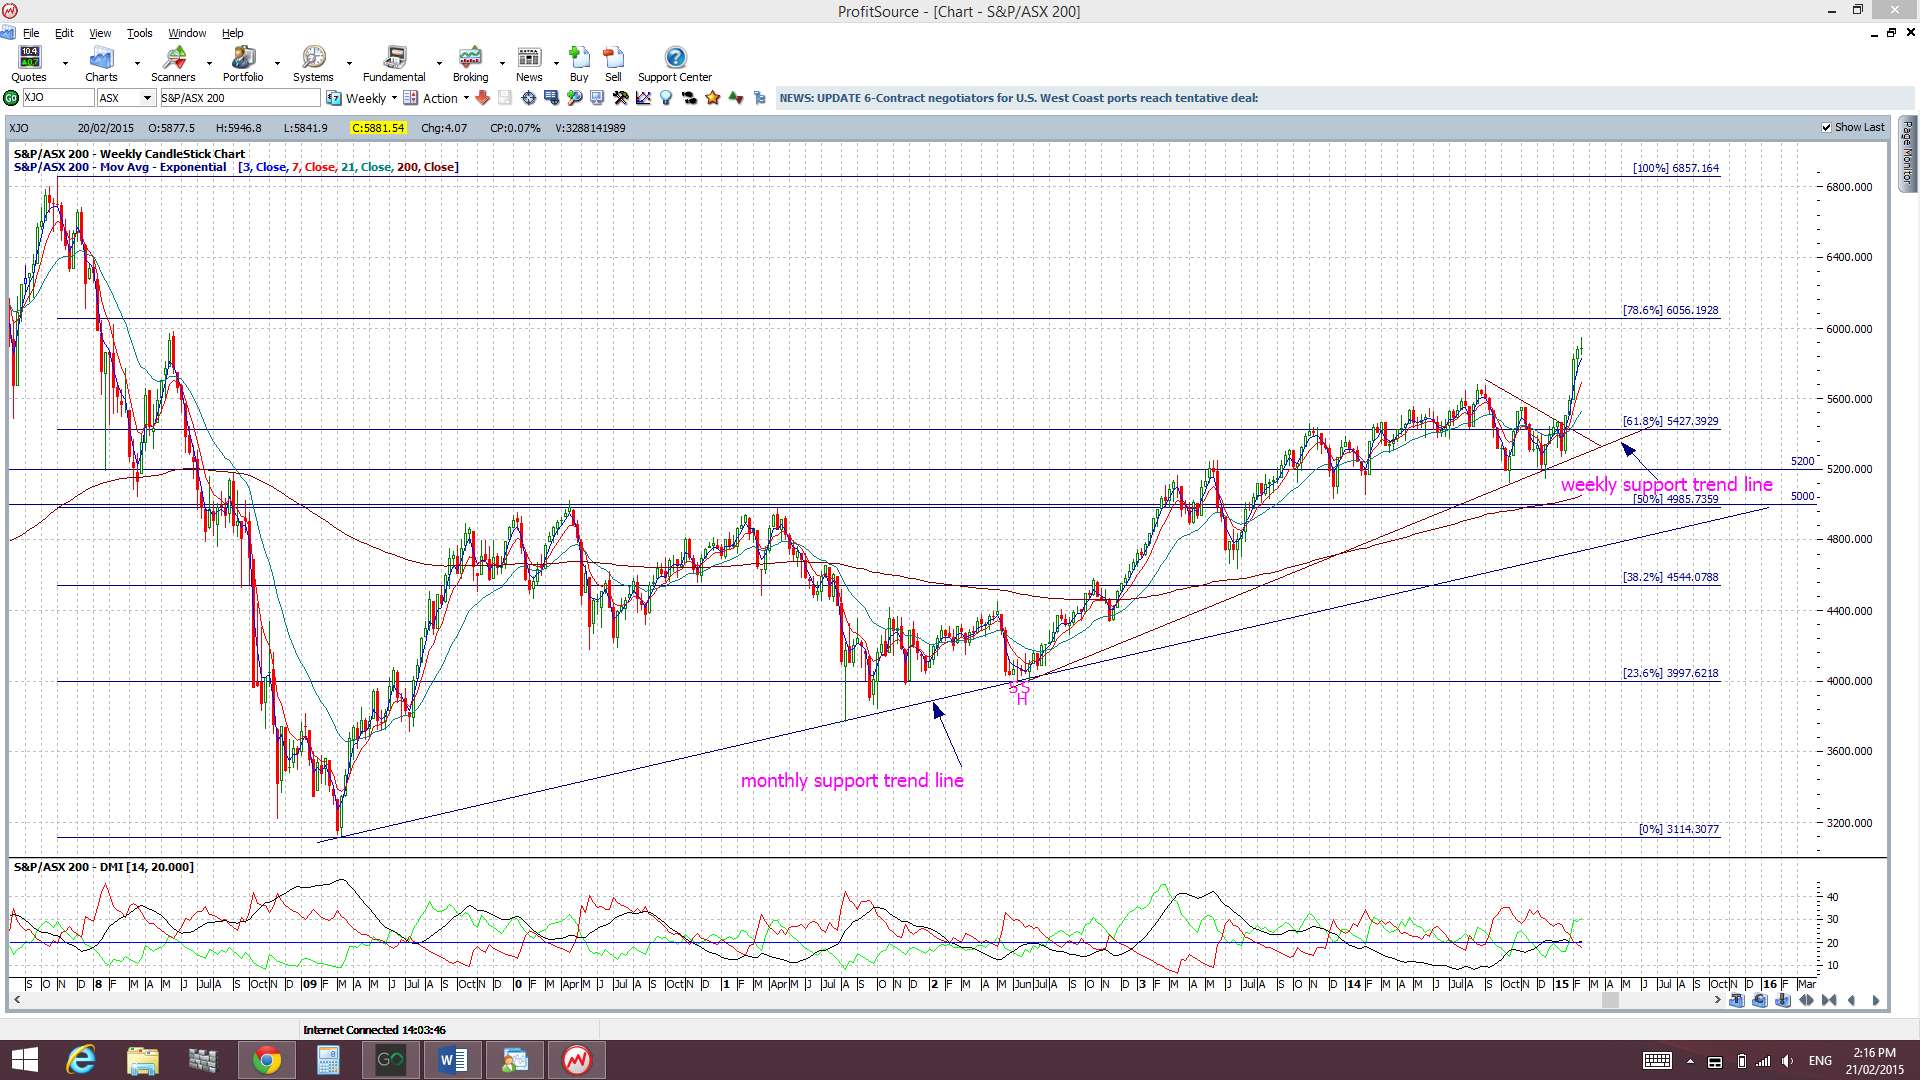
After chopping around either side of the key 61.8% fib for fifteen months, since November 2013, the ASX-200 finally made a triangle breakout in the last week of January. I noted this in my blog post on Jan 27th and this can be found through the following link. I am looking for this to head to test the 78.6% fib near 6,000 and any continuation after that should head to test the 7,000 region.
ASX-200:
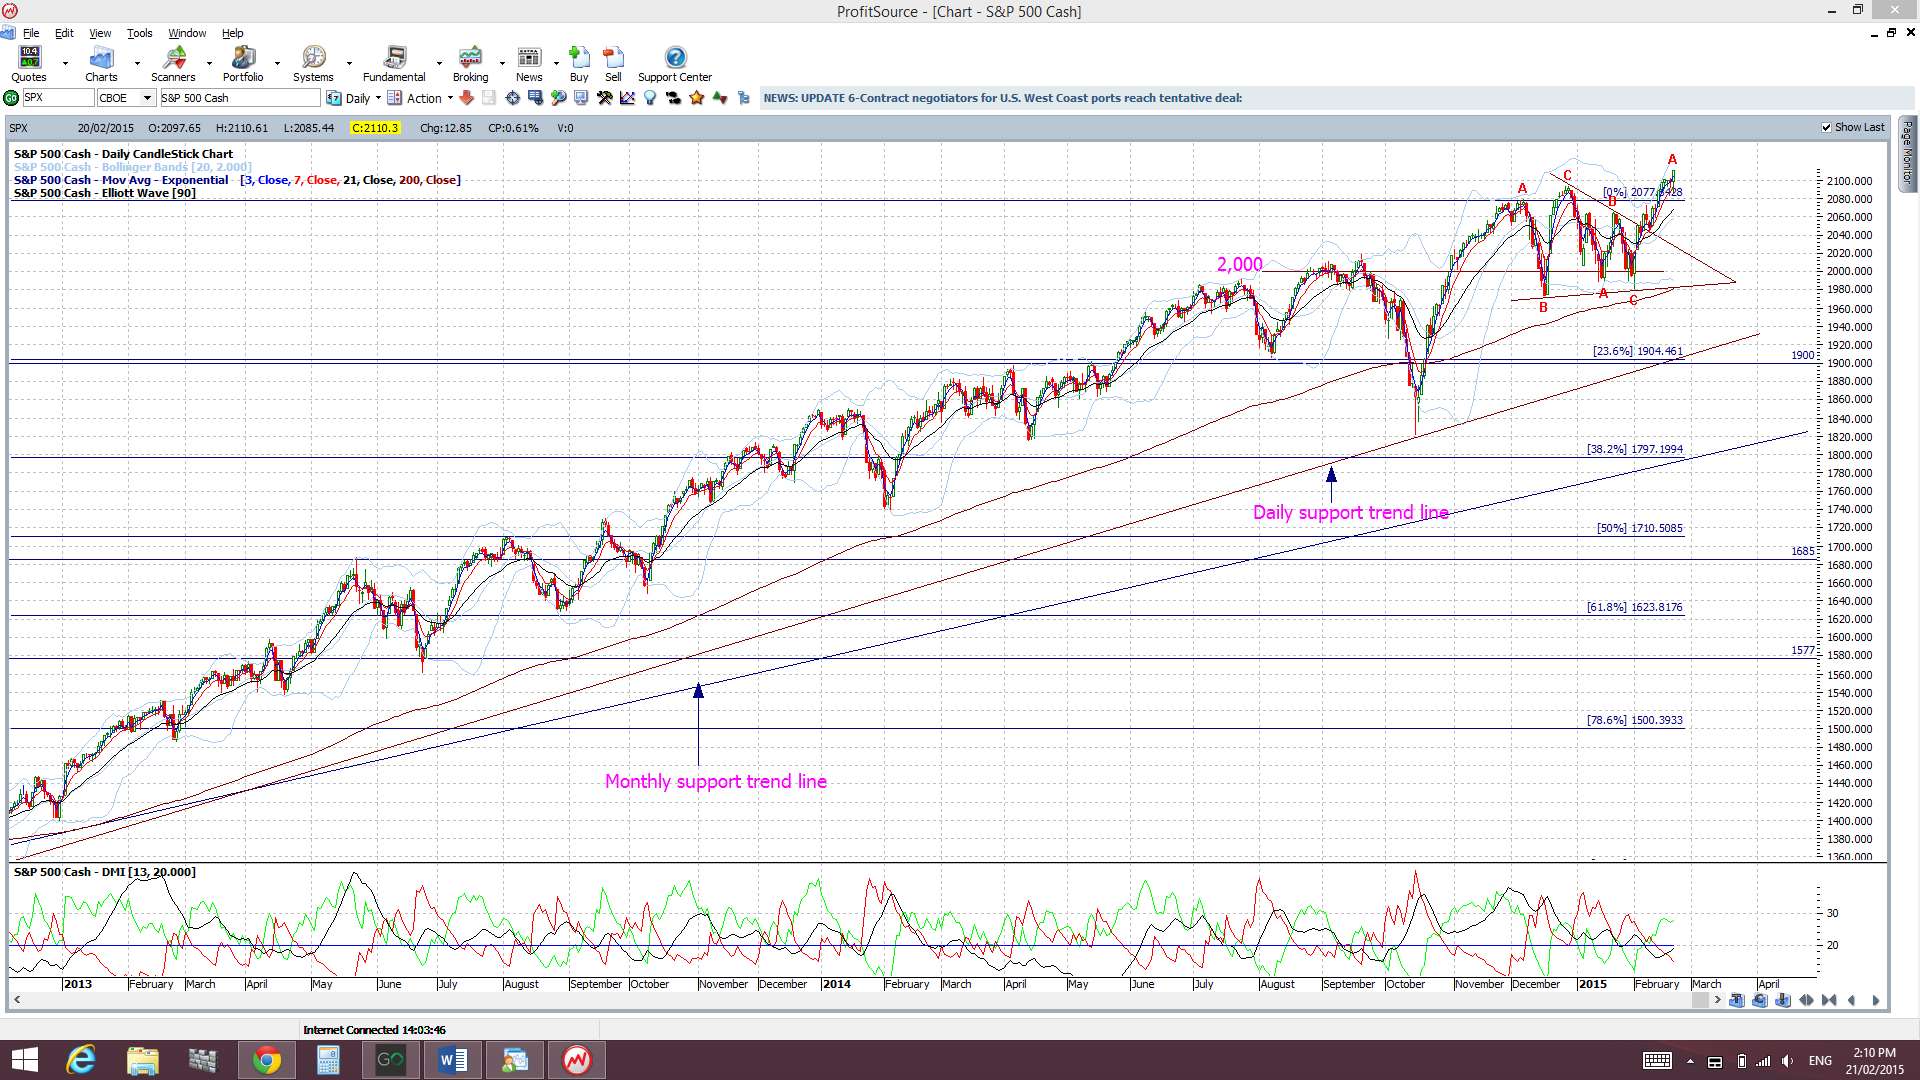
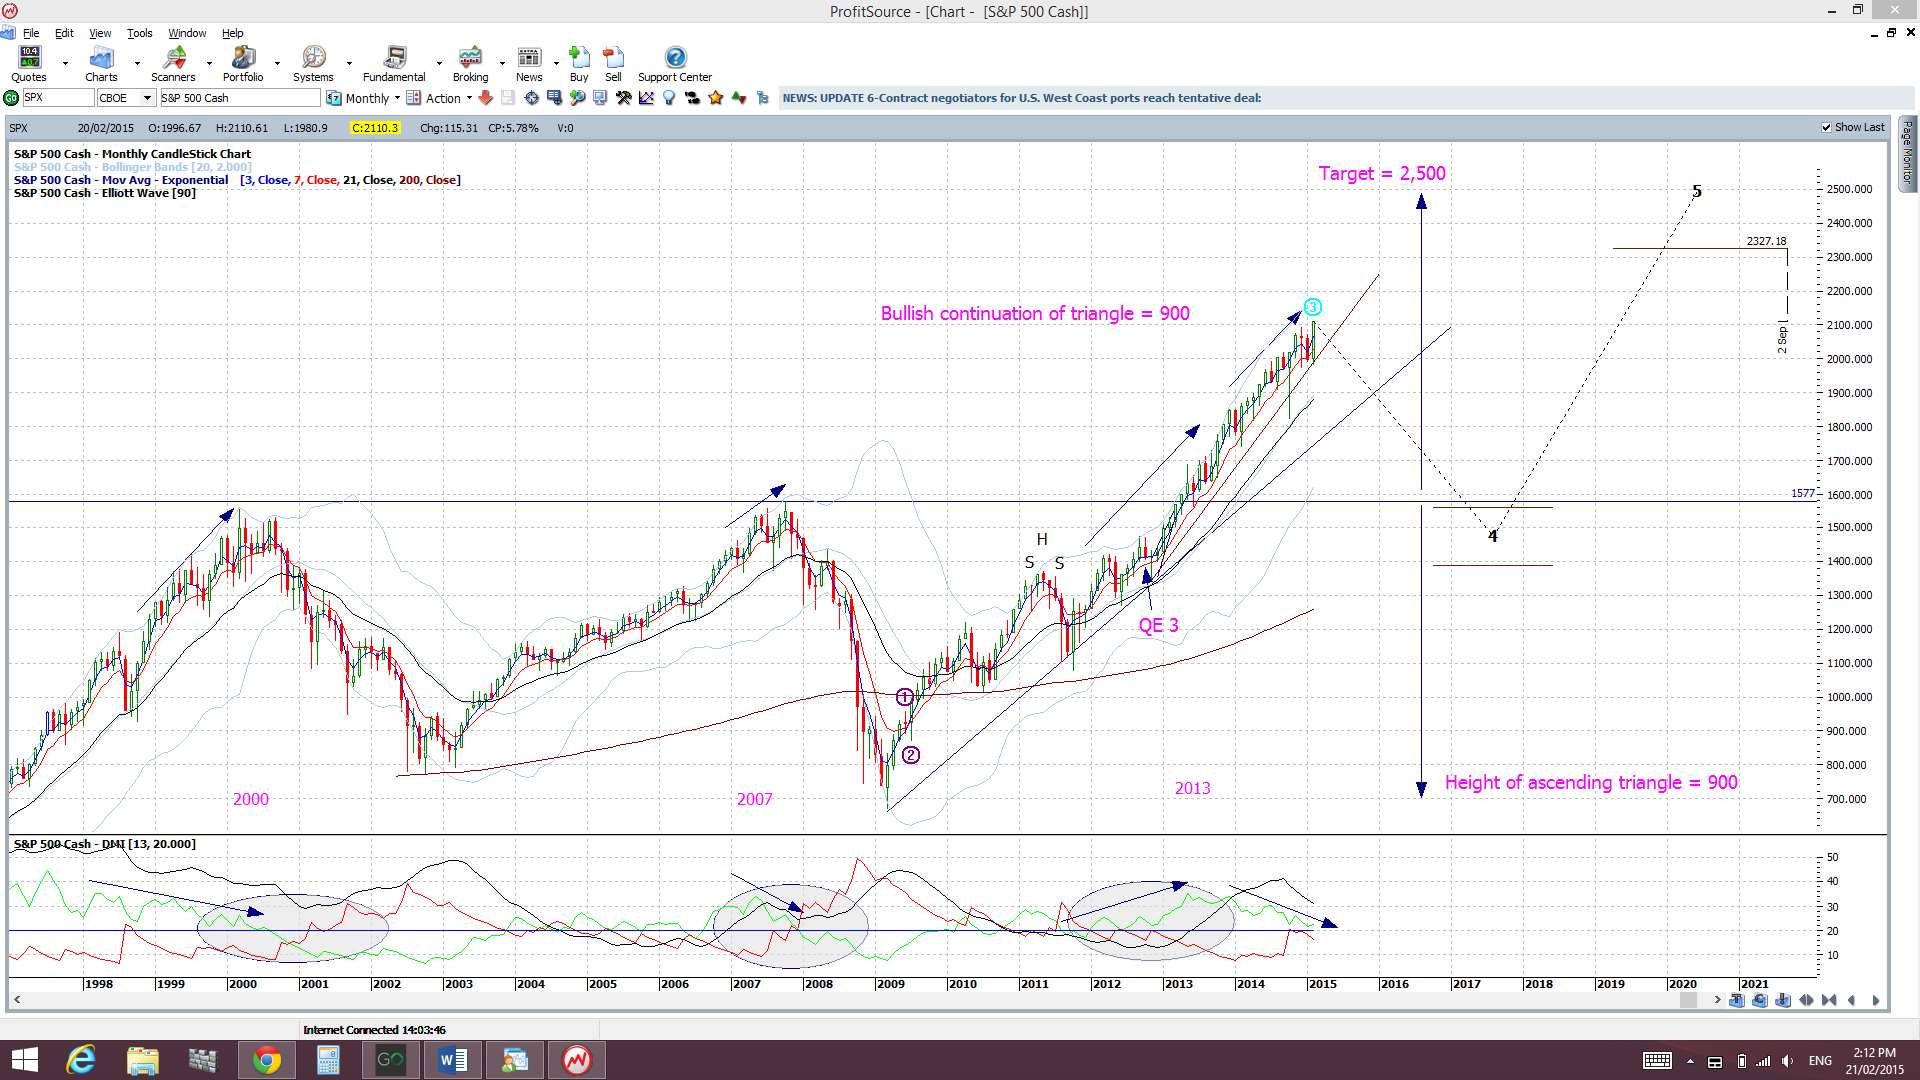
The S&P500 is still navigating new highs above 2000 but the chance of a pullback cannot be ruled out. There has not been any real deep pull back since the break up through the 1,600. Thus, with all of this, I continue to watch out for further clues as to any new momentum move, long or short though! In particular I’m looking out for:
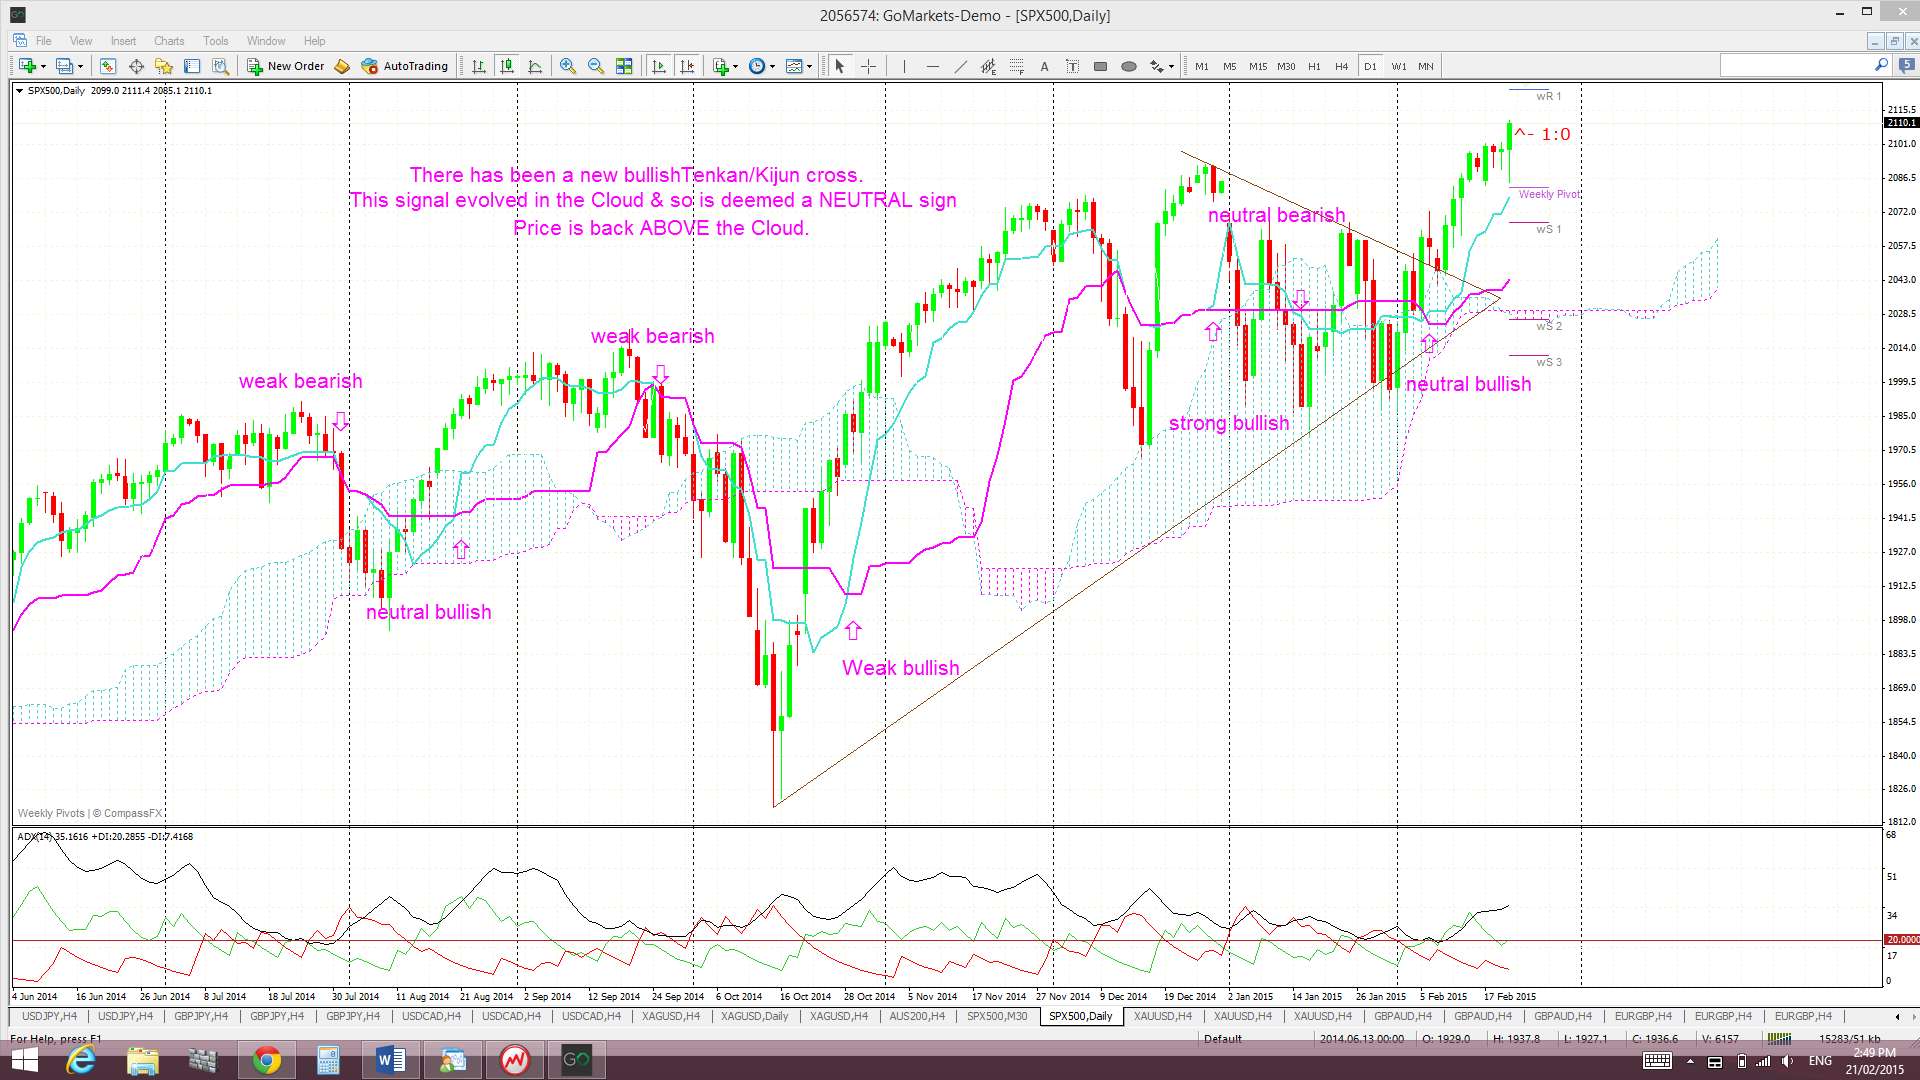
S&P500 daily chart: The index is now trading above the psychological 2,100 level and is still above the daily trend line. Price also recently made a bullish triangle breakout:
Ichimoku S&P500 chart: a clear cross of the blue Tenkan-sen line below the pink Kijun-sen line. There has been a recent bullish Tenkan/Kijun signal that is now confirmed. The index is also trading back above the Cloud and recently made a bullish triangle breakout.
S&P500 monthly chart: a break of the monthly support trend line (see monthly chart). The monthly trend line remains intact. A break of this support level would suggest to me of a more severe pull back or correction.
Russell 2000 Index: this small caps index is a bit of a US market ‘bellwether’ and is trading above the key 1,220 level. A monthly close above this level wold be a very bullish signal:

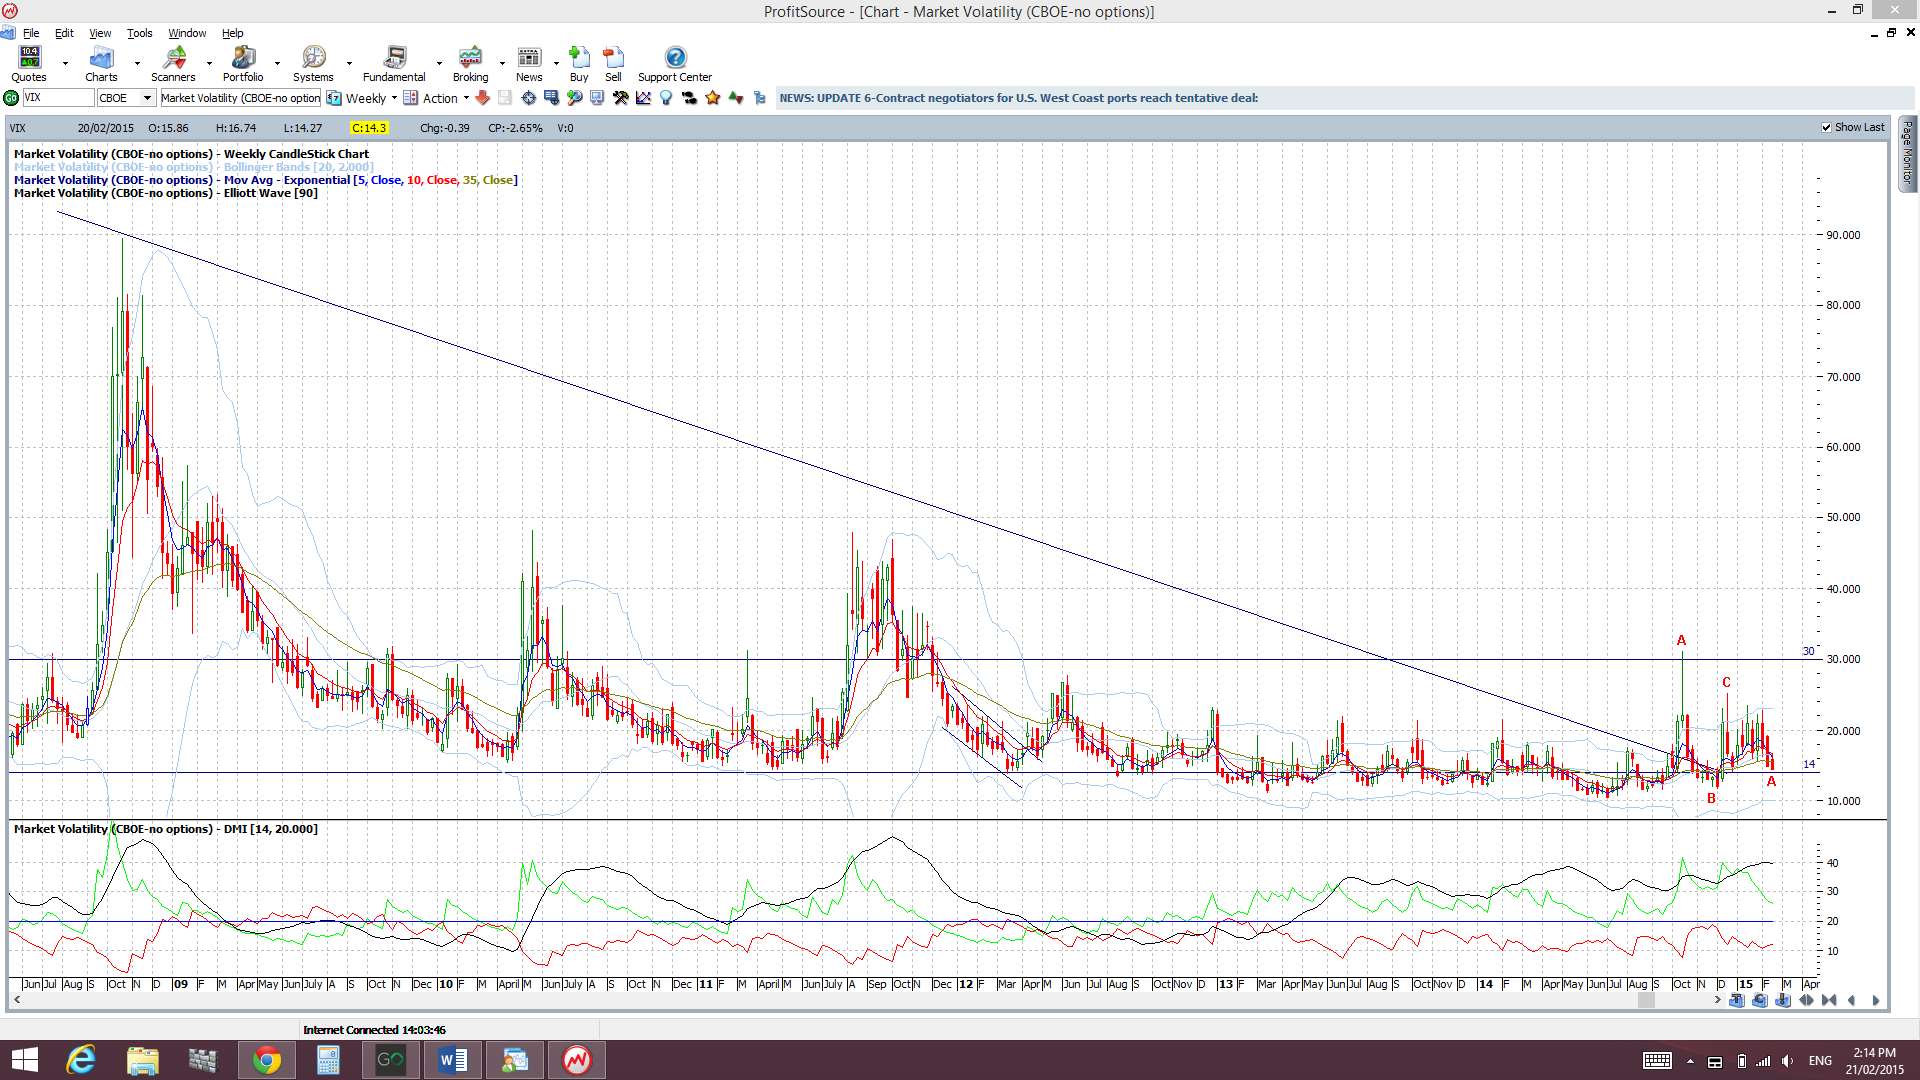
VIX Index: The ‘Fear’ index is back trading below 20 and actually down near the 14 level.
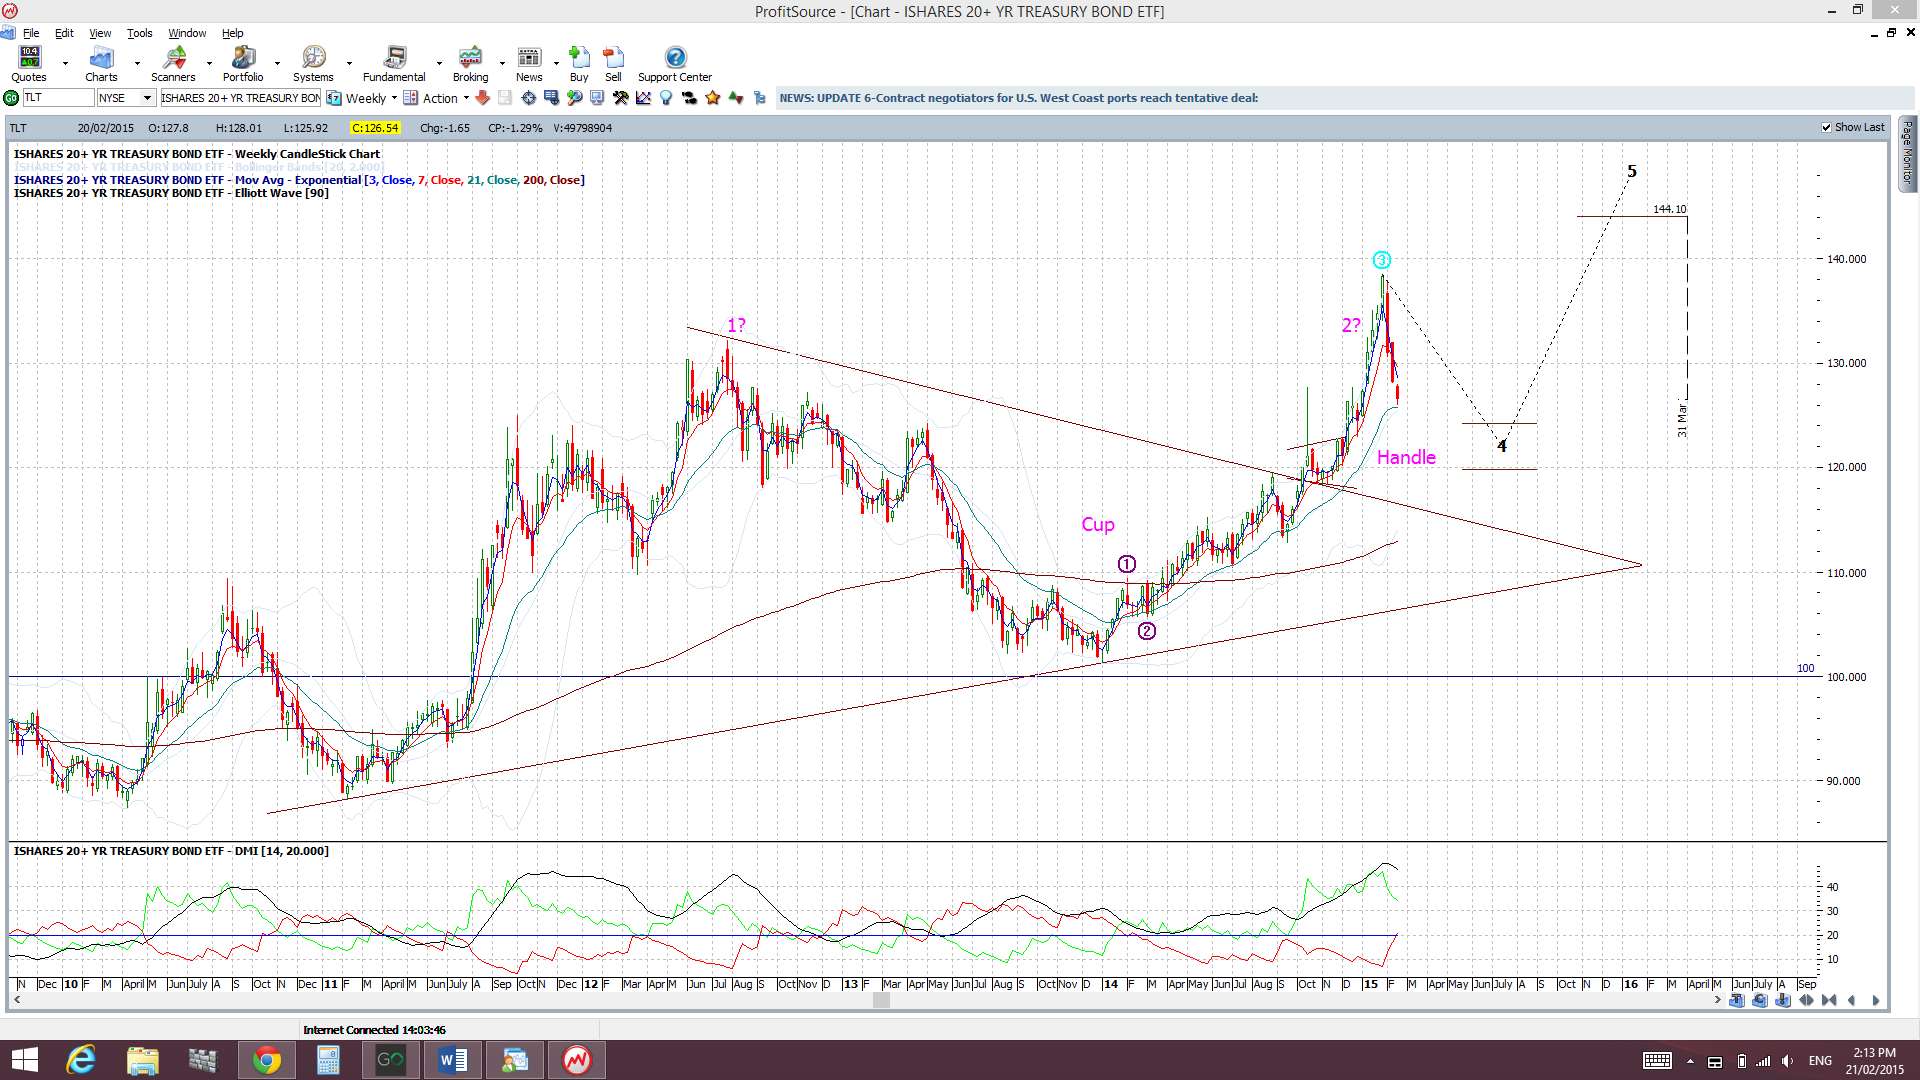
Bonds: The bond ETF has continued with its bearish run as money flows into stocks.
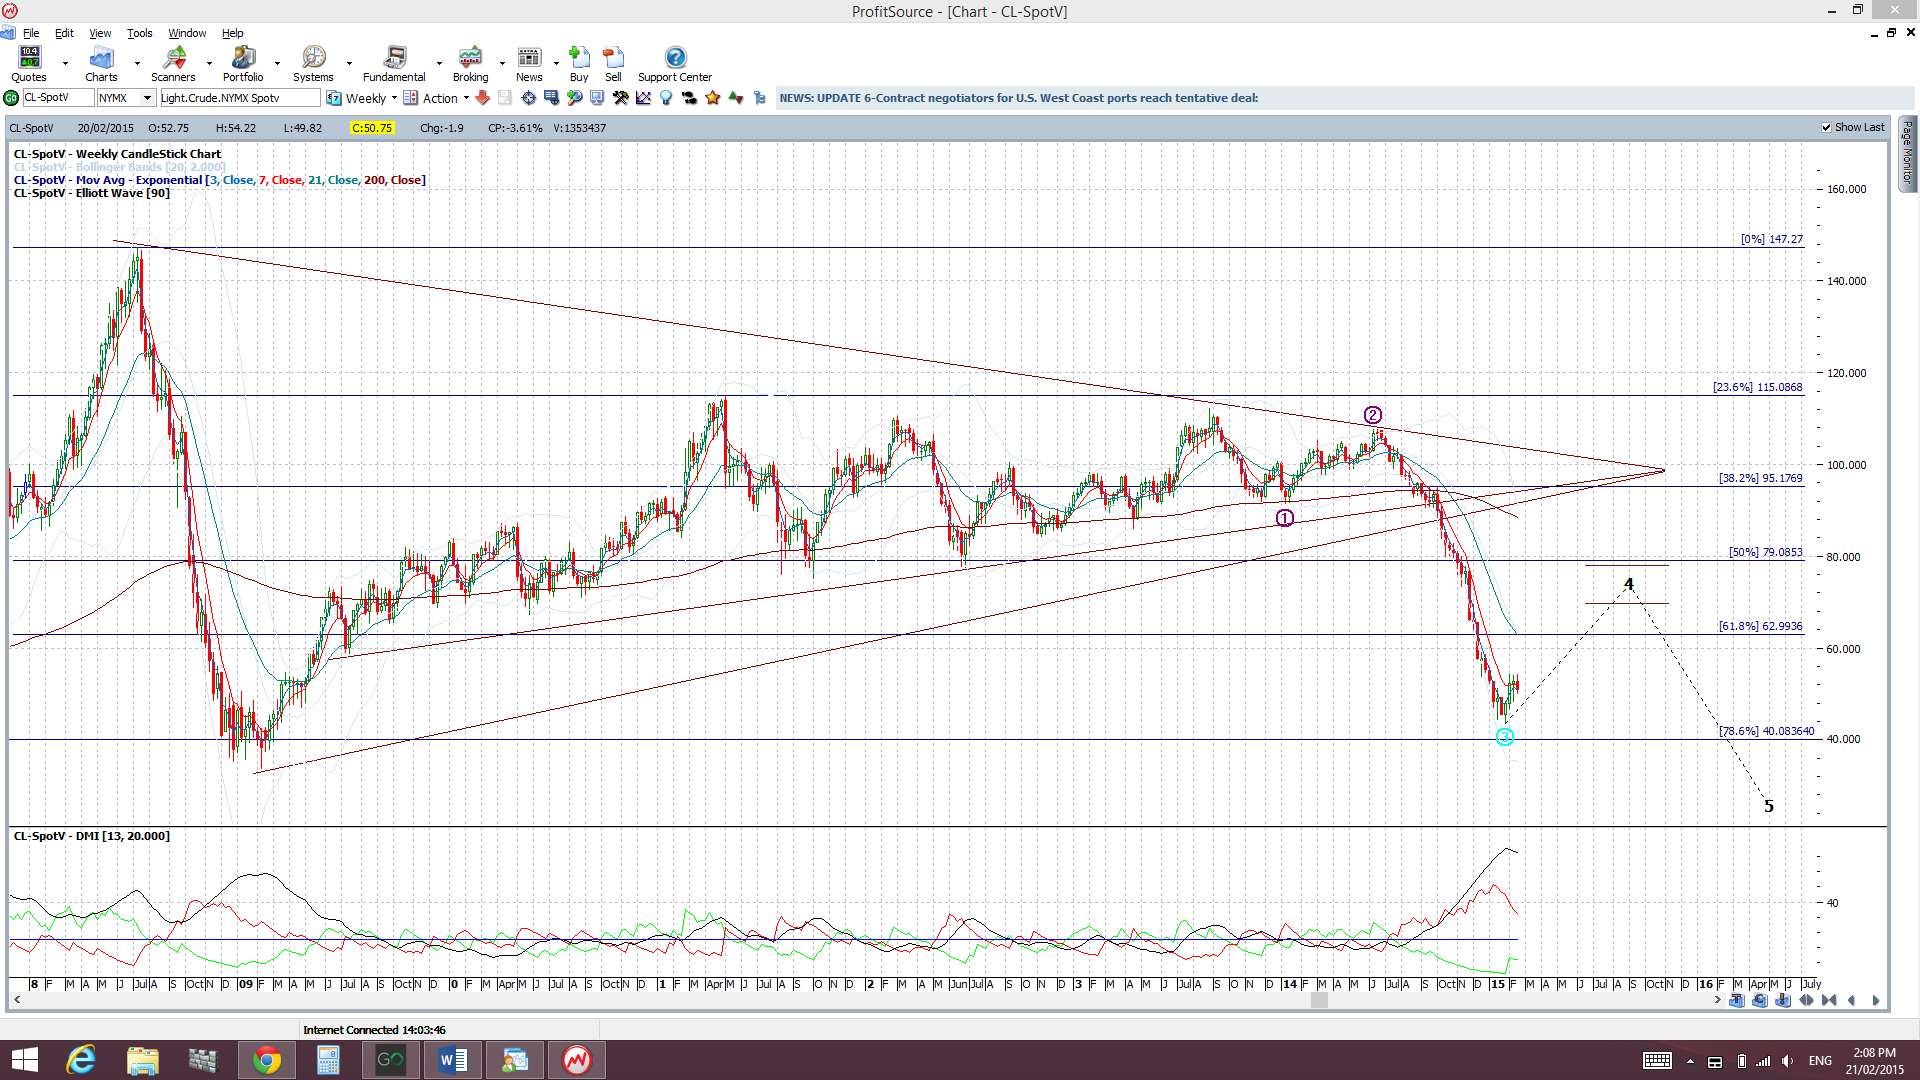
Oil: Oil had a bearish week but is still above $40 support.
Trading Calendar Items to watch out for:
Forex:
- Mon 23rd: EUR German Ifo Business Climate. CNY Bank Holiday.
- Tue 24th: EUR ECB President Draghi speaks. USD CB Consumer Confidence & Fed Chair Janet Yellen testifies. CAD BoC Gov Poloz speaks. CNY Bank Holiday.
- Wed 25th: CNY HSBC Flash Manufacturing PMI. USD Fed Chair Janet Yellen testifies & New Home Sales. EUR ECB Draghi speaks.
- Thurs 26th: NZD Trade Balance. AUD Private Capital Expenditure. GBP Second Estimate GDP. EUR Targeted LTRO. CAD Core CPI. USD Core CPI, Durable Goods & Unemployment Claims.
- Fri 27th: NZD ANZ Business Confidence. USD Prelim GDP.
FOREX:
Important note relevant for all currency pairs: Traders need to monitor the Eurogroup’s Greek-debt negotiation and Janet Yellen’s testimony to Congress about the economy and monetary policy. Both of these high-profile news items have the potential to significantly impact the EUR and USD and, hence, sentiment with most currency pairs and also stocks.
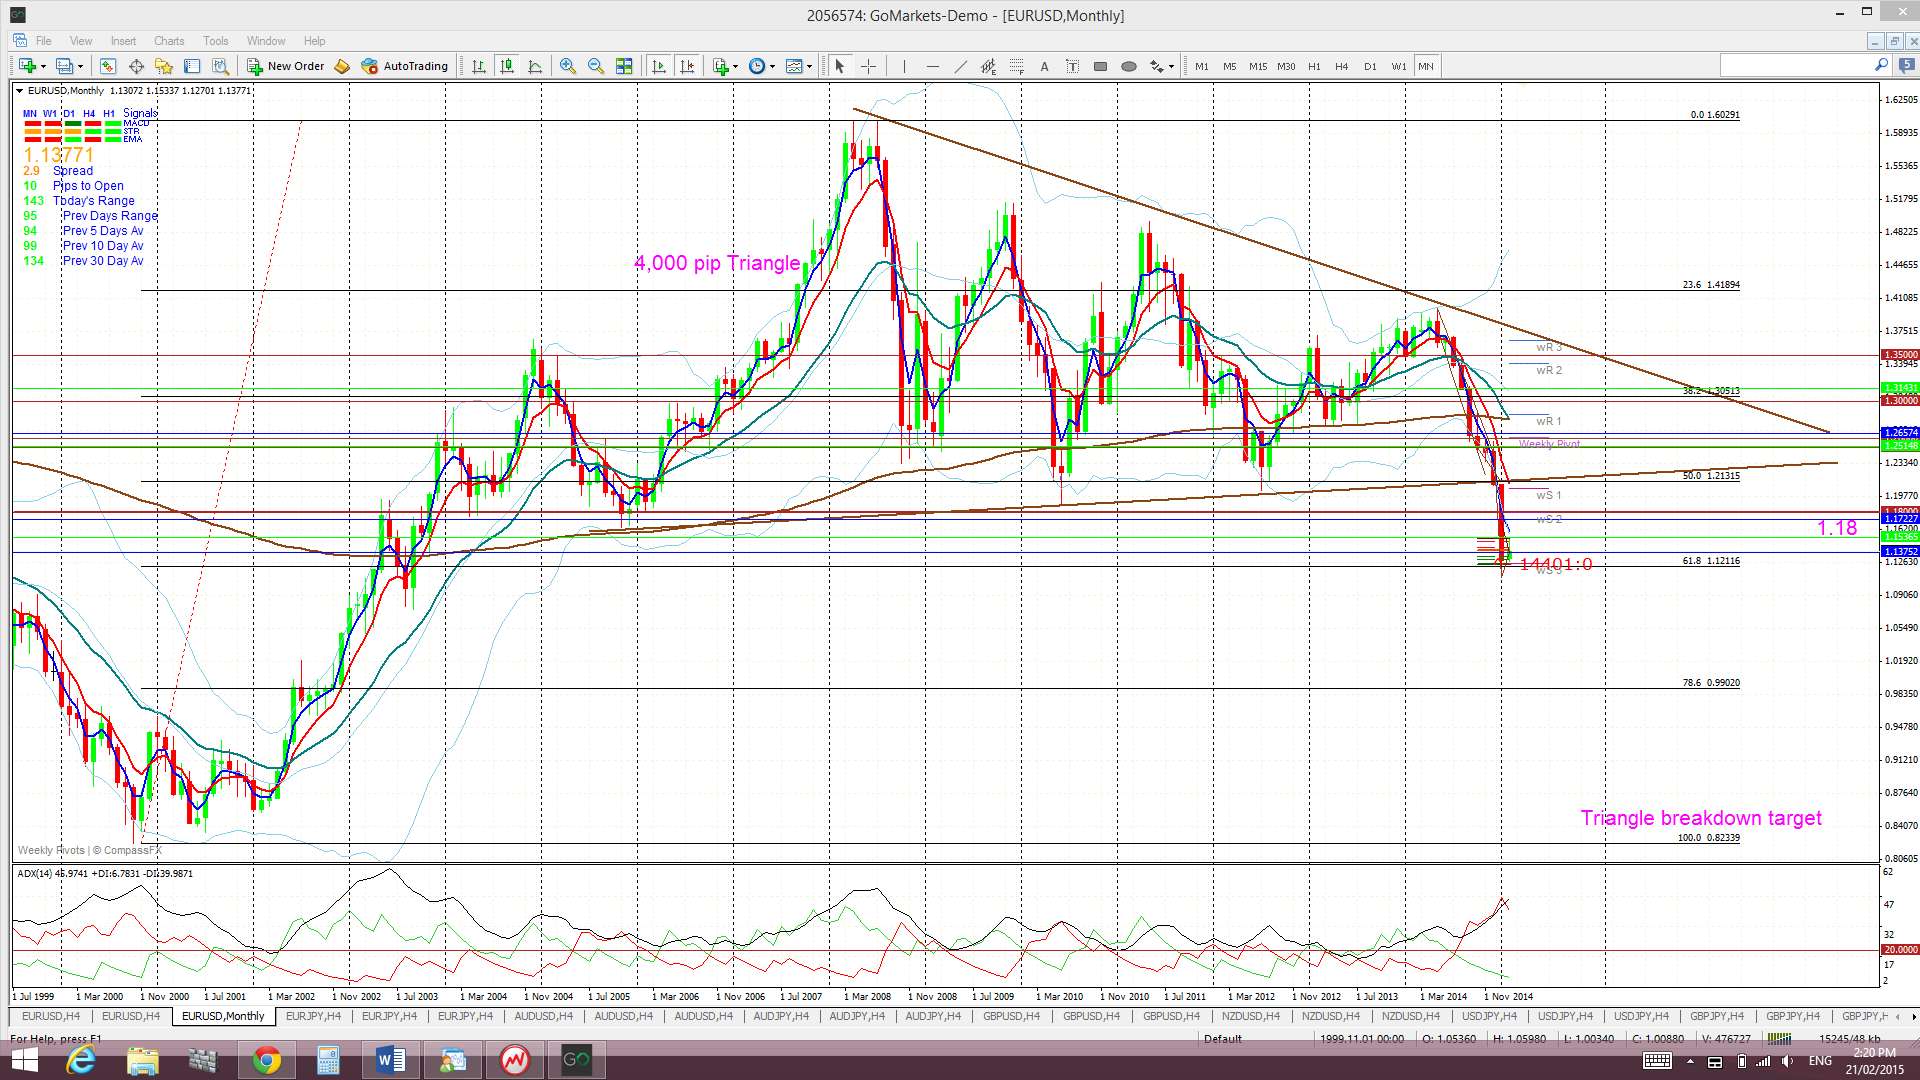
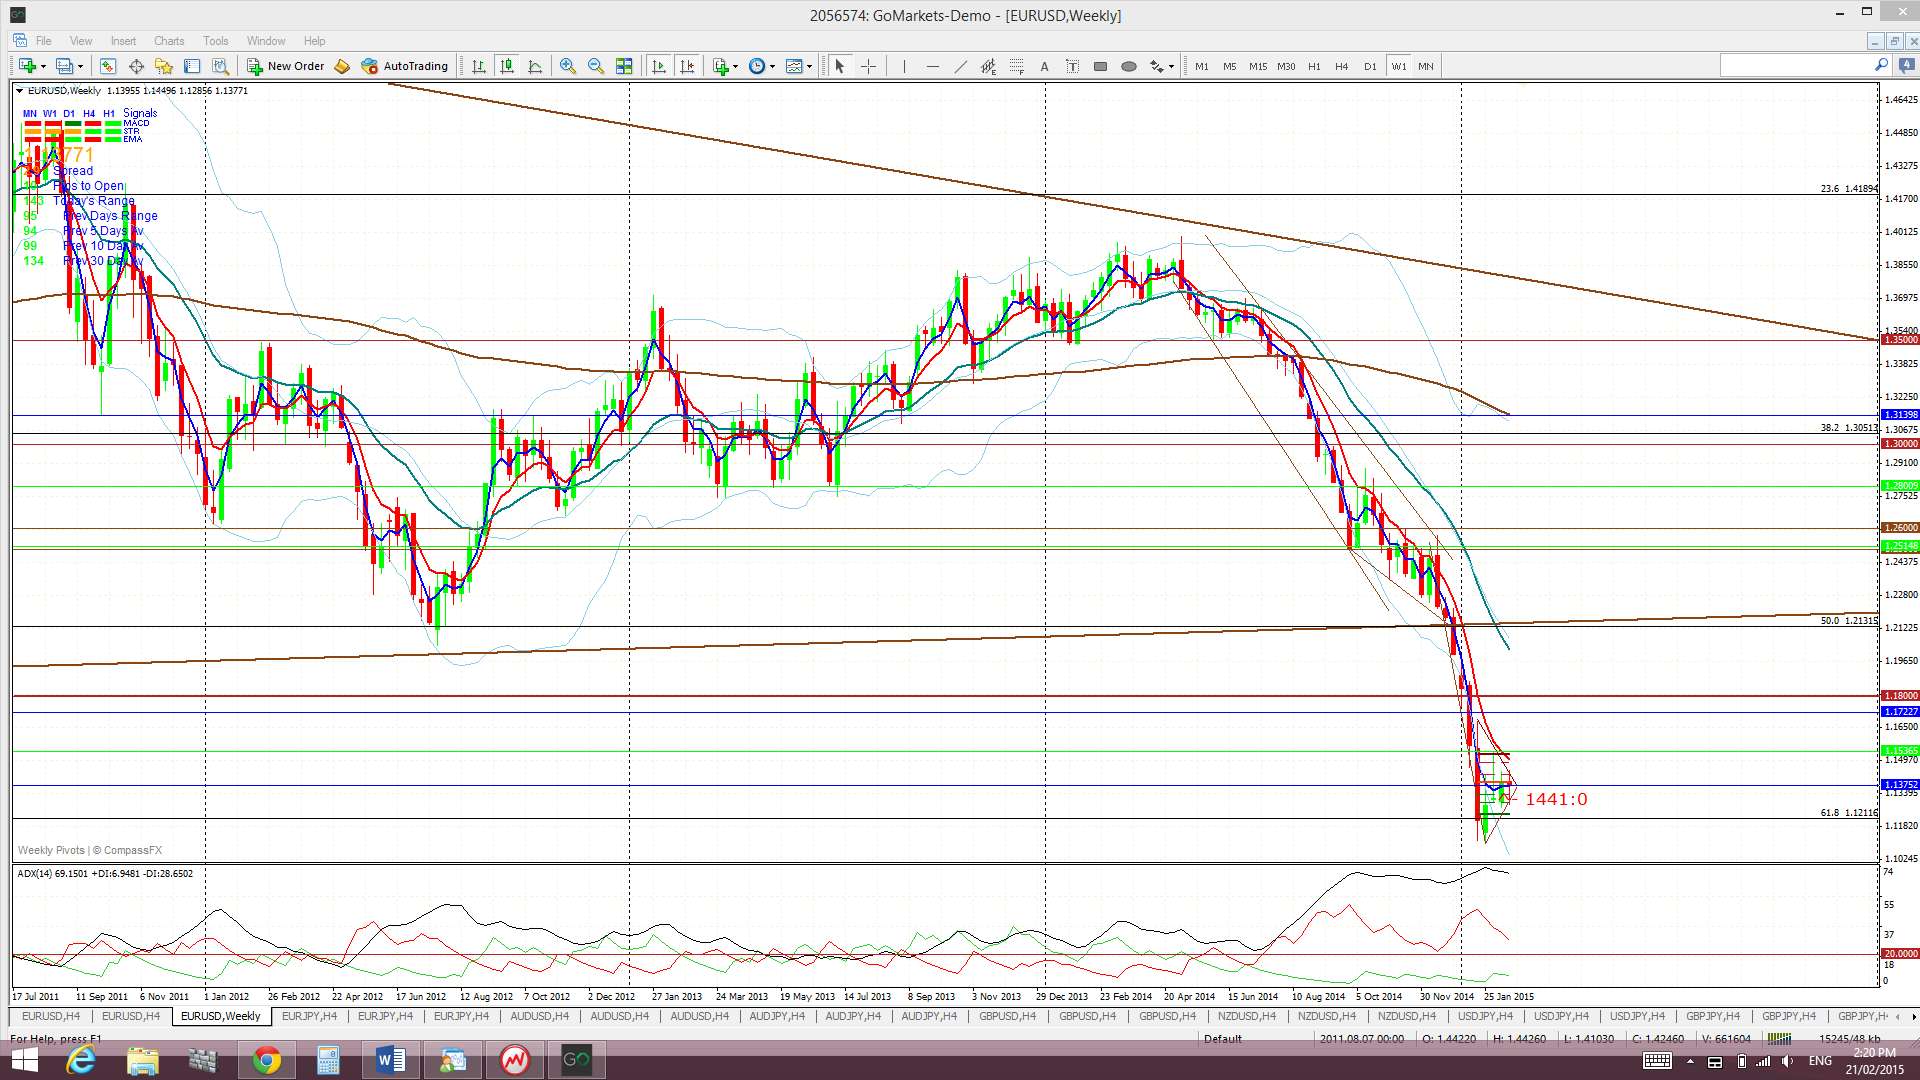
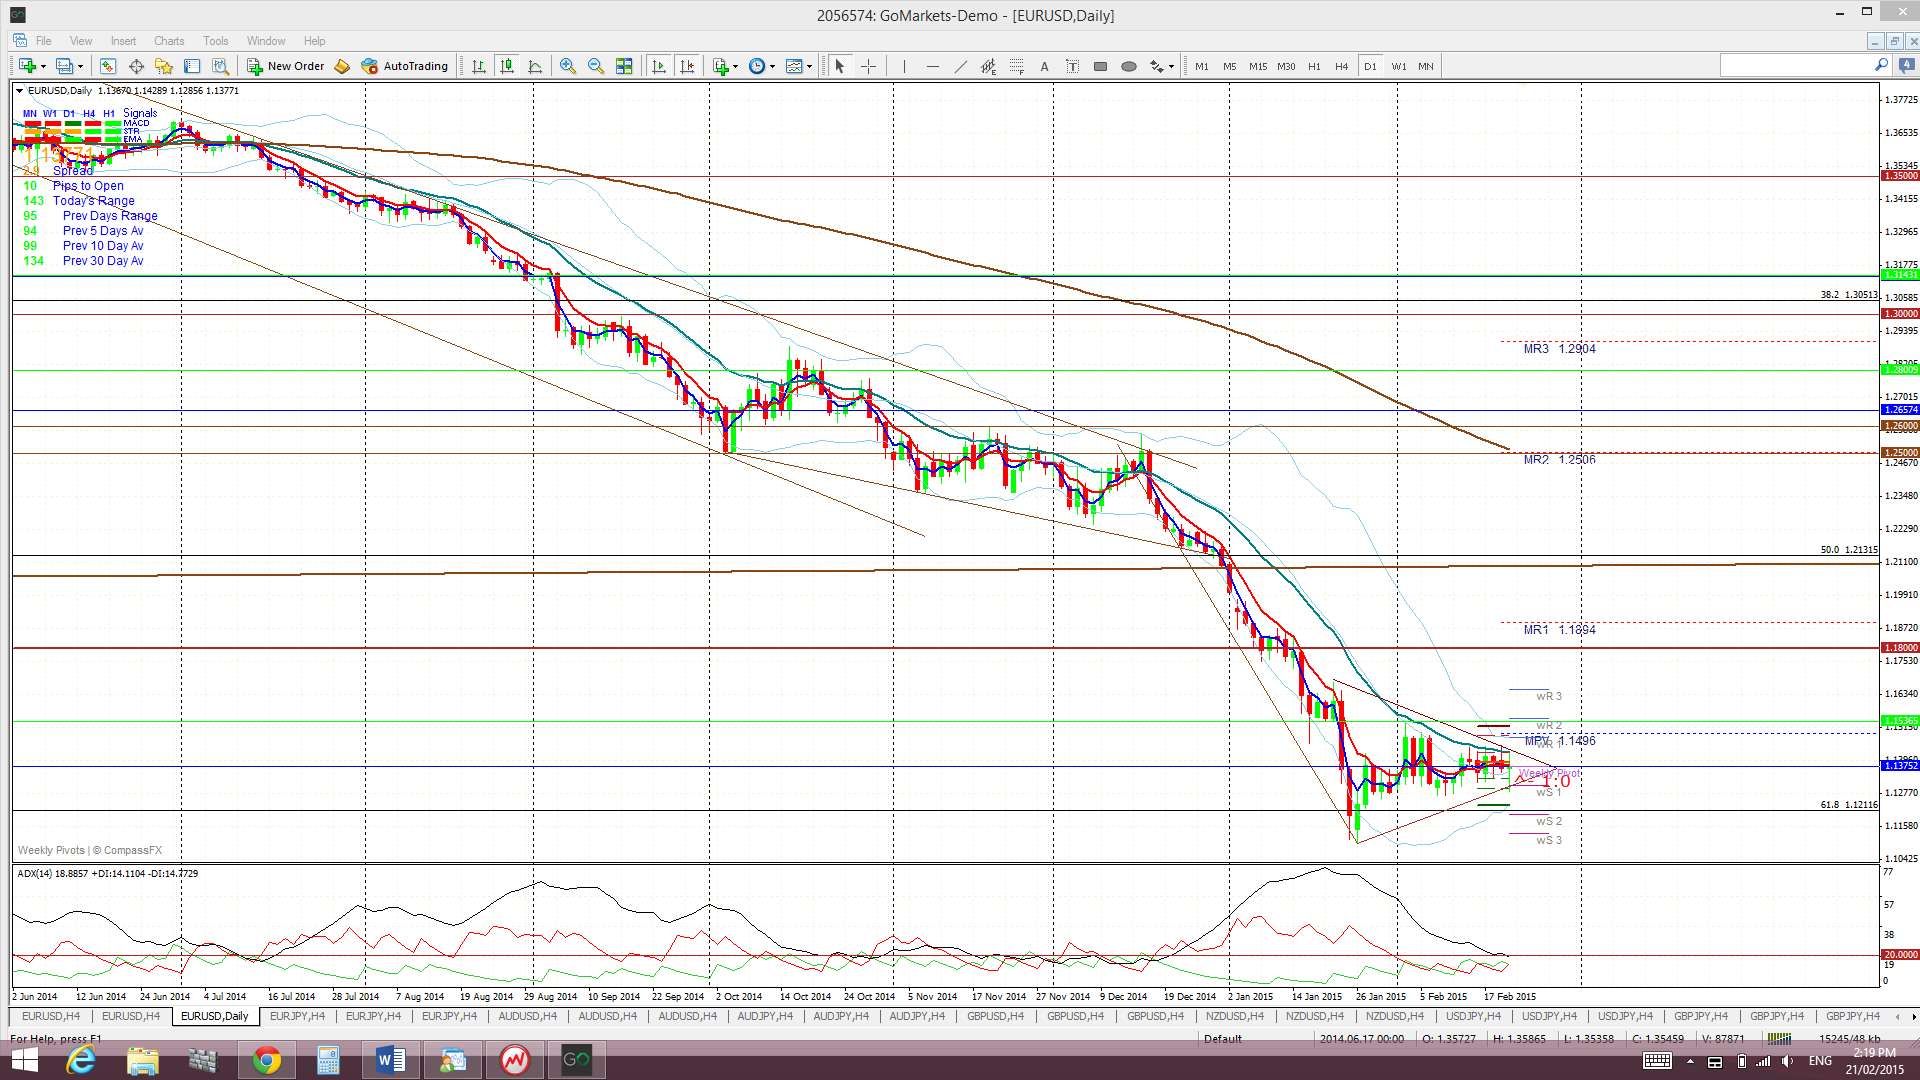
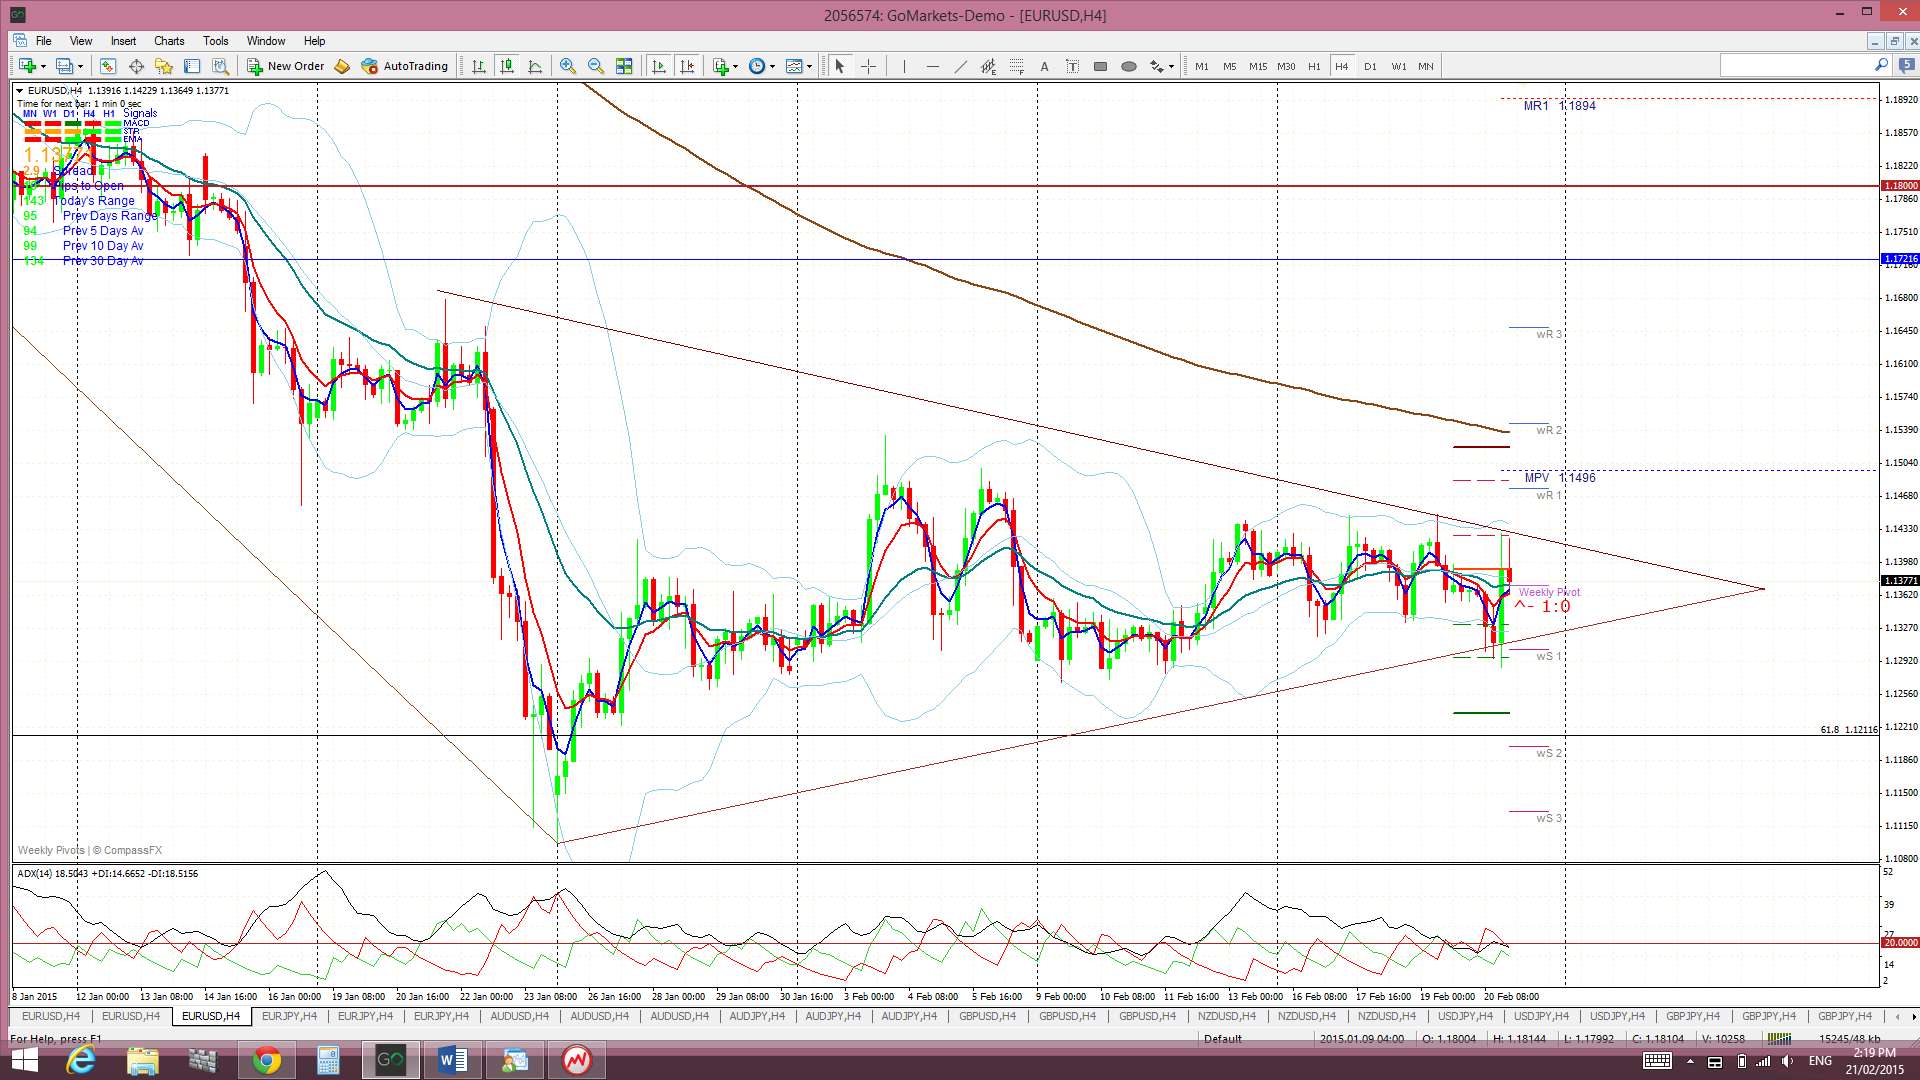
E/U: The E/U has chopped within a Flag pattern for the last five weeks and this is giving the higher time frame charts a ‘Bear Flag’ appearance. News of a potential Greek debt resolution lifted the E/U late on Friday and I have adjusted the triangle trend lines accordingly. Traders need to watch for any triangle breakout with momentum, either up or down.
The E/U continues to hold below the major 1.18 level but above the support of the key 61.8% fib from the 2000-2008 bull run and this continues to be of significance:
E/U monthly showing the 61.8% Fib:
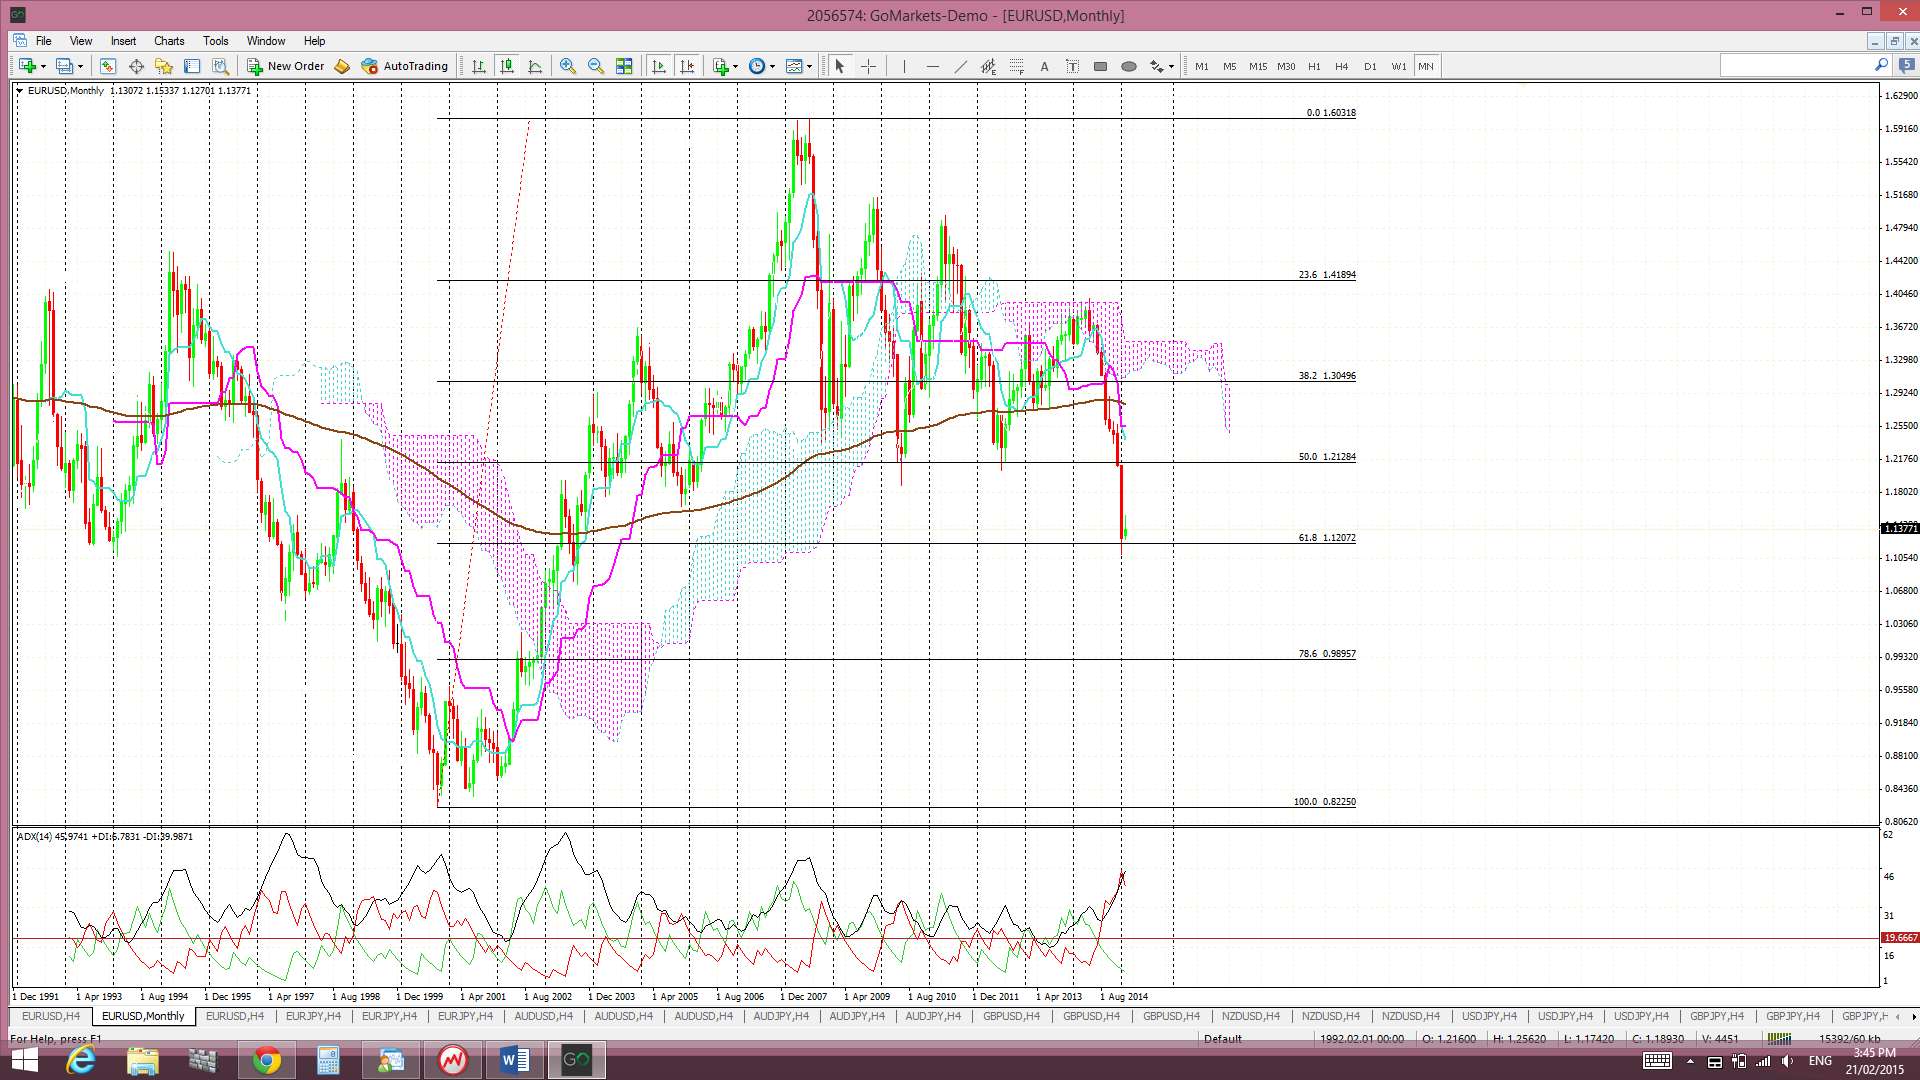
A continued hold above this 61.8% fib would undermine bearish sentiment. I had mentioned I was expecting this pair to test the broken 1.18 level and I am still thinking the same here. Whether price remains bearish following any test of 1.18 though is a ‘wait and see’ prospect but I’ll be looking for signs of weakness to take up the technical triangle breakdown trade as described below:
Descending triangle on the monthly chart: the descending triangle pattern is a bearish continuation pattern and has a base at around the 1.18 level. The height of this triangle is about 4,000 pips. Technical theory would suggest that any bearish breakdown of this triangle below 1.18 might see a similar move. It is worth noting that this would bring the E/U down near 0.80 and to levels not seen since 2000/2001! The monthly chart shows how critical this 1.18 level is for the E/U. The 61.8% of the 2000-2008 bull run is down near 1.12 and might be an interim target on any breakdown move. The January monthly candle closed below this key level and I will be looking for a test of 1.18 before further possible bearish continuation. The caveat here is that any bearish reversal move with the USD might undermine this bearish set-up.
Price is trading in the Ichimoku Cloud on the 4hr chart but below the Cloud on the daily, weekly and monthly charts.
The weekly candle closed as a bearish coloured Doji candle.
- I’m watching for any new TC signal on this pair, the triangle trend lines and the 1.18 level.
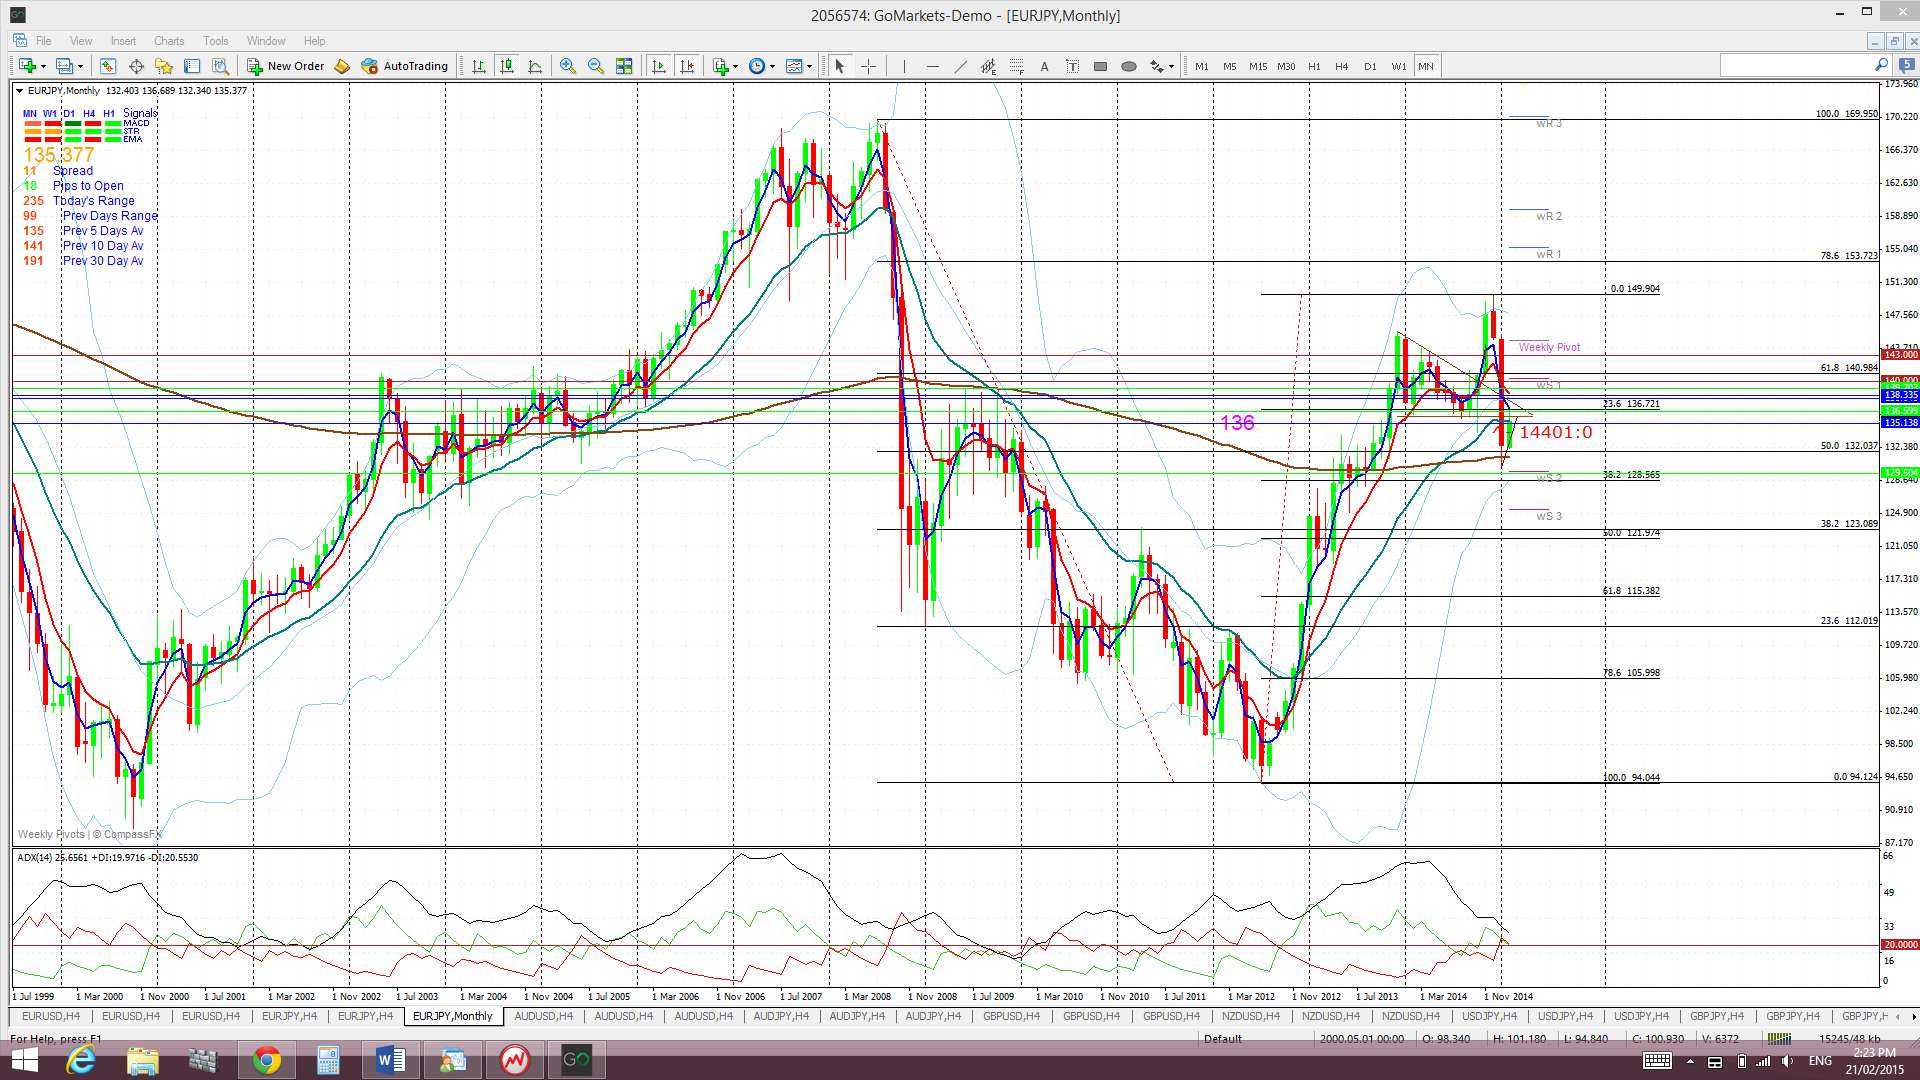
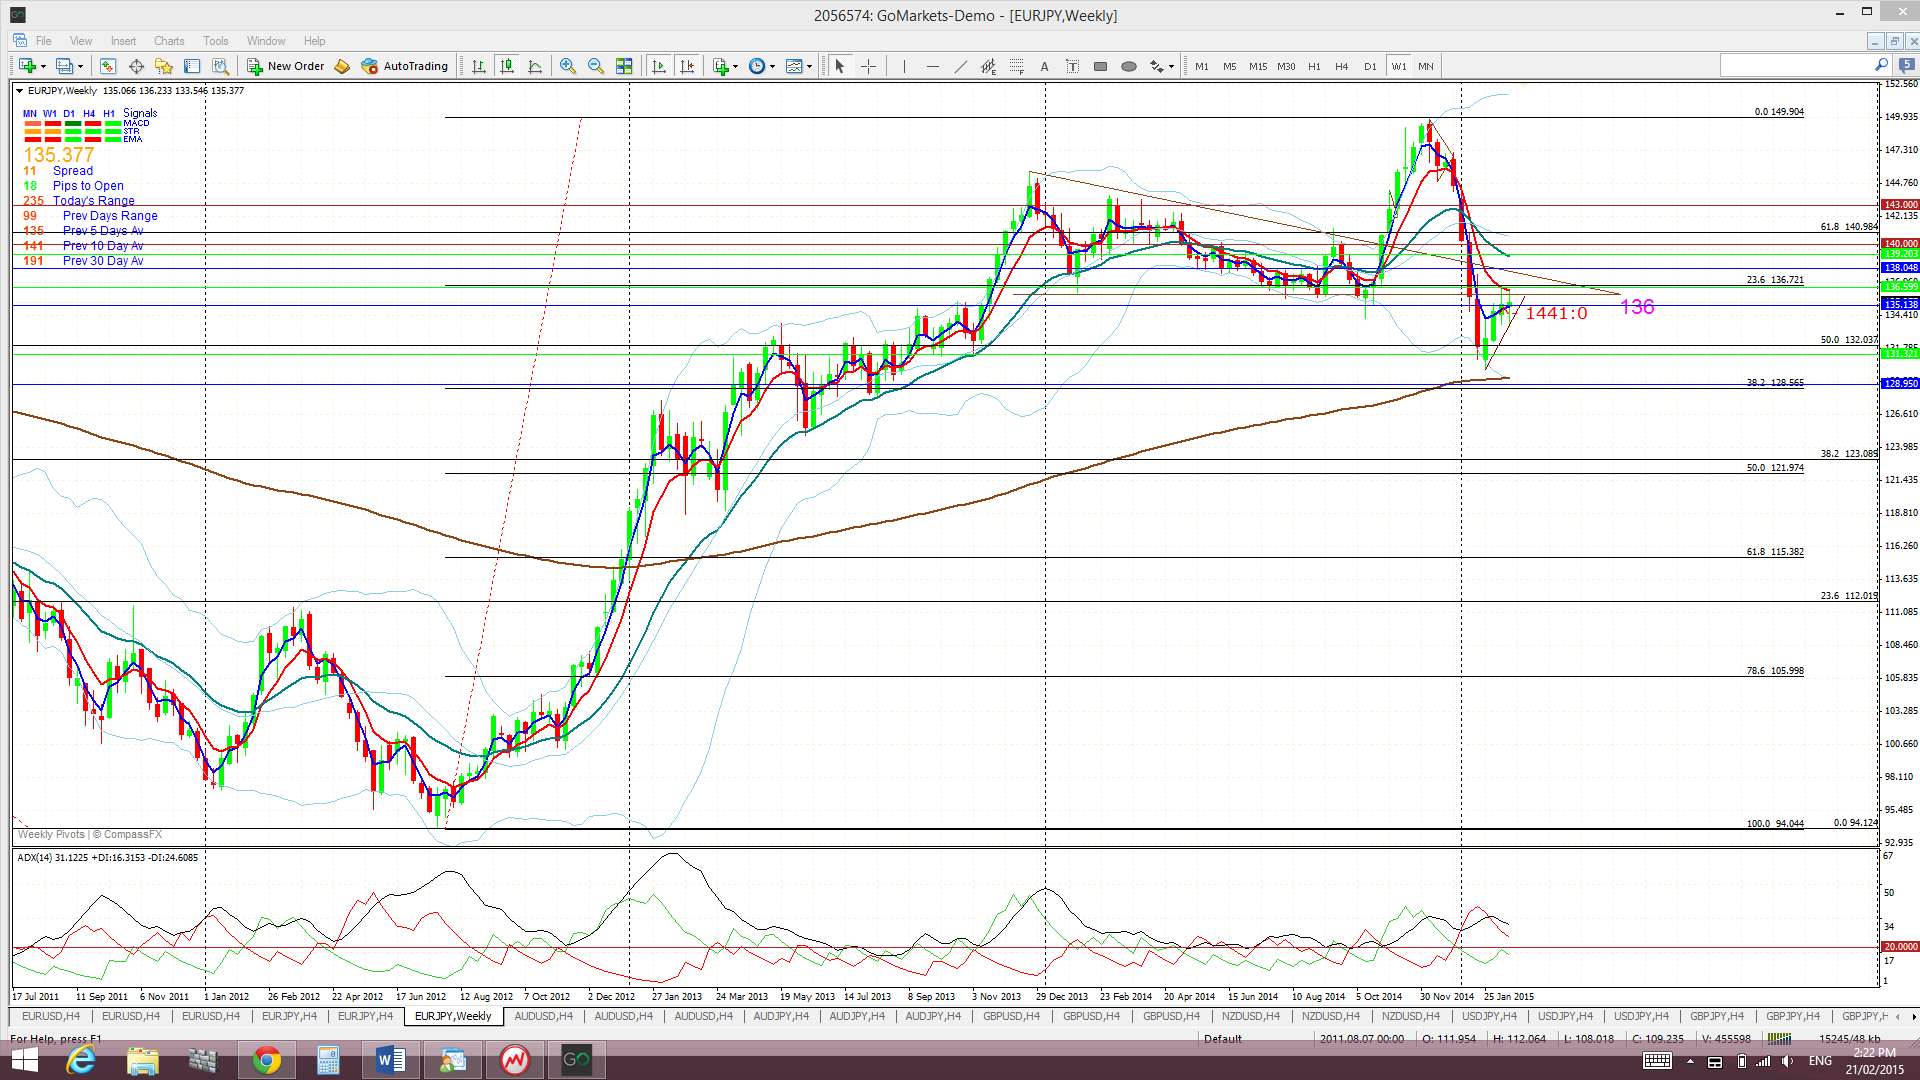
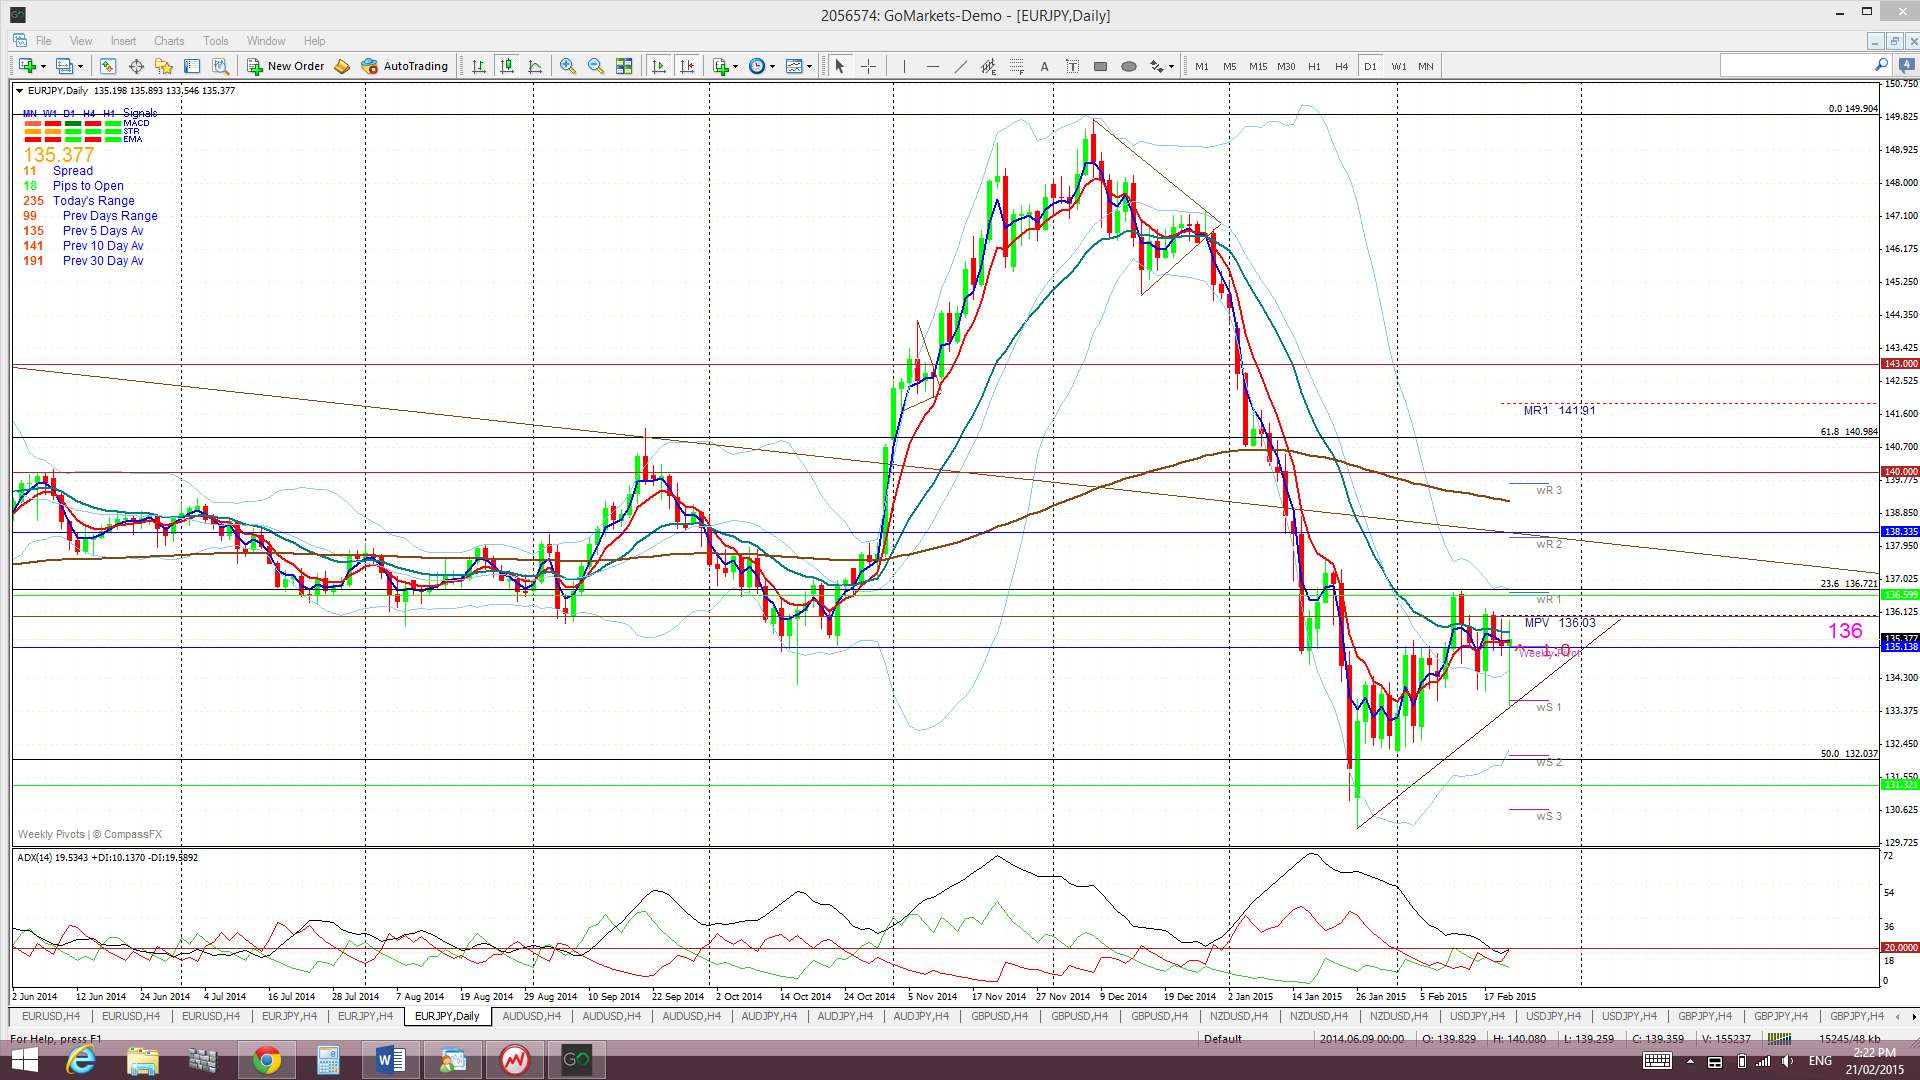
E/J: The E/J continued to hold above a 4 week support trend line but below the 136 level. The pair got a boost on Friday with news of a potential Greek debt deal.
The weekly chart reveals how the 136 level has been a reasonably strong S/R level and price is drifting back up to this region. I still don’t see much momentum on my 4hr charts at the moment but I would look at any close and hold back above 136 as bullish and would look for confirmation by way of a momentum shift. Price appears to have bounced up off the monthly Cloud and so I’ll be looking for continuation here:
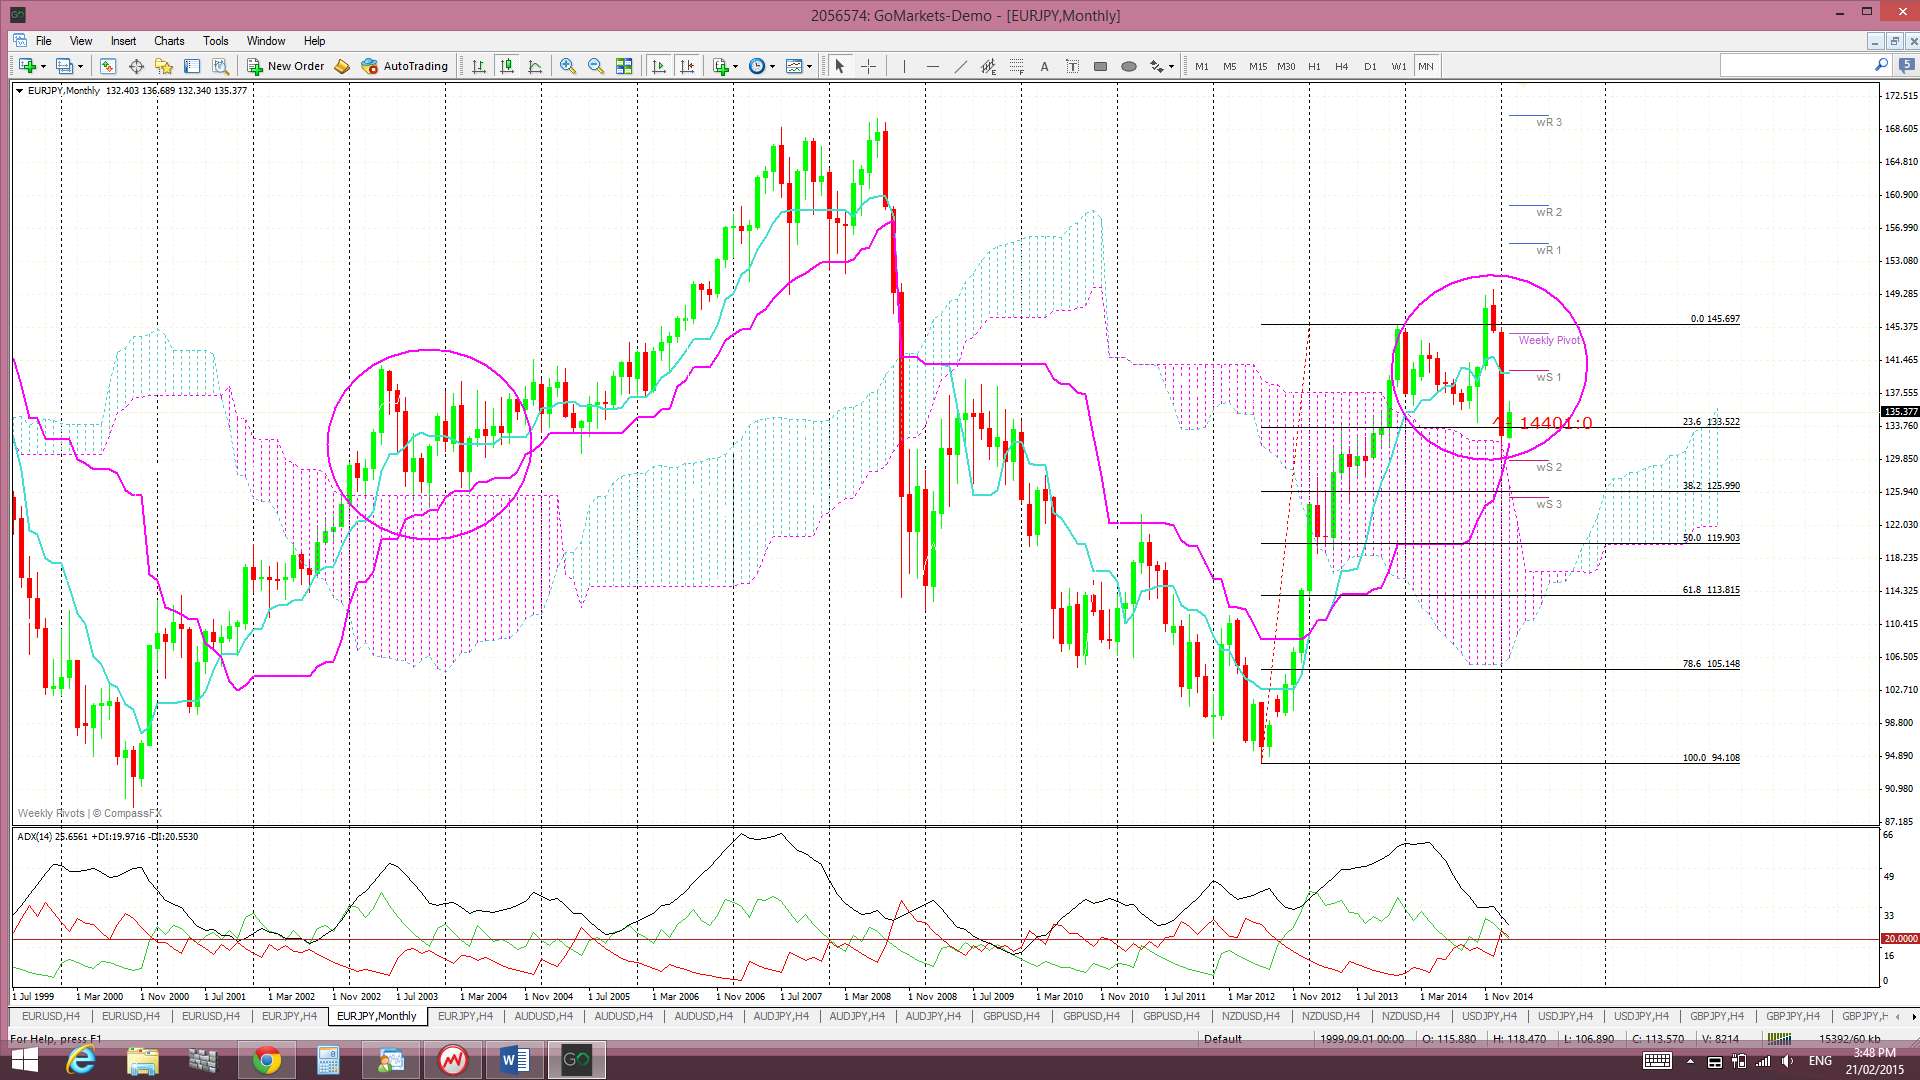
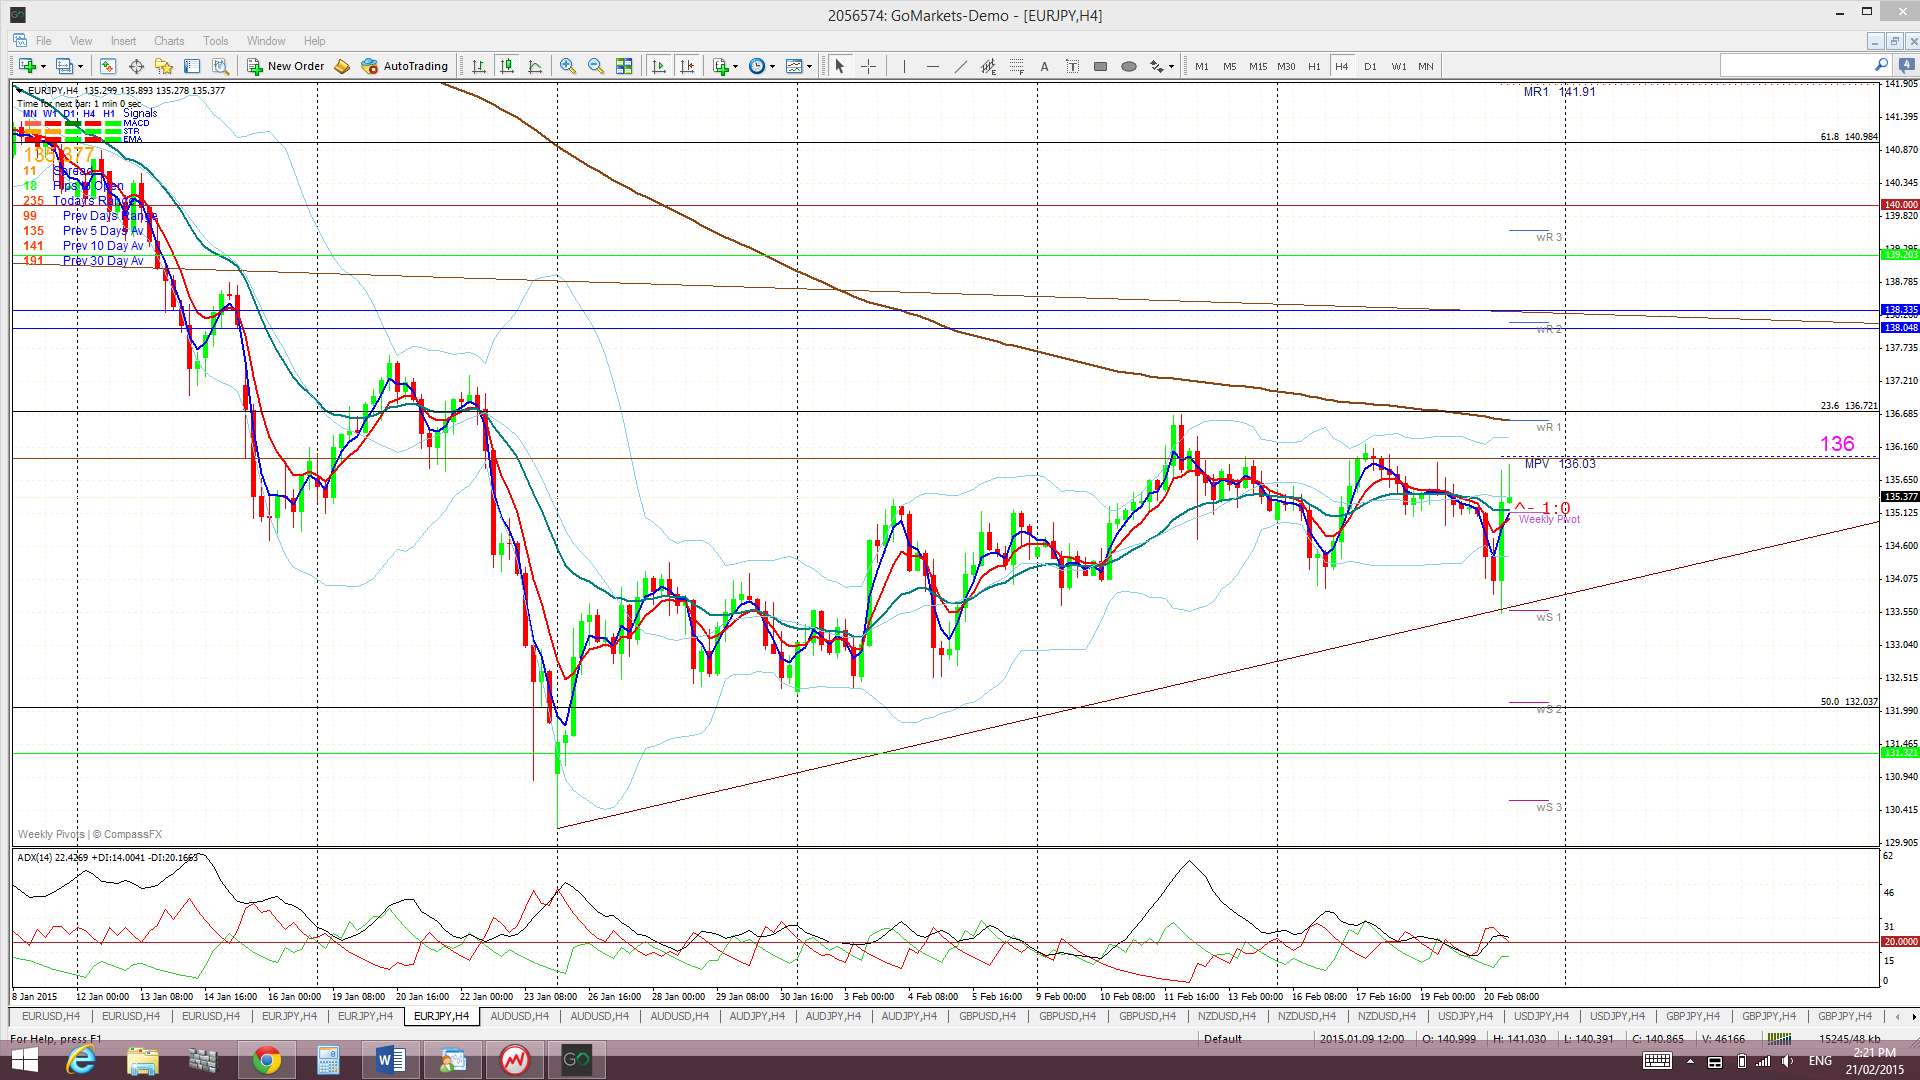
Price is trading in the Cloud on the 4hr chart, below on the daily and weekly charts but above on the monthly chart. I do note there has been a Tenkan/Kijun cross on the daily chart but the angles do not fully support a new bullish signal just yet.
The weekly candle closed as a bullish coloured ‘Spinning Top’ candle.
- I’m watching for any new TC signal on this pair, the 136 level and the top of the monthly Cloud.
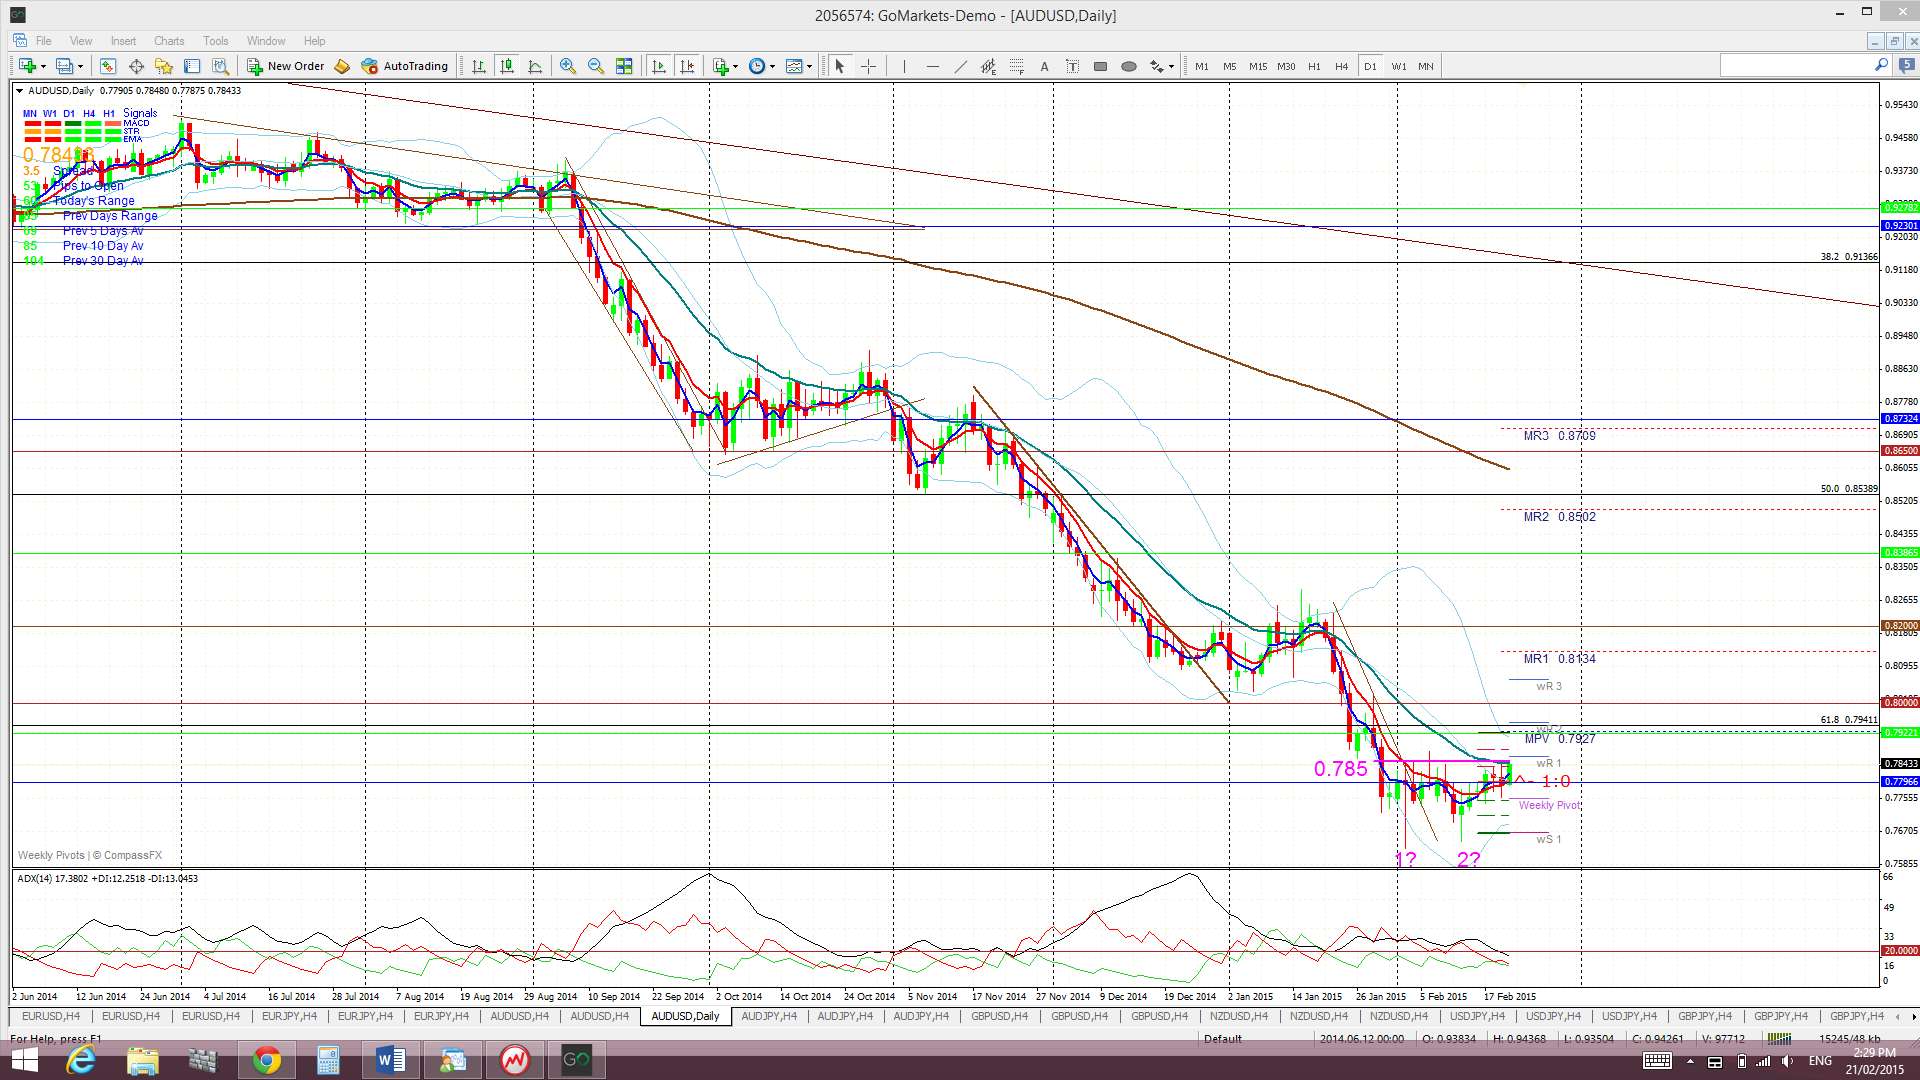
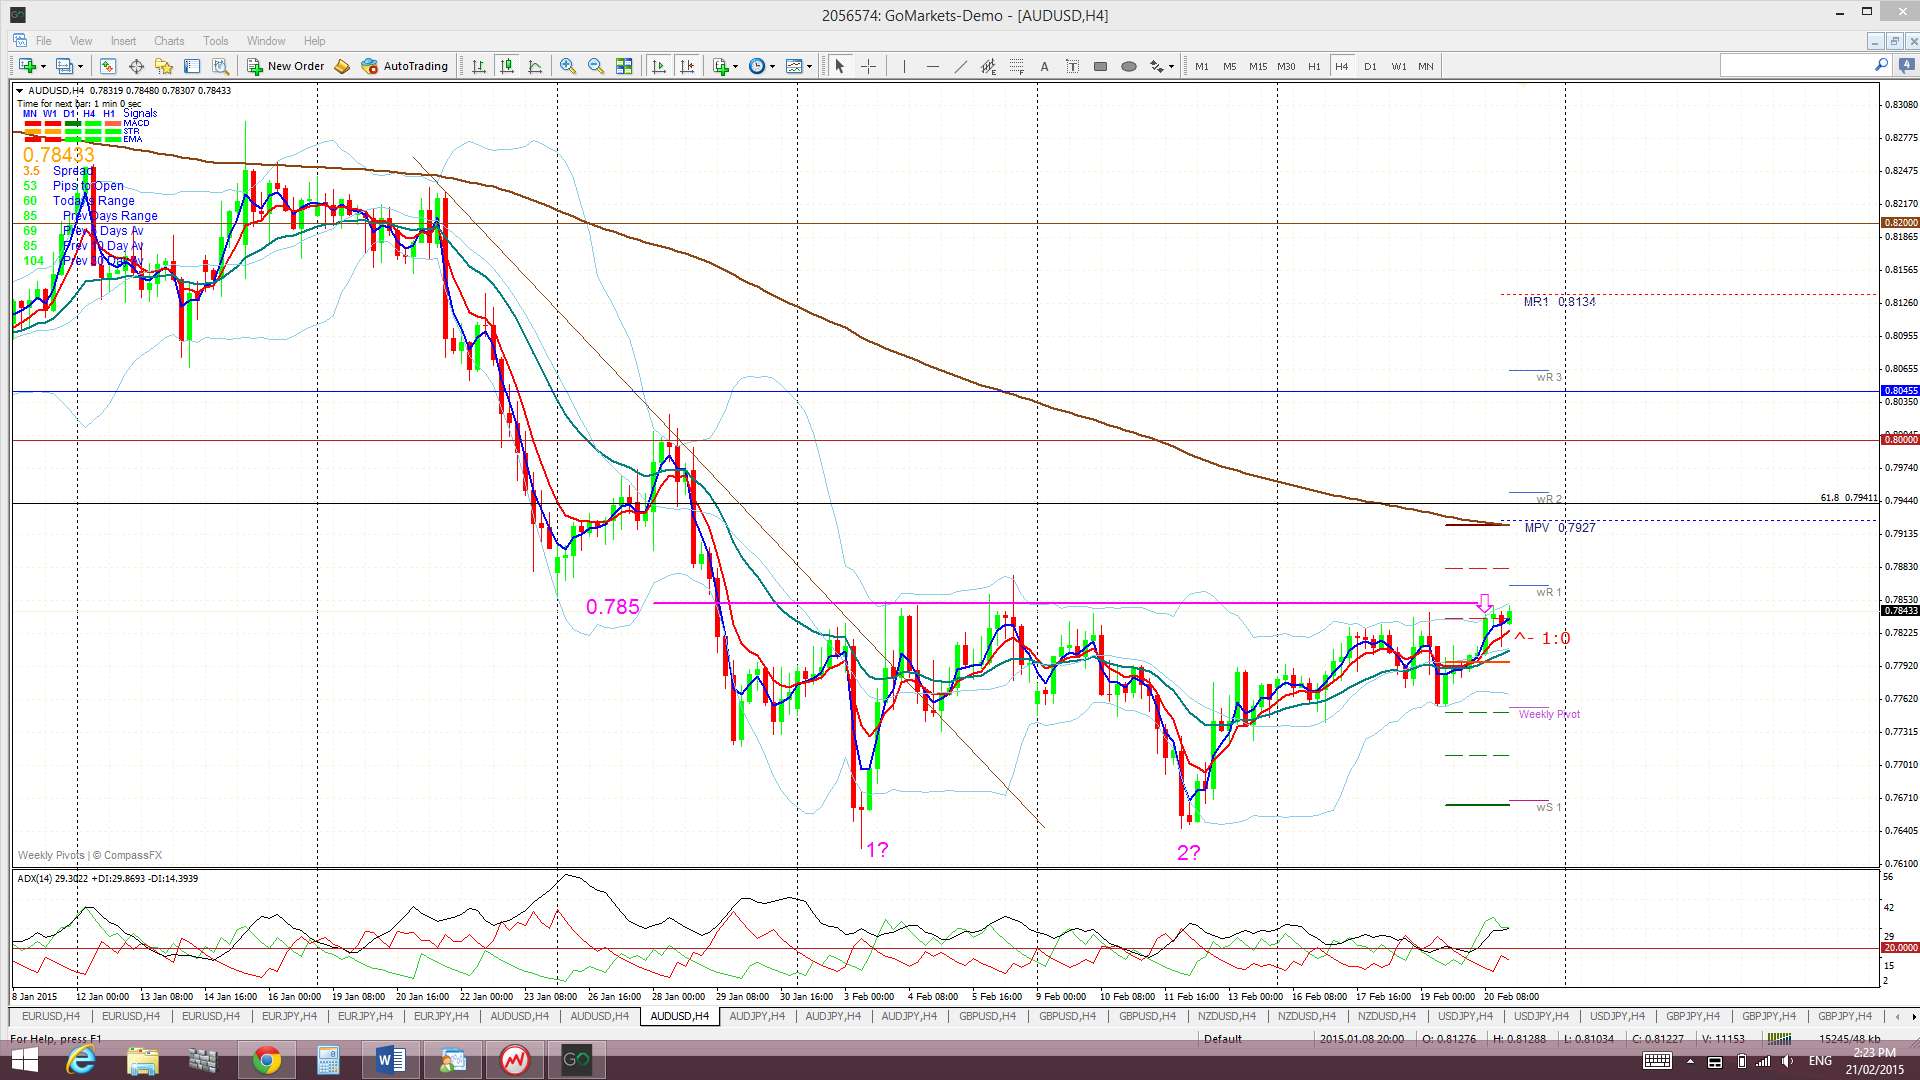
A/U: The A/U has chopped under the ‘neck line’ of a potentially bullish ‘Double Bottom’ for four weeks now. A new TC signal was triggered late on Friday BUT I would want to see a close above the 0,785 resistance level first.
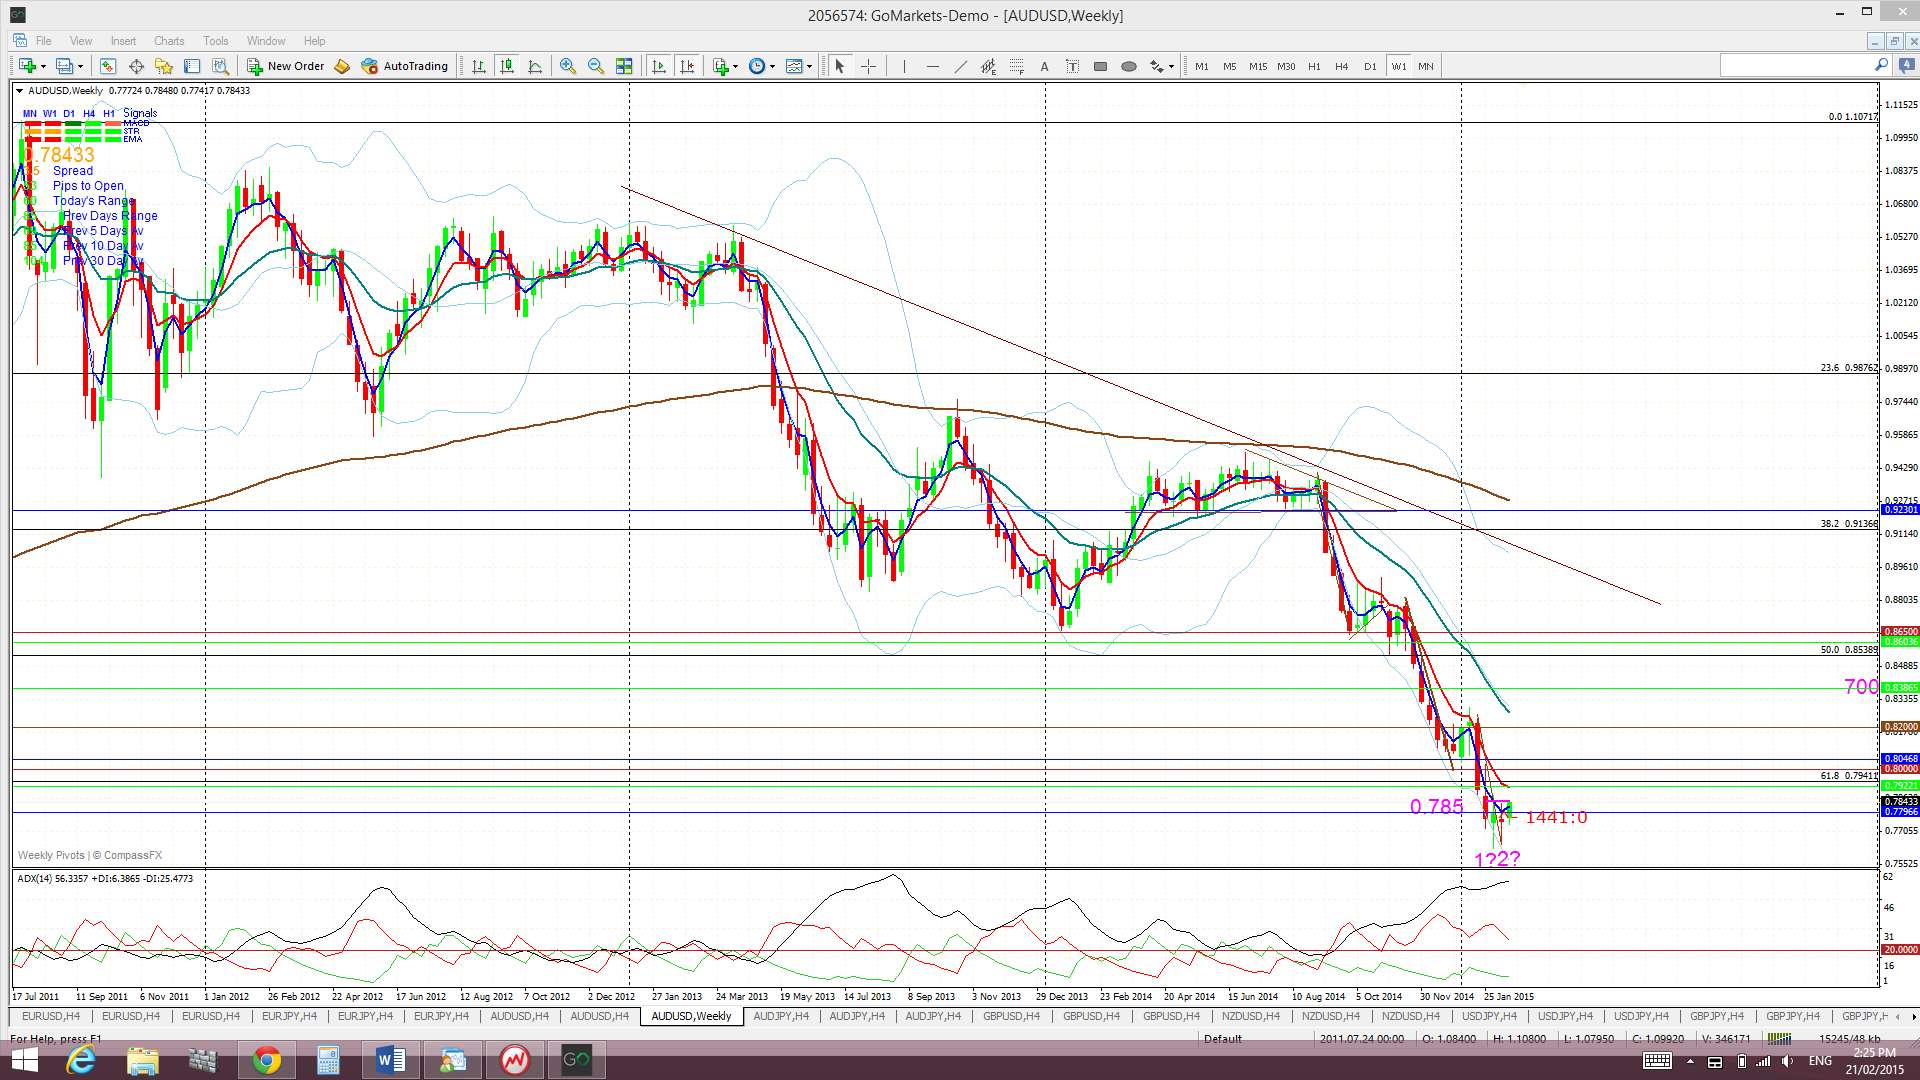
As I’ve been noting for the last few weeks though, the close and hold below 0.80 suggested the start of a possible 700 pip Bear Flag. Technical theory would have traders looking for a test of 0.80 before bearish follow through and, whilst we’ve already had one test, I’m still hoping for another. However, I’m keeping an open mind here as any continuing USD weakness could be a complete game-changer here. I’ll will be watching for any reaction at 0.80, if price manages to get back up that far, to see whether this level will halt any A/U ascent.
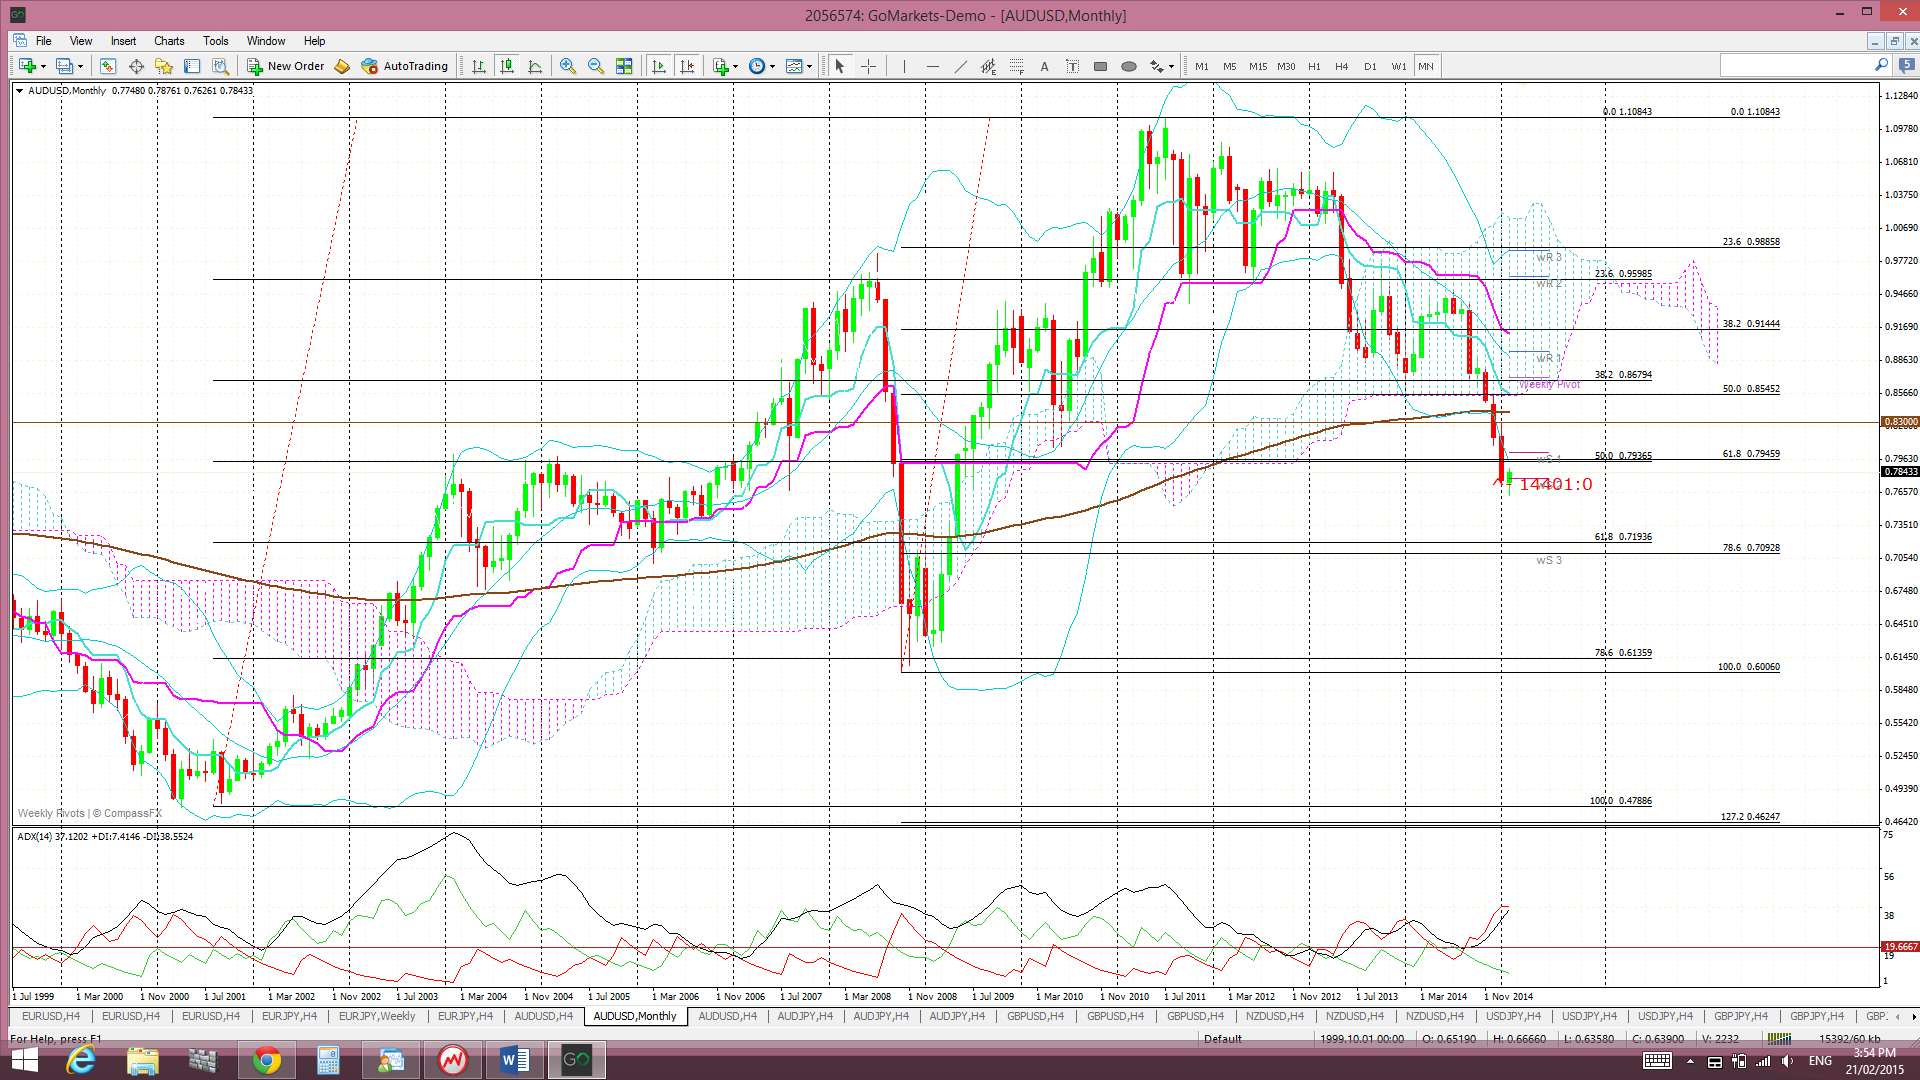
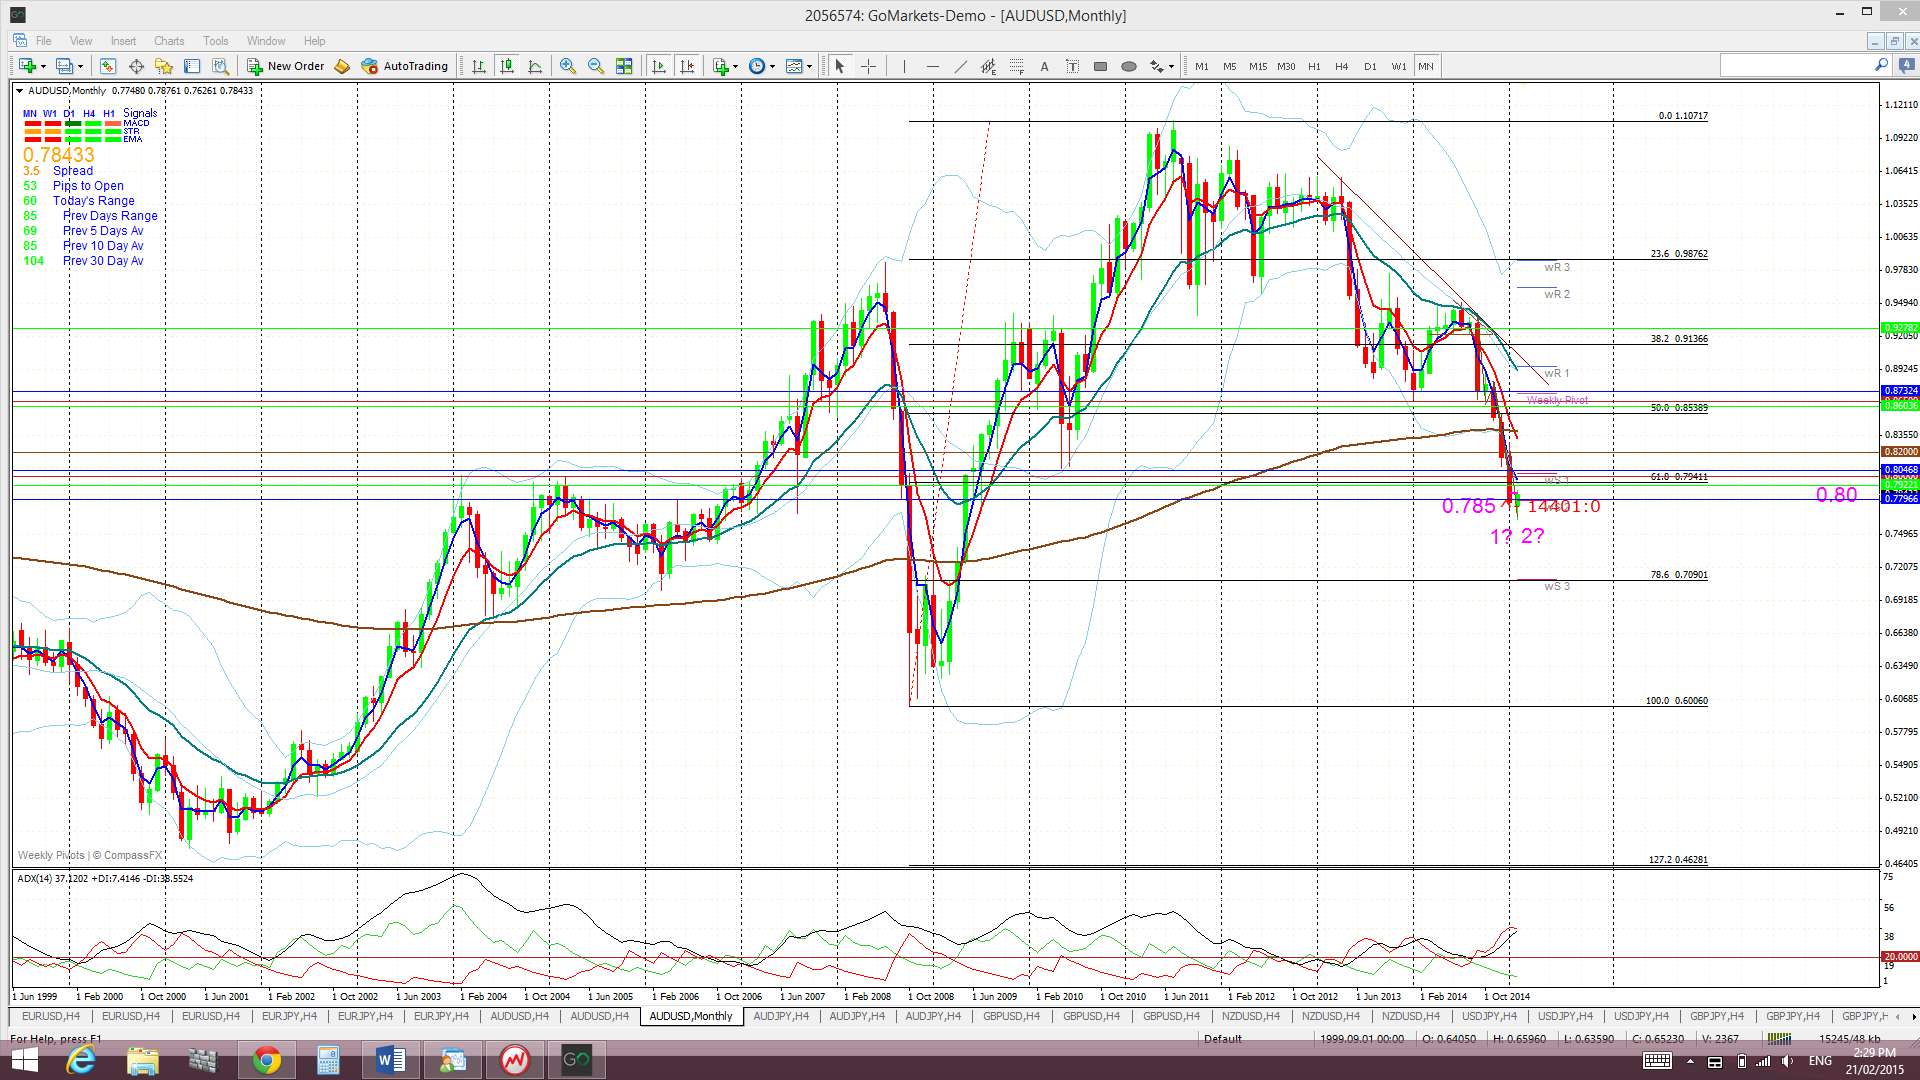
Bear Flag? The break and hold below this 0.80 support suggests the start of a possible new 700 pip Bear Flag. It is no surprise that 0.80 had offered some decent support for the A/U as this was the region of the 61.8% fib from the 2008-2011 bull run and the 50% fib of the 2001-2011 bull run. The break and hold below 0.80 support suggests a trip lower and possibly down to the 70 region where the next layers of fib support kick in. This move has already given over 300 pips but appears to have stalled. I will still look for any other possible test of the 0.80 level to join this Bear Flag trade.
As previously noted: A number of commentators are now claiming that the A/U may have bottomed here and to look for reversal. As mentioned, I’ll be keeping an open mind here BUT, when you look at the monthly chart below, price does seem to be in a bit of ‘no-man’s land’. Had this recent bounce come off one of the noted fib levels then I’d be more on board to support a pullback:
Price is now trading above the Cloud on the 4hr chart but below the Cloud on the daily, weekly and monthly charts.
The weekly candle closed as a small bullish candle.
- There is a new TC signal on this pair BUT I’m waiting for a close and hold above 0.785.
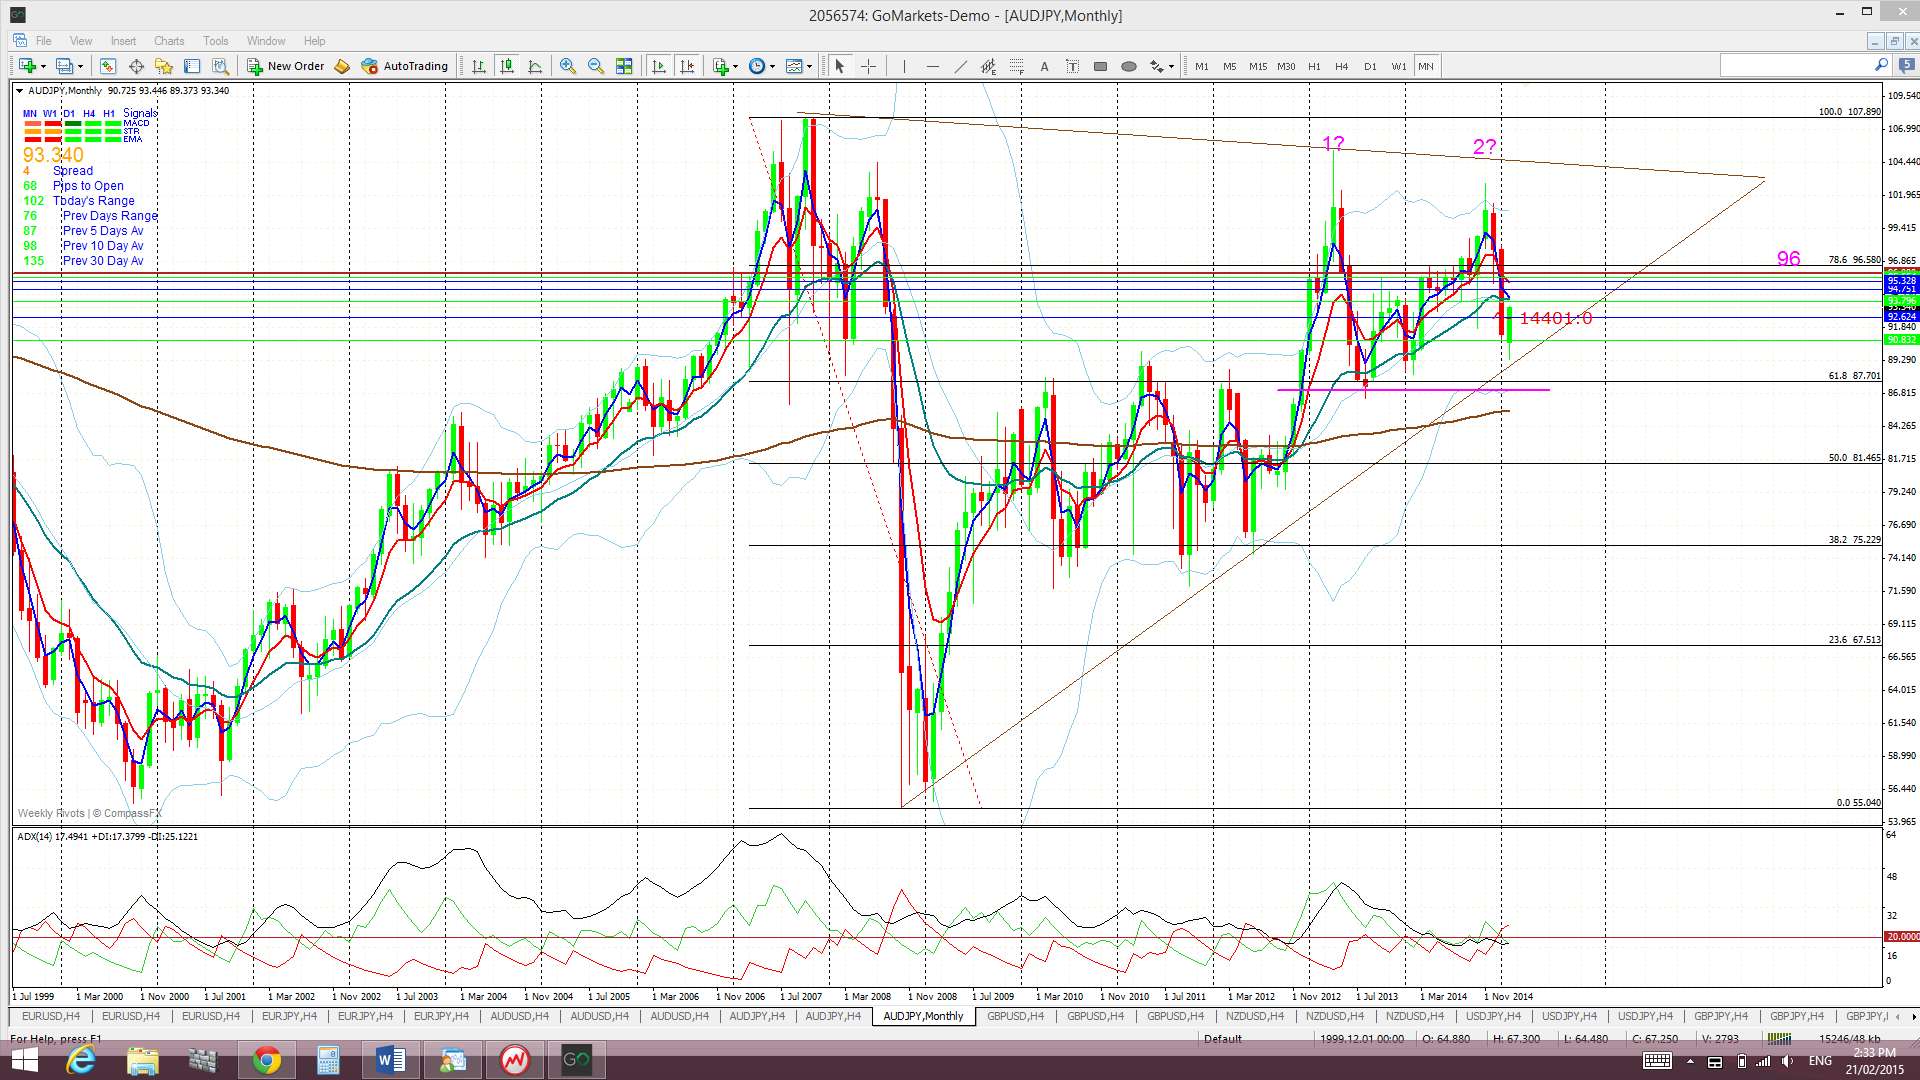
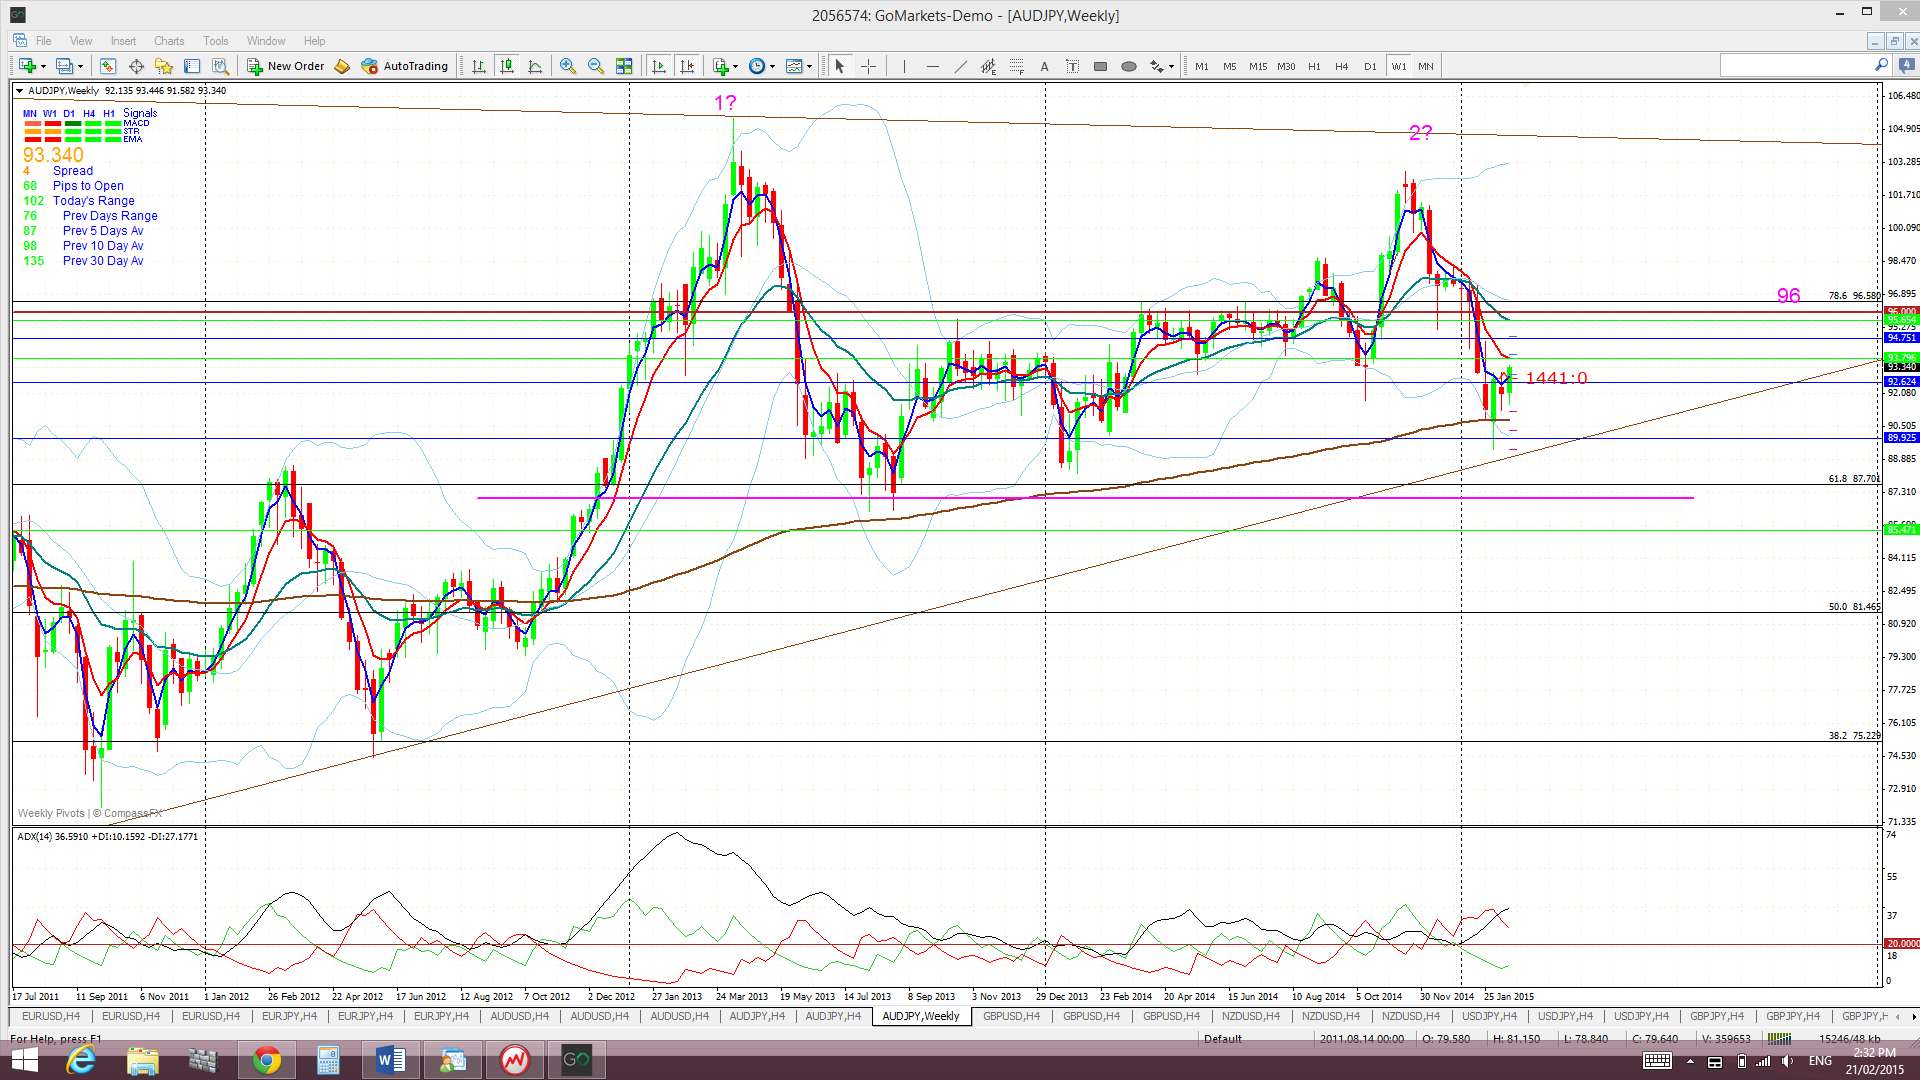
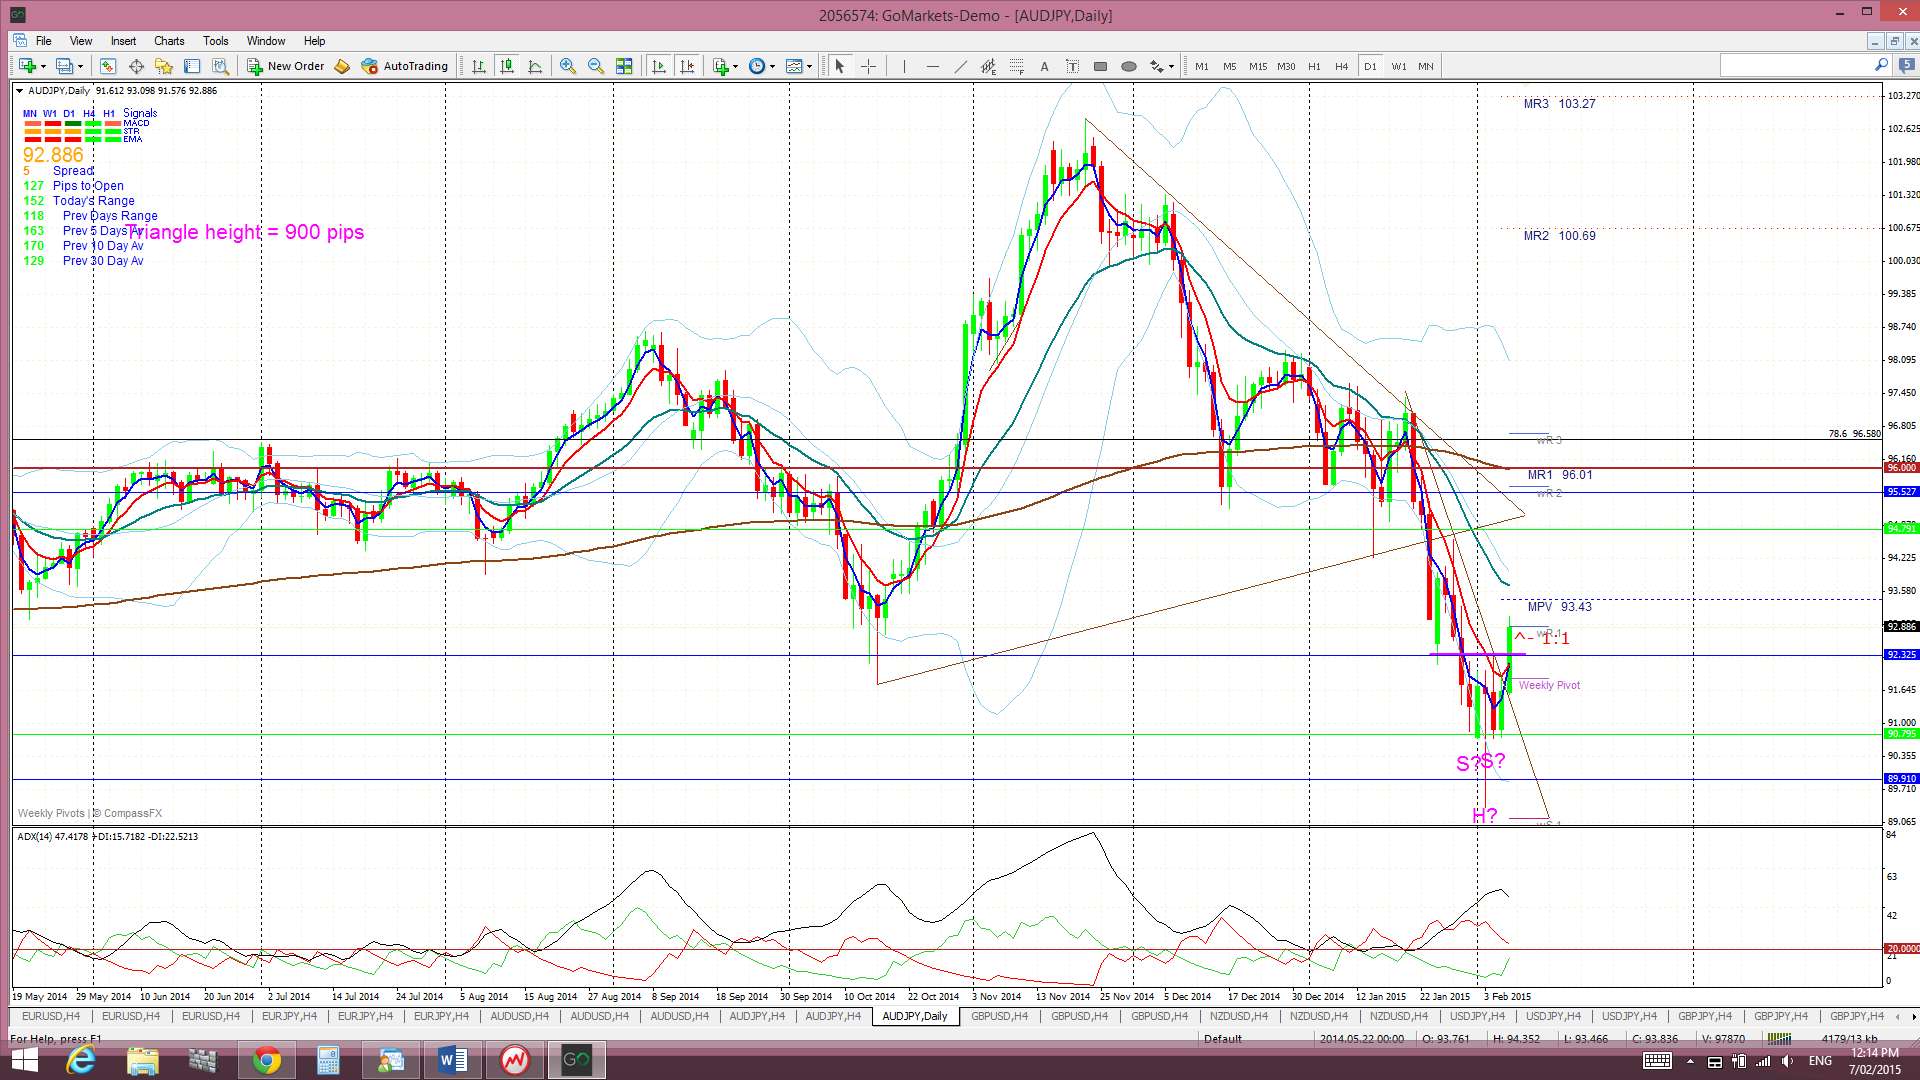
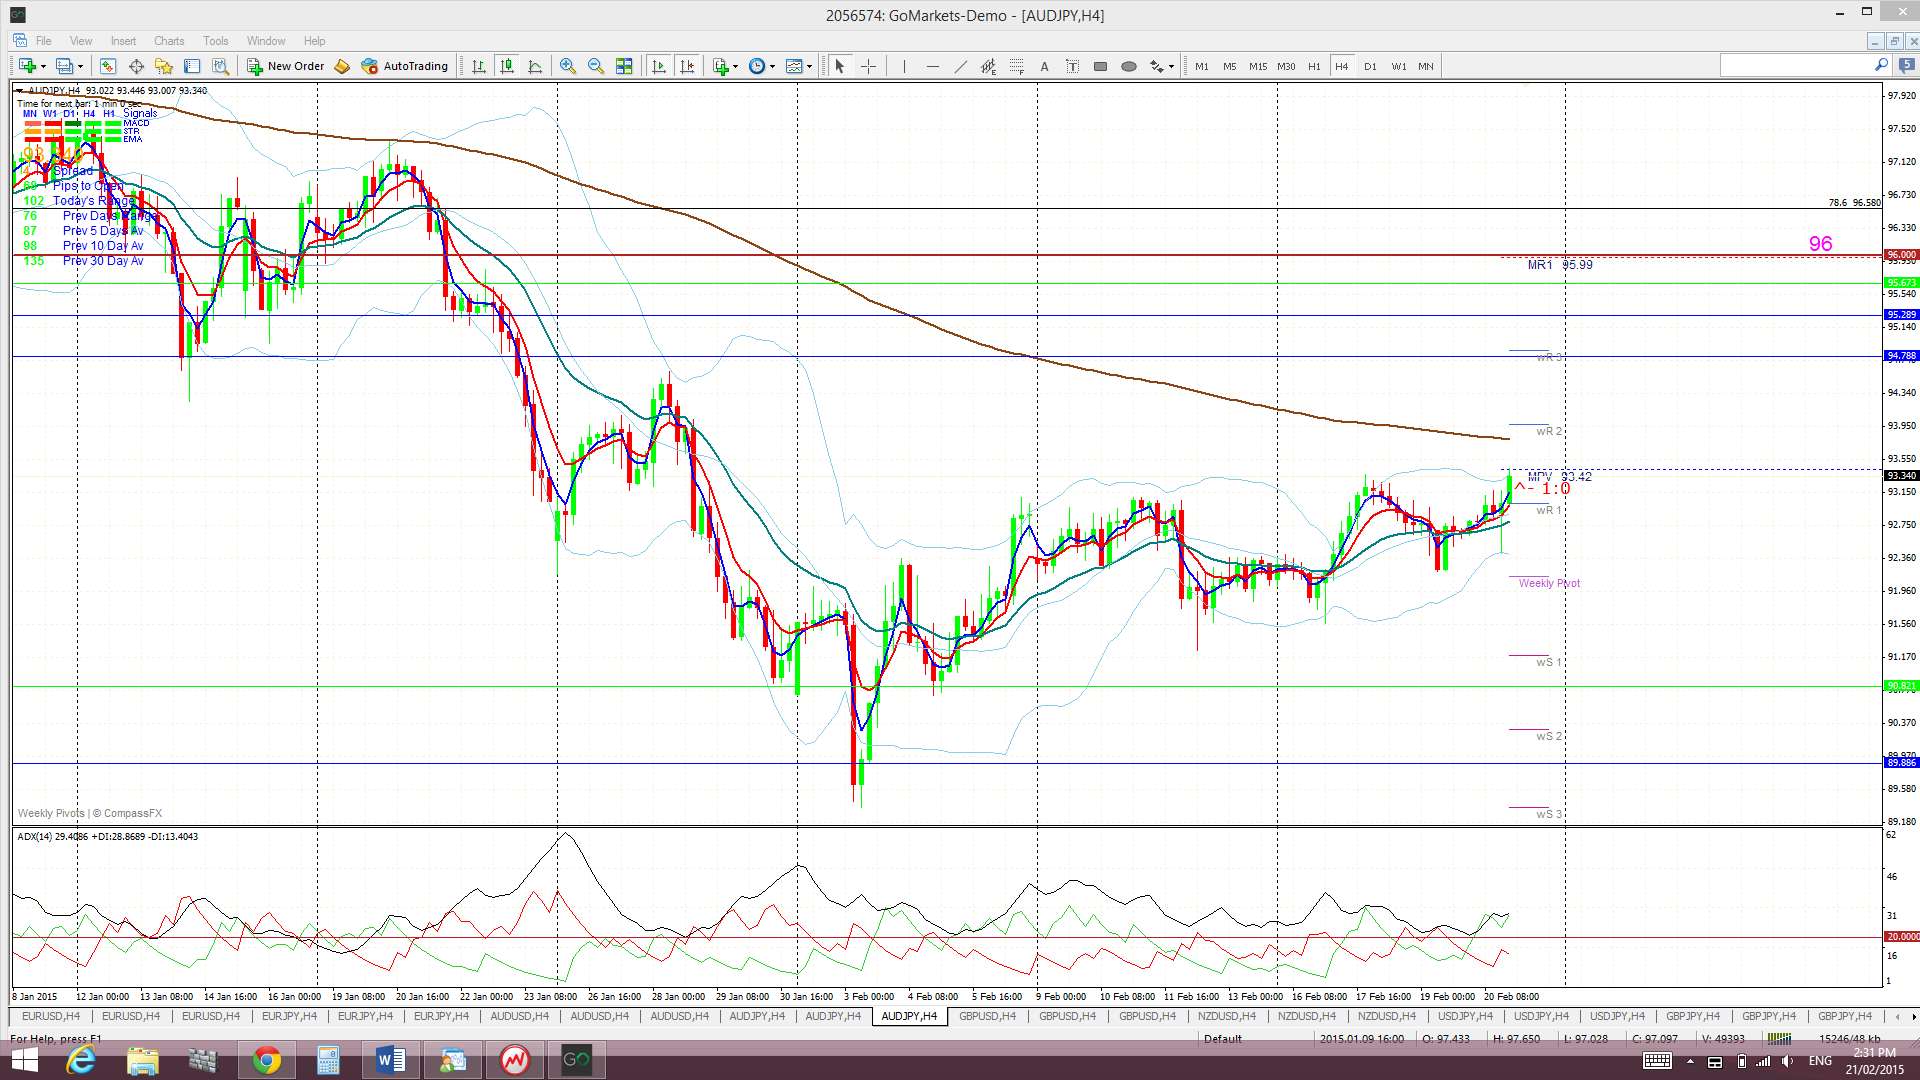
A/J: The A/J has chopped aimlessly under the 96 level for the last few weeks. This pair essentially bounced up off the bottom monthly triangle trend line some weeks ago and looks to be back ranging within this monthly triangle pattern.
Monthly Chart ‘Double Top’? Price is well above 87 for now BUT this level looks to be the ‘neck line’ of a monthly chart ‘Double Top’ pattern. The height of this ‘Double Top’ is at least 1,500 pips and any bearish monthly break and hold below 87 would suggest similar follow through. Watch for any monthly close and hold below 87 for a possible 1,500 pip+ bearish move.
Price is trading above the Cloud on the 4hr chart, below on the daily, in the Cloud on the weekly chart but above the Cloud on the monthly chart.
The weekly candle closed as a bullish, almost ‘engulfing’, candle.
- I’m watching for any new TC signal on this pair and the 96 level.
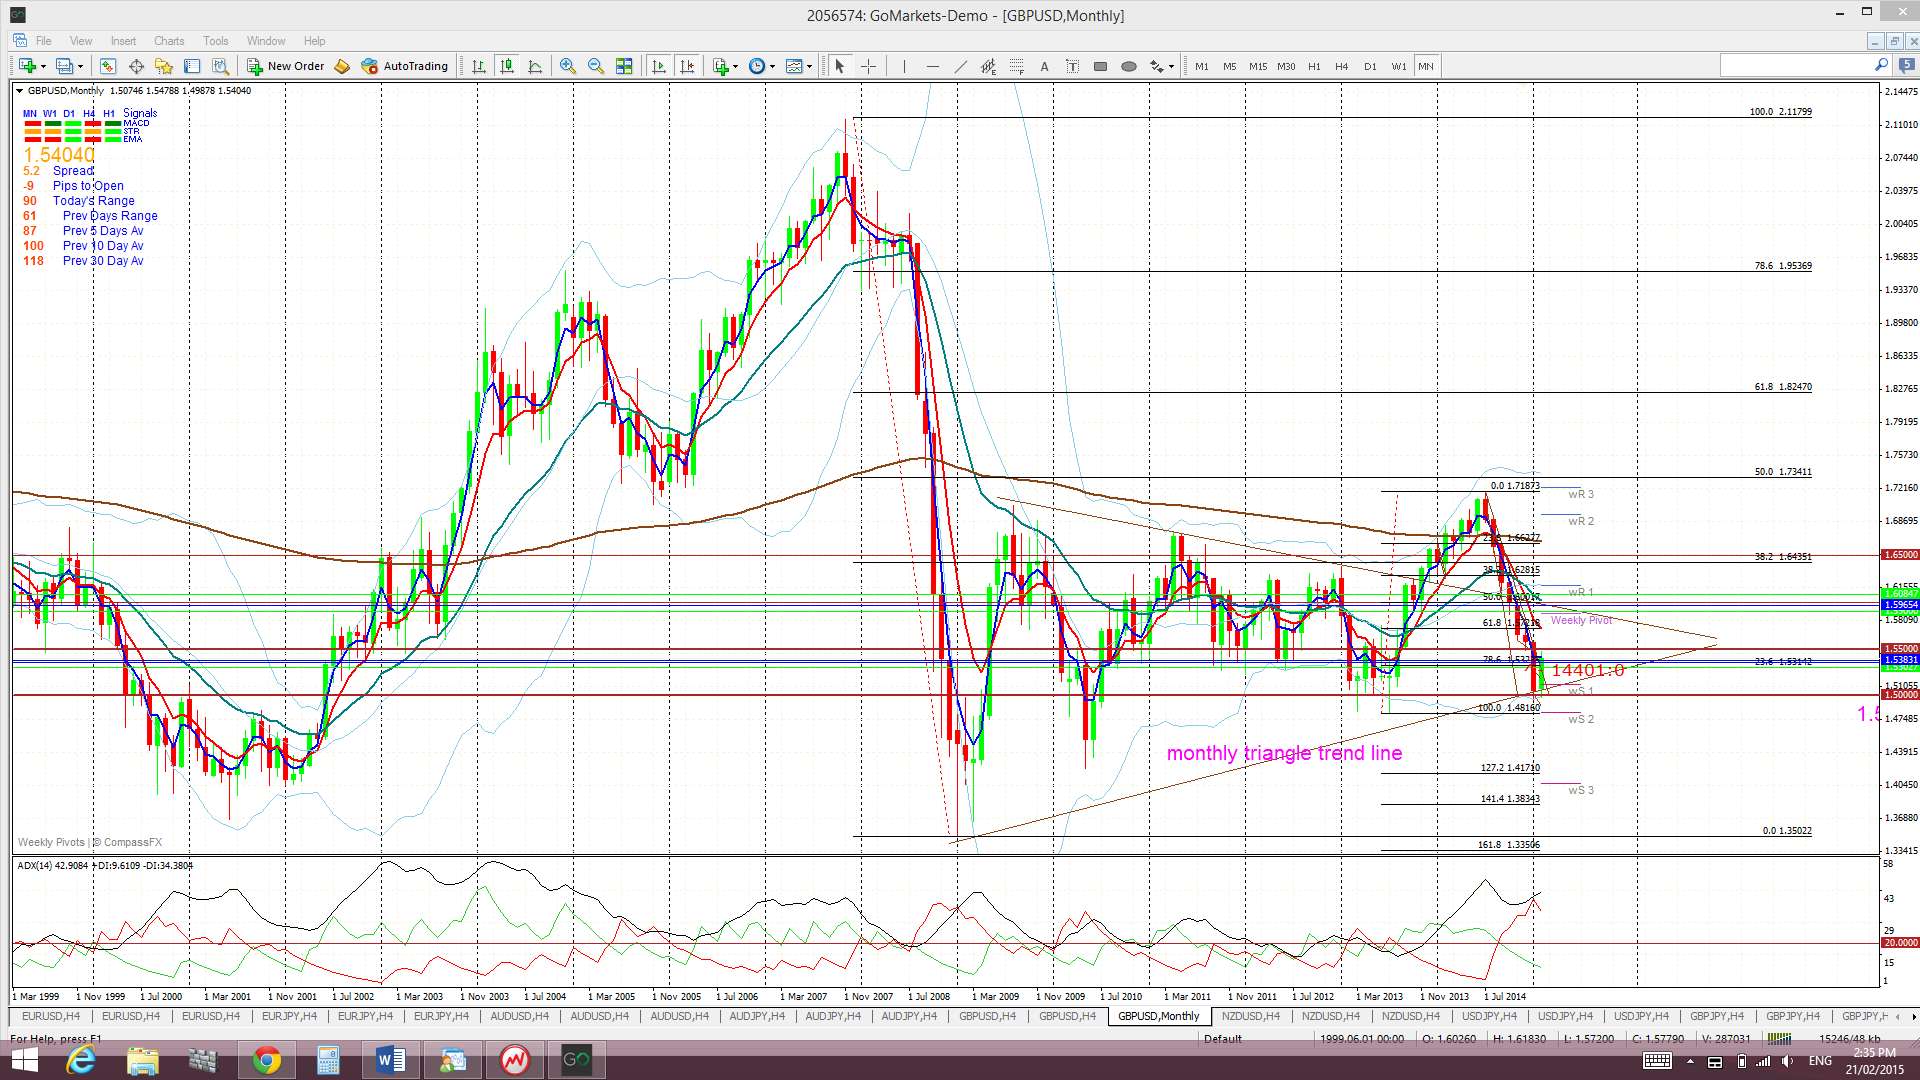
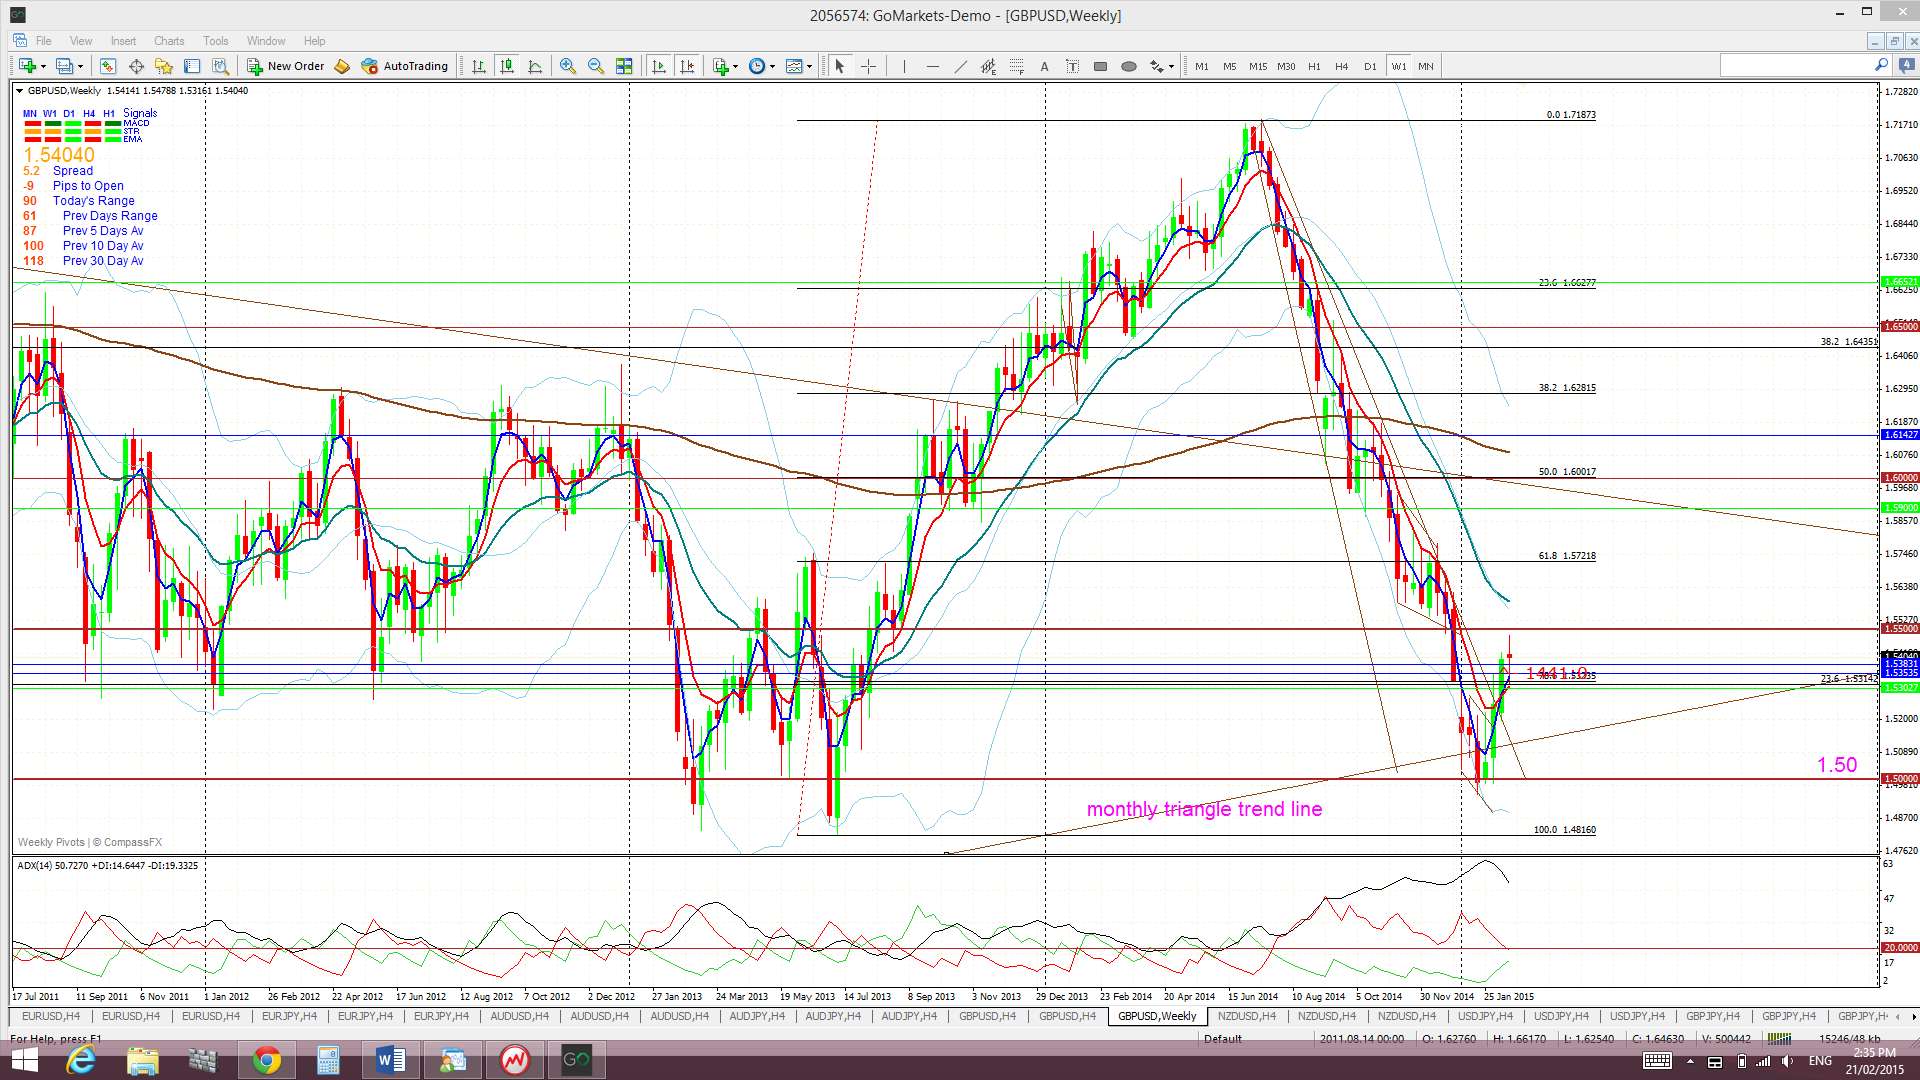
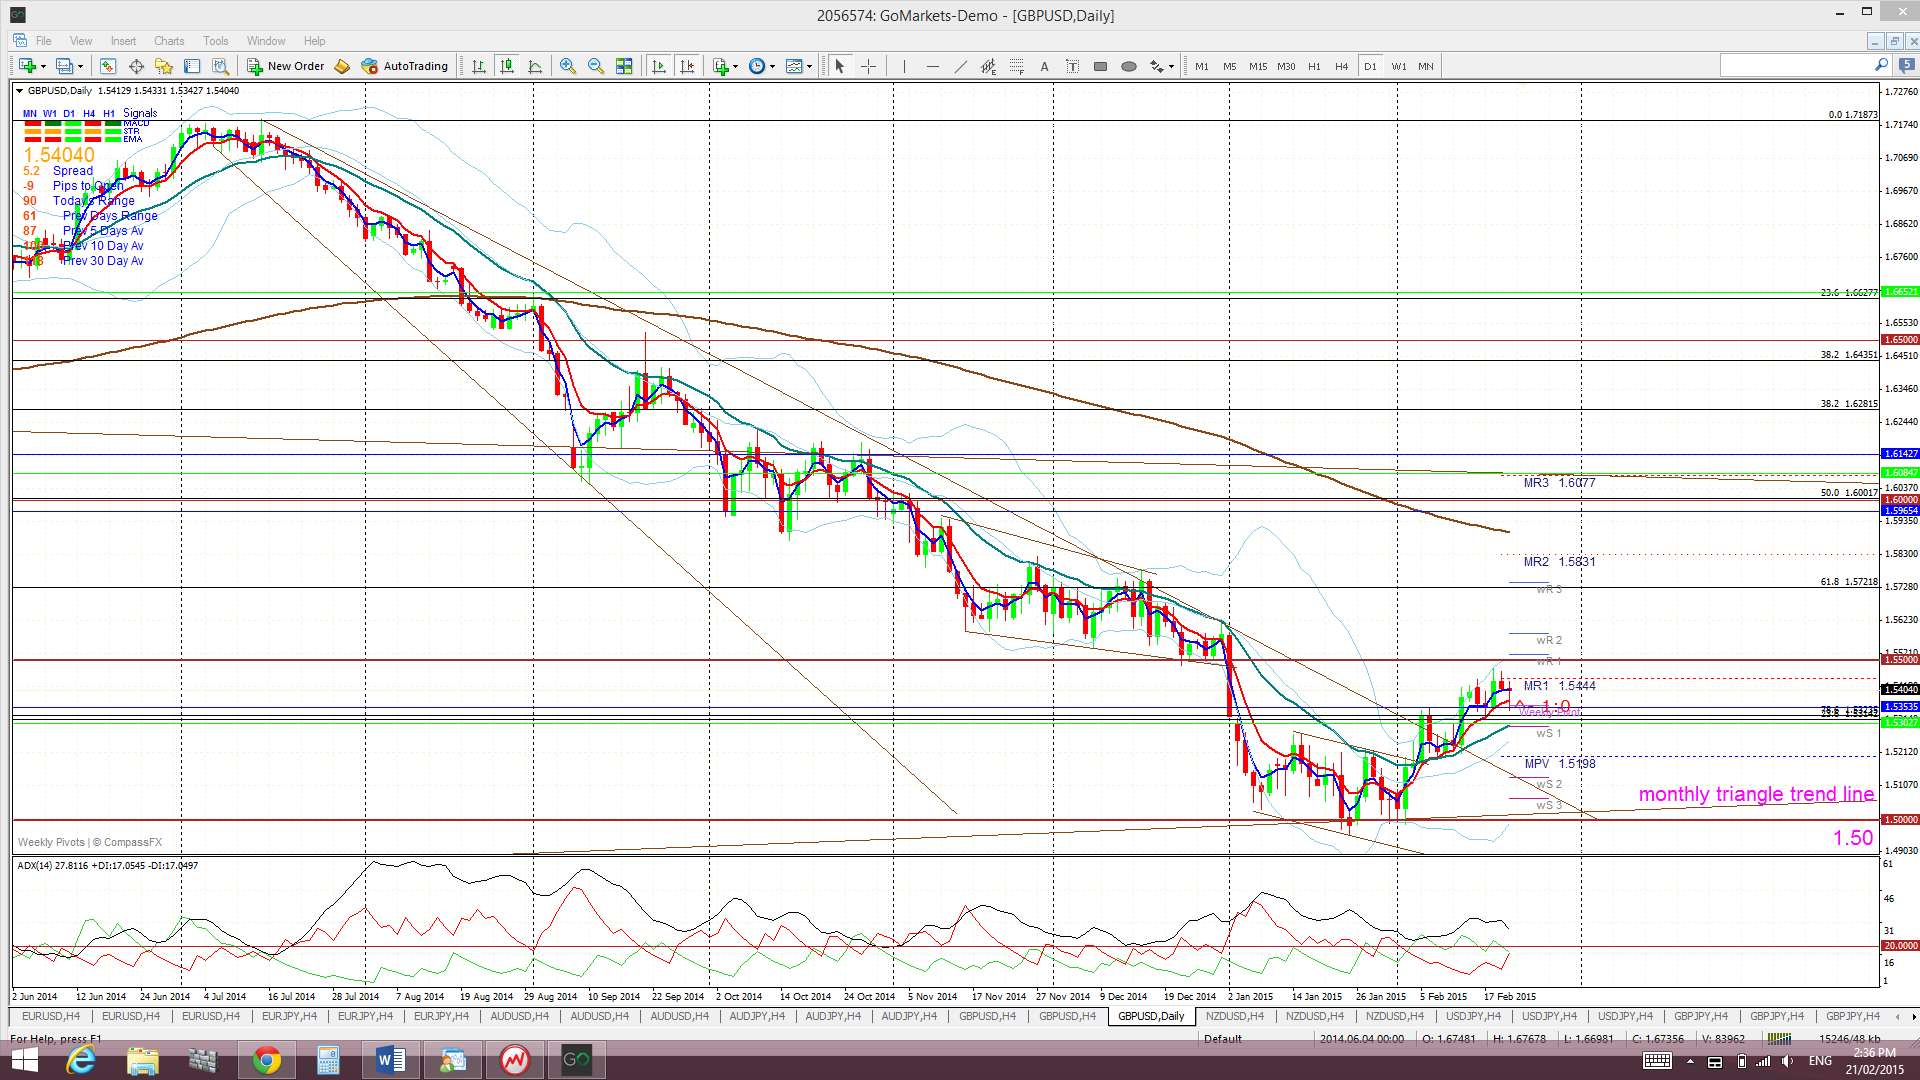
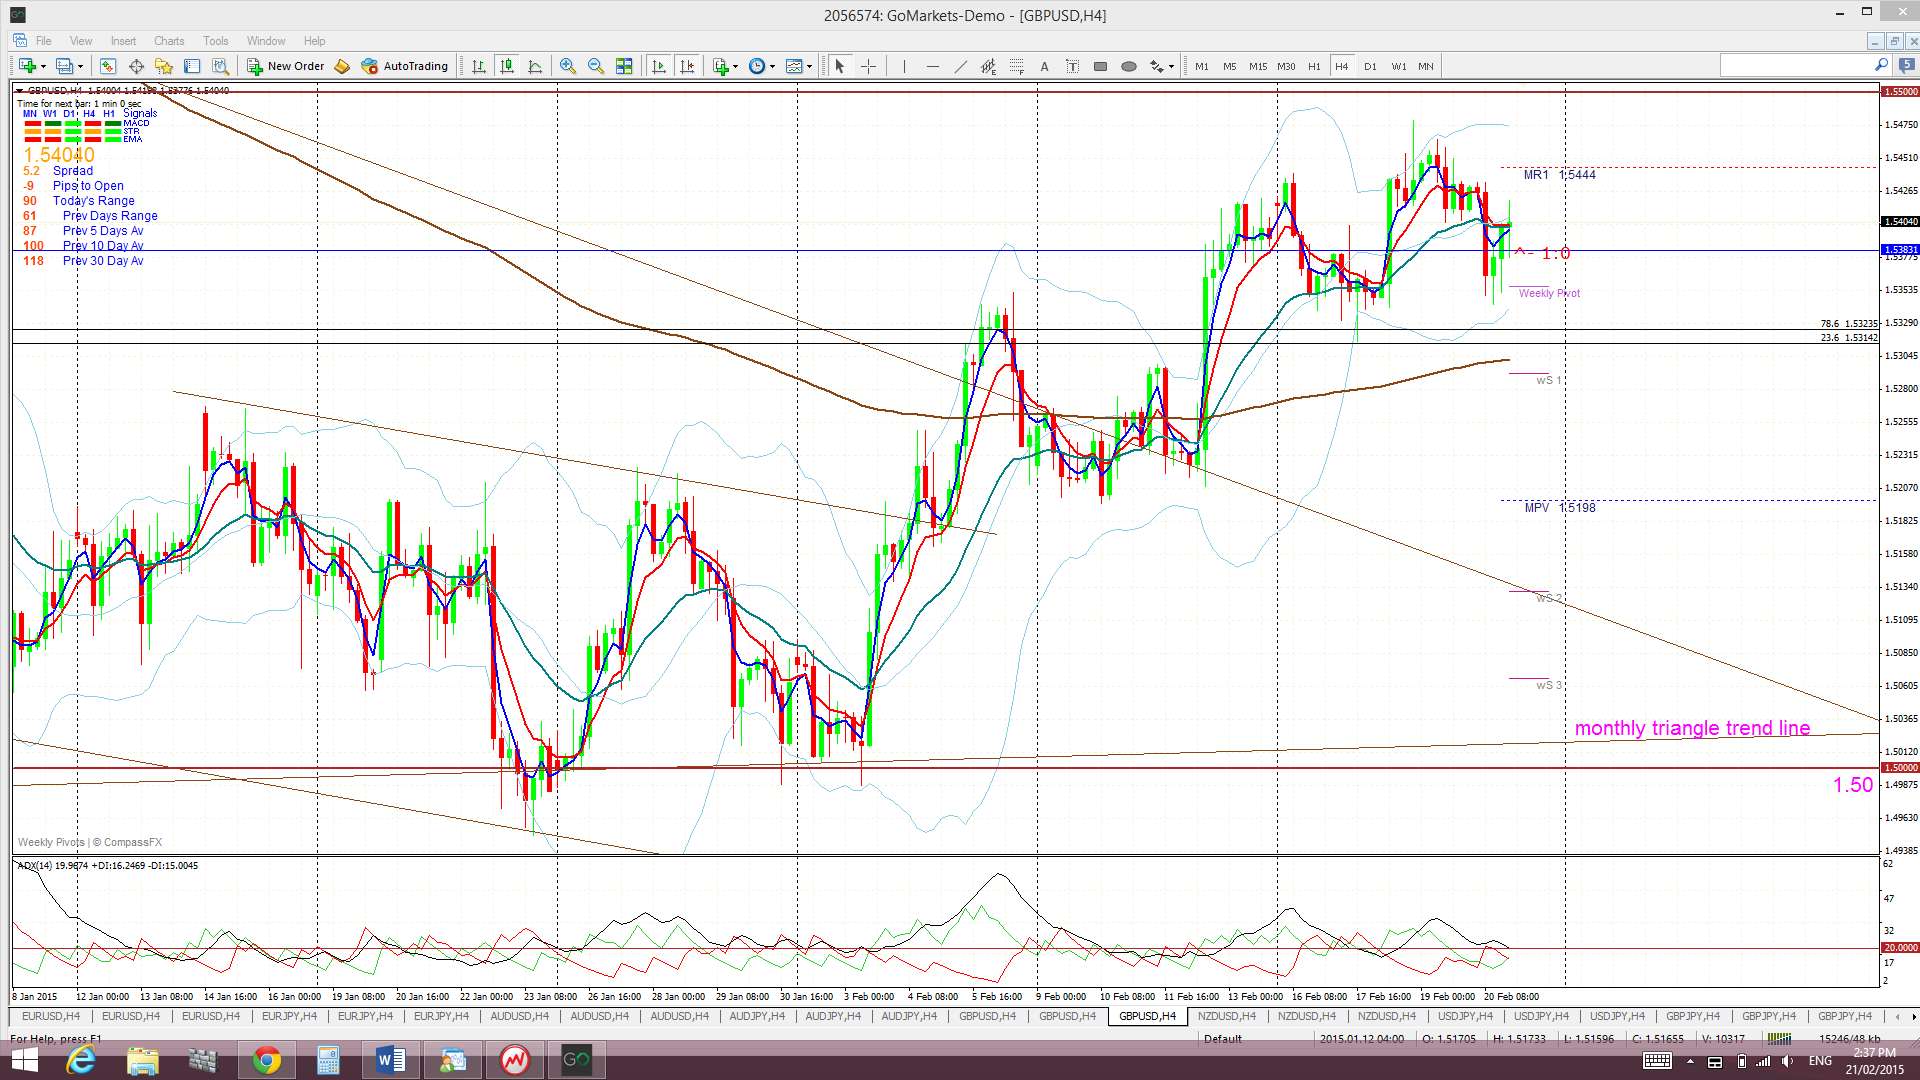
G/U: Price has stalled under the combined resistance of the 1.55 level and top of the daily Cloud region but this follows on from the bullish bounce up off 1.50 support. There has also been a bullish breakout above a weekly chart bear trend line that had been in force since July last year.
Price edged higher again last week but has been battling the daily Cloud. Any new close and hold above the daily Cloud would be another bullish signal.
Price is now trading above the Cloud on the 4hr chart, IN the Cloud on the daily chart but below on the weekly and monthly charts. Keep an eye on the daily Cloud chart though as any new close and hold above the daily Cloud would have be seen as bullish:
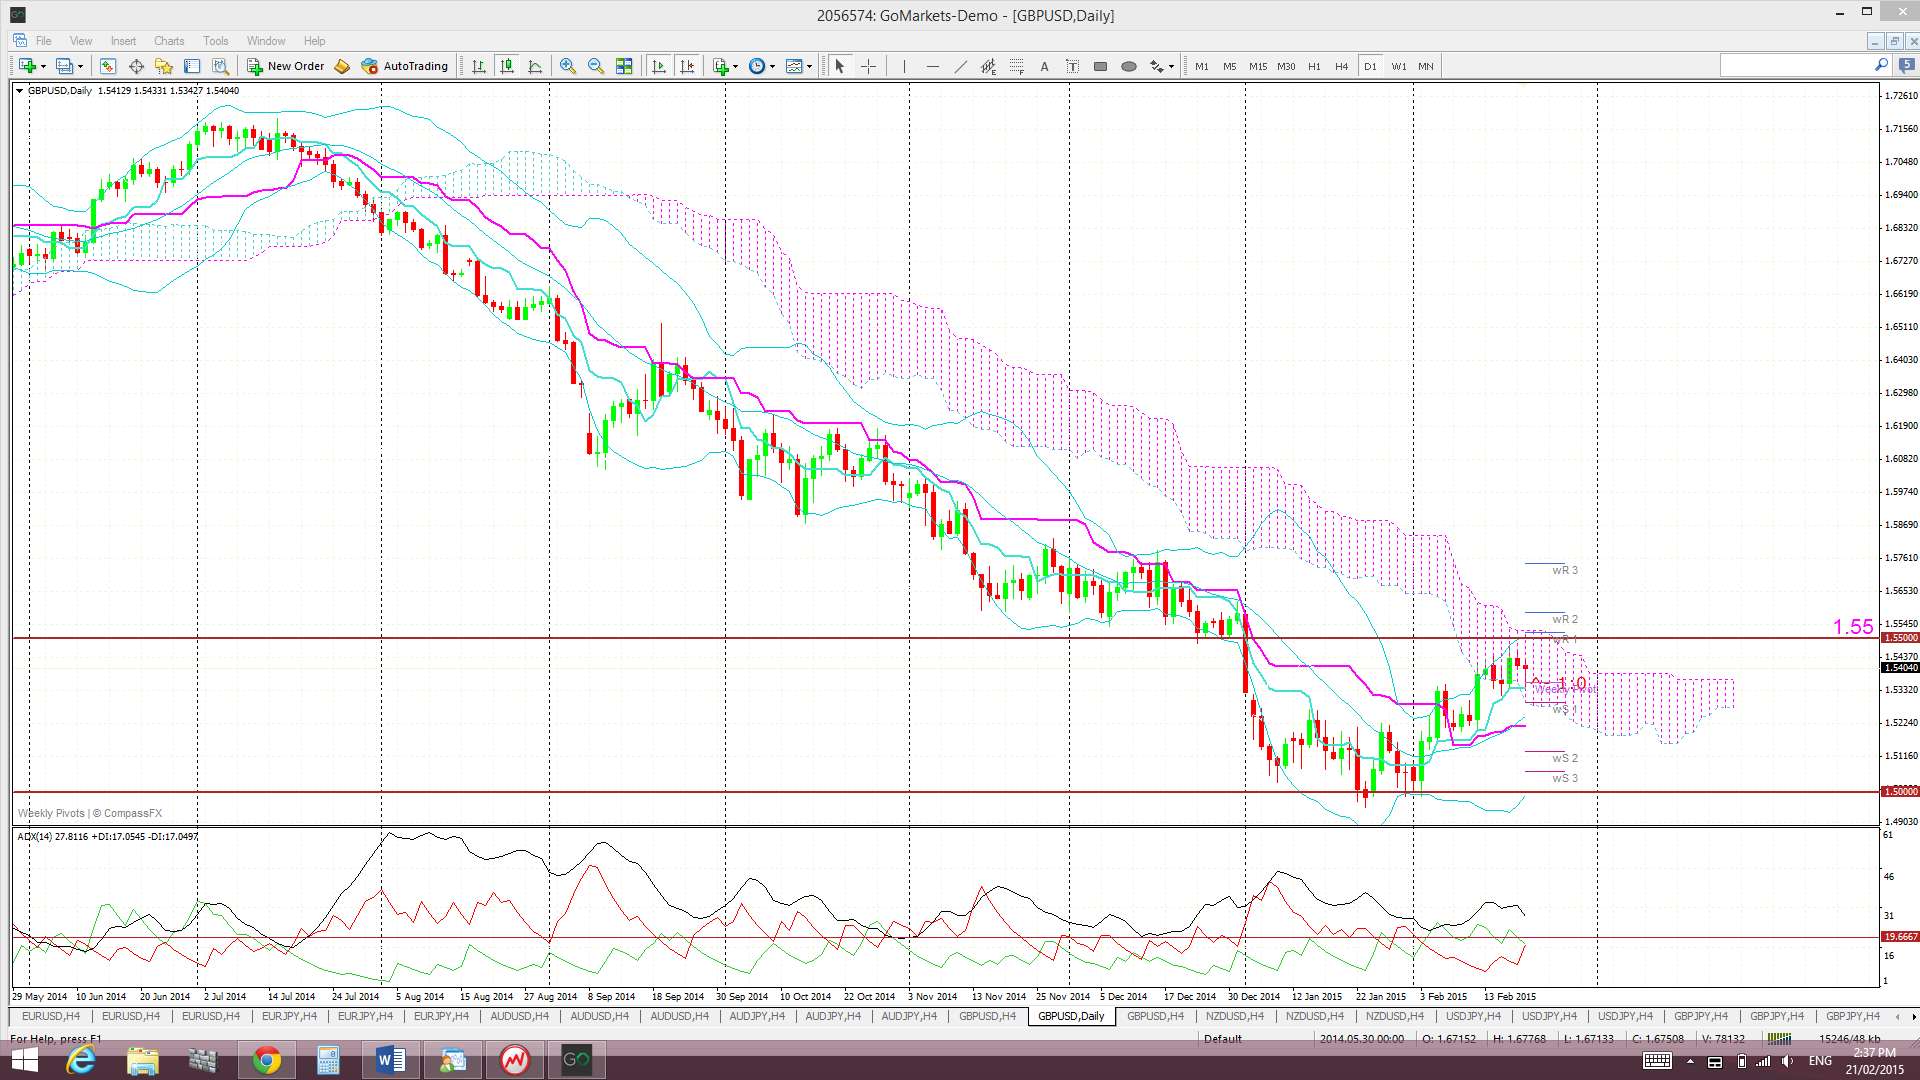
Bear Flag? The 1.55 level will be a key level to watch as any failure to break and hold above this level could start to tell a very different story. We’ve seen many ‘Bear Flags’ form up on other pairs, such as the A/U, EUR/USD and Kiwi, and failure at 1.55 could form the upper limit of a Bear Flag on the Cable IF this level remains unbroken! The ‘Flagpole’ here would be about 2,000 pips in size so will be worth watching should it develop!
The weekly candle closed as a bearish coloured ‘Spinning Top’/ Doji candle.
- I’m watching for any new TC signal on this pair, the daily Cloud and the 1.55 level.
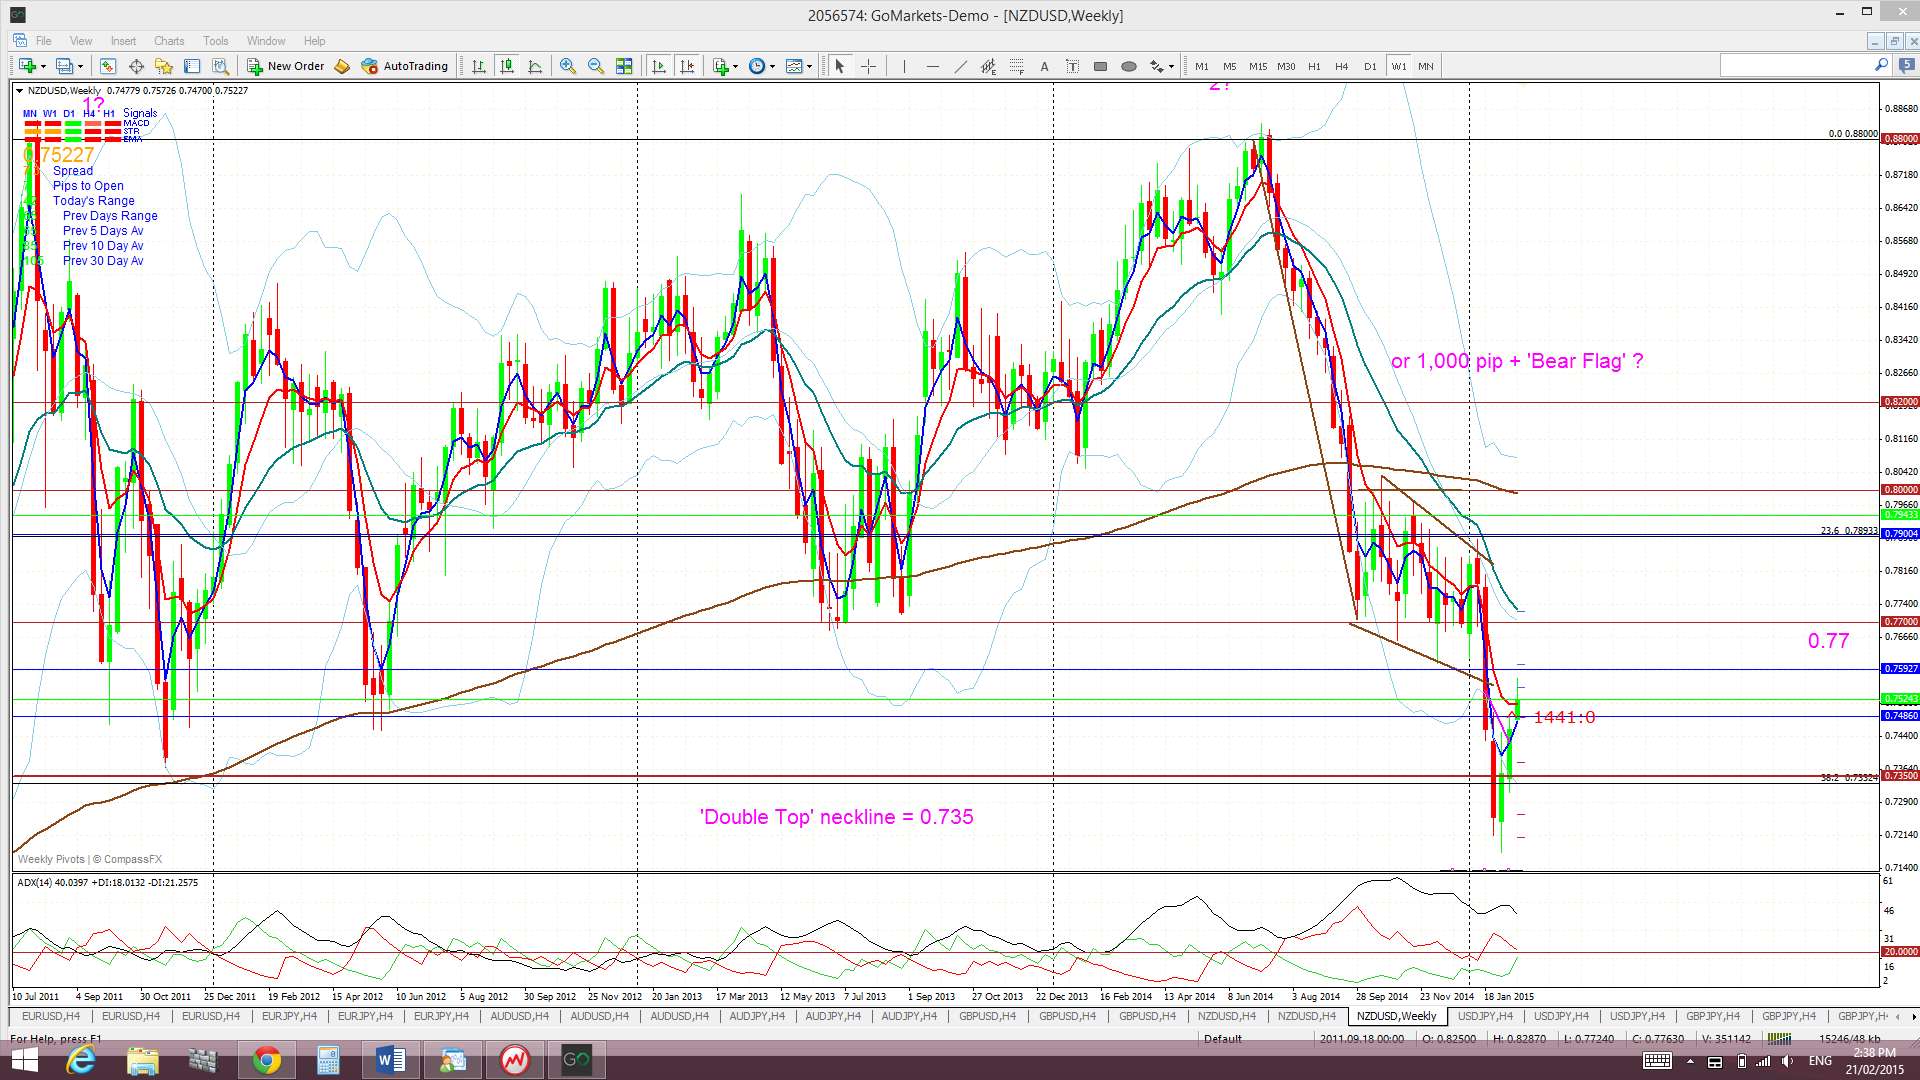
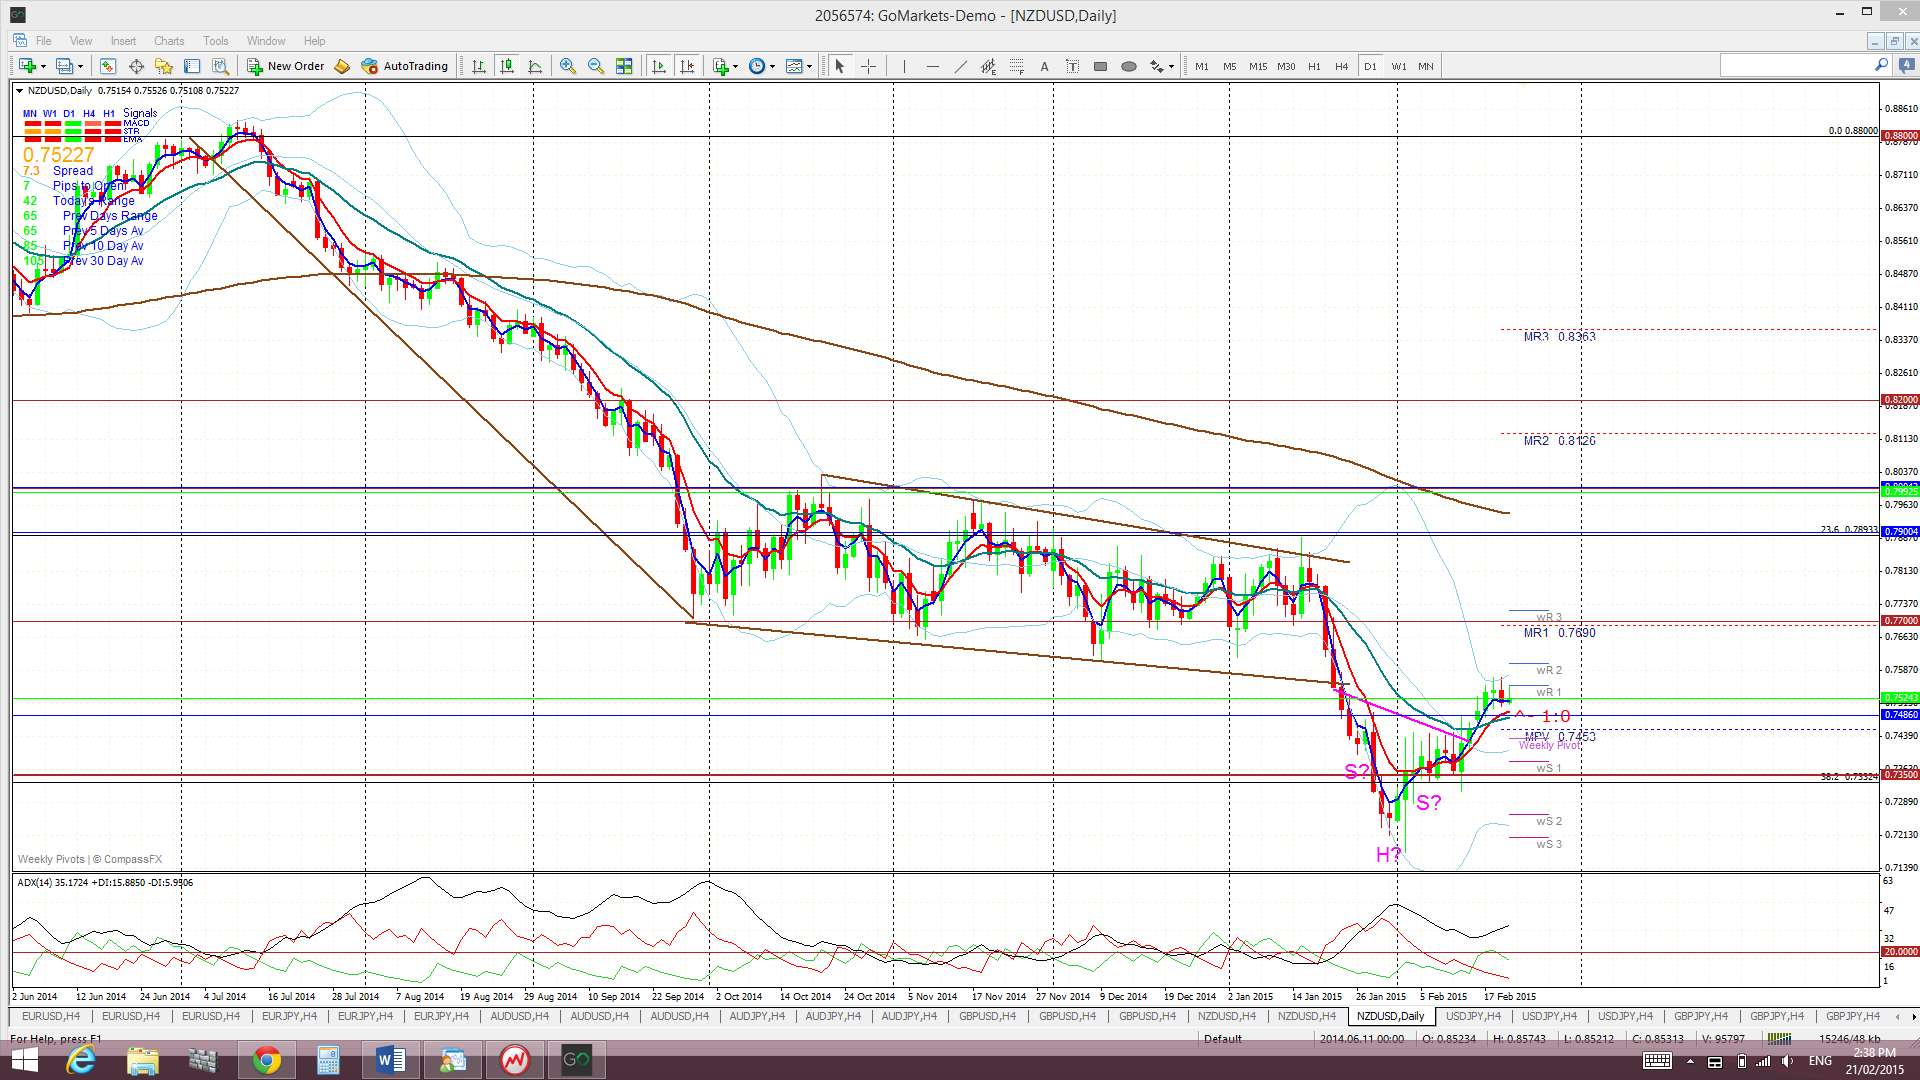
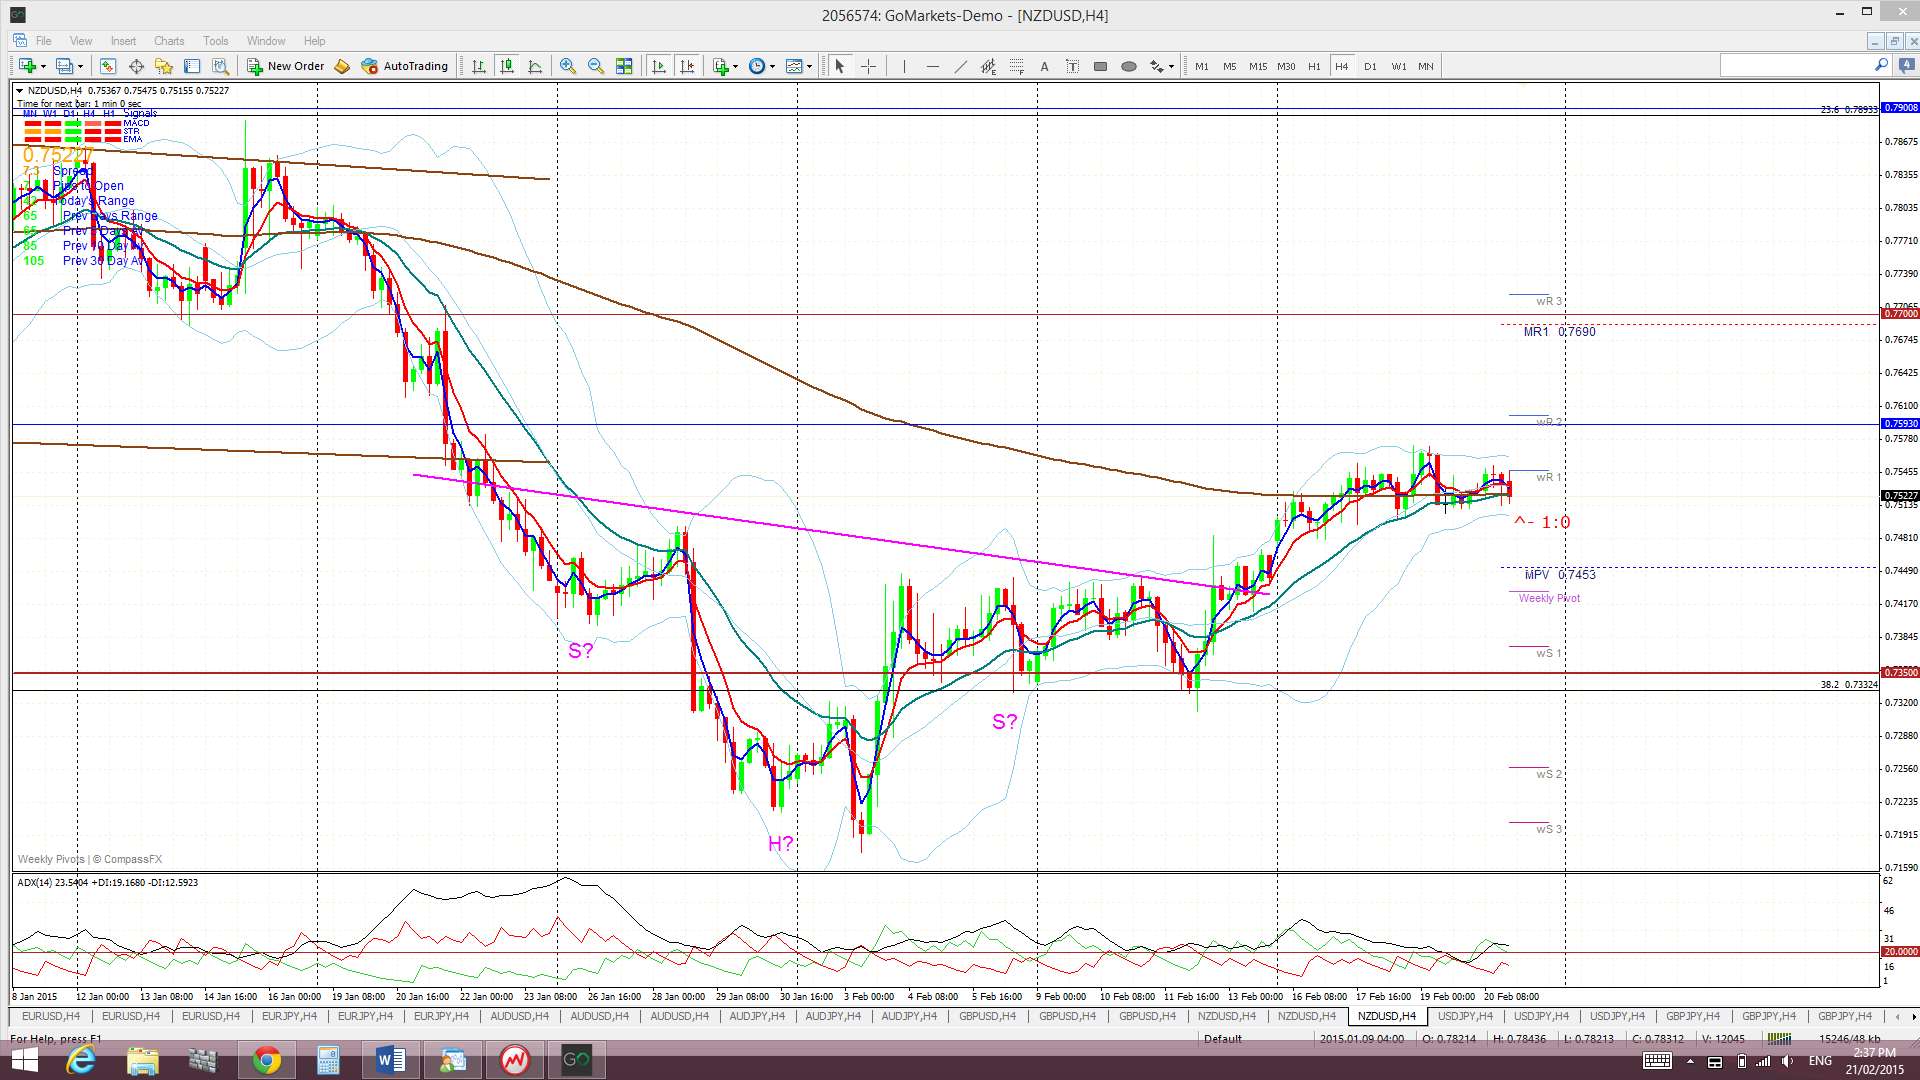
Kiwi: NZD/USD: The Kiwi continued its bounce up off the key S/R level of 0.735 last week and broke up through an ‘inverse H&S’ pattern. The target for this move is up at 0.77 but the Kiwi is struggling to get back up that far just now.
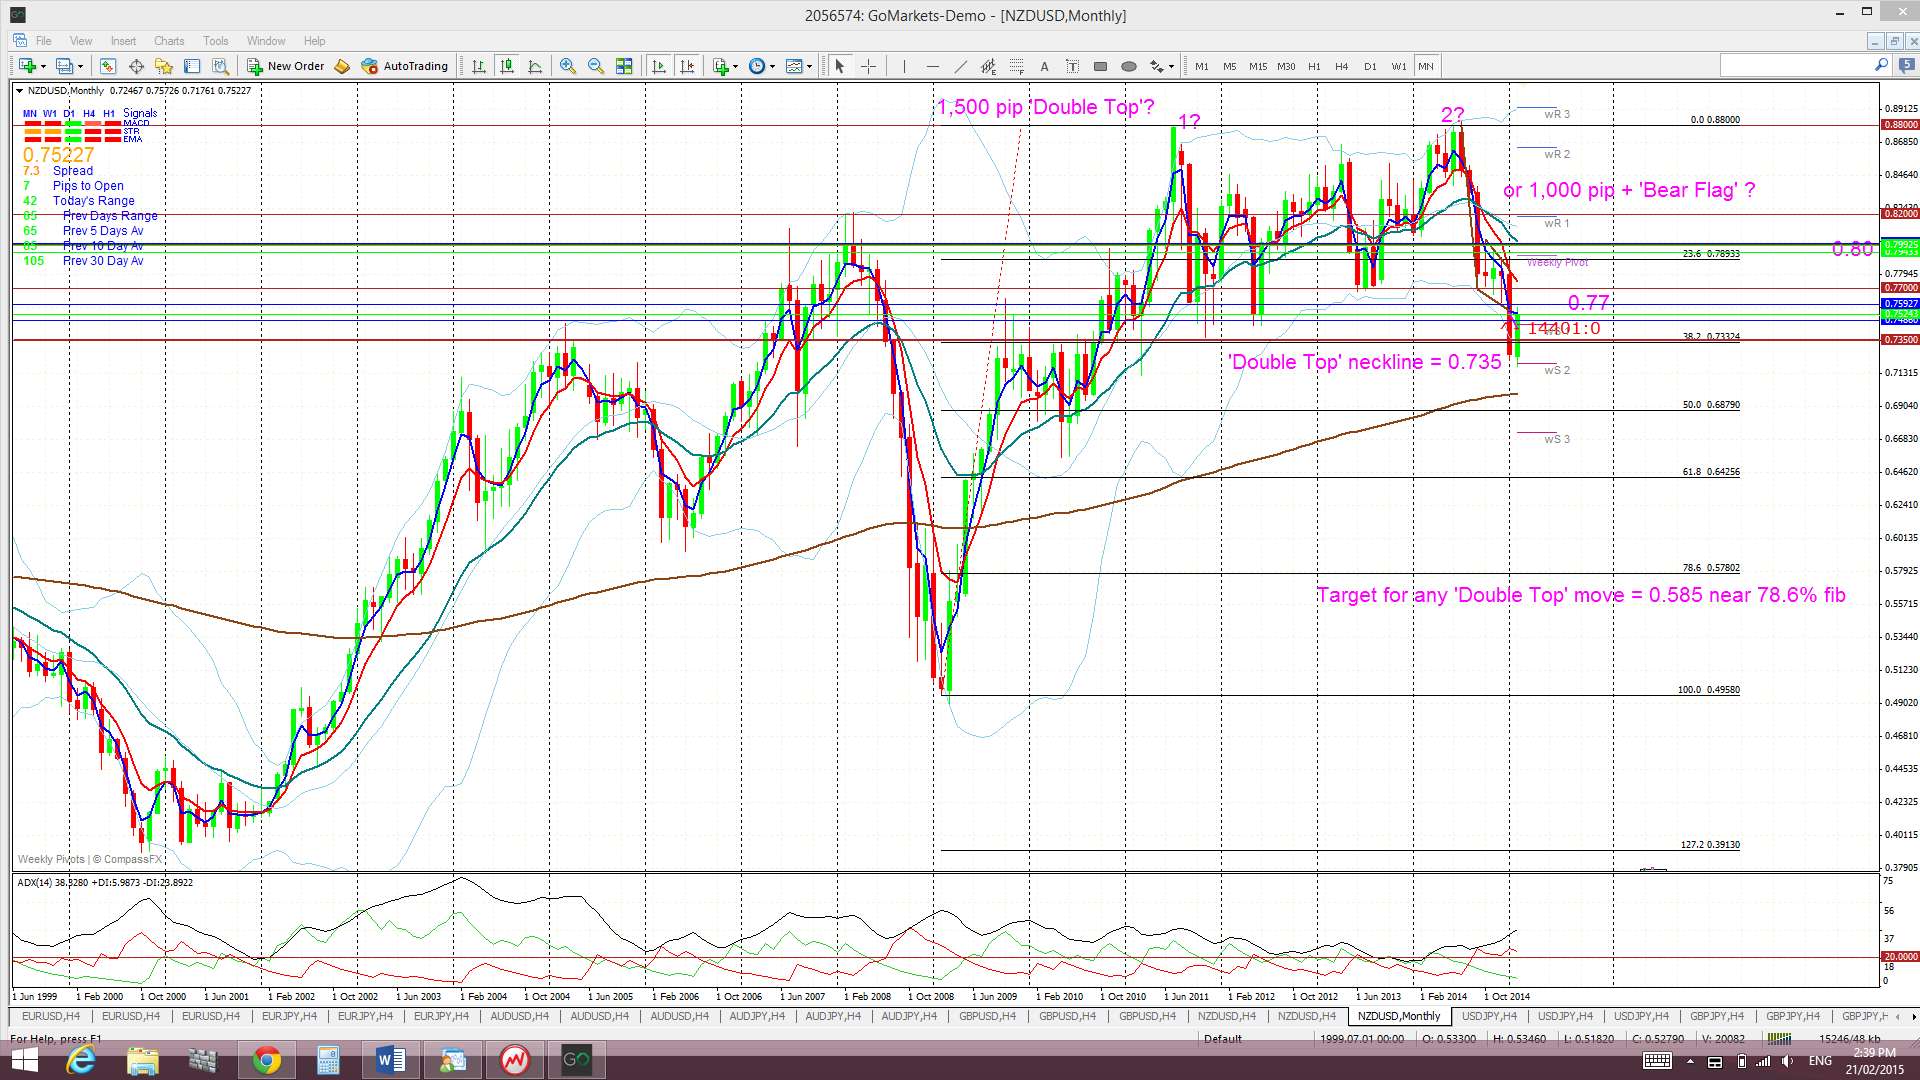
I had previously noted that the January close below 0.735 may signal the start of monthly chart ‘Double Top’ but price has not managed to hold below this level for the time being. This potential ‘Double Top’ on the monthly chart is in addition to the weekly chart’s Bear Flag BUT both patterns could be undermined if the USD tops out here and begins to weaken. Any USD breakdown from here might signal a recovery for the Kiwi though and traders need to be aware of this potential.
Bear Flag for Kiwi on Weekly chart? The hold below 0.77 and the trading channel continues to support the start of a possible 1,000 pip Bear Flag. The 0.77 level represents the previous swing low for the period during mid-2013 and, prior to then, from mid-2012. The ‘Flag Pole’ for the Kiwi’s ‘Bear Flag’ is about 1,100 pips. Thus, any bearish breakdown and continuation below the ‘Flag’ trend line may be expected to extend by 1,100 pips as well. This would bring the Kiwi down to near 0.67 cents. This level is between the 61.8 and 78.6% fibs of the 2009-2014 bull run. I was looking for a test of 0.77, and or the trading channel trend line, to enter this trade but this has not evolved.
‘Double Top’ breakdown on Monthly chart? The monthly chart reveals a possible ‘Double Top’ pattern with a neck line at 0.735. The monthly candle close below this level suggests a possible 2,000 pip bearish follow through move as this is the height of the ‘Double Top’. We have seen a monthly close below this key 0.735 BUT there does not seem to be a hold below this key level JUST YET. This may still well evolve, especially if the USD index regains its bullish mojo but any reversal on the USD index could see Kiwi continue to bounce up off this major support.
Fib levels shows other possible targets for any bearish continuation below 0.77 as being the:
- 38.6% fib near 73.5.
- 50% fib near 70 and the monthly 200 EMA.
- 61.8% fib near 0.65.
Price is trading above the Ichimoku Cloud on the 4hr chart, below on the daily and weekly charts and in the middle of the Cloud on the monthly chart.
The weekly candle closed as a small bullish candle.
- I’m watching for any new TC signal on this pair, the 0.735 level and 0.77 level.
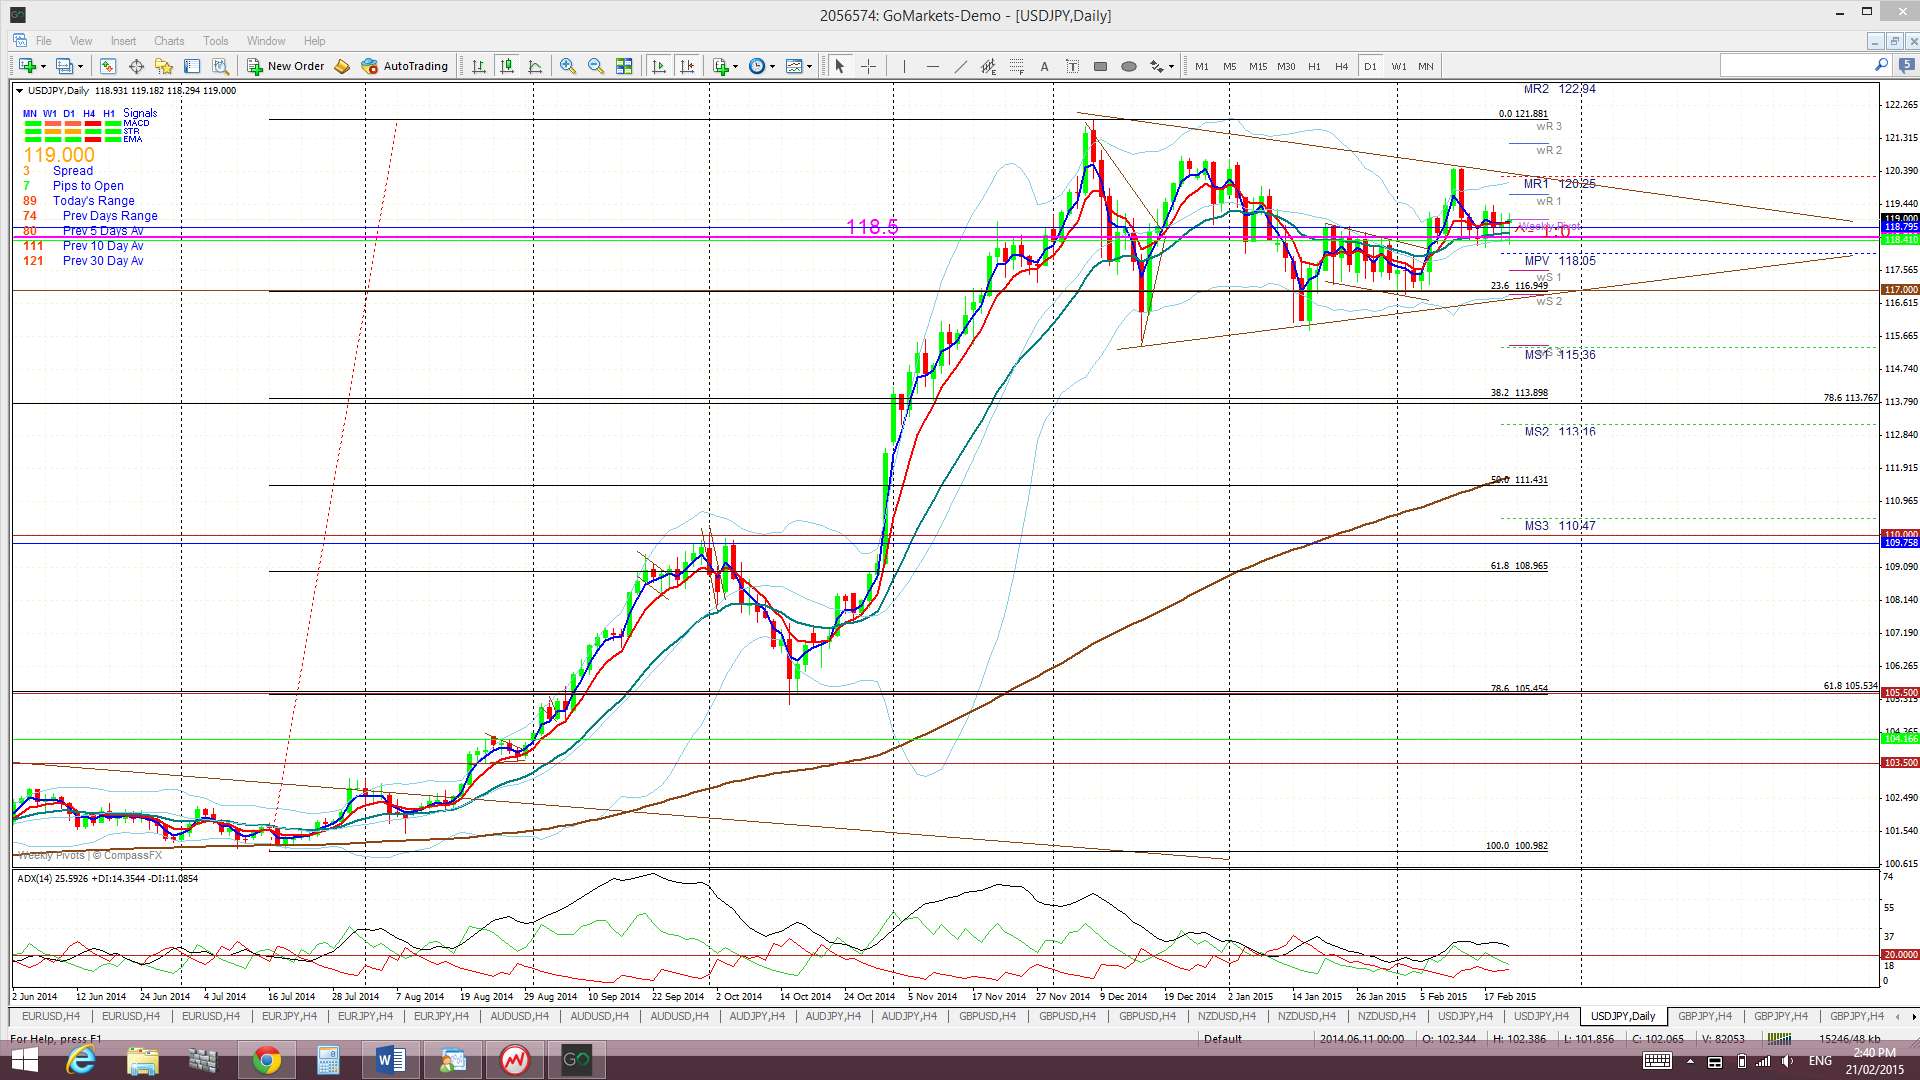
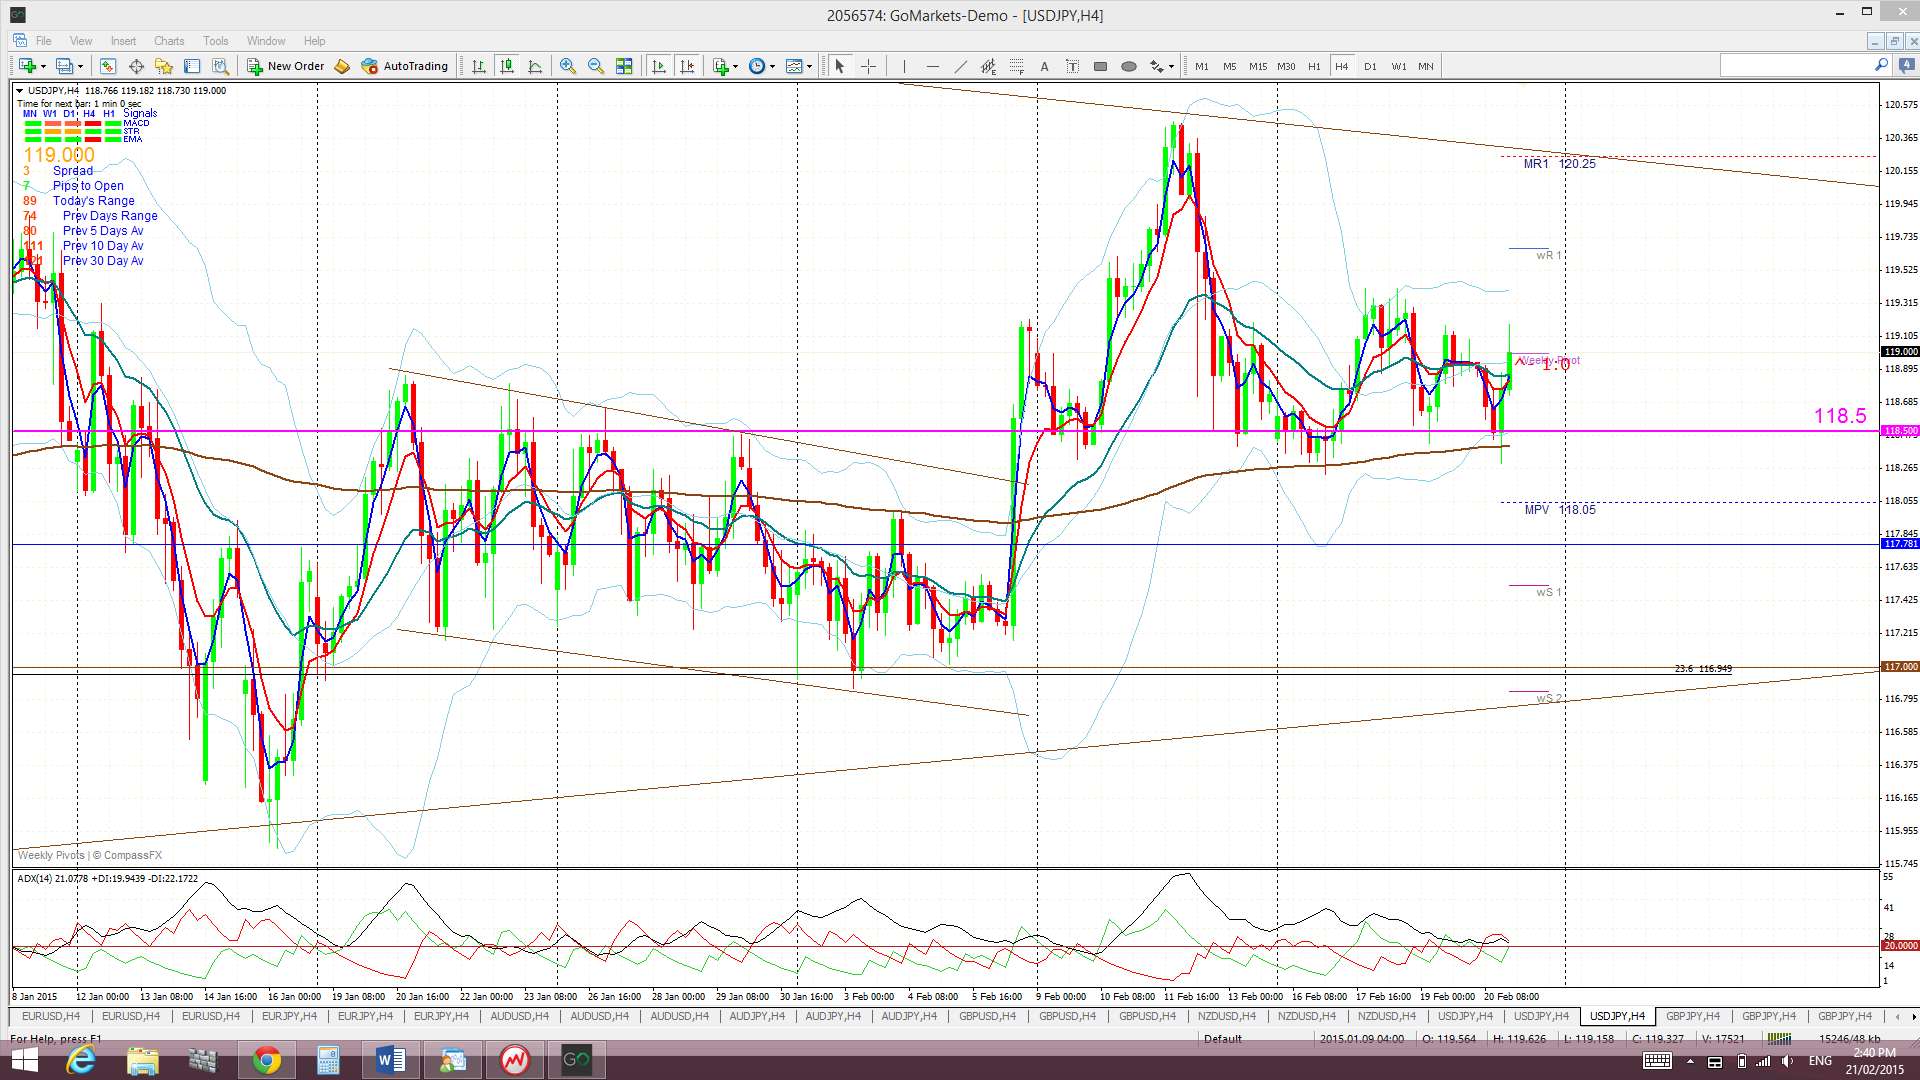
The Yen: U/J: The U/J chopped around within the daily chart’s triangle pattern and above 118.5 support last week. This pair seems to be suffering from the same lack of direction as displayed with the USD index. The worrying fact remains that there is plenty of room in this triangle until the apex and so this pair could range for a lot longer!
Price is trading in the top edge of the Cloud the 4hr chart but above the Cloud on the daily, weekly and monthly charts. November 2013 was the first monthly candle close above the Ichimoku Cloud since mid-2007 and the bullish hold above the monthly Cloud continues to be noteworthy.
The weekly candle closed as a small bullish candle.
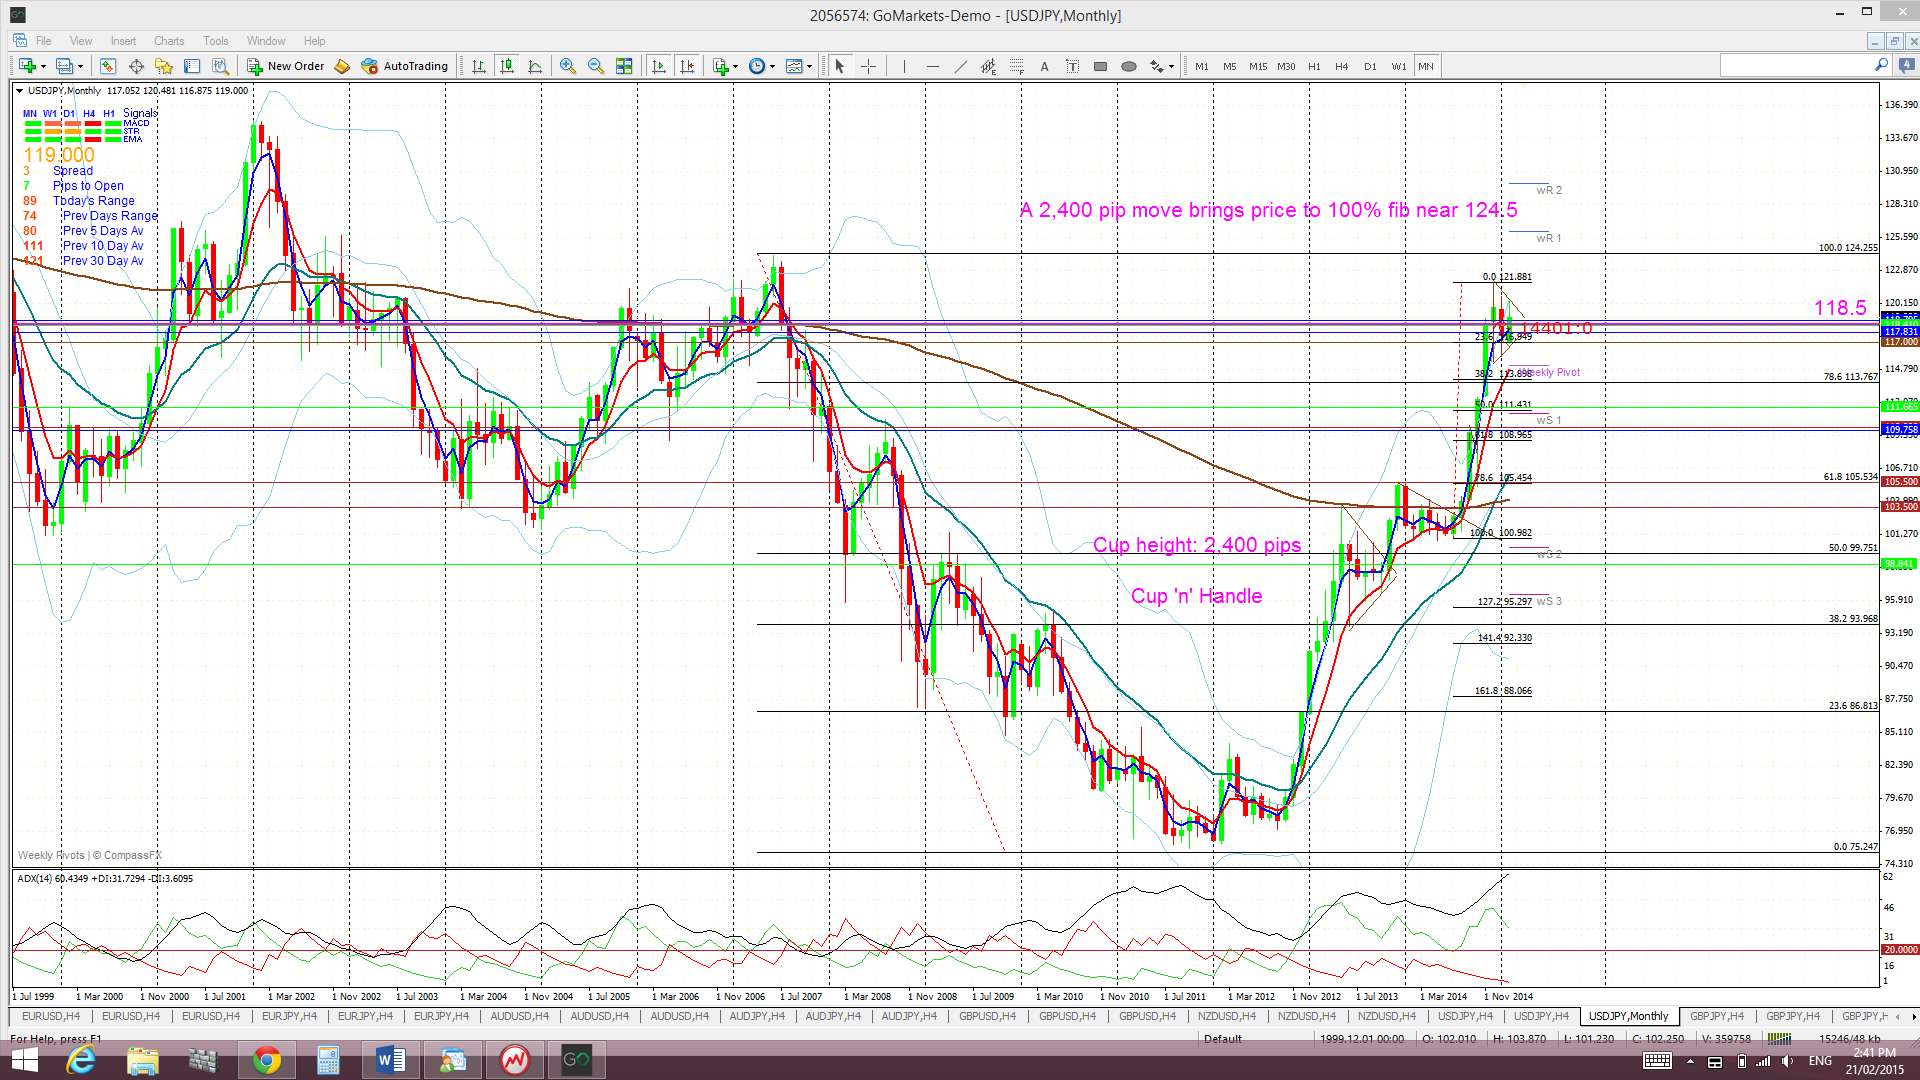
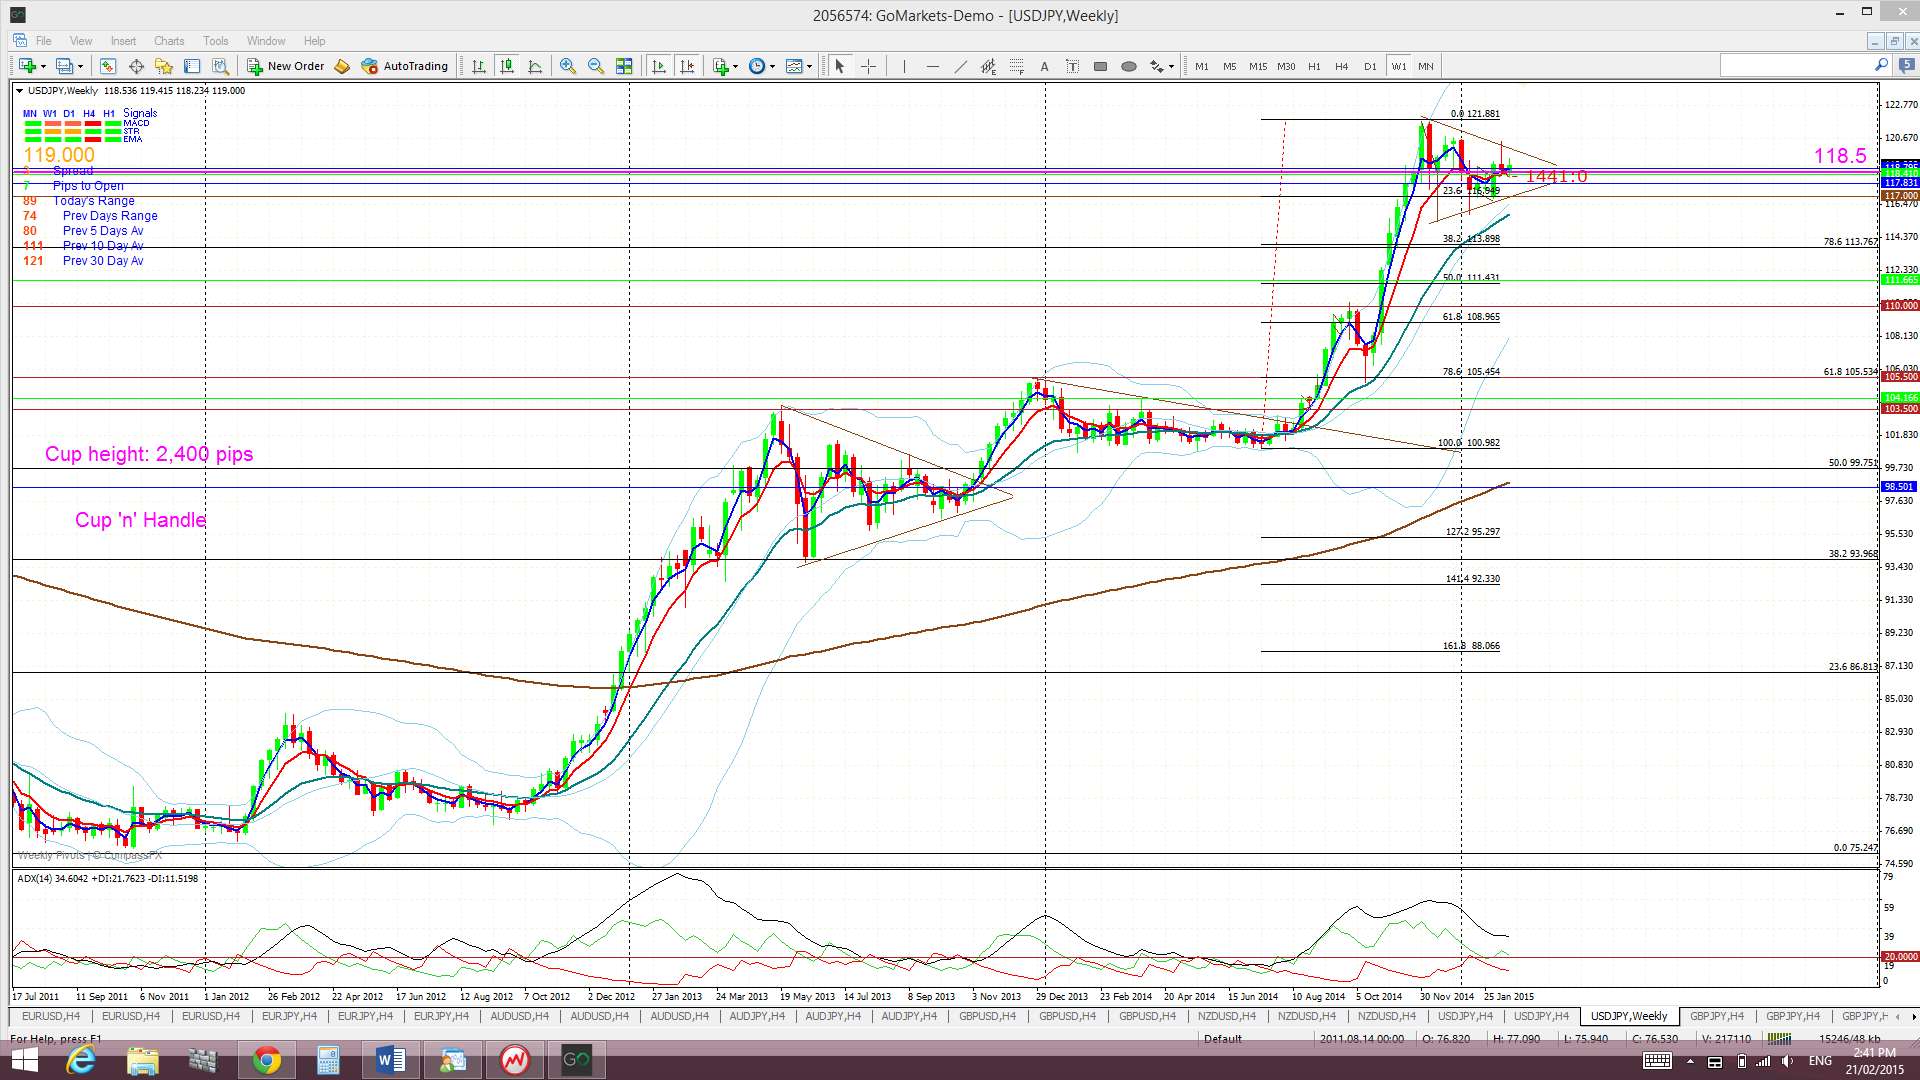
Weekly Chart Bullish Cup’ n’ Handle pattern: This pattern seems to have completed now just 300 pips short of the 2,400 pip target. The theory behind these patterns is that the height of the ‘Cup’ pattern is equivalent to the expected bullish move from the ‘handle’ breakout. The height of the Cup for the U/J weekly chart is around 2,400 pips. The interesting point here is that a 2,400 pip bullish move up from the ‘Handle’ would put price up near the 124 level. This level is the last major swing high for the U/J from back in 2007 and represents the 100% fib pullback for the move down in 2007 to the lows of 2012. This pattern gave up to 2,100 pips of the 2,400 pip target!
- I’m watching for any new TC signal on this pair and the triangle trend lines.
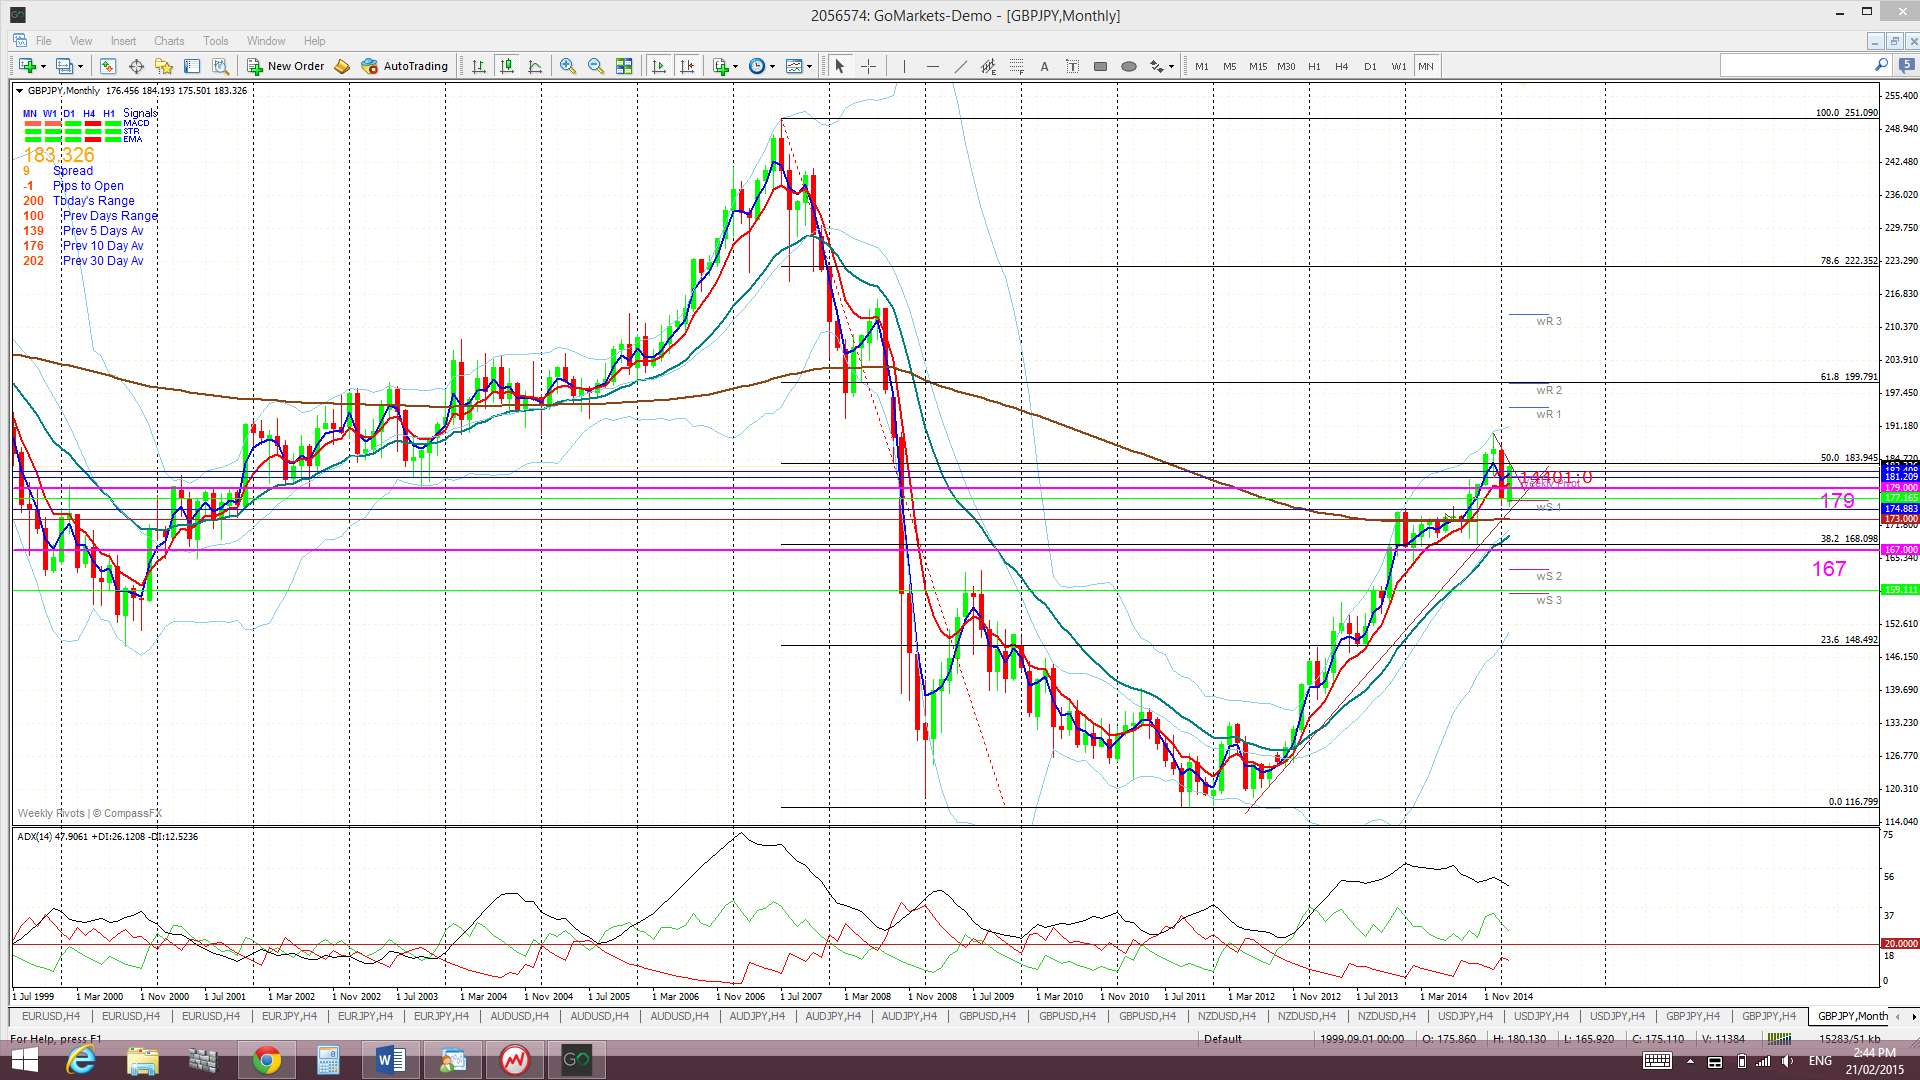
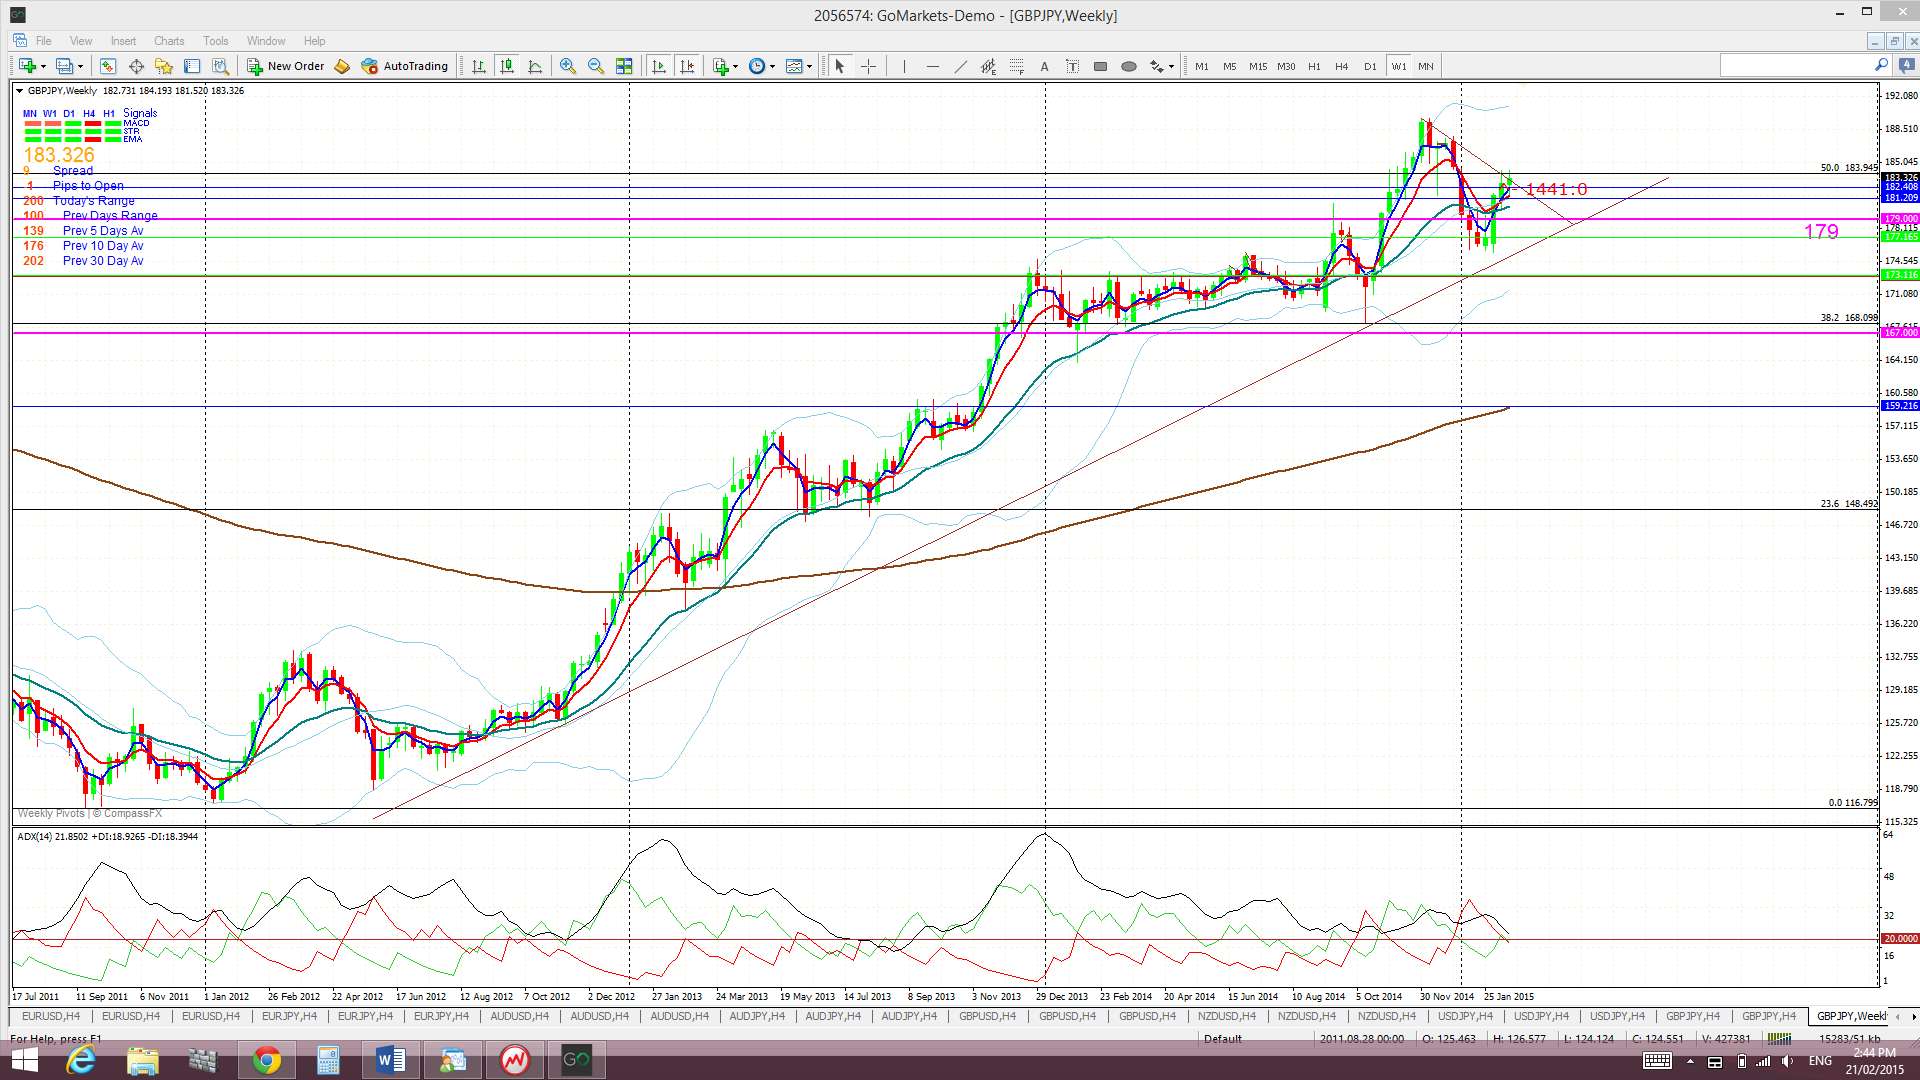
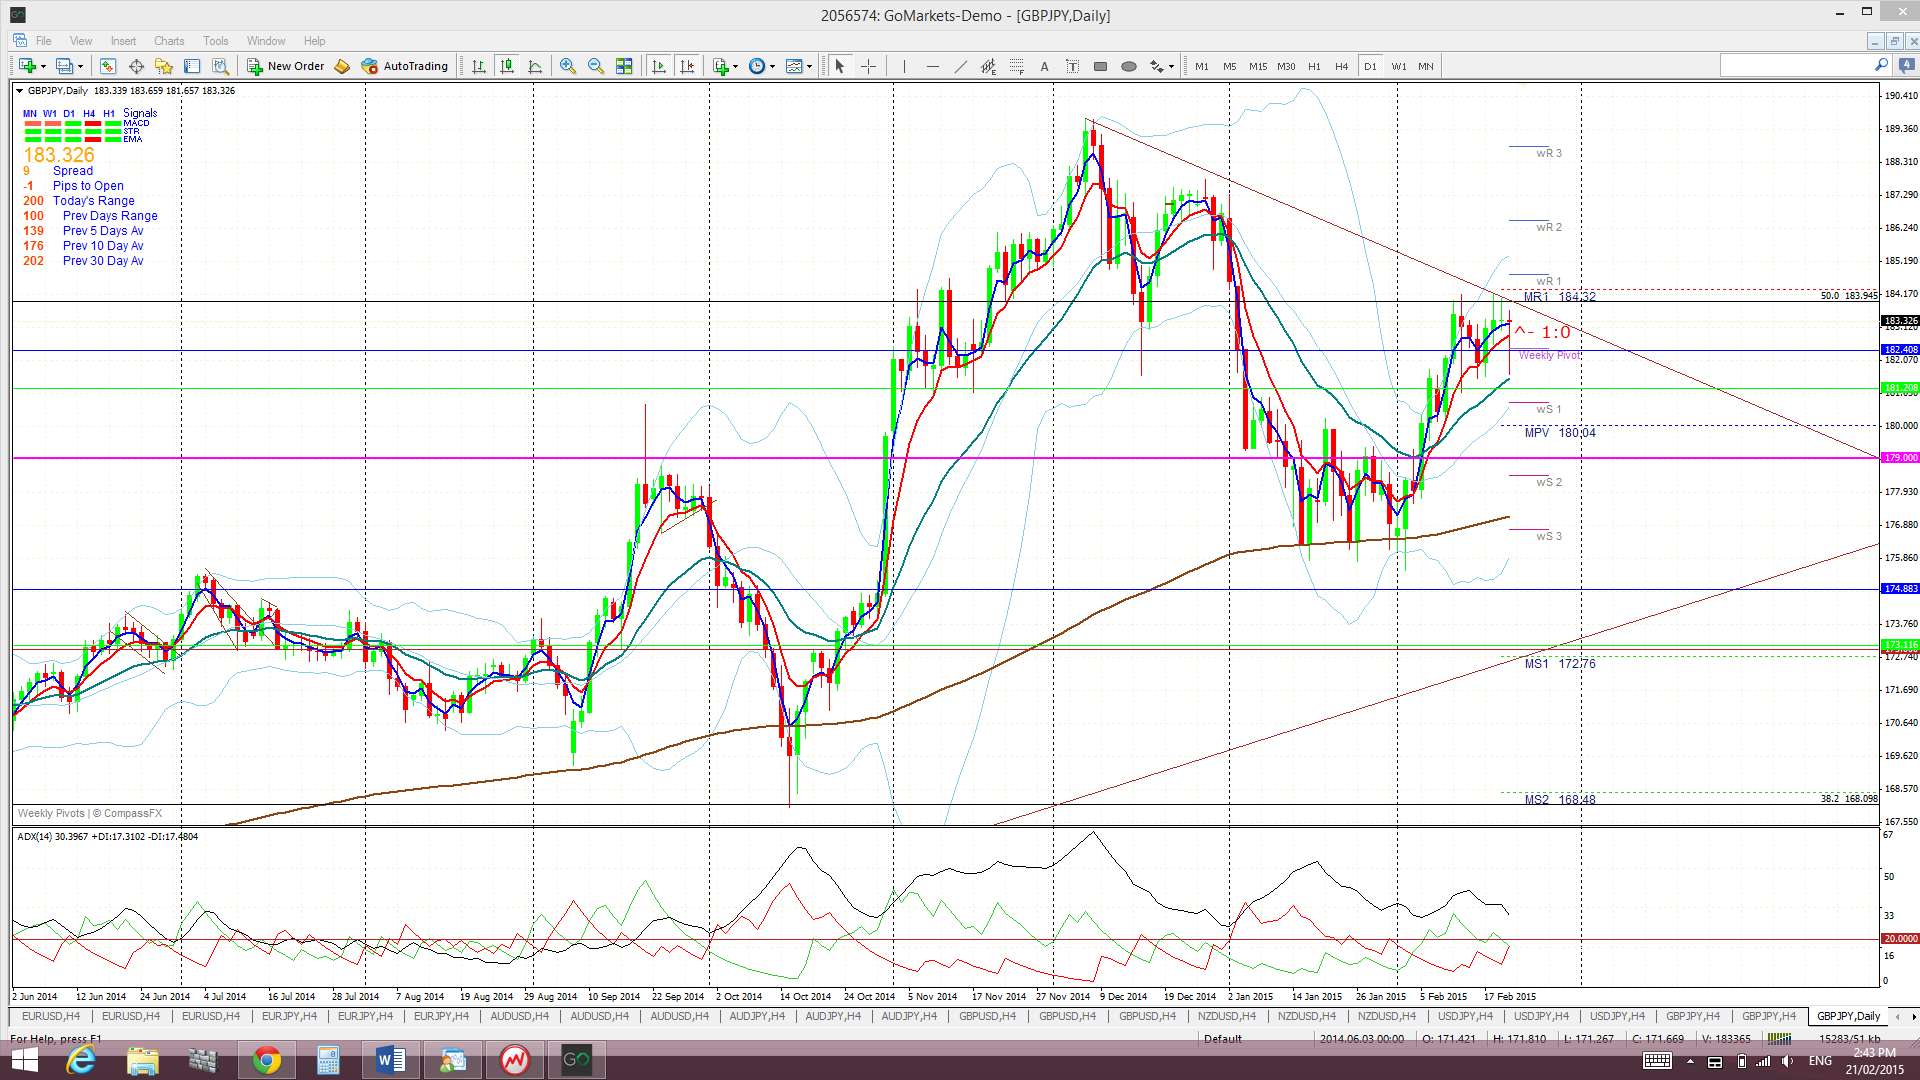
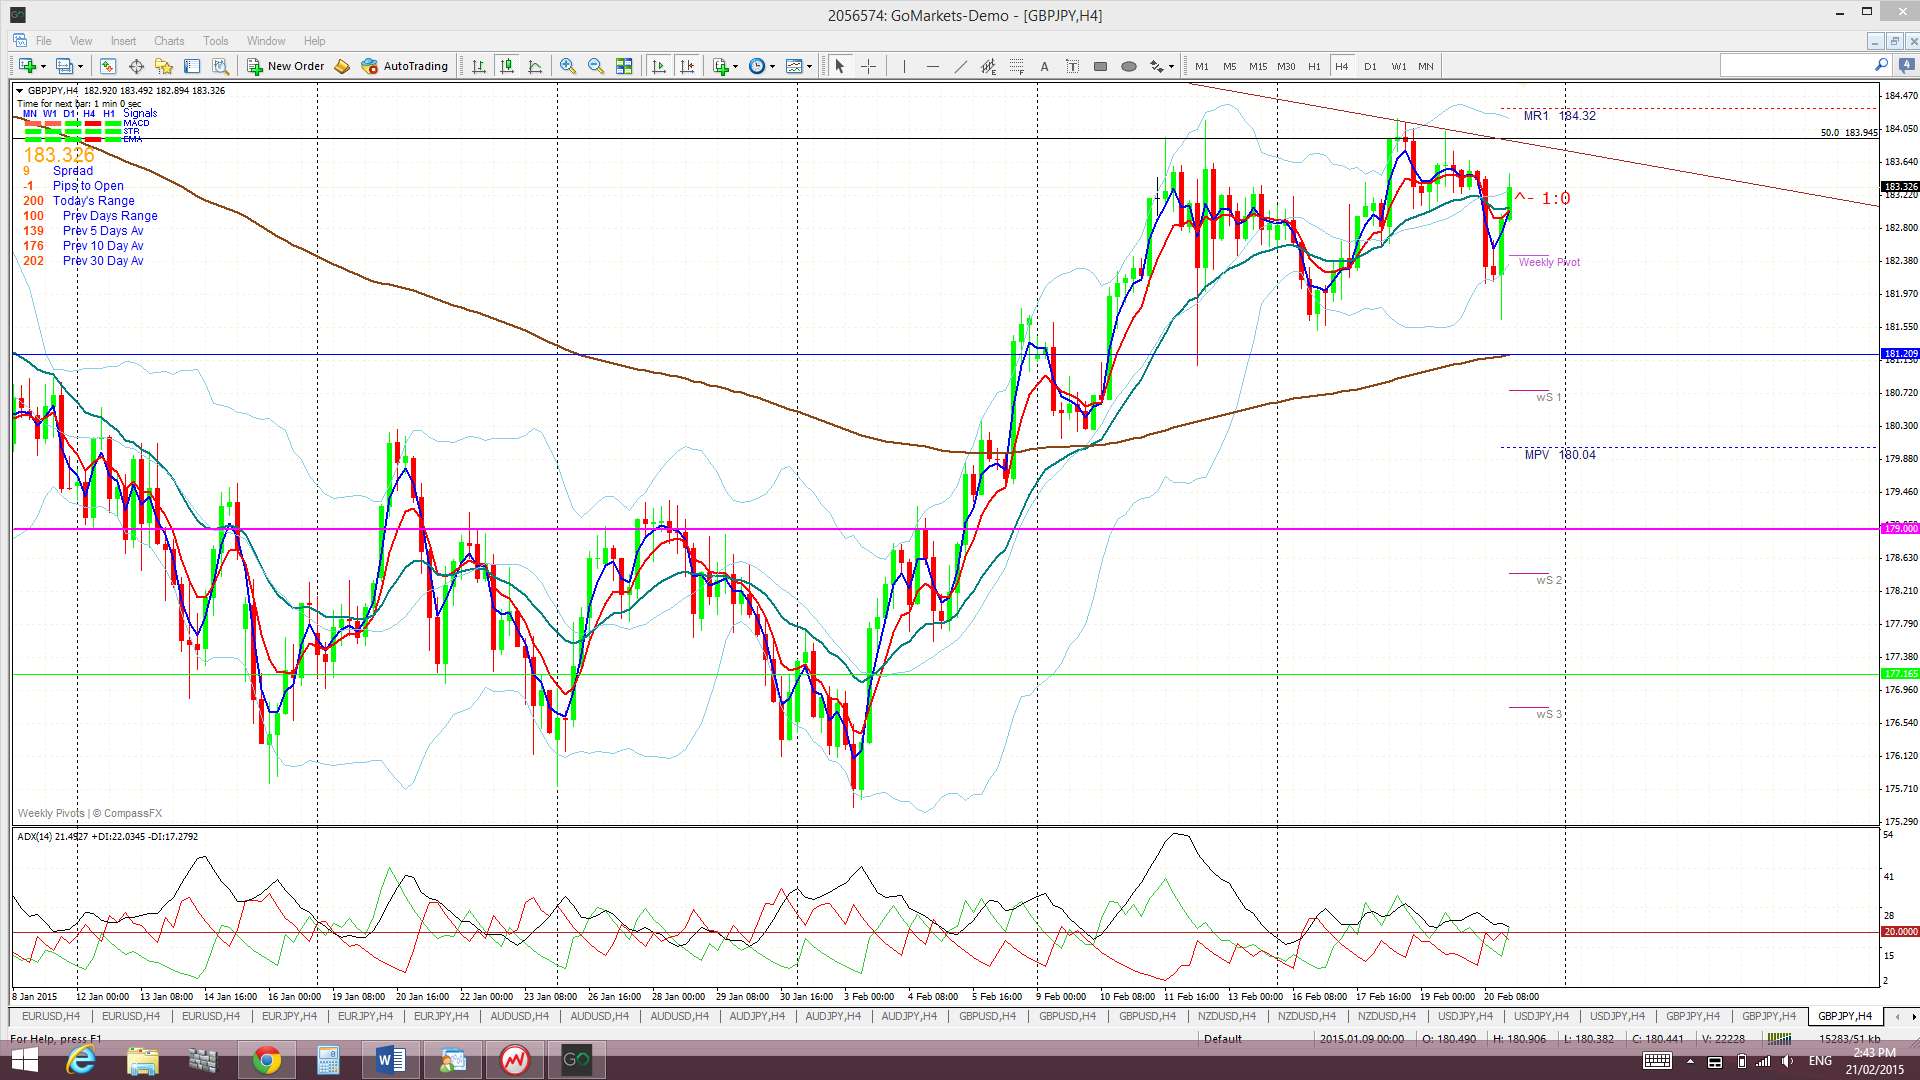
GBP/JPY: The GBP/JPY chopped up and down last week but is holding above a weekly support trend line and the key 179 level. Price action on the weekly chart looks to be forming up within a triangle and the consolidation here matches that seen on a number of other pairs.
Two key S/R levels on the G/J chart: The monthly chart shows a band of choppy congested activity across the chart. This band is defined by rather strong S/R levels at 179 and 167. The 179 level seems to be a key demarcation level and a close and hold above this would suggest bullish continuation. The key 173 level lies midway between these two S/R levels. Targets for any bullish continuation include the 61.8% fib near 200 and the 78.6% fib near 222.
Price is now trading above the Ichimoku Cloud on the 4hr, daily, weekly and monthly charts.
The weekly candle closed as a small bullish candle.
- I’m watching for any new TC signal on this pair and the weekly chart’s triangle trend lines.
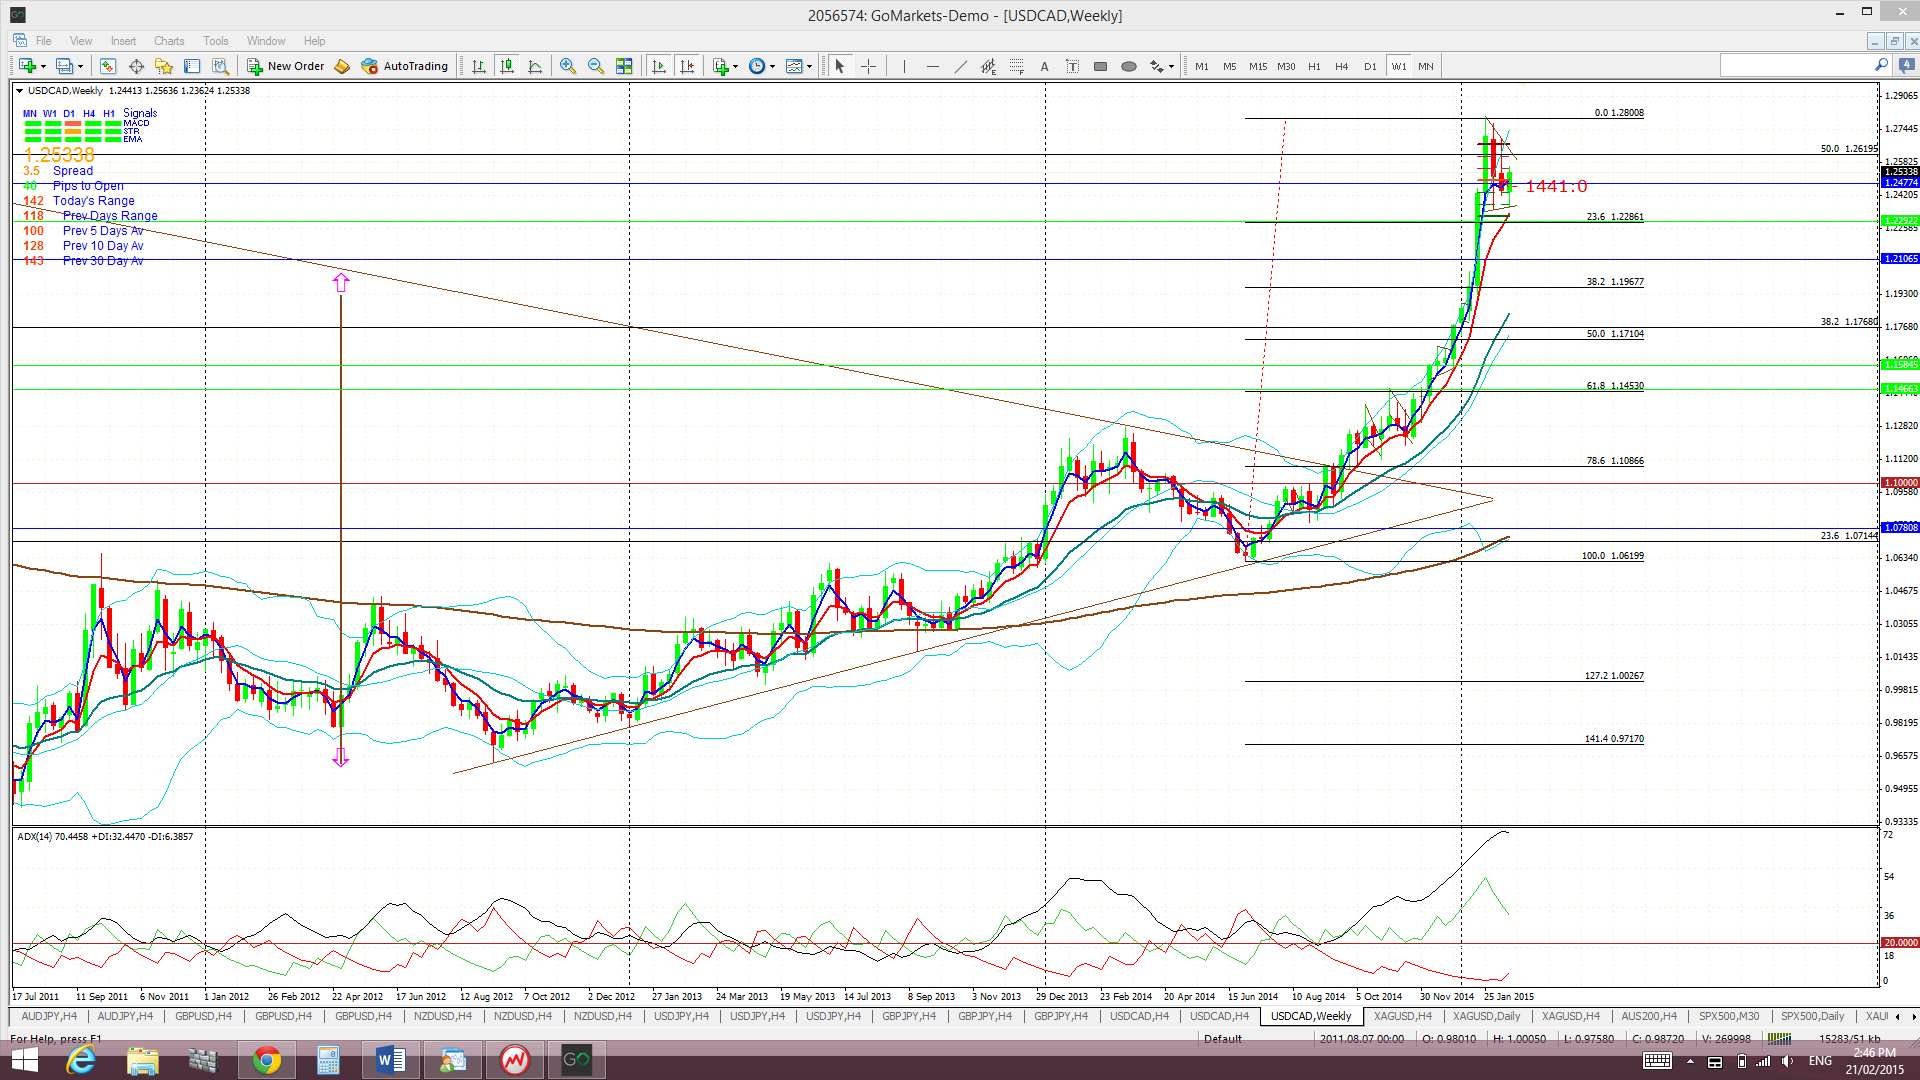
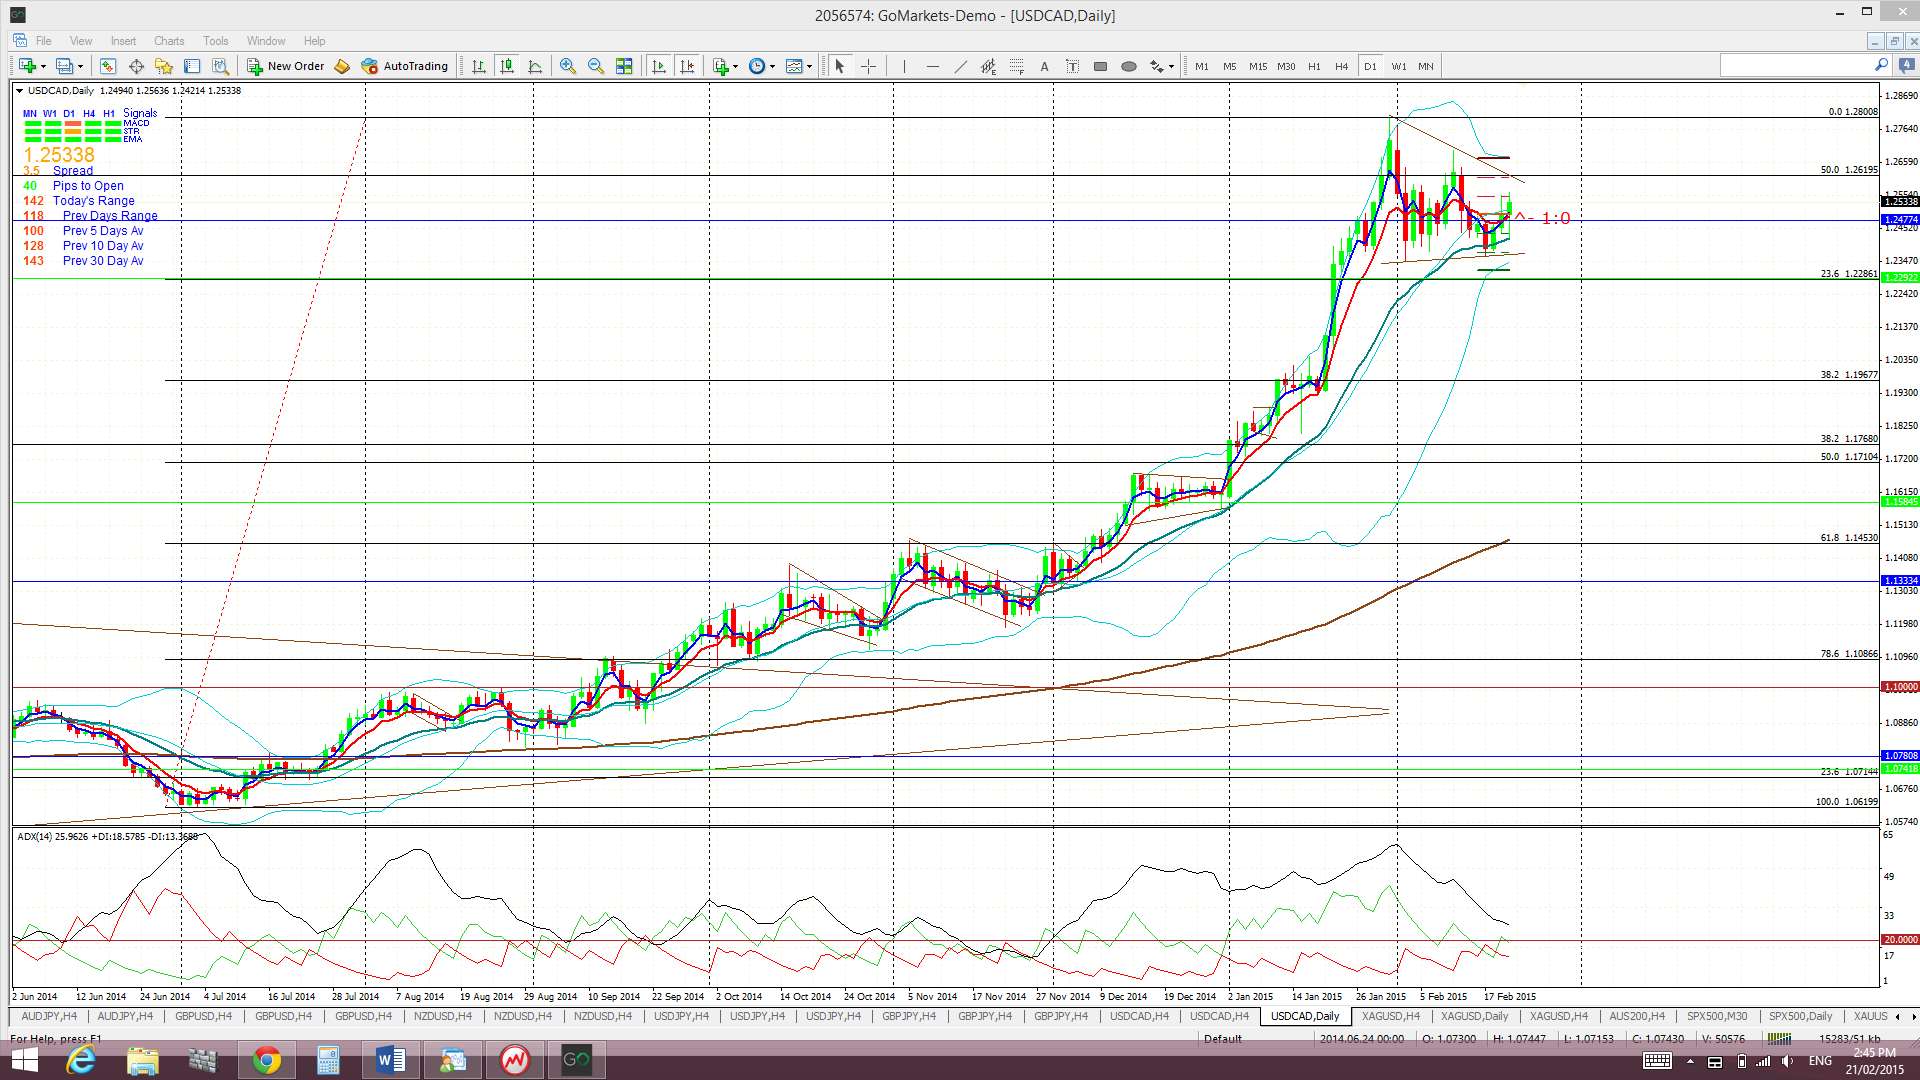
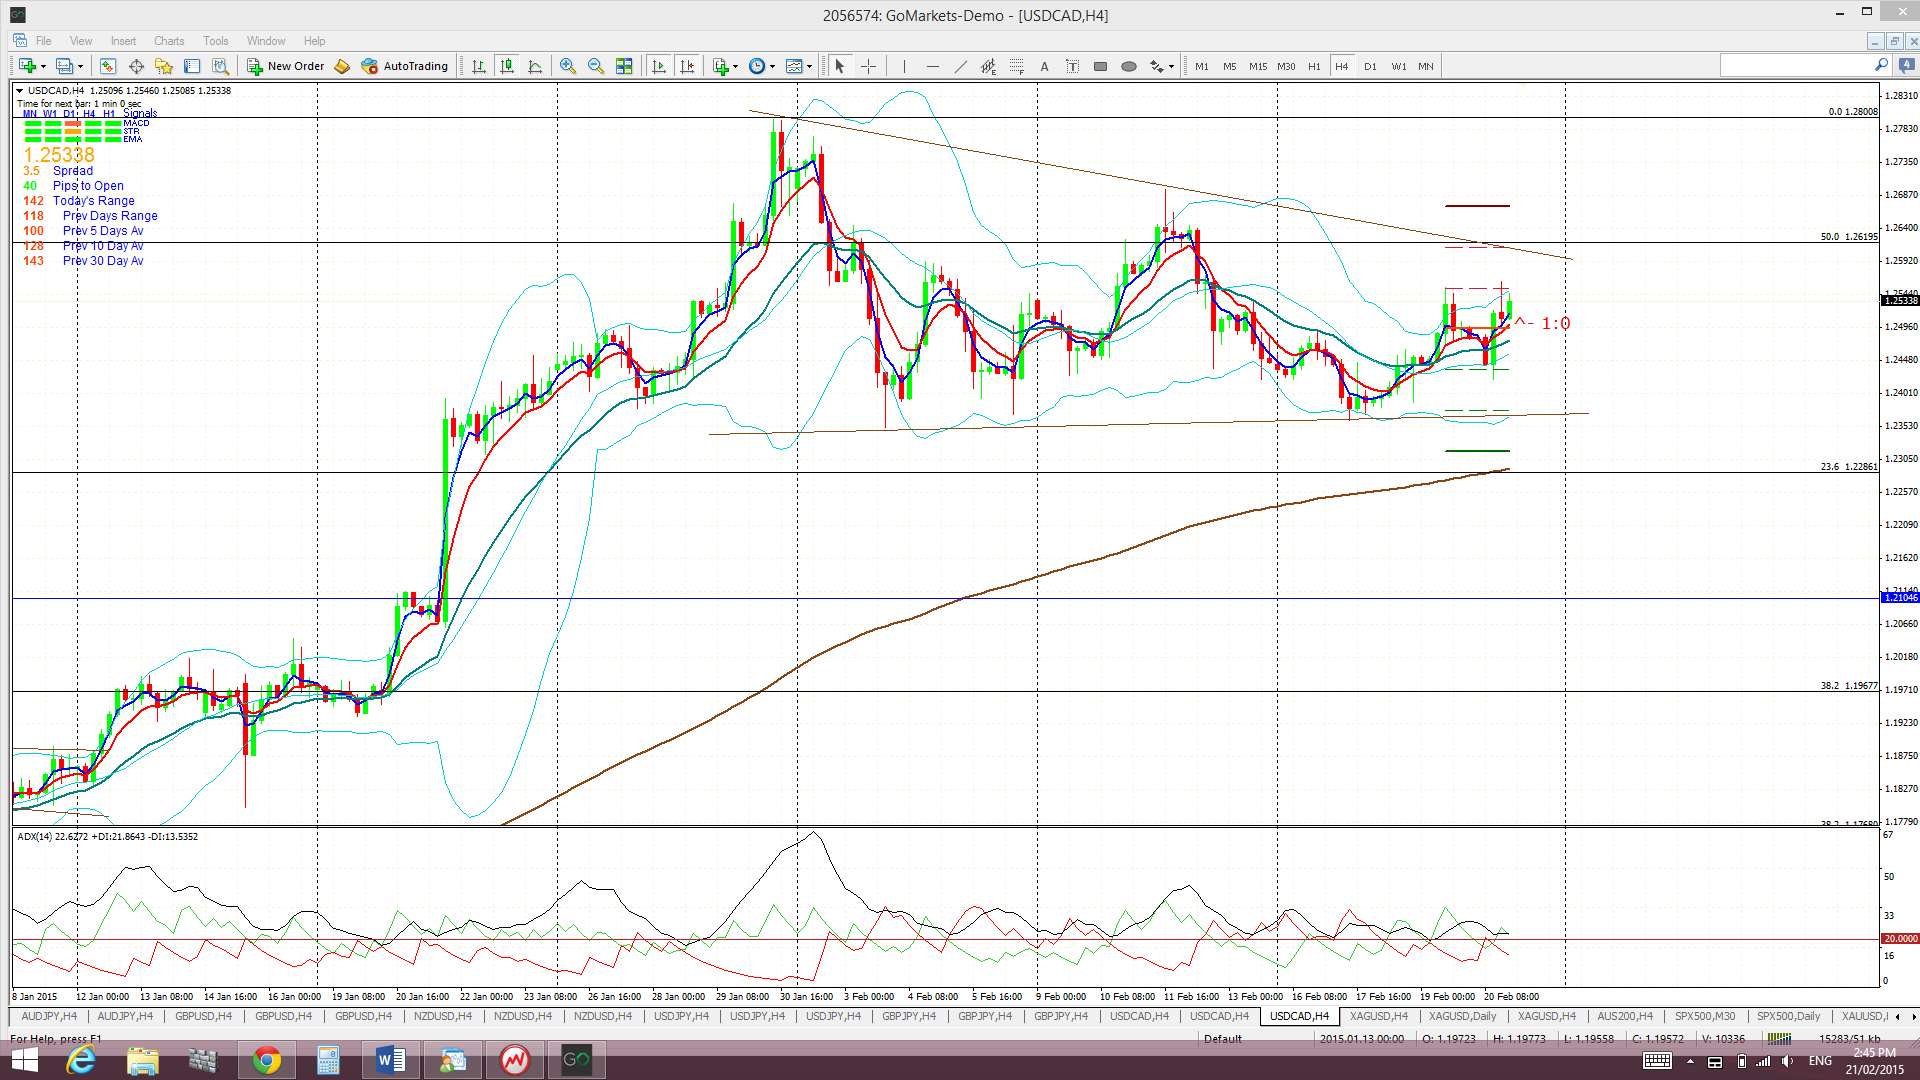
USD/CAD: The USD/CAD has been consolidating sideways within a wedge for the last four weeks and I’m waiting for any momentum based breakout.
The weekly chart shows that a 61.8% fib pullback of the recent rally would bring price down to near the 1.45 level.
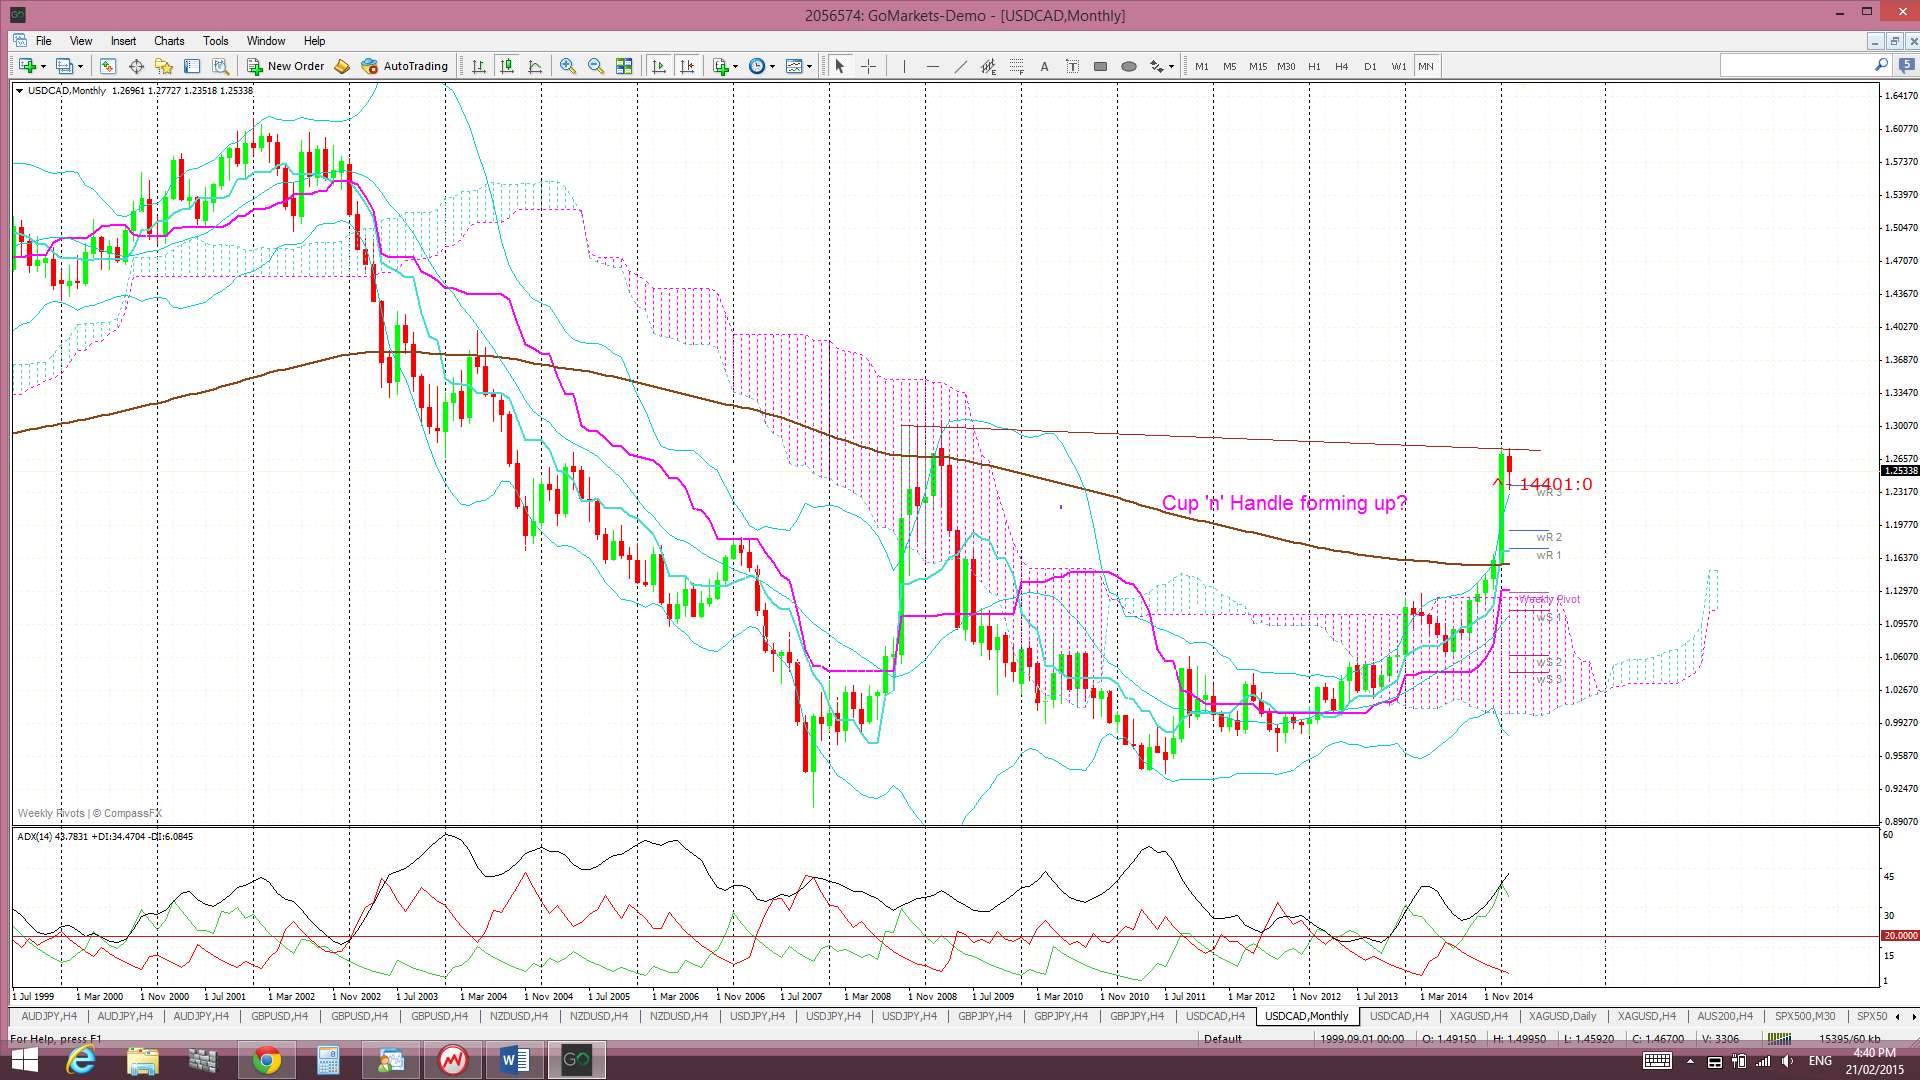
Price continues holding above the monthly 200 EMA however and it is worth remembering that the last bullish monthly candle close above this level was back in February 2009, almost 6 years ago. This period also marks the longest bullish hold by the Loonie above the monthly Cloud since 2002! Note the possible bullish Cup ‘n’ Handle forming up on the monthly chart though. This is in addition to the bullish triangle breakout already in play. Watch for any sideways or choppy action to continue here as that would help to form up the ‘Handle of this pattern’:
Loonie monthly: Cup ‘n’ Handle forming?
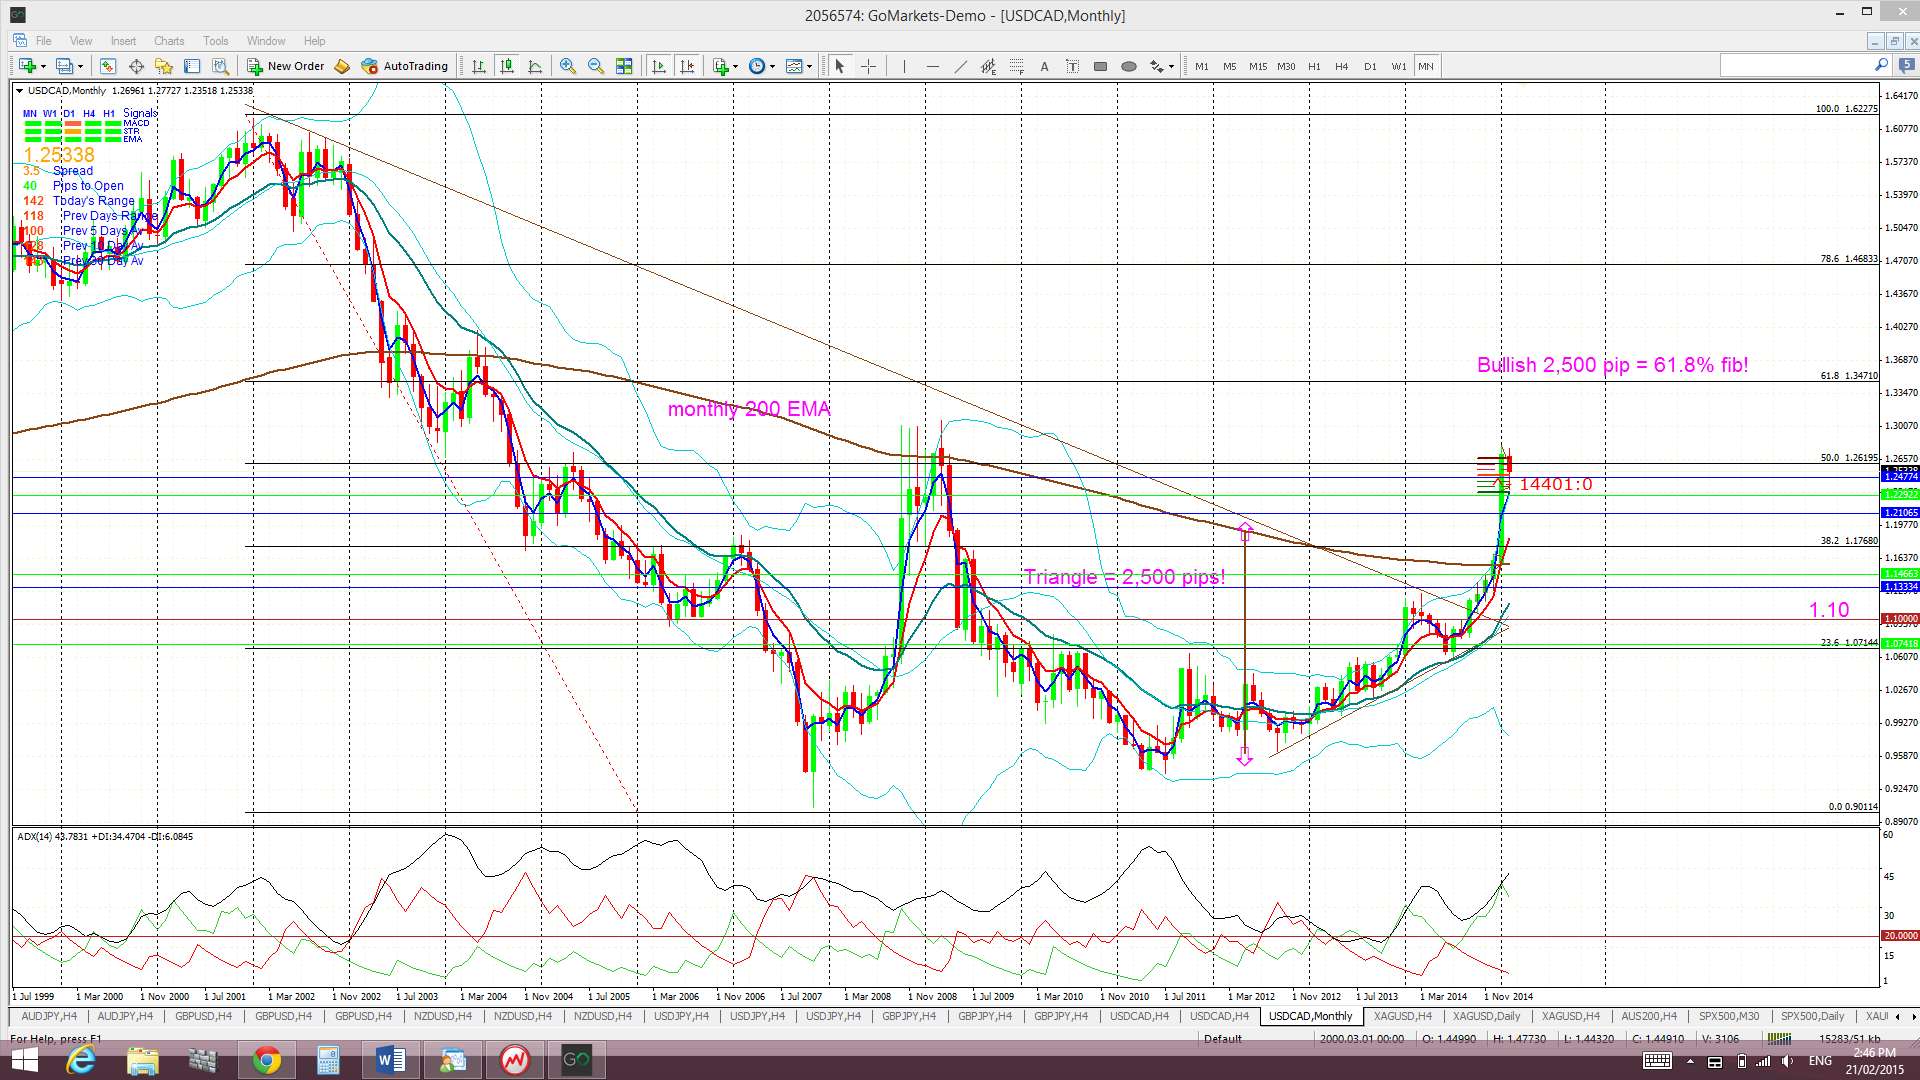
Triangle breakout target: The Loonie has already broken up and out from a major monthly chart triangle pattern that could deliver up to 2,500 pips. This 2,500 pip figure is evaluated from the height of the triangle. I have used the triangle height from the beginning of the bull trend line, as shown in the monthly chart below. The height of the triangle is around 2,500 pips and, thus, this would be the expected move from any breakout action. This is where it gets interesting! Extrapolating a bullish move from this triangle places price up at the 61.8% fib level. These fibs levels are popular targets in retracement moves and so this adds some confluence to this as a possible target. The bullish move so far has given up to 1,600 pips!
Price is now trading IN the Cloud on the 4hr chart but above on the daily, weekly and monthly charts.
The weekly candle closed as a bullish, almost ‘engulfing’ candle.
- I’m watching for any new valid TC signal on this pair and the 4 hr chart’s wedge trend lines.
Silver and Gold General:
Money has been flowing into global stocks with their yield potential and this has put pressure on Gold and Silver. There has also been little direction from the USD as it has range-traded of late but next week could be telling for these two commodities:
- Silver and Gold would probably receive a boost from any breakdown with the Eurogroup Greek debt negotiations AND from any weakening USD.
- However, both could suffer if a Grexit is avoided AND if the USD rallies from here.
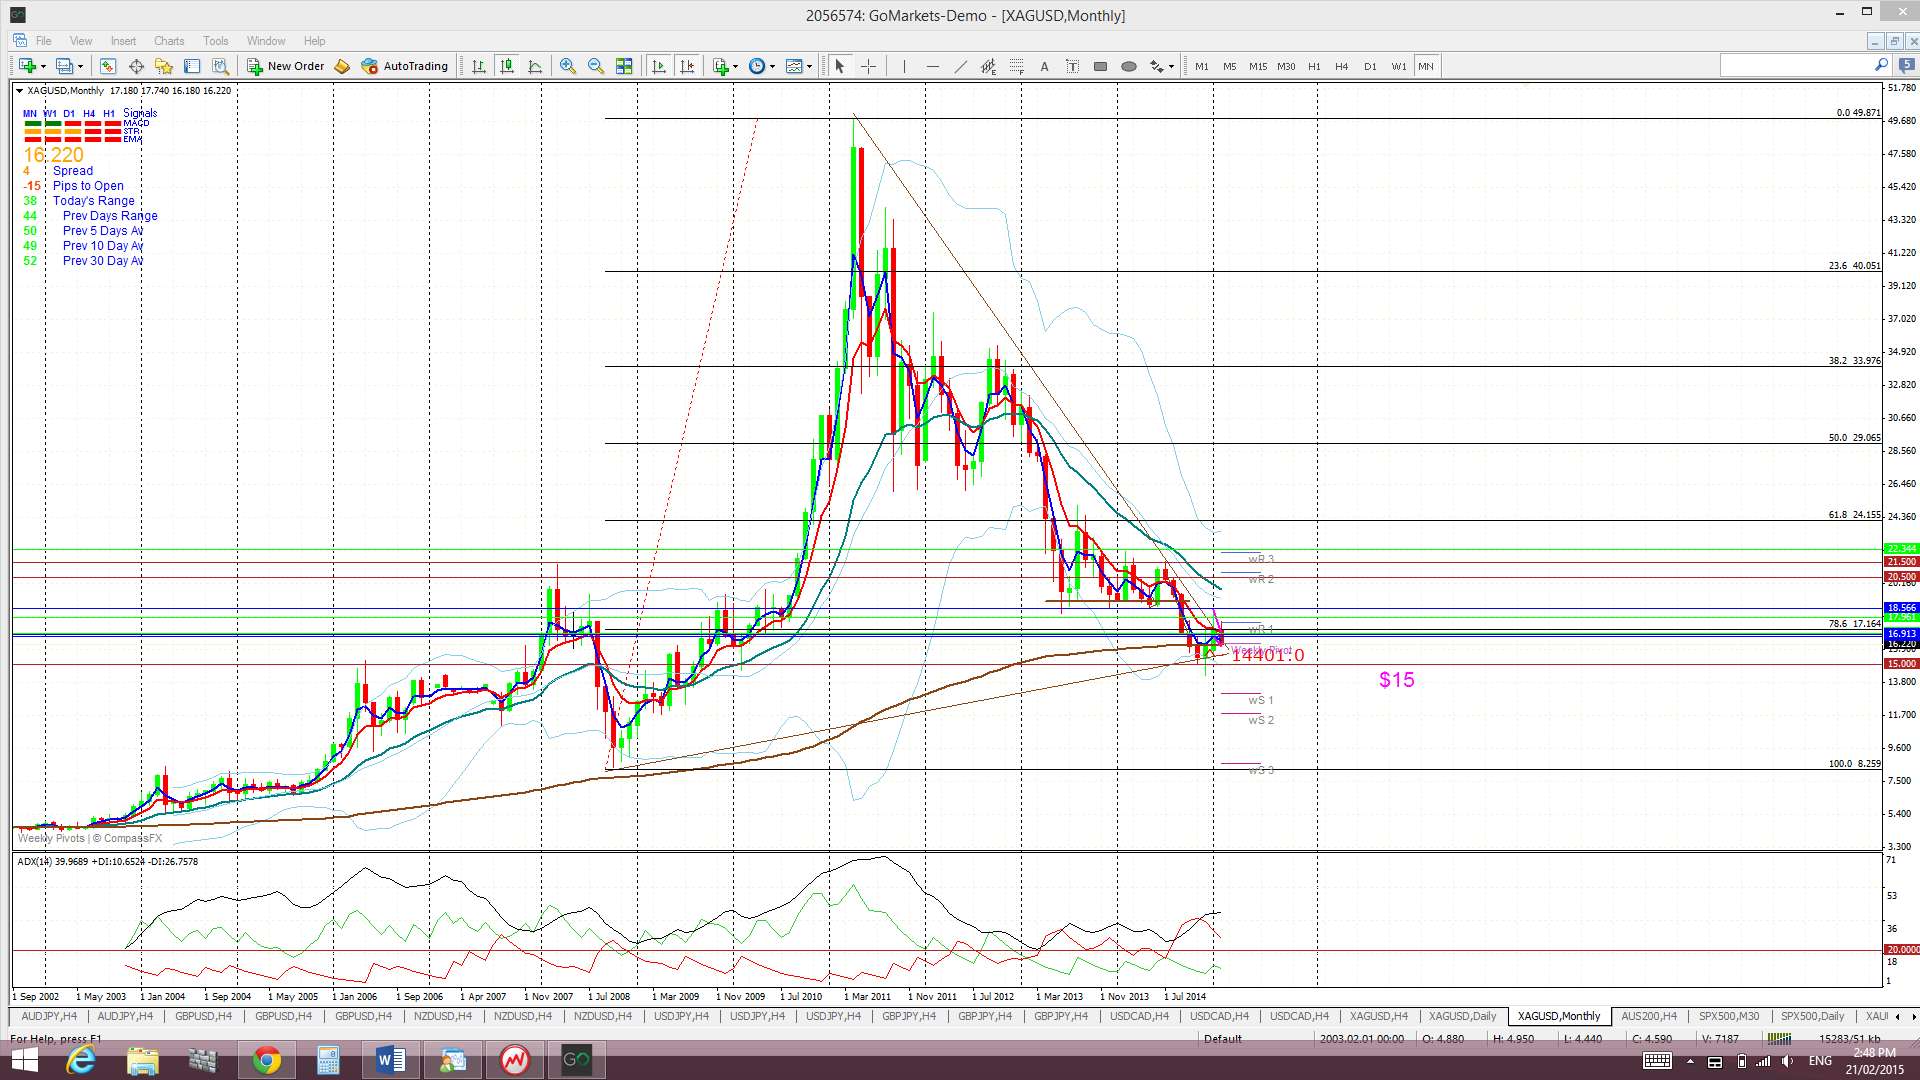
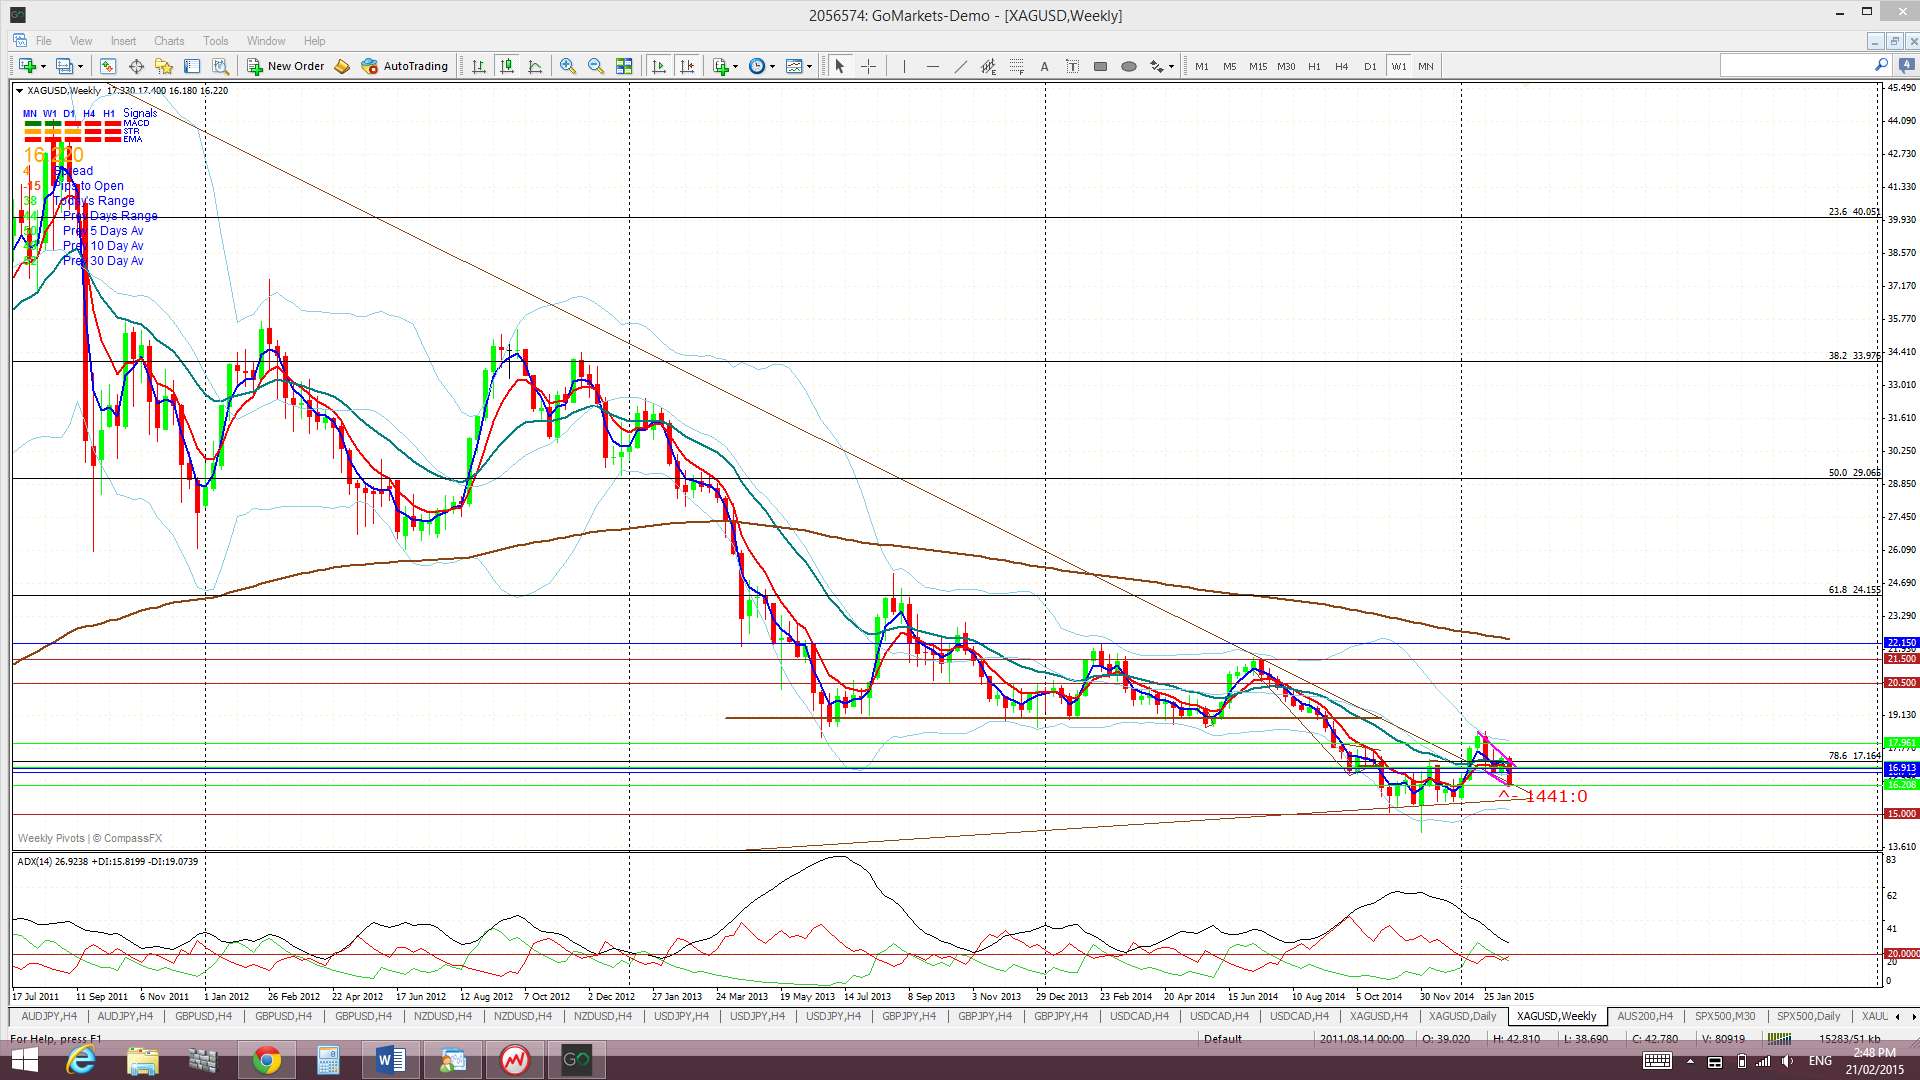
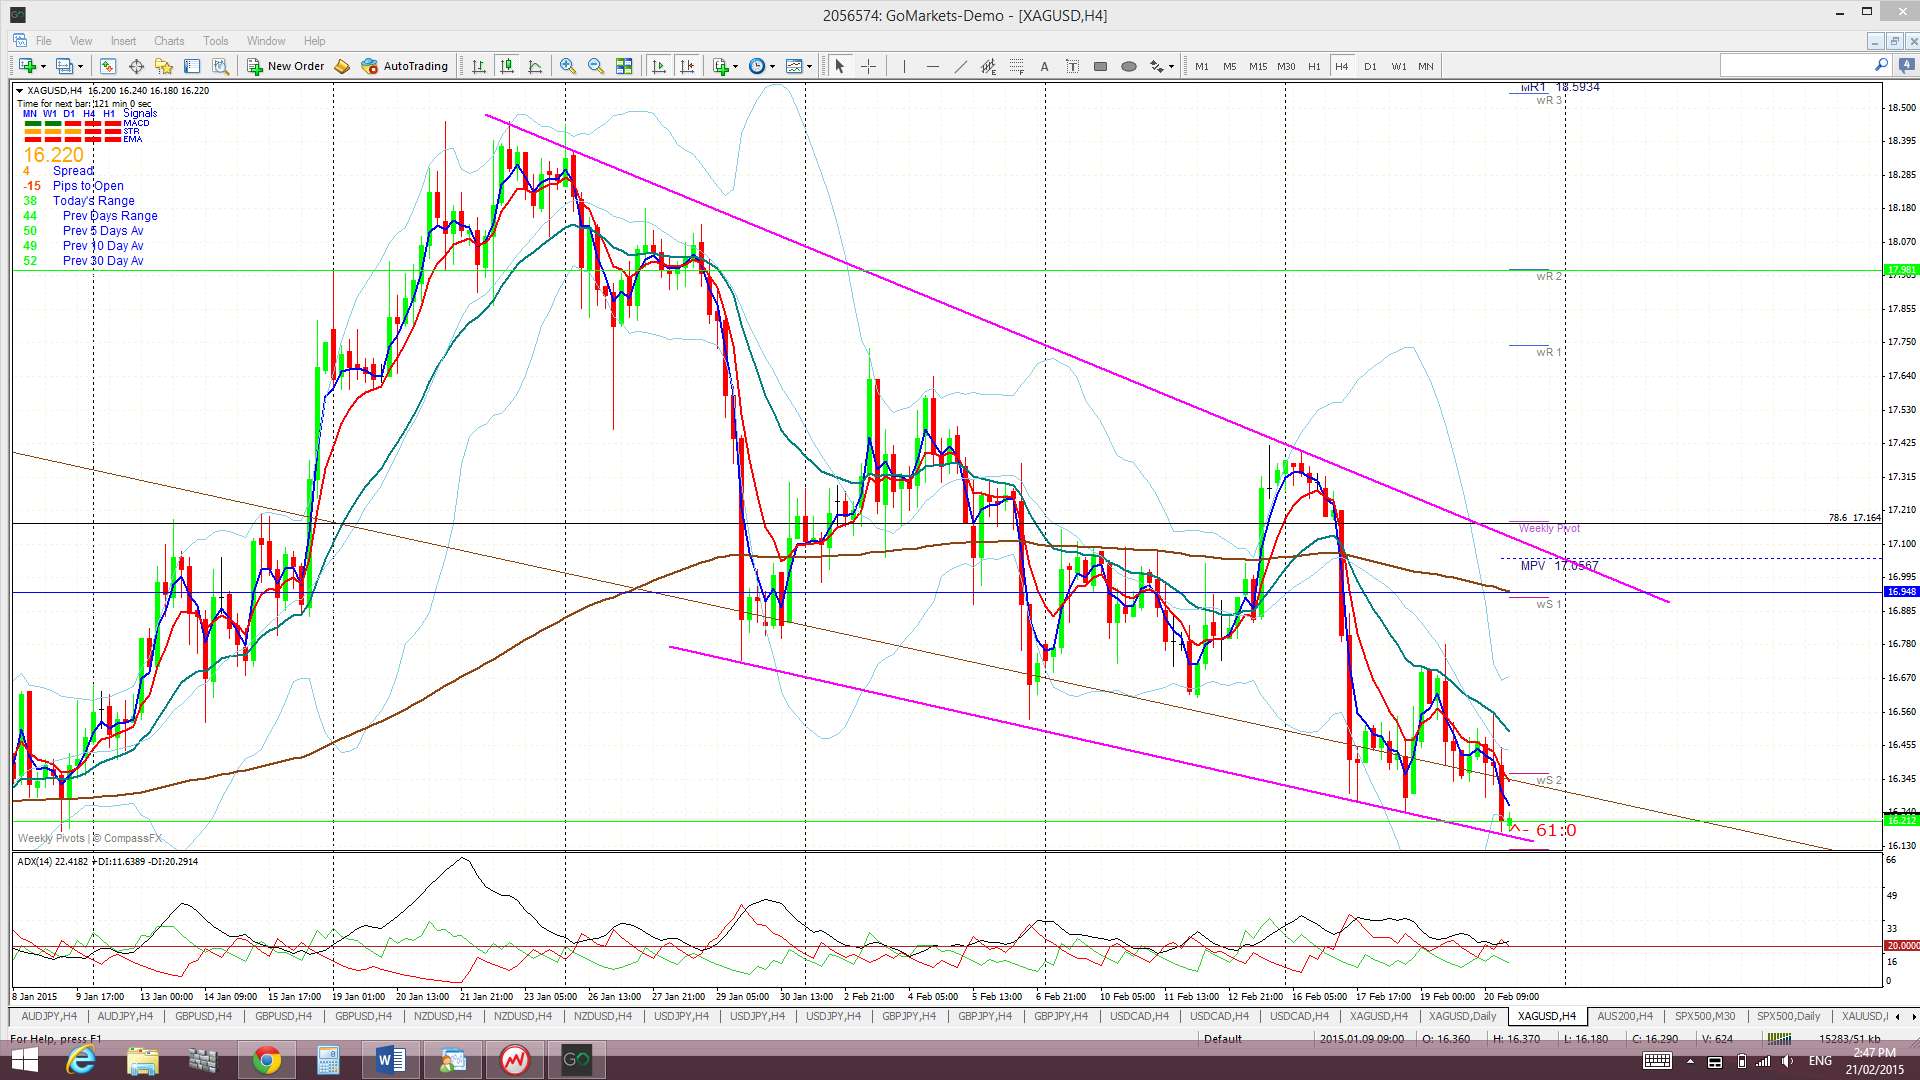
Silver: Silver chopped lower last week but found support from a recent support trend line and that of the monthly chart’s bear trend line that was broken a few weeks ago.
Silver is now trading below the Ichimoku Cloud on the 4hr chart, in the Cloud on the daily chart but below the Cloud on the weekly and monthly charts.
The weekly candle closed as bearish, almost ‘engulfing’, candle.
- I’m watching for any new TC signal and the monthly triangle trend line.
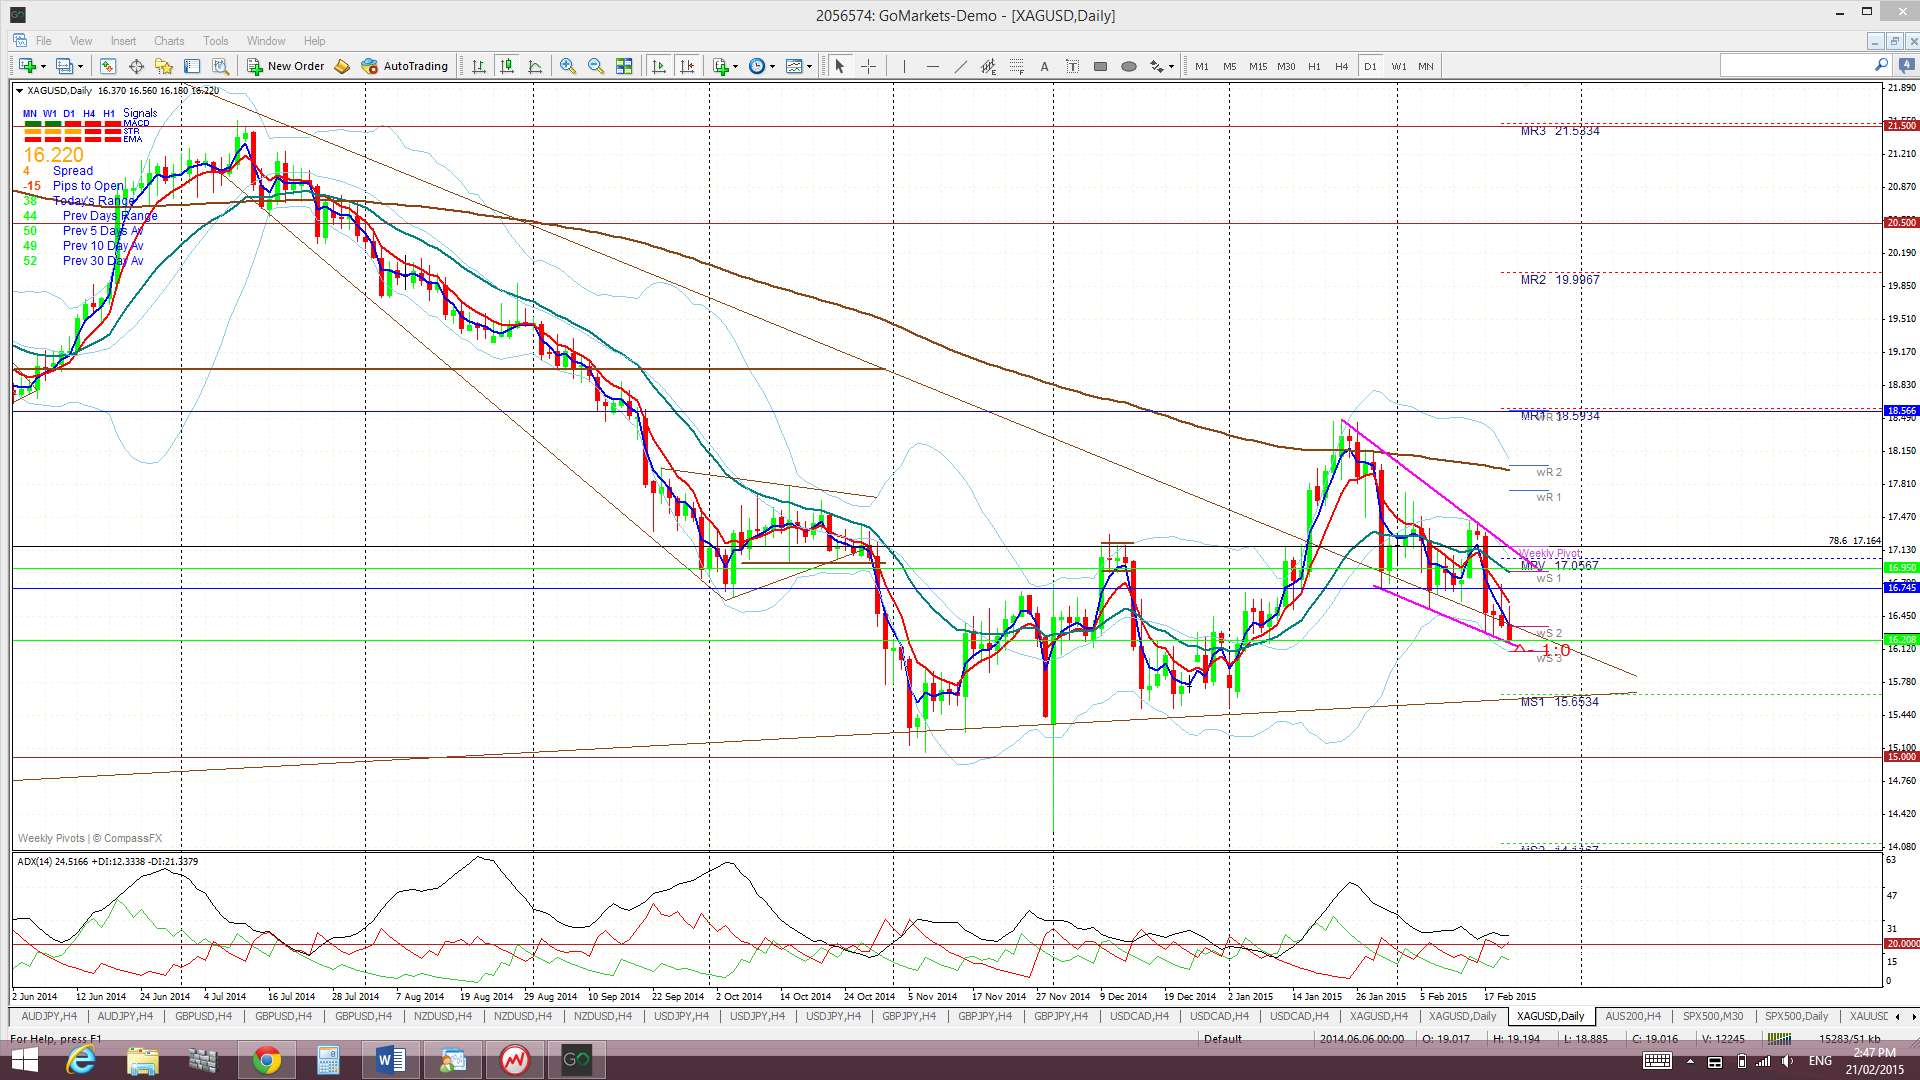
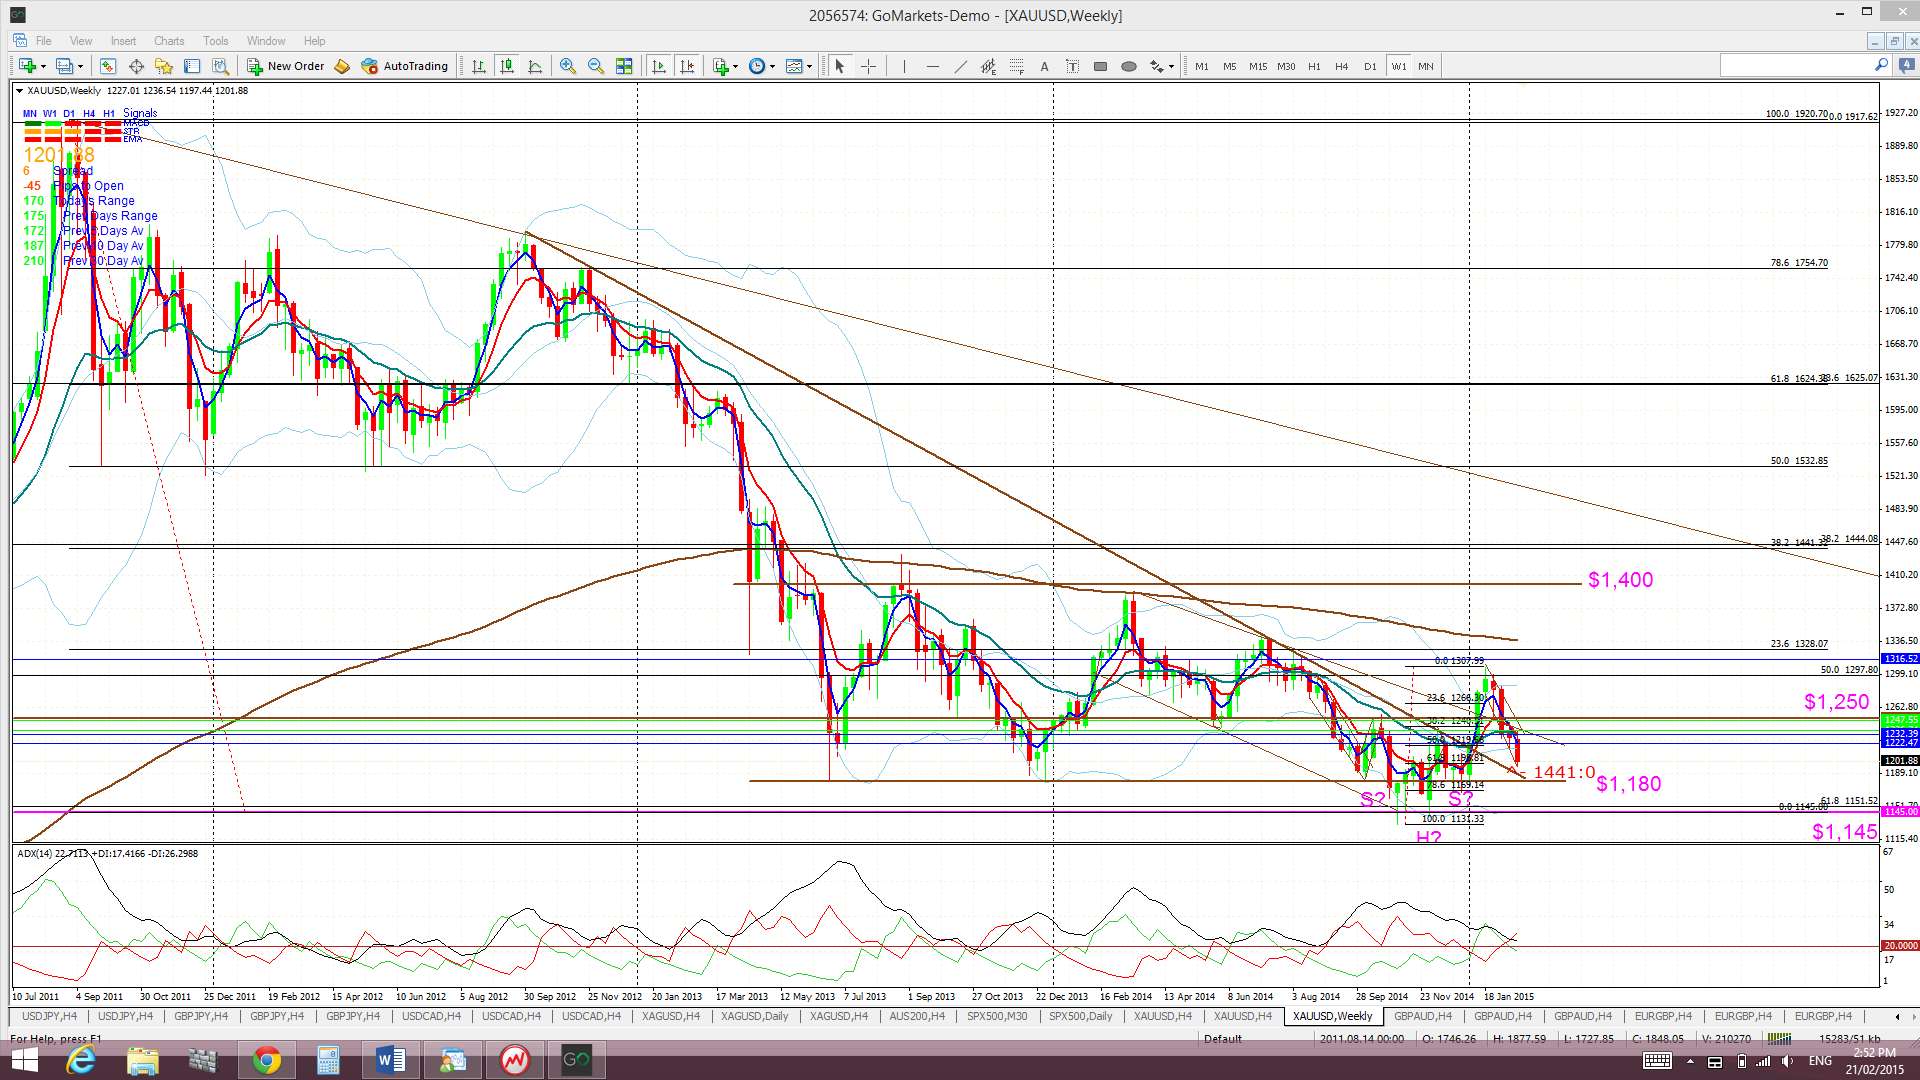
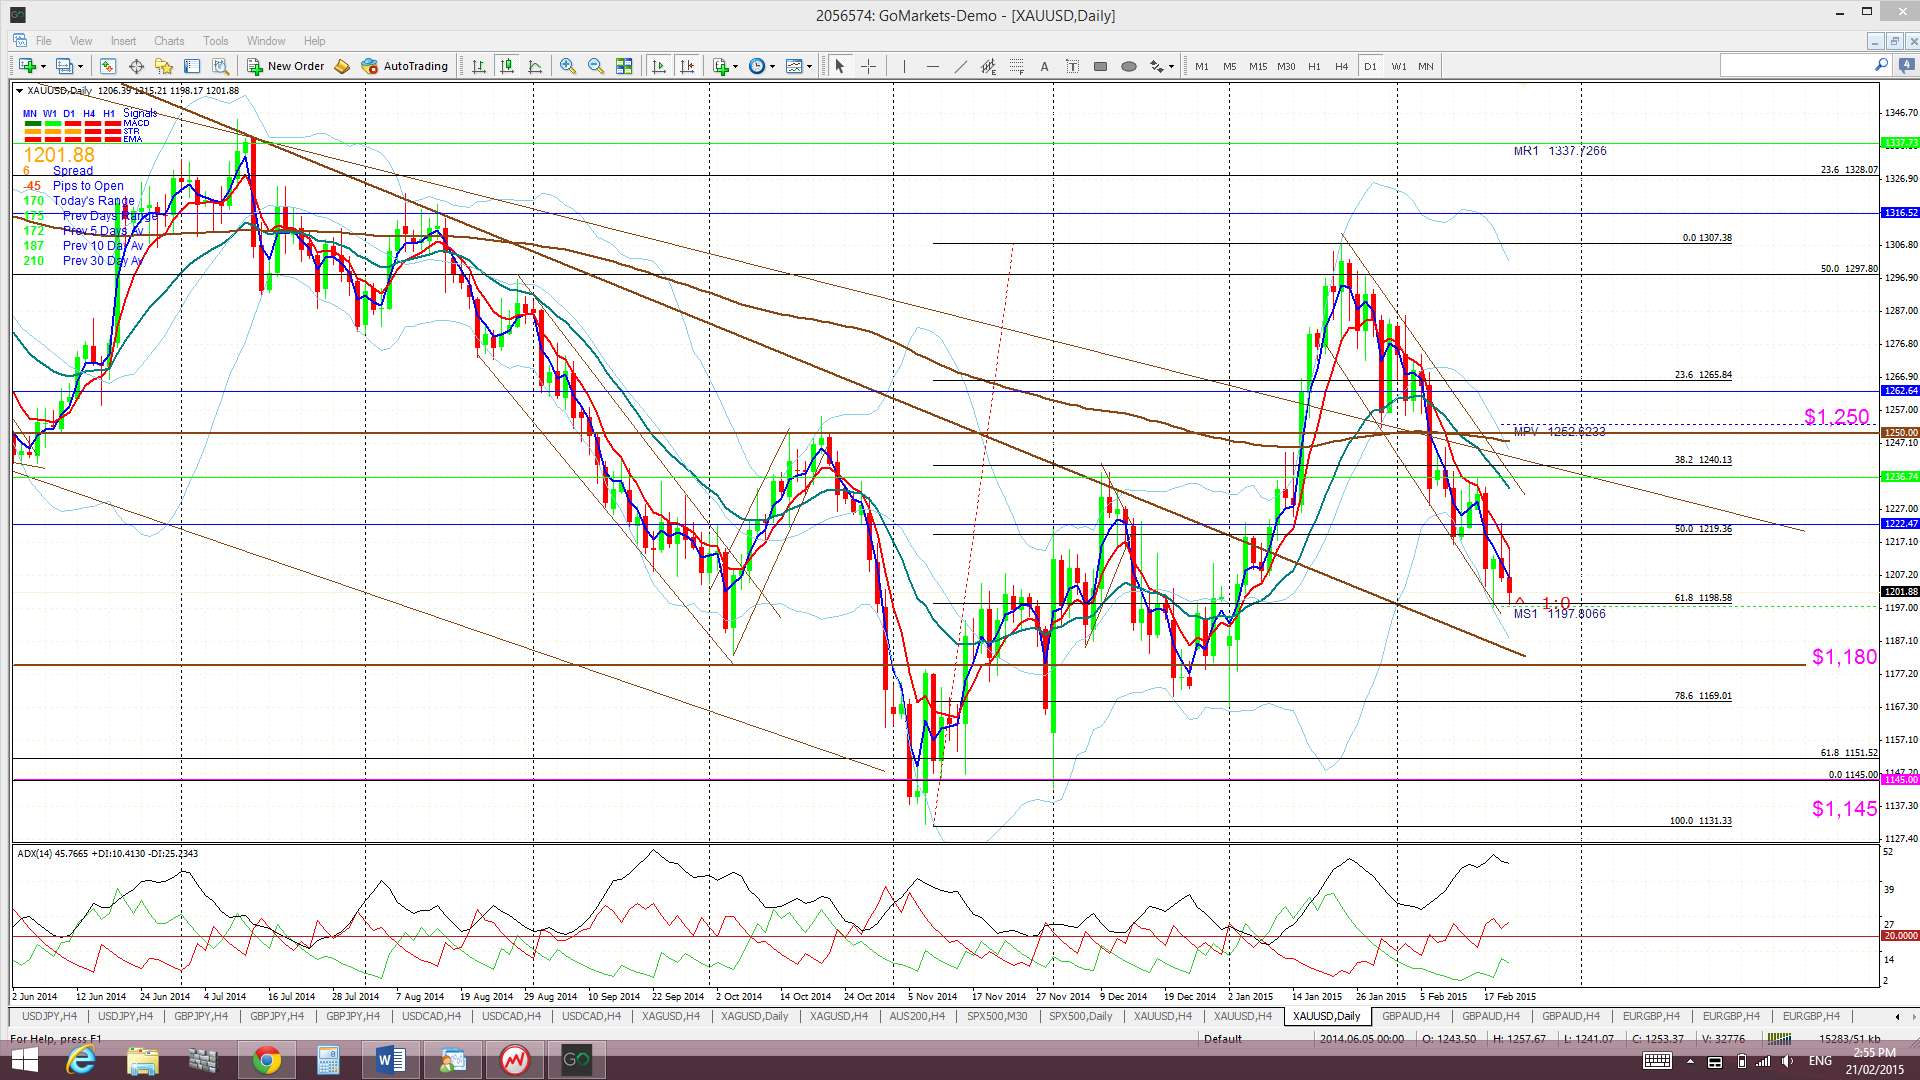
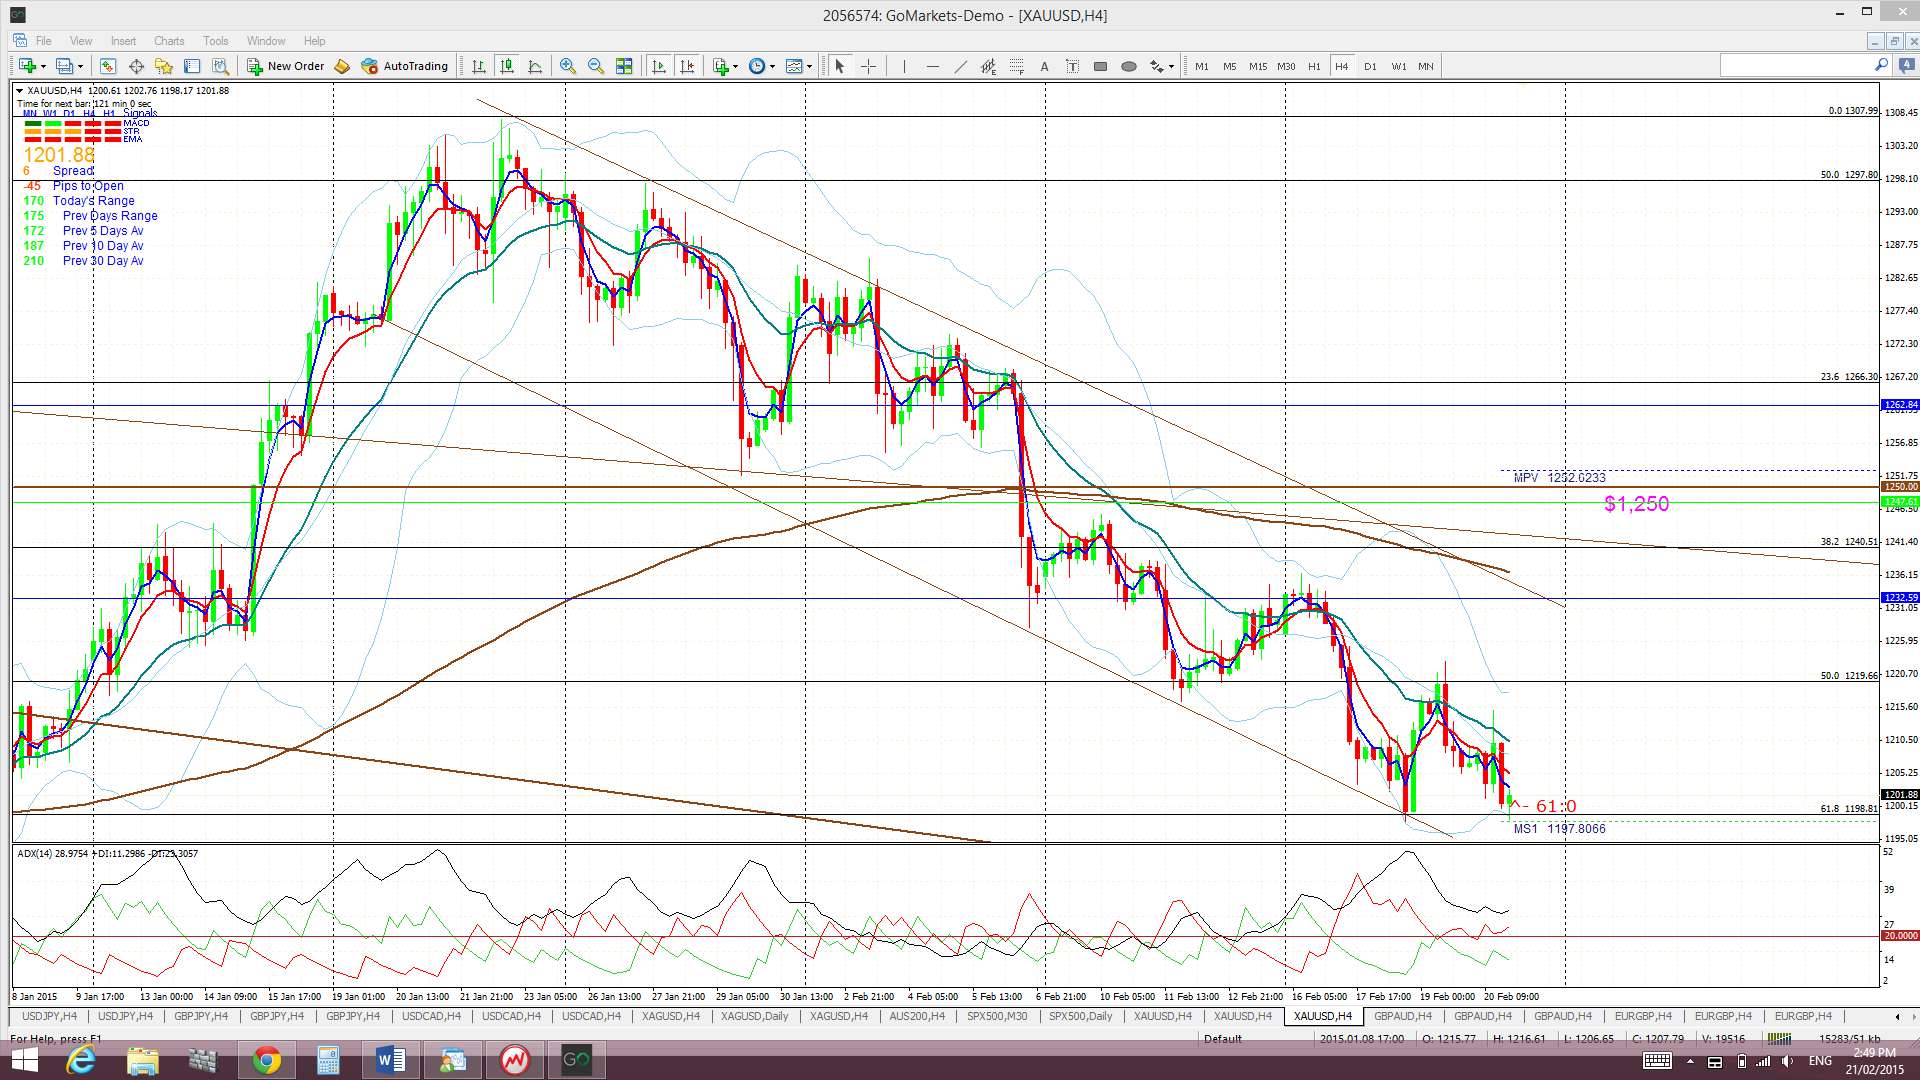
Gold: Gold chopped lower within a descending channel that has contained price action for the last five weeks now.
The daily chart shows that a 61.8% fib pullback of the recent bull run is right near the key $1,200 support level and price has held above there for now. $1,180 is another S/R level and just below current price and so I’ll be watching for any reaction there if price makes it down that far.
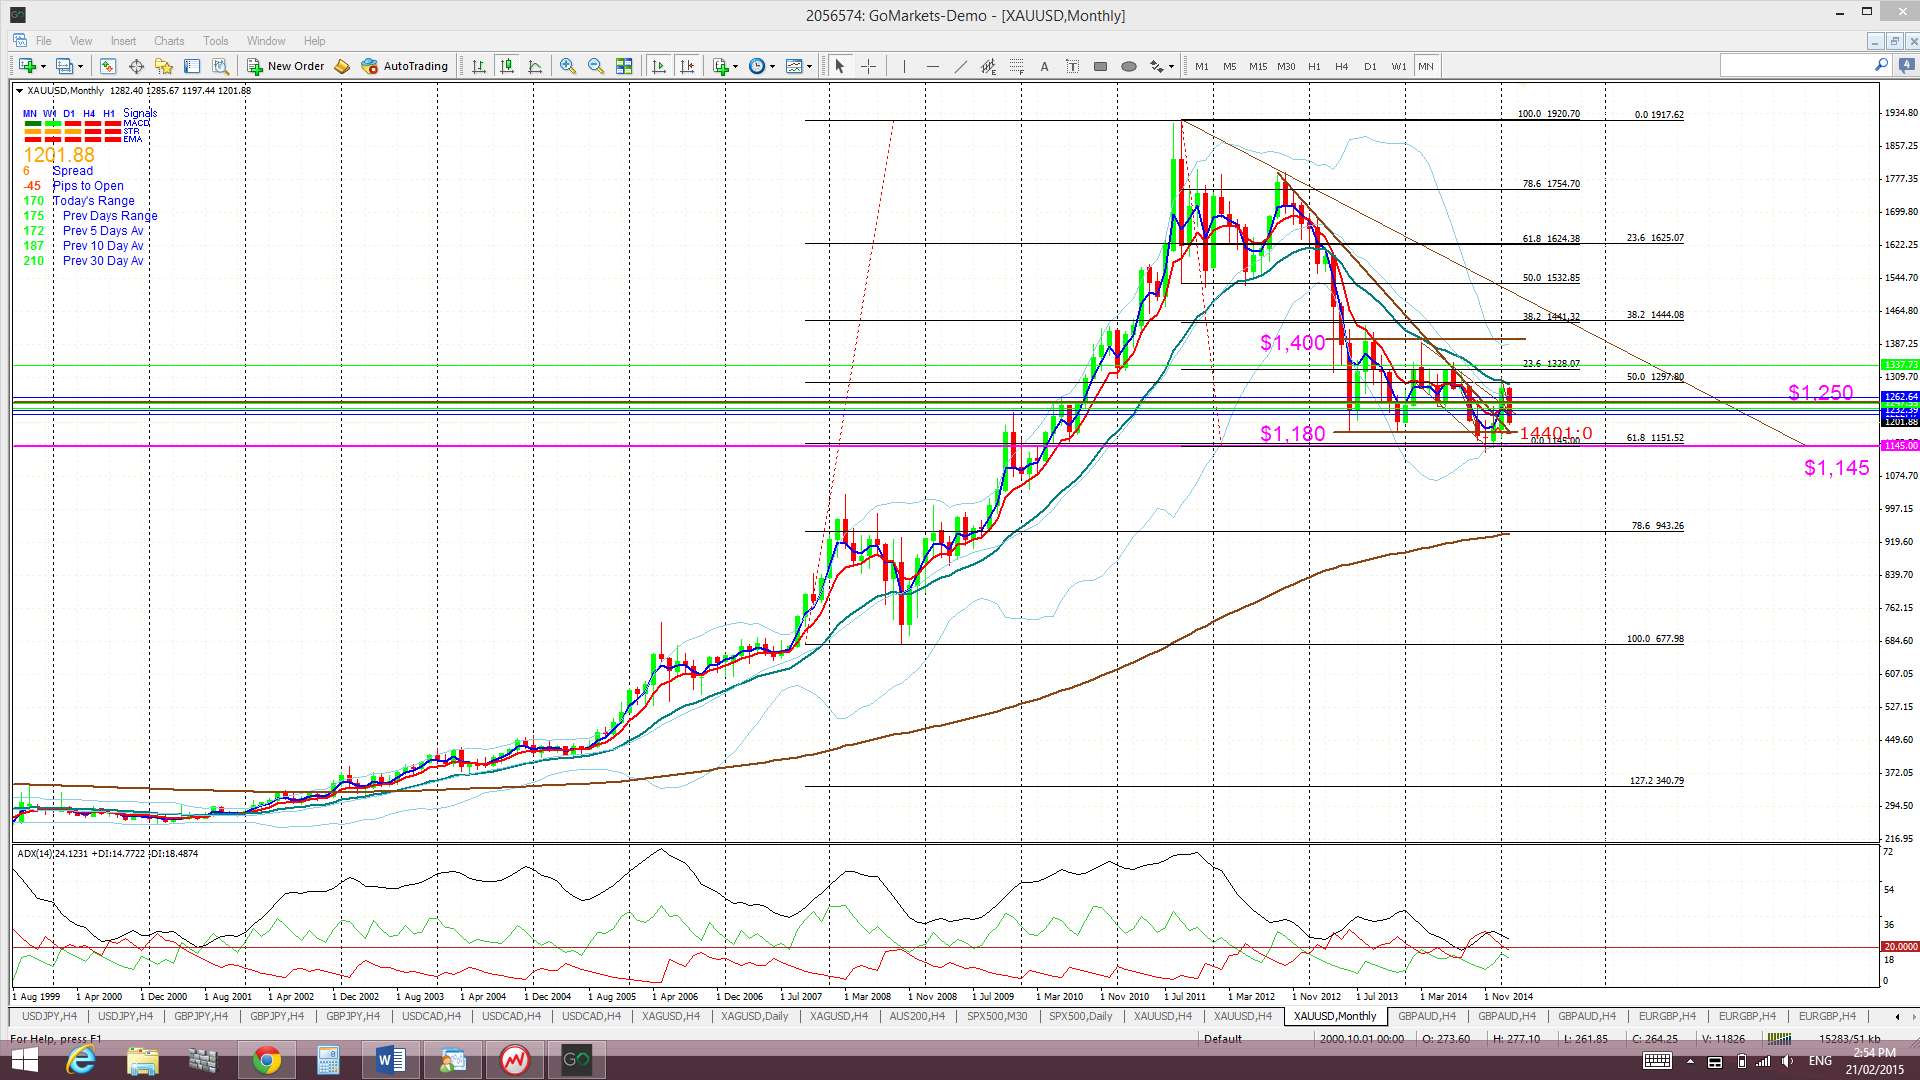
Whilst it looks likely that Gold has carved out a base here any new break and hold below $1,145 would suggest that this support might give way to a deeper pull back. Bearish targets below $1,145 include the $1,000 psychological level and, then, the 78.6% fib near $950.
Gold is trading below the Ichimoku Cloud on the 4hr chart, in the Cloud on the daily chart but below the Cloud on the weekly and monthly charts.
The weekly candle closed as a large bearish candle.
- I’m watching for any new TC signal, the $1,200 and the $1,180 level.
The post FX ranging for now but global Stocks rally. appeared first on www.forextell.com.