Last week: After a couple of tough weeks for trend trading Spring certainly seems to have sprung! There were some great trend line breakouts trades and TC signals and I am hoping, that with the norther Summer behind us, there will be more of this to come! The weekly charts of many instruments look have me thinking that the mean reversion, I’ve long waxed on about, might be starting to gear up.
Trend line breakout tally: these trades gave the following maximum pip movement and were profiled mid-week here, here, here andhere:
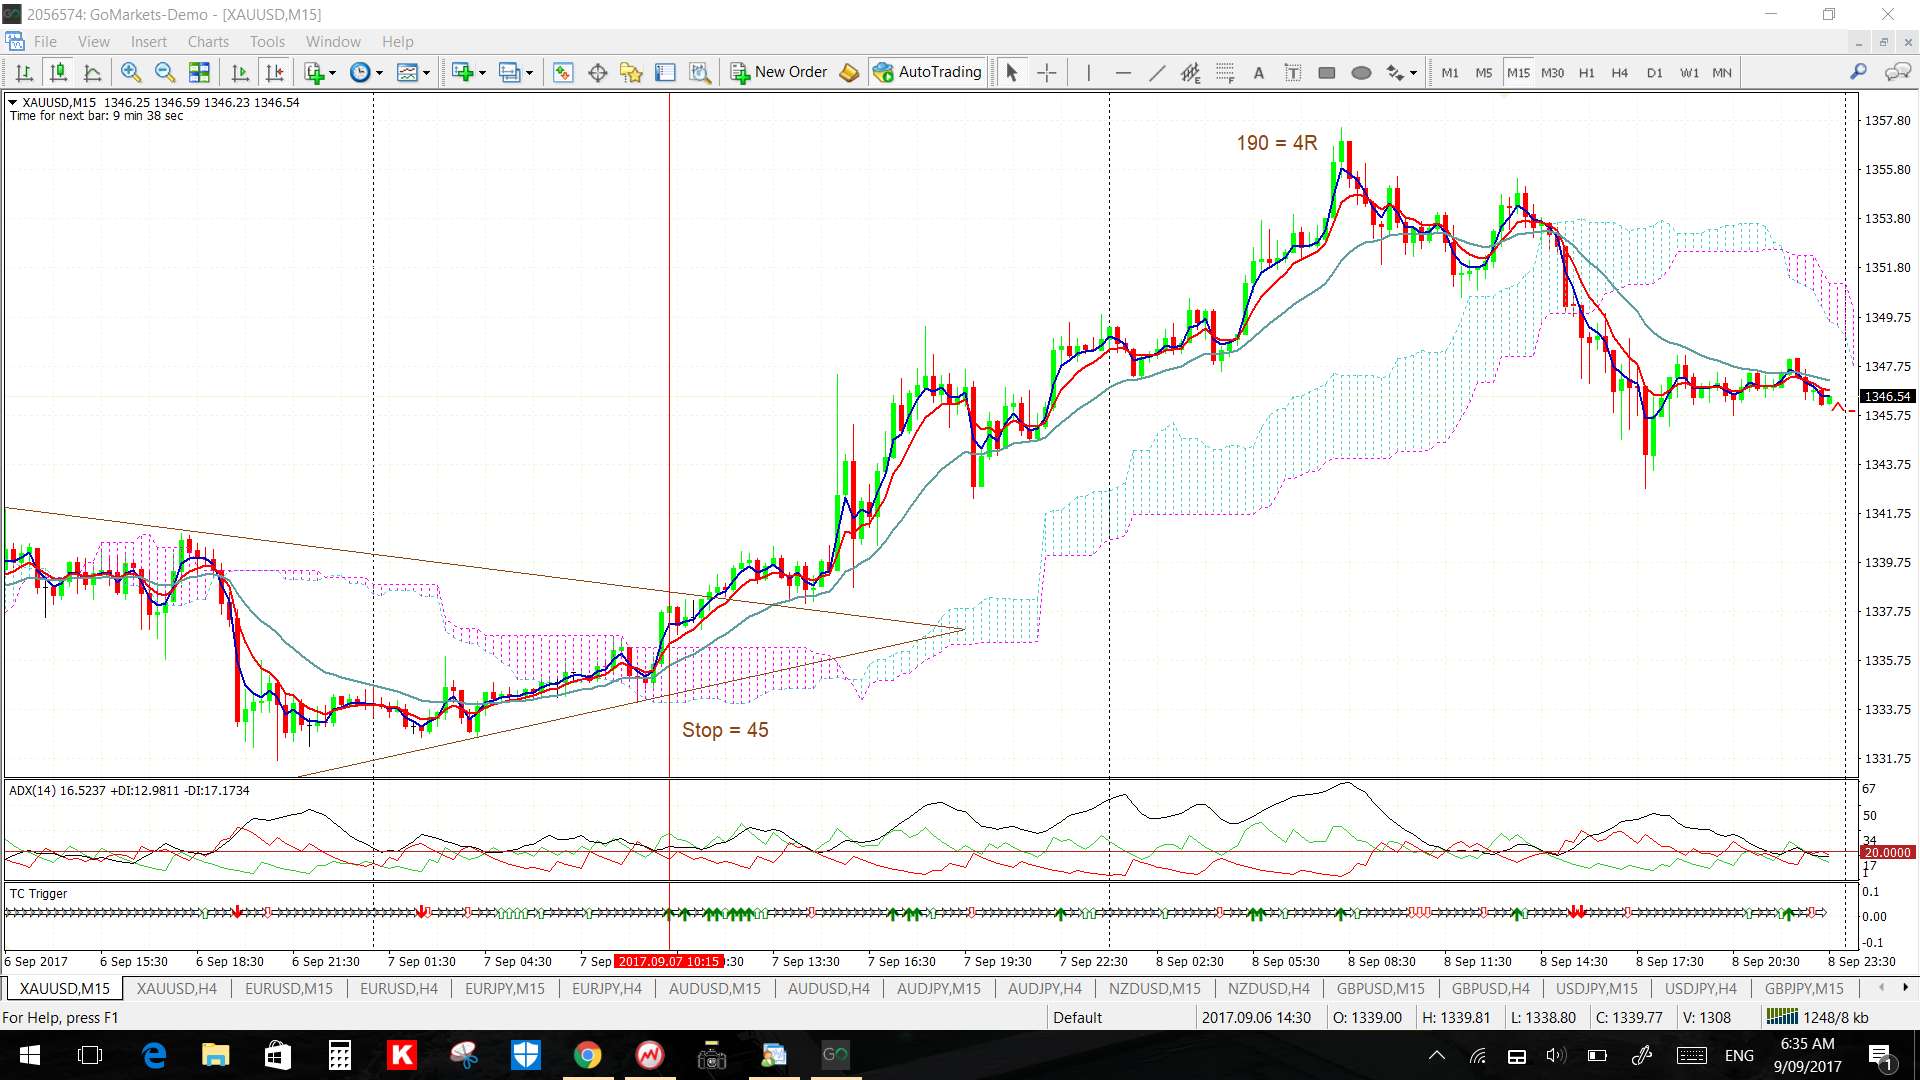
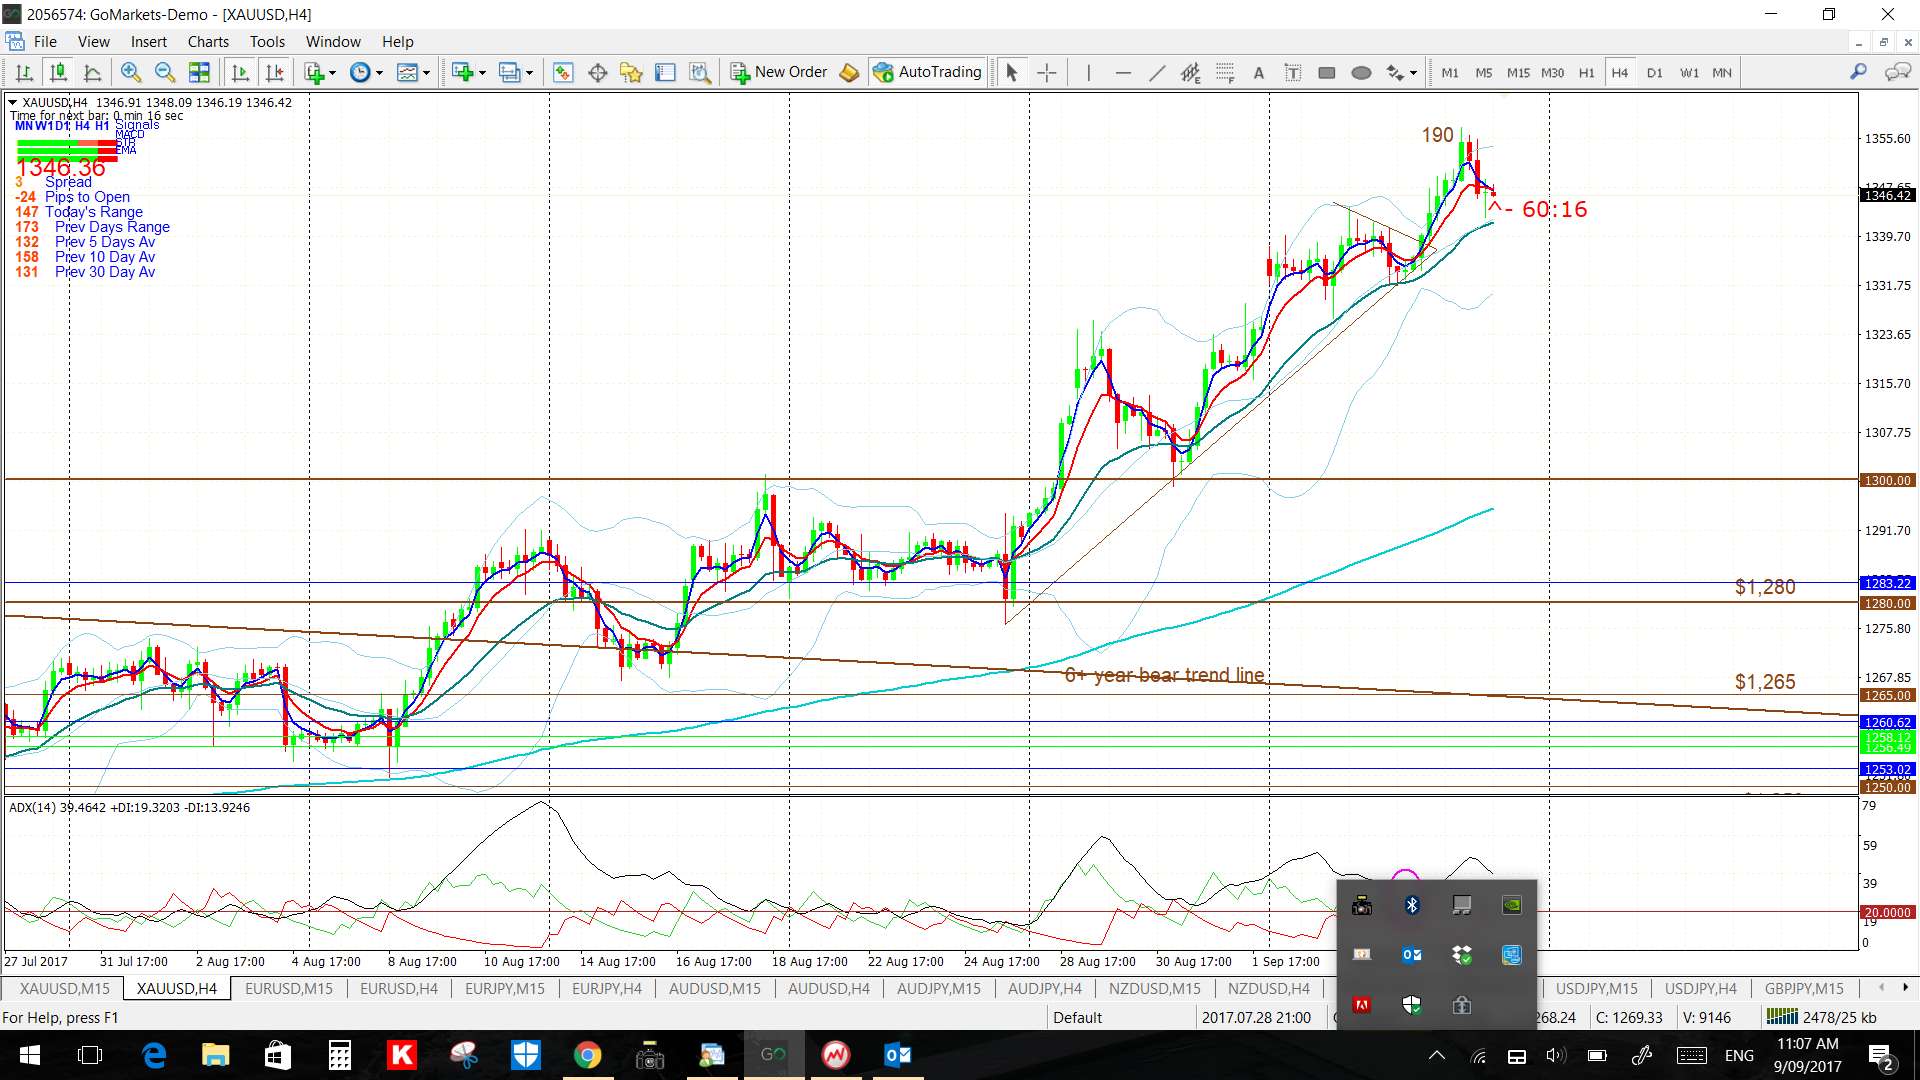
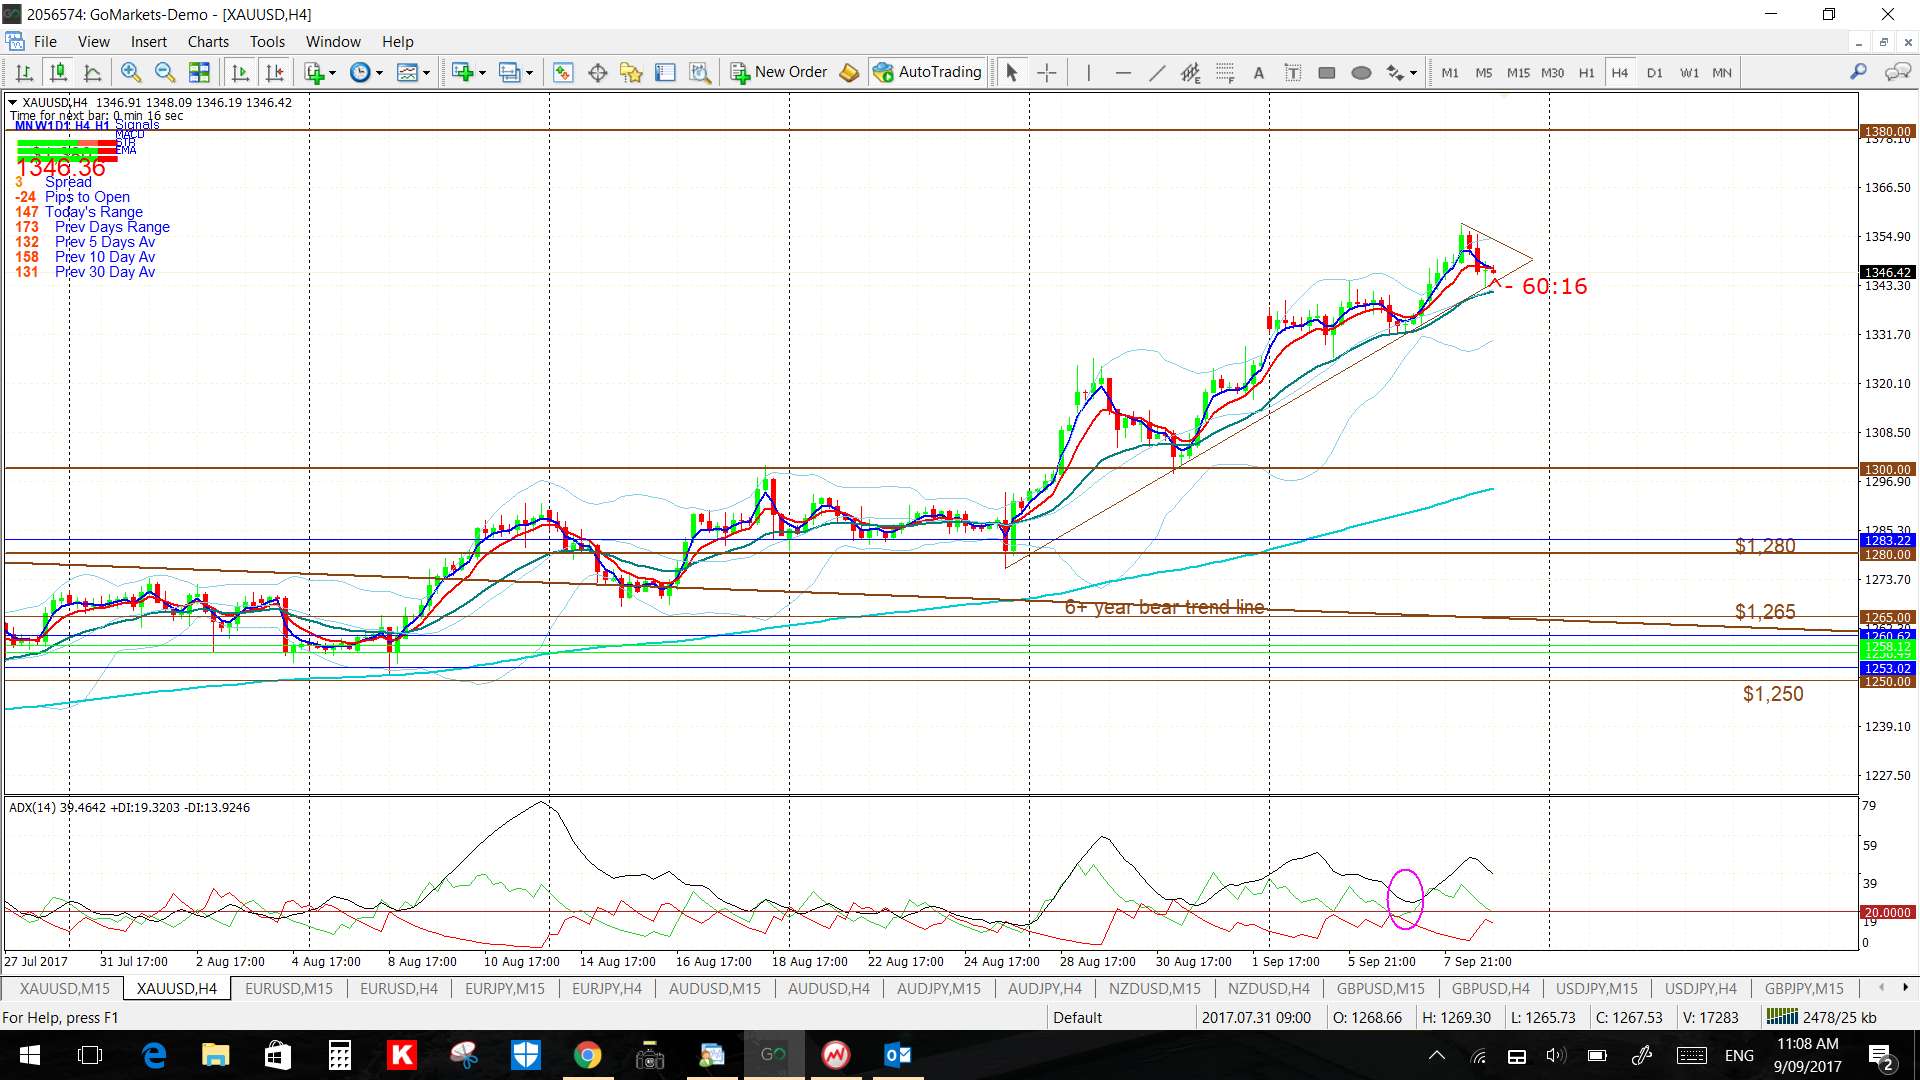
- Gold: 180 pips and 190 pips.
- EUR/JPY: 85 pips.
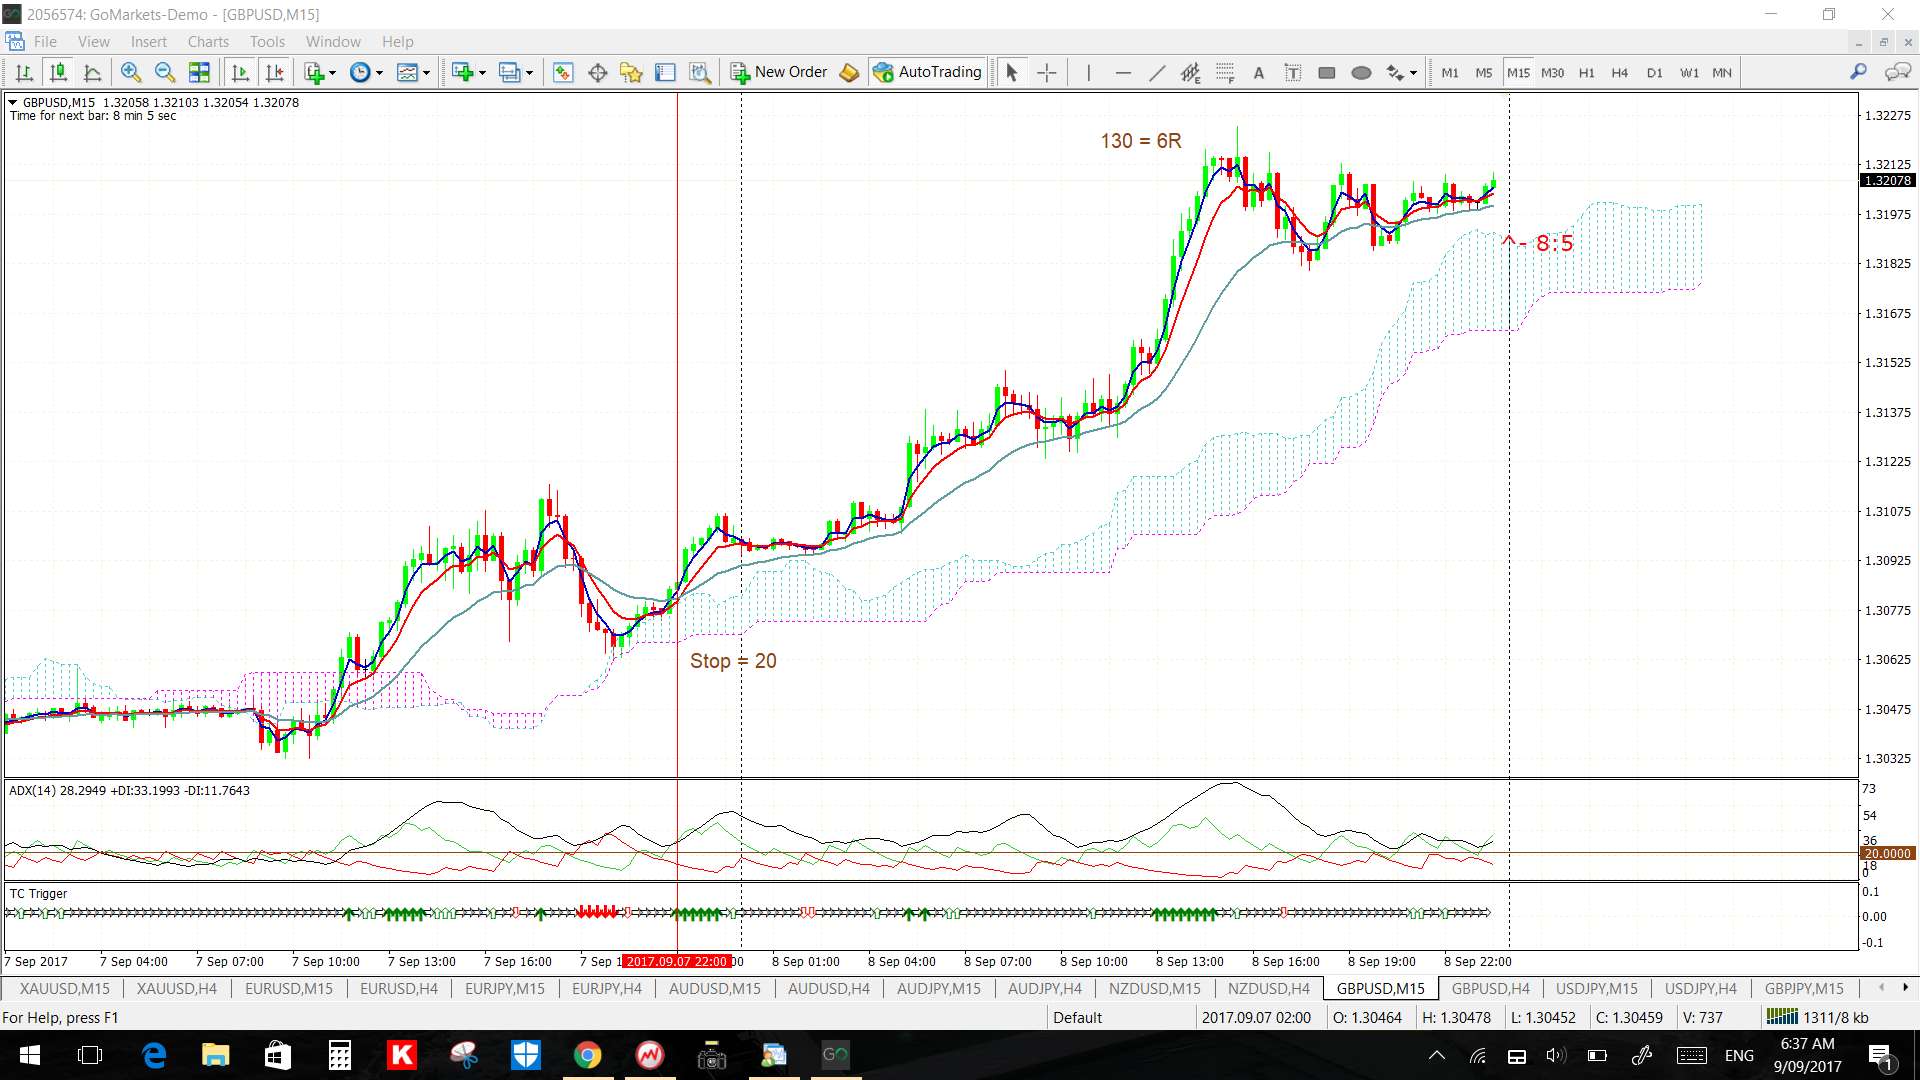
- GBP/USD: 250 pips.
- EUR/NZD: 150 pips and 100 pips.
- GBP/NZD: 170 pips.
- GBP/AUD: 80 pips.
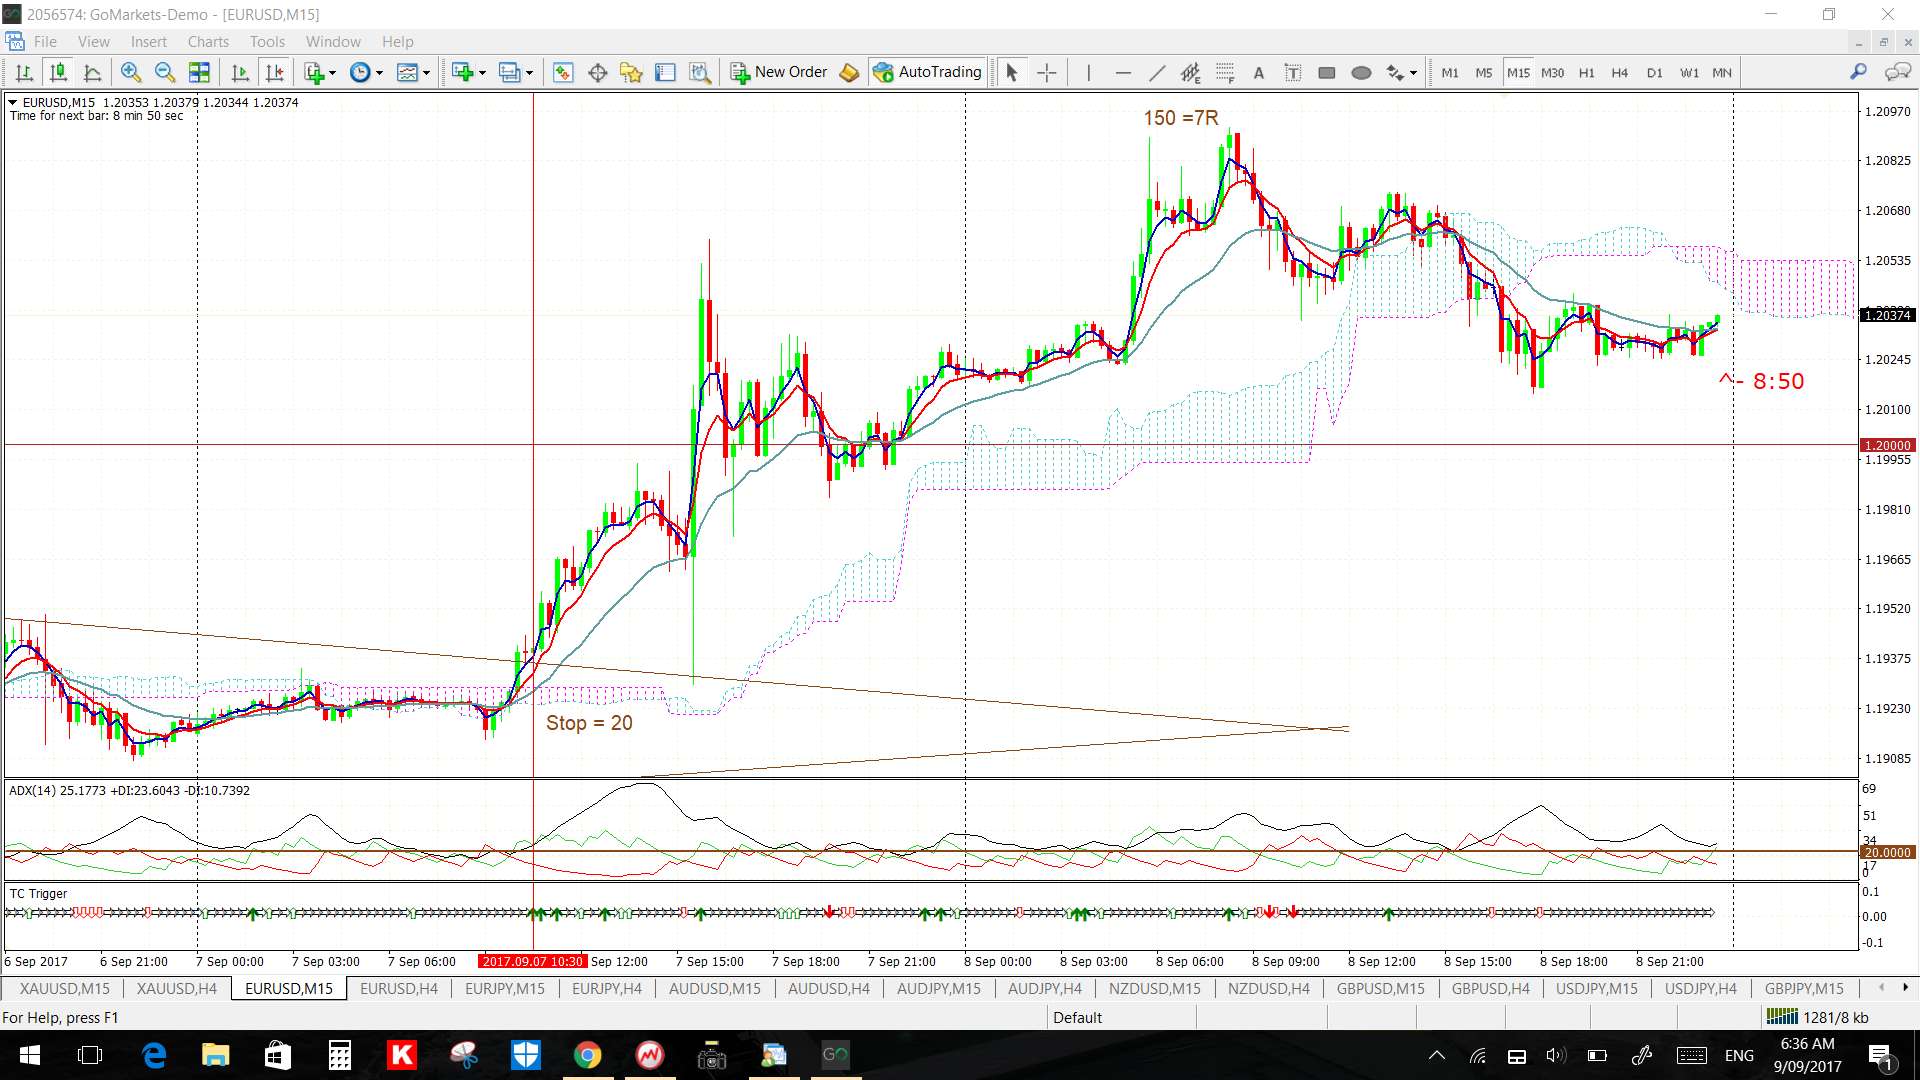
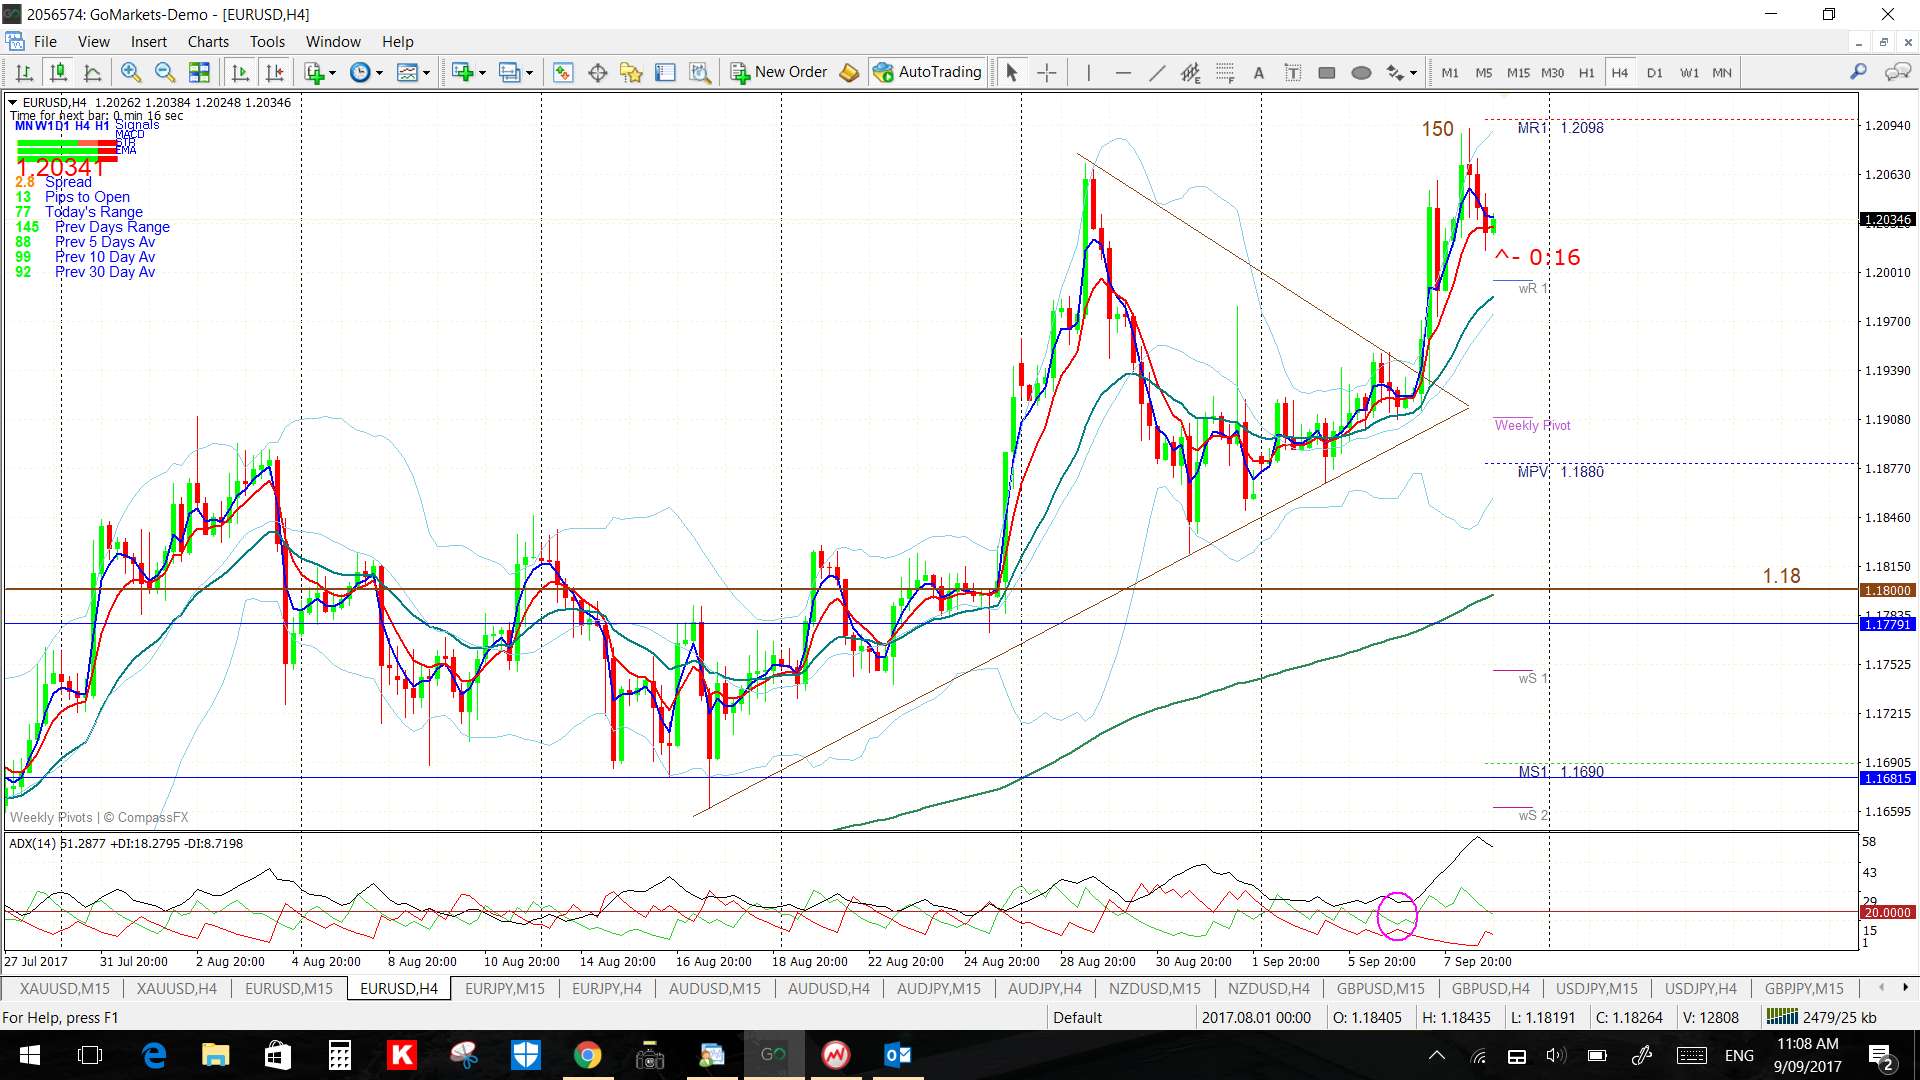
- EUR/USD: 150 pips.
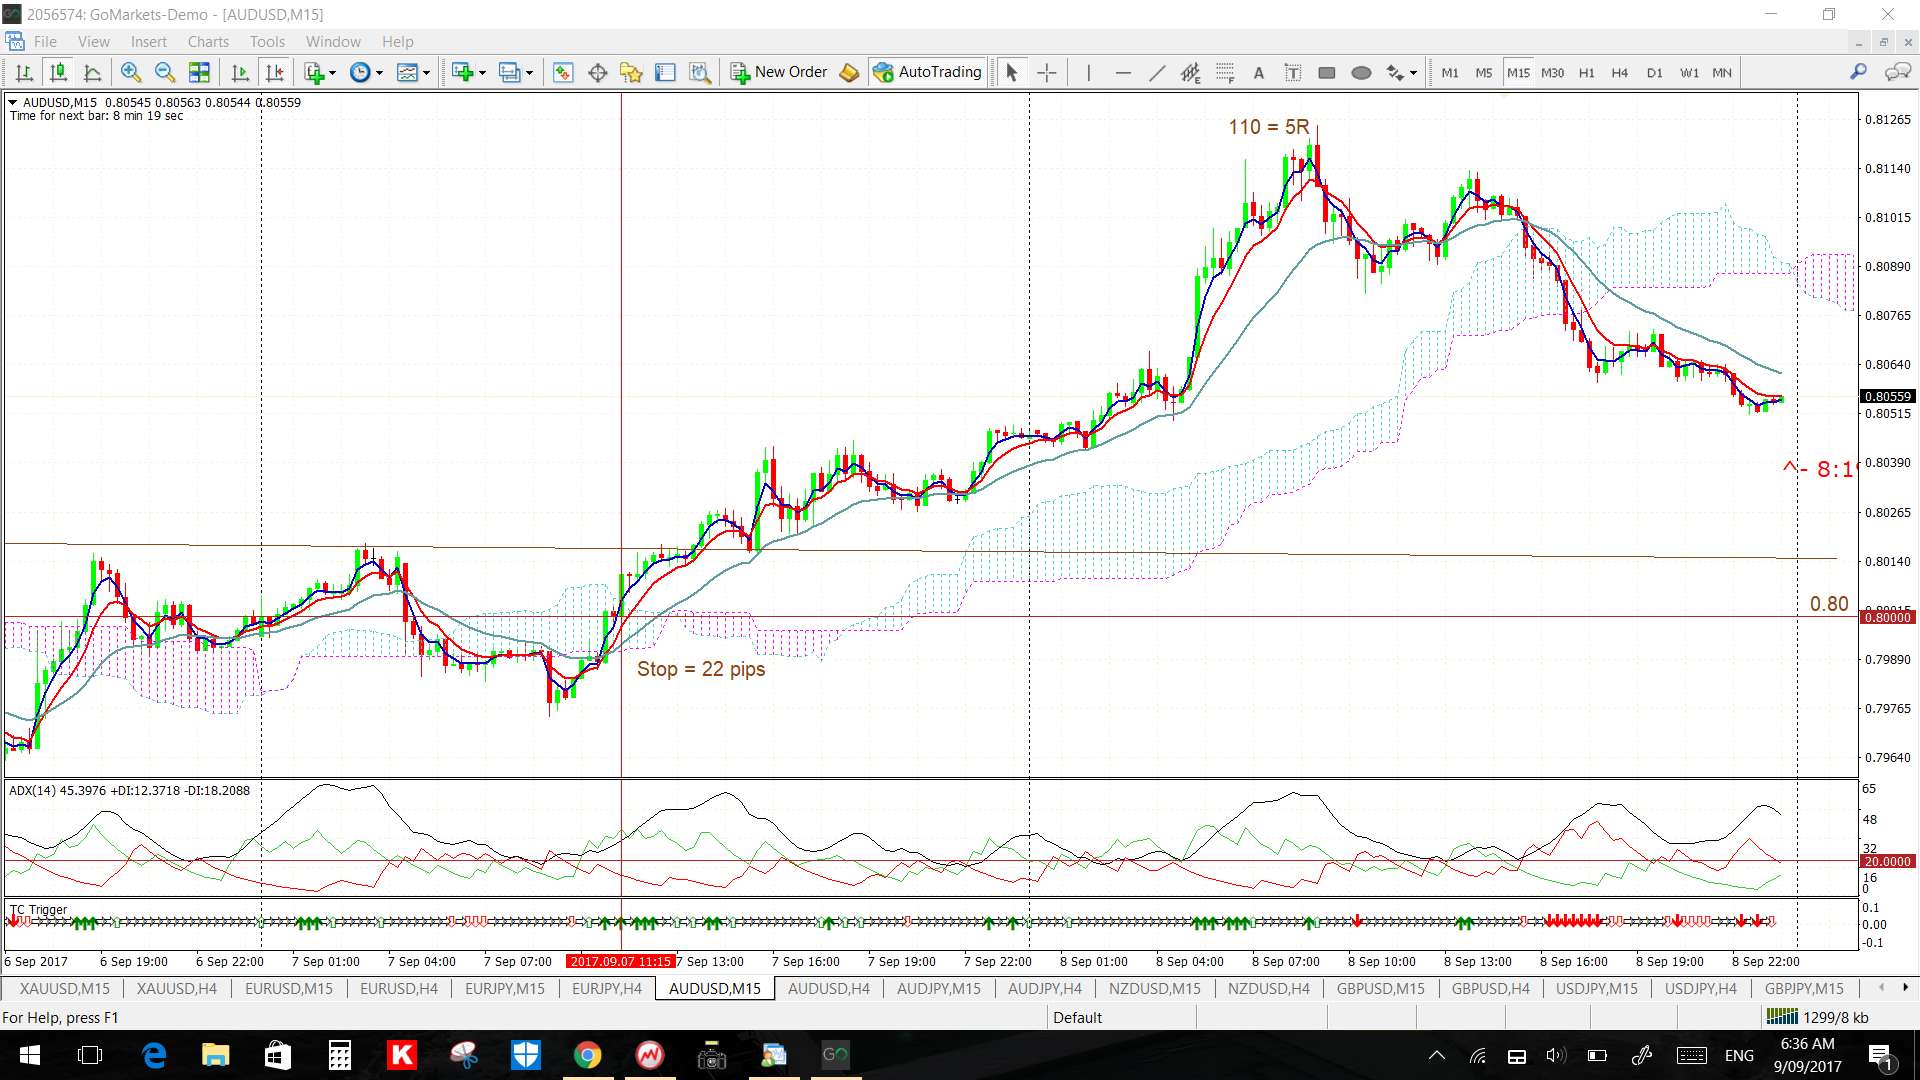
- AUD/USD: 100 pips (on Friday)
- NZD/USD: 100 pips (on Friday)
This week:
- US$: the US$ index closed lower for the week. A review of the FX Indices can be found through this link.
- Data: There was upbeat CNY CPI and PPI data released after the markets closed on Friday so watch for impact at market open, especially on the AUD and NZD pairs. There are two Central Bank rate updates from BoE (GBP) and SNB (CHF) as well as AUD & GBP Employment data to monitor this week.
- UN vote on North Korea sanctions: the US has called for a Monday UN vote on North Korea sanctions so watch for any impact on market sentiment from this event.
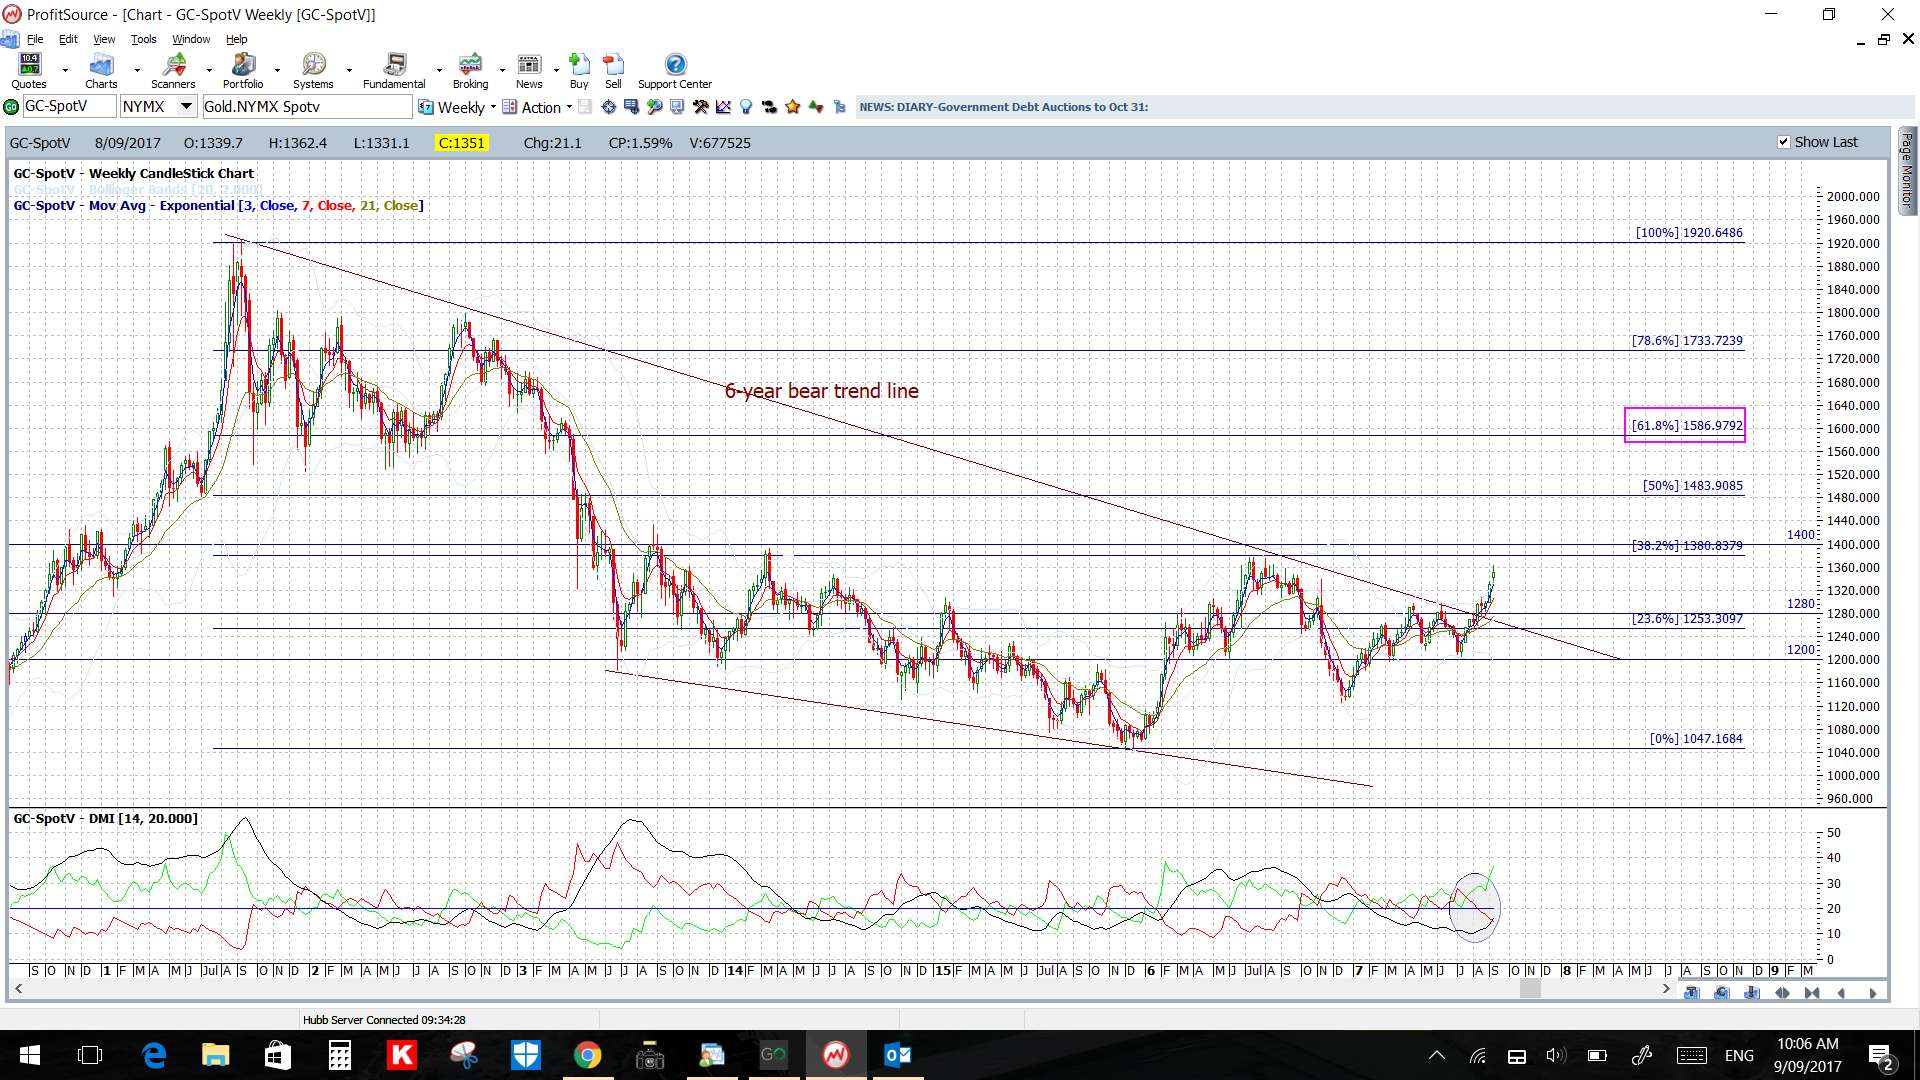
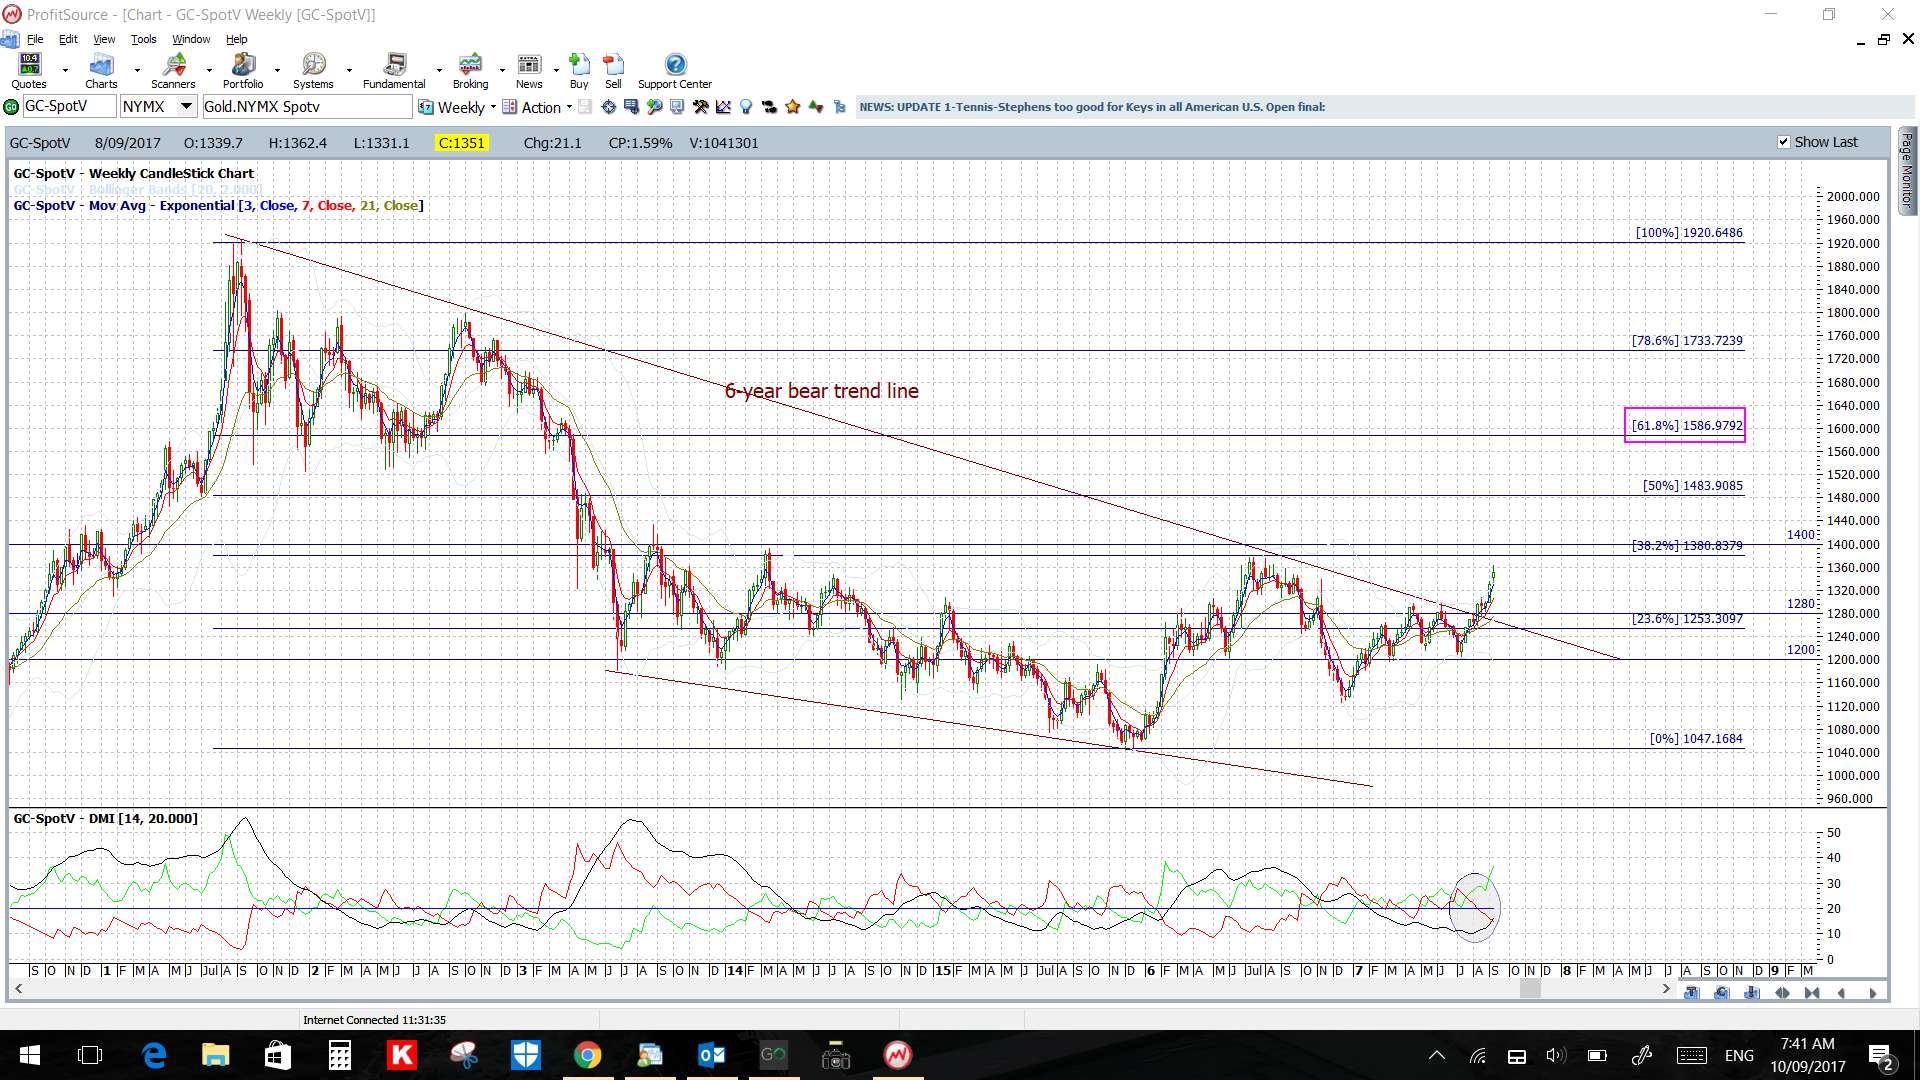
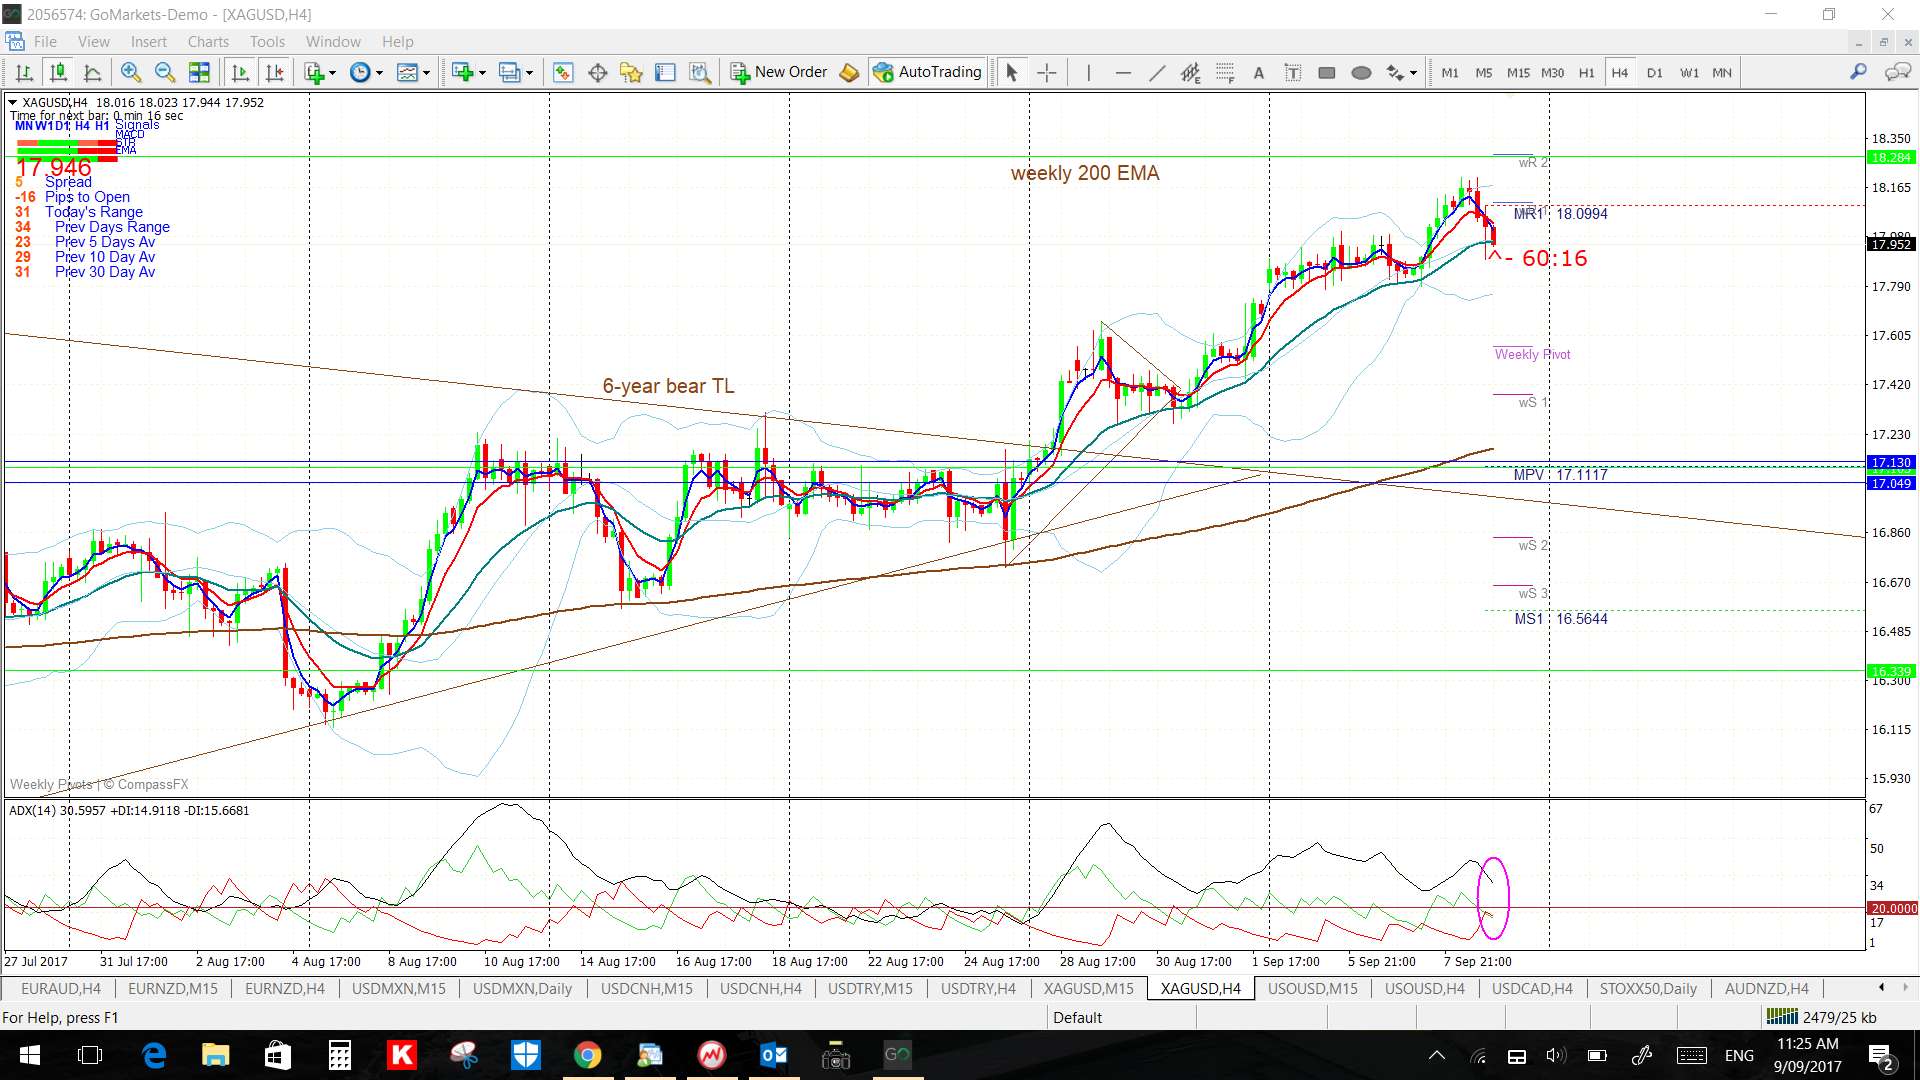
- Gold: continues holding up above the recently broken 6-year bear trend line so keep watching for any continuation move up to the weekly chart’s 61.8% fib; circa $1,600:
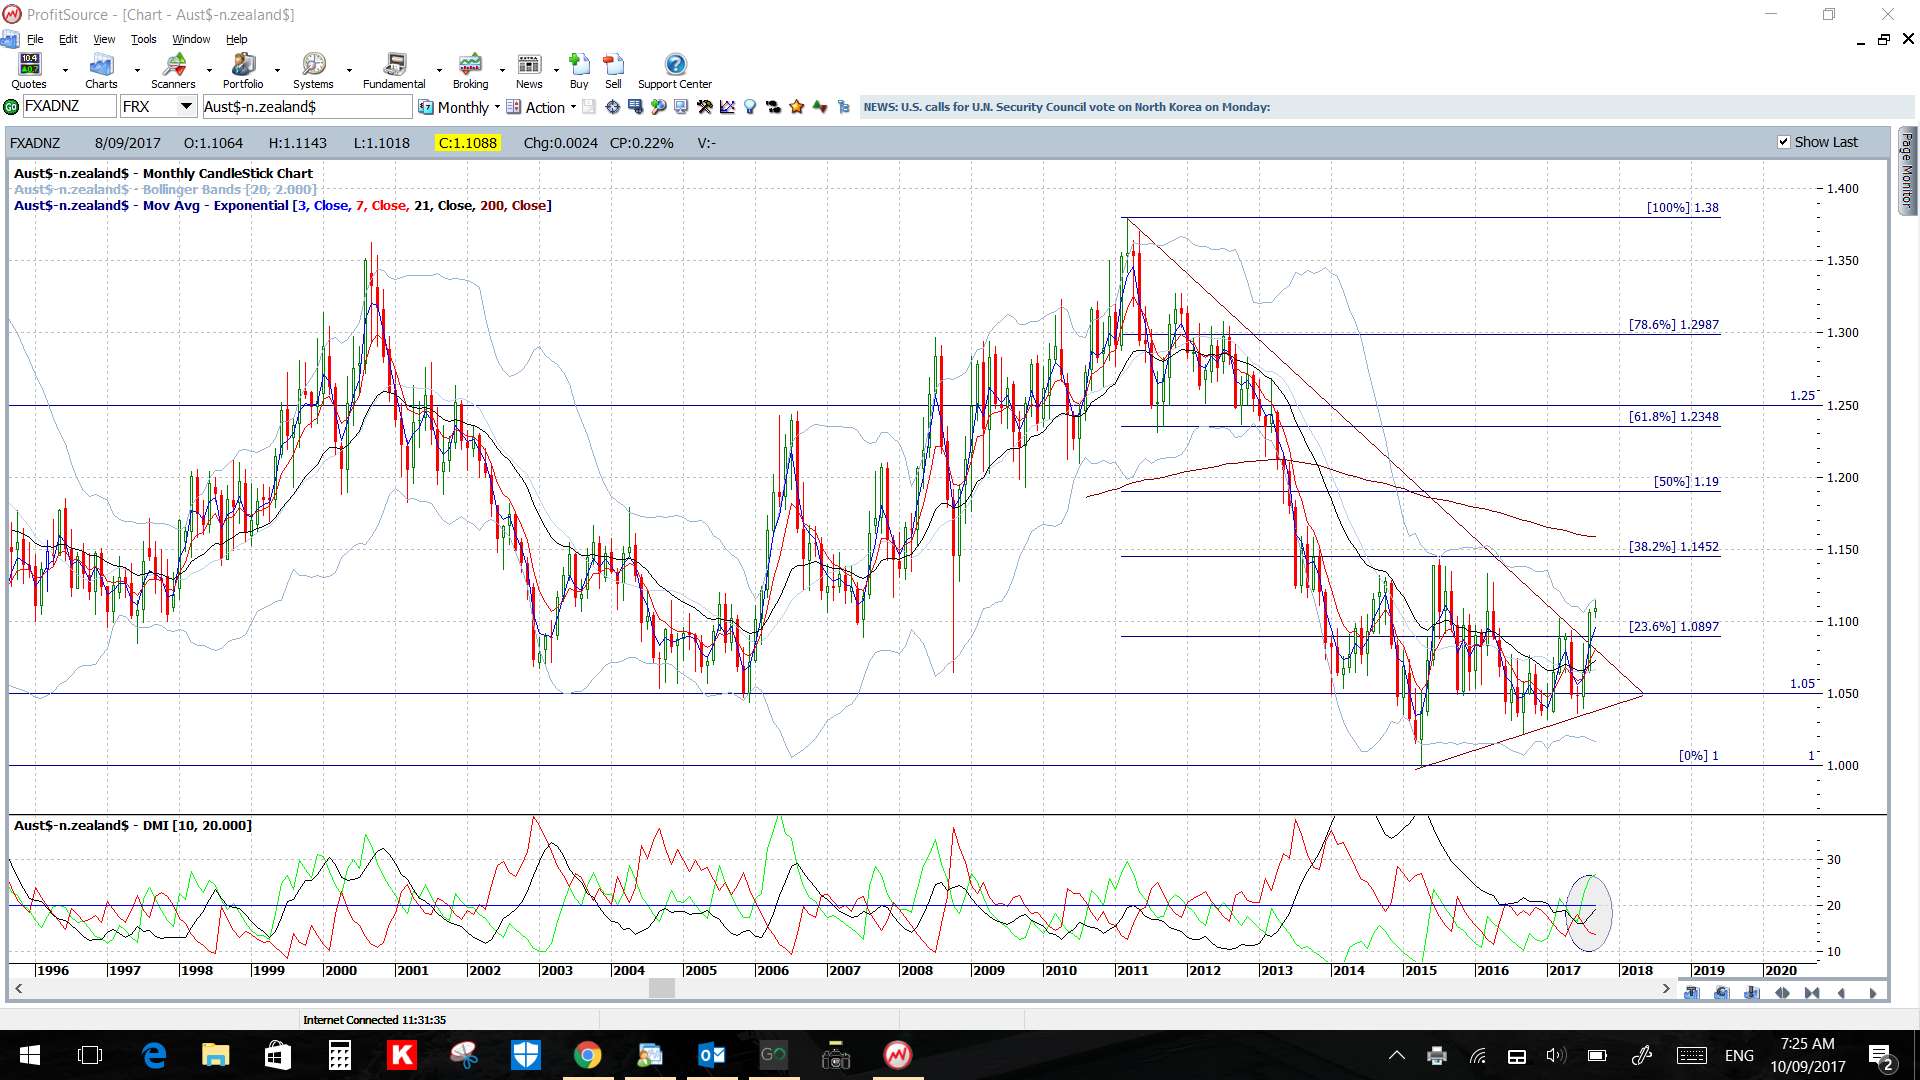
- AUD/NZD monthly: this pair looks like it could be starting some mean reversion too!
- NB: This is just a brief update as I’ve been away for the w/e. I moved position from yesterday though!
Calendar:
- Mon 11th: nil
- Tue 12th: GBP CPI.
- Wed 13th: GBP Employment data. USD PPI & Crude Oil Inventories.
- Thurs 14th: AUD Employment data. CNY Industrial Production. CHF SNB rate update. GBP BoE rate update. USD CPI.
- Fri 15th: USD Retail Sales.
TC Signals: The end of the northern Summer has really helped to deliver a return to trending markets and this has also helped to produce some great TC 15 min chart signals during the last week. A few of the better 15 min chart signals from the week are highlighted below.
Gold: this was a great TC signal falling into the Optimal TC signal category for 4R!
EUR/USD: another one that falls into the TC Optimal TC category although there was the ECB rate announcement during this move. There was a 2R result here some hours before the ECB but it then went on for a 7R return:
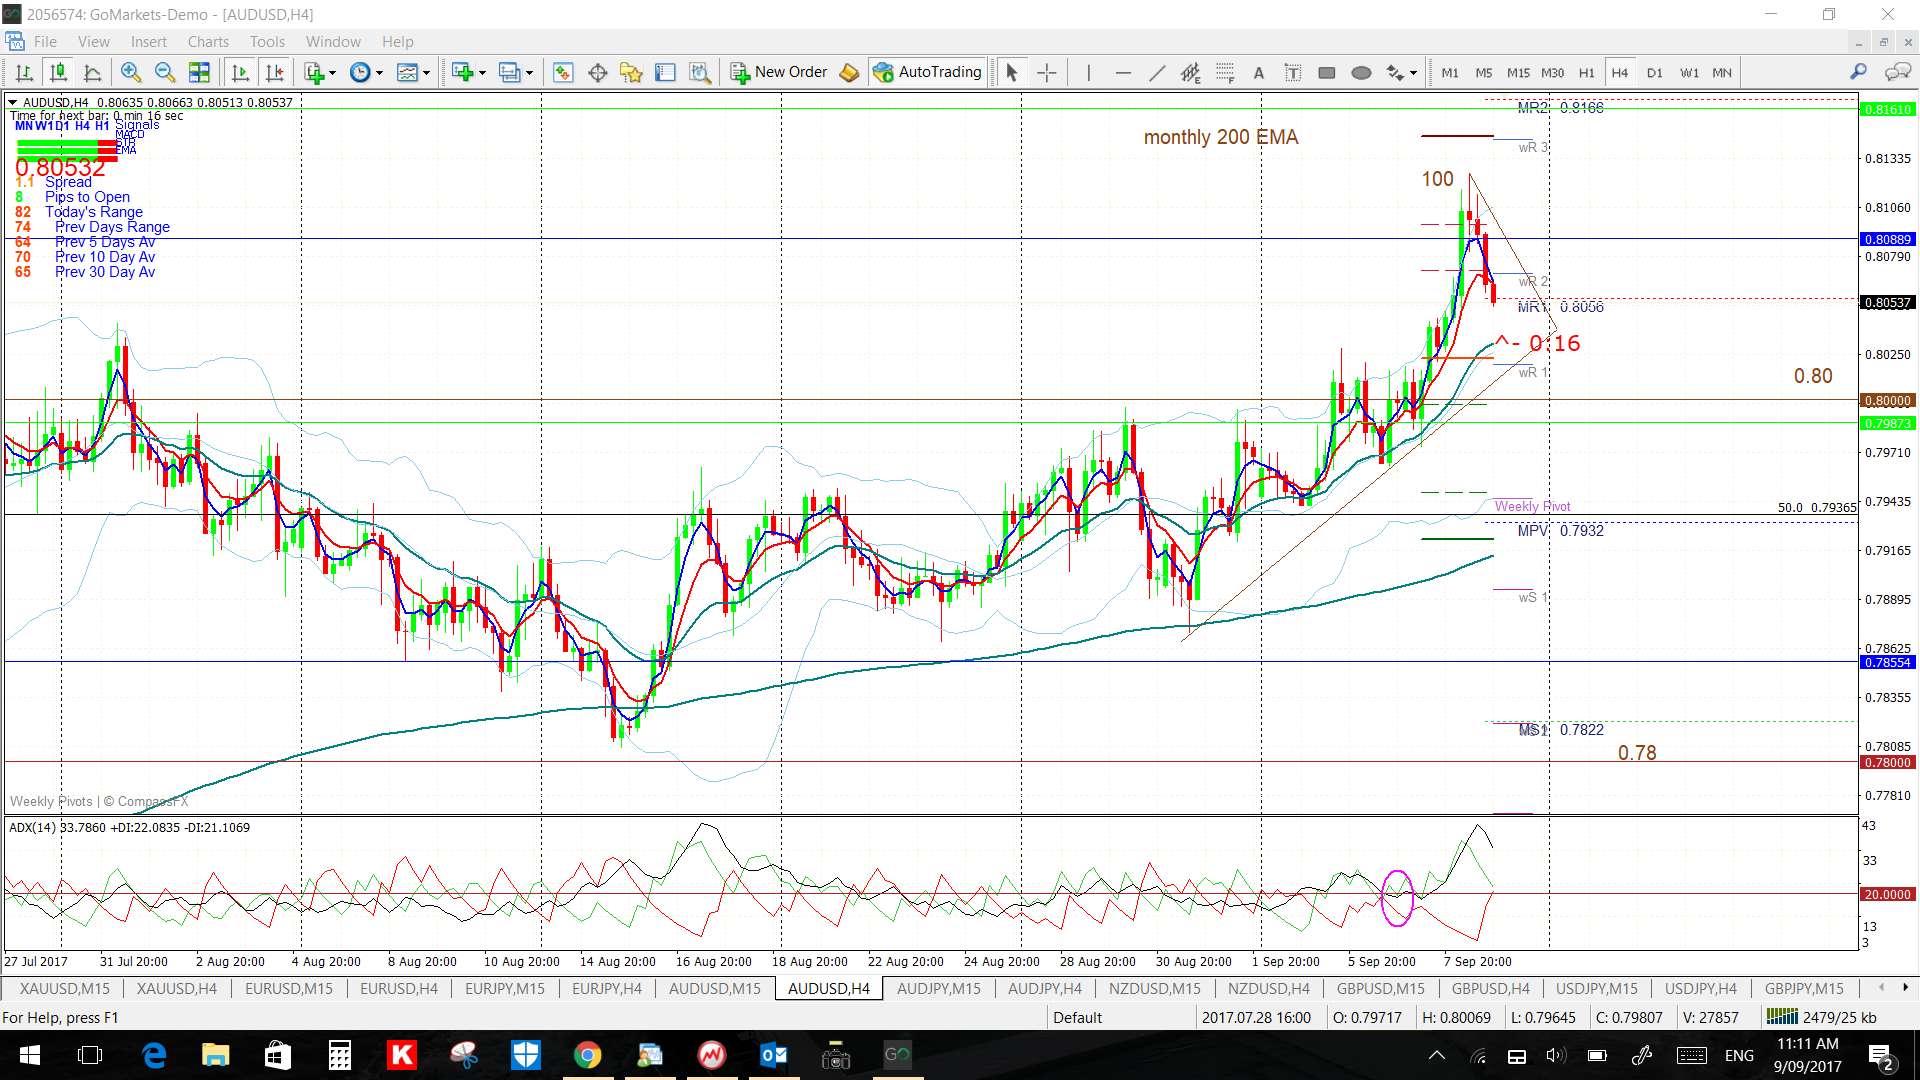
AUD/USD: and yet another TC Optimal signal for 5R with the move above the trend line and 0.80 resistance:
GBP/USD: this TC signal for 6R followed on from an earlier one in the week that was a Optimal TC signal:
Forex Analysis:
Gold: Watch the revised 4hr chart’s triangle trend lines, and also the $1,380 level, for any new breakout.
Keep an eye out for any continued move up to the weekly 61.8% fib near $1,600:
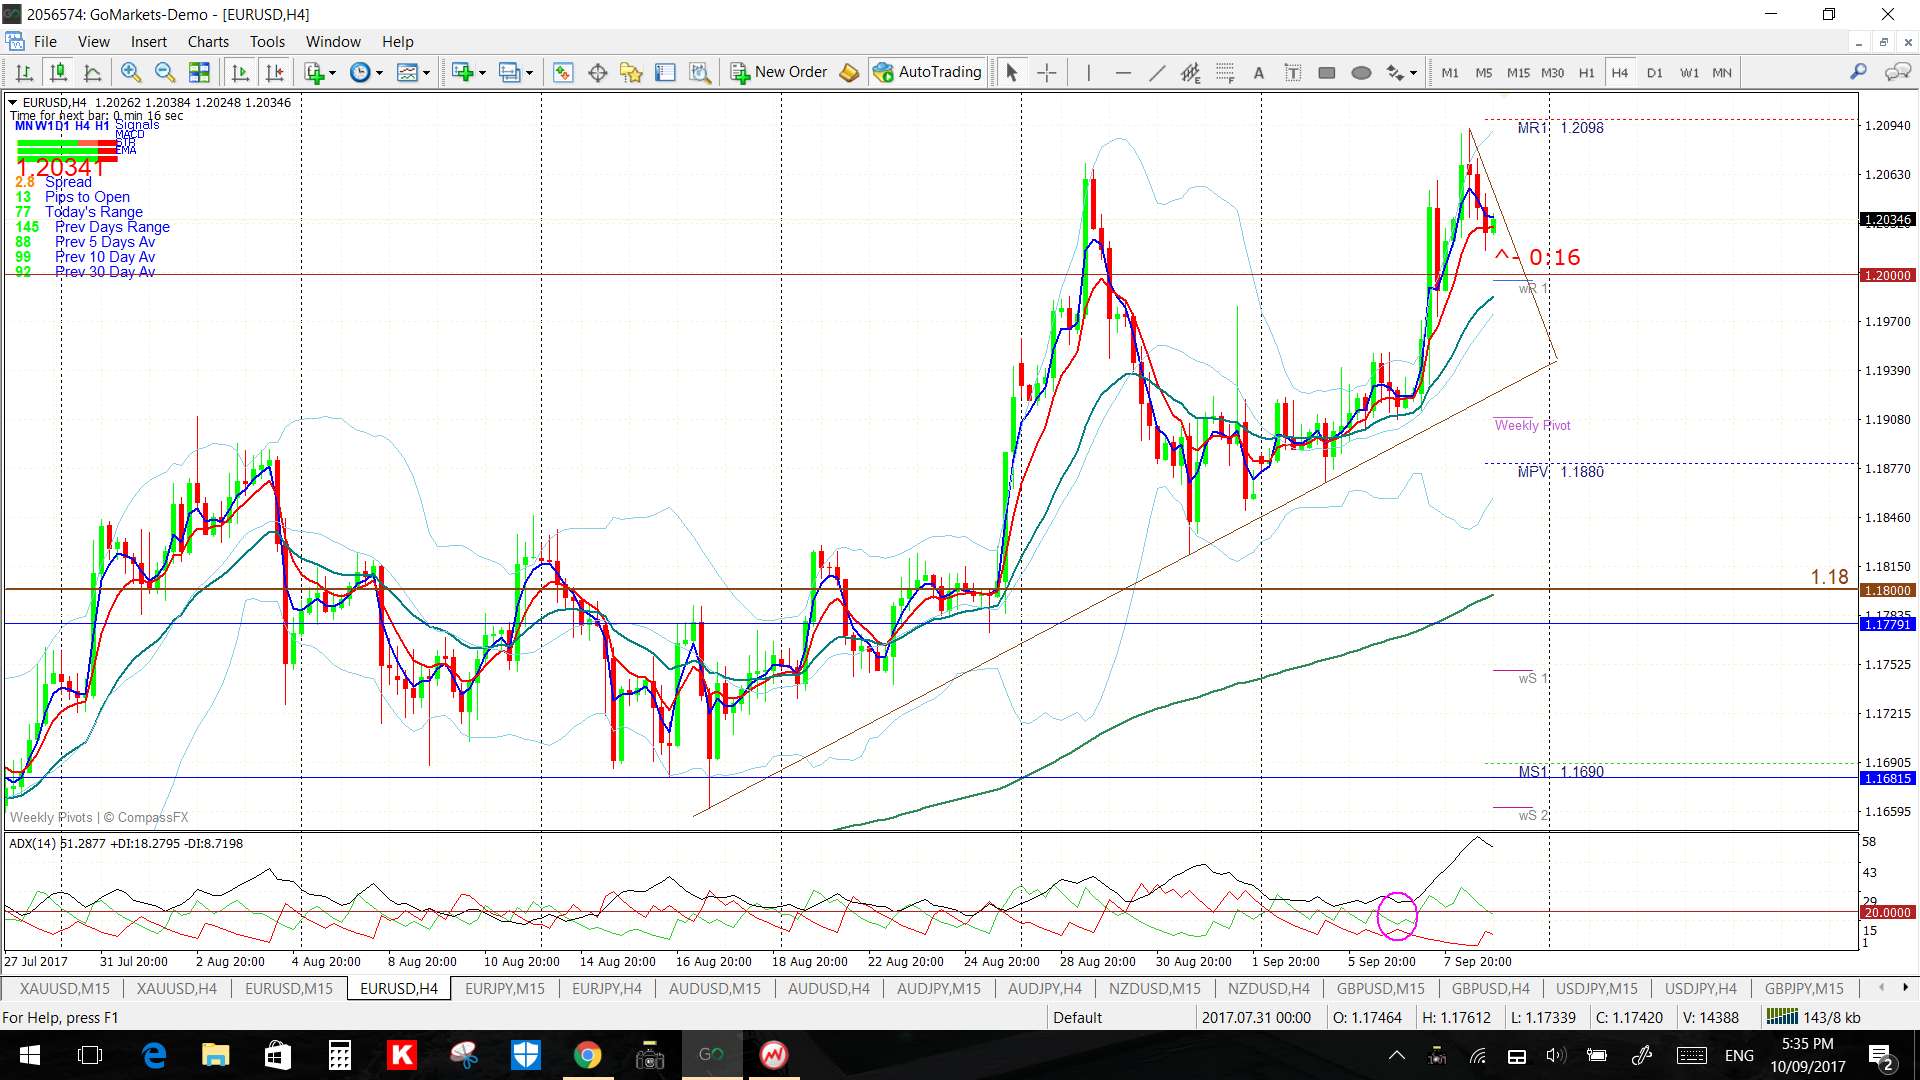
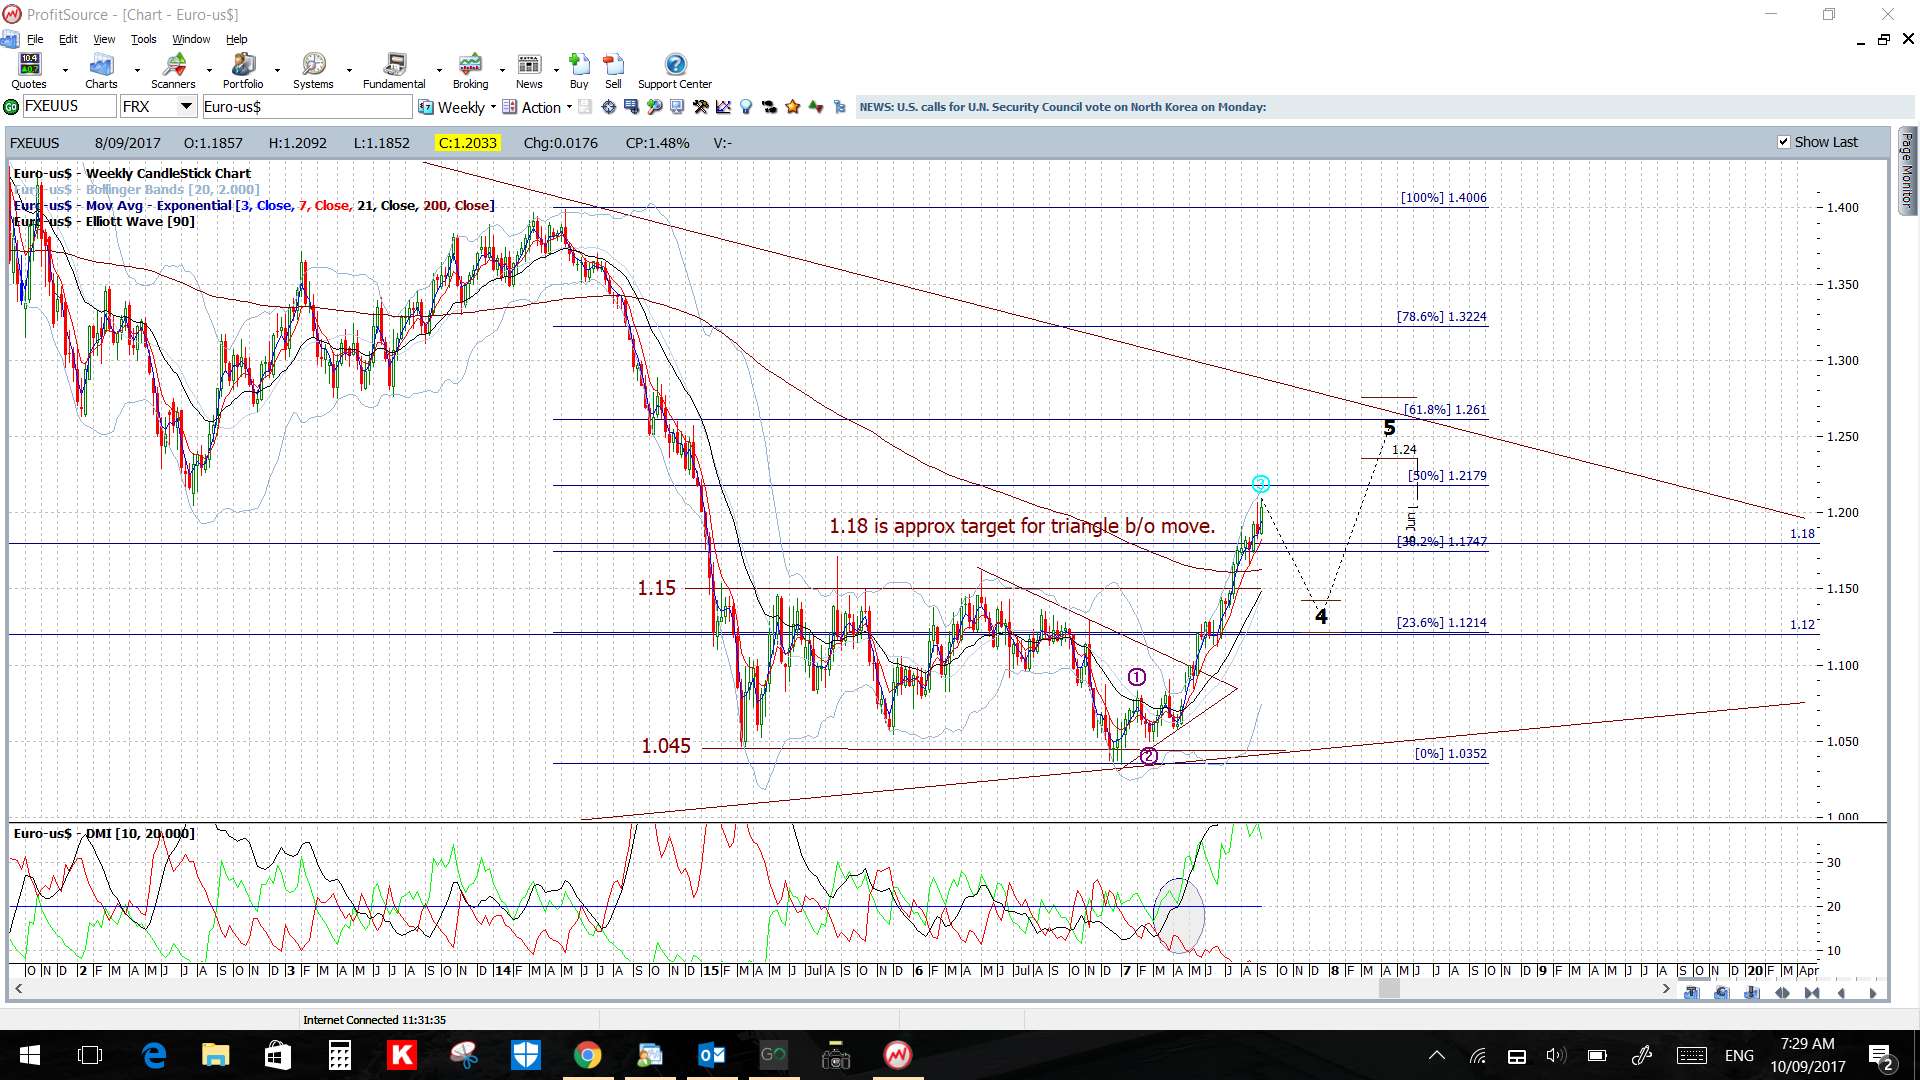
EUR/USD: Watch the revised 4hr chart’s triangle trend lines, and also the 1.20 level, for any new breakout.
Any hold above 1.20 would bring the 1.25 level, near the weekly chart’s 61.8% fib, into focus:
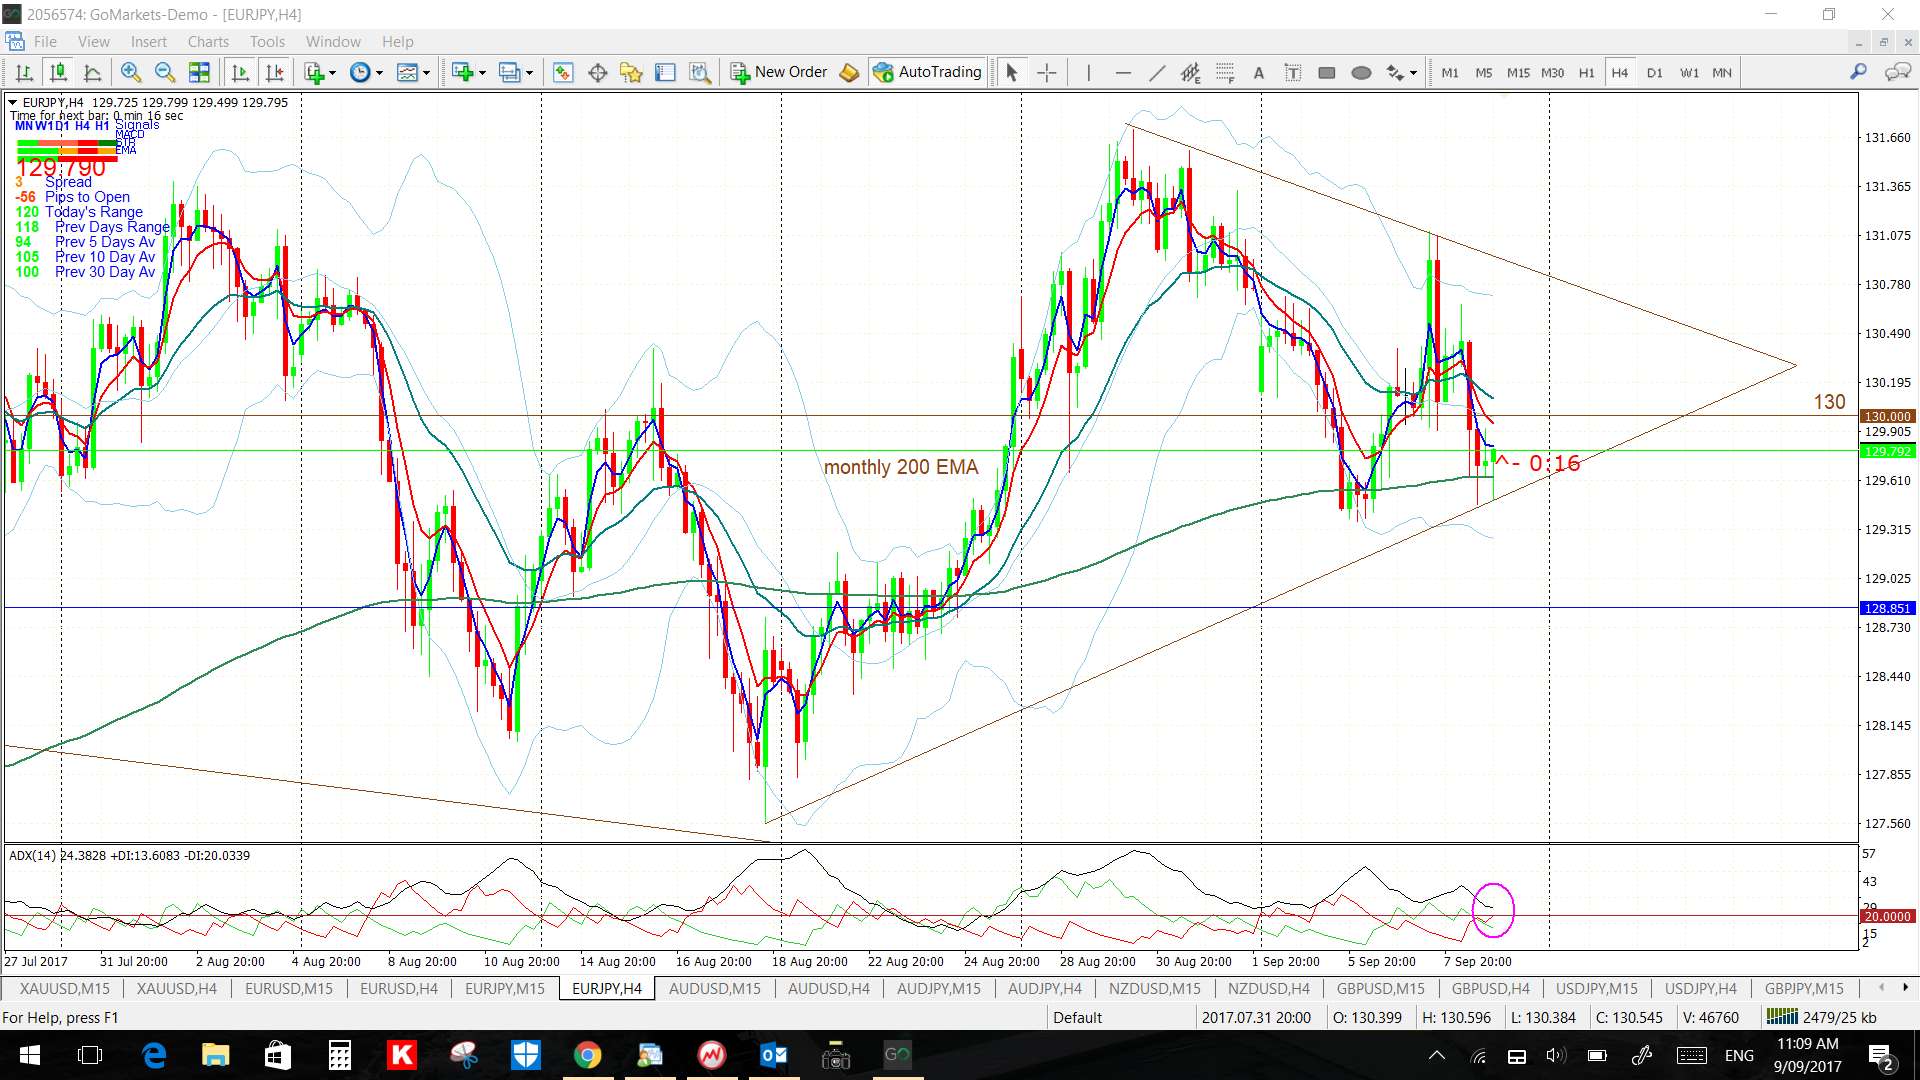
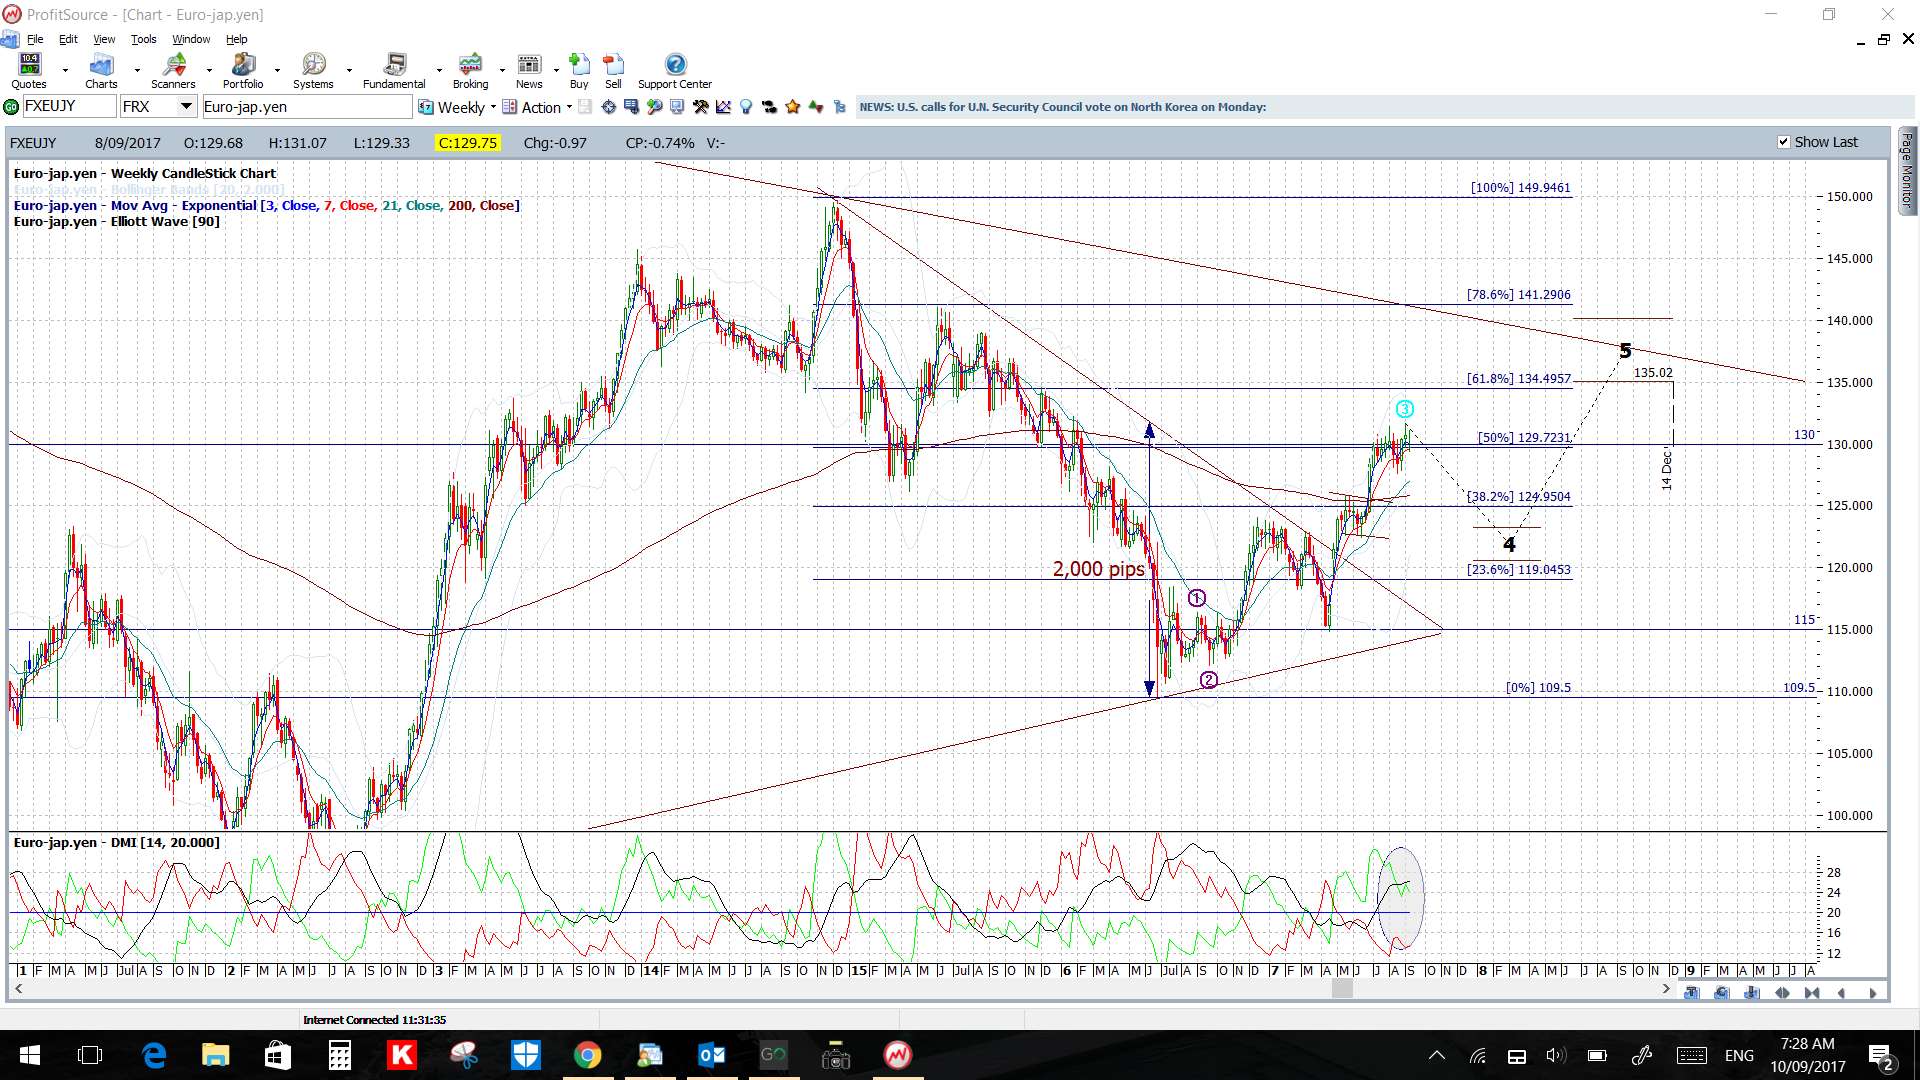
EUR/JPY: Watch the 4hr chart’s triangle trend lines, and also the 130 level, for any new breakout:
AUD/USD: Watch the revised 4hr chart’s triangle trend lines, and also the 0.80 level, for any new breakout. There was upbeat CNY CPI and PPI data releases on Saturday so watch for any impact here at market open.
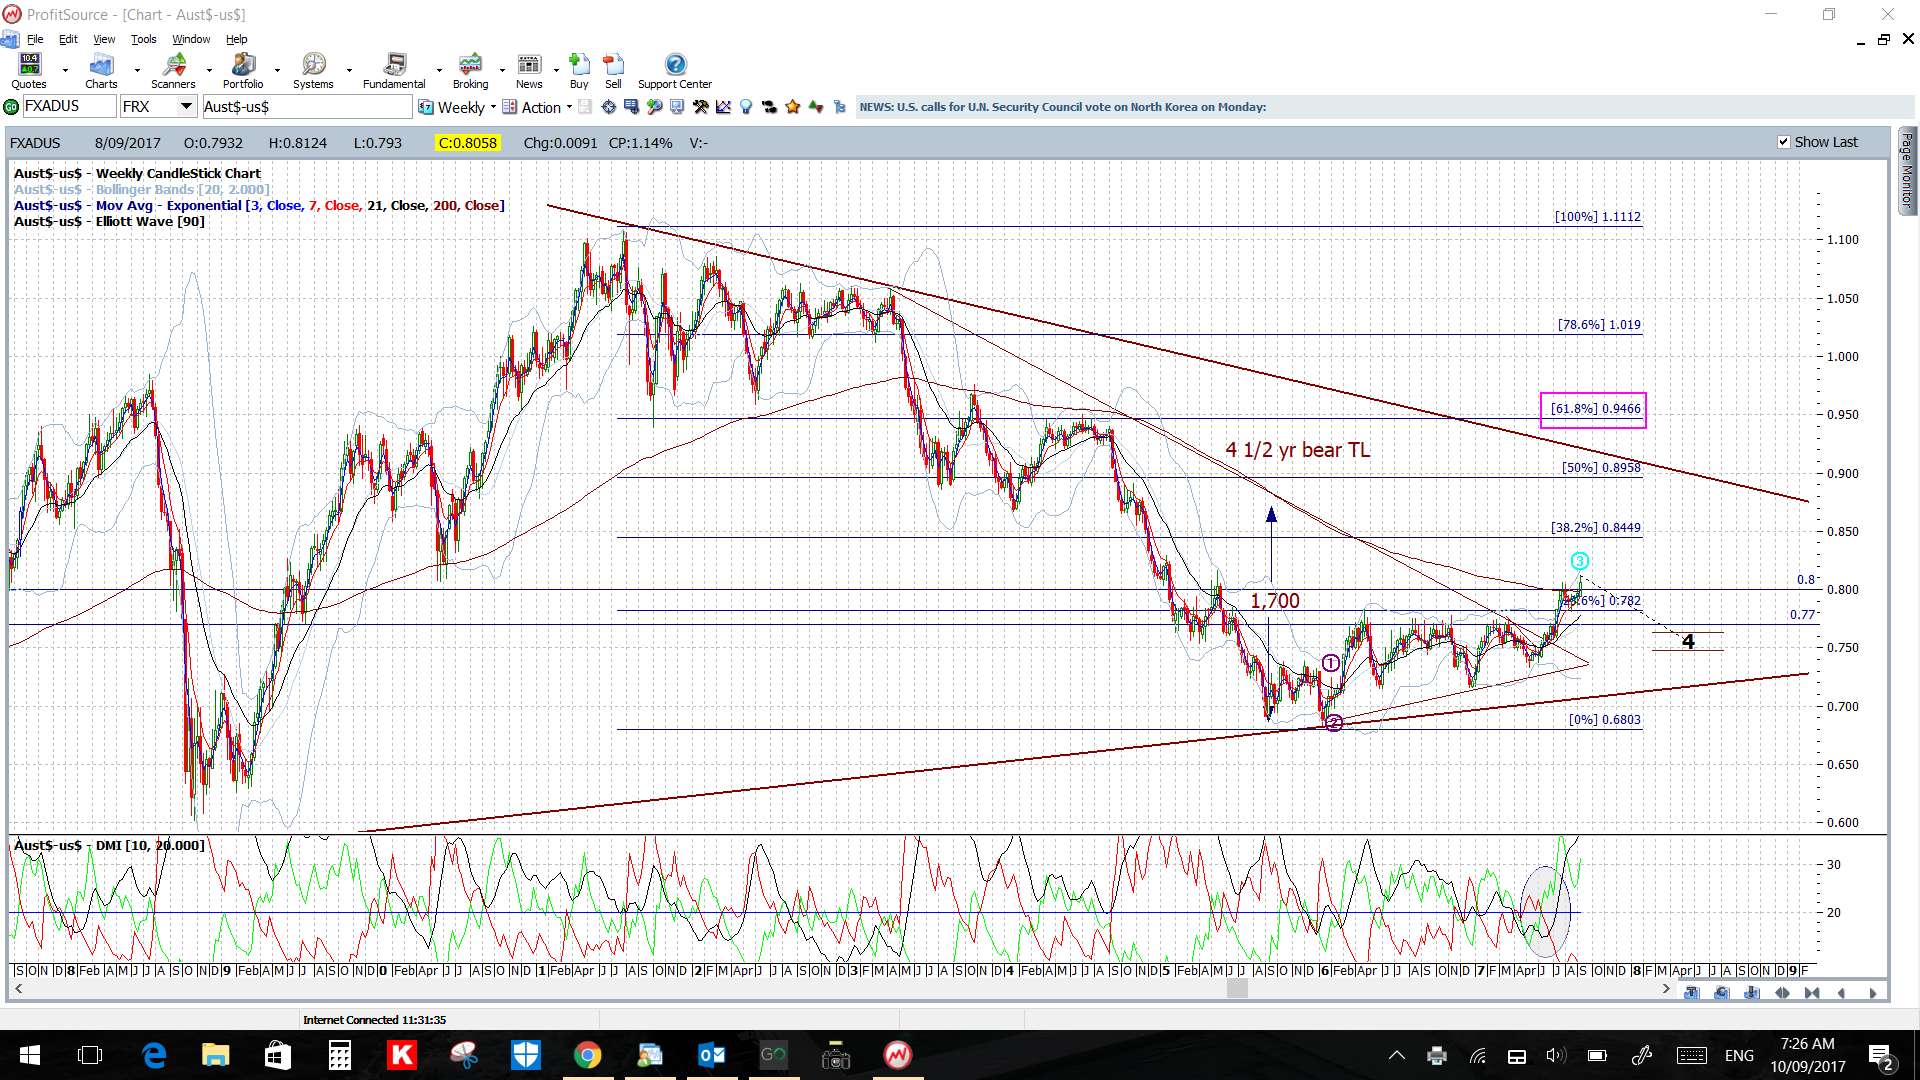
The continued hold above 0.80 is bringing the weekly chart’s 50% fib, near the 0.90 level and the major bear trend line, into focus:

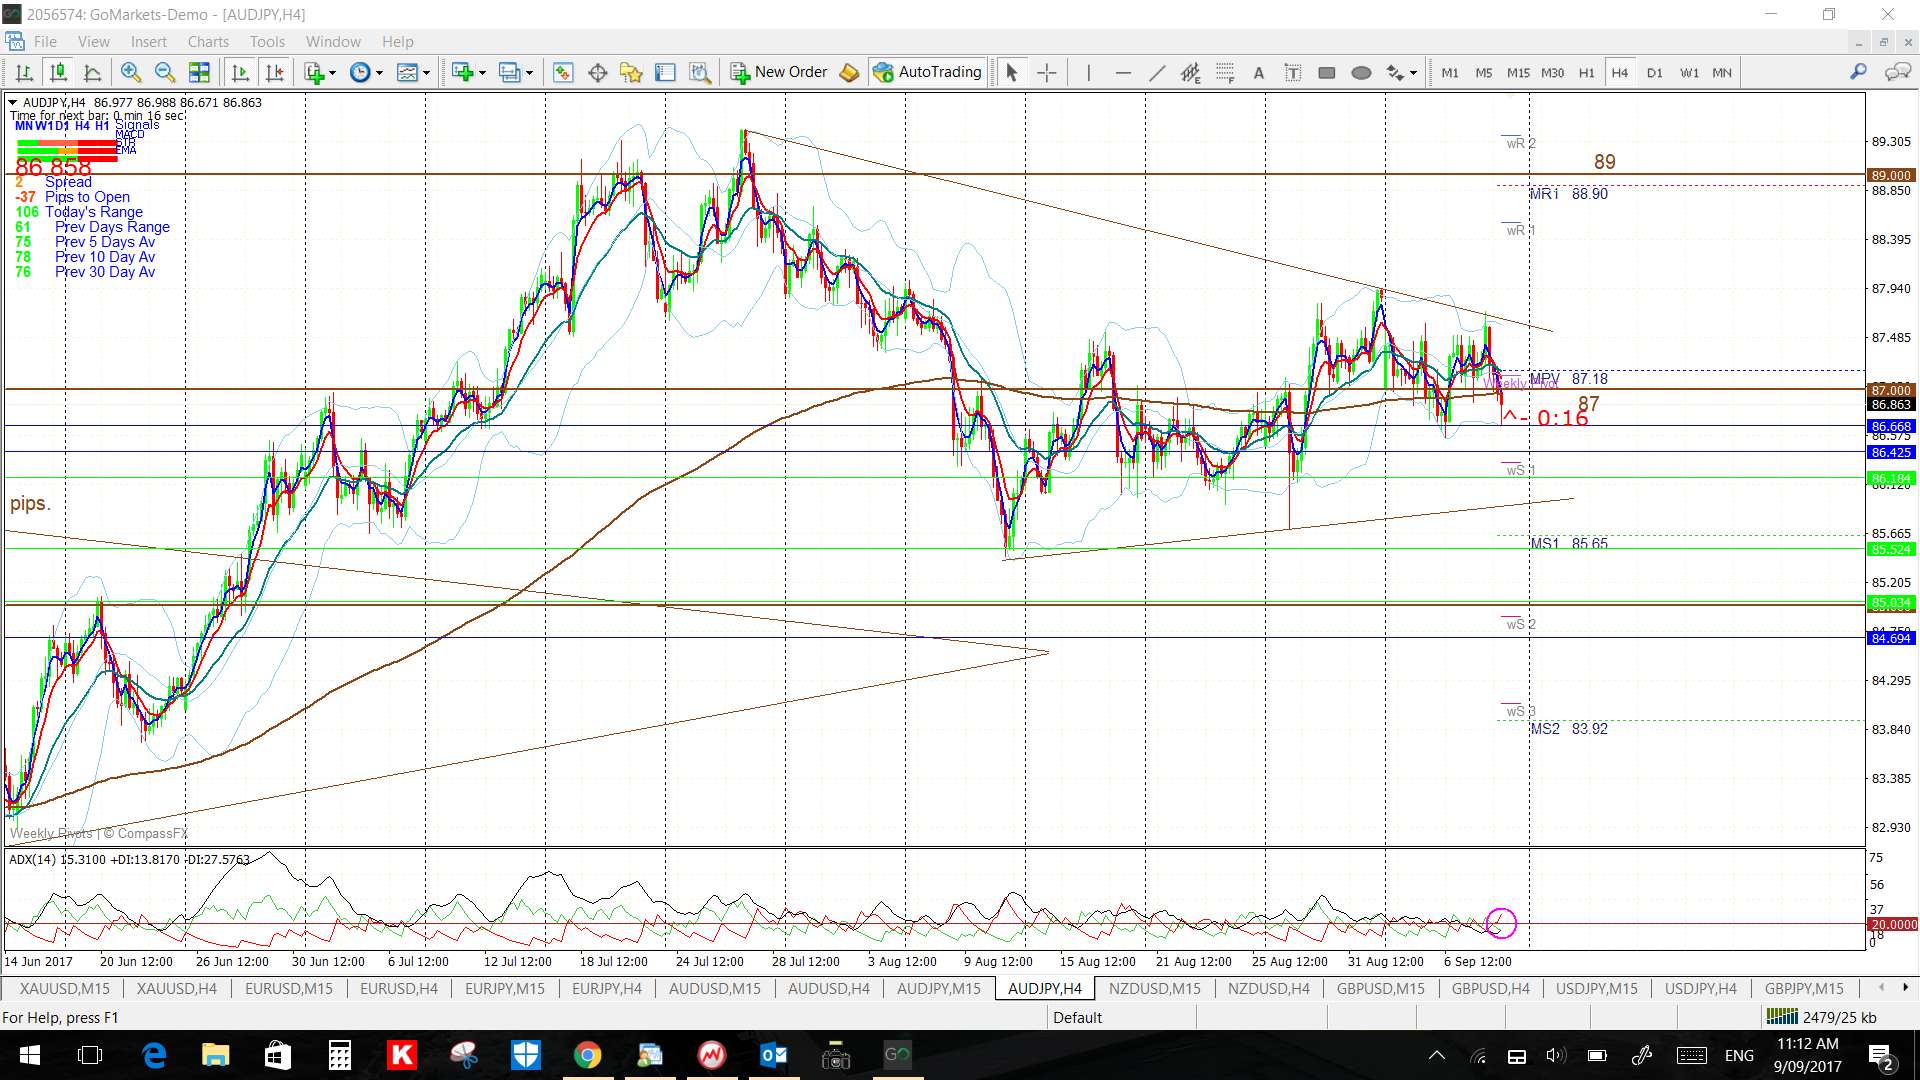
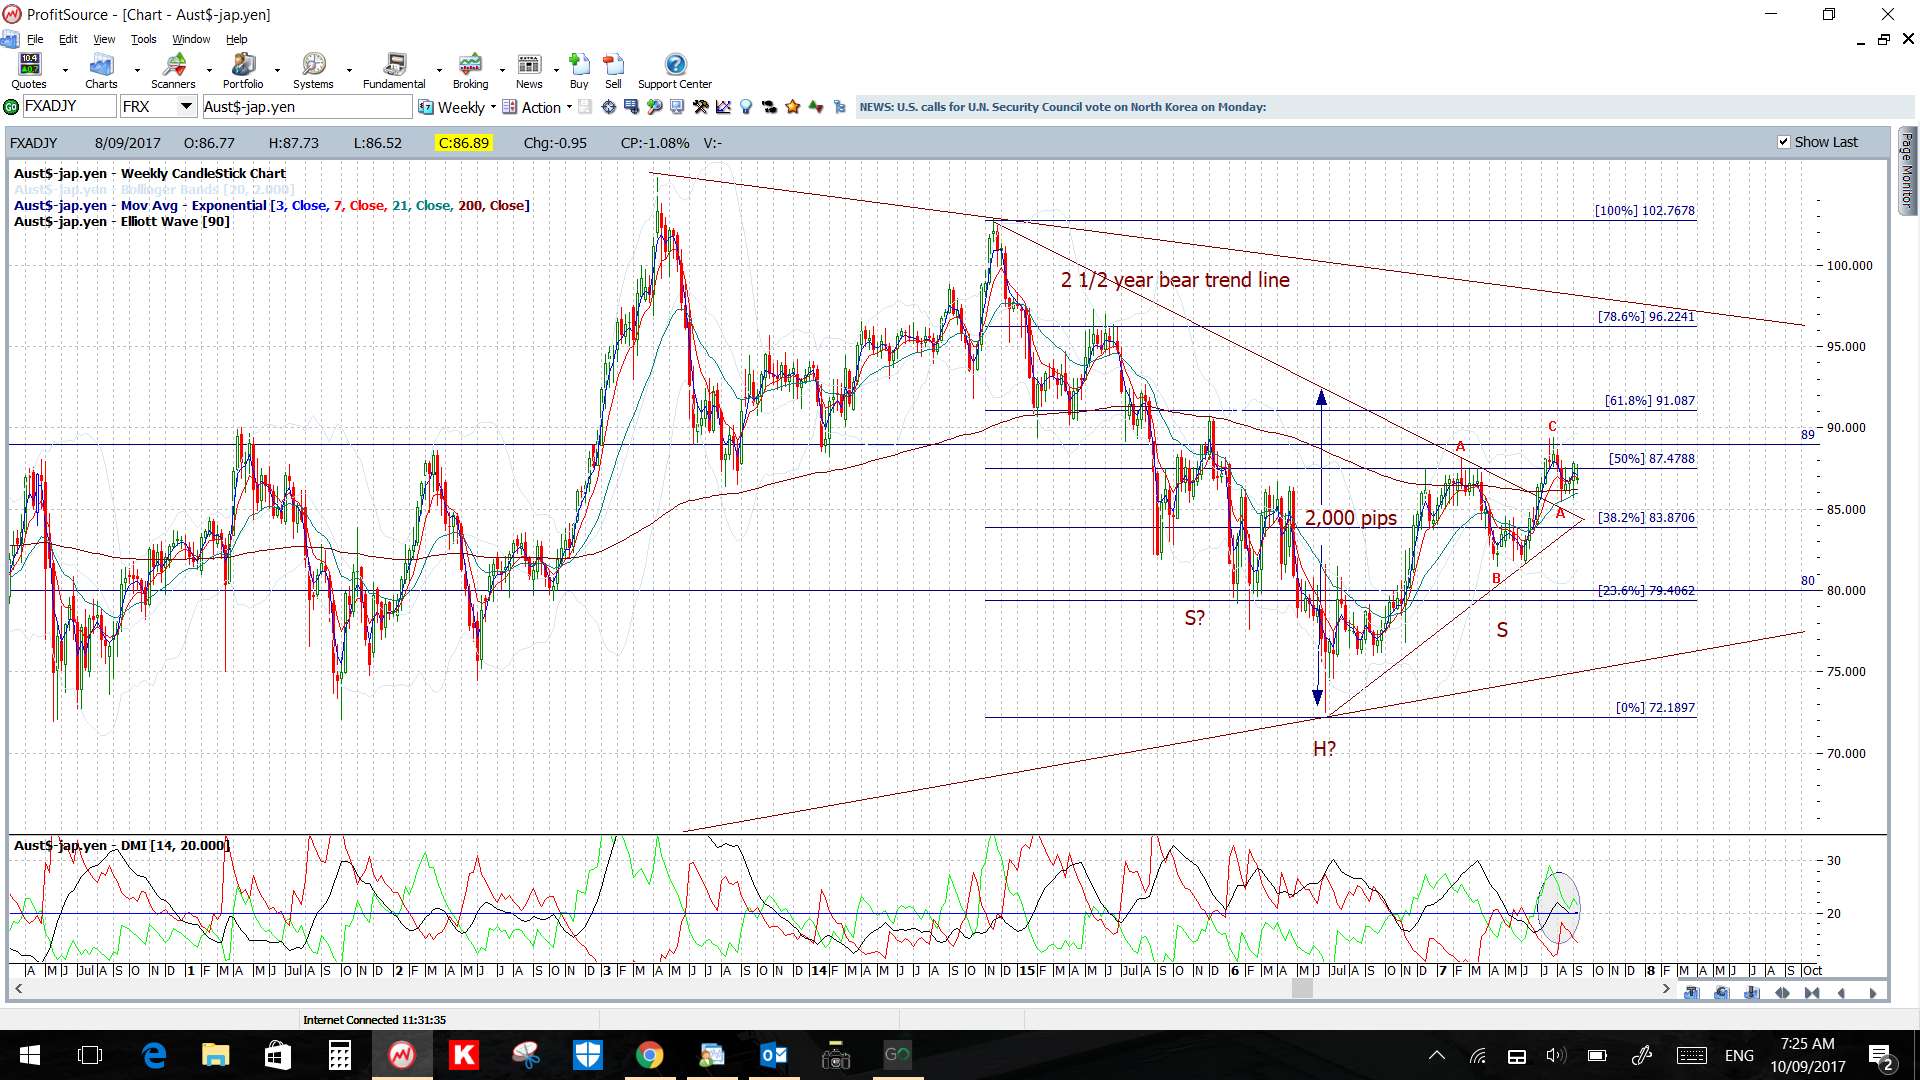
AUD/JPY: Watch the 4hr chart’s triangle trend lines, and then 89 level, for any new breakout.
There was upbeat CNY CPI and PPI data releases on Saturday so watch for any impact here at market open:
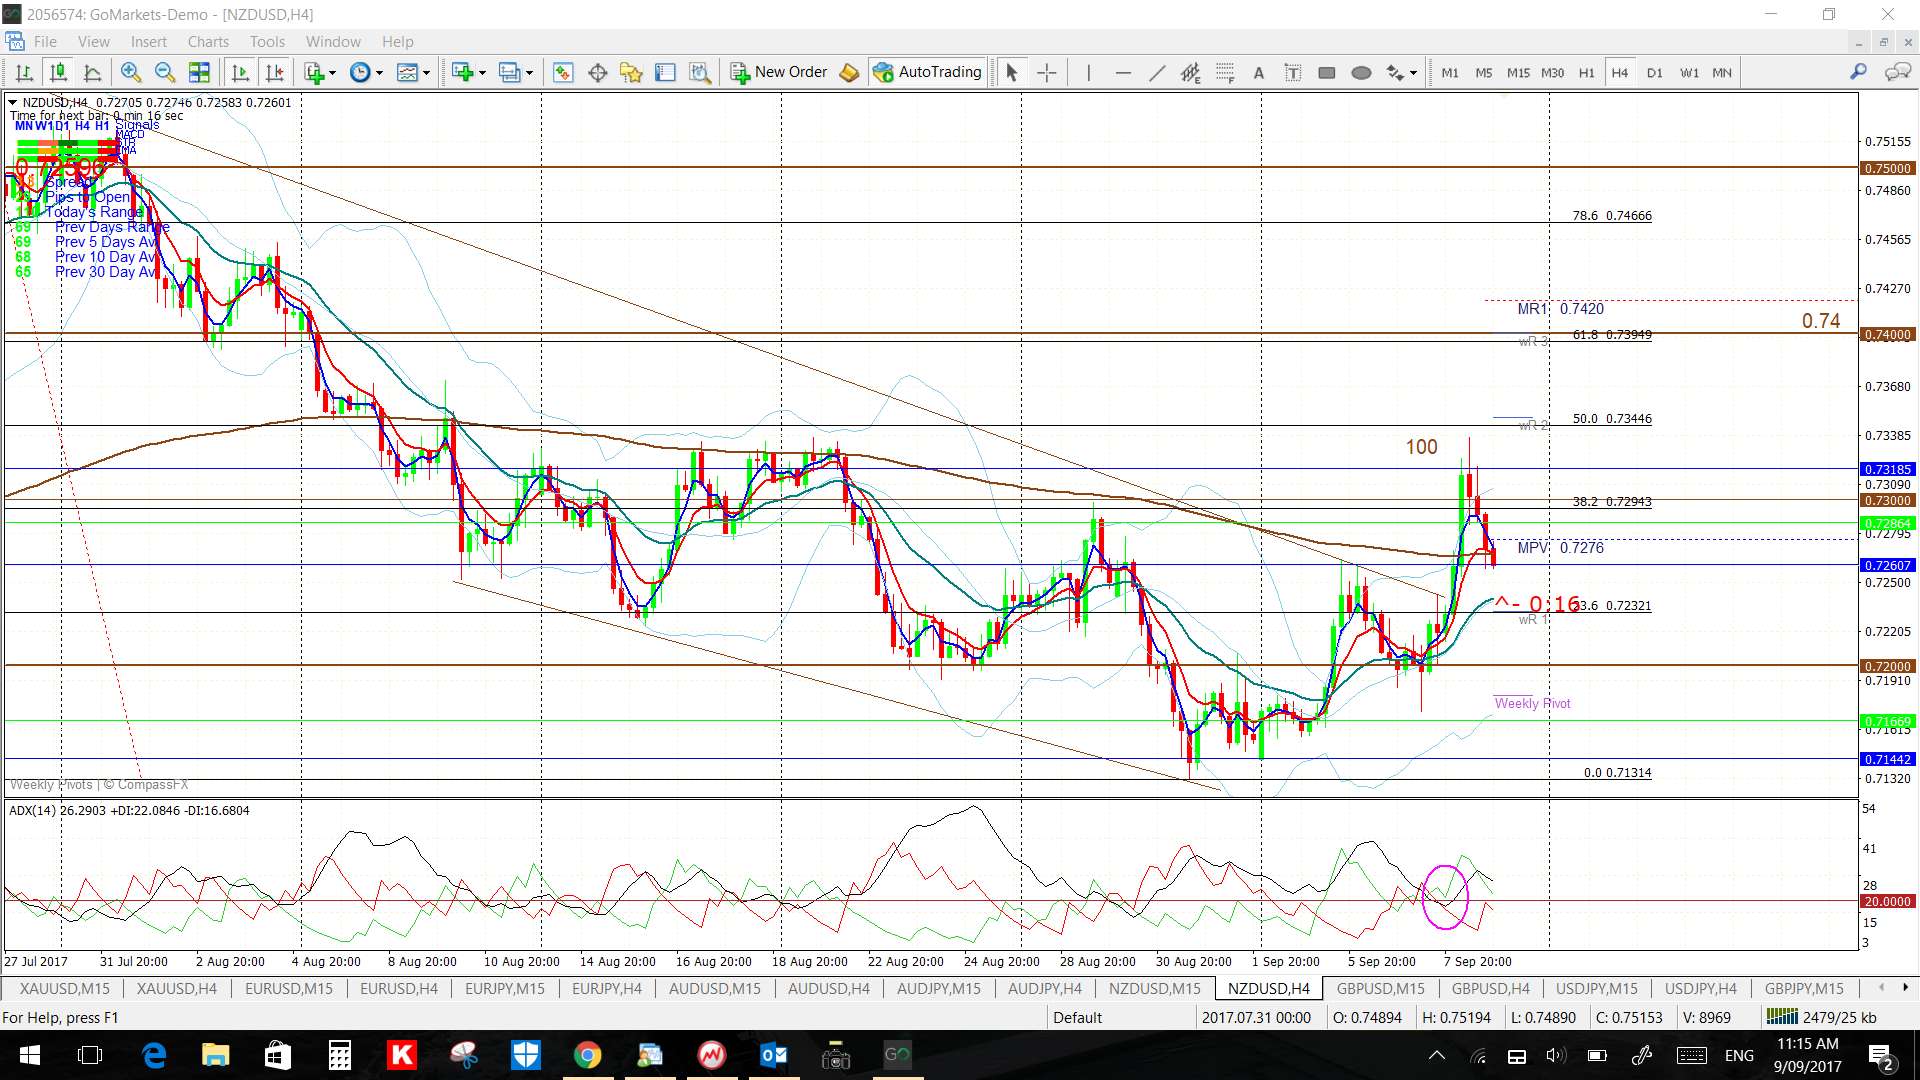
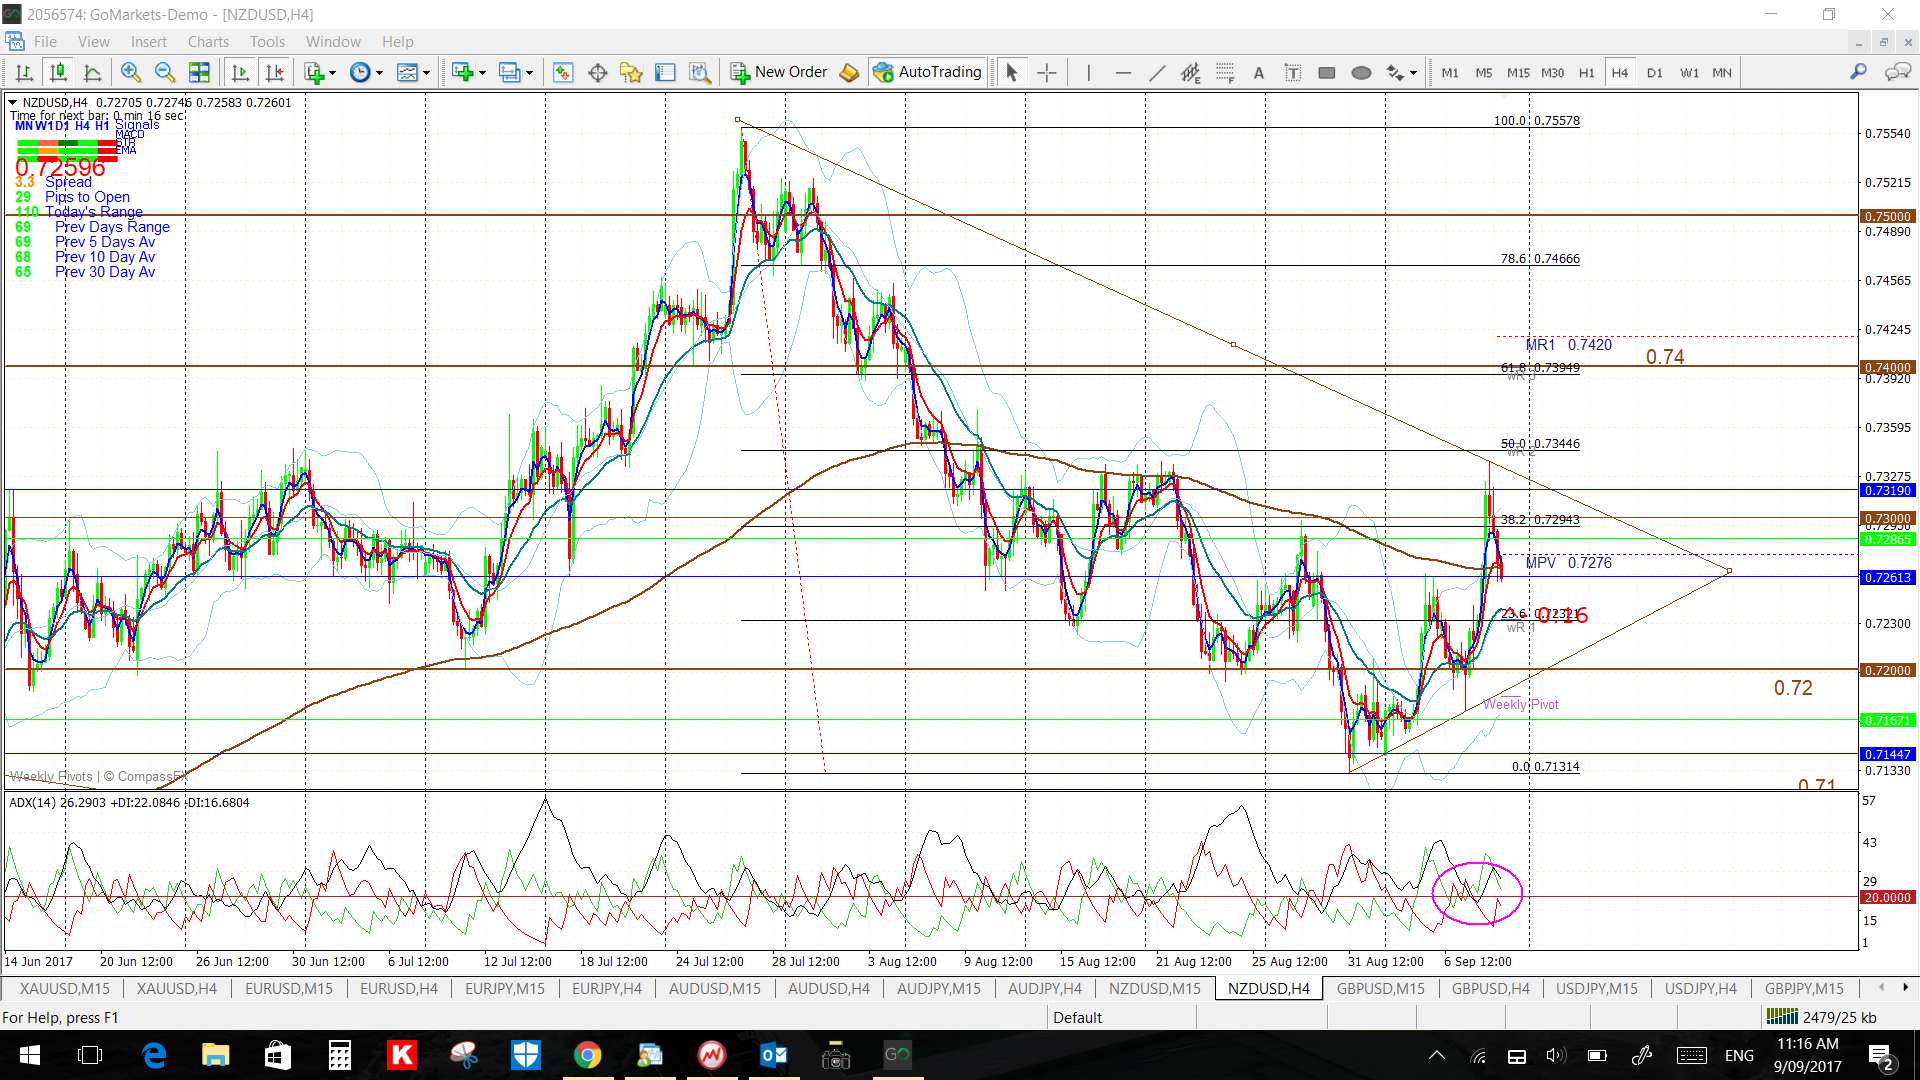
NZD/USD: Watch the revised 4hr chart’s triangle trend lines, and also the 0.73 level, for any new breakout.
There was upbeat CNY CPI and PPI data releases on Saturday so watch for any impact here at market open.
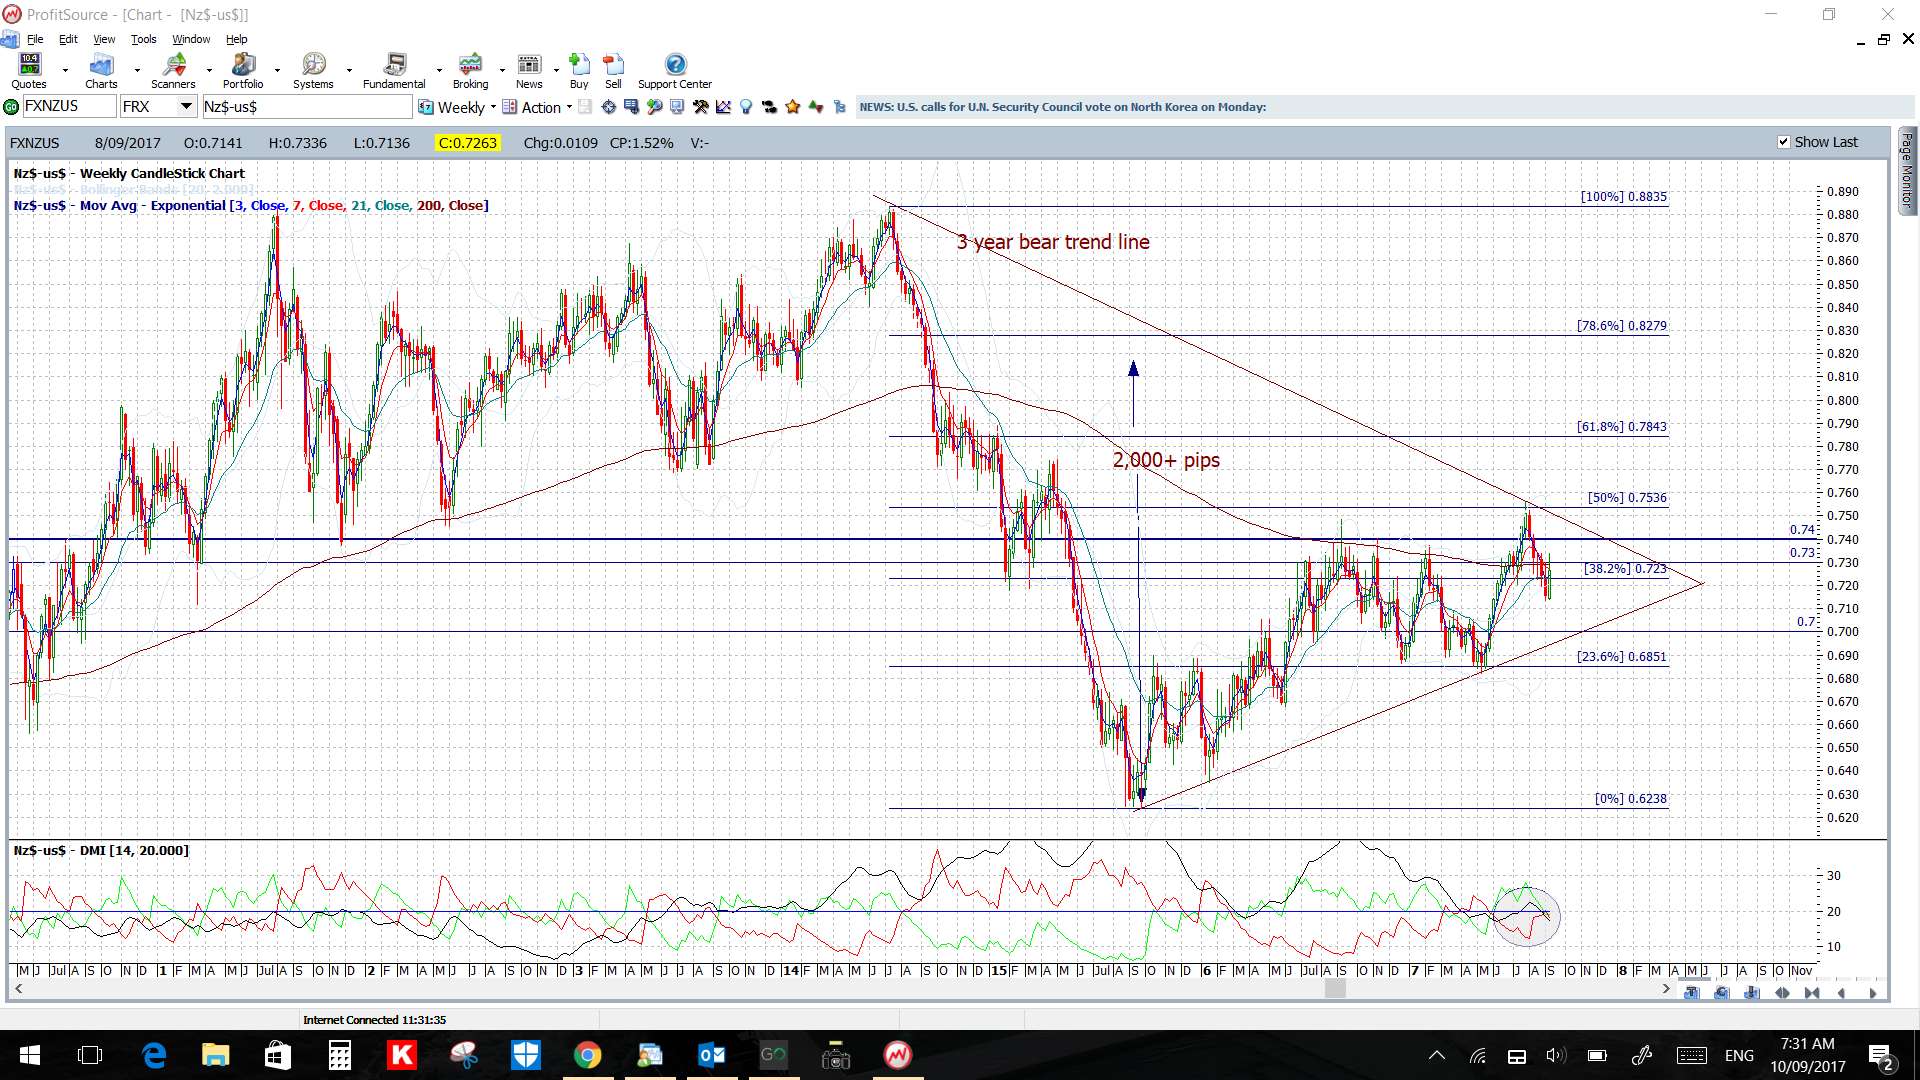
Note that I have revised the weekly triangle here following lack of follow-through momentum:
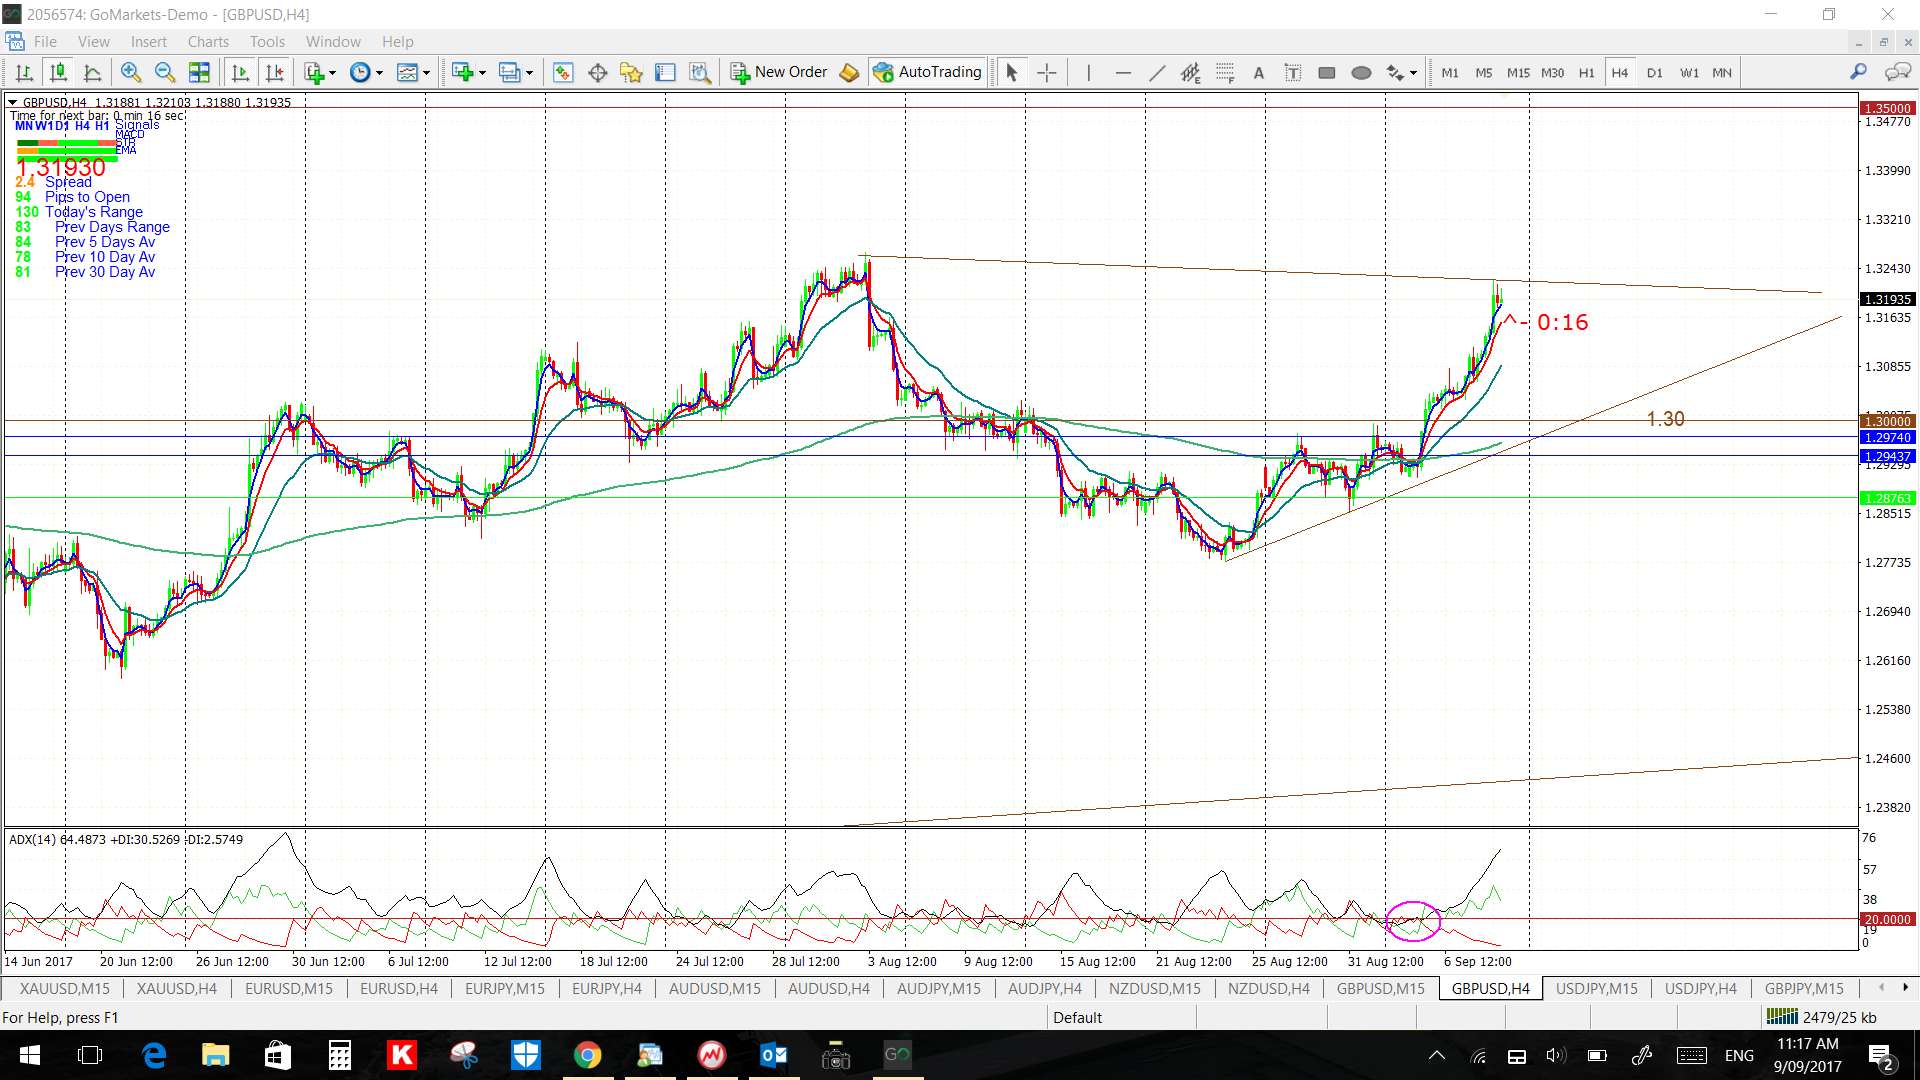
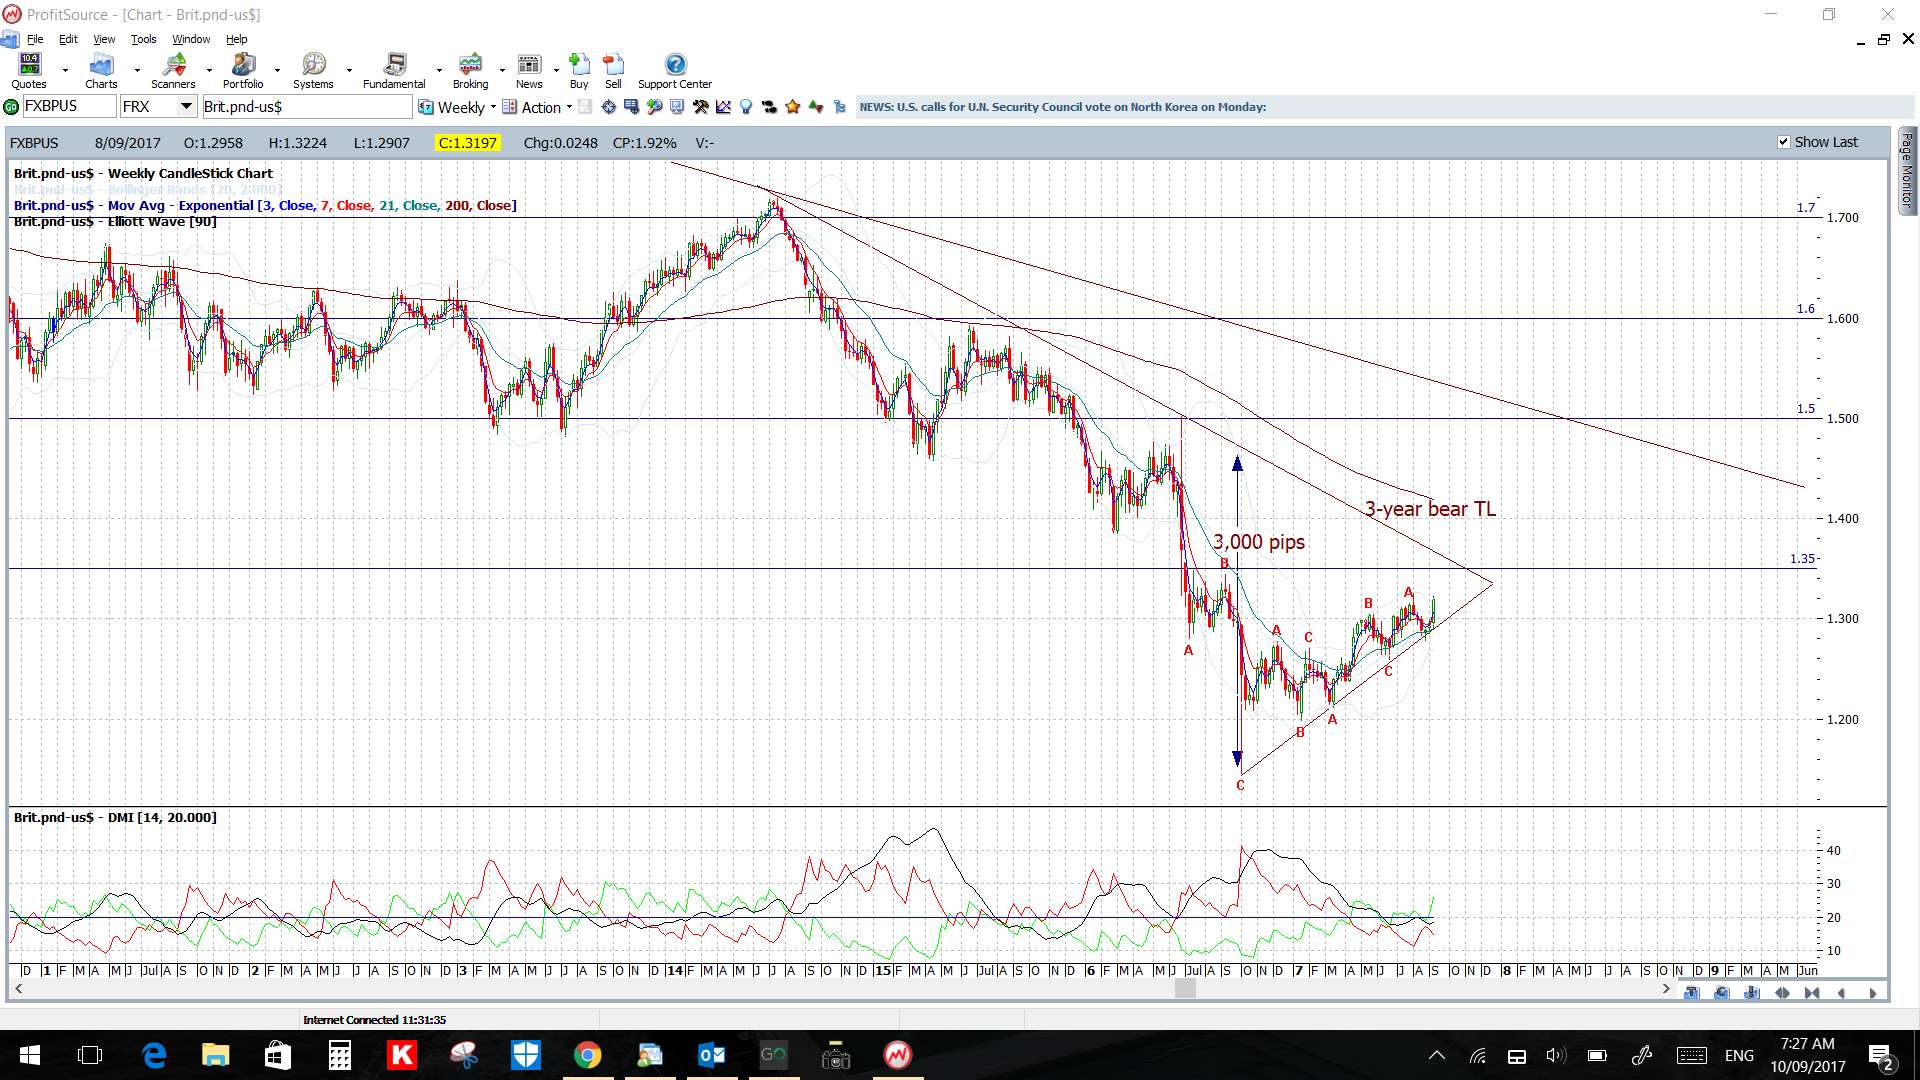
GBP/USD: What a great breakout move on this pair last week! Now watch the revised 4hr chart’s triangle trend lines for any new breakout, especially with all the GBP data this week: BoE rate update and Employment data.
I note that the key 1.35 level is about 280 pips above the 4hr chart triangle. The weekly chart also shows a major bear trend line just above this 1.35 region:

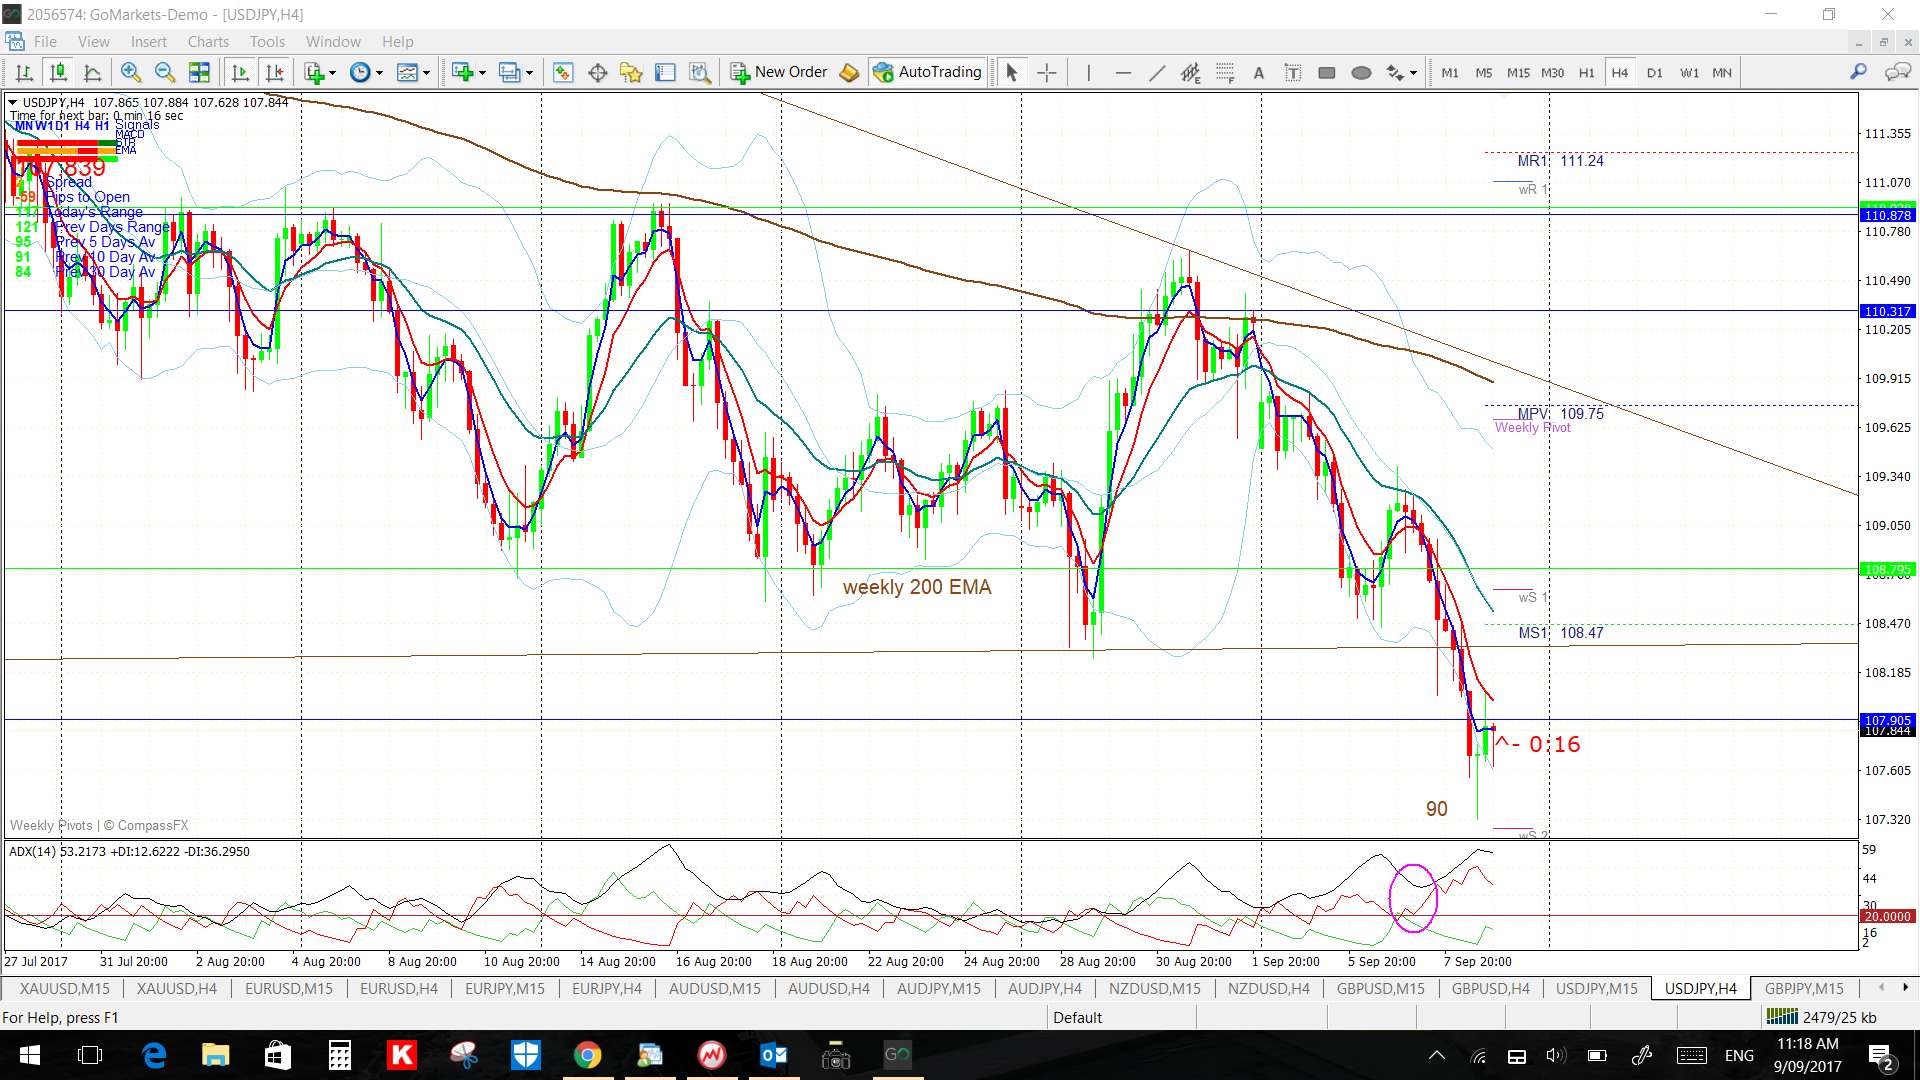
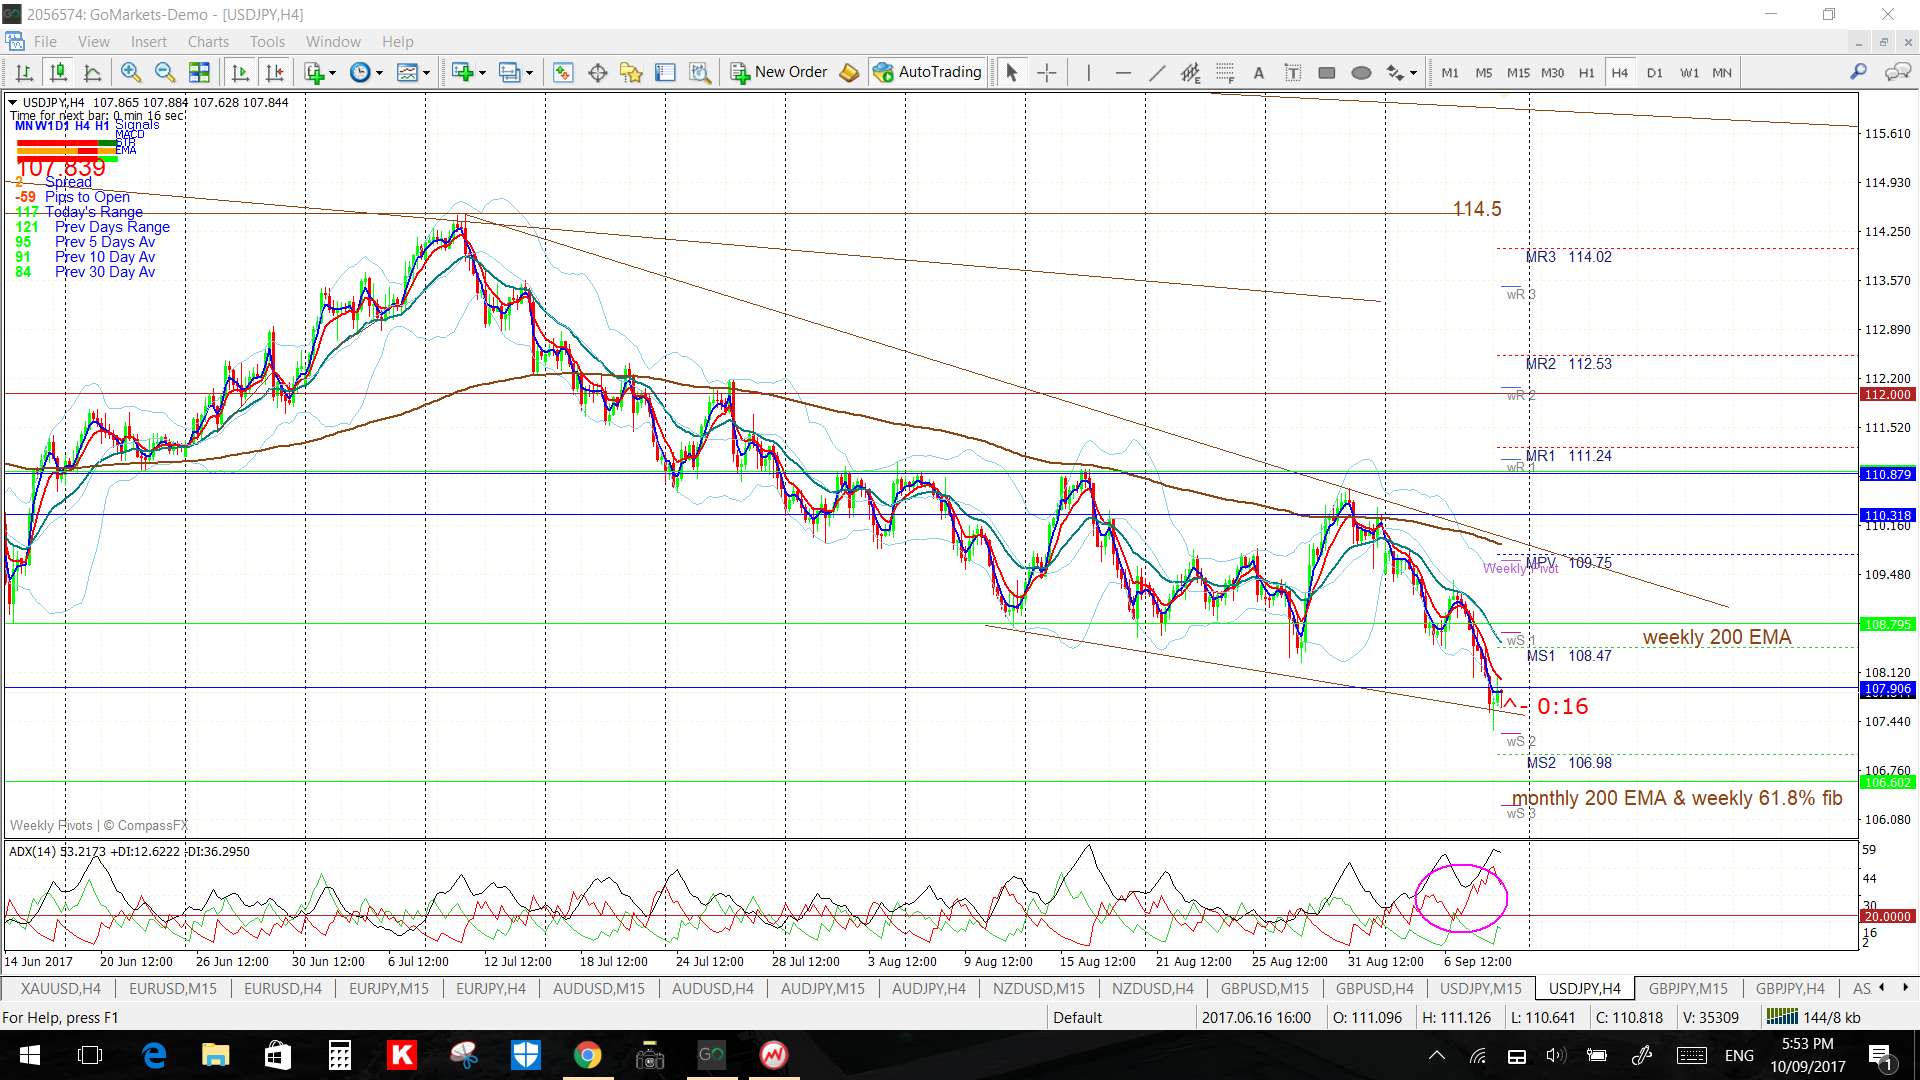
USD/JPY: Watch the revised 4hr chart’s wedge trend lines for any new breakout.
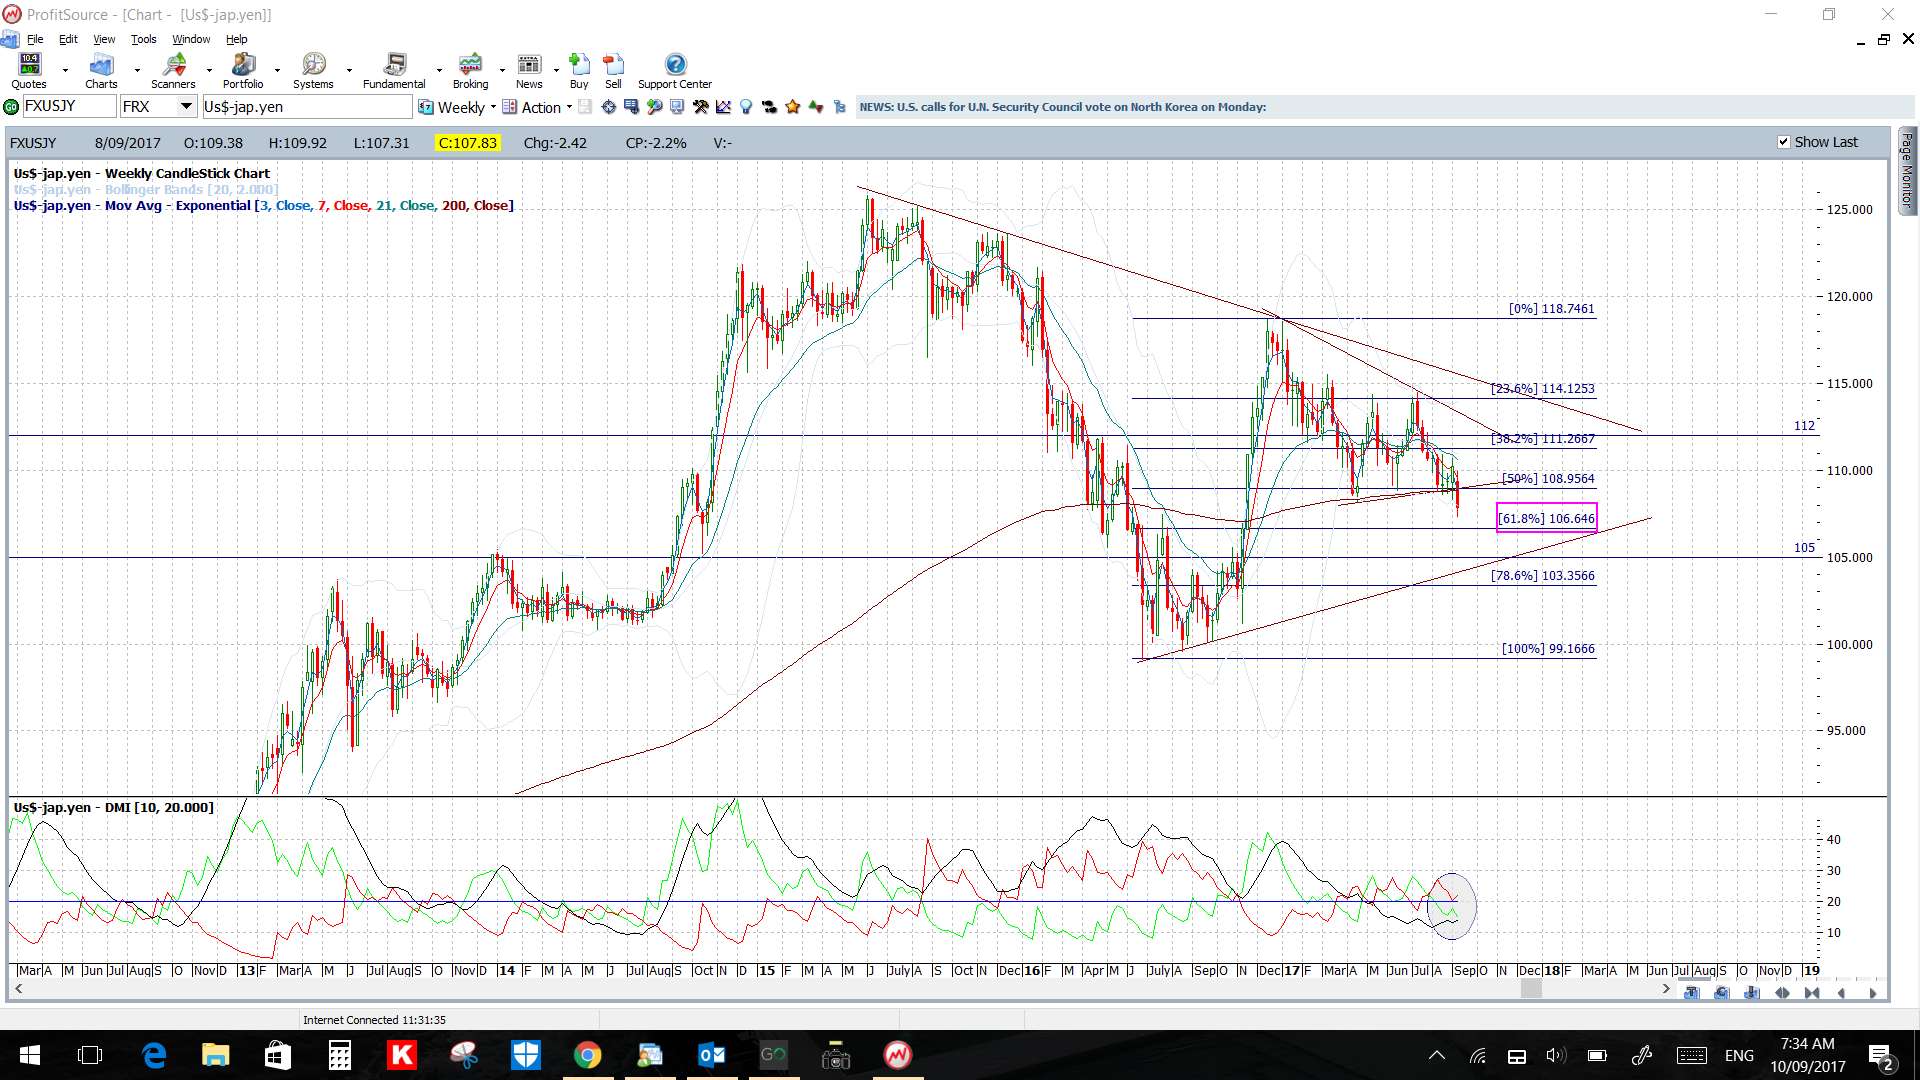
Note that the weekly chart’s 61.8% fib and the monthly 200 EMA are both down near 106.5 so watch for any reaction if price gets down that far:
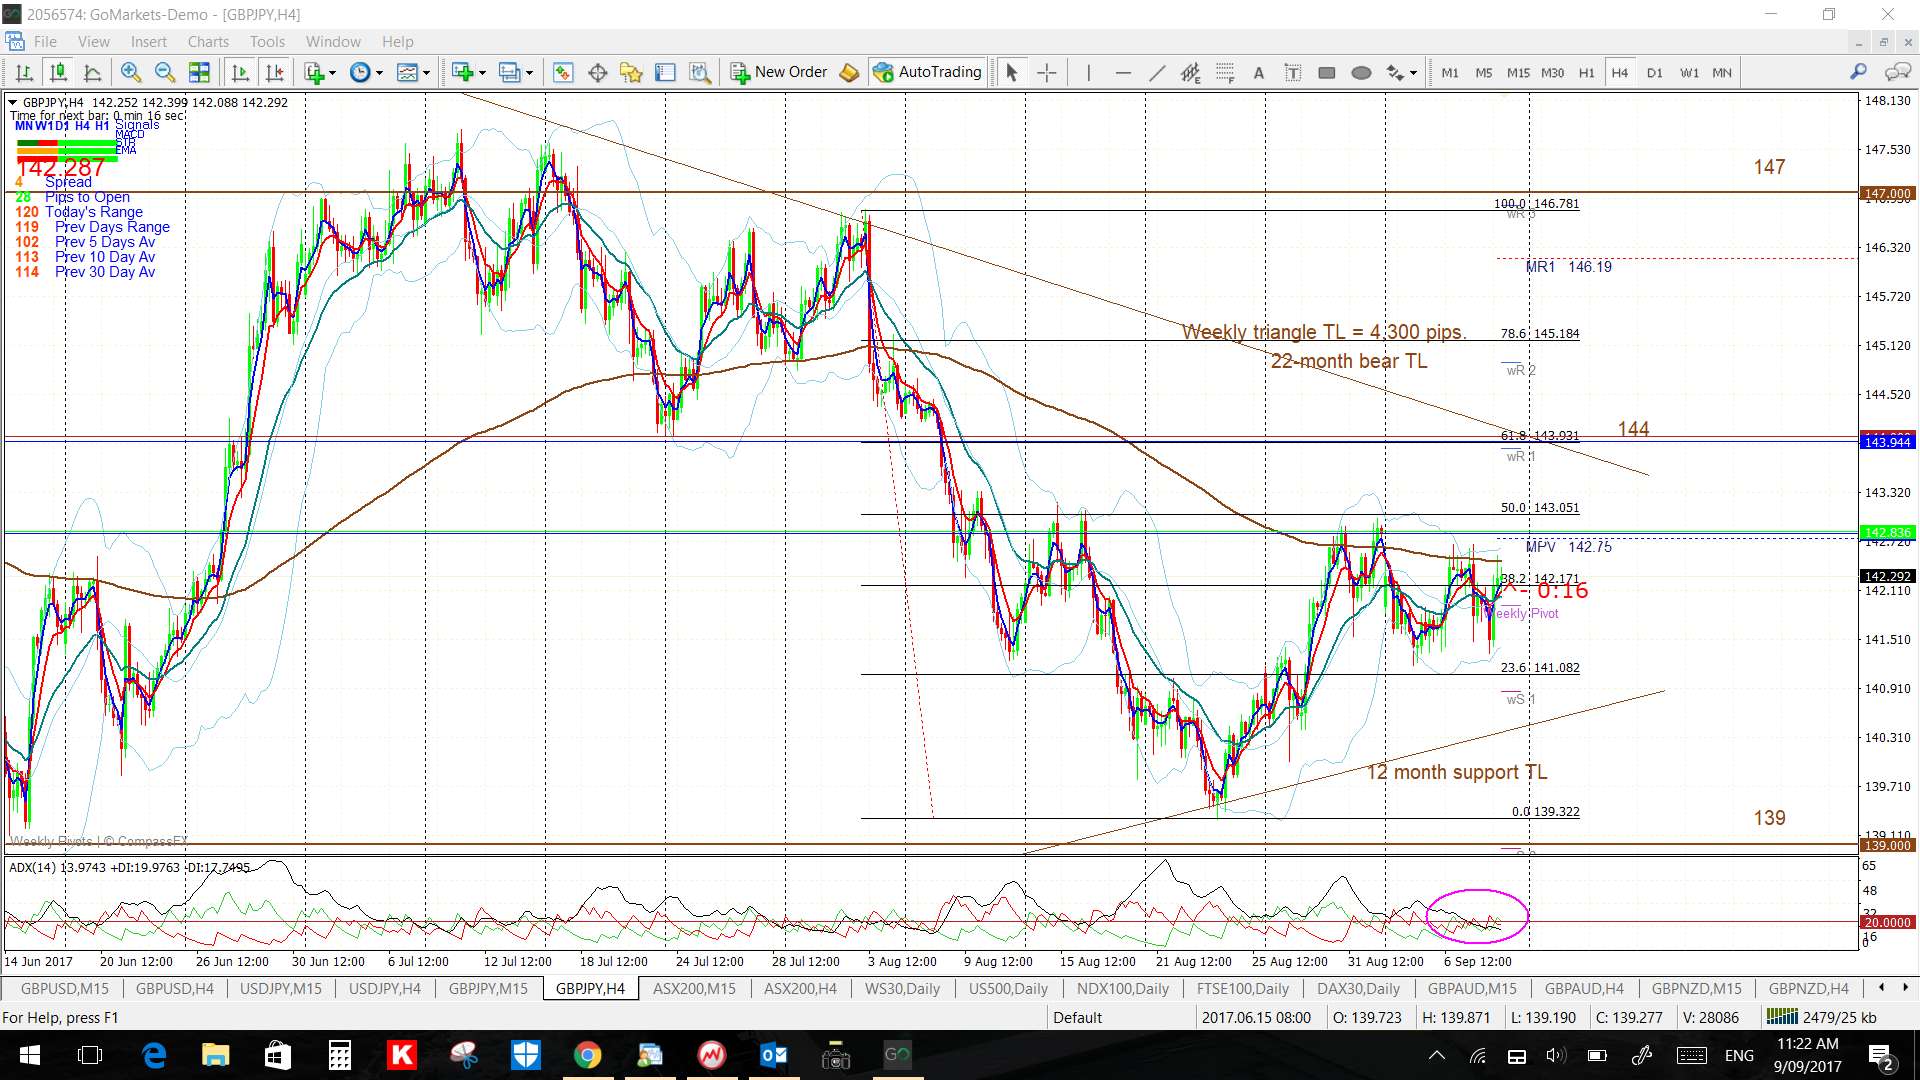
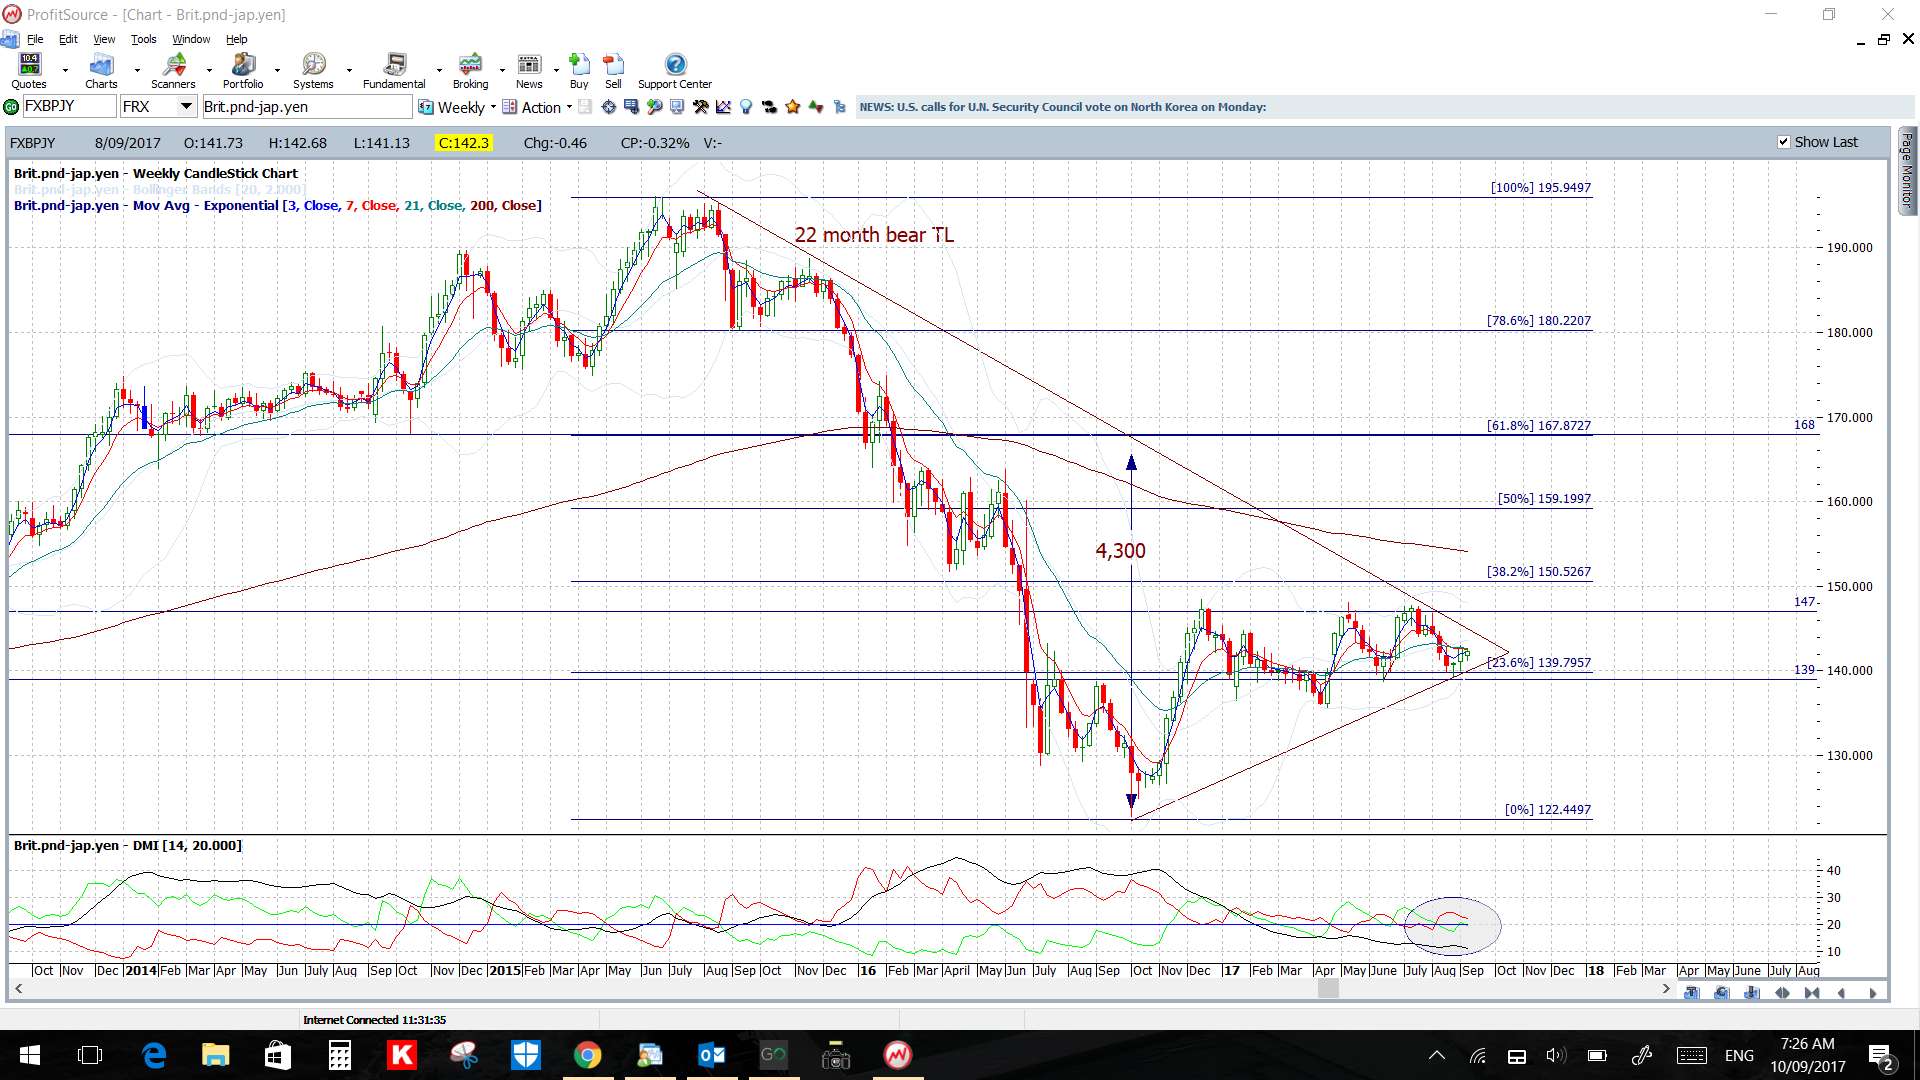
GBP/JPY: Watch the 4hr chart’s triangle trend lines for any new breakout:
GBP/AUD: Watch the 4hr chart’s wedge trend lines for any new breakout:


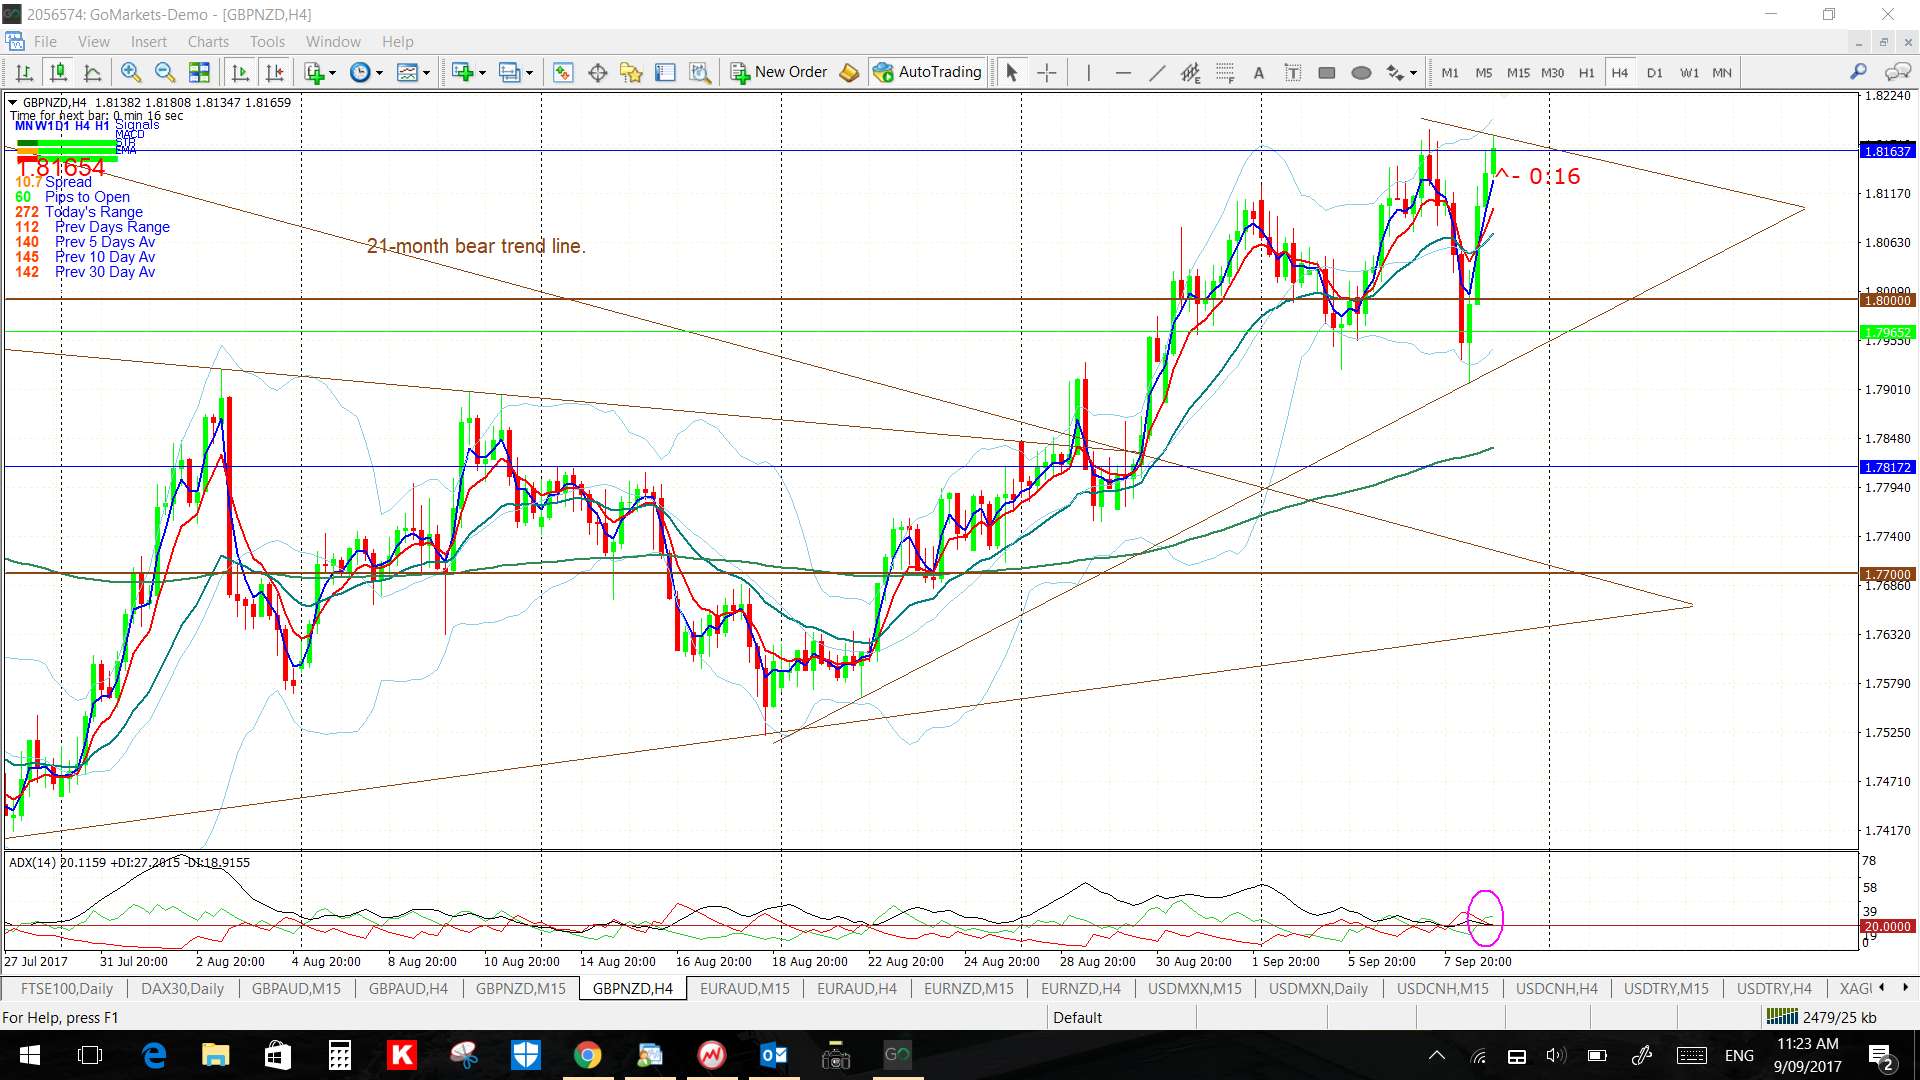
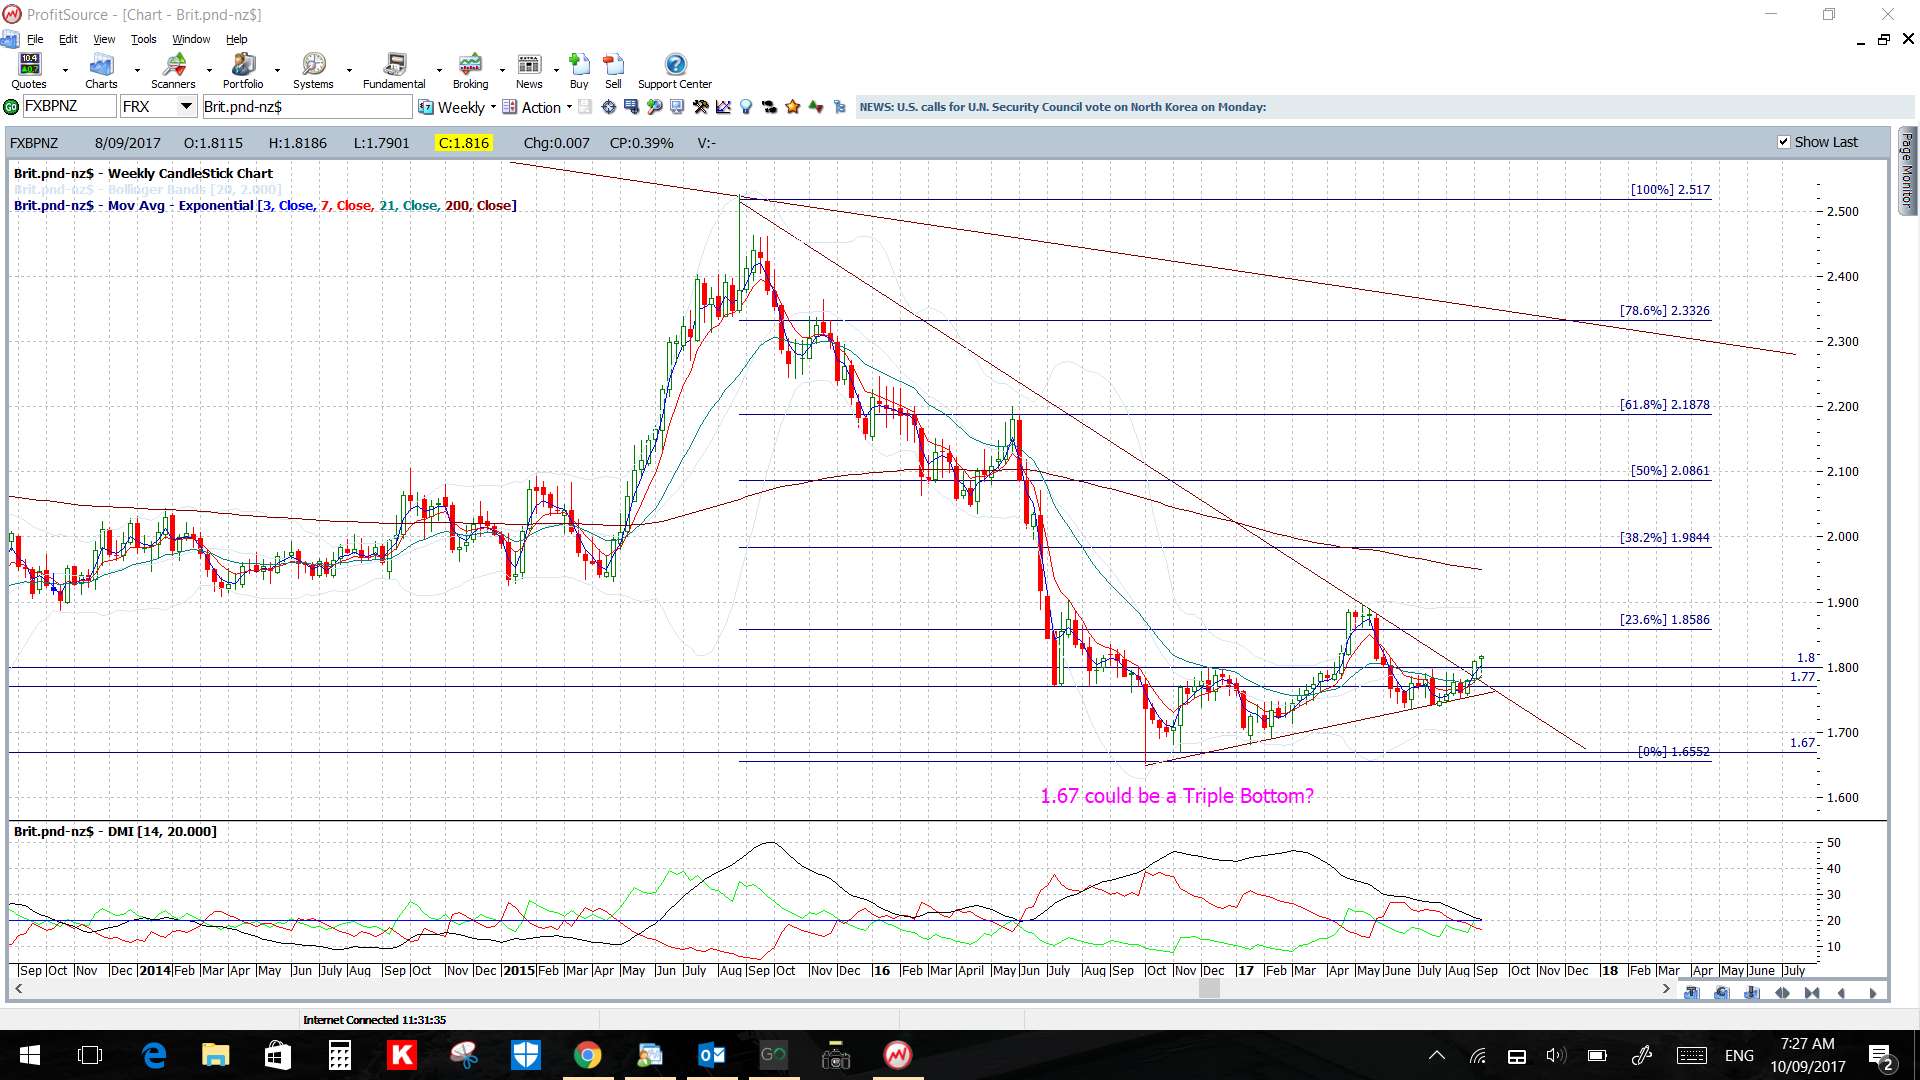
GBP/NZD: Watch the 4hr chart’s triangle trend lines, and also the 1.80 level, for any new breakout.
Recall: this pair has broken out from a weekly/monthly chart triangle so watch for any mean reversion activity here too:
EUR/AUD: Watch the 4hr chart’s triangle trend lines, and also the 1.50 level, for any new breakout:
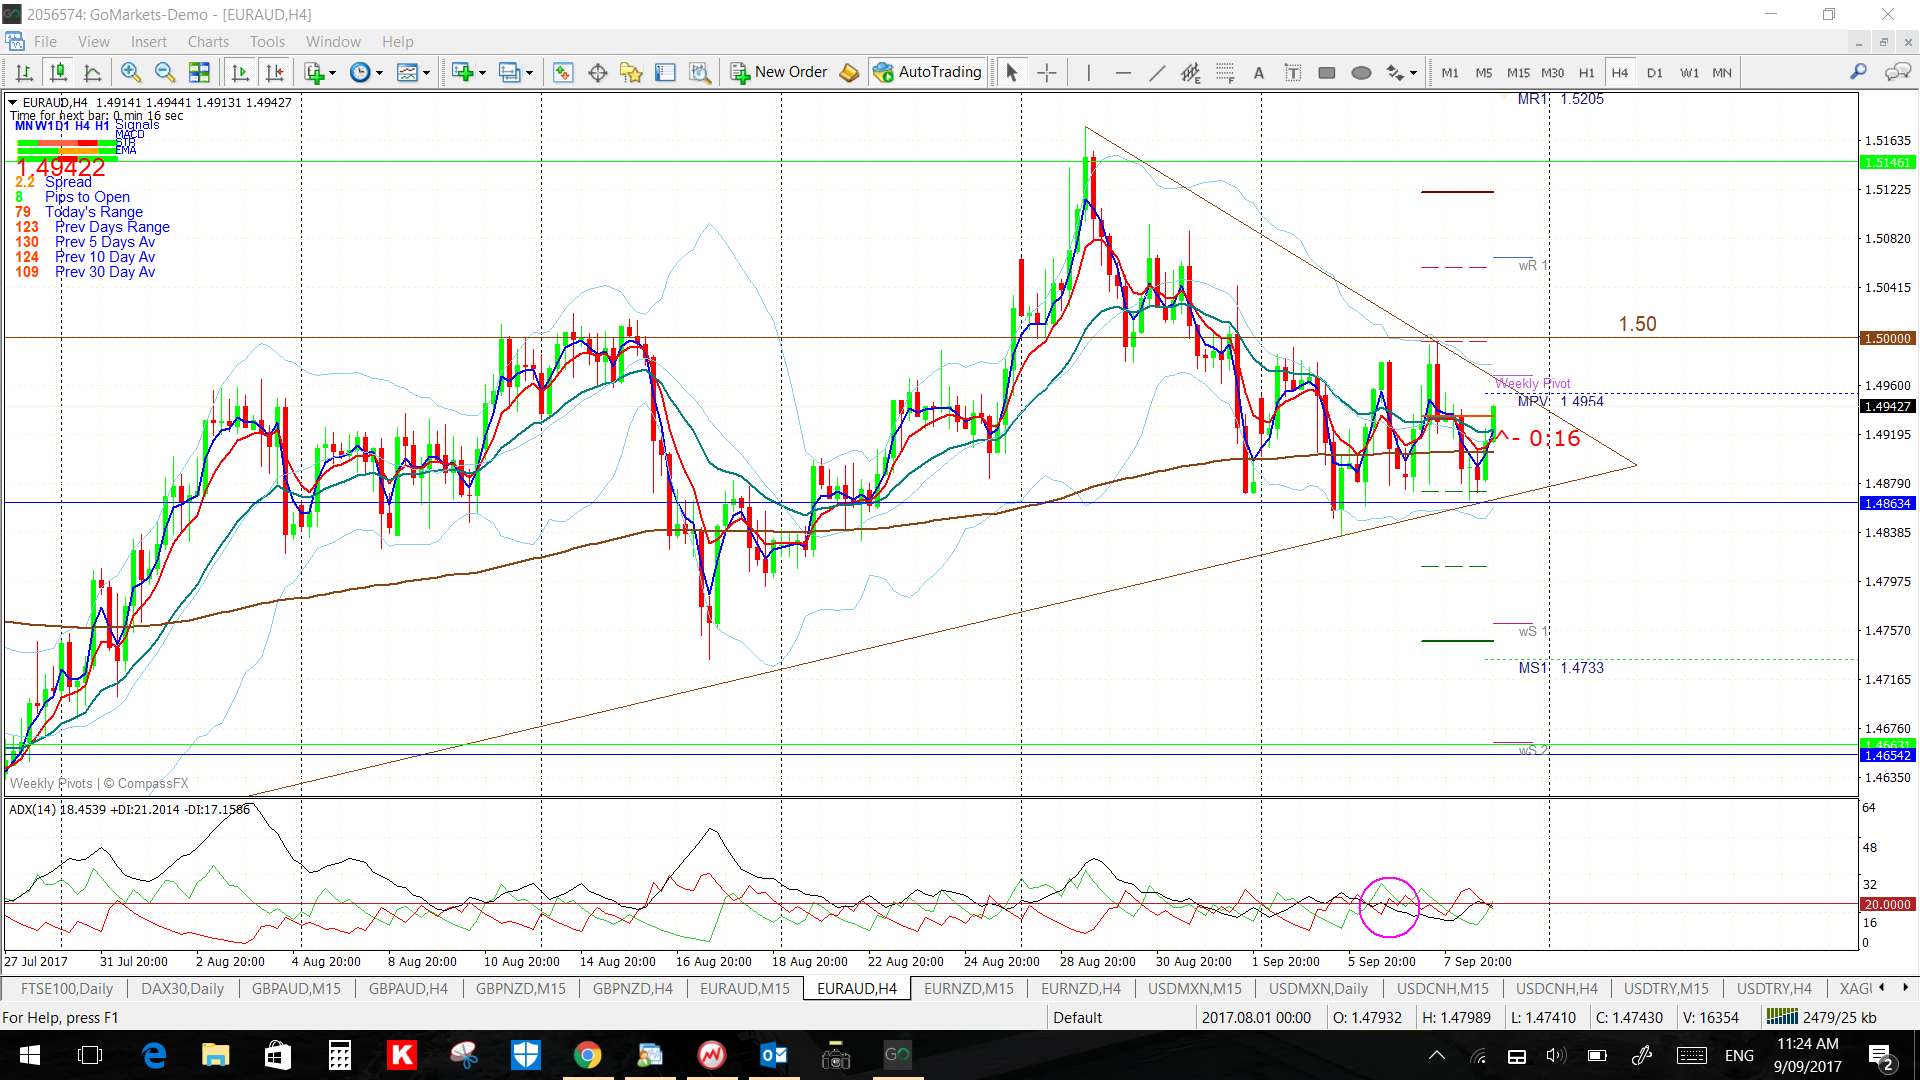

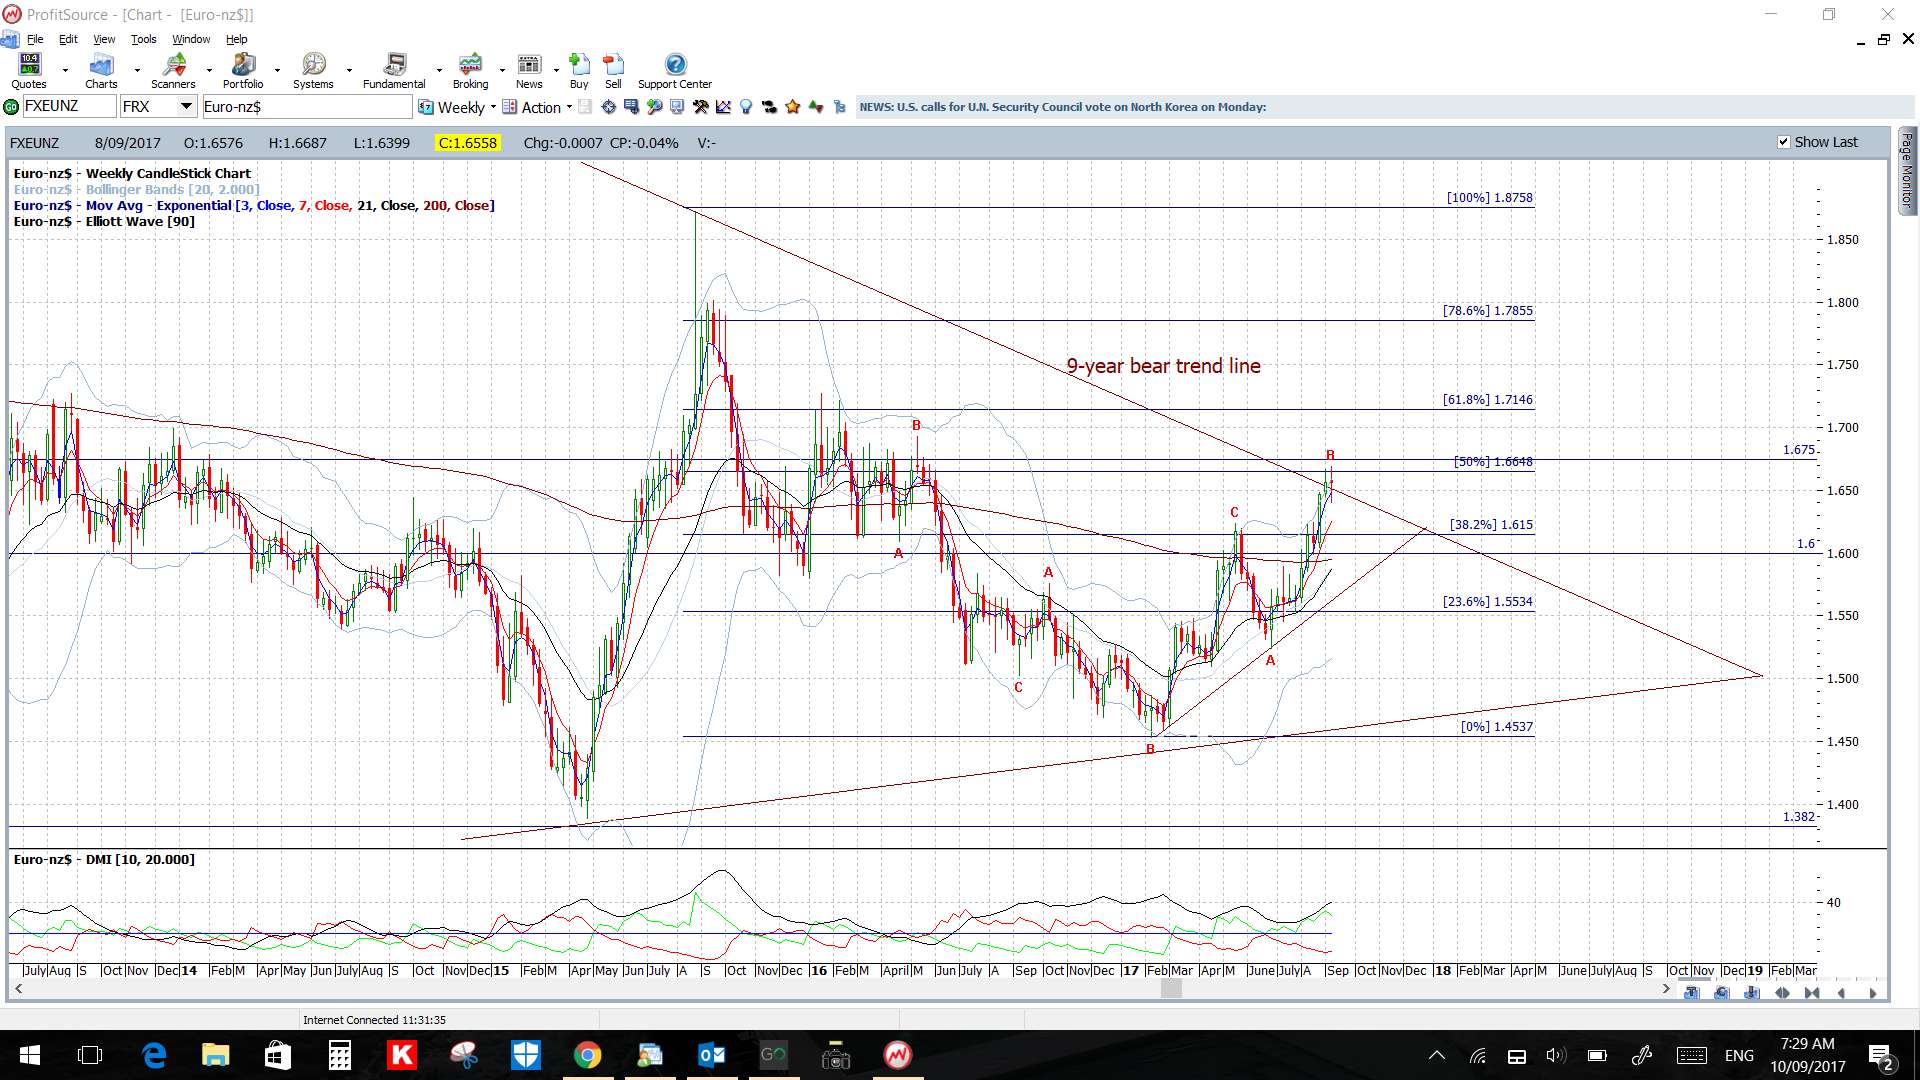
EUR/NZD: Watch the 4hr chart’s triangle trend lines, and also the 9-year bear trend line and 1.675 level, for any new breakout:

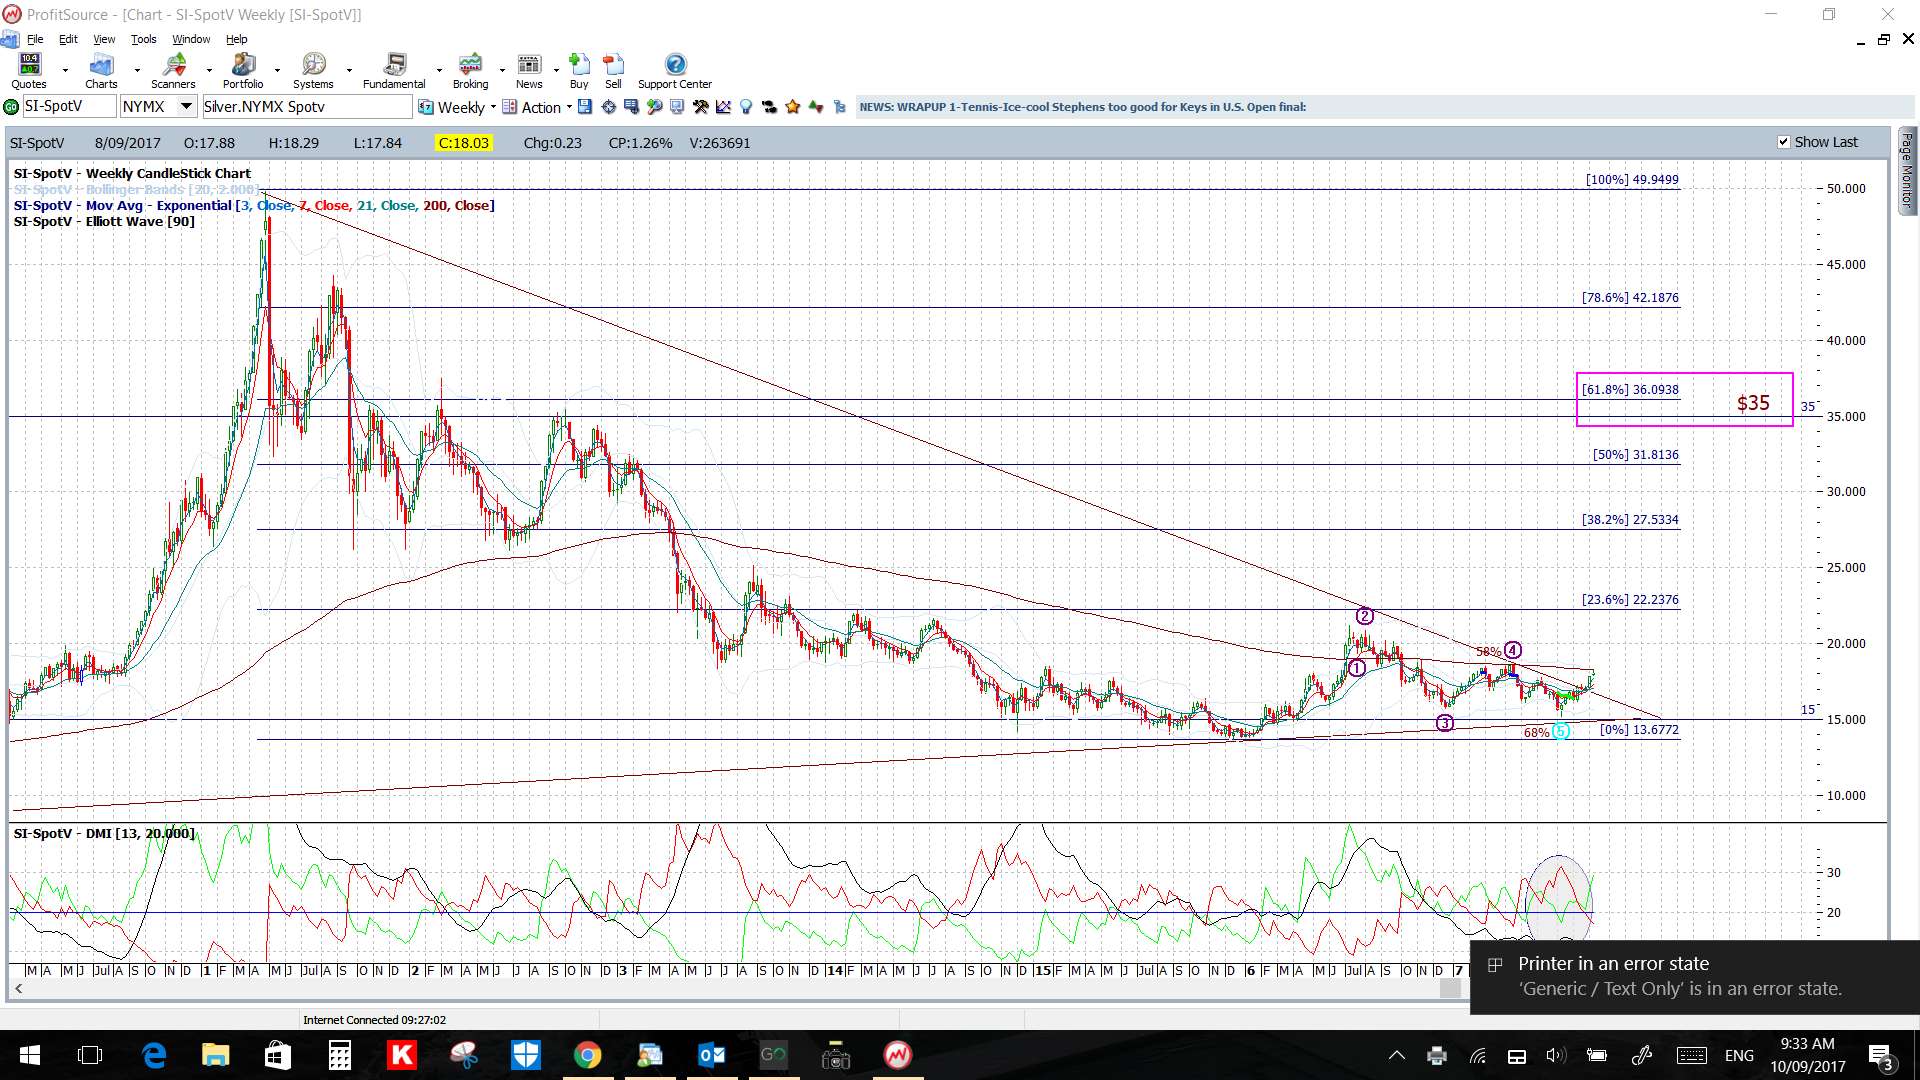
Silver: Watch the weekly 200 EMA for any new make or break:
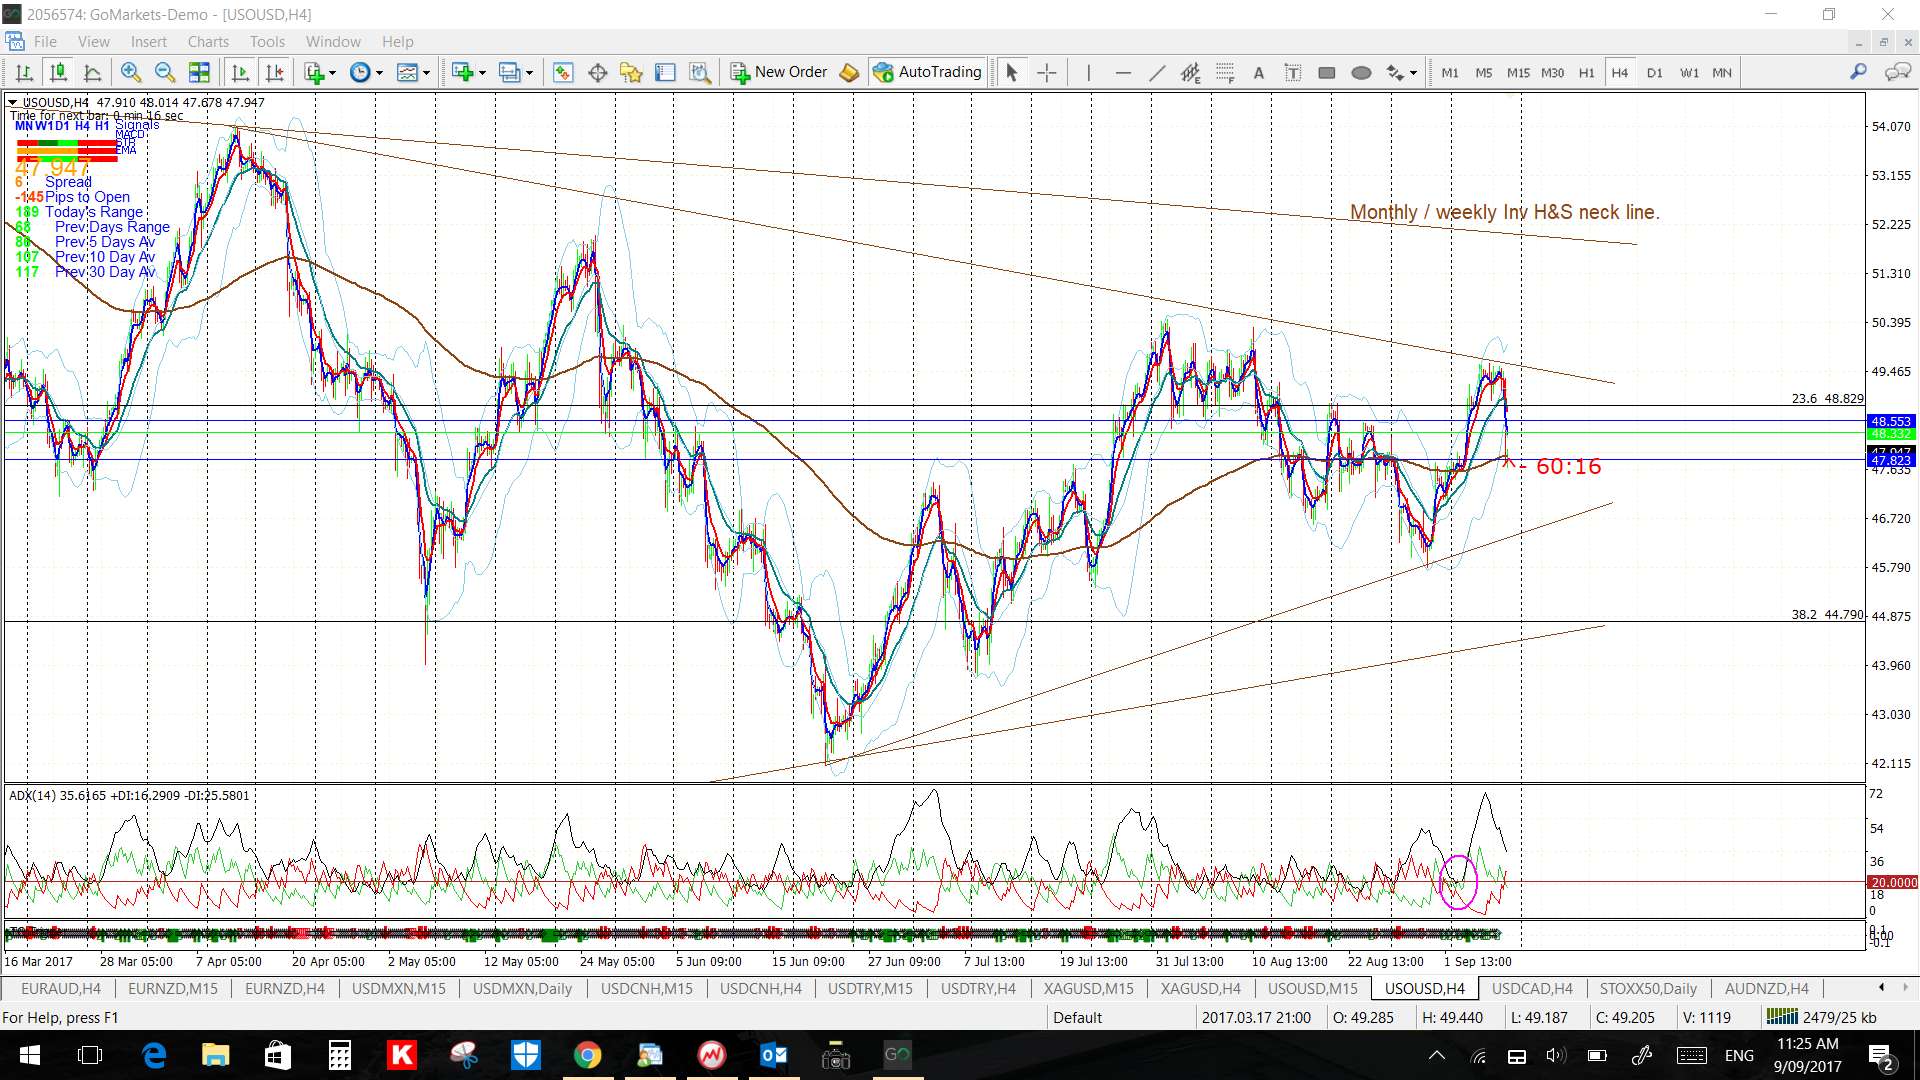
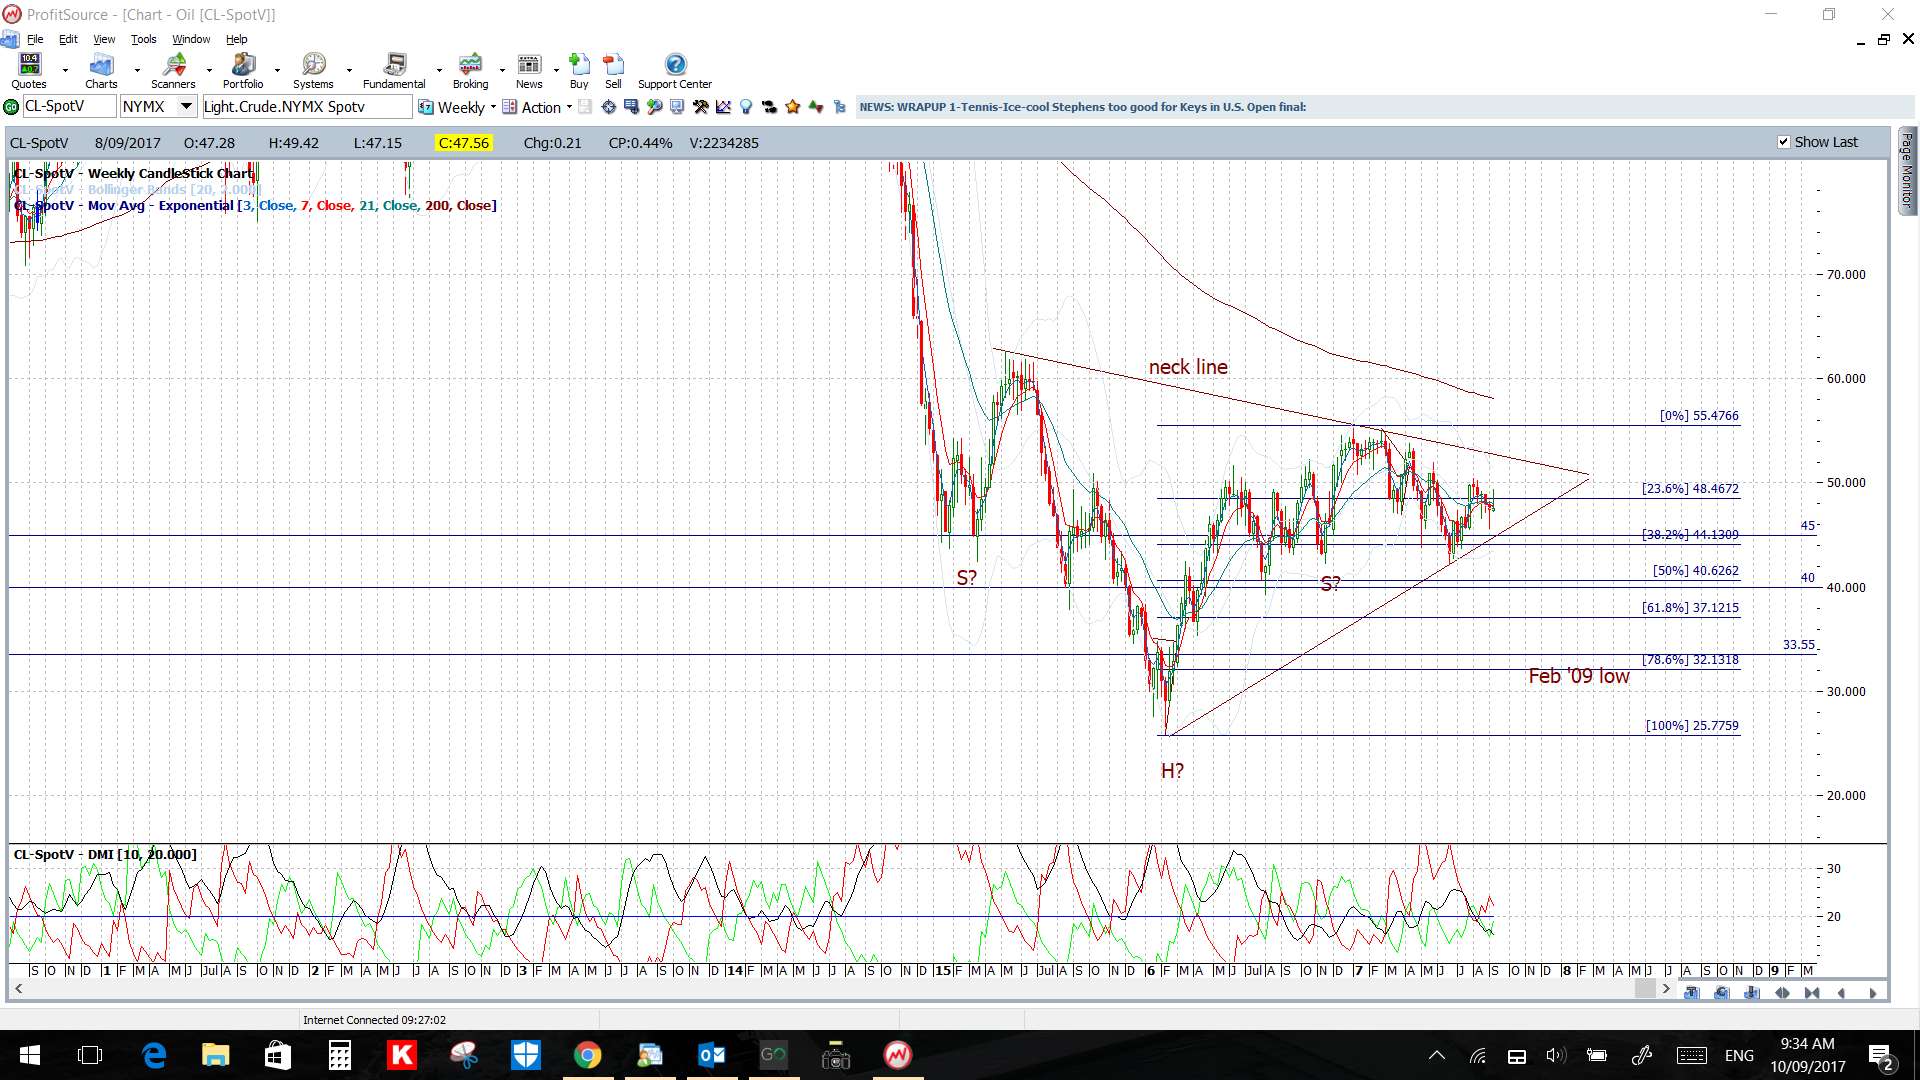
Oil: Watch the 4hr chart’s triangle trend lines for any new breakout:
Other weekly charts:
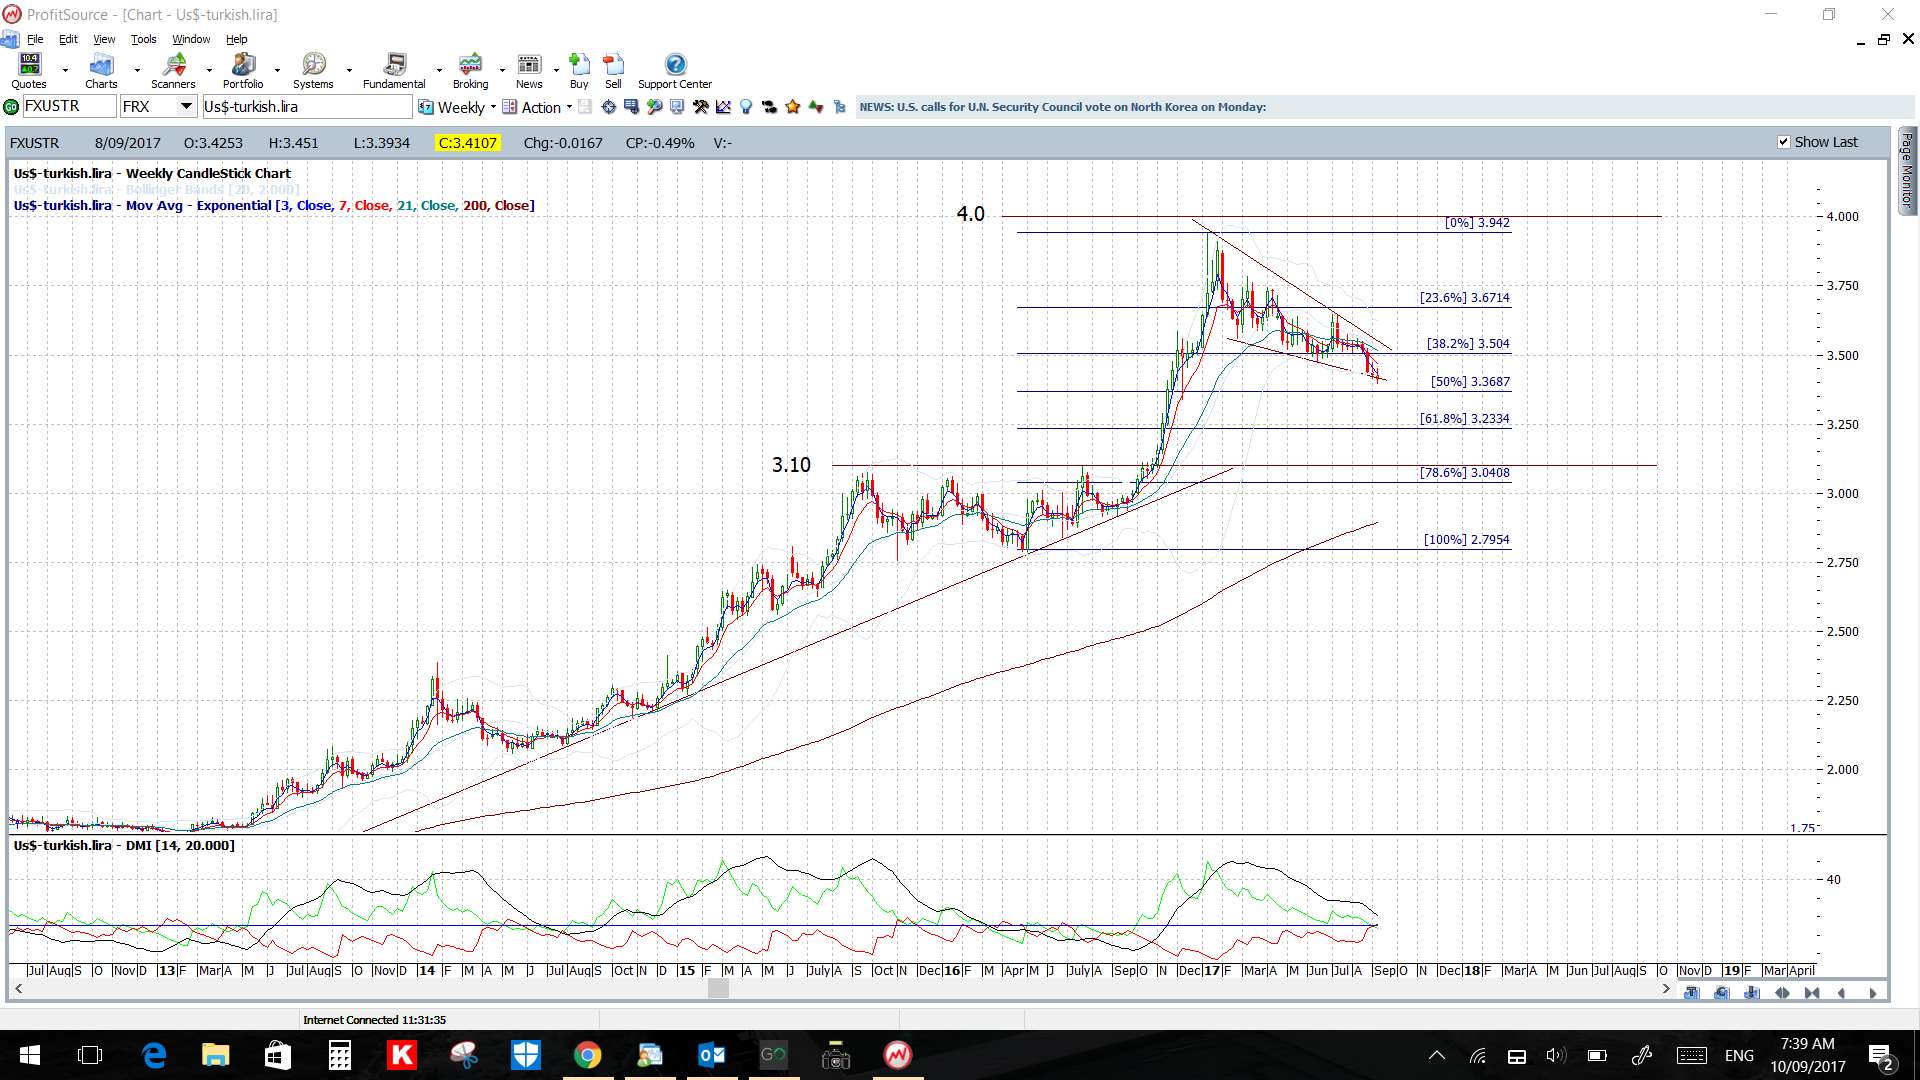
USD/TRY weekly: watch for any break of the weekly chart’s Flag trend line:
USD/CNH weekly: watch for any move to the 61.8% fib:

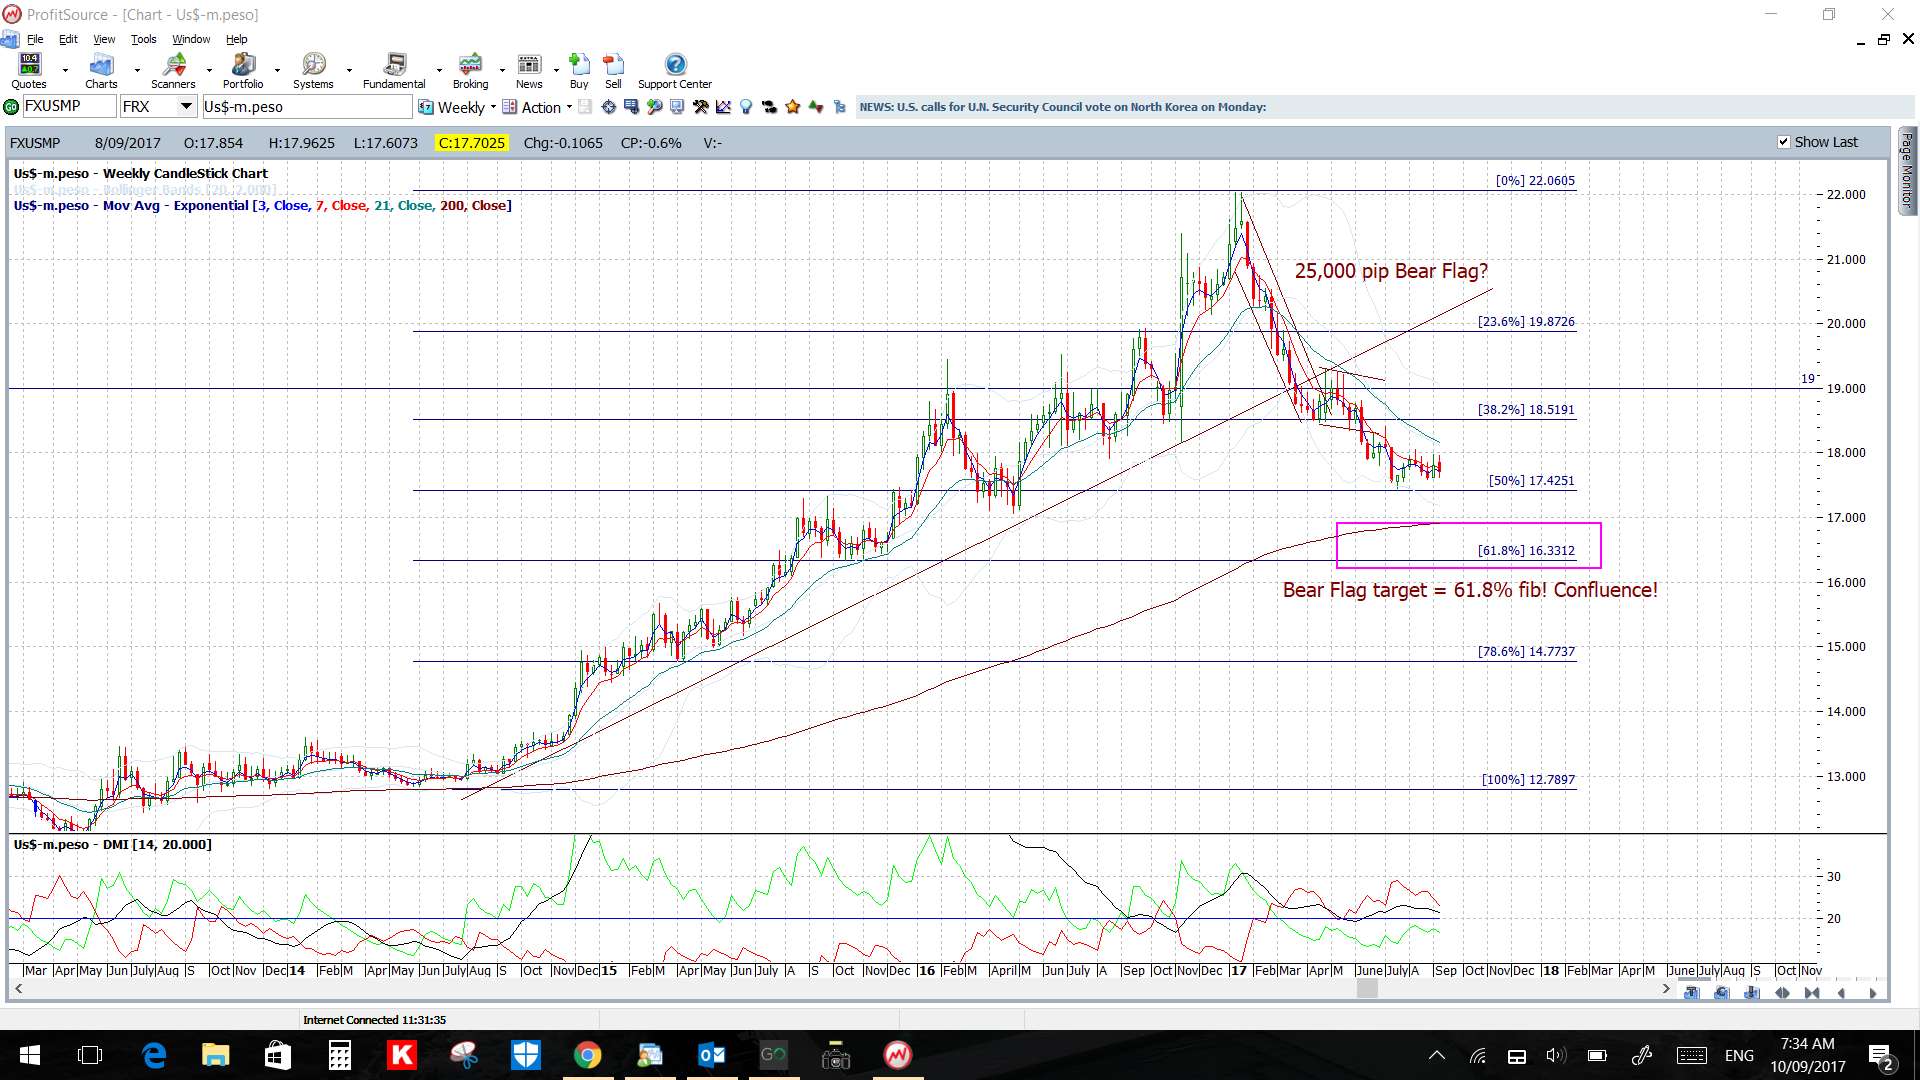
USD/MXN weekly: watch for any make or break at the 50% fib.
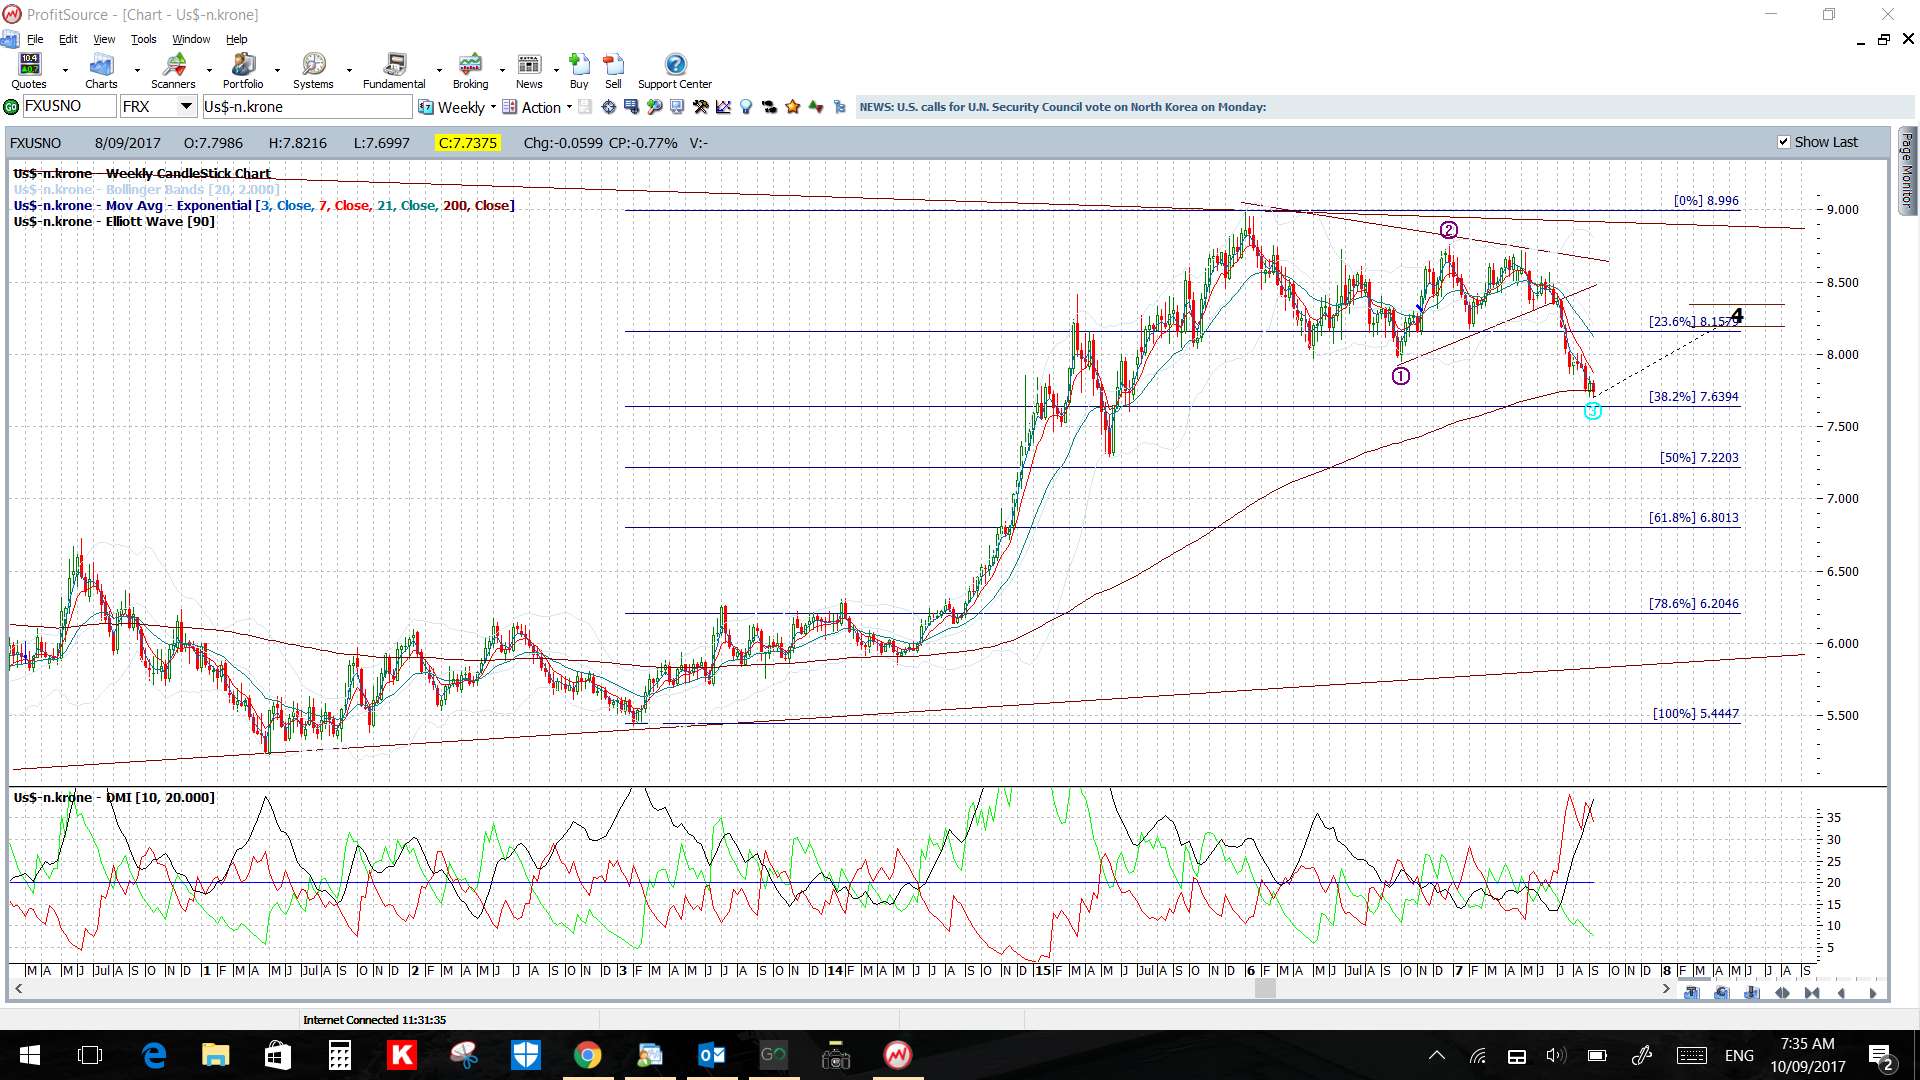
USD/NOK weekly: watch for any make or break at the 38.2% fib.
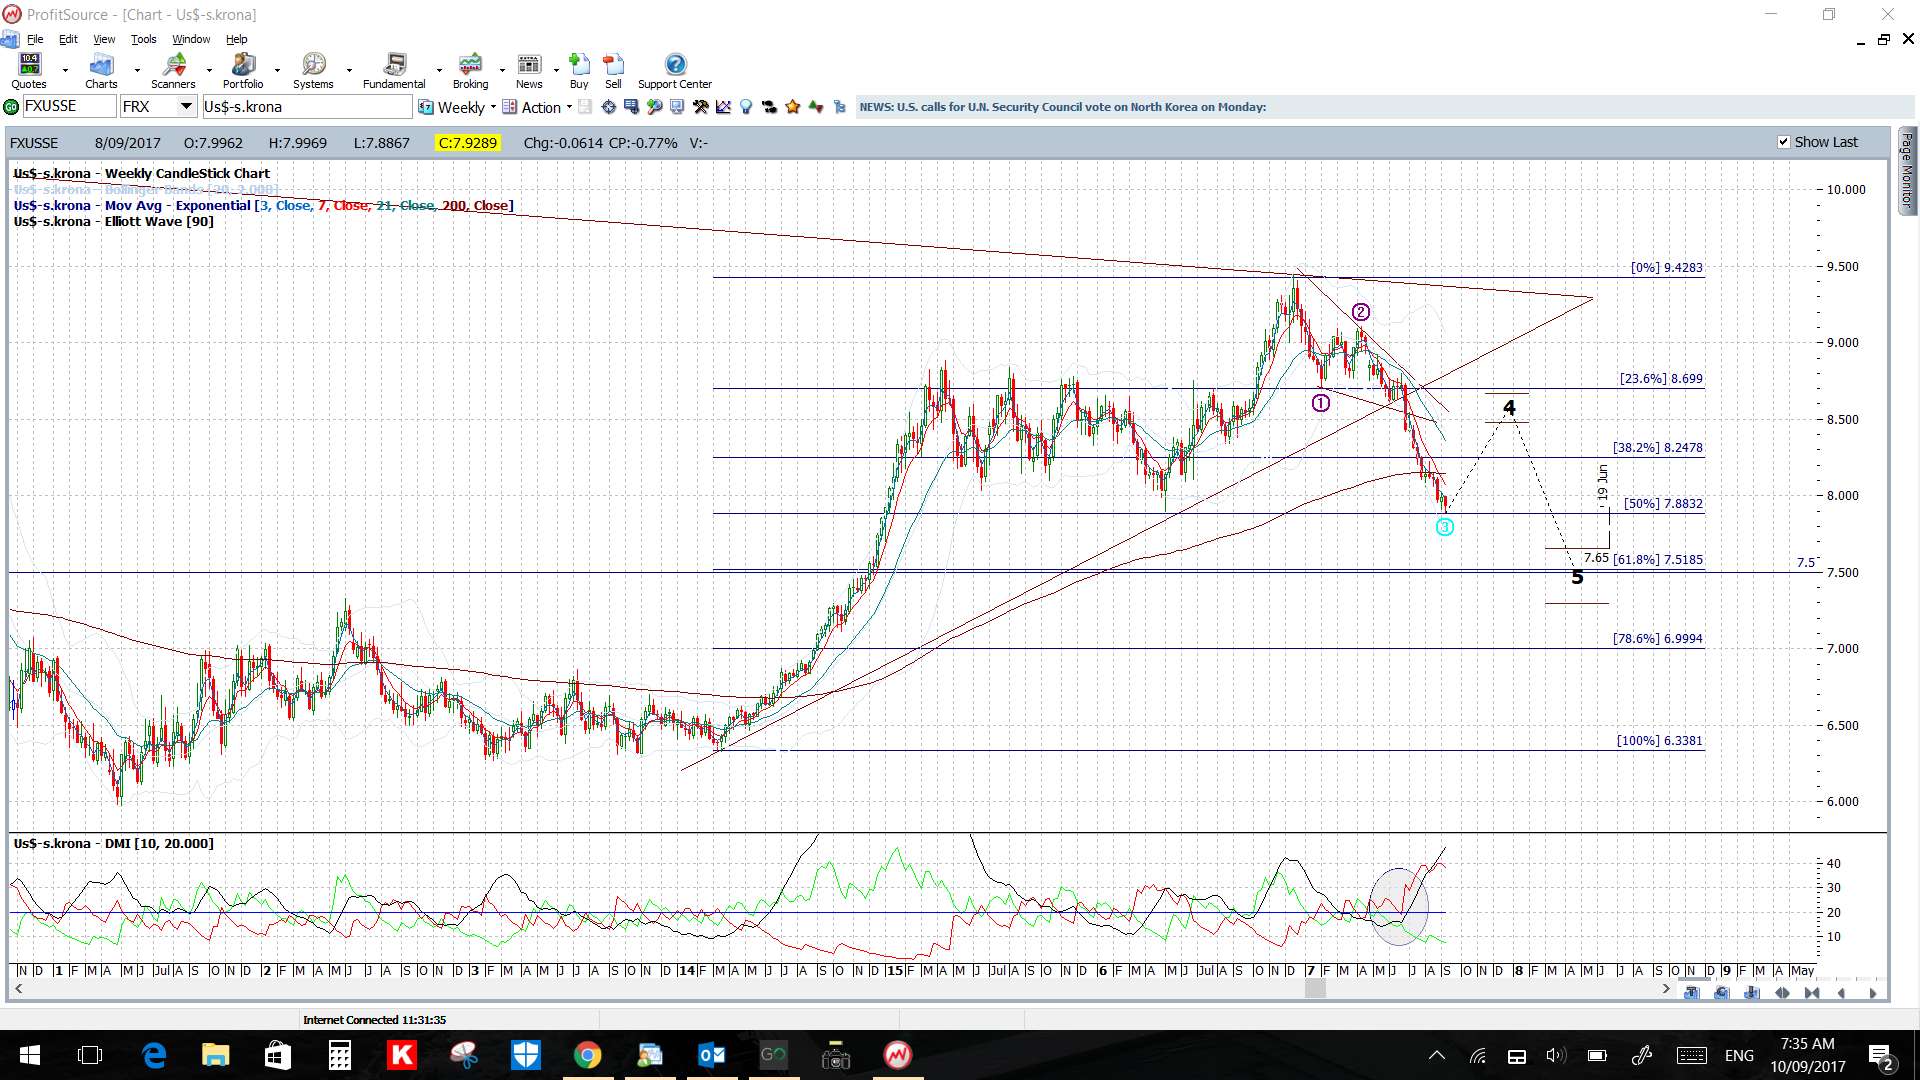
USD/SEK weekly: watch for any make or break at the 50% fib.