Last week: It was a choppy week for the FX pairs that I watch. There were no TC signals until Friday and, then, a few came in together but all were essentially based on the same theme: long USD. Most are near entry or in small profit BUT I’m wary with these given the bearish weekly candle just printed on the USD index and the fact the index hasn’t been able to break 88.50 resistance during the last two weeks.
This week:
There is a HUGE amount of high impact data in the coming week that traders will have to navigate through. This starts over the w/e with the Swiss Gold Referendum and is followed up by the release of interest rate data with commentary from four central banks; AUD, GBP, CAD and EUR, lots of PMI data and concludes with the ‘big kahuna’ of them all with USD NFP on Friday.
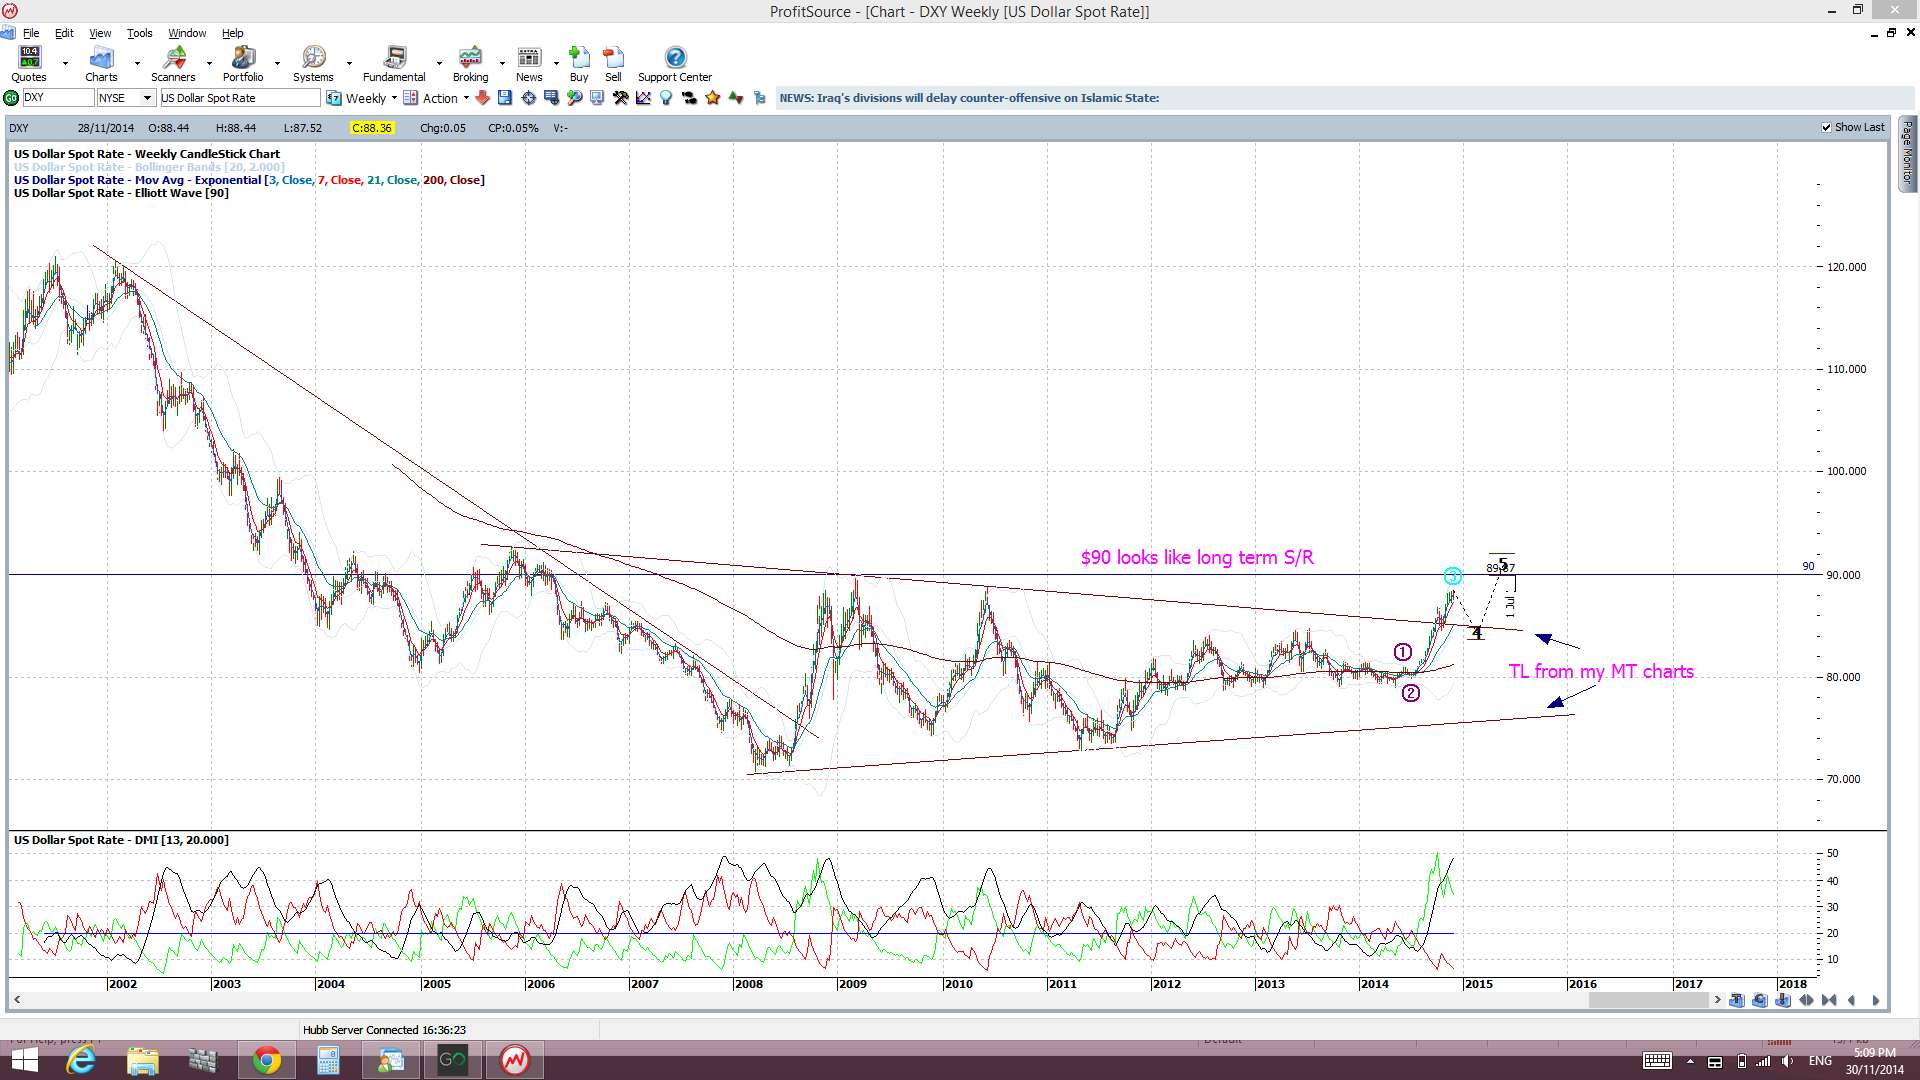
The USD continues to struggle under major resistance and it printed a bearish-reversal weekly candle. This bearish potential is making me cautious with some of my new TC signals that were derived from a bullish USD bias. A review of the FX indices can be found through this link.
USD index weekly: 90 is the next major S/R level:
Friday was the last day of the trading month so watch for new monthly pivots on Monday.
Some candle patterns worth noting this week: potential bullish reversal candles on the E/U weekly, GBP/USD weekly and Kiwi monthly.
US Bonds rallied last week and I consider the various implications of this move.
Gold and Silver may experience huge moves following the weekend Swiss Referendum.
I am away from Fri 5th Dec until Wed Dec 10th. Updates will be less frequent and more brief during this time.
Events in the Ukraine and the Middle East, as well as with Ebola, continue to have the potential to undermine any developing ‘risk’ appetite and need to be monitored.
Stocks and broader market sentiment:
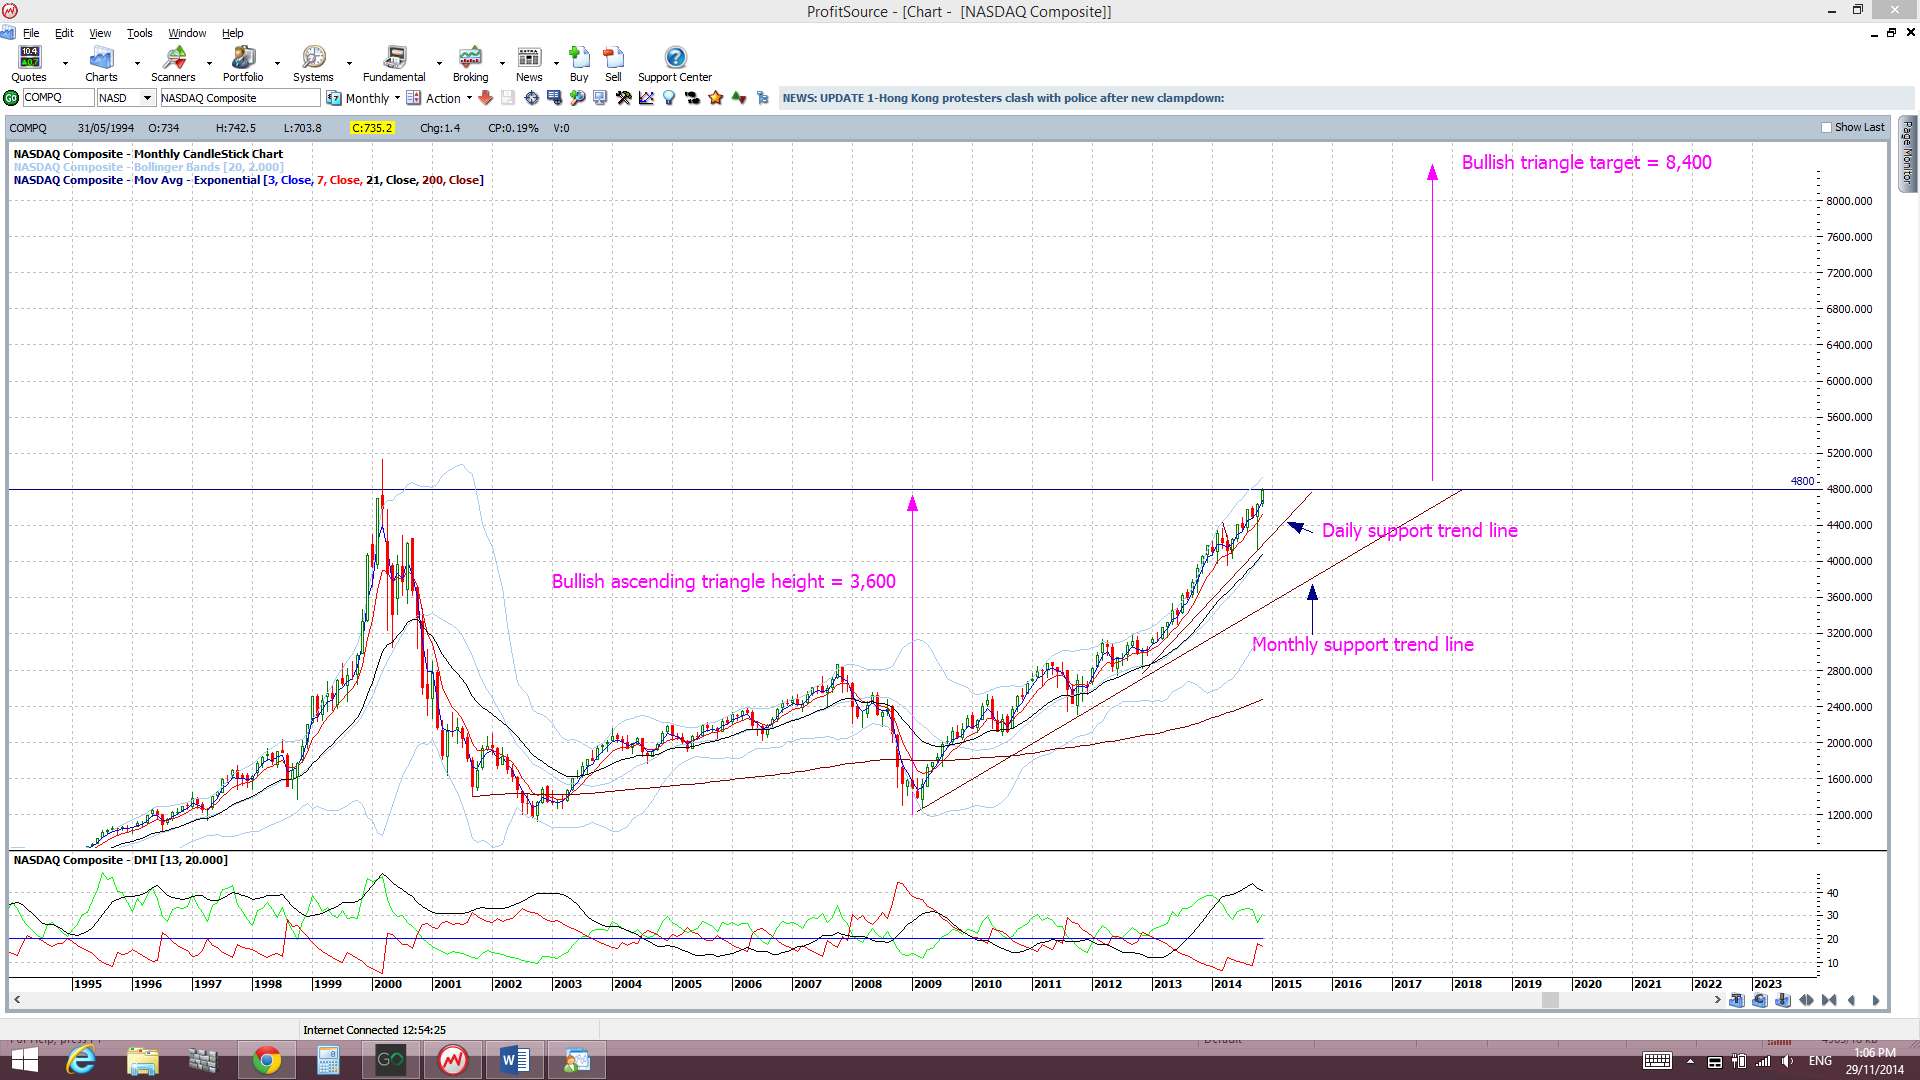
The S&P500 and DJIA closed with reasonably sized bullish monthly candles but their weekly candles were only bullish coloured Dojis. I do suspect though that they’ve been waiting for the NASDAQ to do its ‘catch up’ thing and, that it did! The NASDAQ printed a bullish weekly and monthly candle and the monthly candle was the highest monthly close on record. Not the highest daily close as that was at 5,048.62 back in March 2000.
NASDAQ monthly:
The Russell 2000 ‘small caps’ index continues to hold up and out from a ‘Bull Flag’ breakout but printed bearish coloured Doji candles for both the monthly and weekly close. I am aware of the Russell 2000 being the ‘canary in the coal mine’ and it might be sending a warning signal BUT, with the action seen across the NASDAQ, a part of me is wondering whether this is just cyclical rotation at work? That is, given the S&P500 and DJIA keep printing new highs, which would obviously un-nerve many traders, preference is shifting to other well know big cap stocks such as those found in the NASDAQ and away from small caps.
There are also a few strange trend observations worth noting: Stocks up slightly, Treasury yields down, Bonds up, U/J up and VIX slightly higher for the week but still below 14. The rally with bonds this week has been interesting. This comment from Pragmatic Capitalism on the correlation between bonds and stocks is worth noting:
“Historically, rising equity prices have been associated with falling bond prices (rising bond yields), as stronger economic fundamentals drove investors to stocks and away from bonds, and weaker economic growth produced the reverse. However, over the past few years, equity and bond prices began moving together as both markets were inflated by floods of liquidity from accommodative U.S. monetary policy, which distorted the traditional relationship. After tapering of quantitative easing by the U.S. Federal Reserve was first suggested in mid-2013, markets began returning to more normal correlations, driven not by expectations of continued quantitative easing, but by the economic outlook.”
So, whilst I admit that I’m a bit perplexed here, I consider there could be three possibilities with this latest bond rally:
- the Bond market isn’t buying into any increase in US interest rates or,
- if you take the historical correlation view, quoted above, they suspect a stock market pull back is coming or,
- if you take the recent correlation pattern, quoted above, perhaps they see a stock market rally coming!
Confusing!
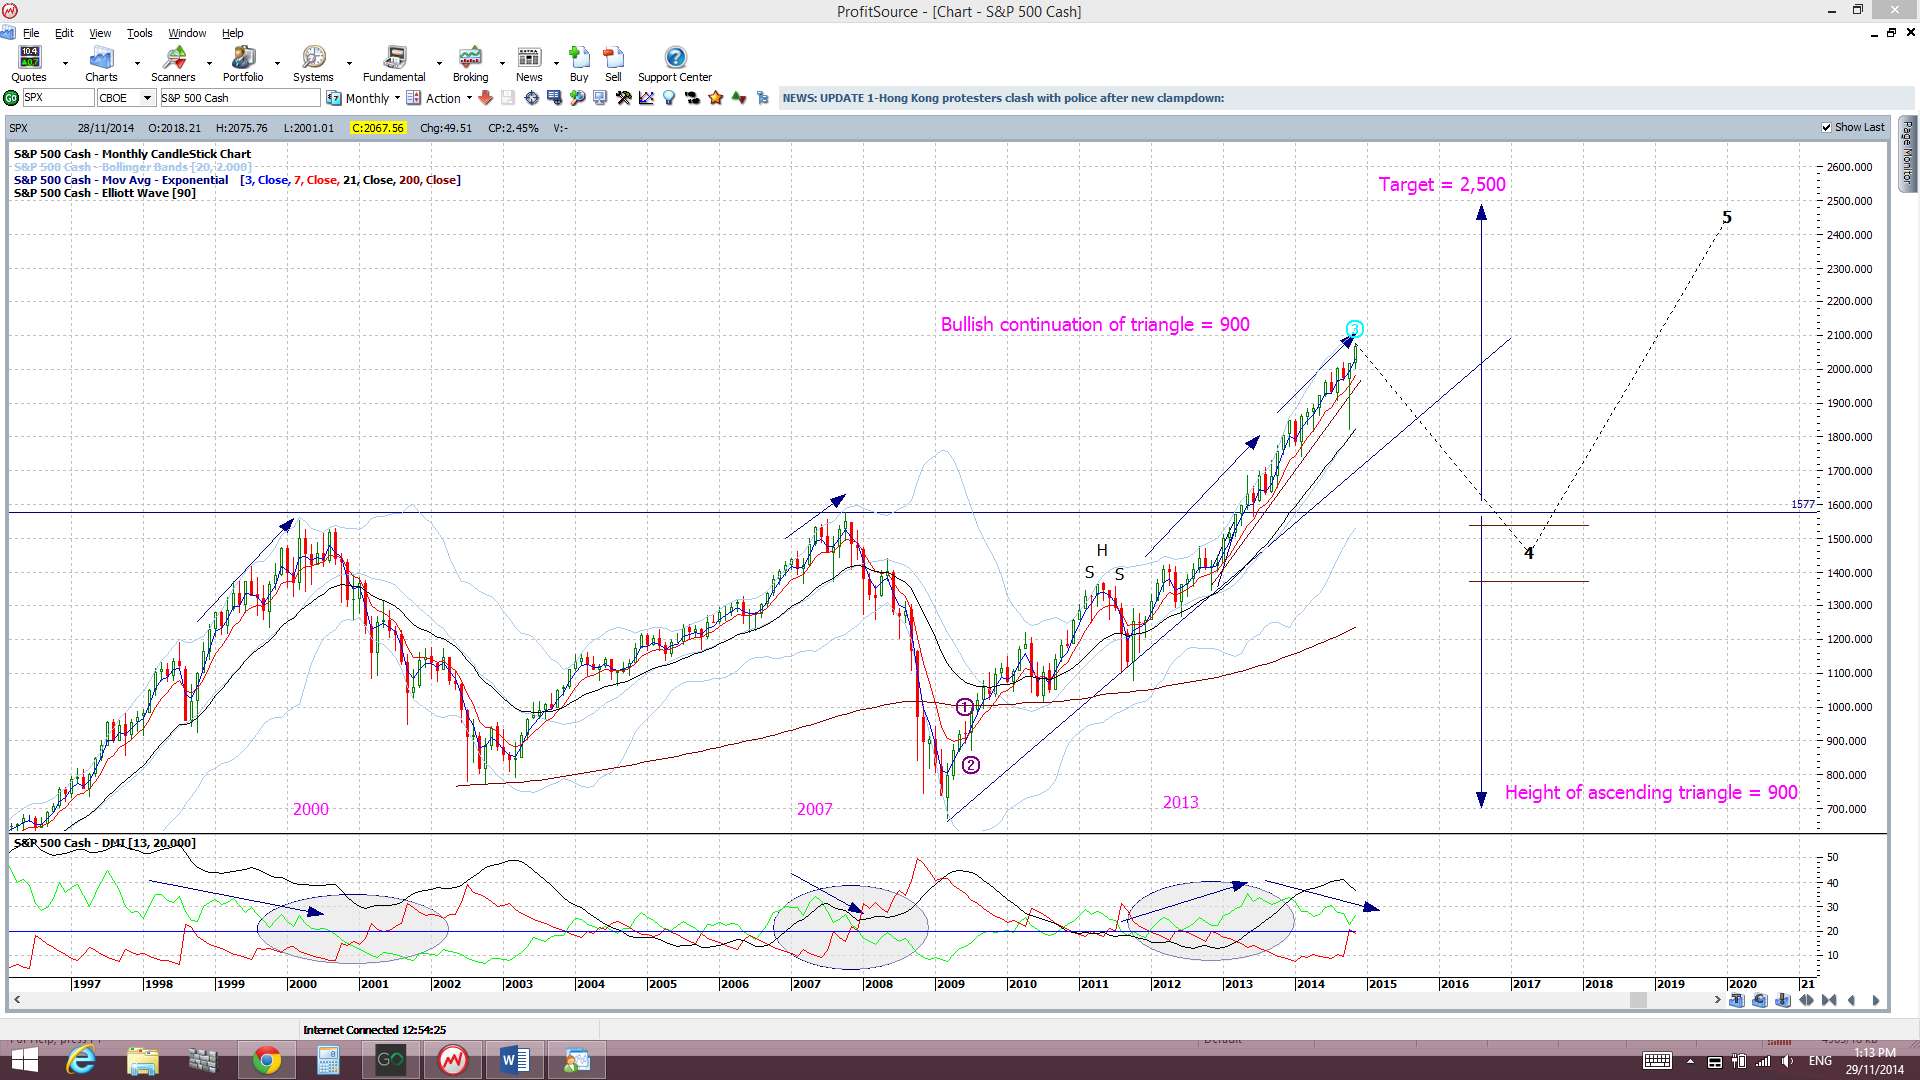
Anyway, I am still seeing divergence on the monthly S&P500 monthly chart though and whilst this might just be warning of a pause, as the index navigates these new highs up circa 2000, the chance of a pullback cannot be ruled out either. There has not been any real deep pull back since the break up through the 1,577, 1,600, 1,700 and 1,800 levels and the major break of the 1,577 level was only tested once.
Thus, with all of this, I continue to watch out for further clues as to any new momentum move, long or short though! In particular I’m looking out for:
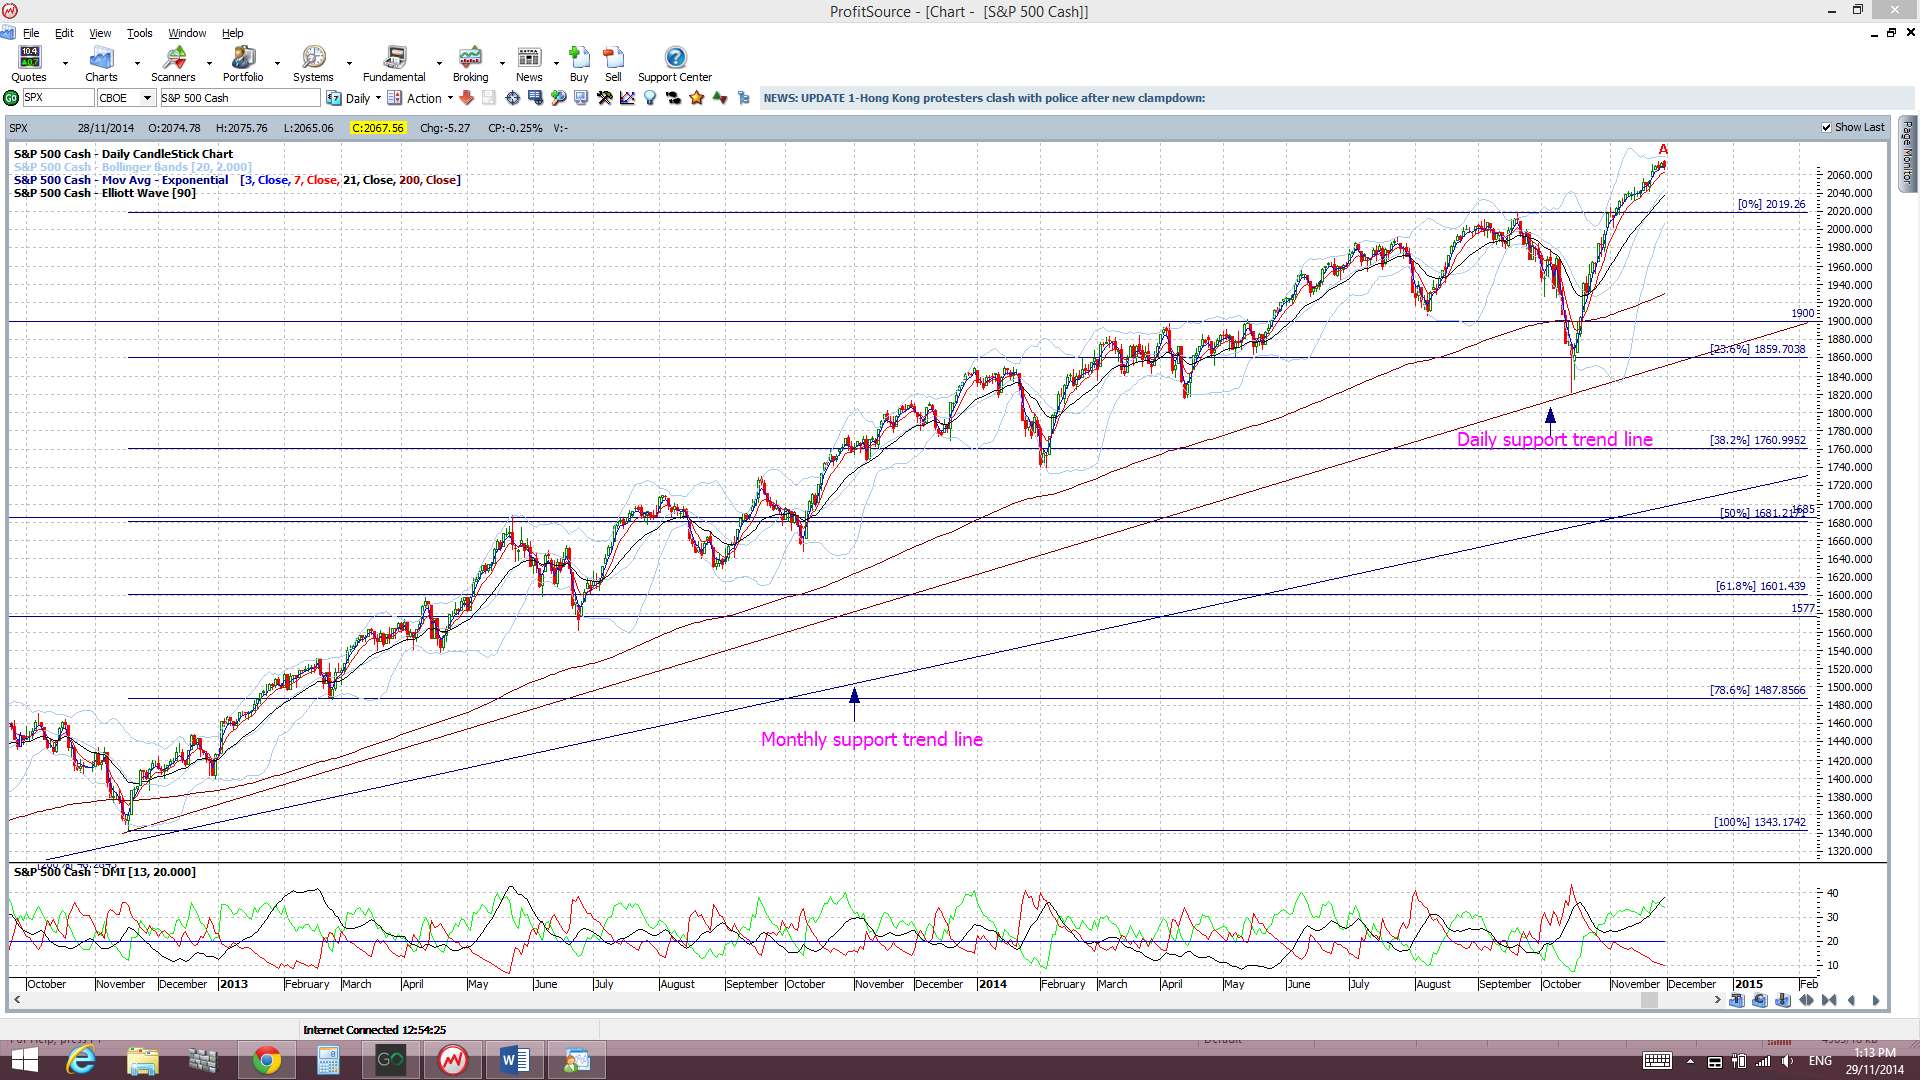
S&P500 daily chart: The index is above the daily trend line and above the key 2,000 level. Note the revised daily support trend line. I still would not be surprised to see the 2,000 level tested at some stage though.
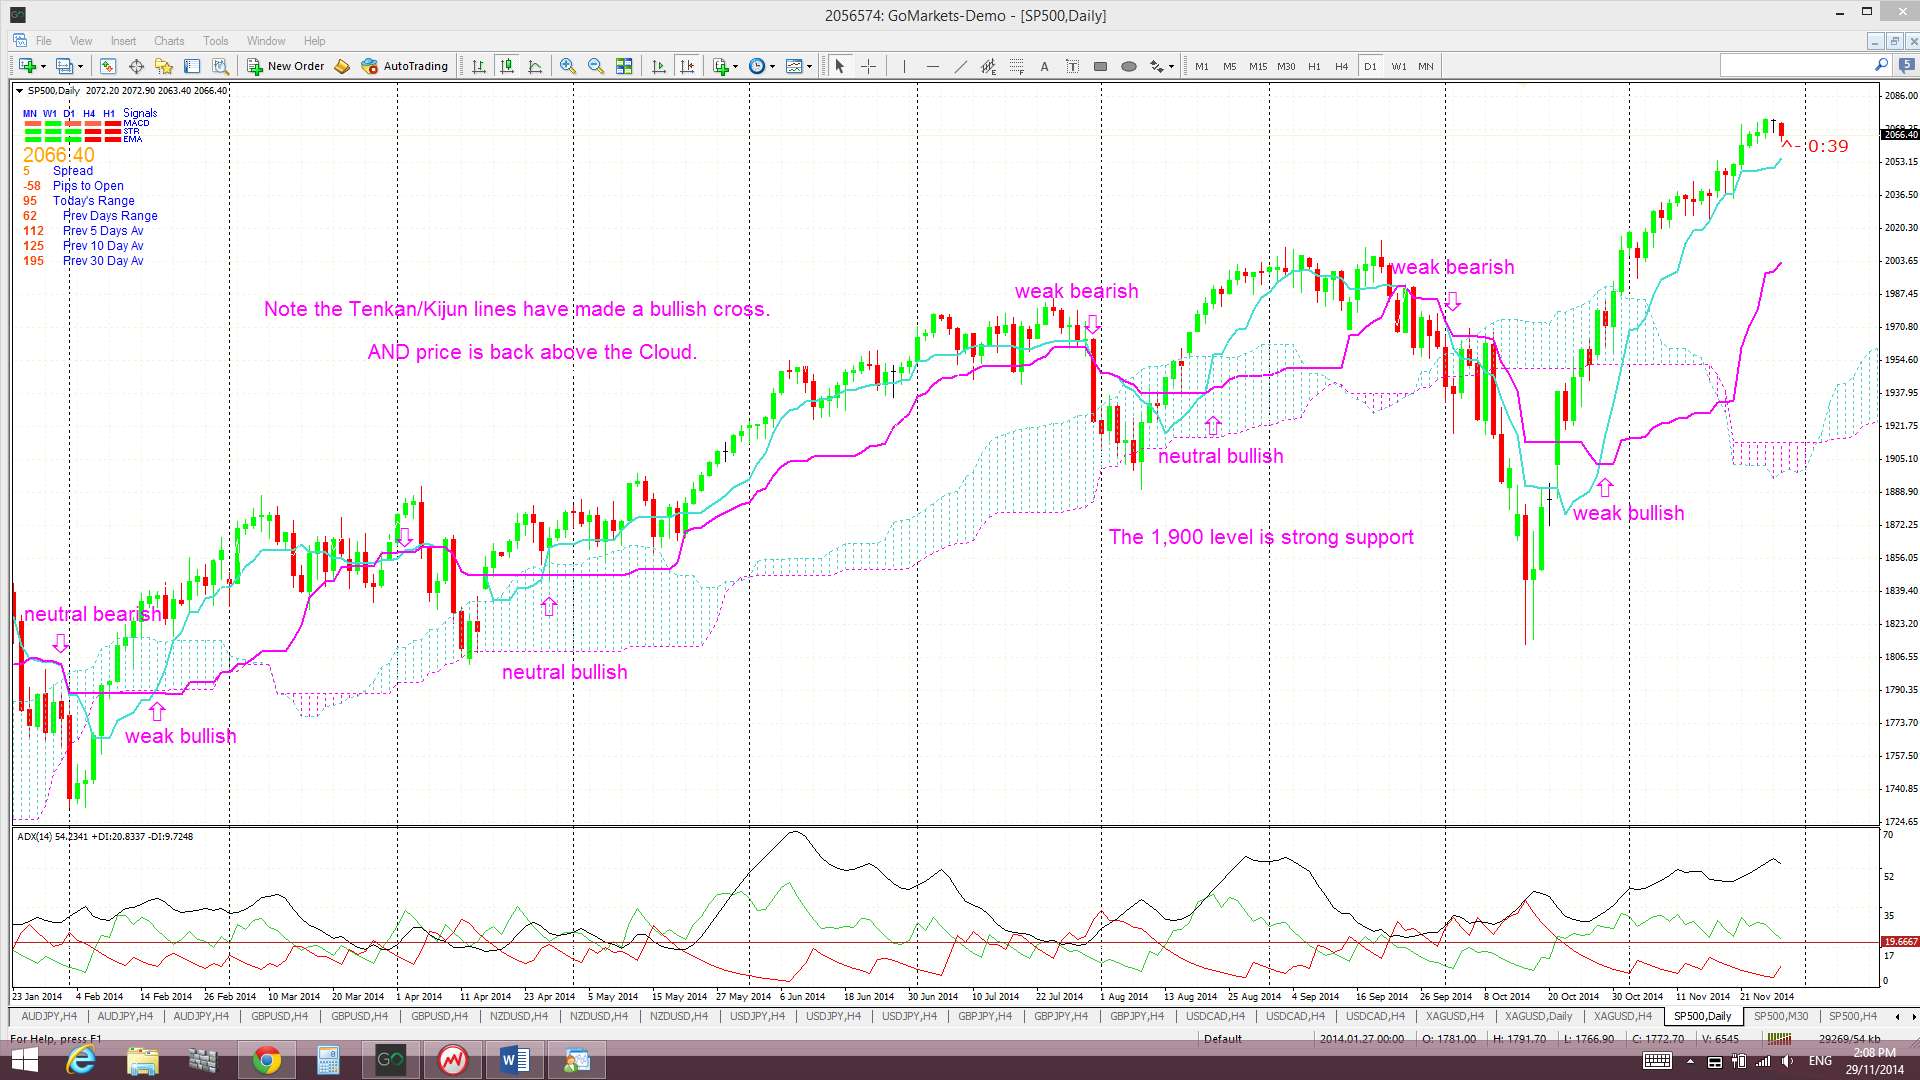
Ichimoku S&P500 chart: a clear cross of the blue Tenkan-sen line below the pink Kijun-sen line. There has been a bullish Tenkan/Kijun cross a while back and price is trading above the Cloud.
S&P500 monthly chart: a break of the monthly support trend line (see monthly chart). The monthly trend line remains intact. A break of this support level would suggest to me of a more severe pull back or correction.
Russell 2000 Index: this small caps index is a bit of a US market ‘bellwether’ and I see the 1,080 level as key support here. The index has held up and out from a ‘Bull Flag’ breakout but is looking a bit vulnerable. Is this merely sector rotation at work though?

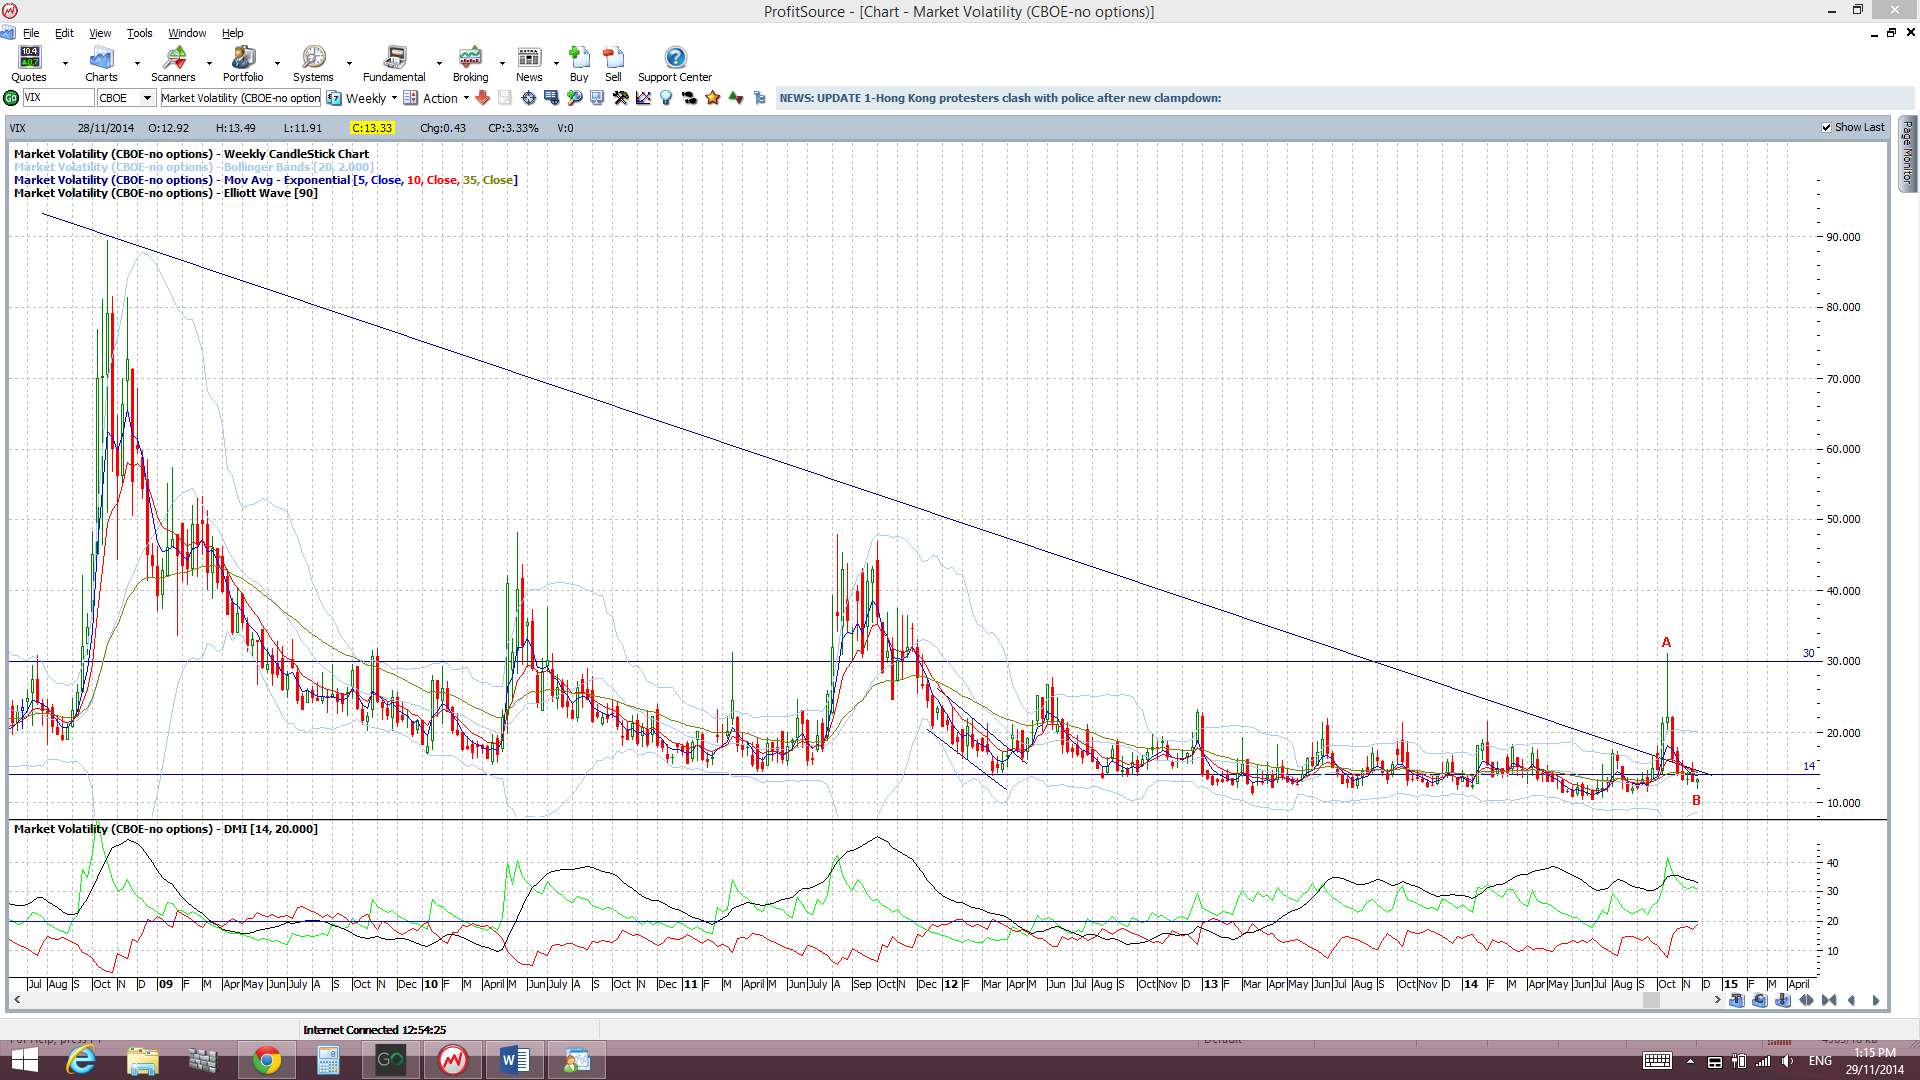
VIX Index: this recently broke up and out of a descending triangle pattern but is back below the 14 level:
Bonds: The bond ETF remains above the triangle breakout and rallied last week. This rally raises a few questions for me though, as discussed above:

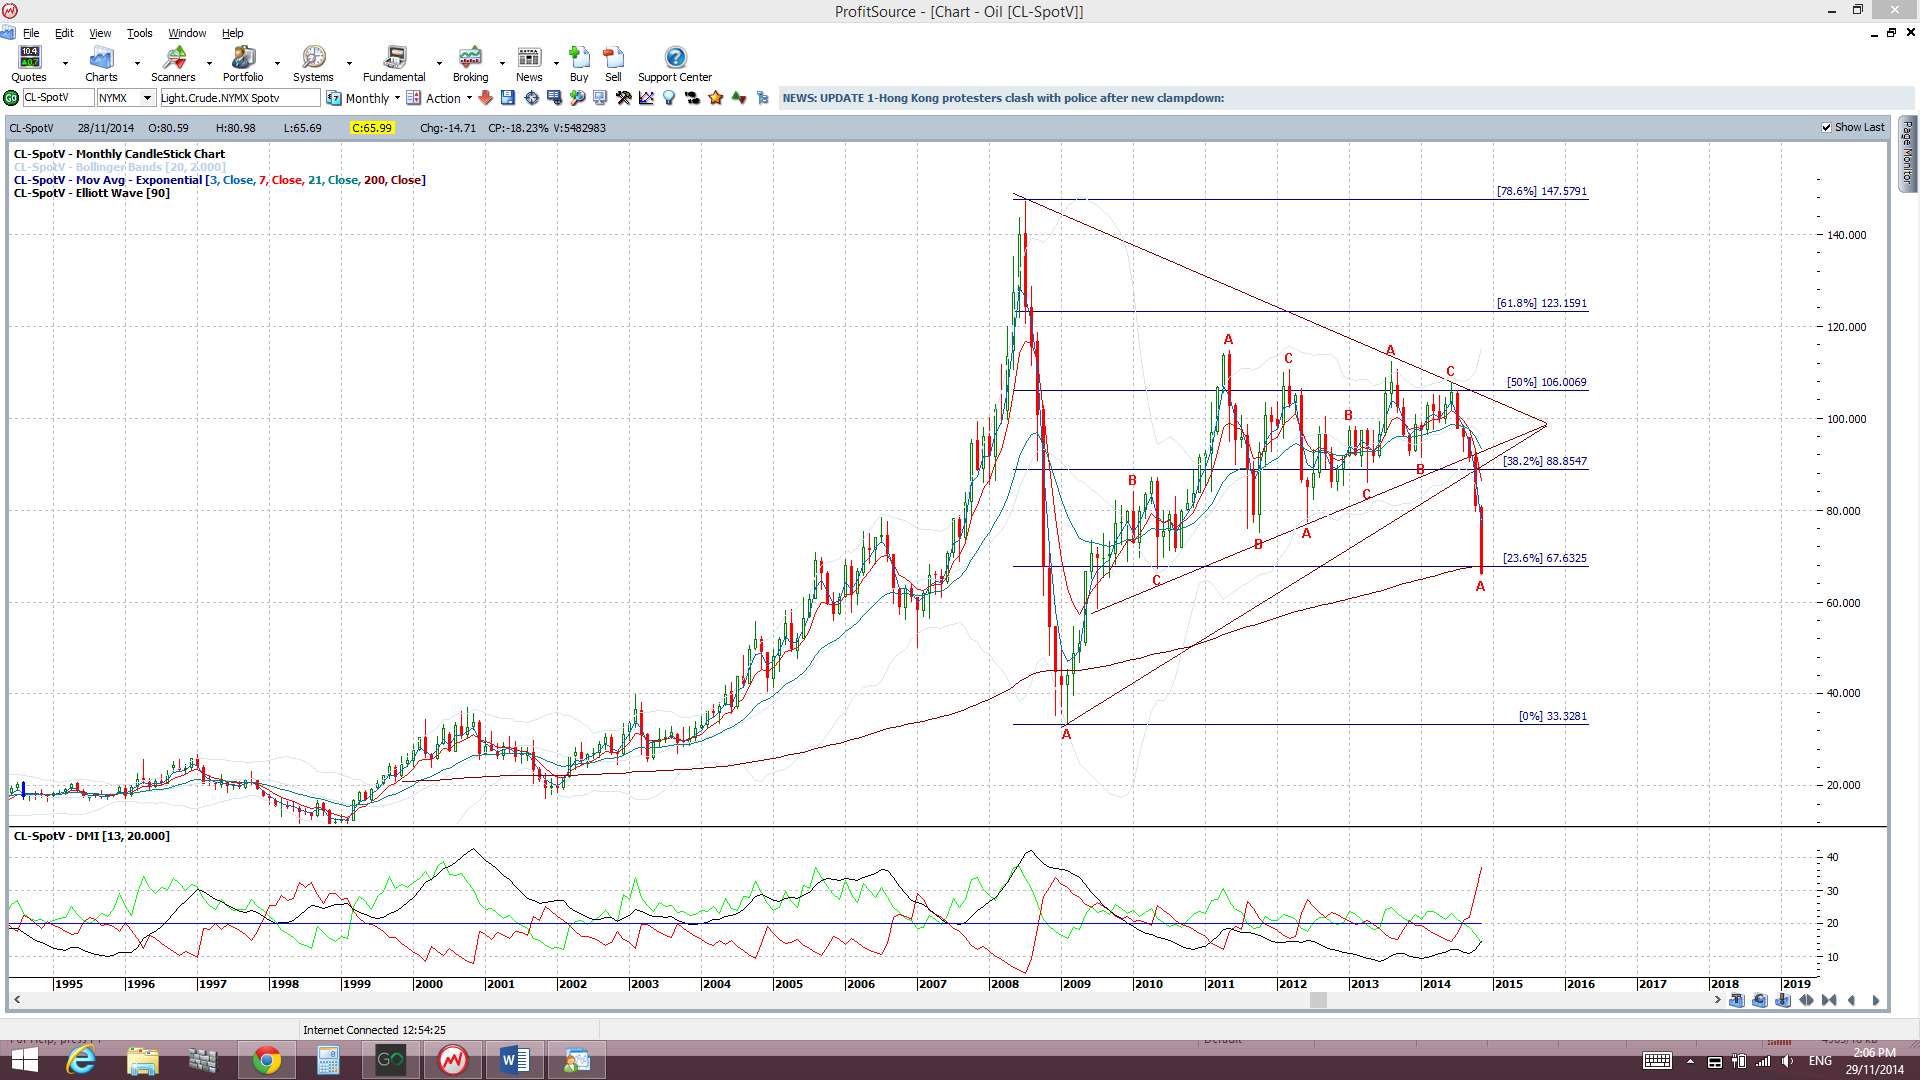
Oil: Oil has pulled back to the 23.6% fib support level. OPEC news sent this commodity tumbling during the week when they announced they would not cut production to reduce supply thereby boosting price. Thus, from this monthly chart, a test of $40 looks likely now:
Trading Calendar Items to watch out for:
- Nov 30th: CHF SNB Gold asset vote.
- Dec 1st: NZD RBNZ Gov Wheeler speaks. CNY Manufacturing PMI & HSBC Final Manufacturing PMI. GBP Manufacturing PMI. USD ISM Manufacturing PMI.
- Dec 2nd: AUD Building Approvals, Interest rates & RBA statement. GBP Construction PMI. NZD GDT Price Index.
- Dec 3rd: AUD GDP. GBP Services PMI. USD ADP NFP & ISM Non-Manufacturing PMI. CAD Interest Rates & BoC Gov Poloz speaks.
- Dec 4th: AUD Retail Sales, Trade Balance & Mid Year Economic & Fiscal Outlook. GBP Interest Rates & Rates Statement. EUR Minimum Bid rate & ECB Press Conference. USD Unemployment Claims. CAD Ivey PMI.
- Dec 5th: CAD Employment data & Trade Balance. USD NFP & Trade Balance.
Forex:
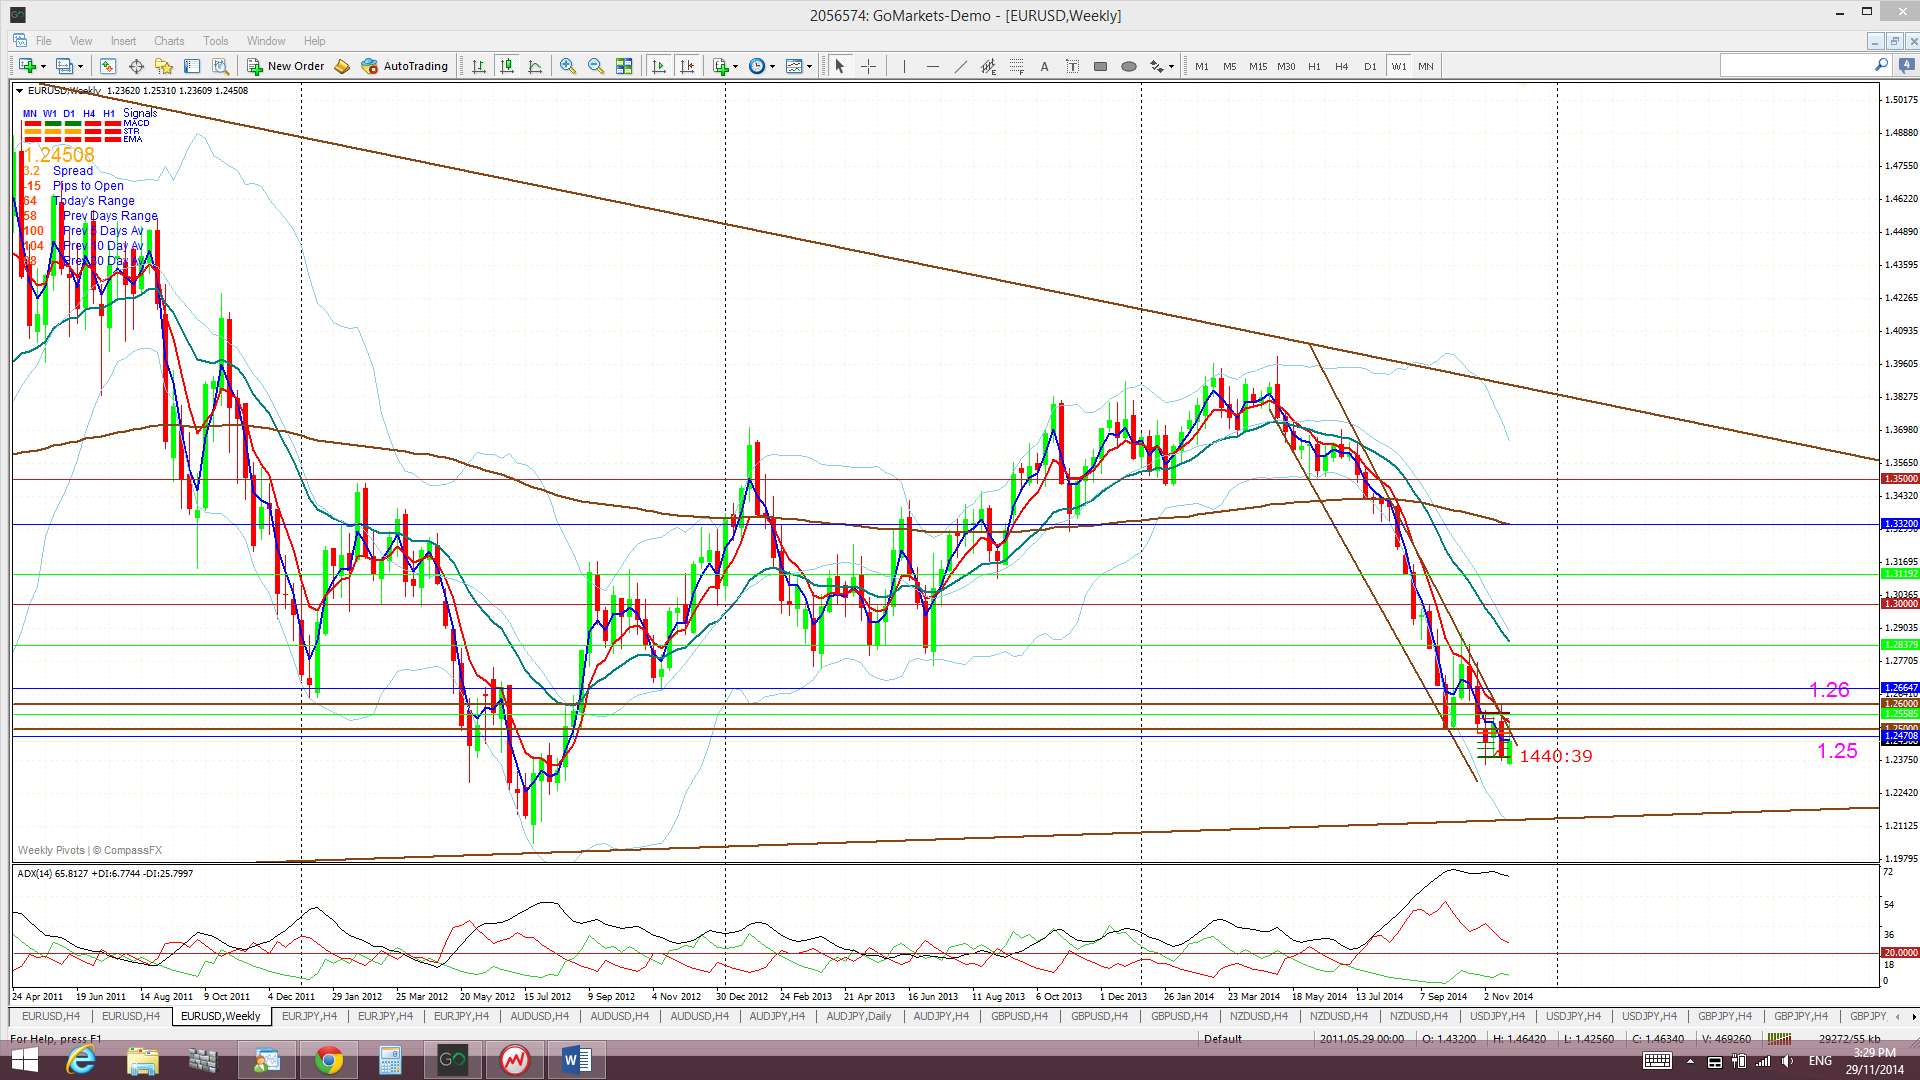
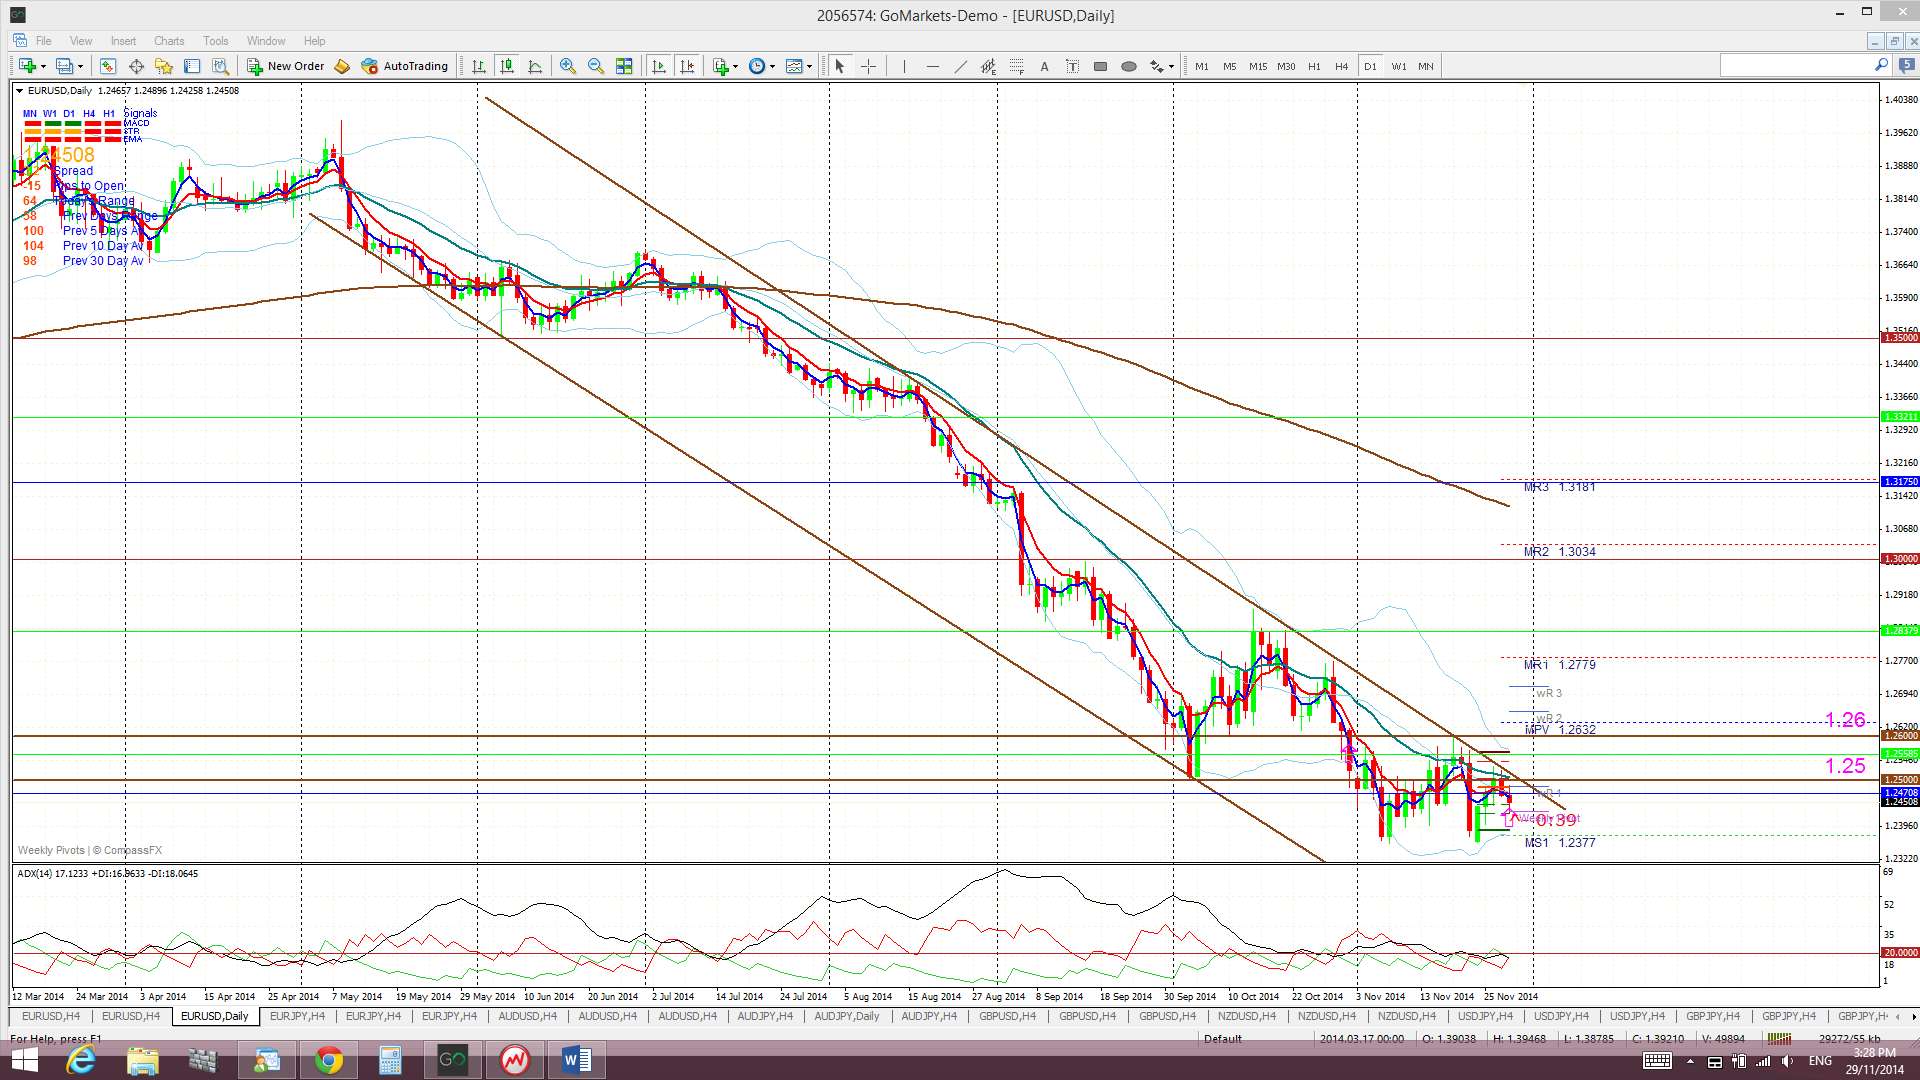
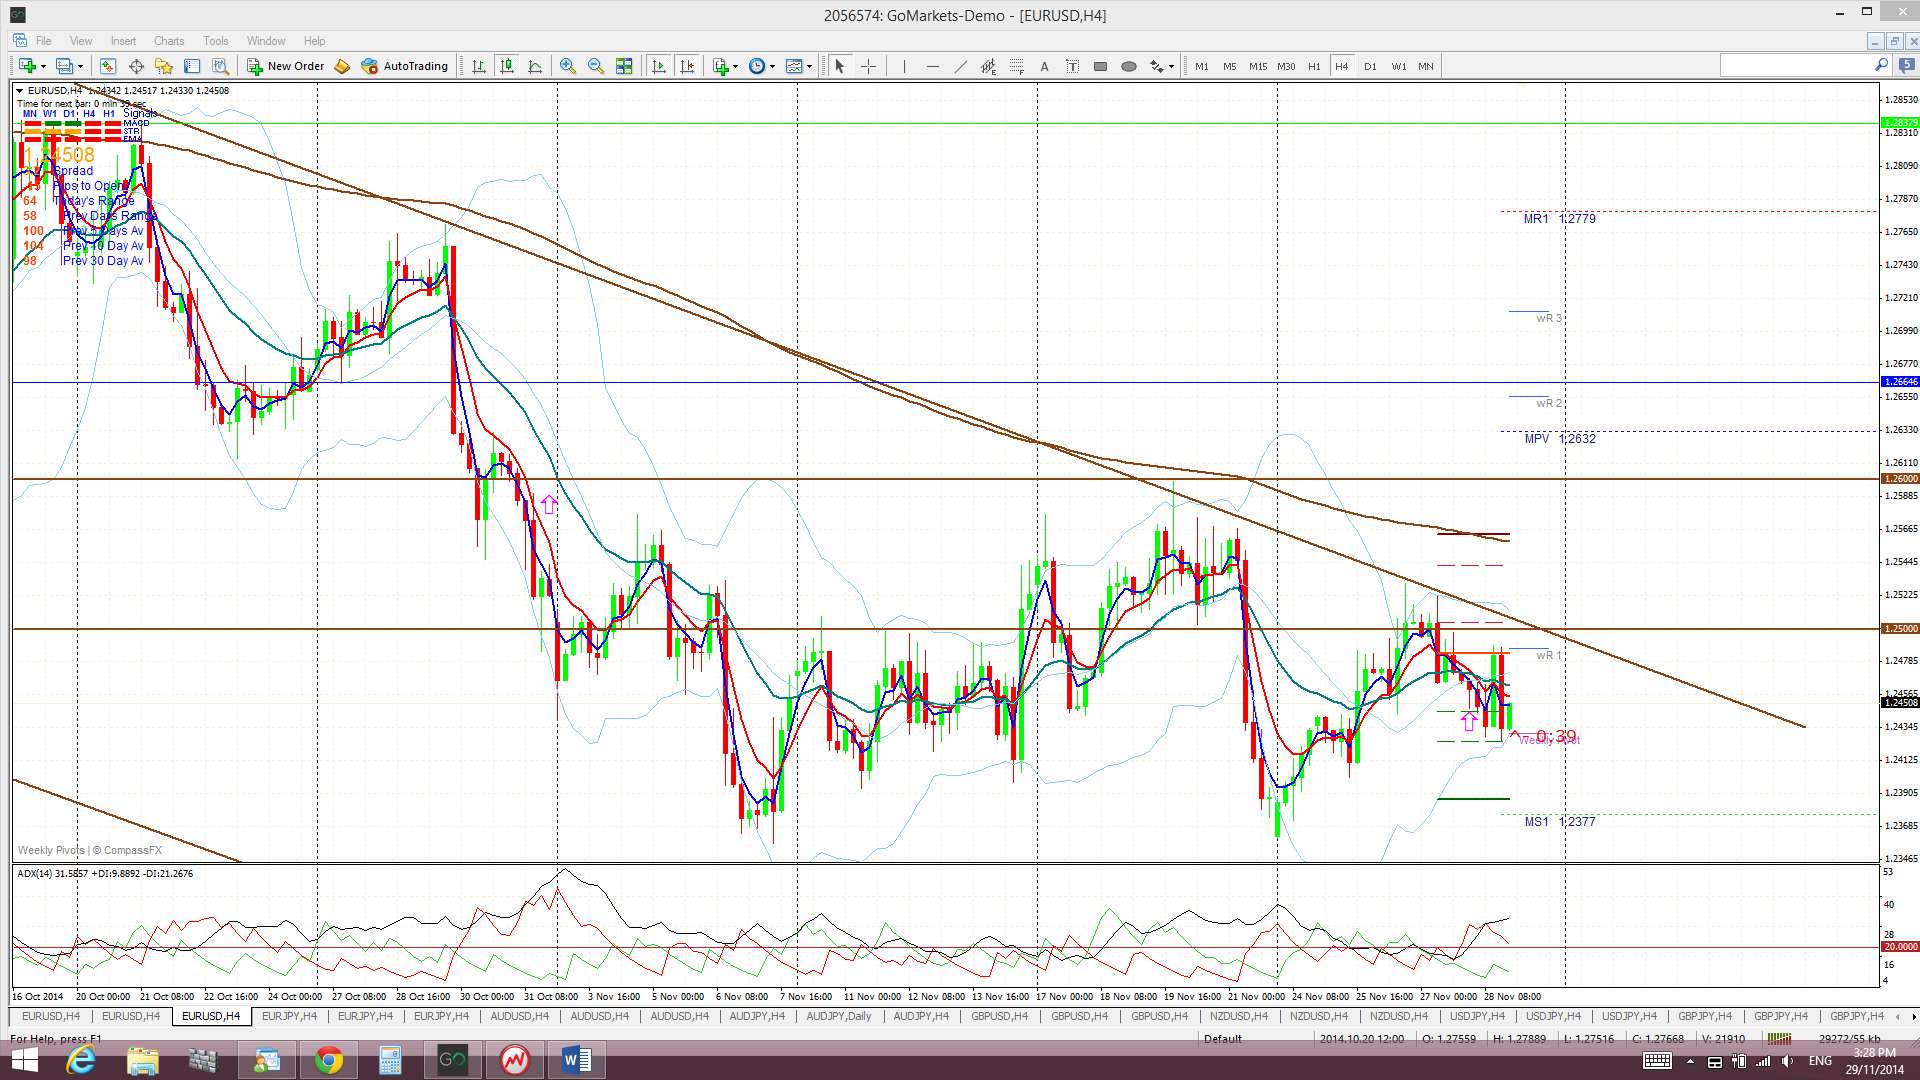
E/U: The E/U bounced off recent lows last week and traded up to close back above the 1.25 level by Thursday. This bullish move brought price back to trade just under the bear trend line of the daily chart’s descending trading channel. The USD picked back up steam towards the end of the week though and this put pressure on the E/U. It bounced down from this trading channel trend line in a move that triggered a new TC signal. This signal is slightly in profit but I’m cautious given the current state of the USD index and the fact that the weekly E/U candle printed a bullish-reversal ‘Inverted Hammer’.
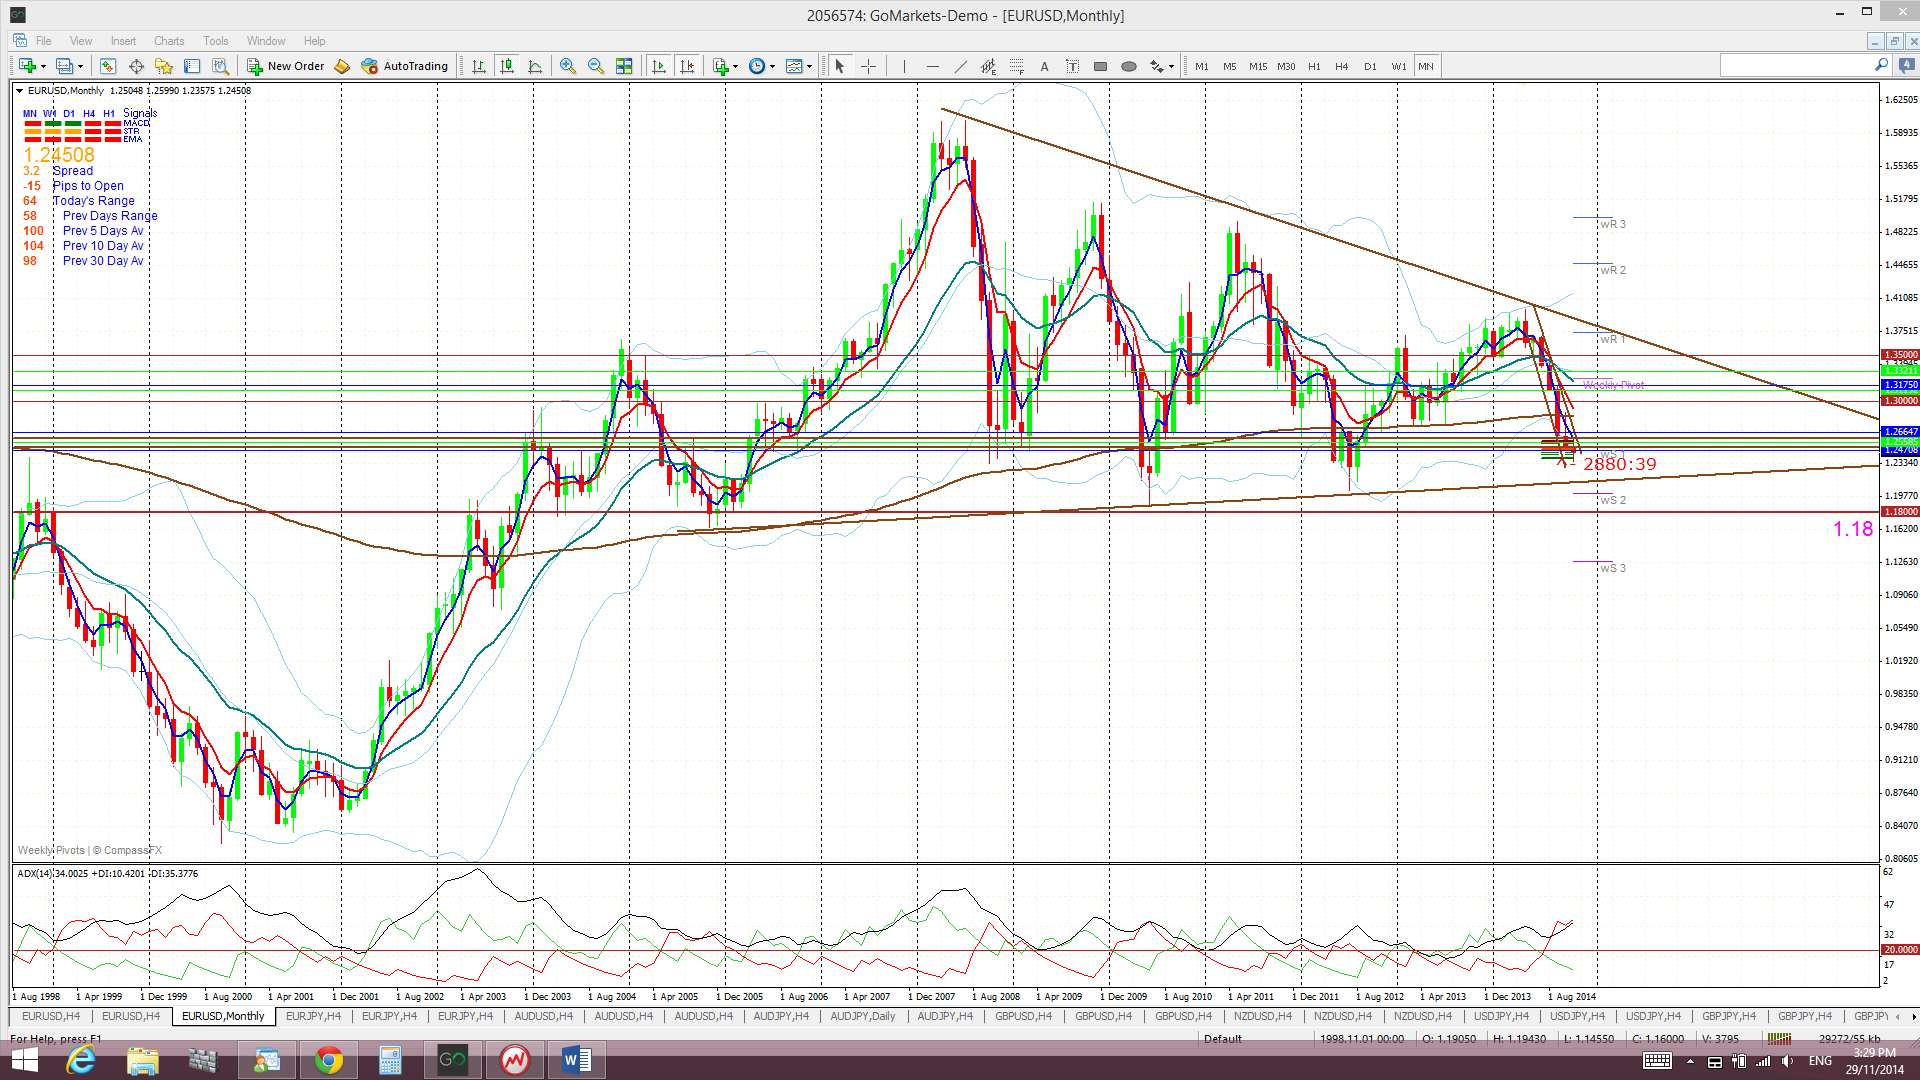
It is worth remembering that this daily chart descending trading channel is set within a bearish descending triangle pattern on the larger scale monthly chart.
Descending triangle on the monthly chart: the descending triangle pattern is a bearish continuation pattern and has a base at around the 1.18 level. The height of this triangle is about 4,000 pips. Technical theory would suggest that any bearish breakdown of this triangle below 1.18 might see a similar move. It is worth noting that this would bring the E/U down near 0.80 and to levels not seen since 2000/2001!
Price is trading below the Ichimoku Cloud on the 4hr, daily, weekly and monthly charts which is bearish.
The weekly candle closed as a bullish, almost ‘Inverted Hammer’ candle suggesting some bullish reversal potential. The monthly candle closed a bearish coloured ‘Spinning Top’ though reflecting the indecision here.
- There is an open TC signal on this pair BUT I am cautious here given the bearish-reversal signal from the weekly USD candle AND the bullish-reversal candle printed on the E/U.
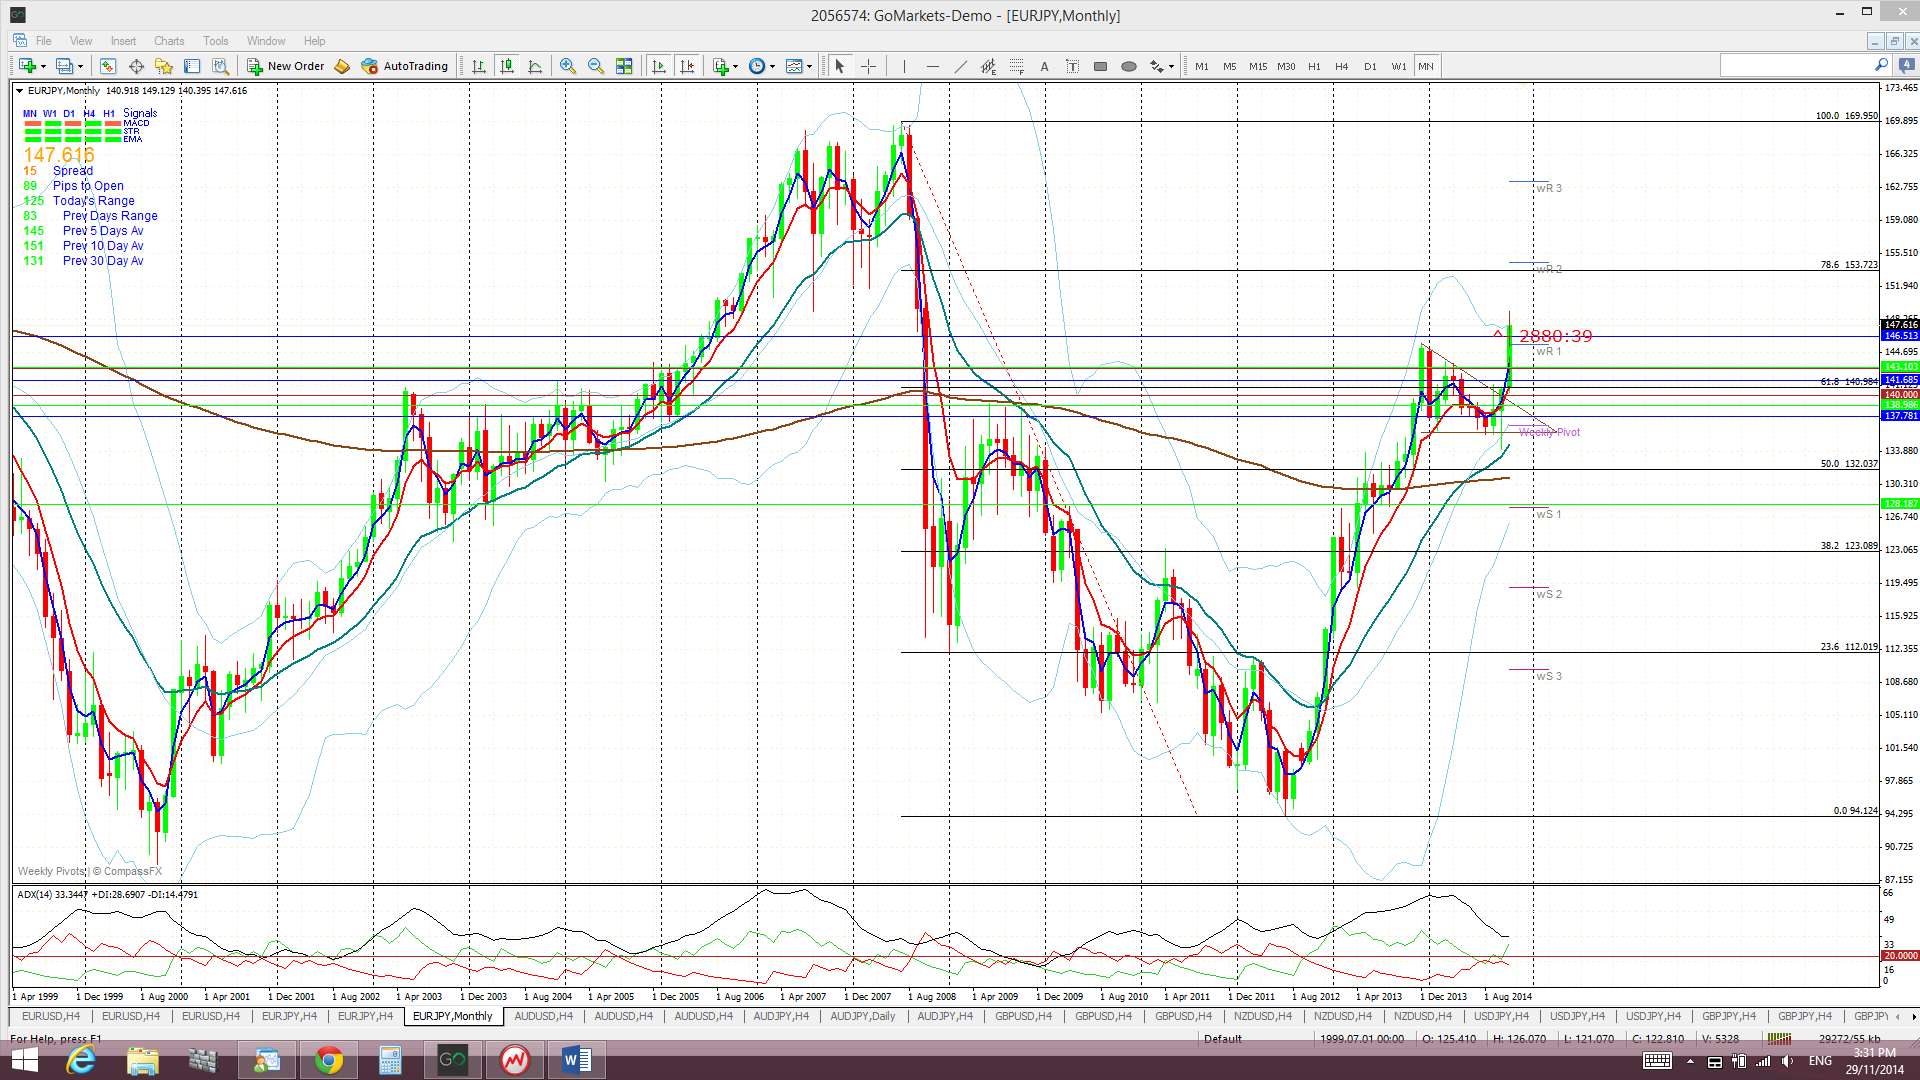
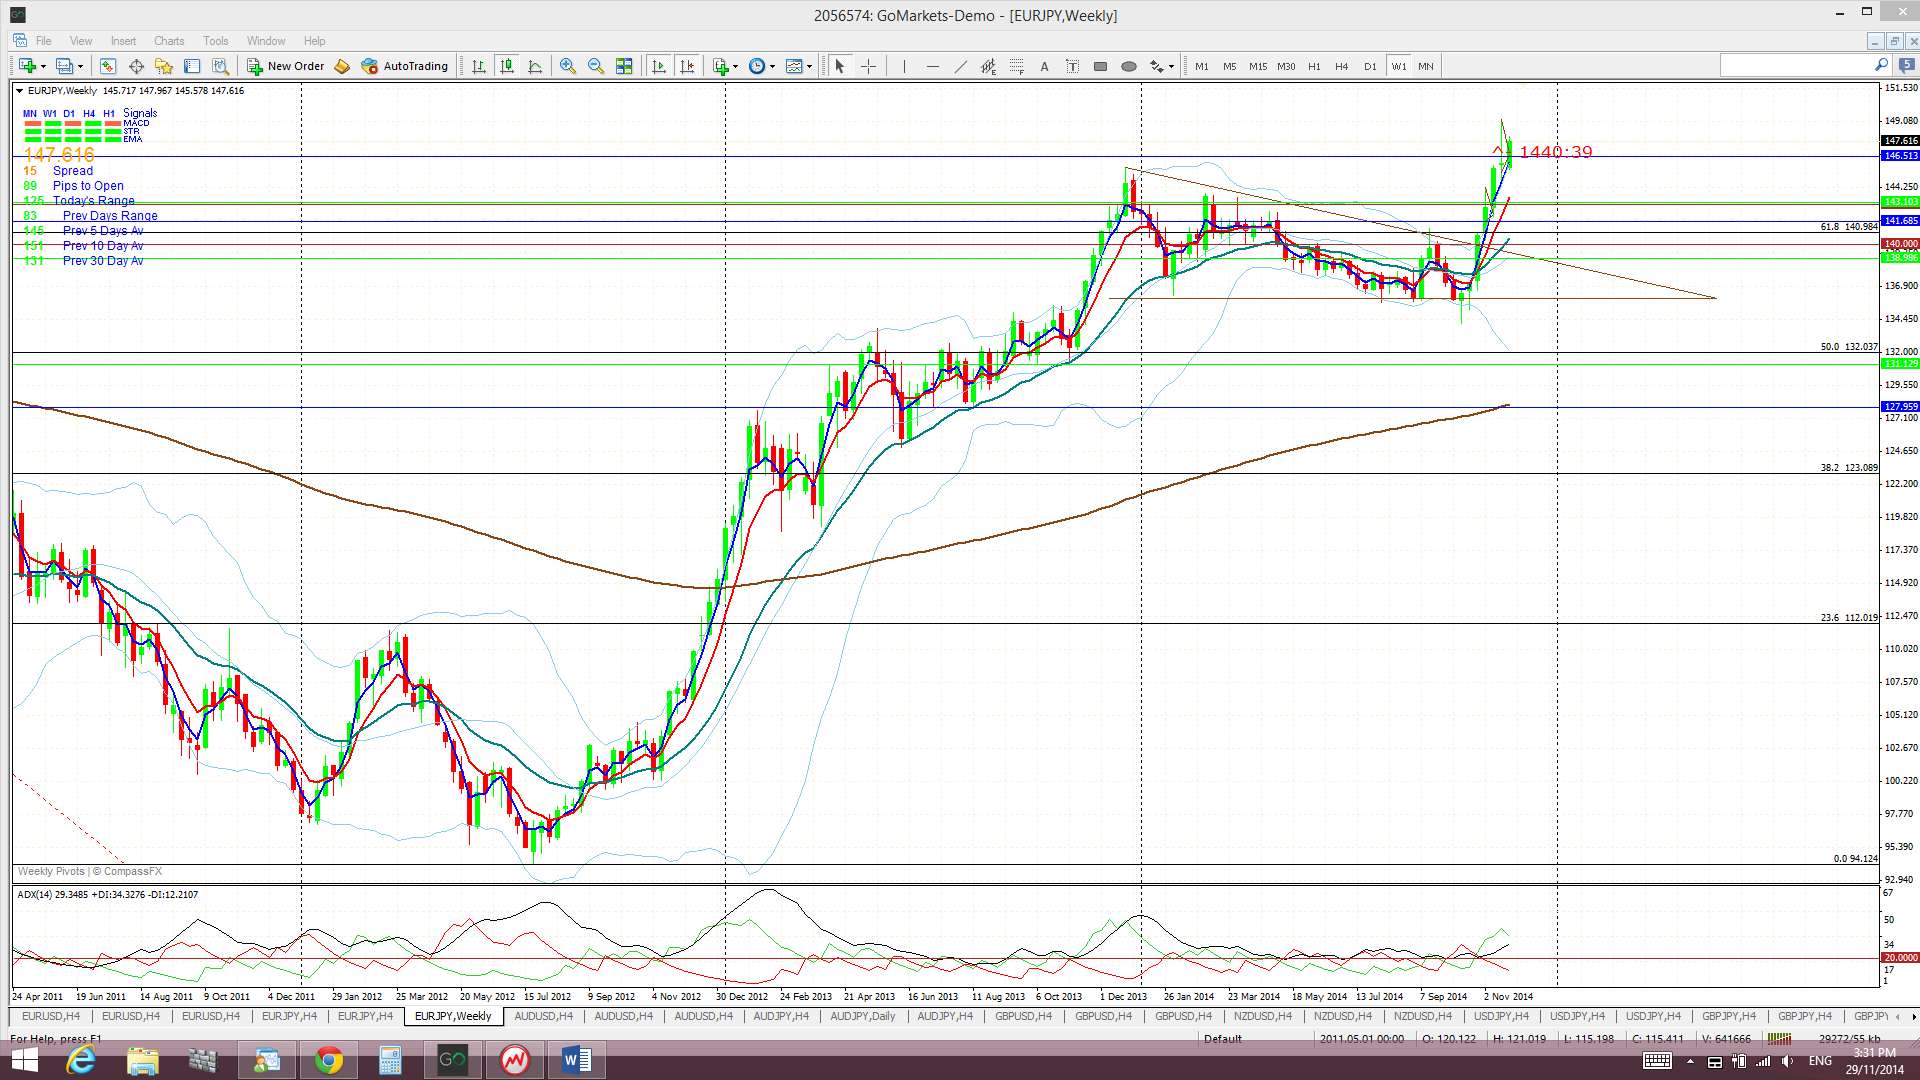
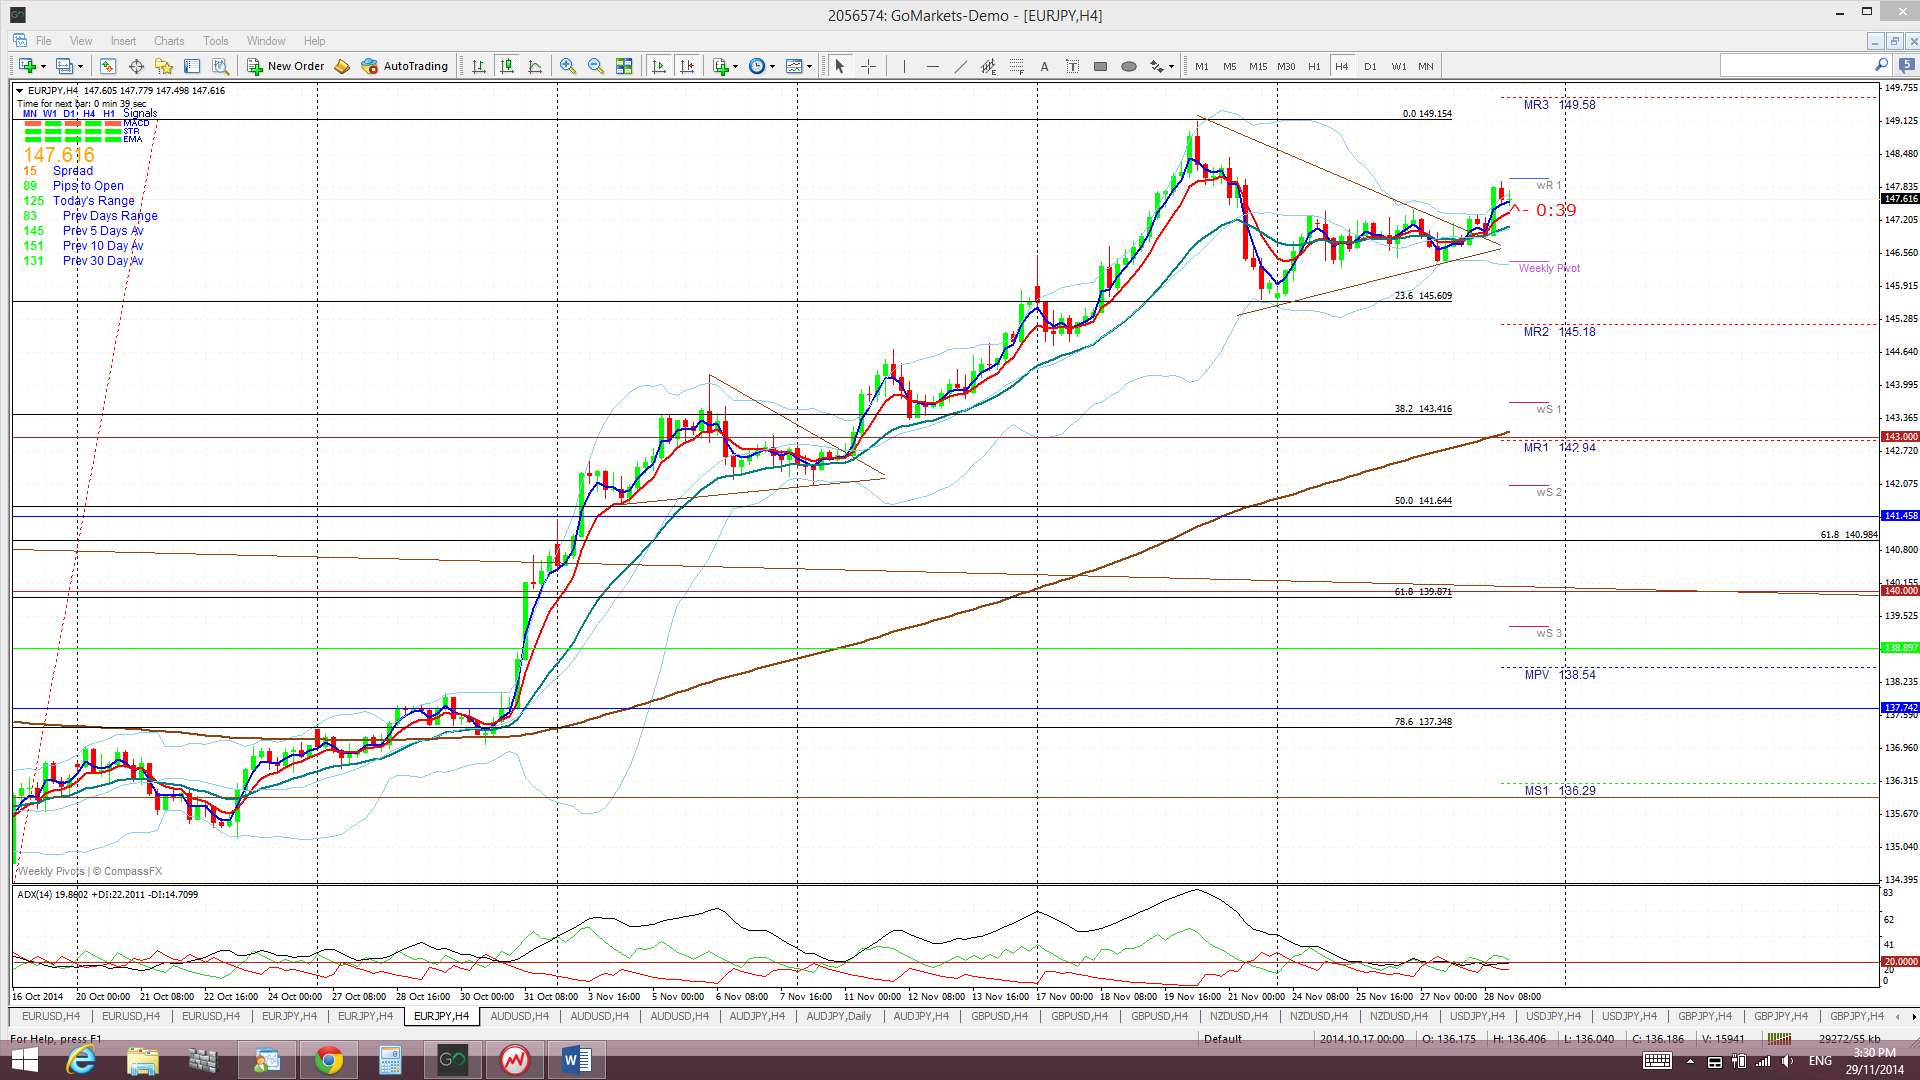
E/J: The E/J consolidated within a triangle pattern for most of last week. It appeared to make a bullish breakout on Friday BUT this move didn’t come with much momentum and so I consider it rather suspect. Having said that though, any close above the recent high near 149 would have me looking for a continuation move up to the 78.6% fib near 154.
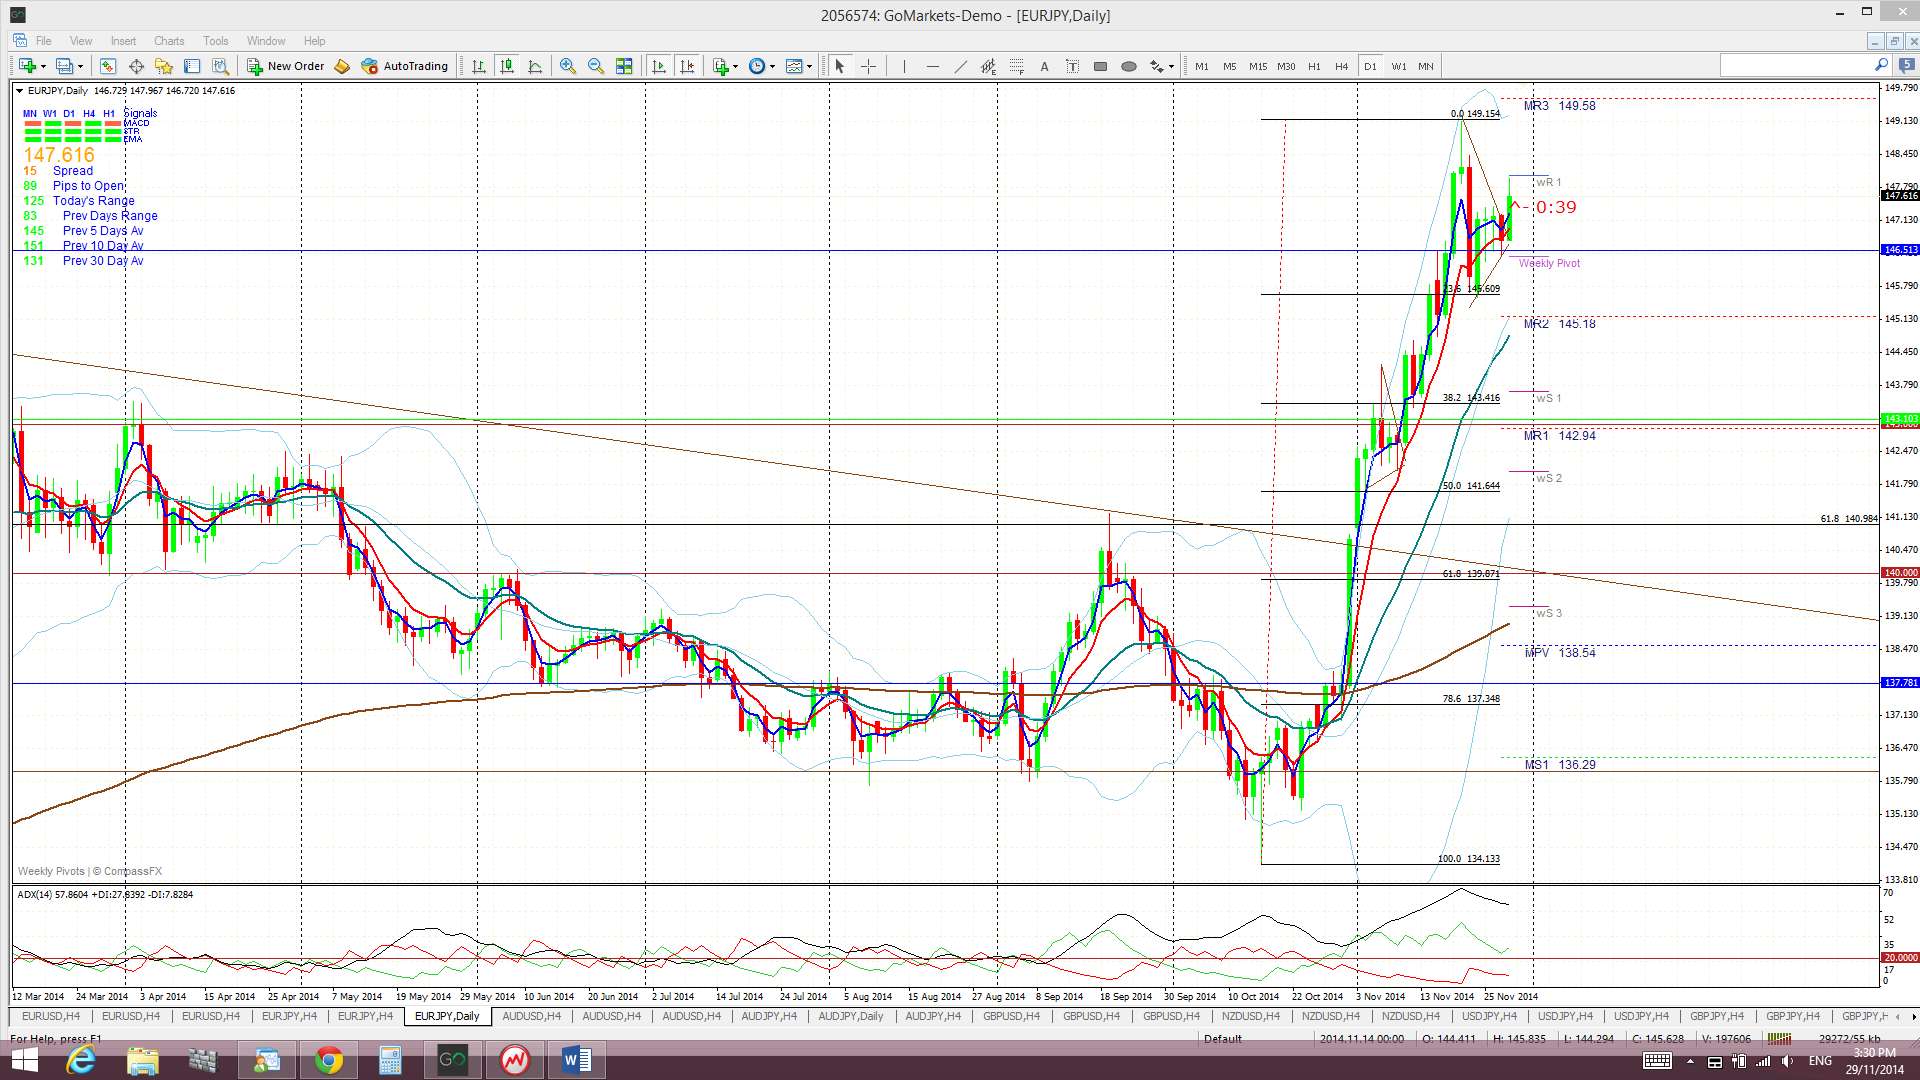
The E/J had already pulled back to the 23.8% fib but this bearish move could continue. Other possible bearish targets could be:
- The 38.2% fib near the key 143 level.
- The 50% fib near the daily 200 EMA circa 141.5.
- The 61.8% fib near the key 140 level. This level is also near the trend line from the previous weekly chart’s triangle breakout and it is near the 61.8% fib of the monthly charts major bear move. Thus, there is a lot of confluence in this region.
Price is still trading above the Cloud on the 4hr, daily, weekly and monthly charts however which is bullish. The November and December candles were the first to close above the resistance of the monthly Ichimoku Cloud since 2008. Check out the monthly Cloud chart below. The E/J made its last break back above the Cloud in 2003 and the consolidation pattern following that breakout is very similar to the consolidation we’re seeing now. Note how, back then, price eventually rallied and I wonder if history will repeat itself here?
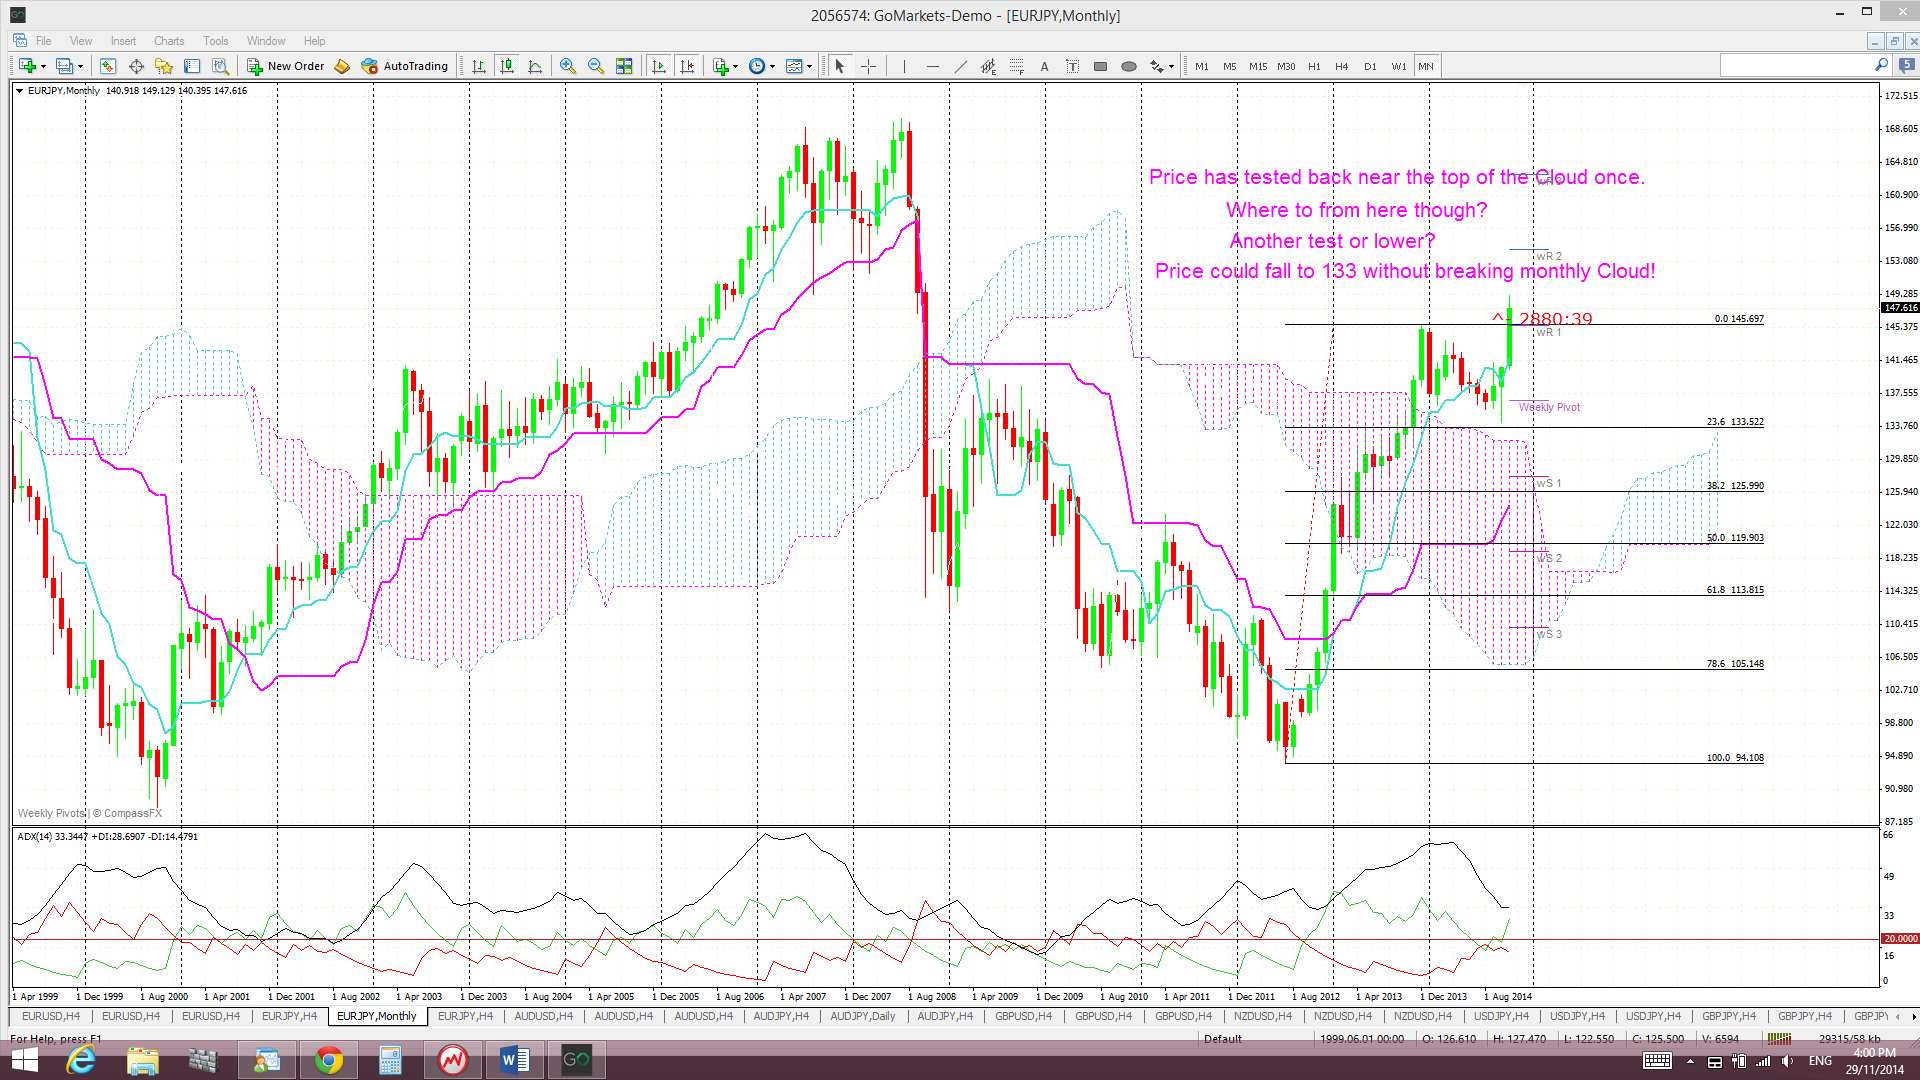
The weekly candle closed as a bullish coloured candle as did the monthly candle.
- I’m watching for any new TC signal on this pair.
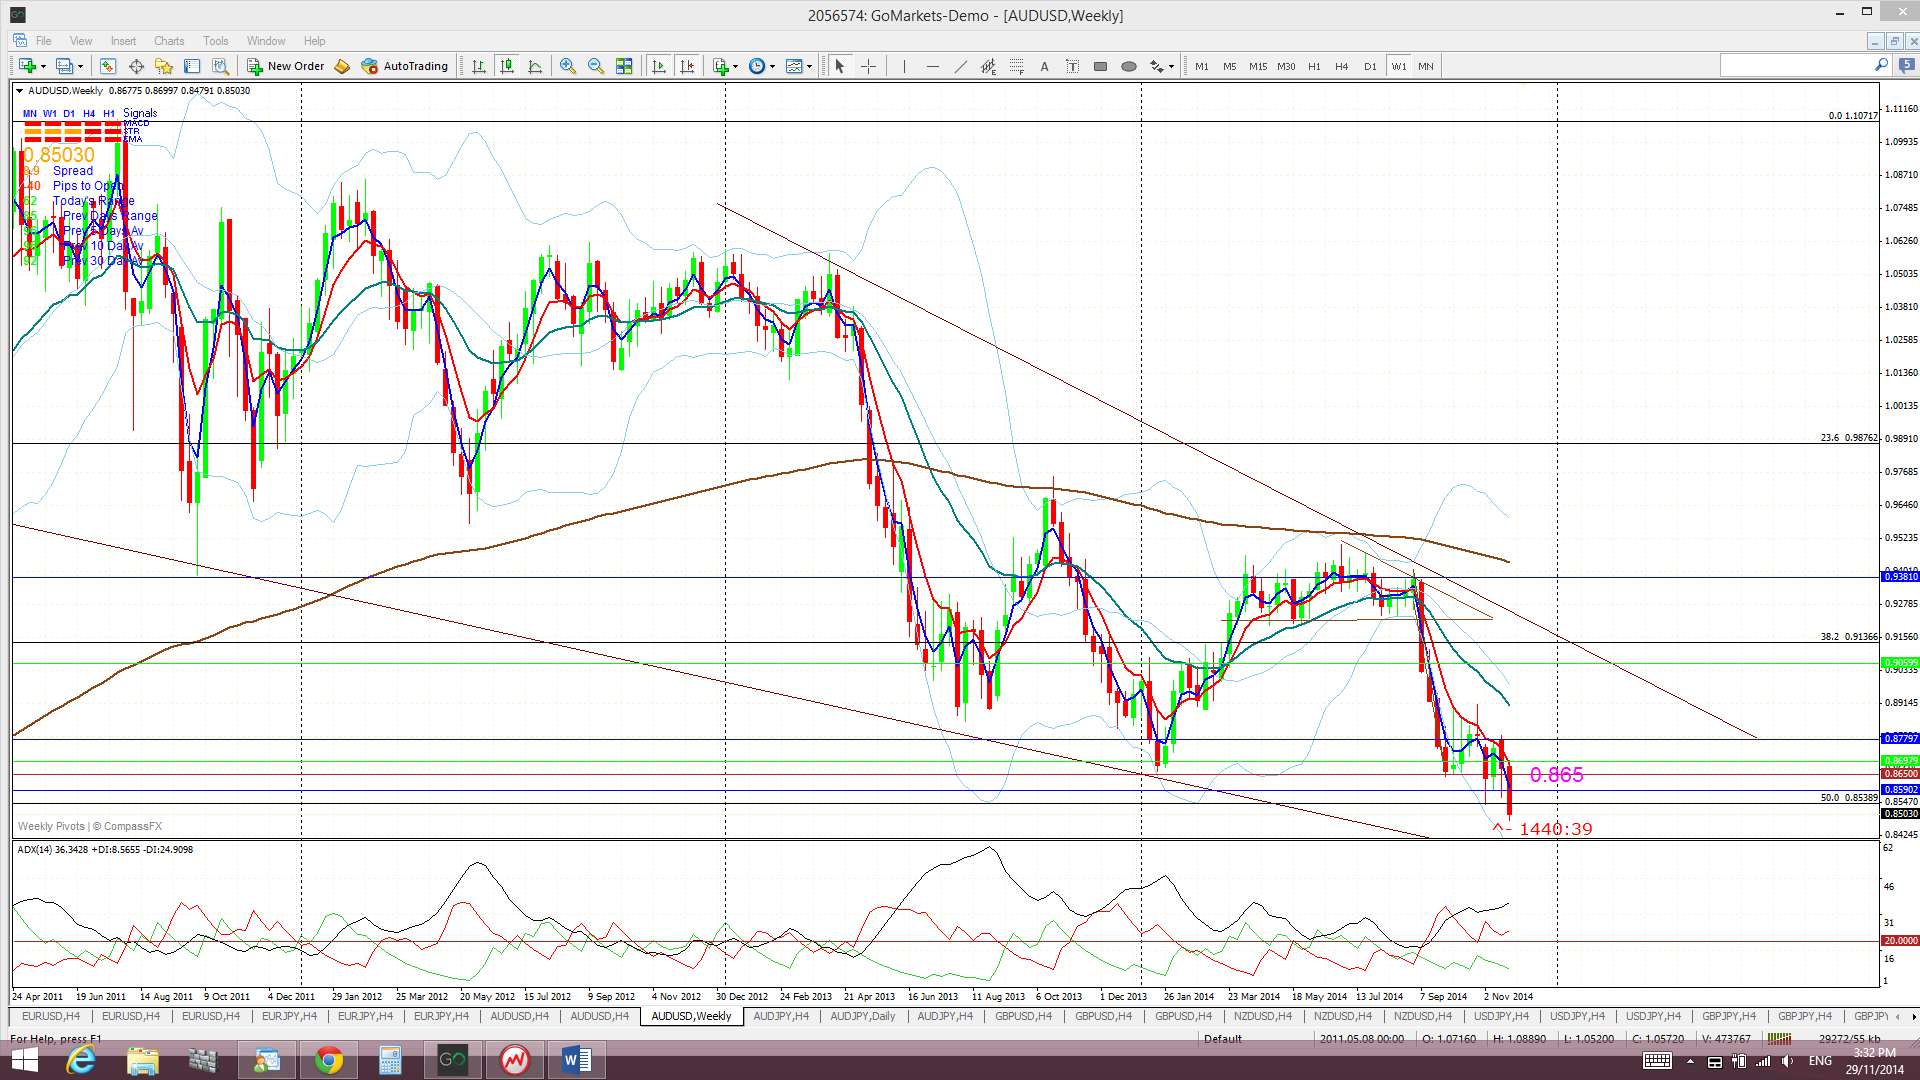
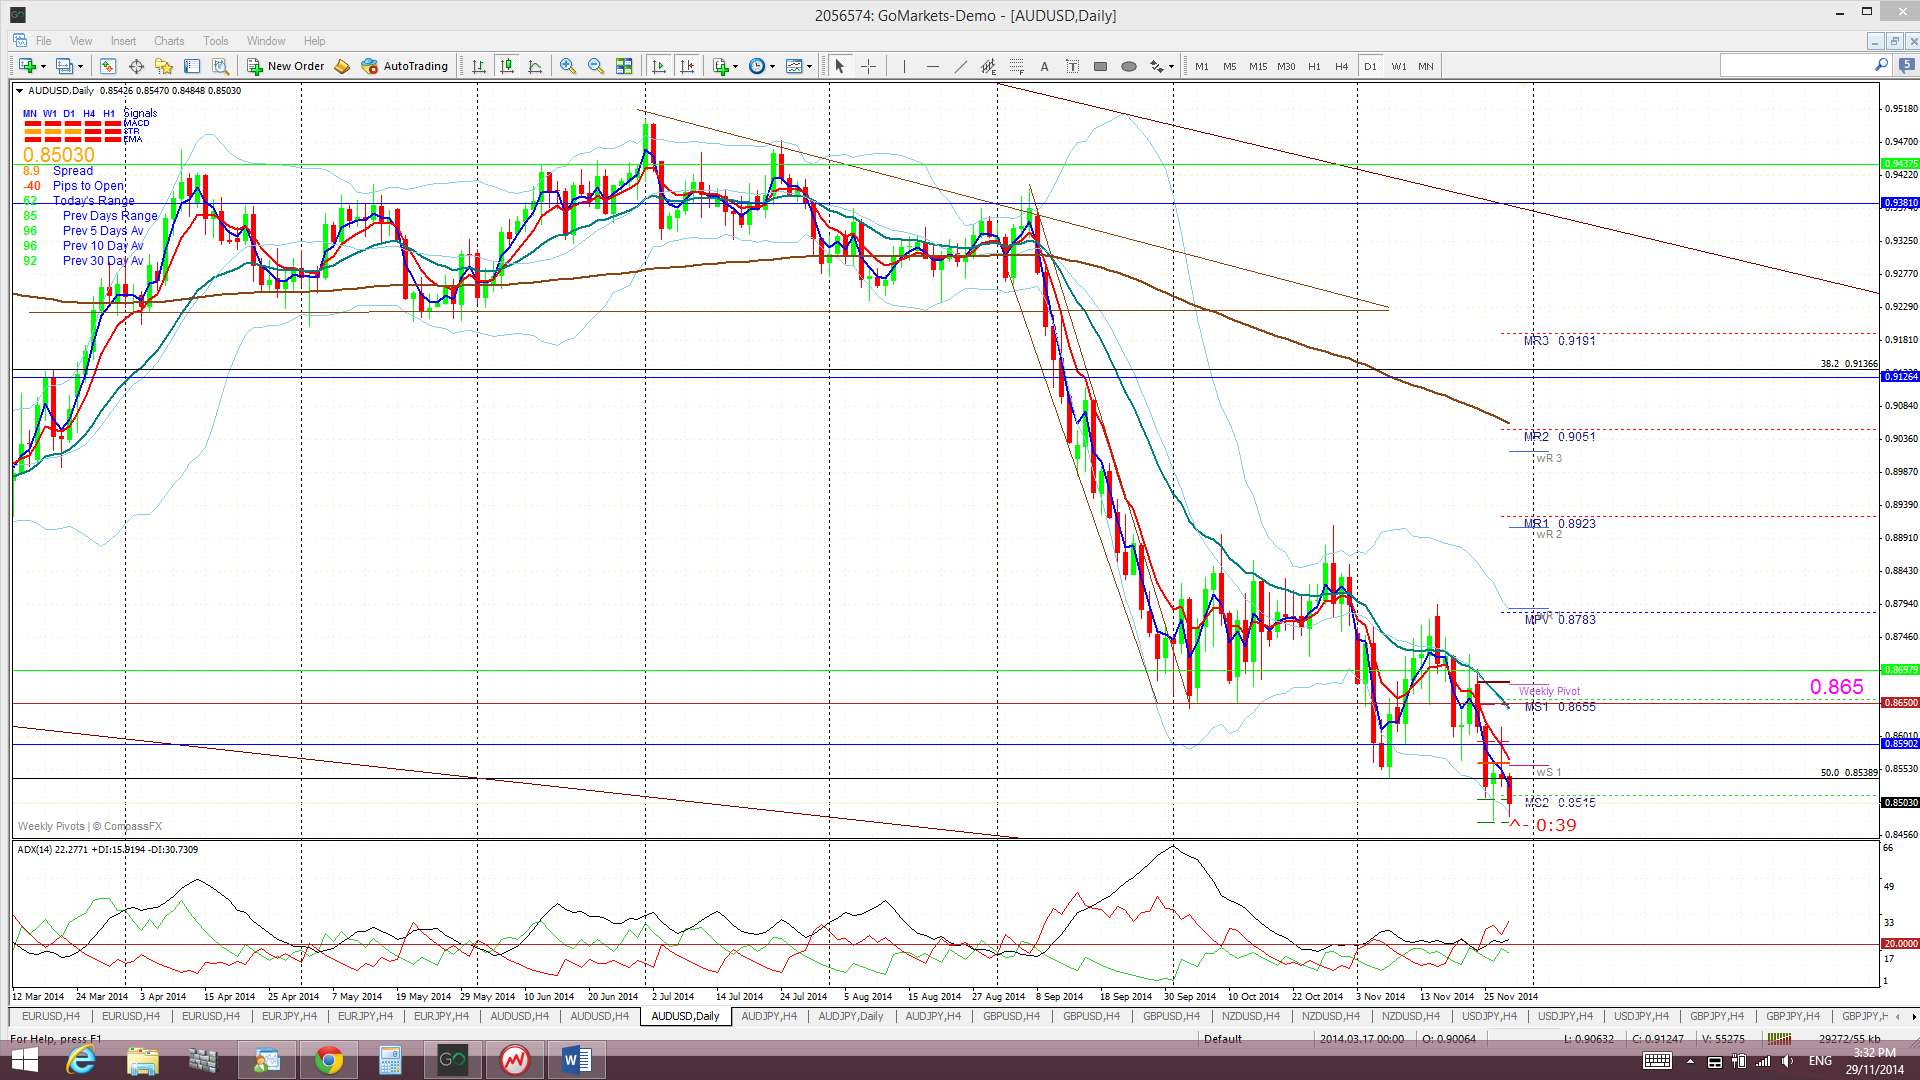
A/U: The A/U chopped lower last week and again fell back below key 0.865 support. The Aussie continued to fall and tested lower support from the combination of the 50% fib of the 2008-2011 bull run and the bottom of the monthly Ichimoku Cloud. Price closed below these levels on Friday and triggered a new TC signal BUT I’m still rather cautious given the recent bearish signal coming from the USD index.
Bear Flag? The Bear Flag is looking very messy but the 0.865, monthly 50% fib and bottom of the monthly Cloud remains as key support levels to watch. A break and hold below these three support levels would suggest the Bear Flag move might be back in contention. Price has broken these support levels BUT I will watch next week to see if this breakdown holds, especially given the bearish signal just printed on the USD index. The ‘Flag Pole’ for any A/U Bear Flag has a height of about 630 pips. Thus, the expected move for any bearish breakdown is expected to be of about 630 pips as well. This projects a bearish target down near the 0.80 level. This is significant as this is also the 61.8% pull back for the 2008-2011 bull run.
Price is trading below the Cloud on the 4hr, daily, weekly charts and monthly charts which is a significant bearish development. The close below the monthly Cloud and 50% fib of the 2008-2011 bull run is a very bearish development. However, any reversal with the USD index would support the Aussie.
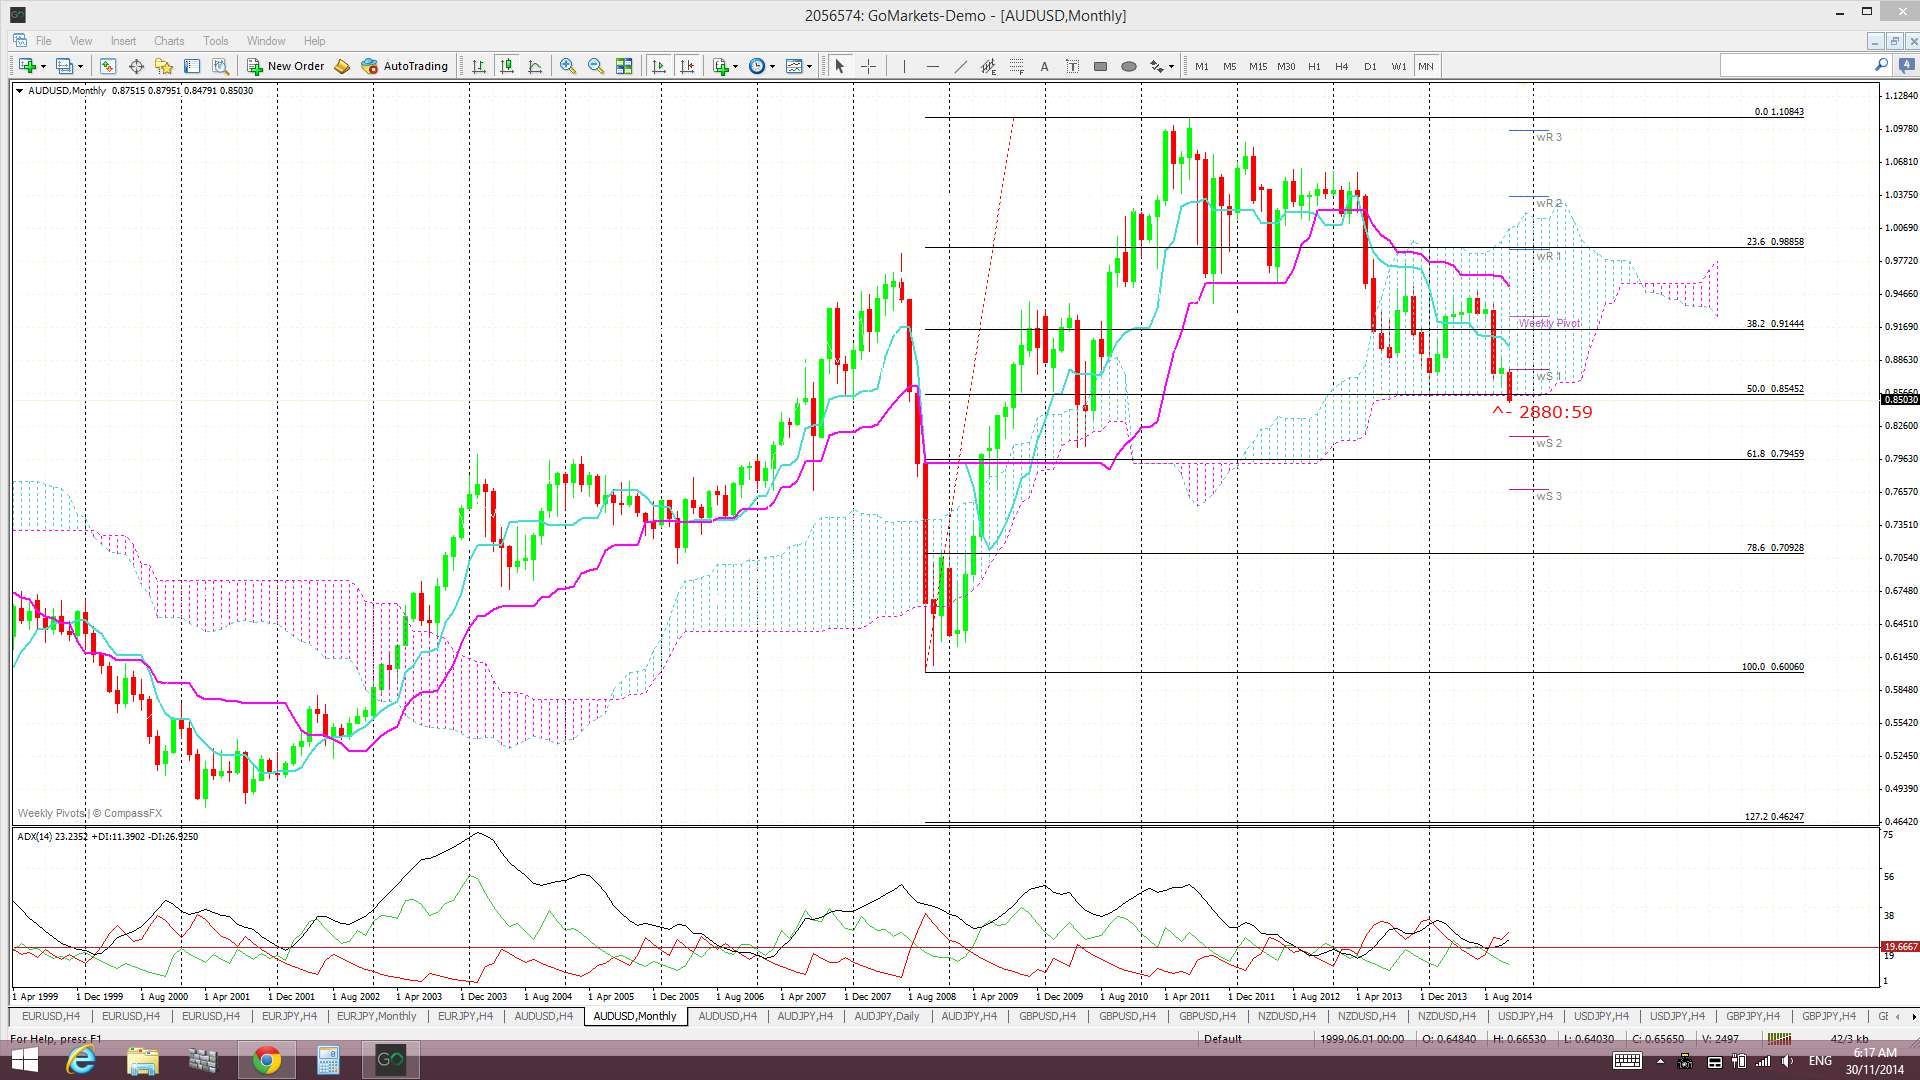
The weekly and monthly candles closed as large bearish candles.
The monthly chart, however, continues to present as a bullish descending wedge.
- There is an open TC signal on this pair but I am cautious here given the bearish-reversal signal off the weekly USD candle.

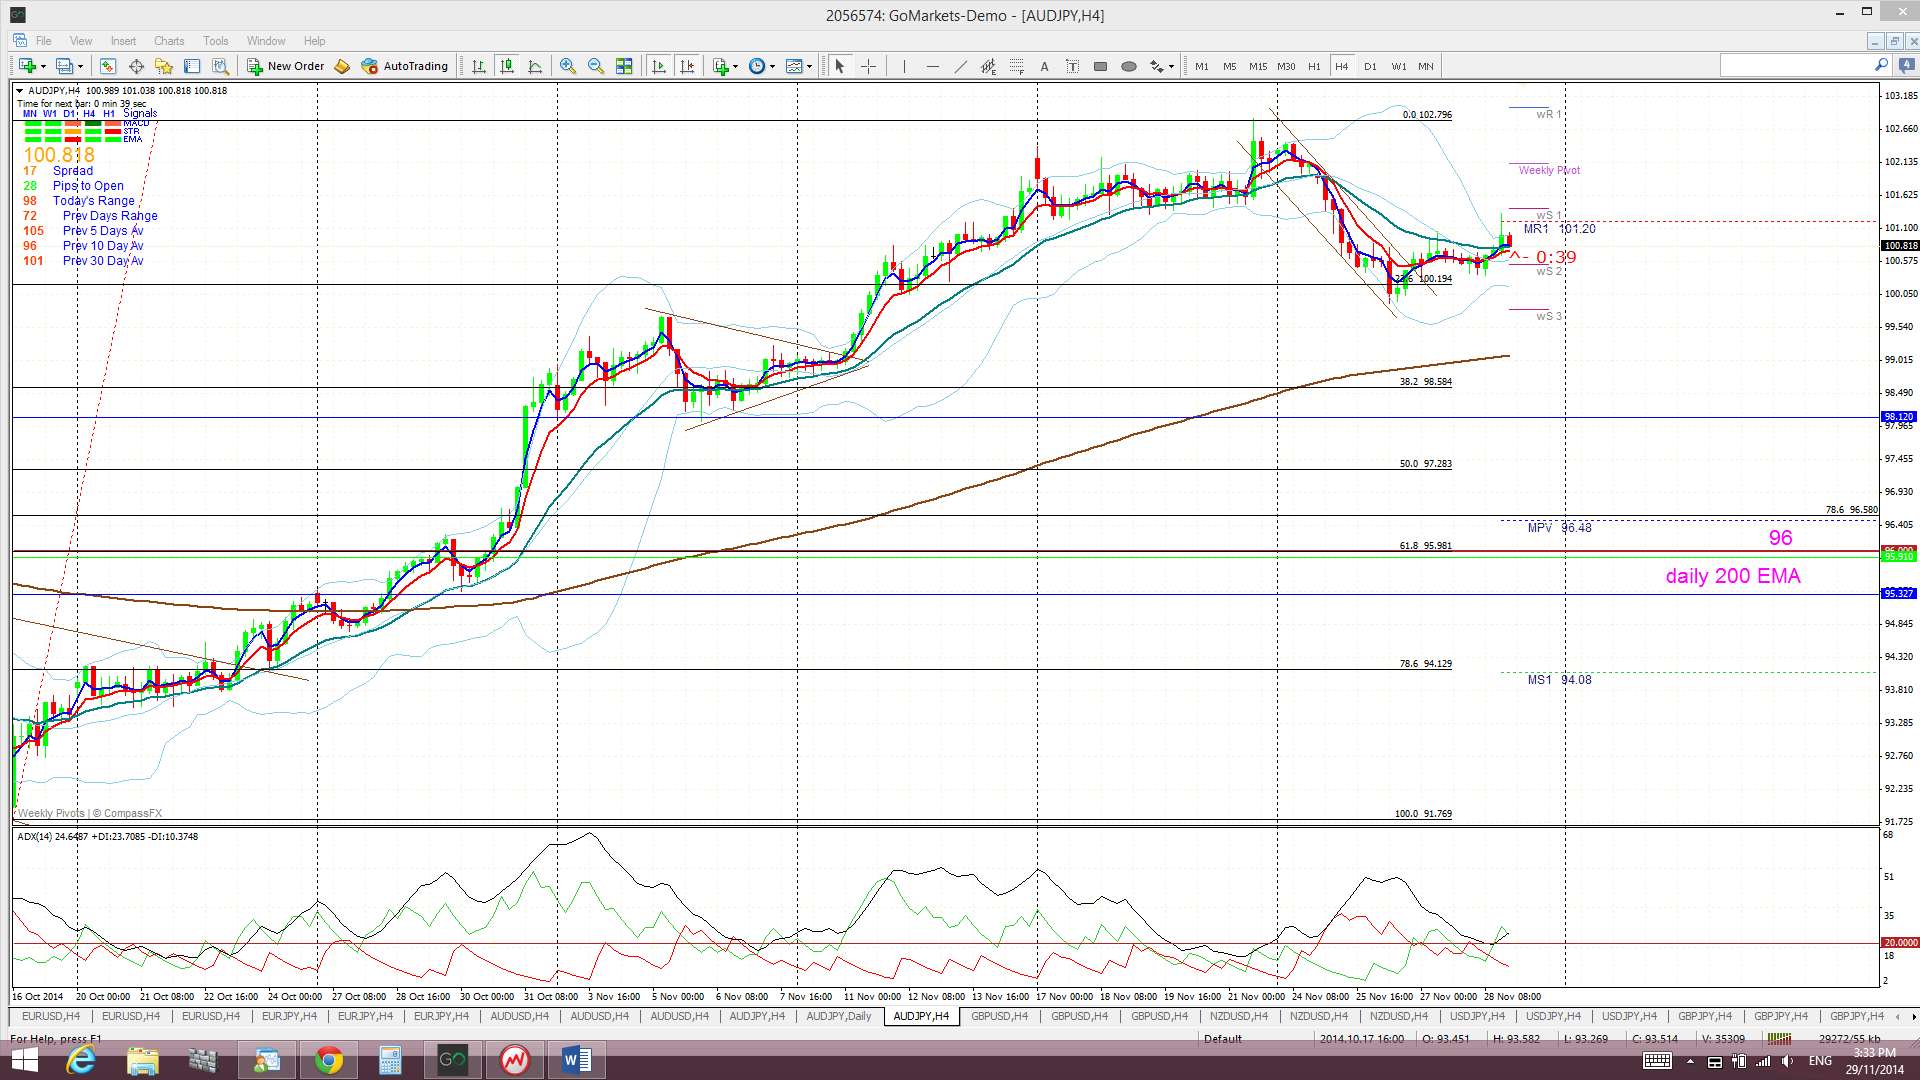
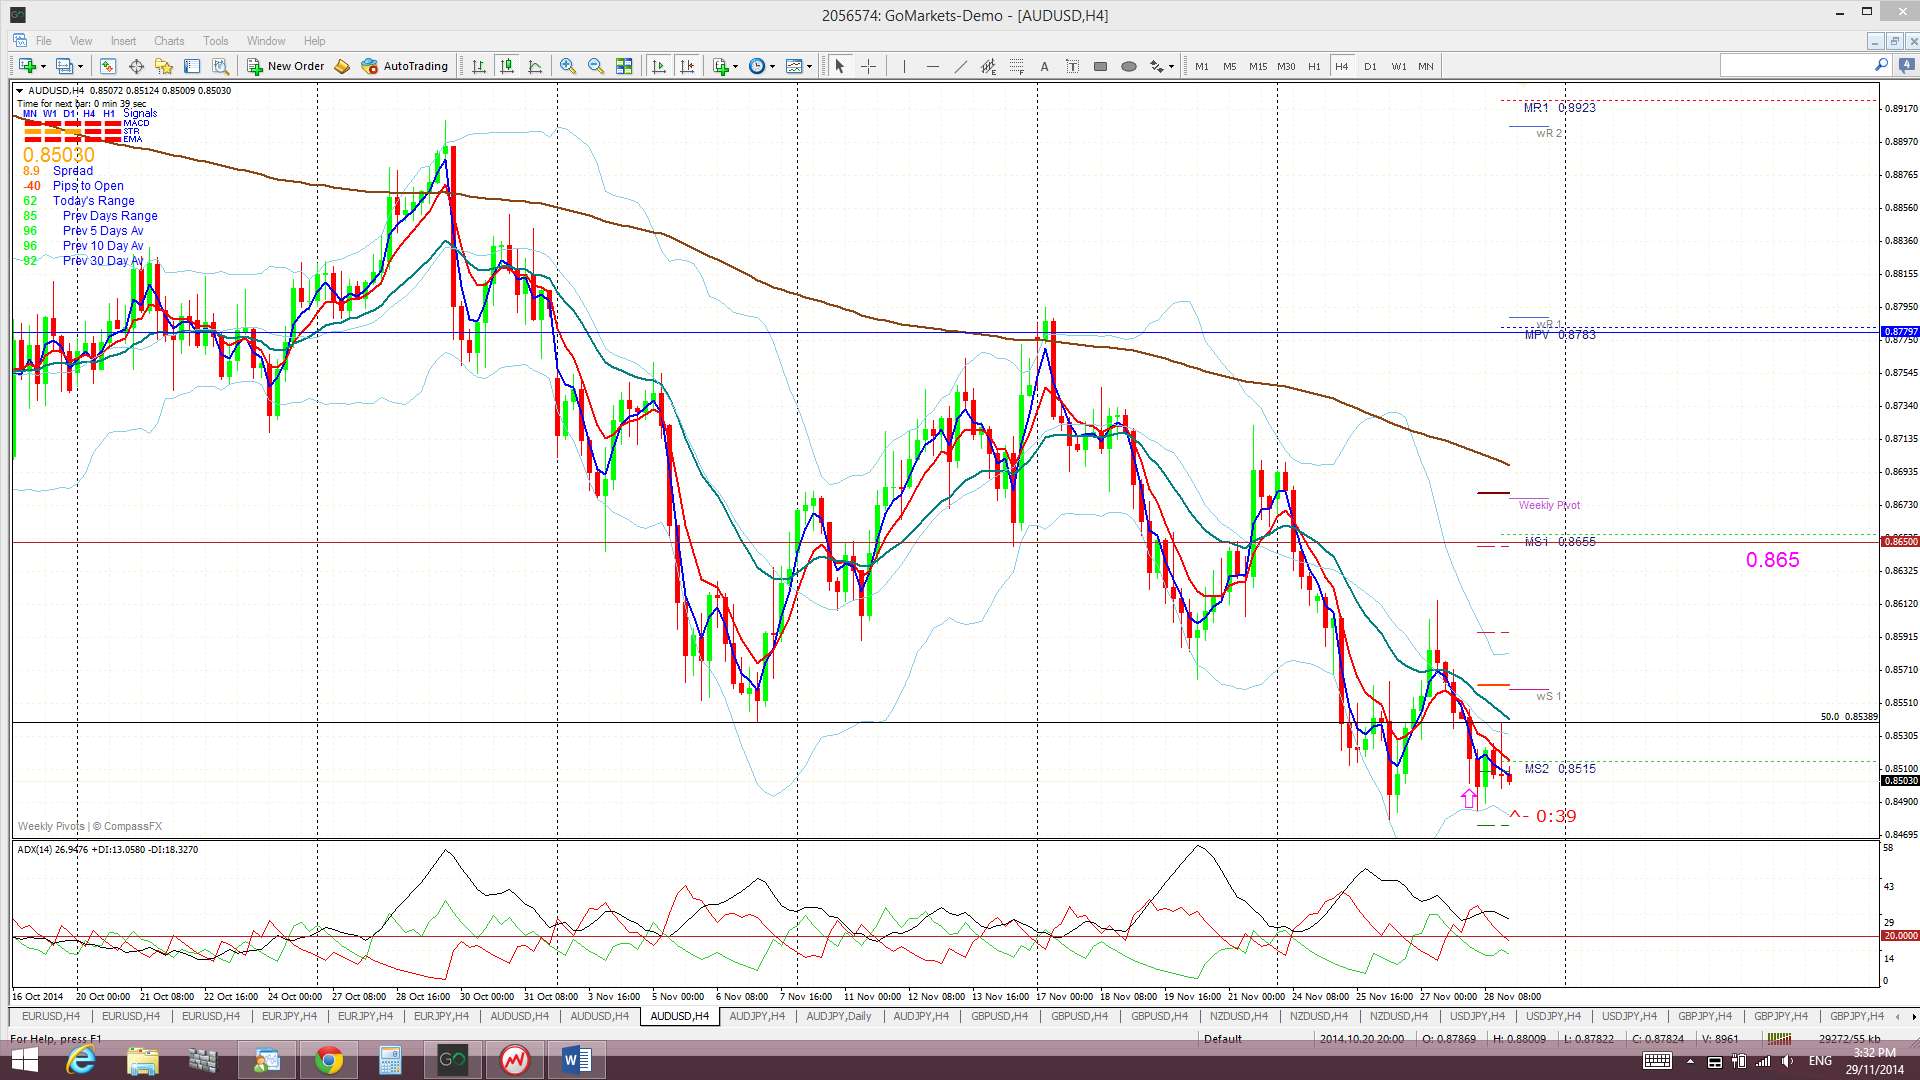 A/J: The A/J chopped lower last week but much of this move was mired in the 4hr Cloud. It pulled back to the 23.6% fib of the recent bull run but found support from this fib and from the bottom of the 4hr Cloud.
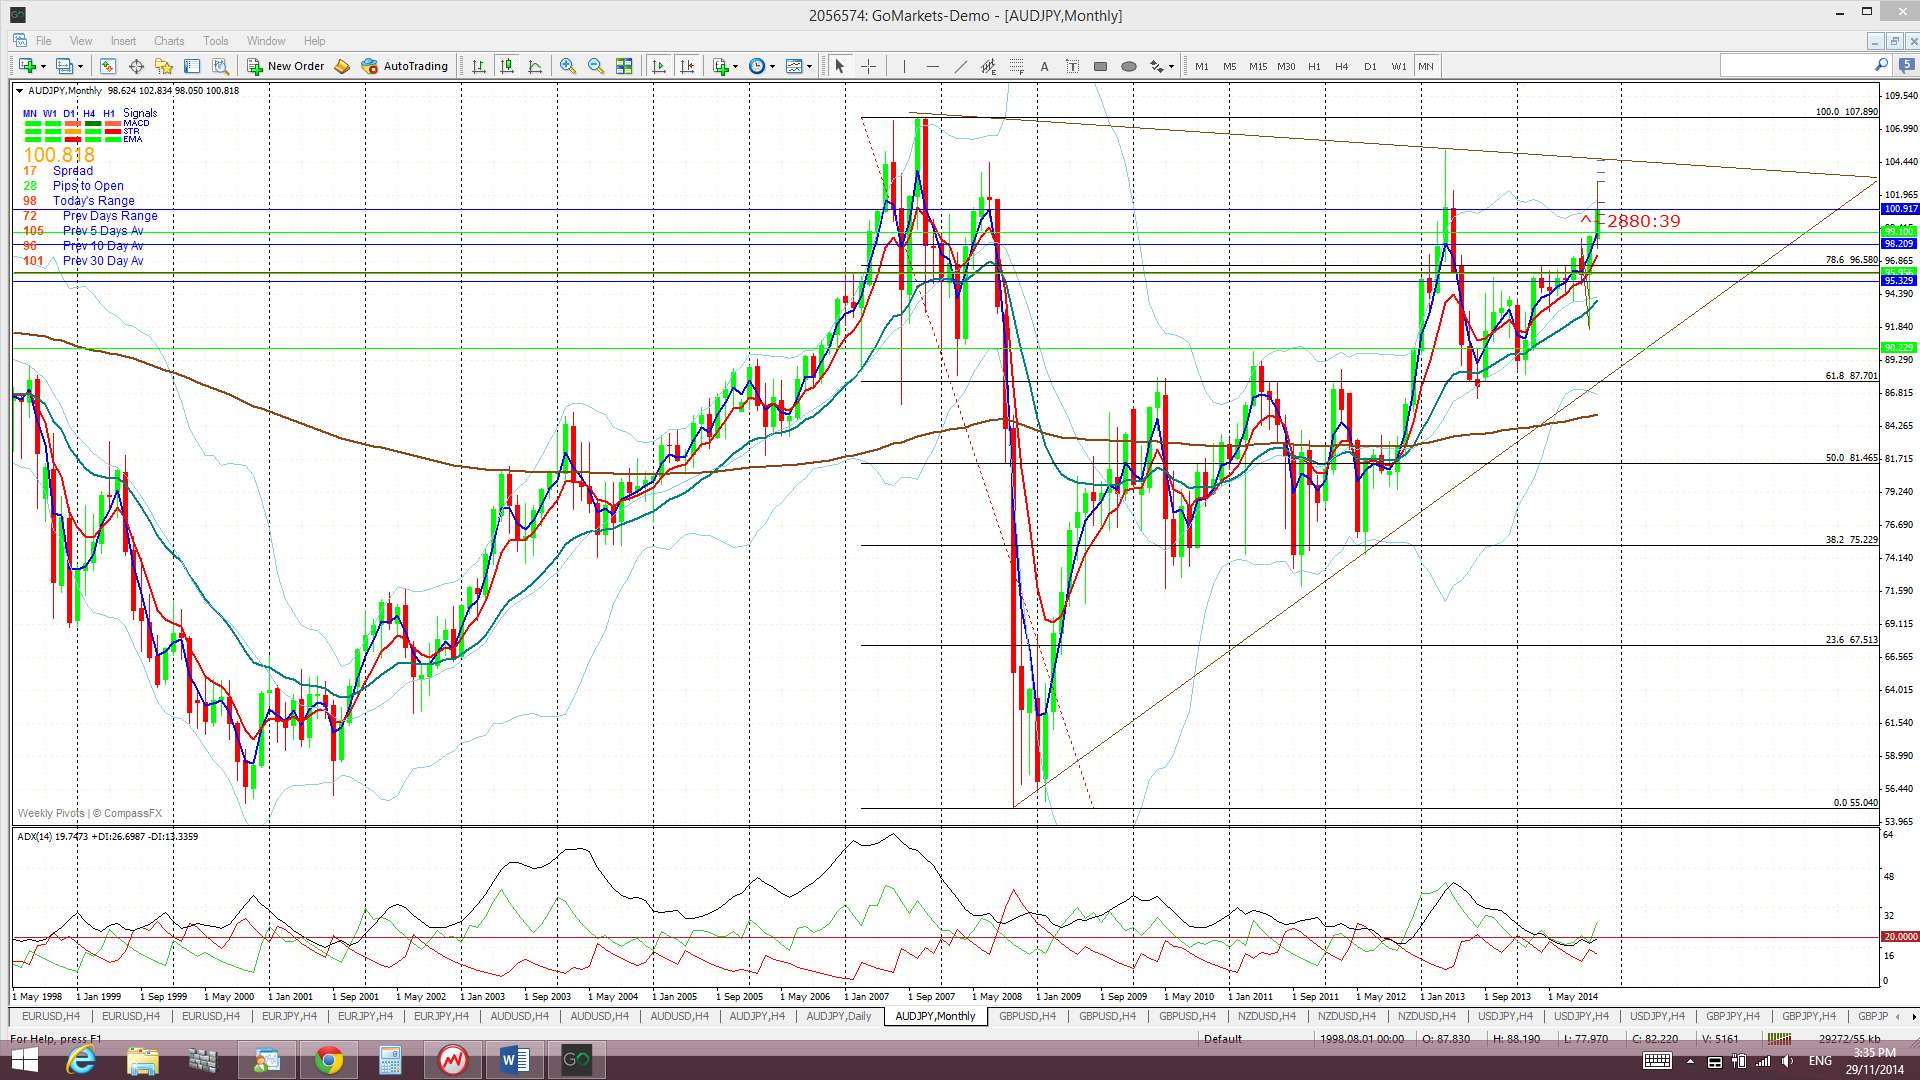
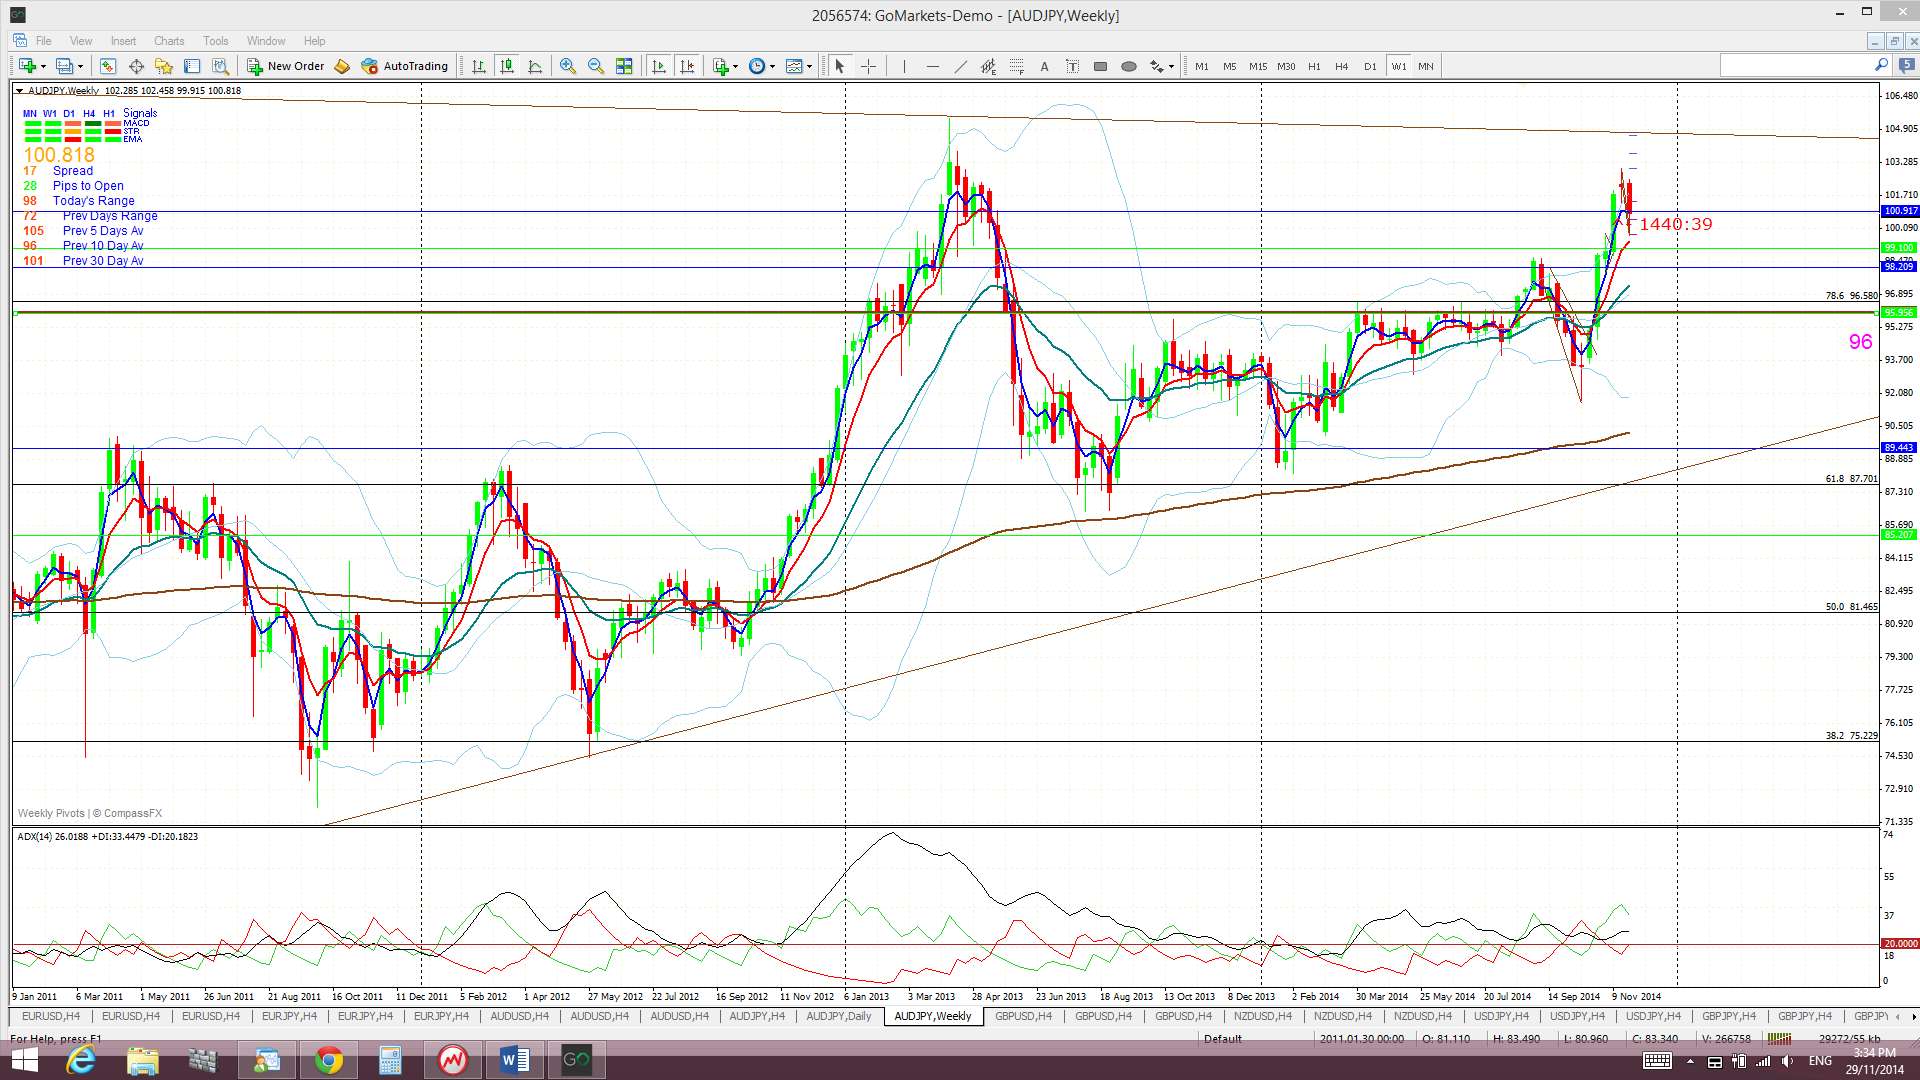
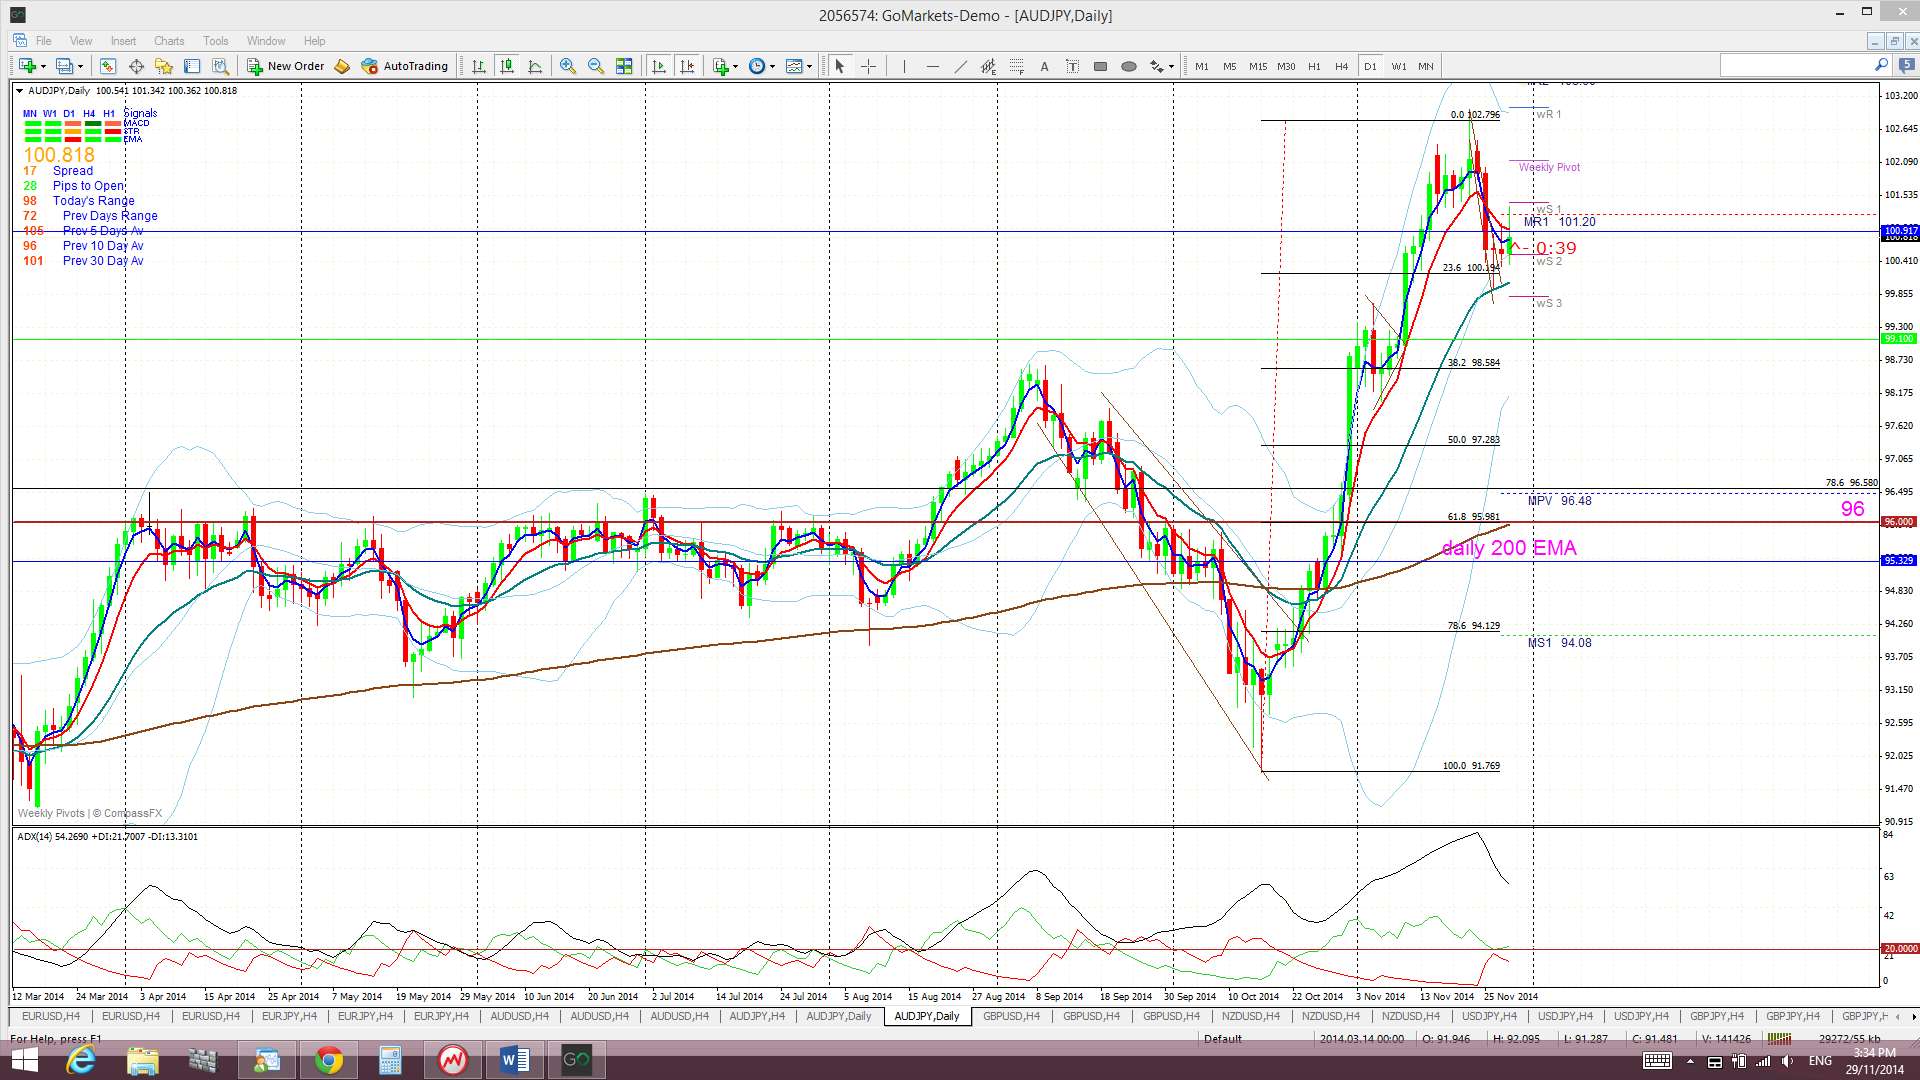
As mentioned over recent weeks, this pair is at a very interesting level. It is now about 400 pips below a major monthly triangle trend line and 700 pips or so below the previous 108 region high set back in 2007. The 2013 high was up at 105.42 and it could try to test this region again. Although, if there is to be any continued pull back, it is worth noting that a 61.8% fib pullback of the recent bull run would bring price back down to the key 96 S/R level.
Price is trading below the Cloud on the 4hr chart but above on the daily, weekly and monthly charts which is a bearish shift here.
The weekly candle closed as a bearish candle but the monthly candle was bullish.
- I’m watching for any new TC signal on this pair and back watching the 96 level.
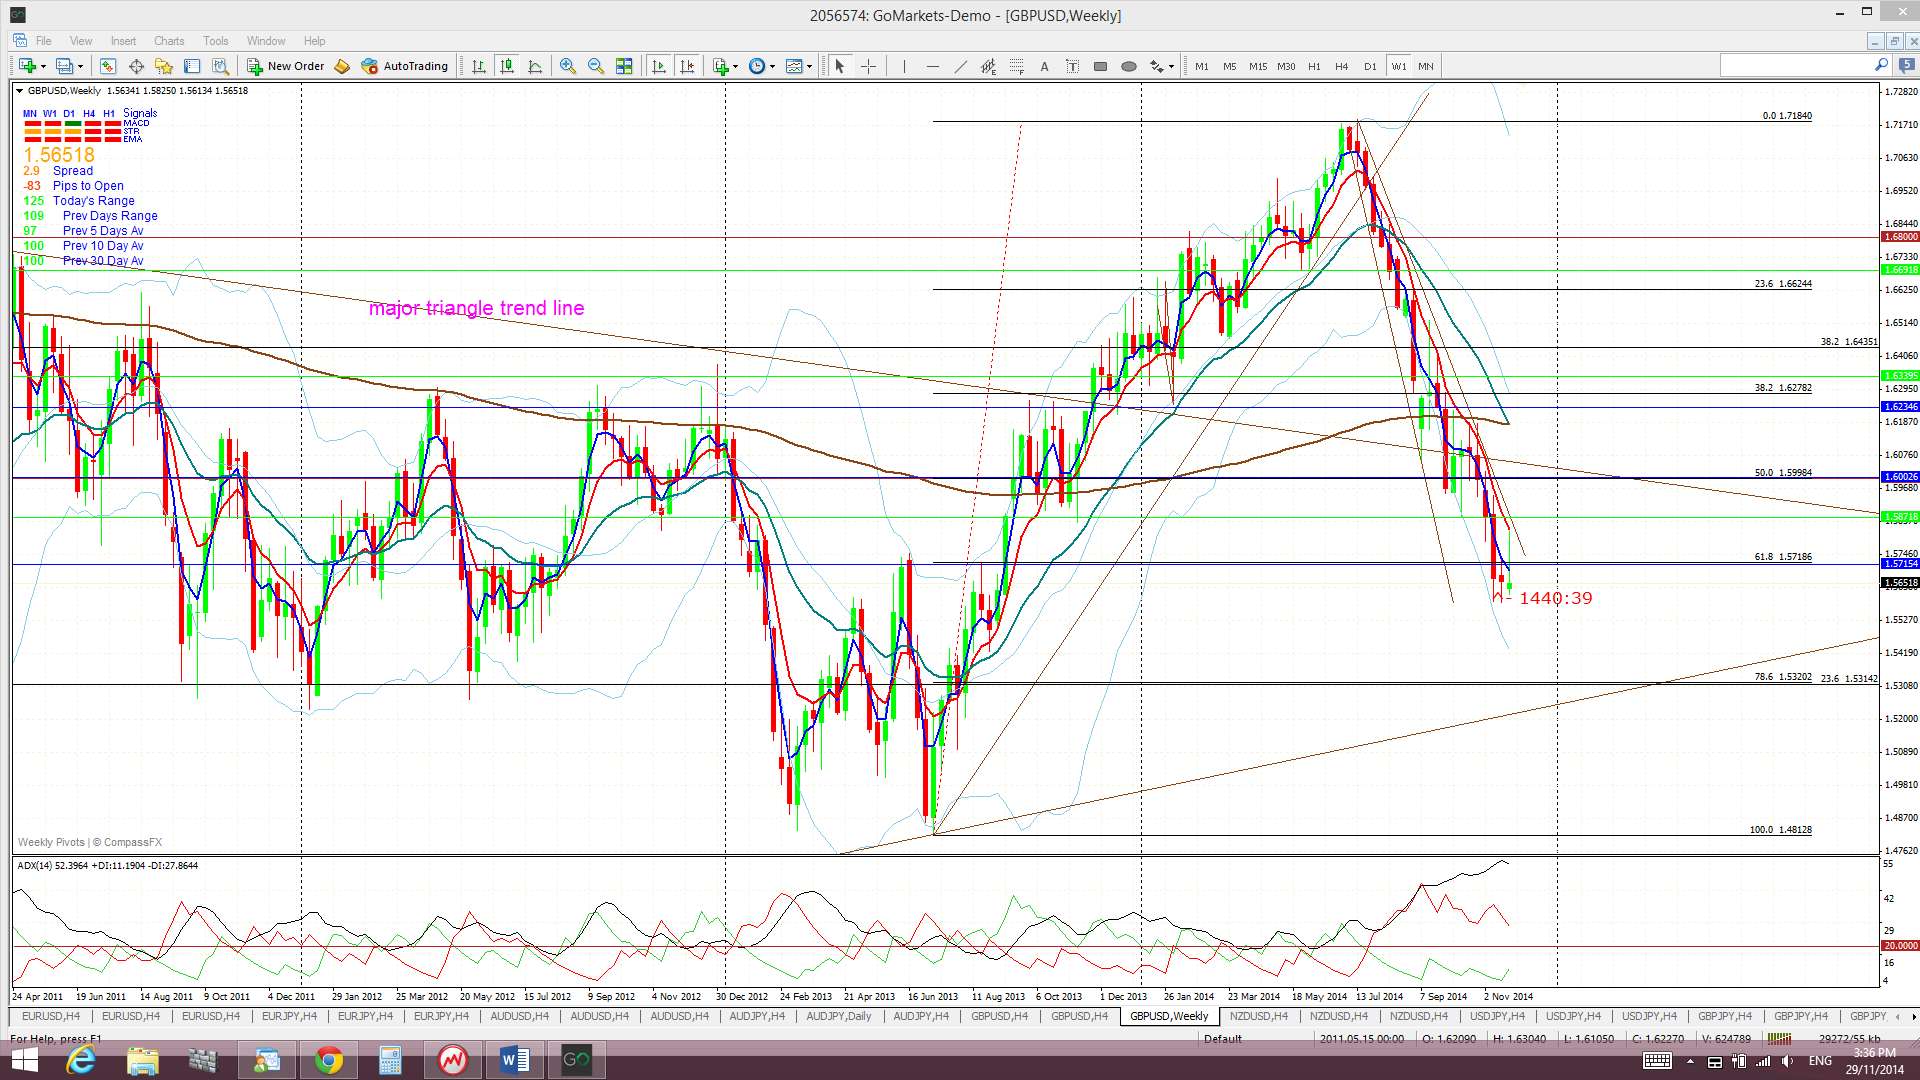
G/U: The Cable chopped higher last week and managed to move back above the 61.8% fib level of the 2013-2014 bull run, a seemingly small move but a rather significant achievement. This was short lived though as USD strength towards the end of the week pushed this pair back below this key 61.8% fib support.
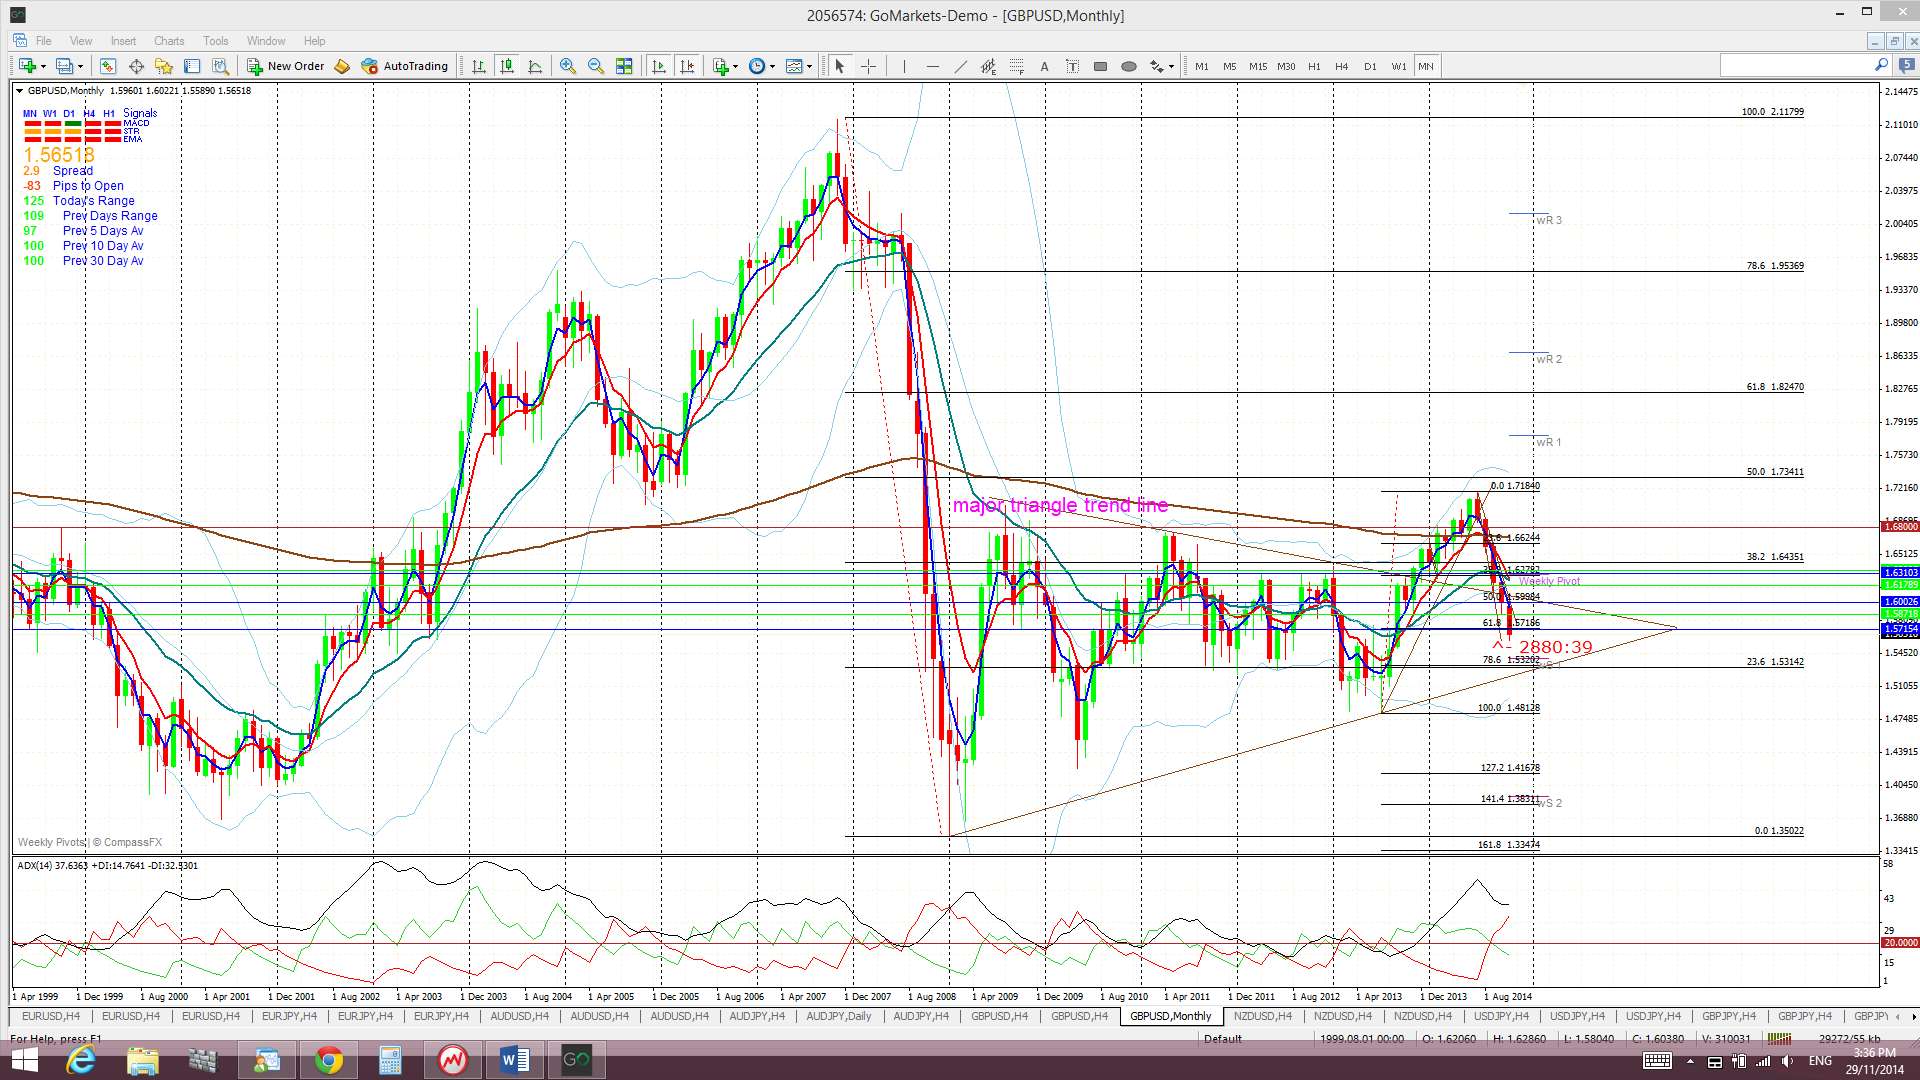
It is worth noting, that in spite of this close below support, the GBP/USD printed a bullish-reversal weekly candle which should be kept in mind, especially given that the USD index printed a bearish-reversal candle. Any bearish continuation move though would most likely target the monthly triangle trend line down near 1.53.
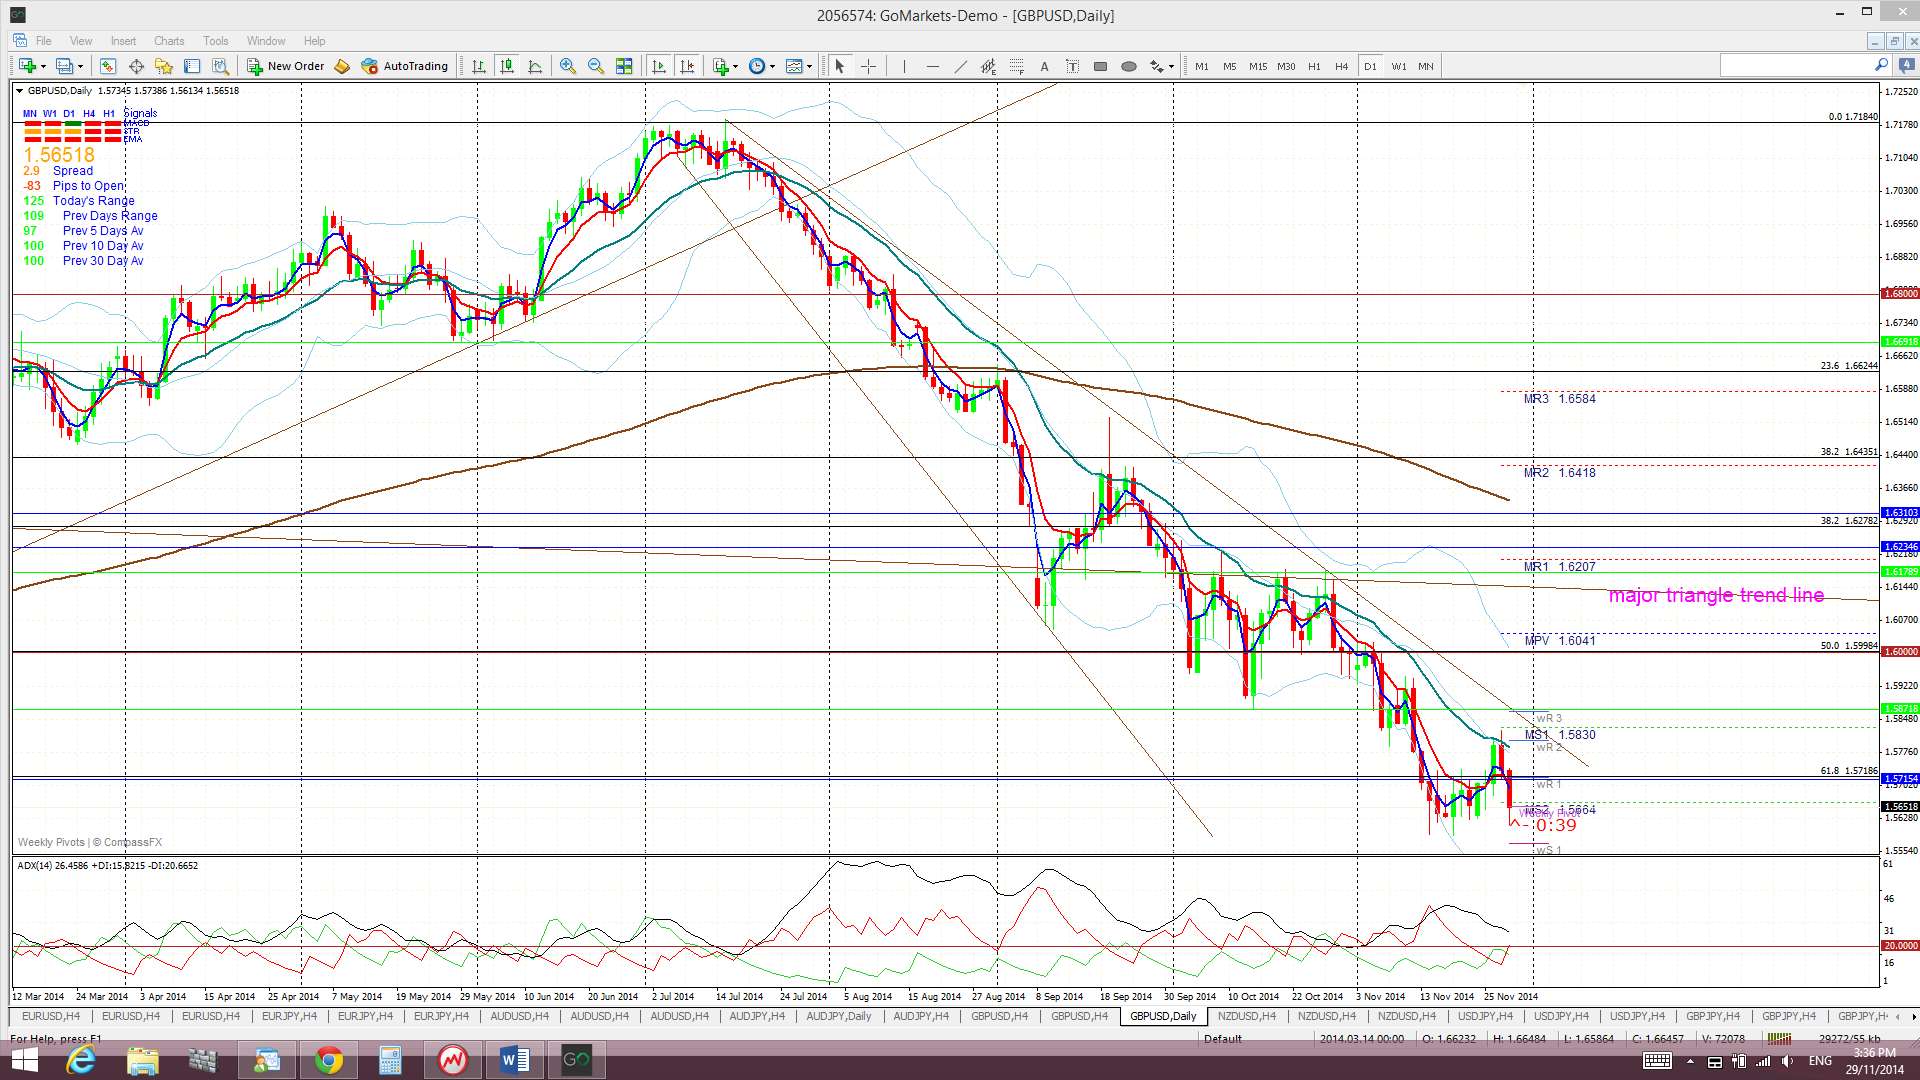
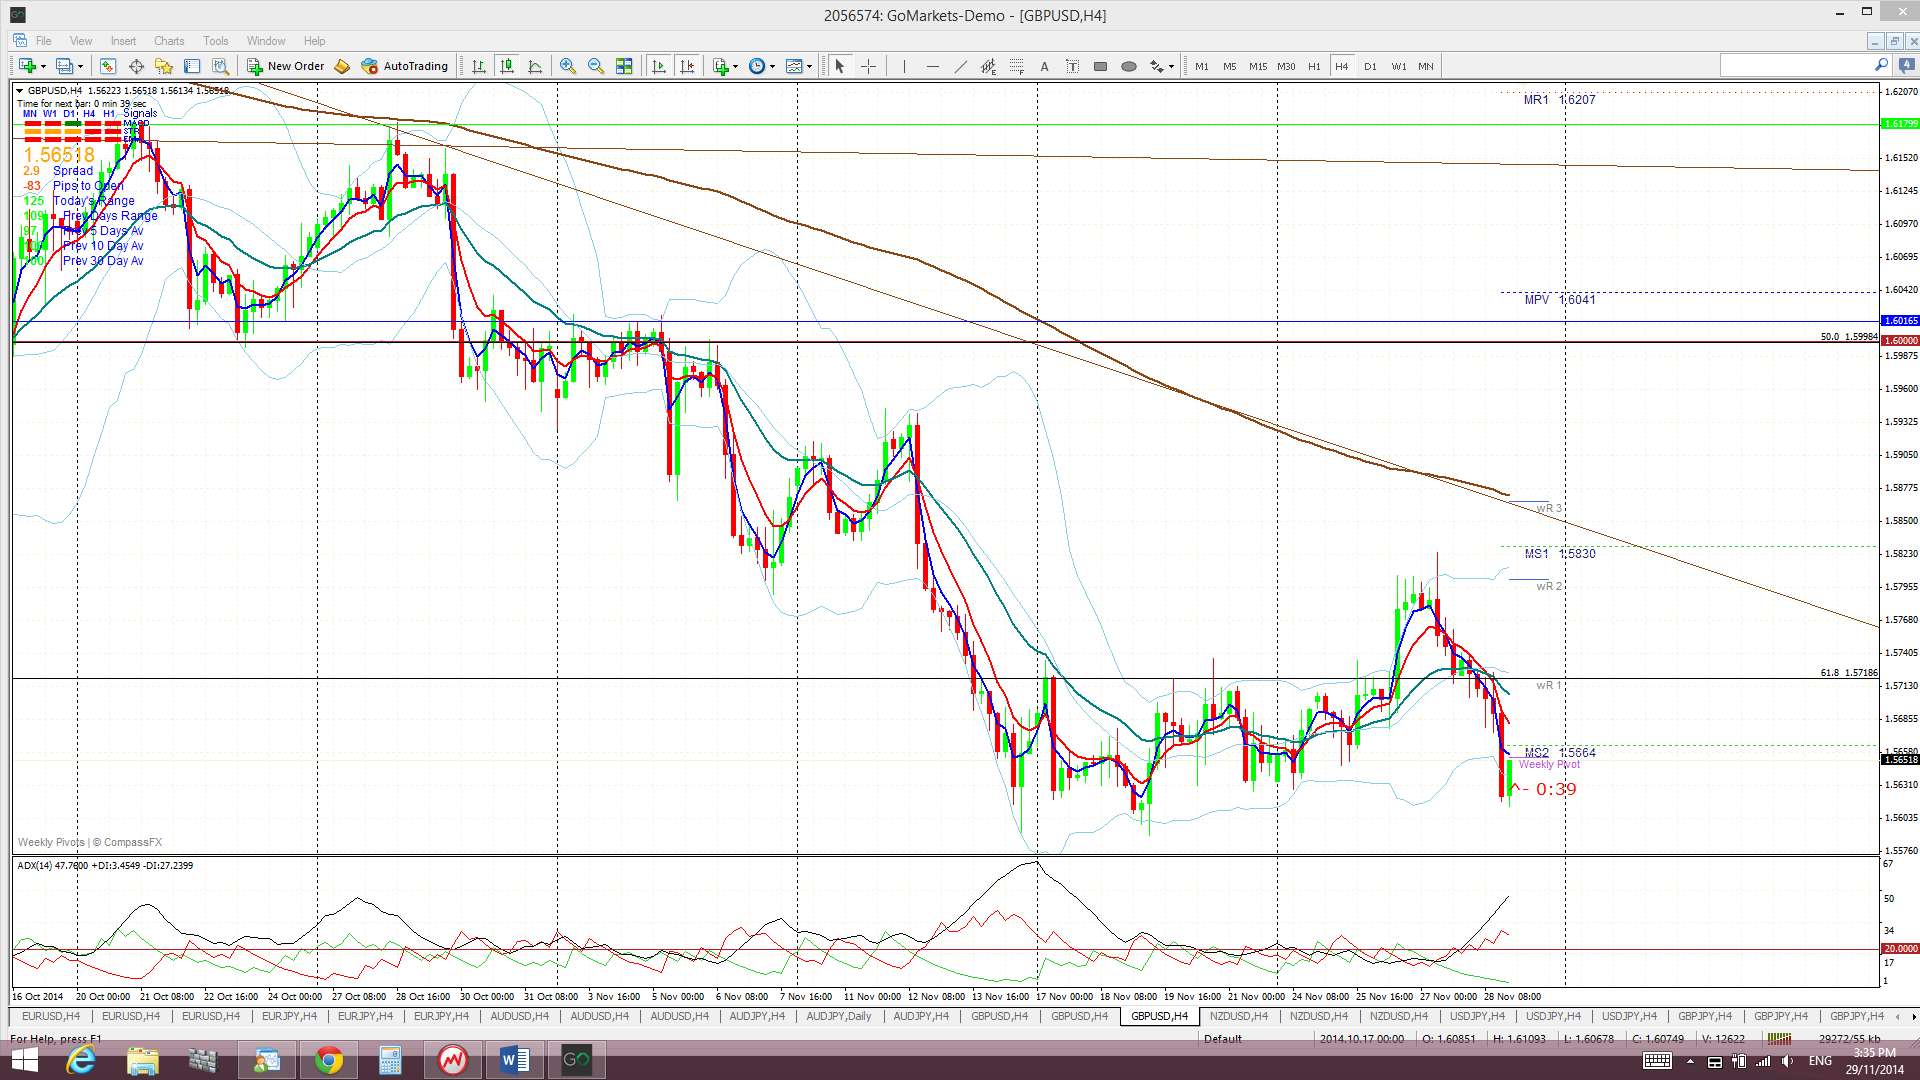
Price is trading below the Cloud on the 4hr, daily, weekly and monthly charts which is bearish.
The weekly candle closed as a bullish-reversal ‘Inverted Hammer’ candle although the monthly candle was bearish.
- I’m watching for any new TC signal on this pair and the 61.8% fib.
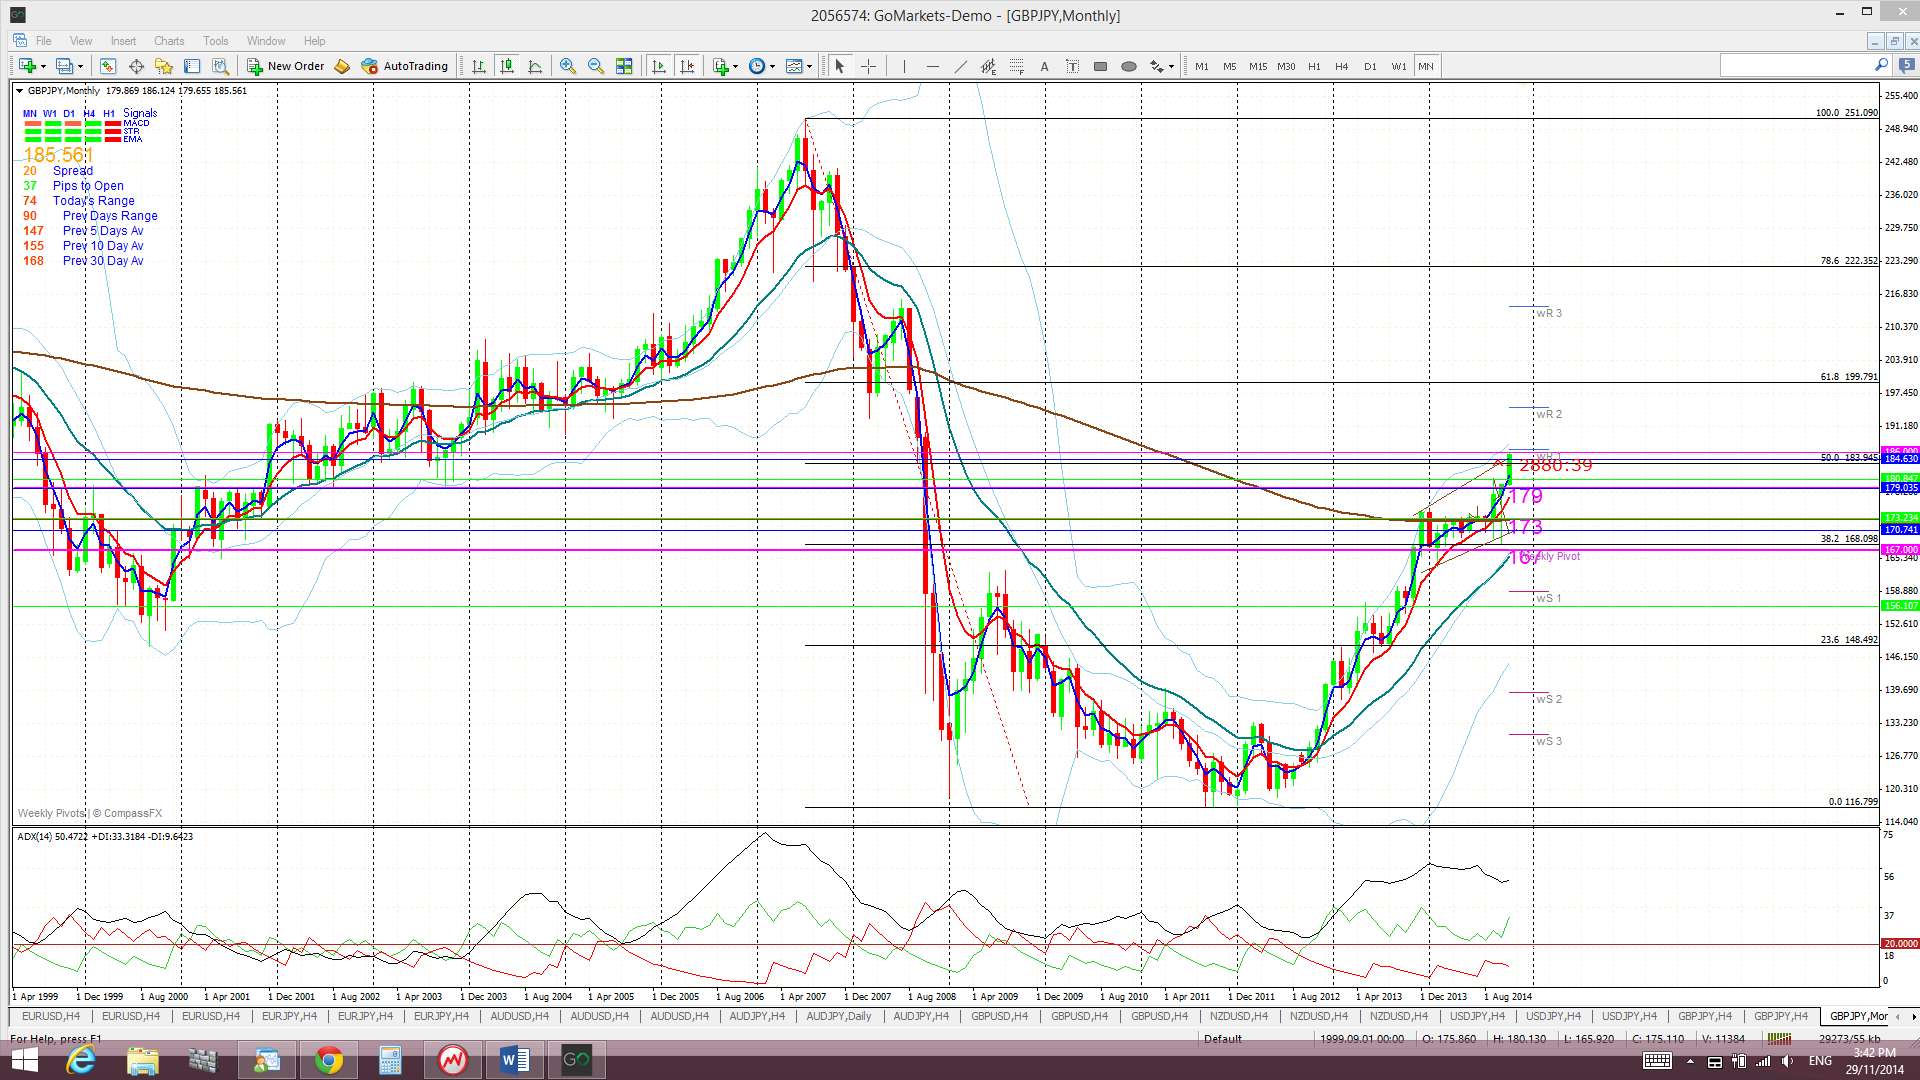
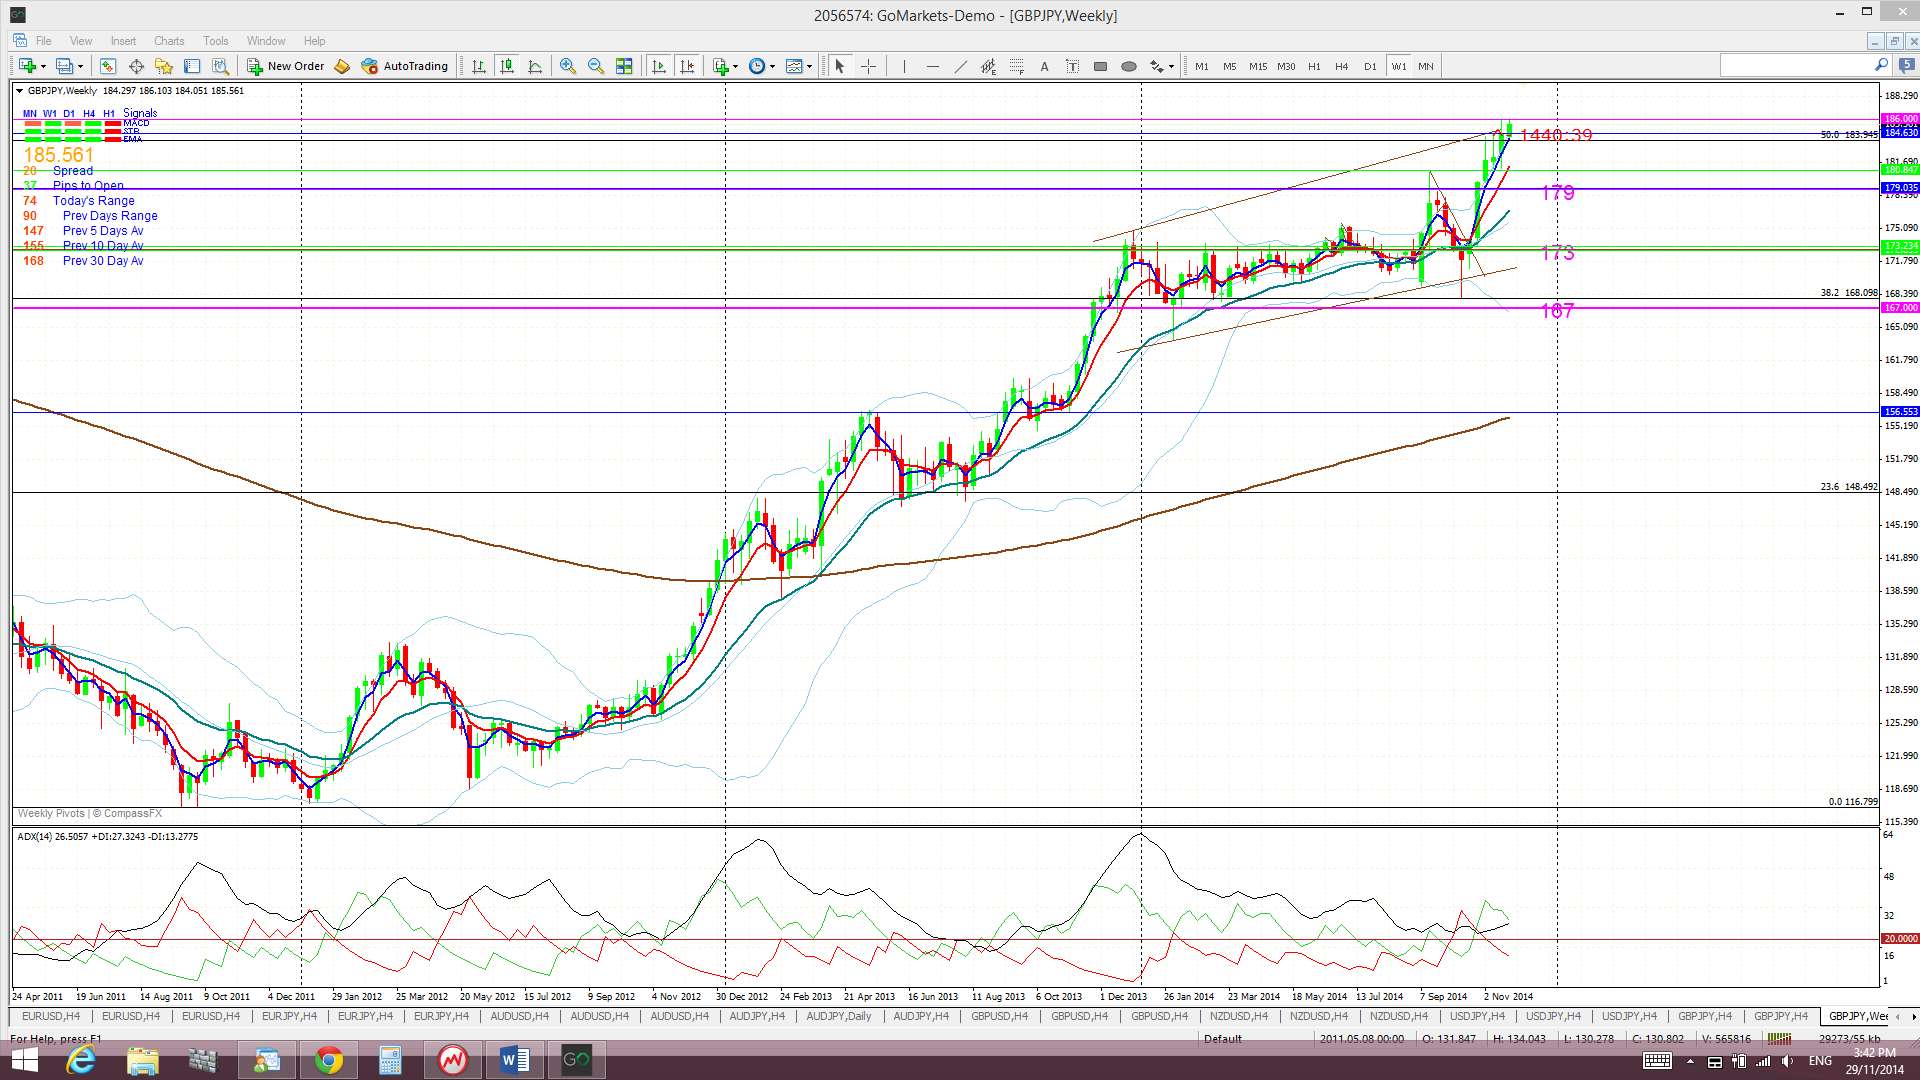
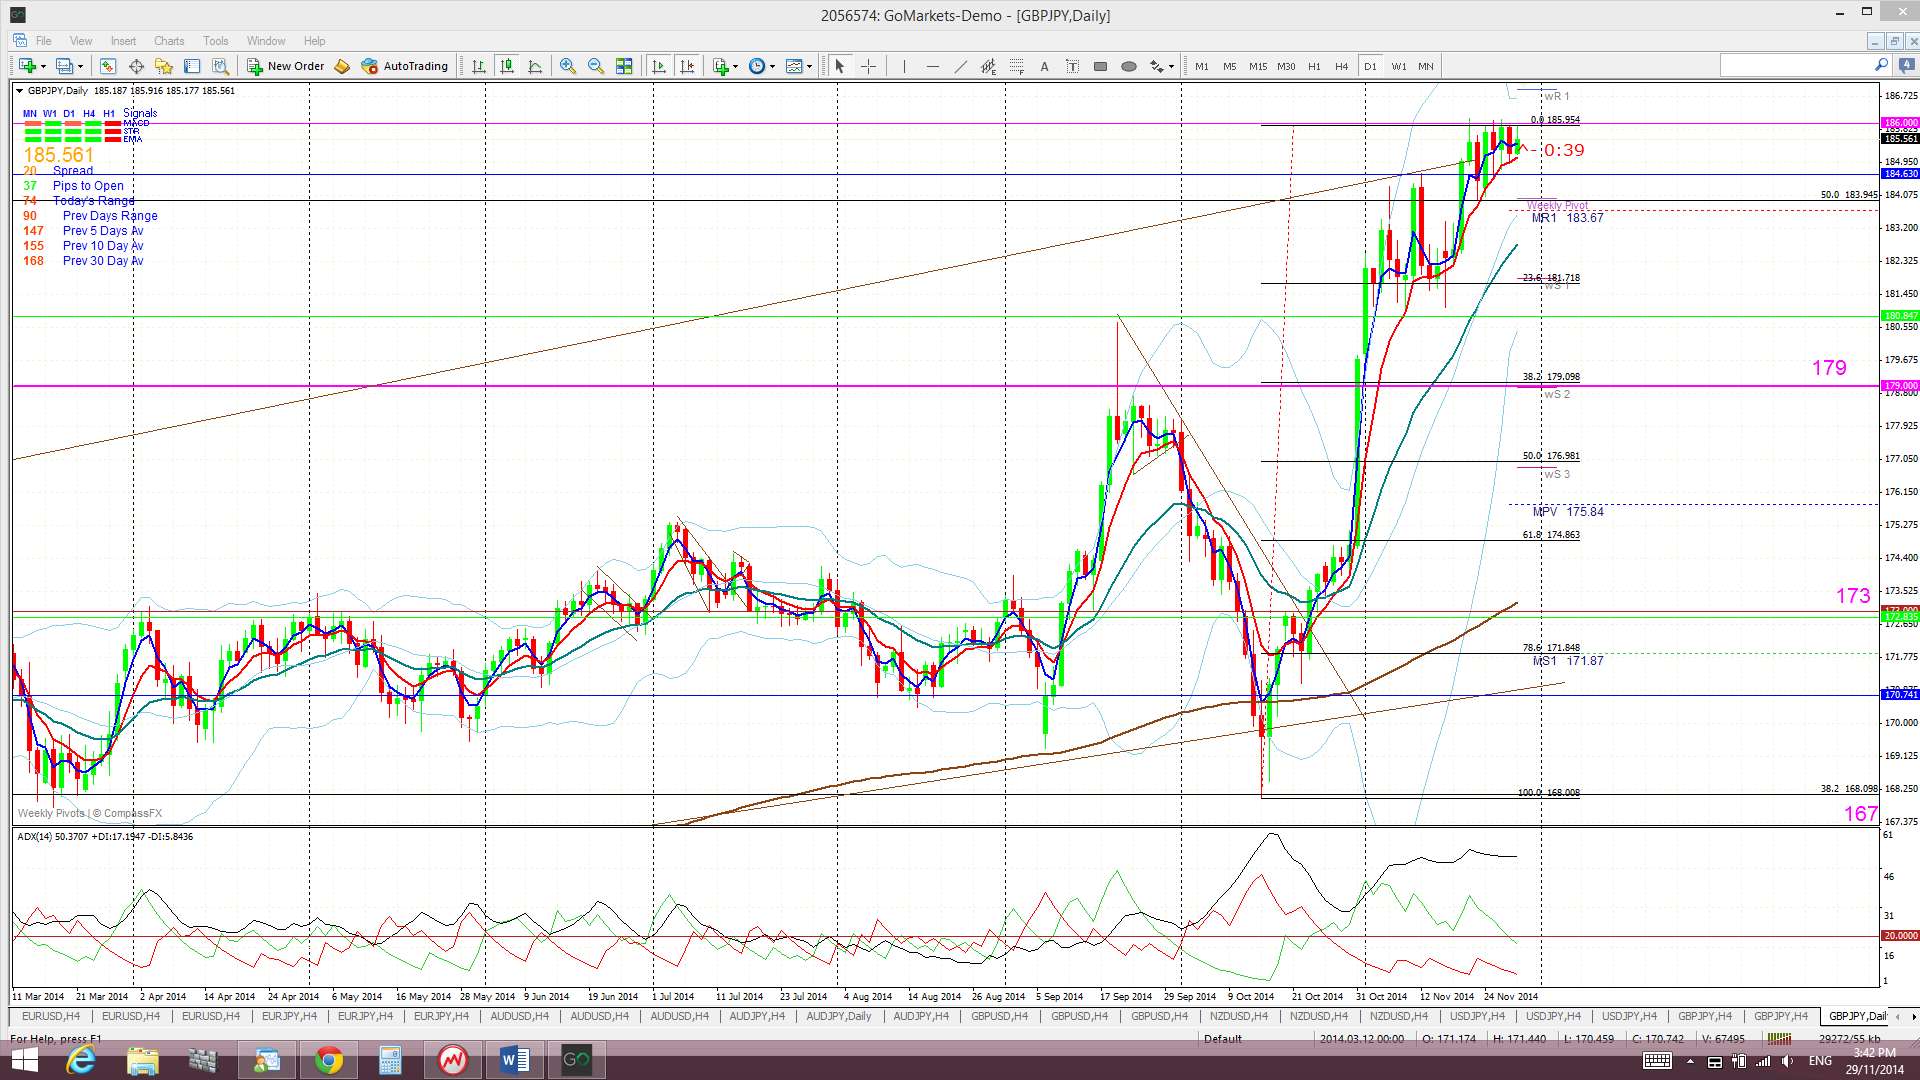
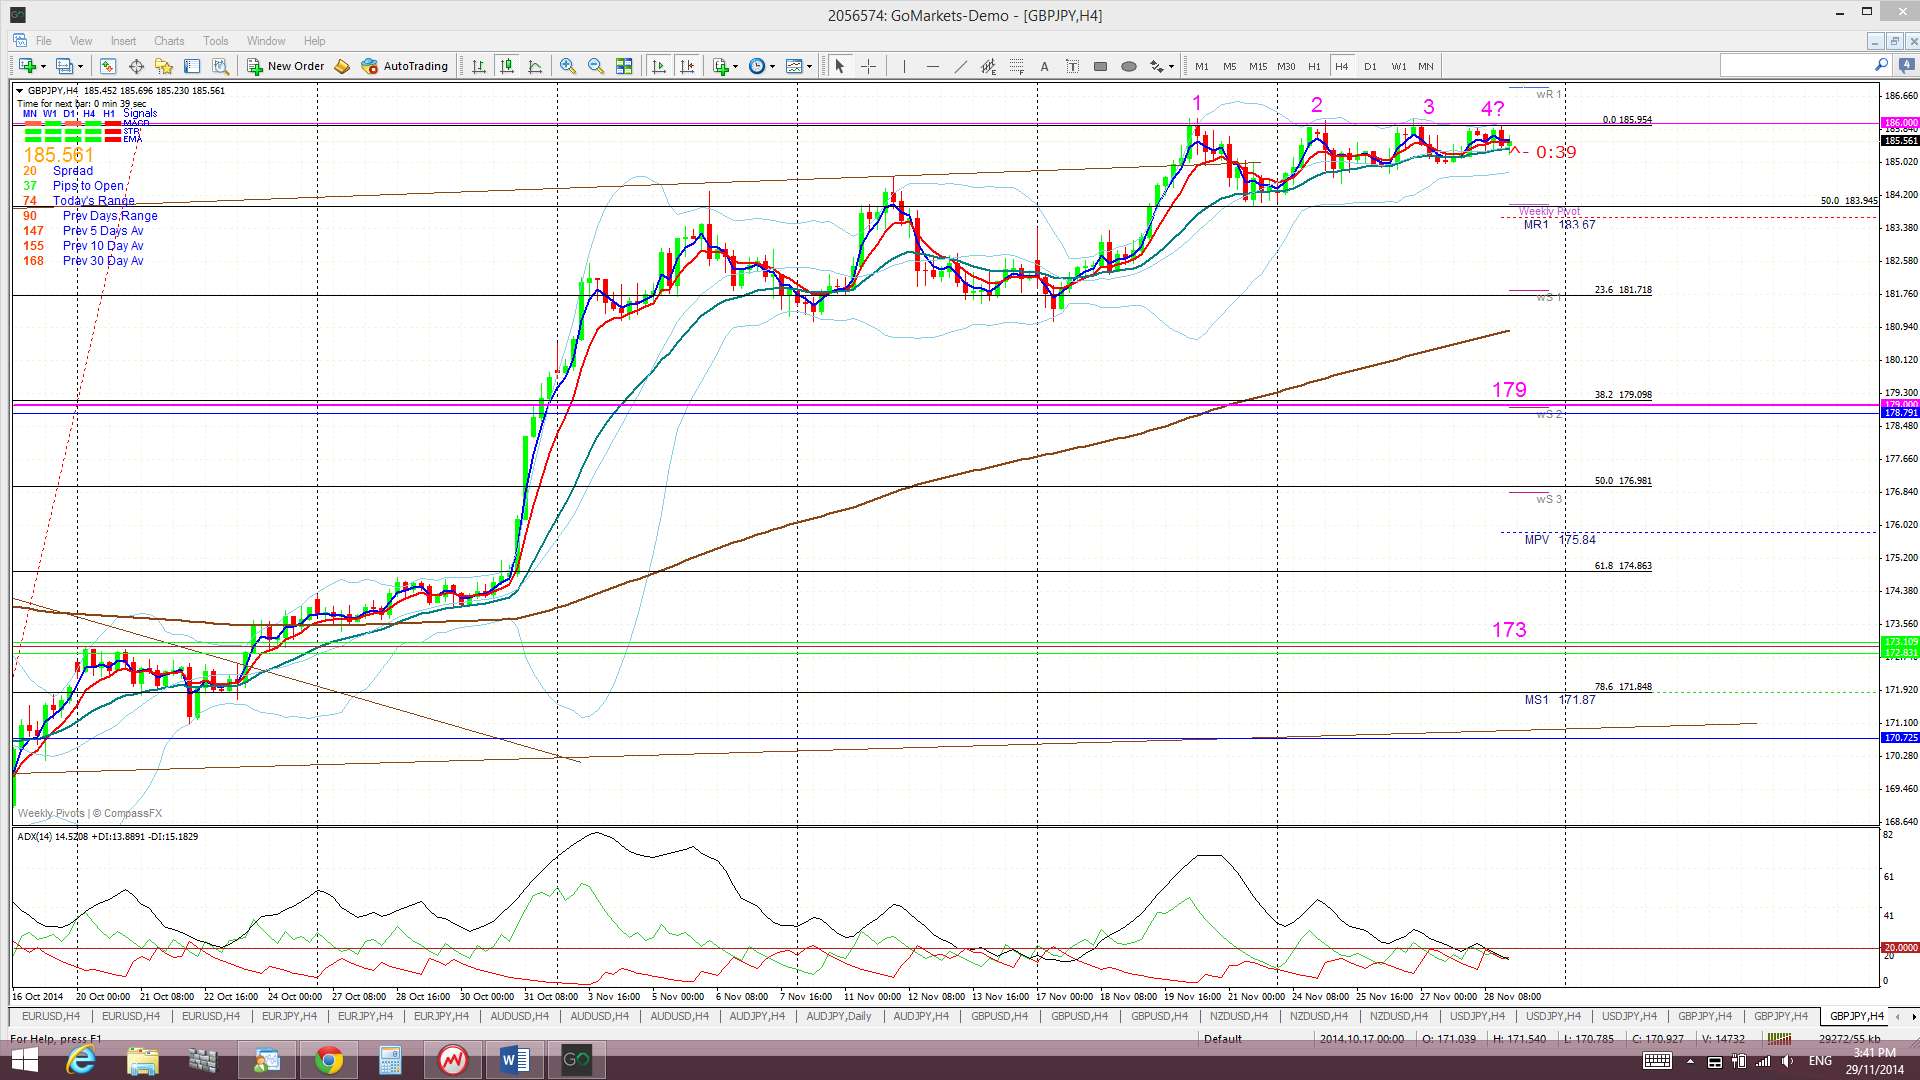
GBP/JPY: The GBP/JPY chopped sideways under the 116 level last week and this is now giving the chart a bearish ‘Quadruple Top’ appearance. However, any break and hold above the 116 would be bullish and suggest continuation up to the 61.8% fib near 200.
A bearish pull back here has failed to evolve as yet but possible targets would be the 179 level, which is near the 38.2% fib, and the 173 level, which is just below the 61.8% fib.
Two key S/R levels on the G/J chart: The monthly chart shows a band of choppy congested activity across the chart. This band is defined by rather strong S/R levels at 179 and 167. The 179 level seems to be a key demarcation level and a close and hold above this would suggest bullish continuation. The key 173 level lies midway between these two S/R levels. Targets for any bullish break and hold above the 179 level, apart from obvious whole number levels, include the 50% fib near 184, the 61.8% fib near 200 and the 78.6% fib near 222.
Price is trading above the Ichimoku Cloud on the 4hr, daily, weekly and monthly charts which is bullish.
The weekly candle closed as a small bullish candle but the monthly candle was a larger bullish candle.
- I’m watching for any new TC signal on this pair and the 116 level.
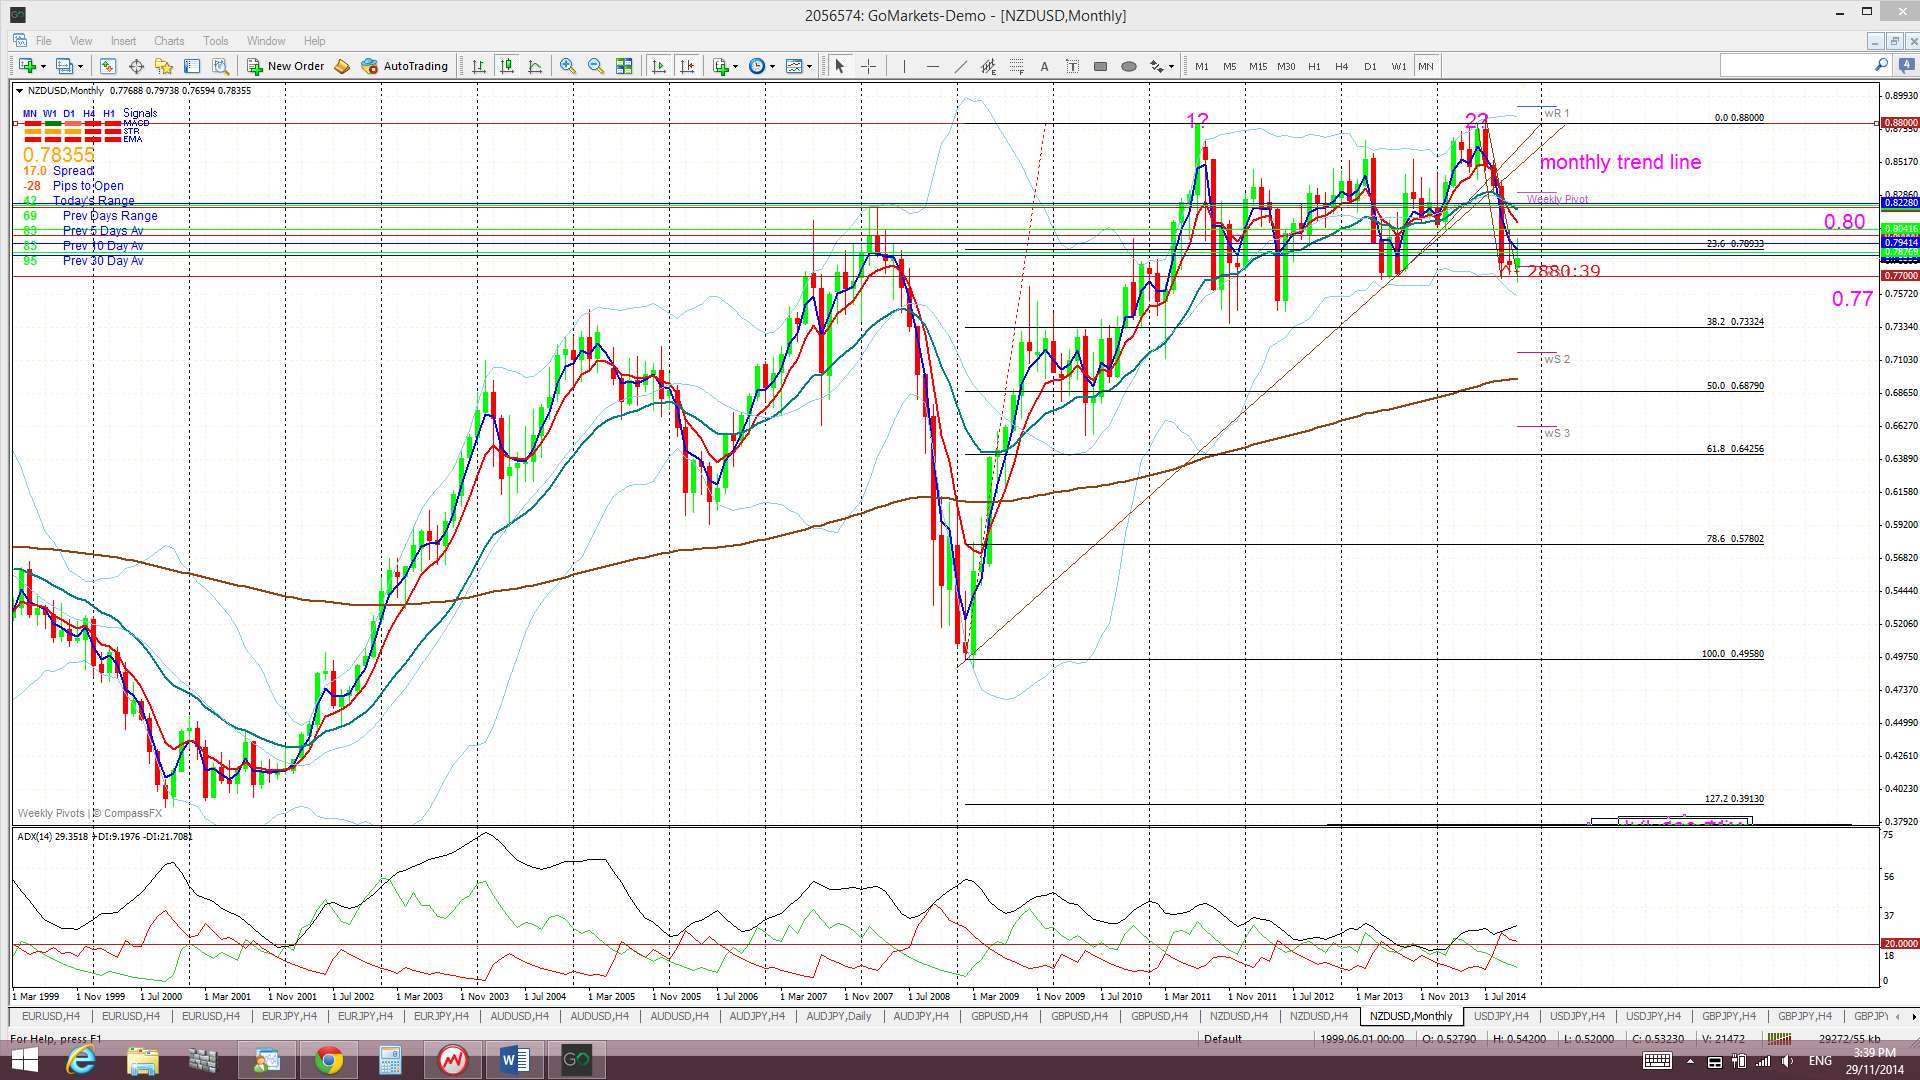
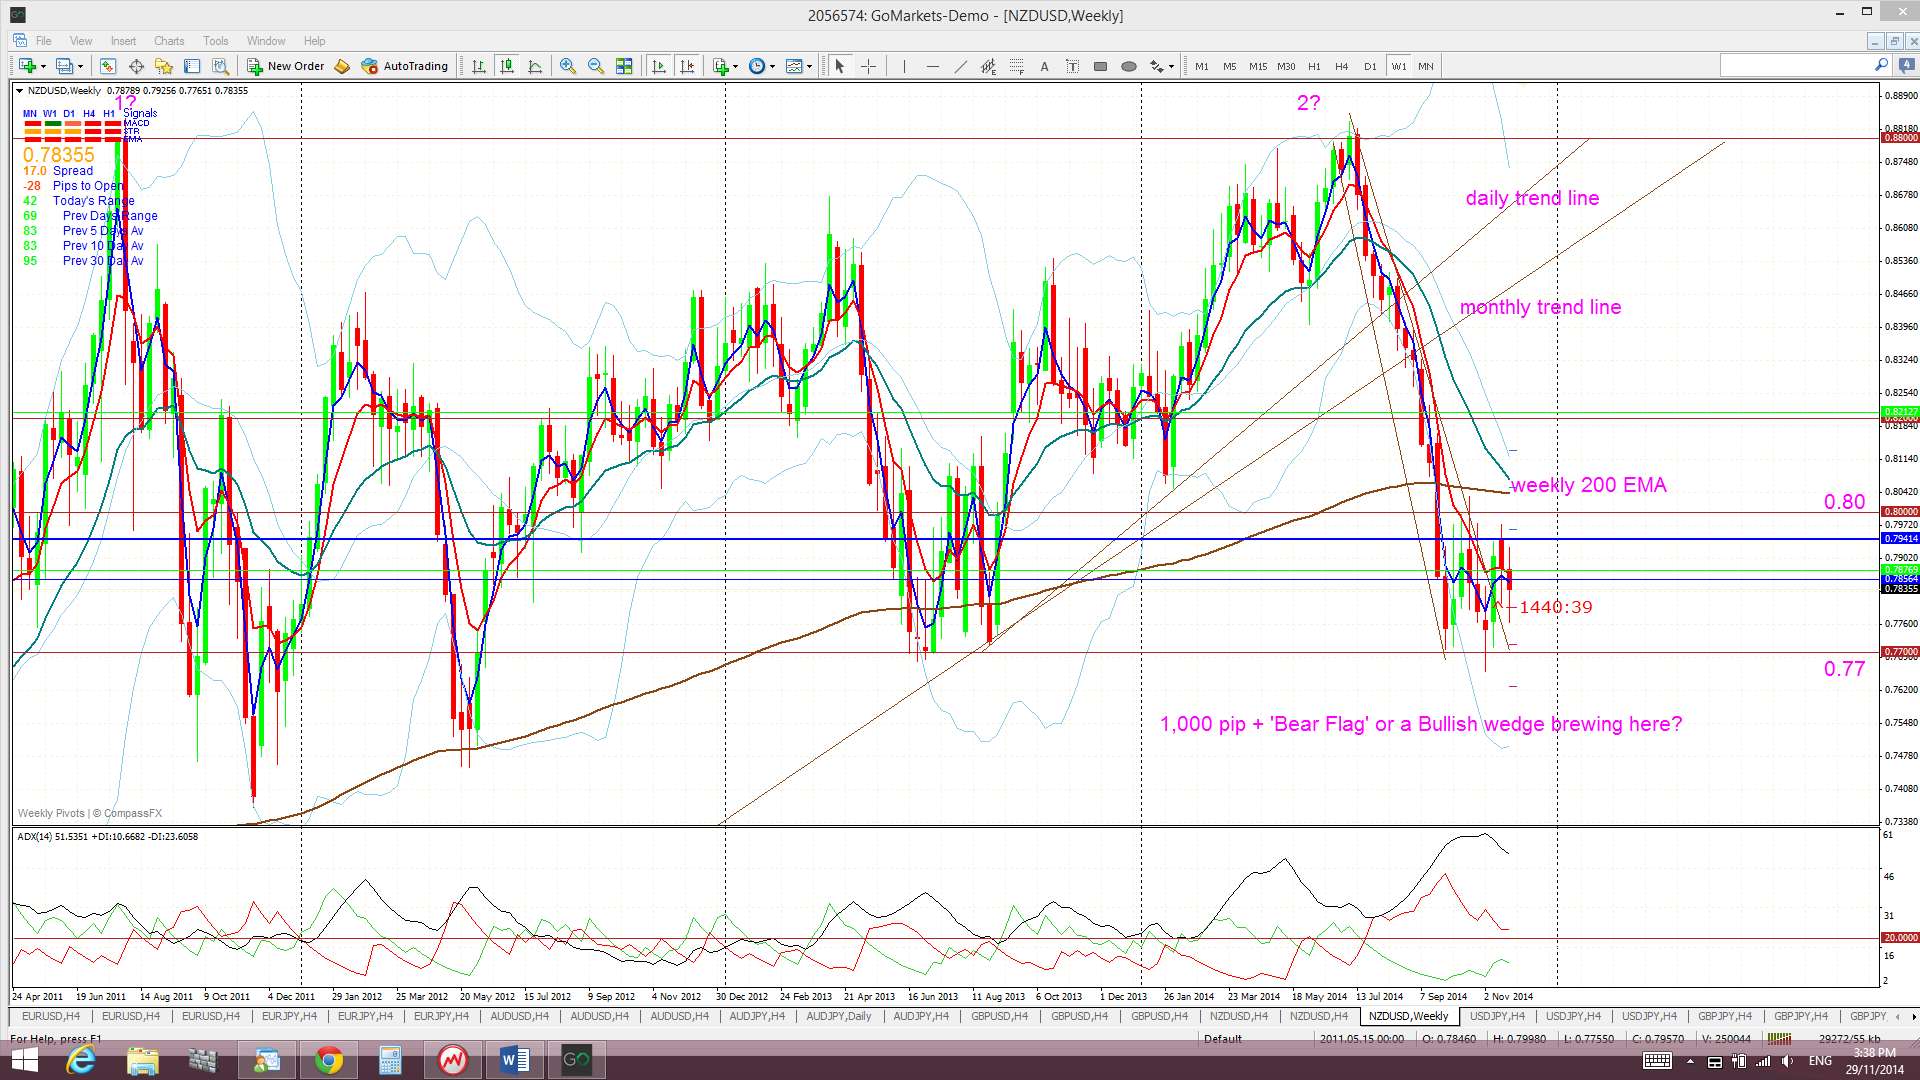
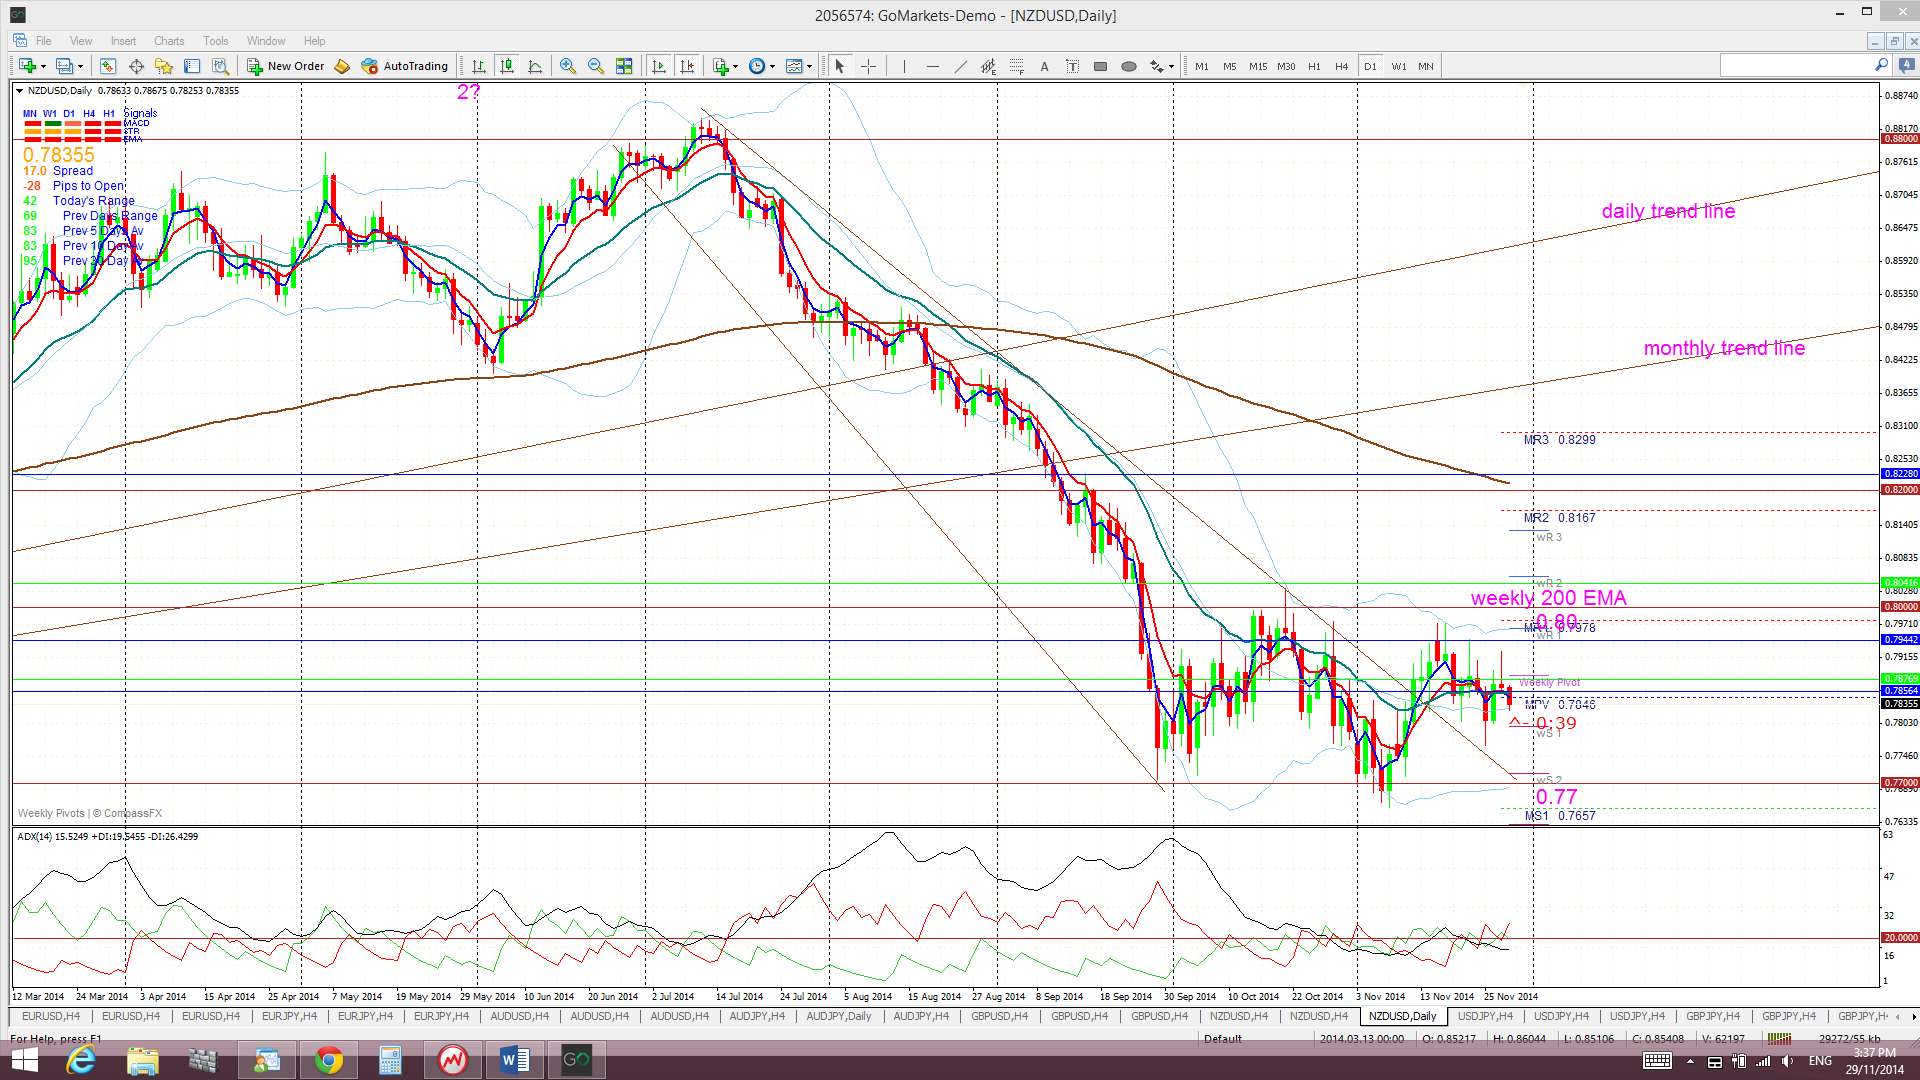
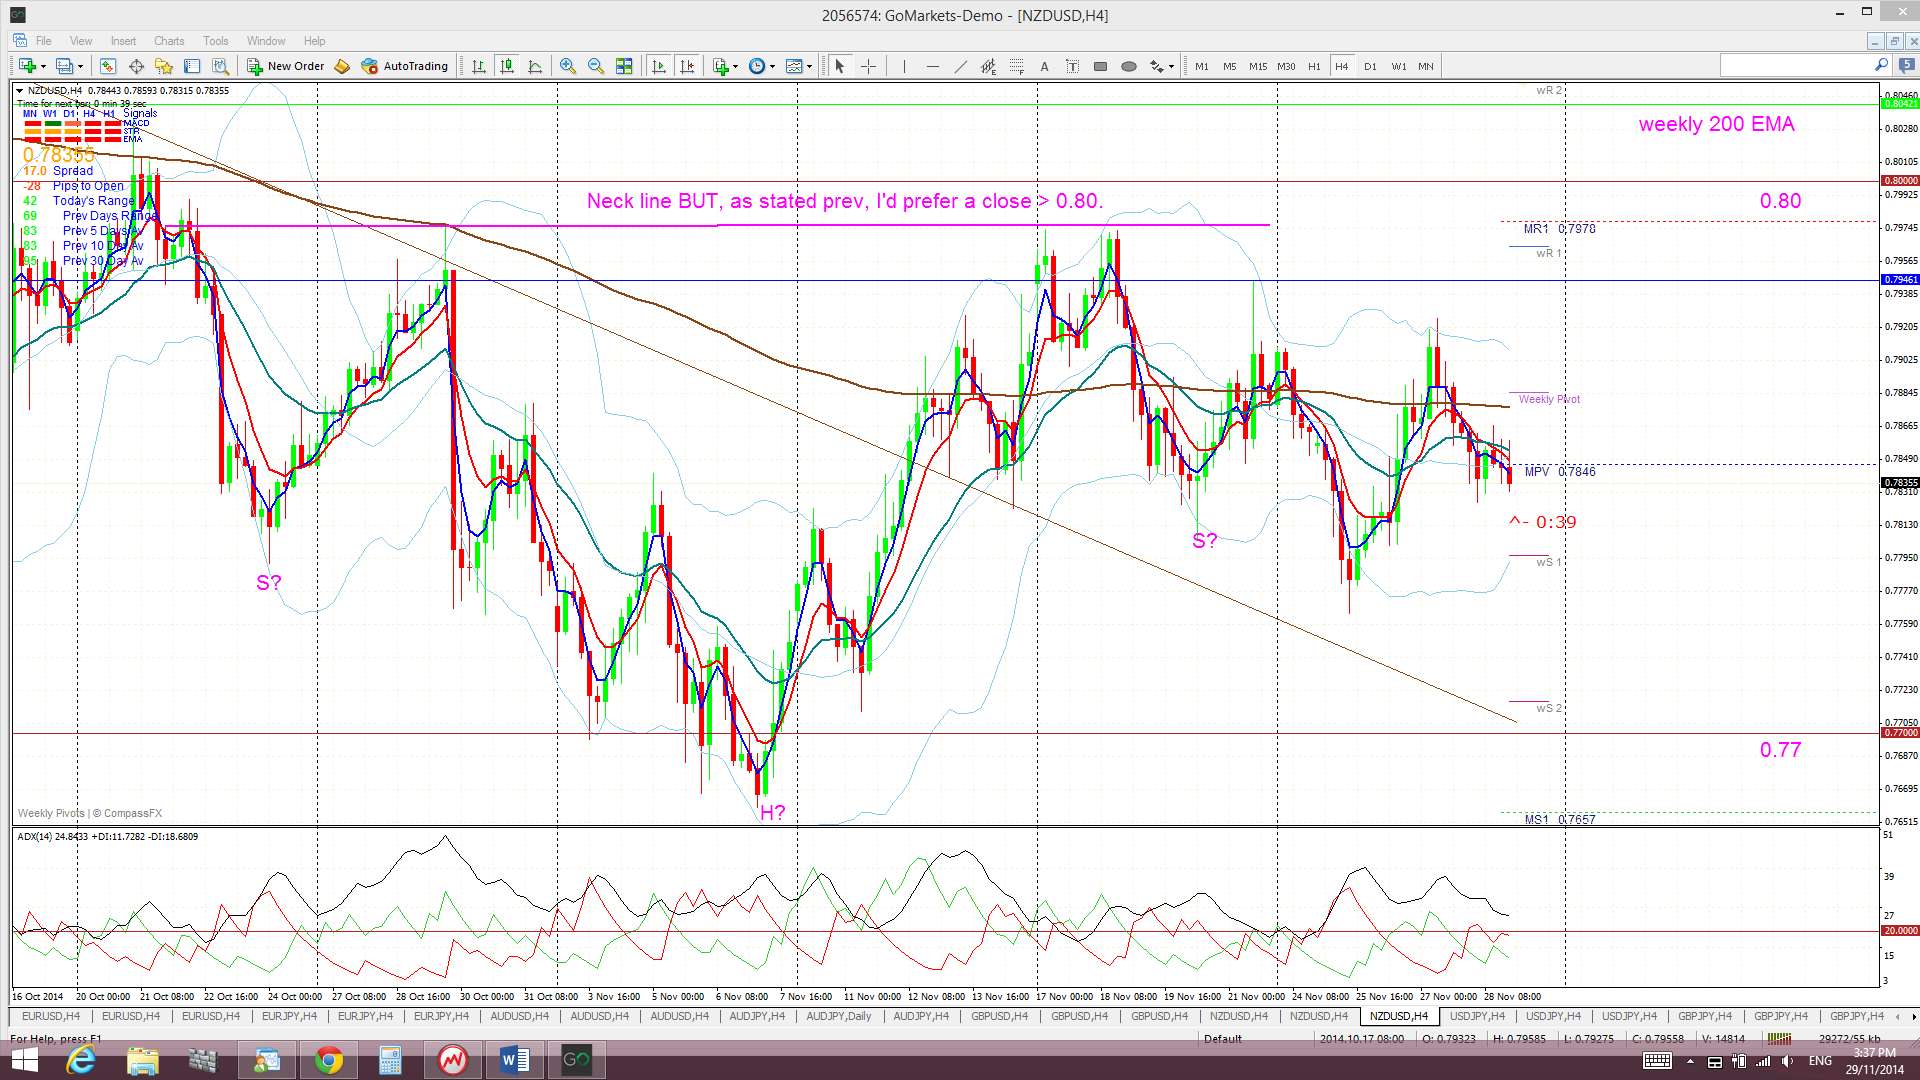
Kiwi: NZD/USD: The Kiwi had another choppy week but continued to hold up and out from the daily chart’s descending wedge. The bullish ‘inverse H&S’ pattern on the 4hr chart is looking rather messy but the 0.80 level remains the key bullish level to watch here whilst 0.77 remains as the bearish level to watch. Whilst the weekly candle was bearish the monthly candle is sending a bullish signal here which is worth taking note of.
Bear Flag for Kiwi: The 0.77 remains the key level to watch here as any break and hold below this level would trigger the start of a possible ‘Bear Flag’ move. The ‘Flag Pole’ for the Kiwi’s ‘Bear Flag’ is about 1,100 pips. Thus, any bearish breakdown and continuation below the ‘Flag’ trend line may be expected to extend by 1,100 pips as well. This would bring the Kiwi down to near 0.67 cents. This level is between the 61.8 and 78.6% fibs of the 2009-2014 bull run. Given that the 0.77 is strong support I would still prefer to wait to confirm any possible ‘Bear Flag’ move until there is a close and hold below this 0.77 level. The 0.77 remains a significant S/R level for the Kiwi. This level represents the previous swing low for the period during mid-2013 and, prior to then, from mid-2012.
Fib levels shows other possible targets for any bearish continuation below 0.77 as being the:
- 38.2% fib near 73.5.
- 50% fib near 70 and the weekly 200 EMA.
- 61.8% fib near 0.65.
Price is trading below the Ichimoku Cloud on the 4hr, daily and weekly charts and in the top edge of the Cloud on the monthly chart.
The weekly candle closed as another bearish candle with decent sized shadows reflecting the uncertainty here. The monthly candle closed a bullish-reversal ‘Inverted Hammer’ candle. This candle, forming at 0.77 support, is well worth taking note of!
- I’m watching for any new TC signal on this pair and the 0.77 and 0.80 levels.
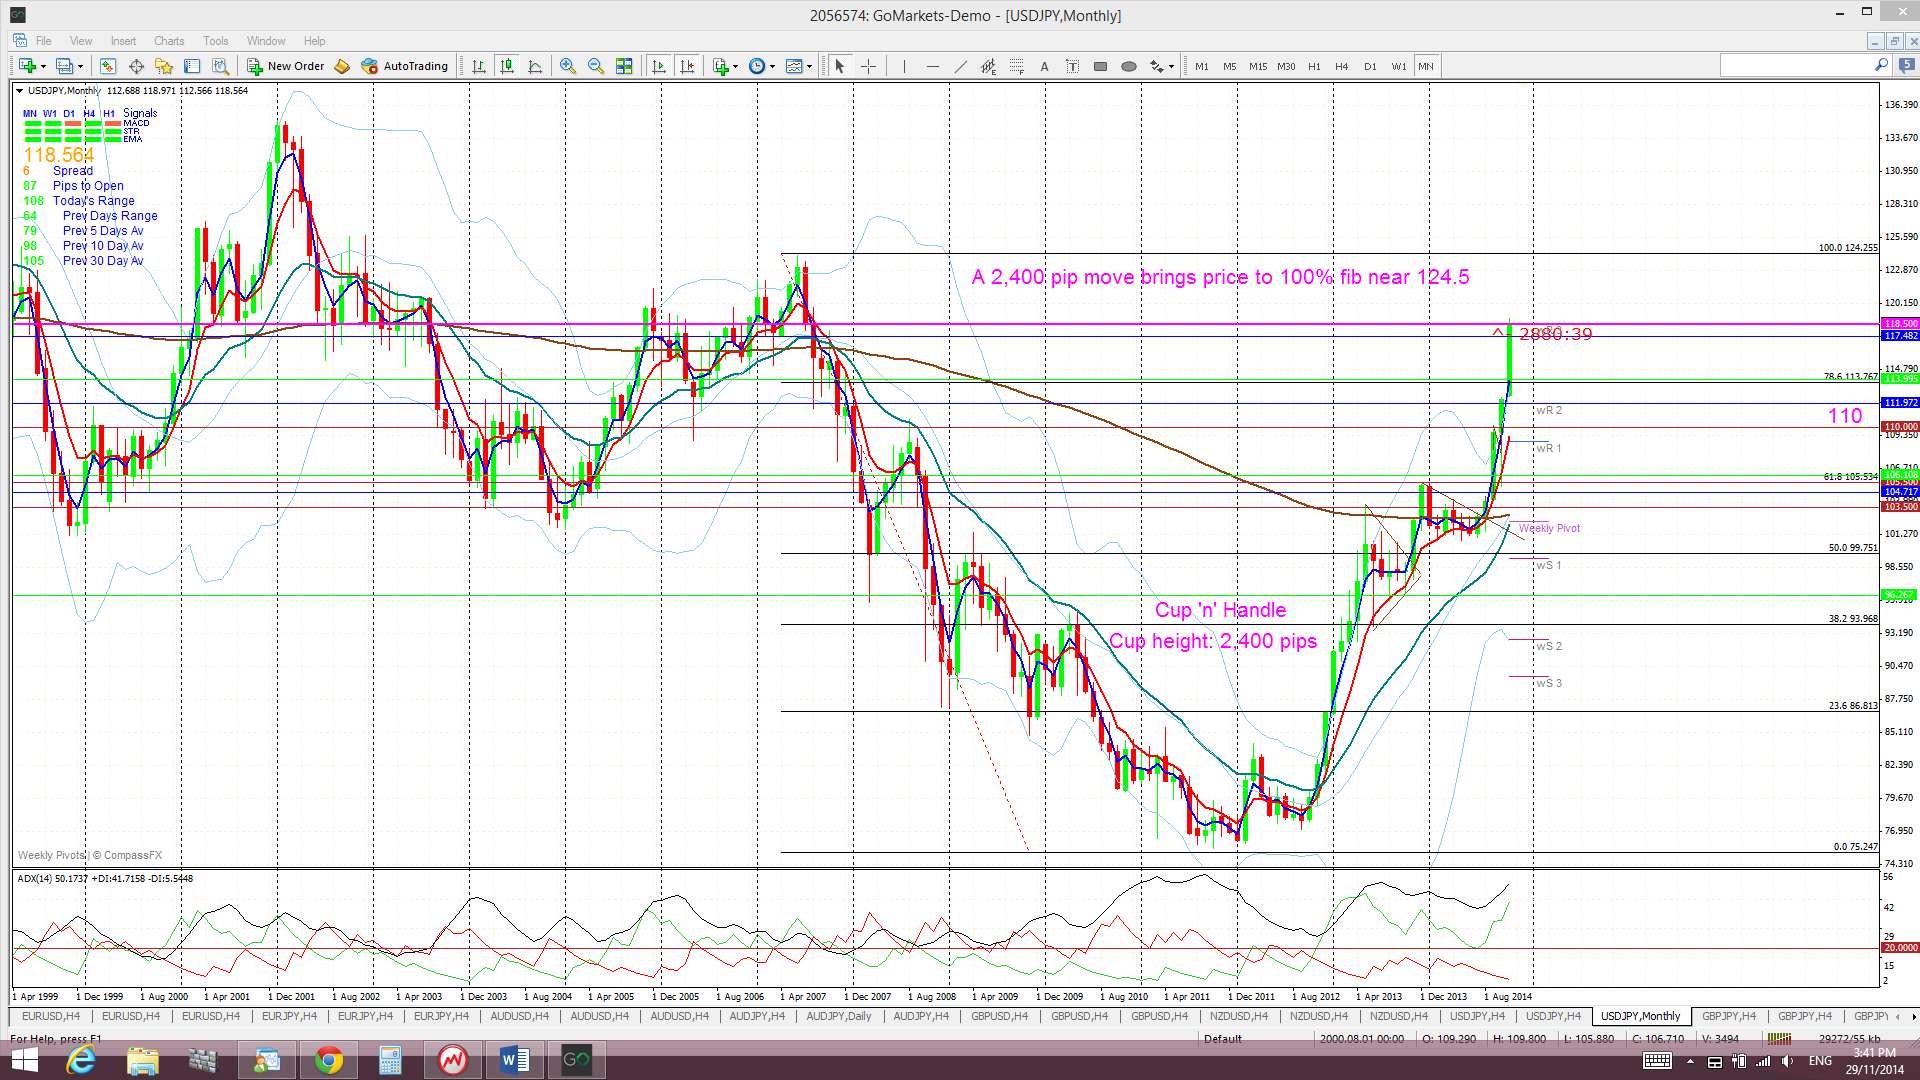
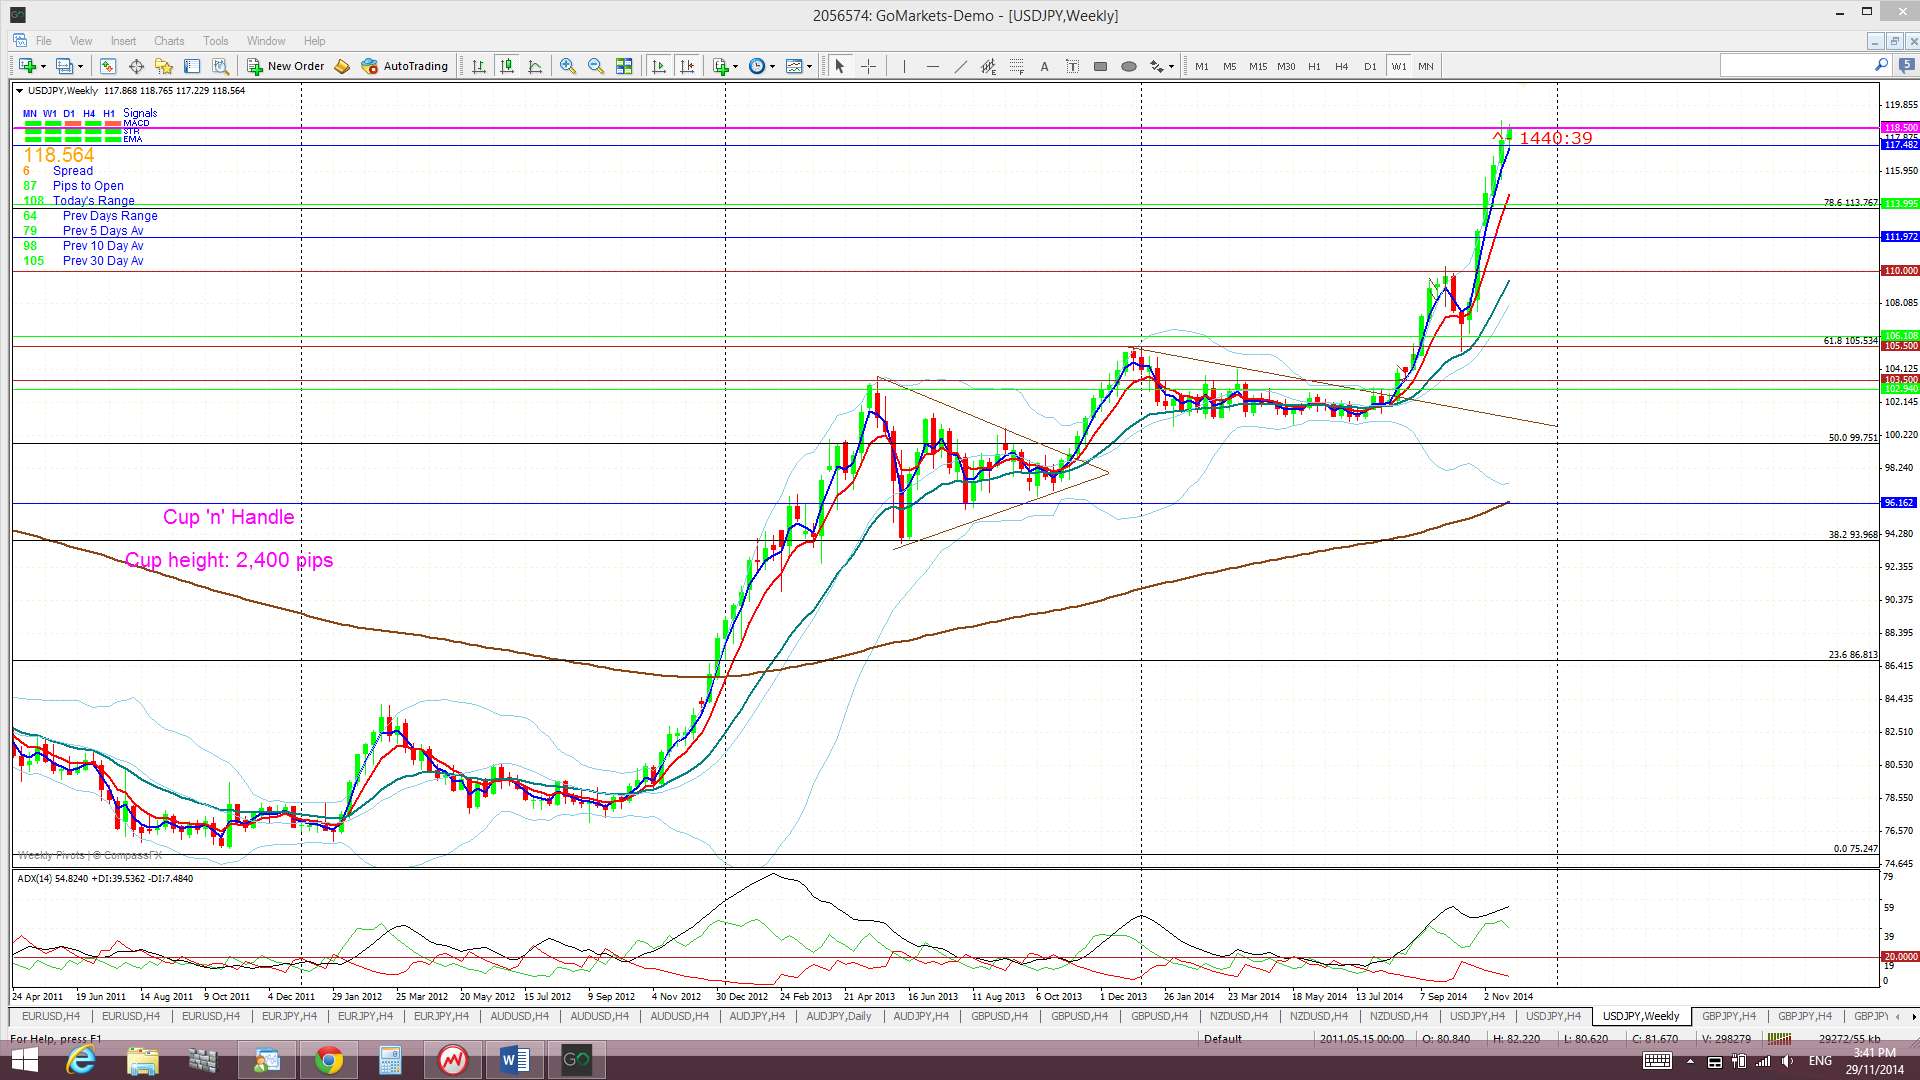
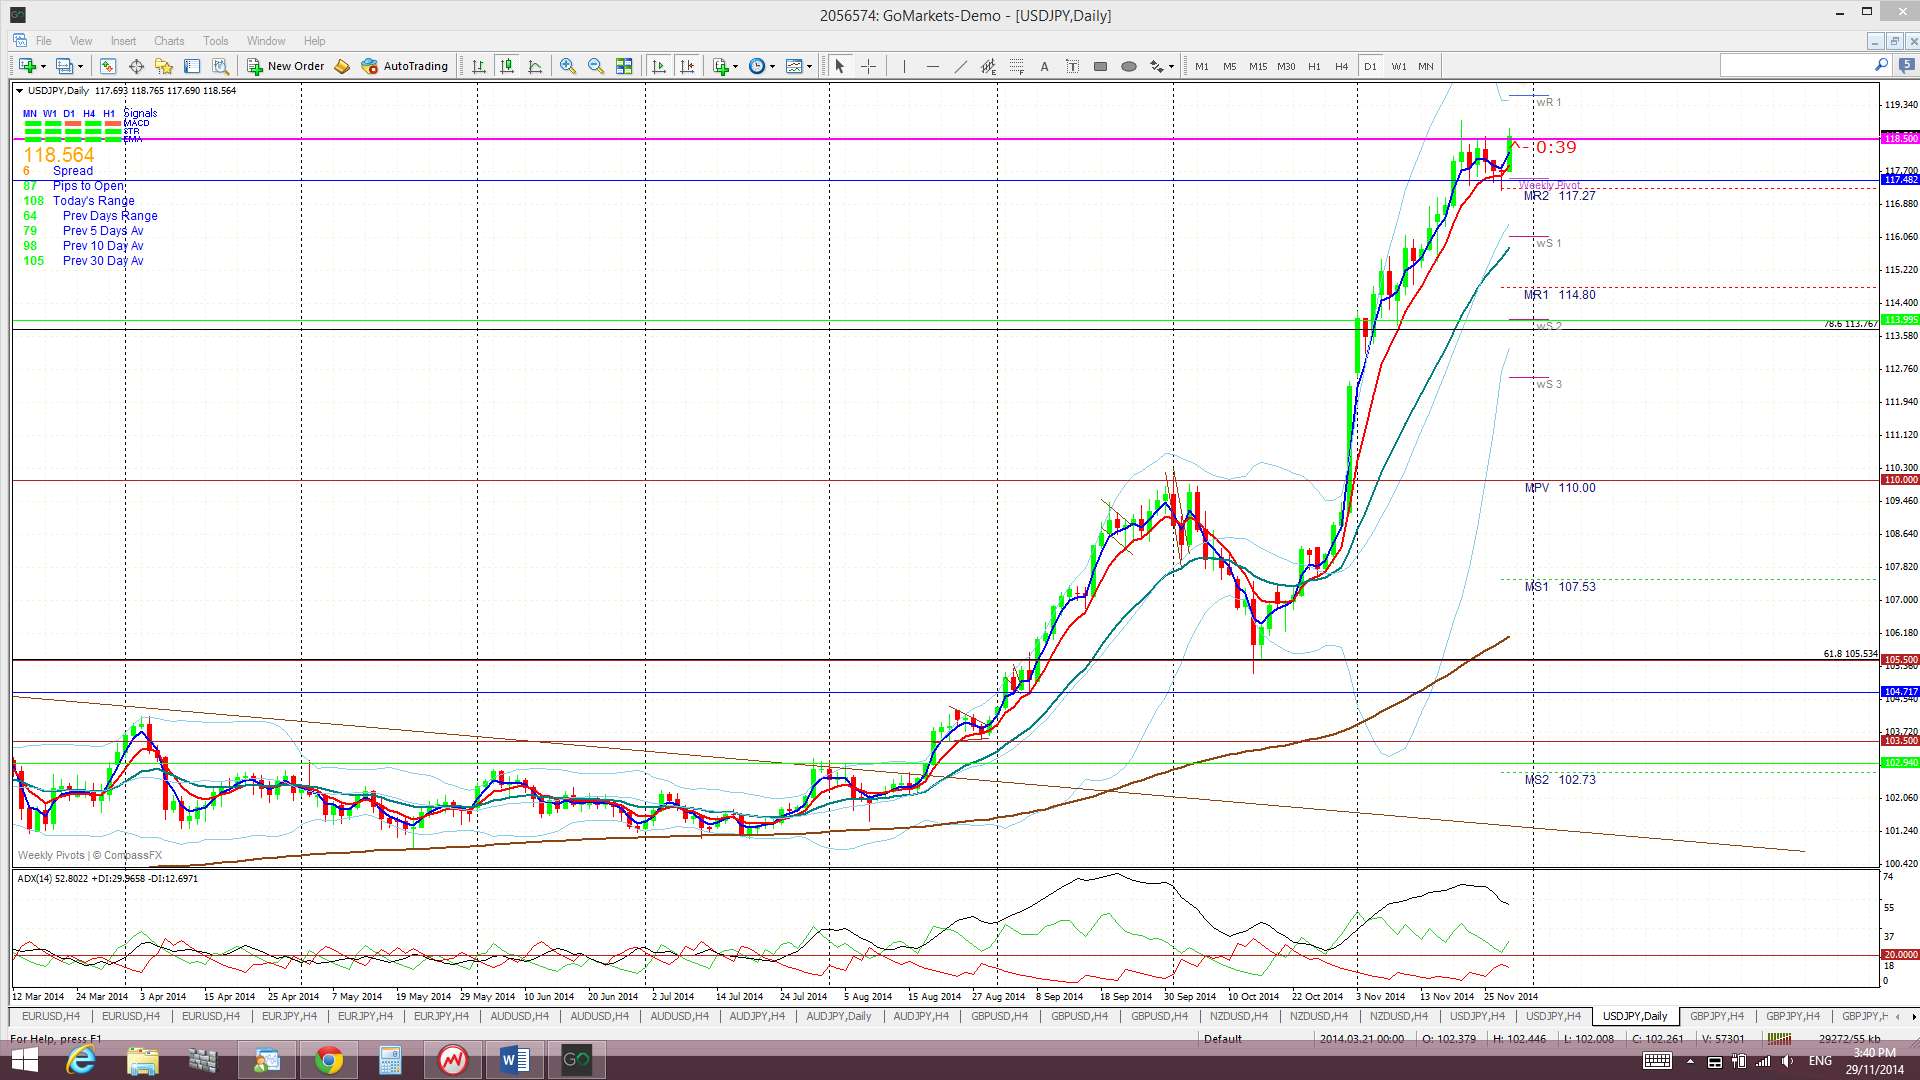
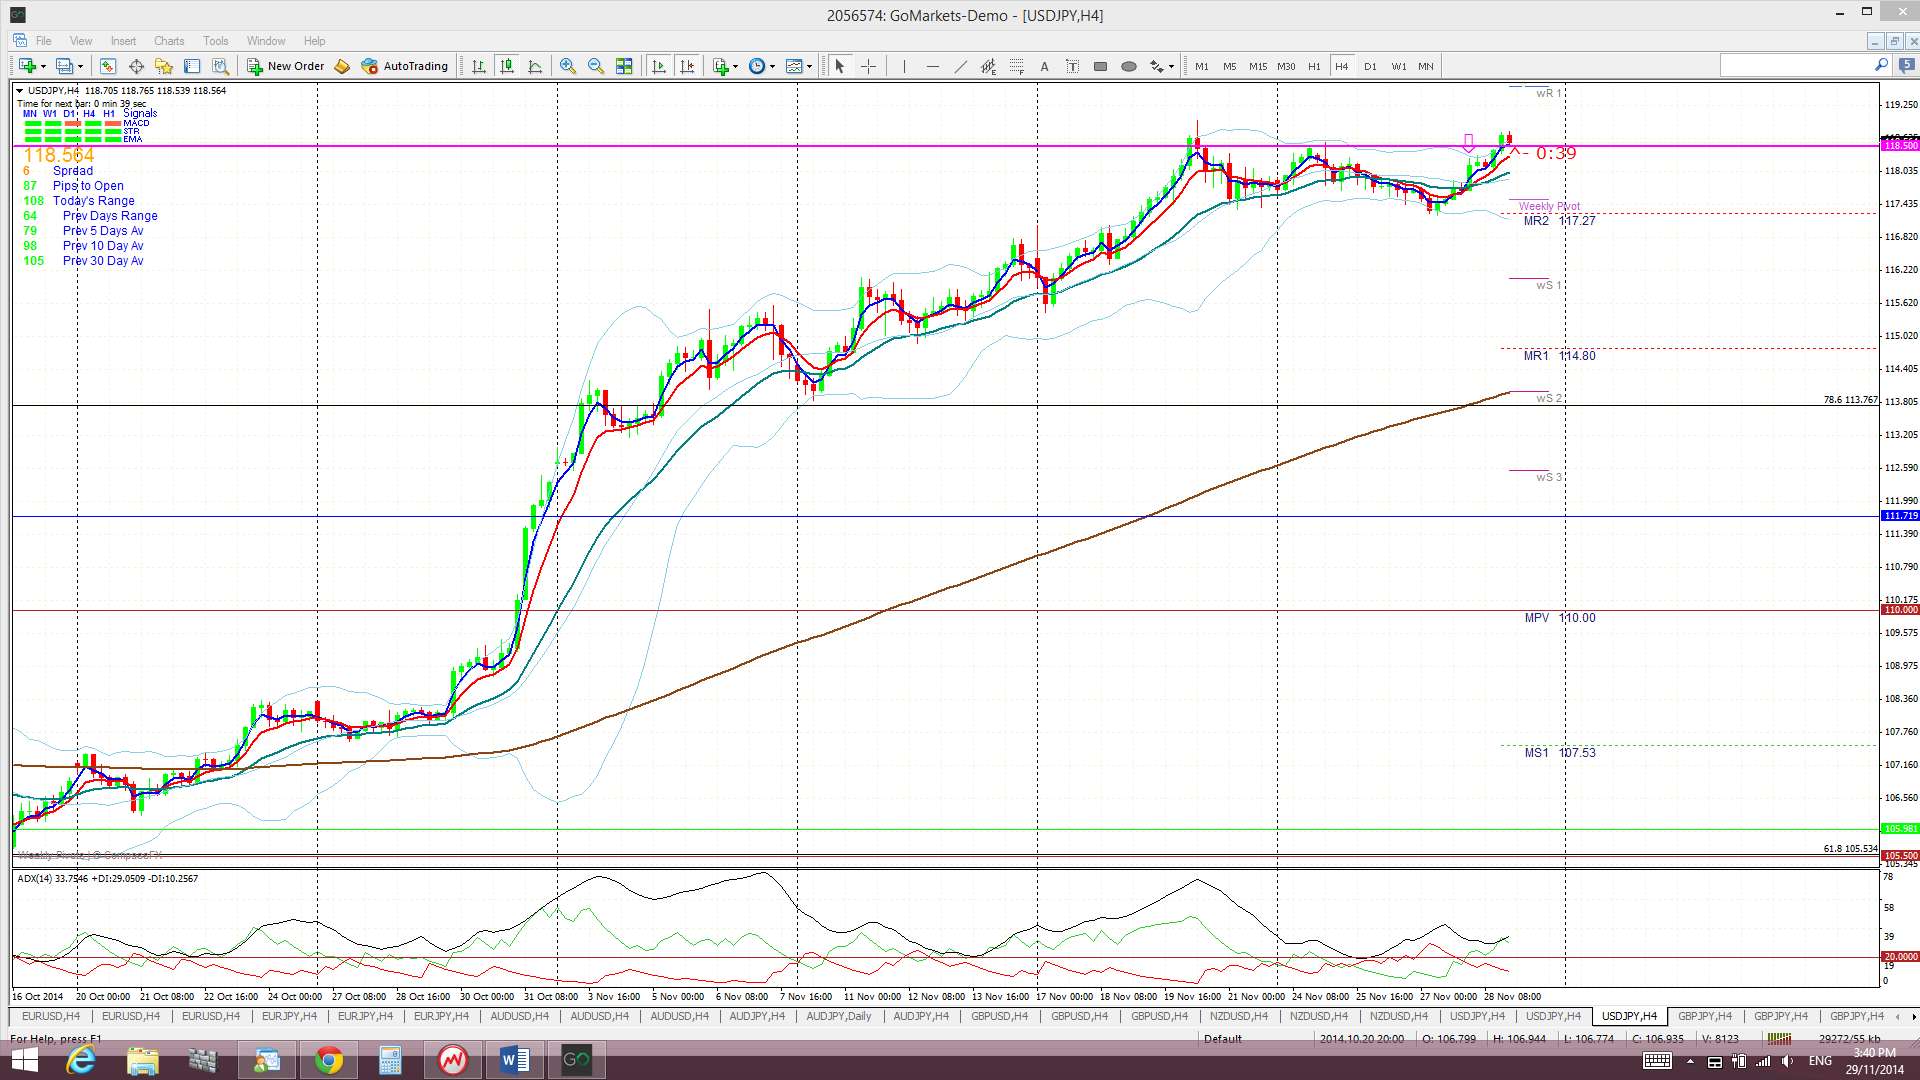
The Yen: U/J: The U/J chopped sideways under the 118.5 level for much of the week until USD strength kicked in again on Friday. This pair then rallied, triggered a new TC signal and managed to close above the 118.5 level.
Price is still trading above the Cloud on the 4hr, daily, weekly and monthly charts which is a bullish. November 2013 was the first monthly candle close above the Ichimoku Cloud since mid-2007 and the bullish hold above the monthly Cloud continues to be noteworthy.
The weekly candle closed as a small bullish candle but the monthly candle closed as large and bullish.
Weekly Chart Bullish Cup’ n’ Handle pattern: This pattern is getting close to its climax! The theory behind these patterns is that the height of the ‘Cup’ pattern is equivalent to the expected bullish move from the ‘handle’ breakout. The height of the Cup for the U/J weekly chart is around 2,400 pips. The interesting point here is that a 2,400 pip bullish move up from the ‘Handle’ would put price up near the 124 level. This level is the last major swing high for the U/J from back in 2007 and represents the 100% fib pullback for the move down in 2007 to the lows of 2012. This pattern has already given up to 1,800 pips of the 2,400 pip target!
- There is an open TC signal on this pair but I am cautious here given the bearish-reversal signal off the weekly USD candle..
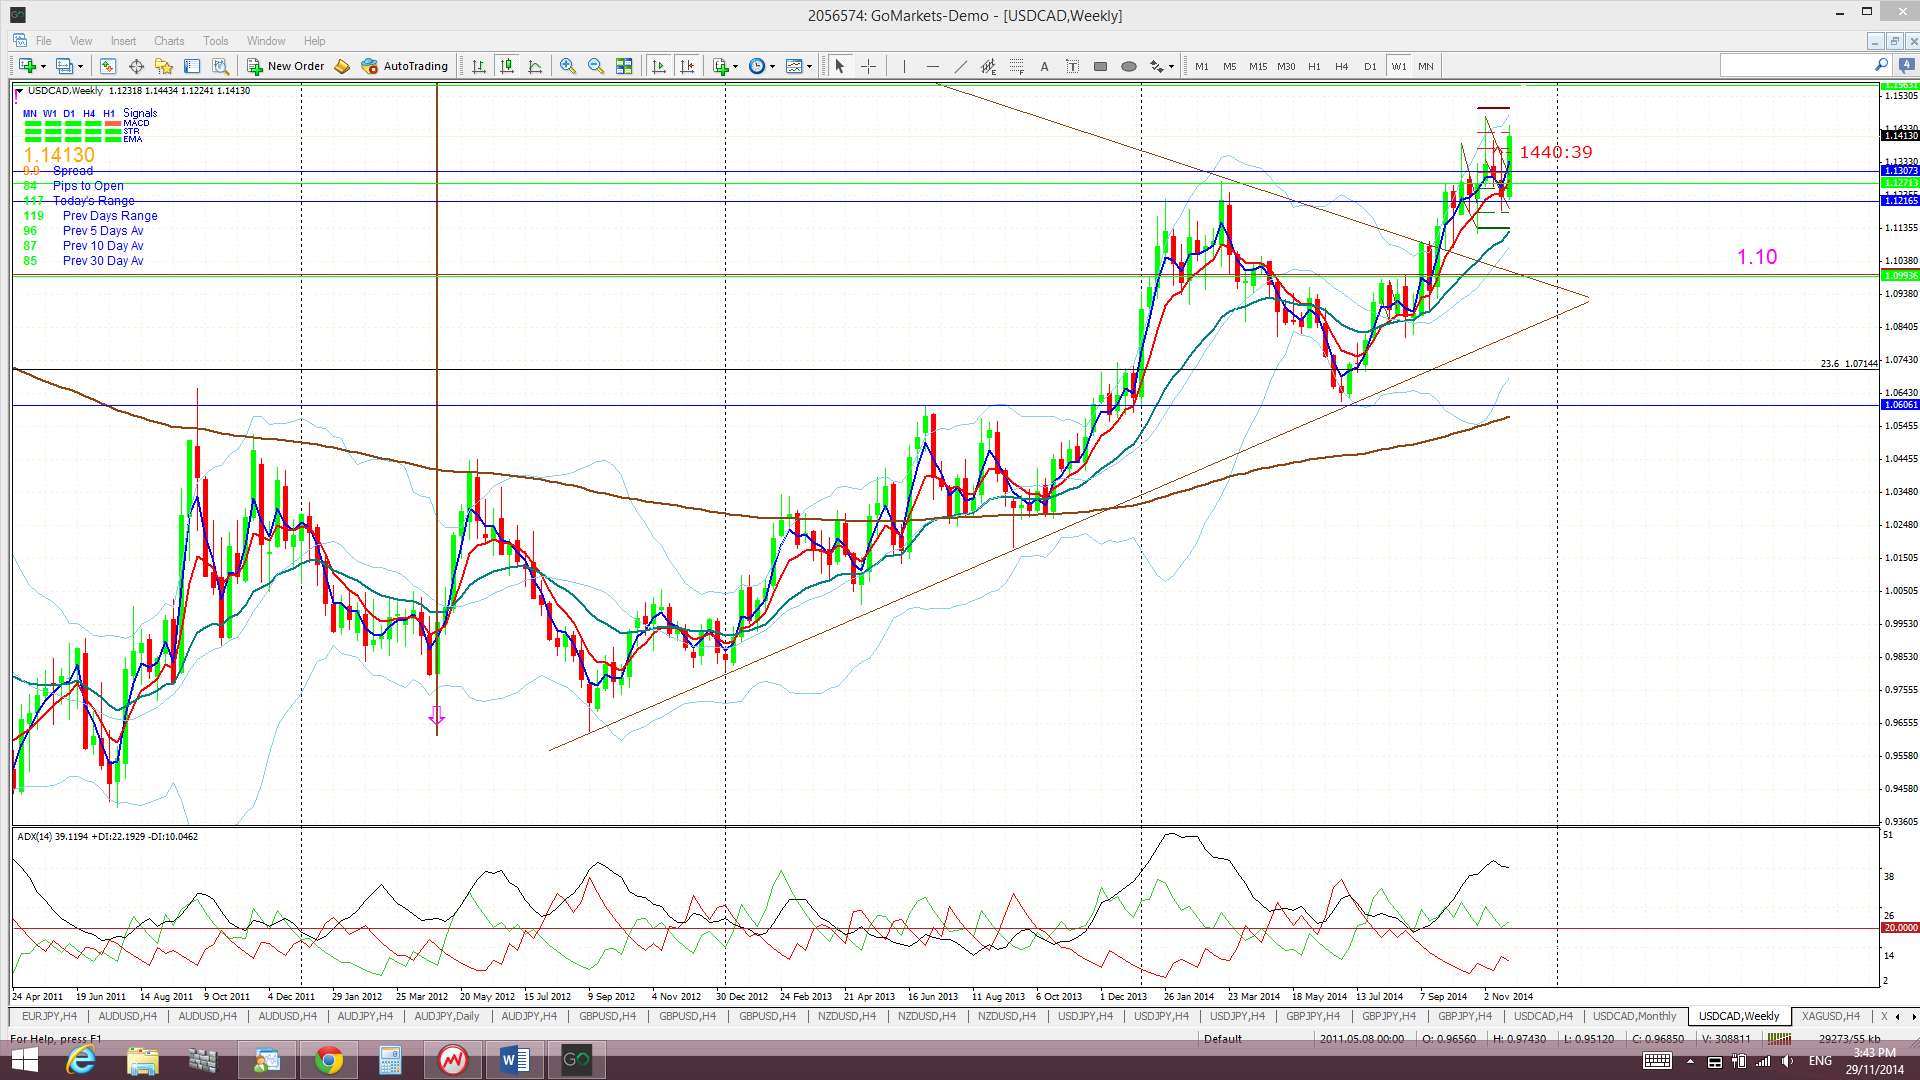
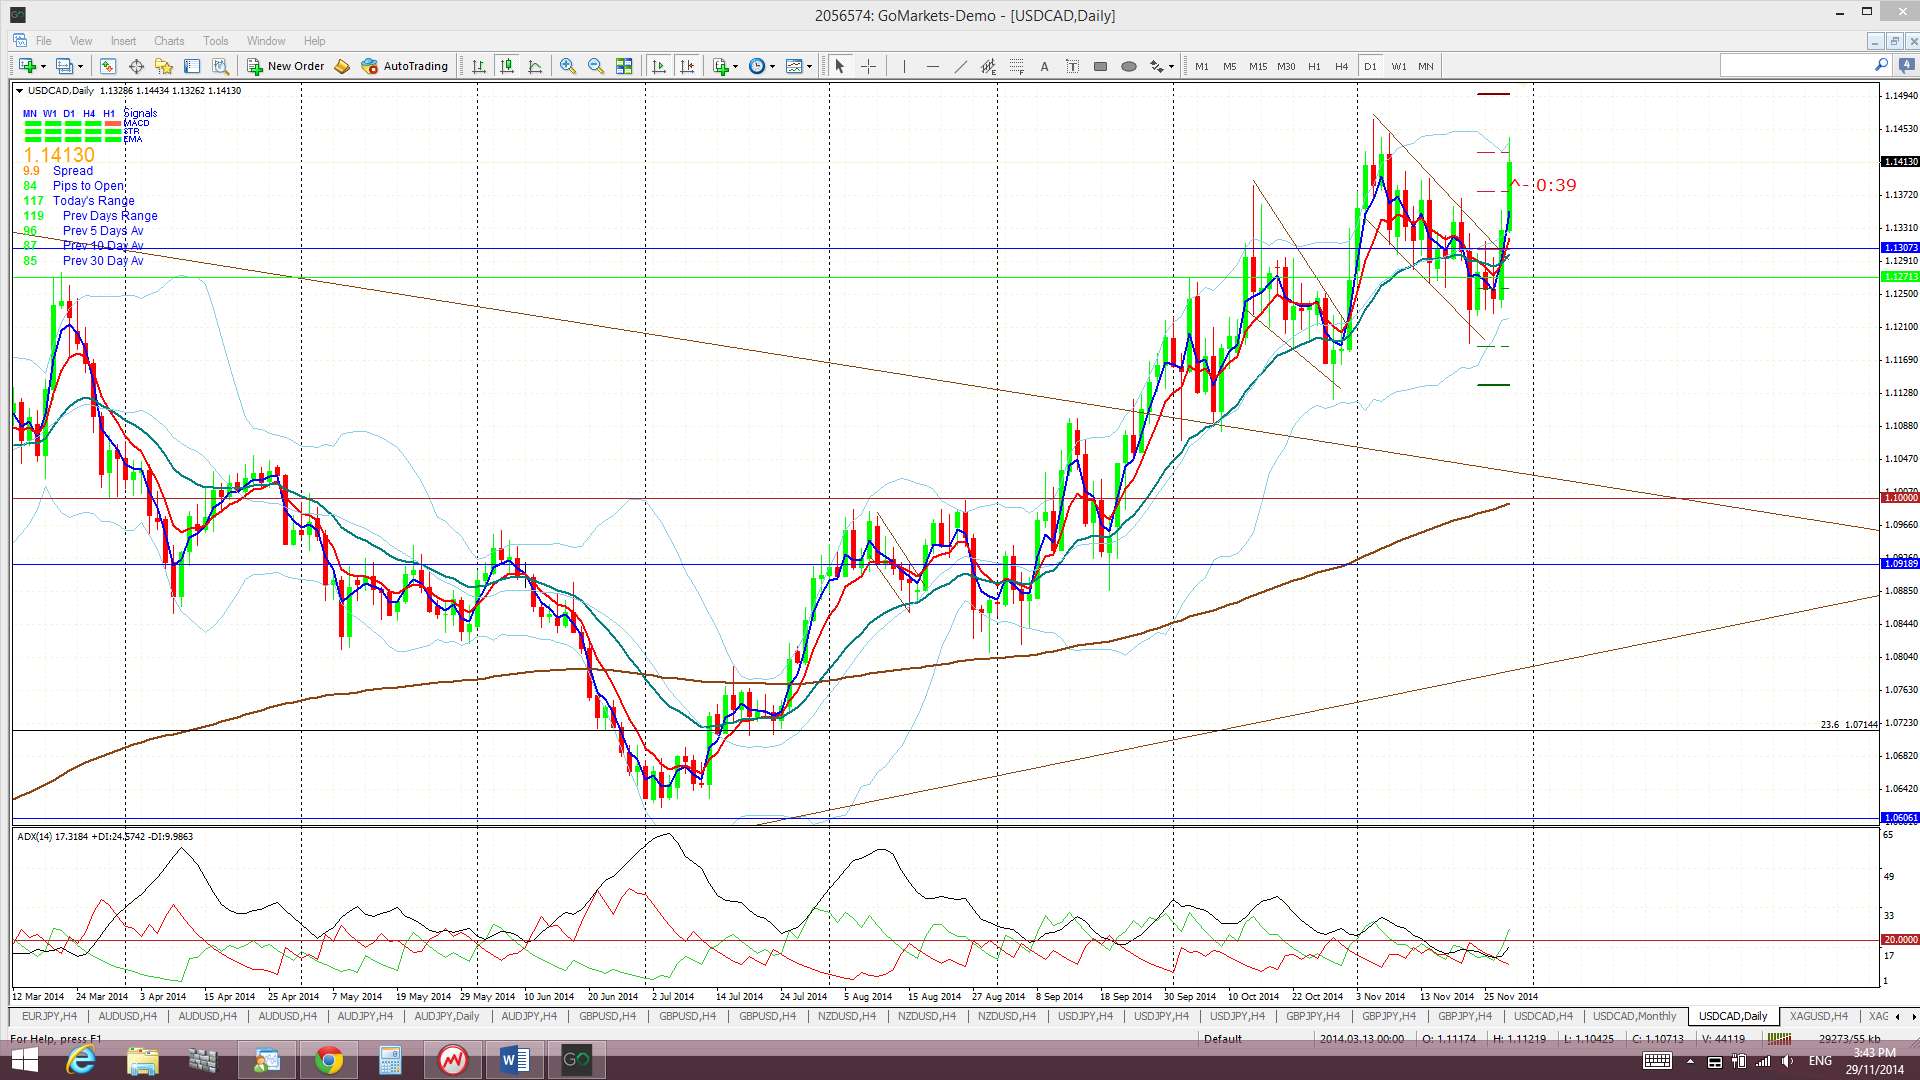
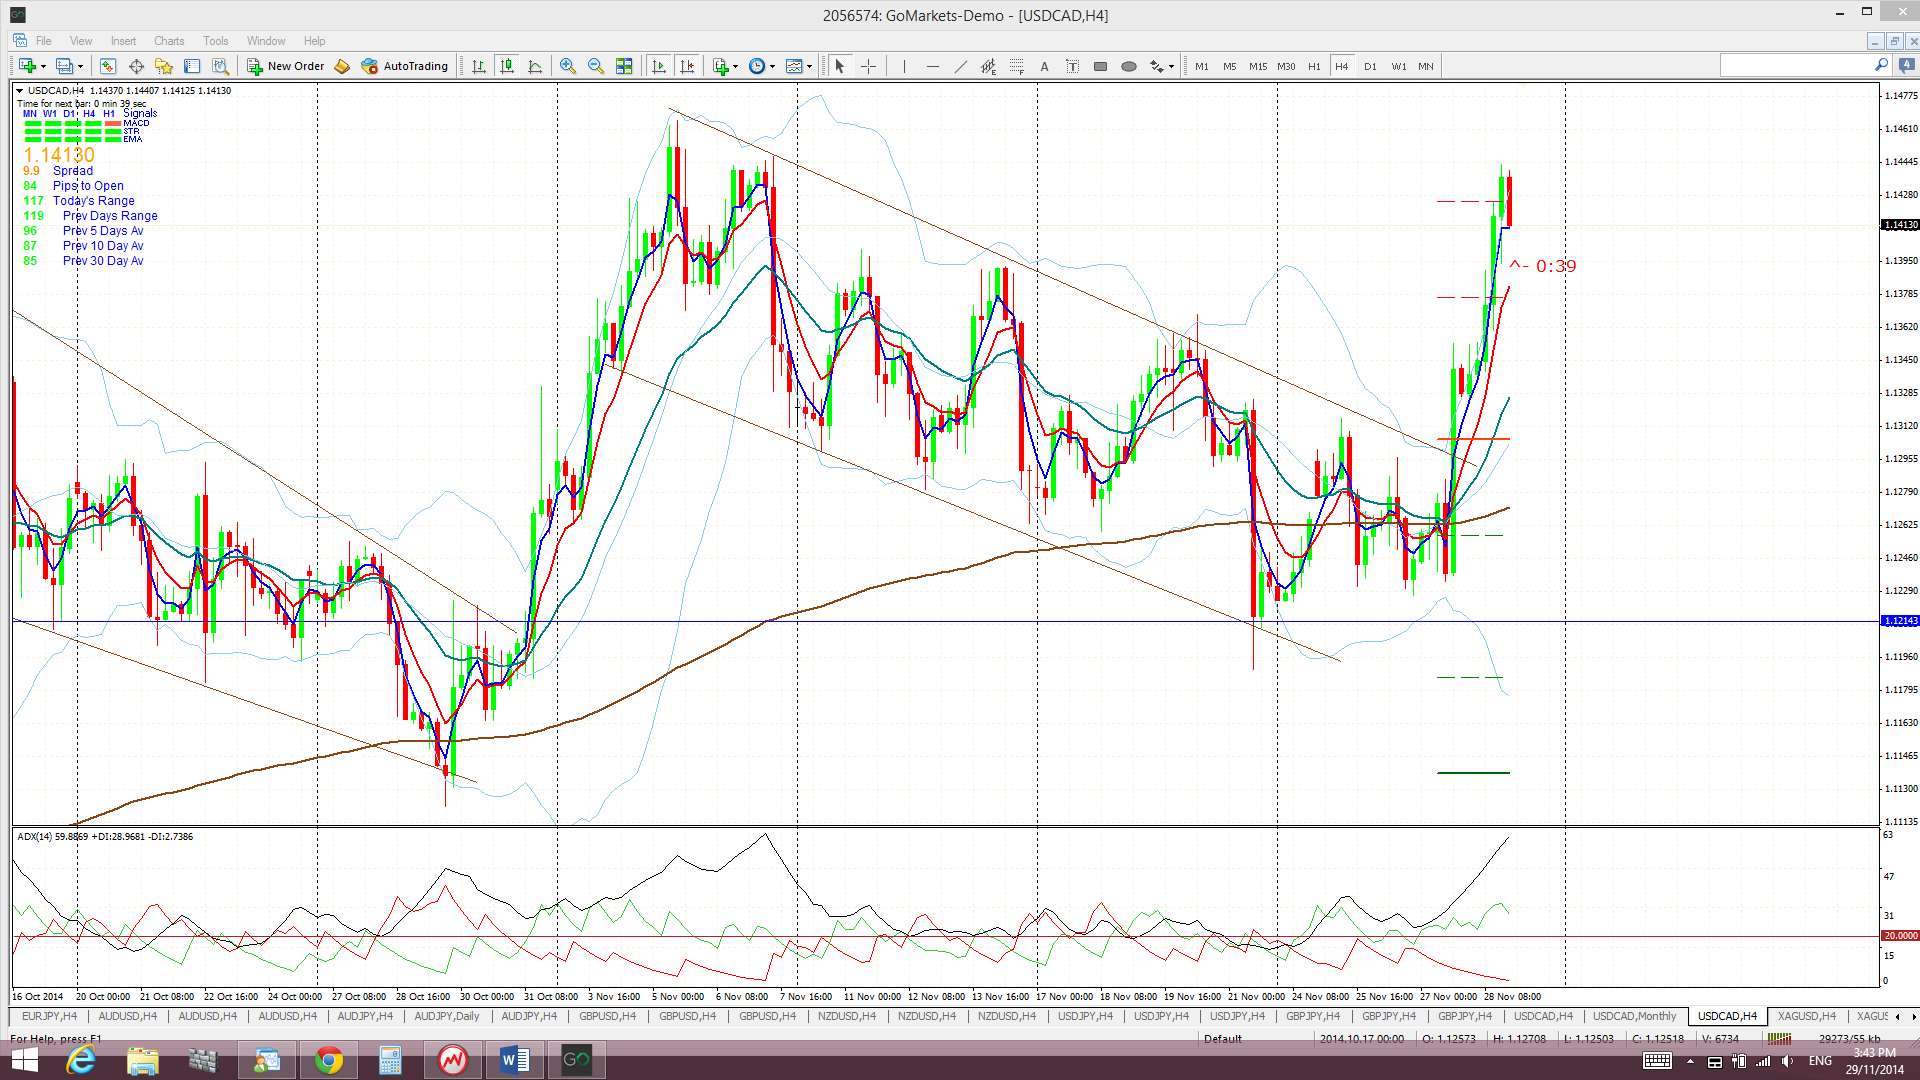
USD/CAD: The USD/CAD chopped around again for much of last week and traded within the descending wedge pattern. Falling oil prices towards the end of the week though put pressure on the CAD and this triggered a wedge breakout on this pair that gave up to 140 pips. This move also triggered a new TC signal but it wasn’t valid due to the large candle size.
Triangle breakout target: The Loonie has broken up and out from a major monthly chart triangle pattern that could deliver up to 2,500 pips. This 2,500 pip figure is evaluated from the height of the triangle. I have used the triangle height from the beginning of the bull trend line, as shown in the monthly chart below. The height of the triangle is around 2,500 pips and, thus, this would be the expected move from any breakout action. This is where it gets interesting! Extrapolating a bullish move from this triangle places price up at the 61.8% fib level. These fibs levels are popular targets in retracement moves and so this adds some confluence to this as a possible target.
Price is now trading above the Cloud on the 4hr, daily, weekly and monthly charts which is a significant bullish shift.
The weekly and monthly candles closed as a bullish with the weekly candle being almost an ‘engulfing’ candle.
- I’m watching for any new valid TC signal on this pair.

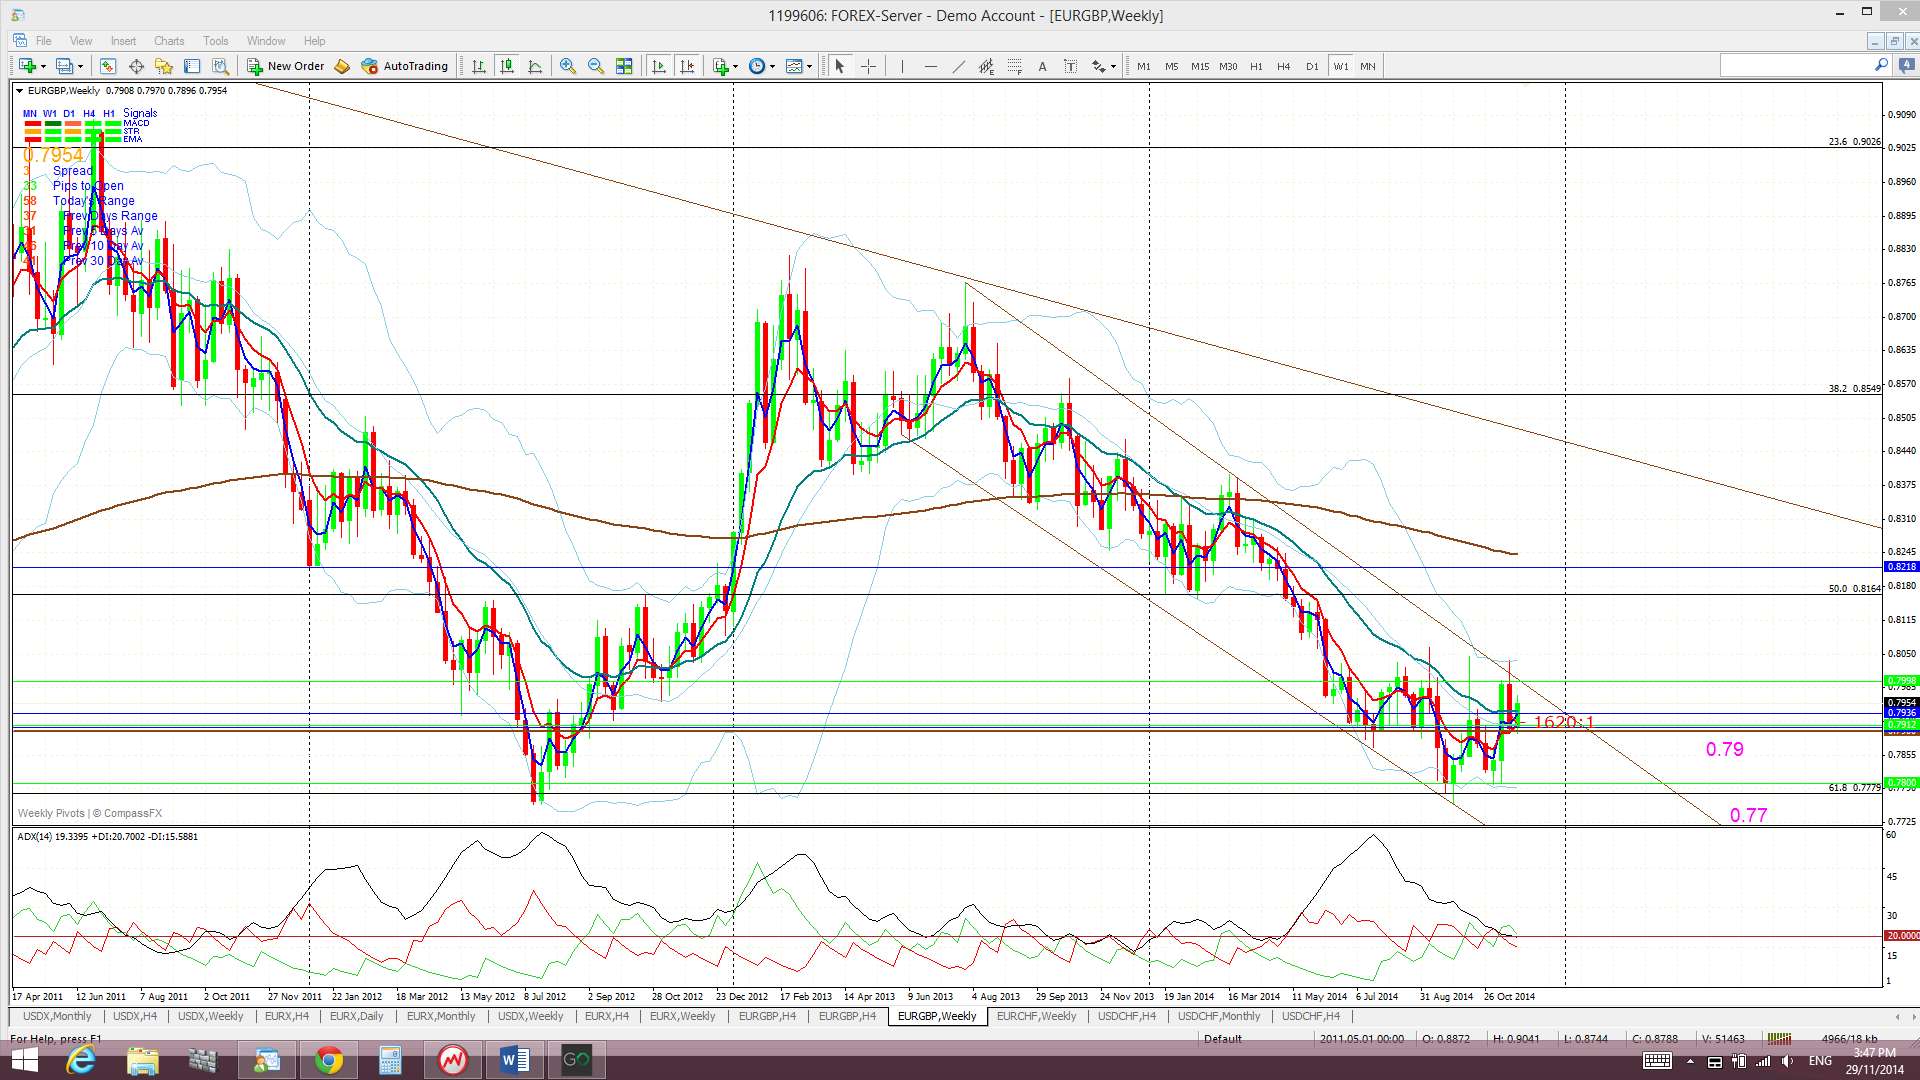
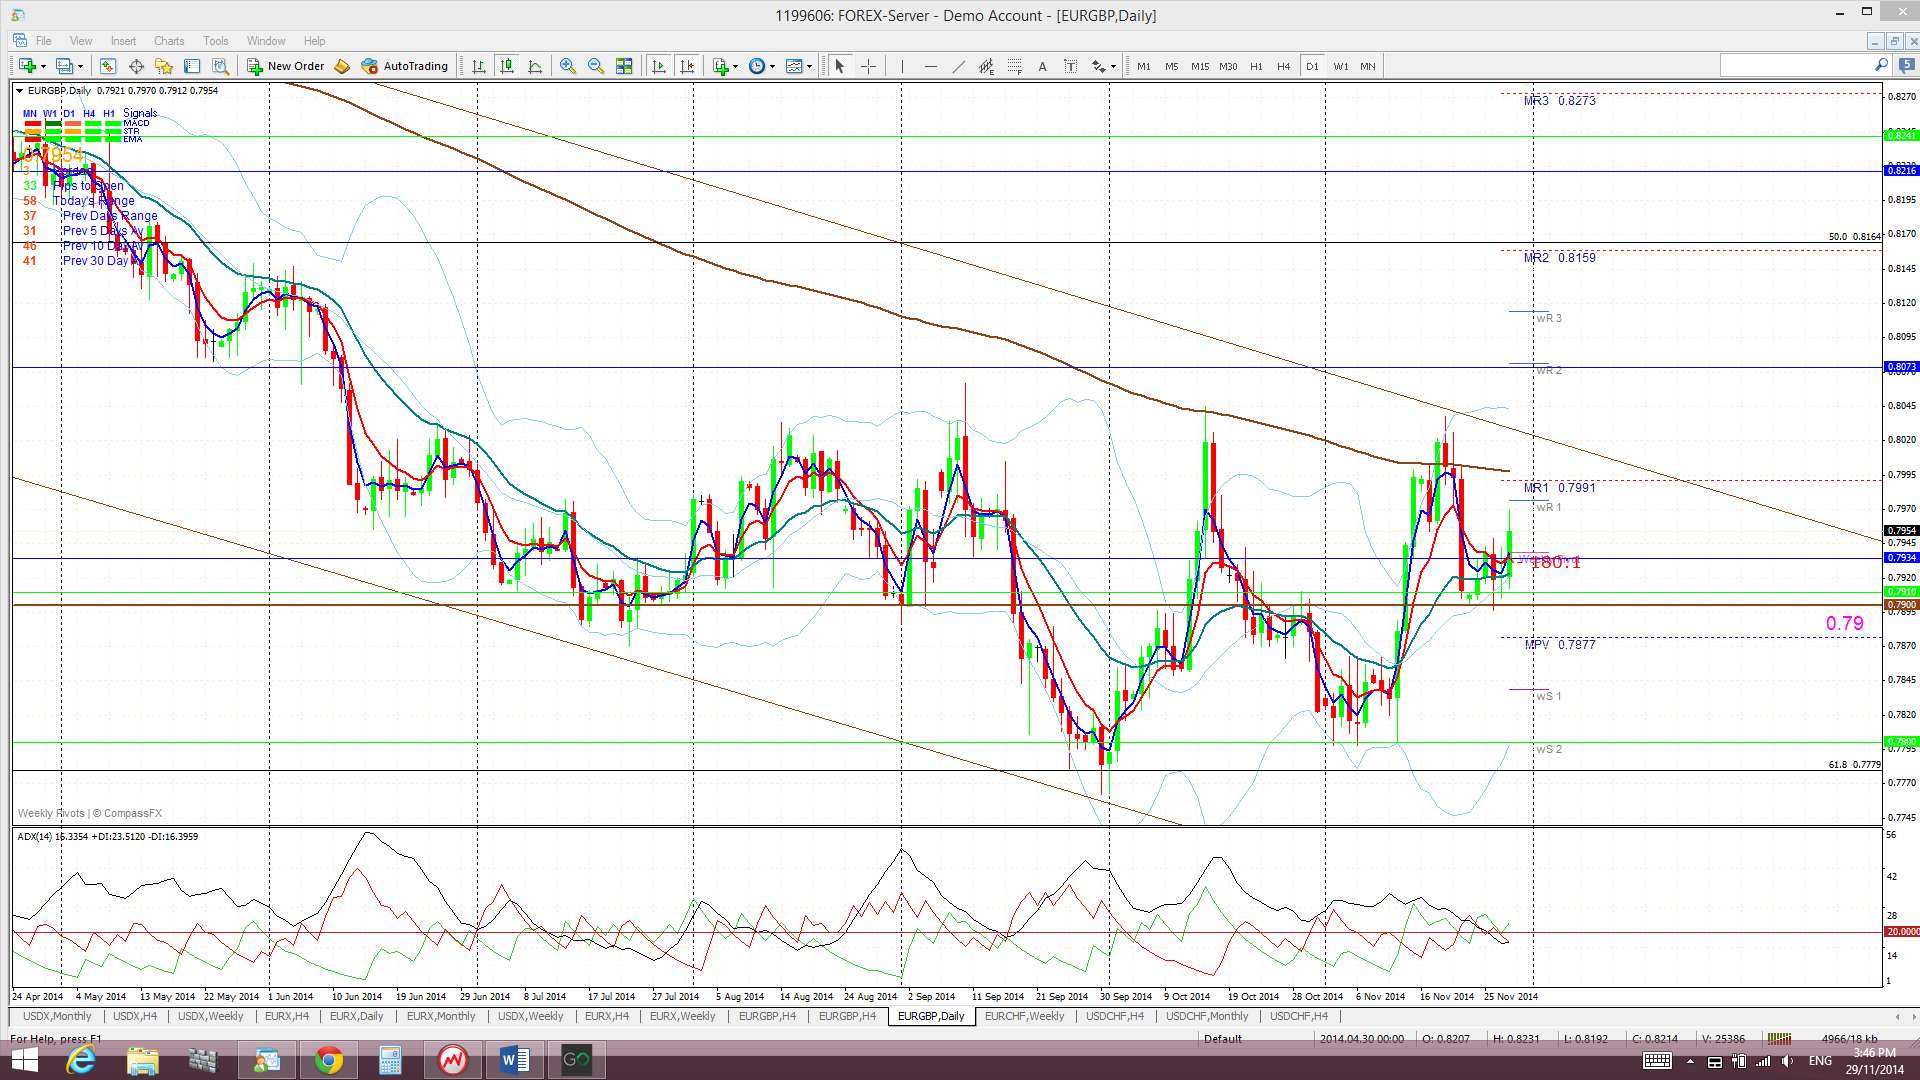
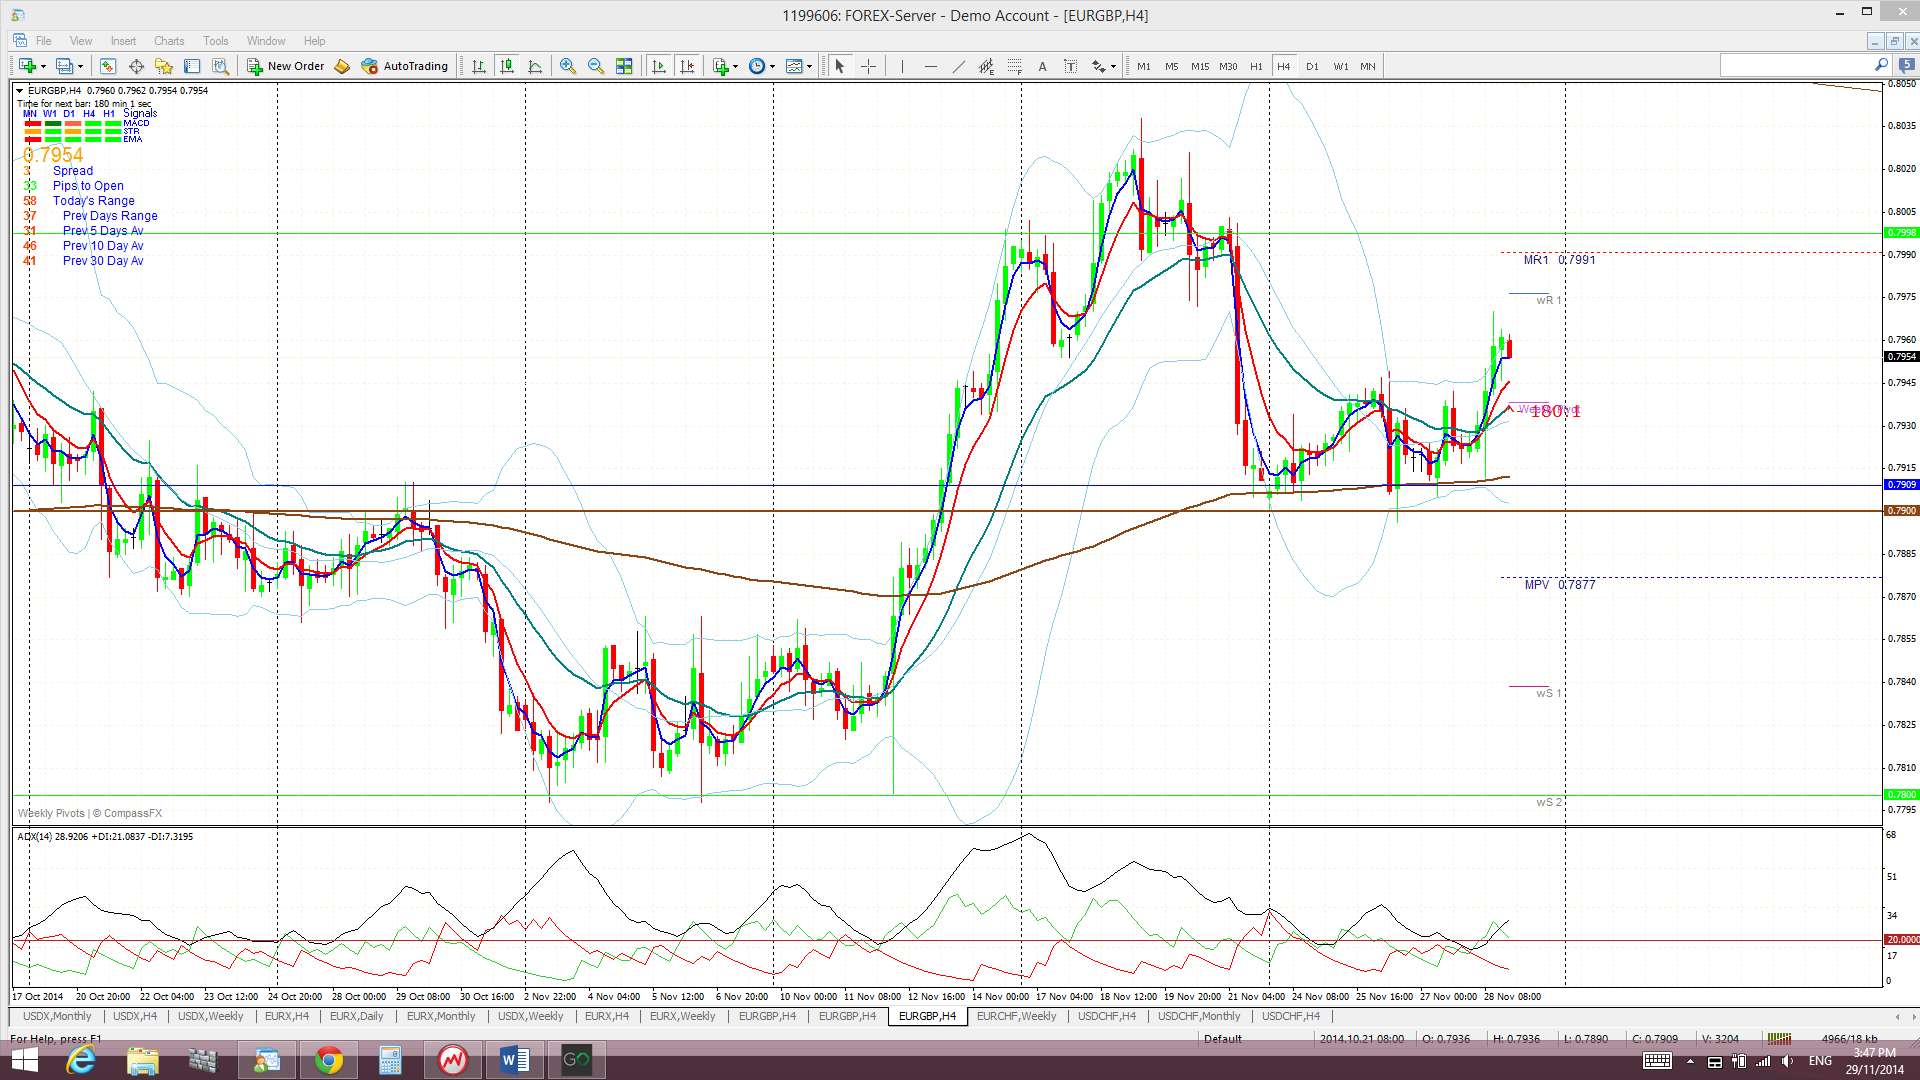
EUR/GBP: This pair simply chopped sideways last week above 0.79 support.
The E/G is trading in the top edge of the 4hr Cloud, just below daily Cloud and well below the weekly and monthly Cloud.
The weekly candle closed a bullish coloured ‘Inside’ candle reflecting indecision but the monthly candle closed as a large bullish candle.
- I’m watching for any new TC signal and the daily chart’s channel trend lines.

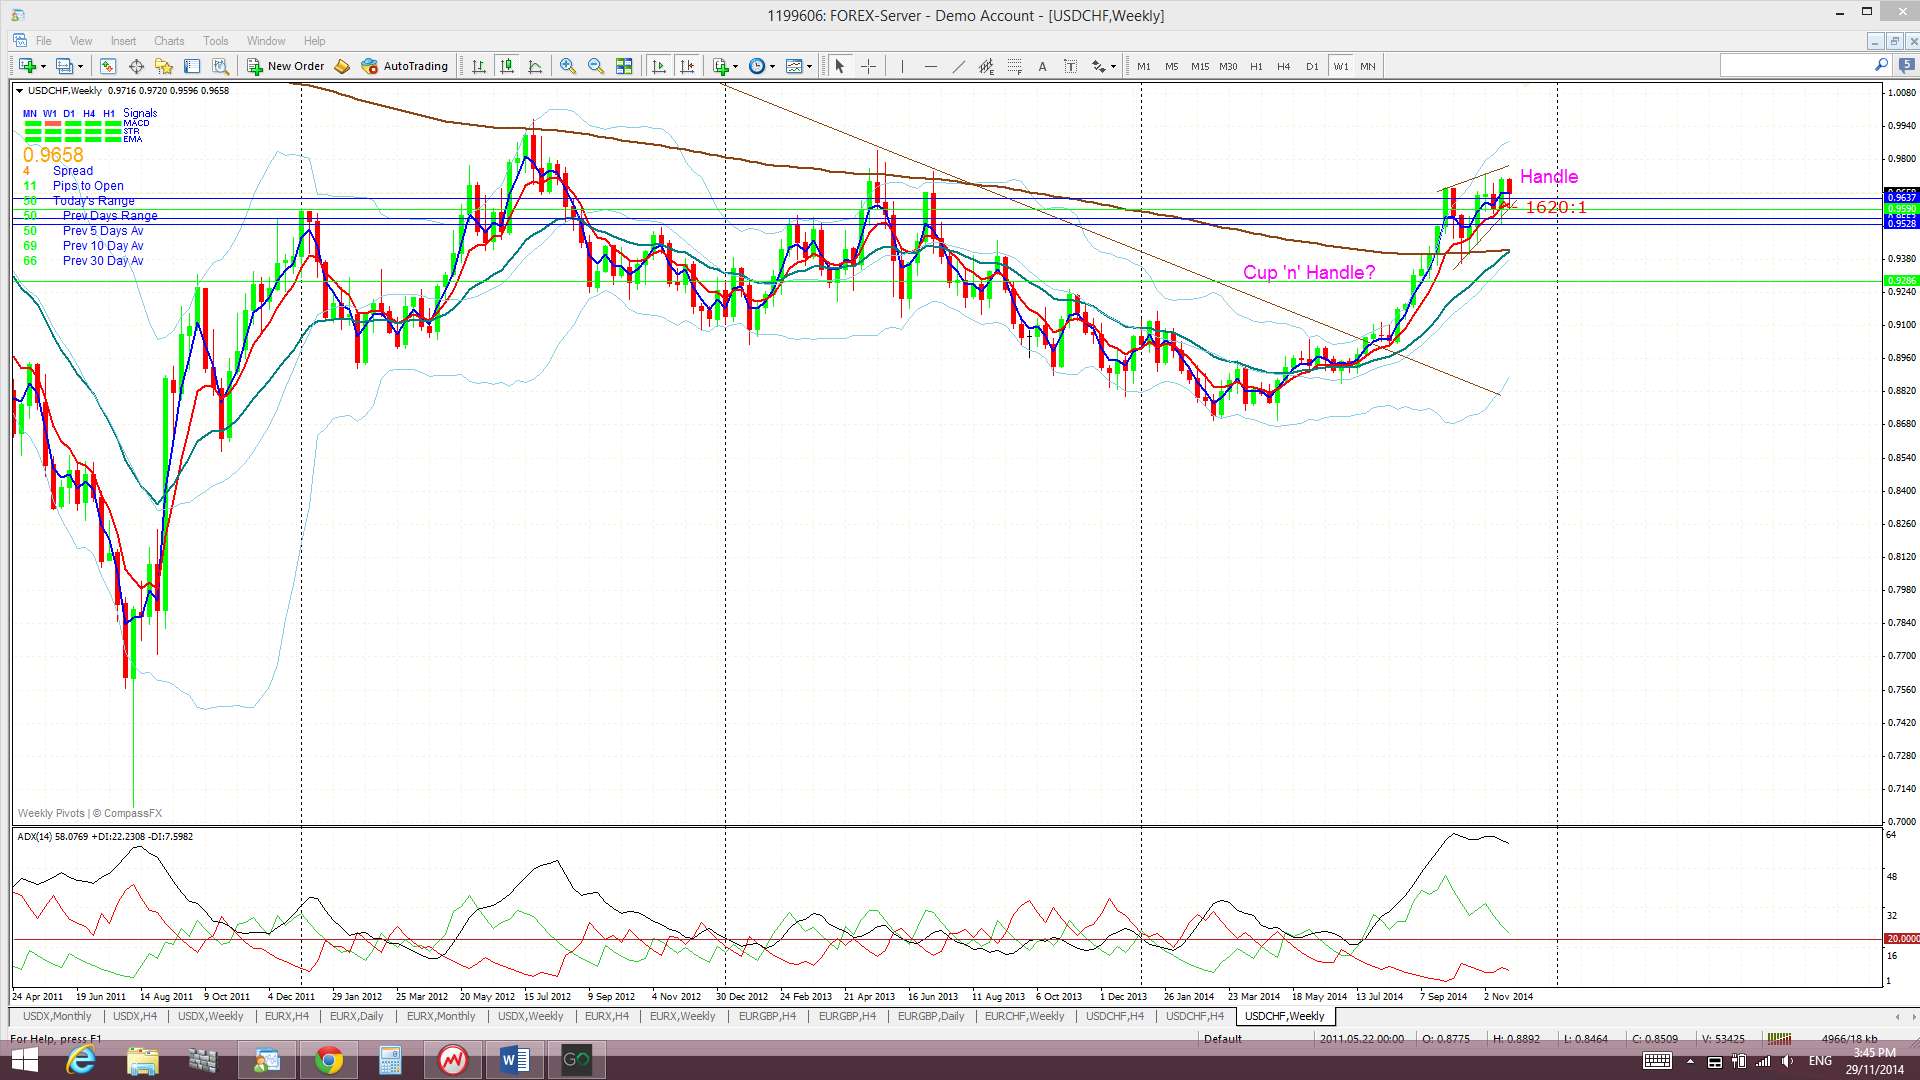
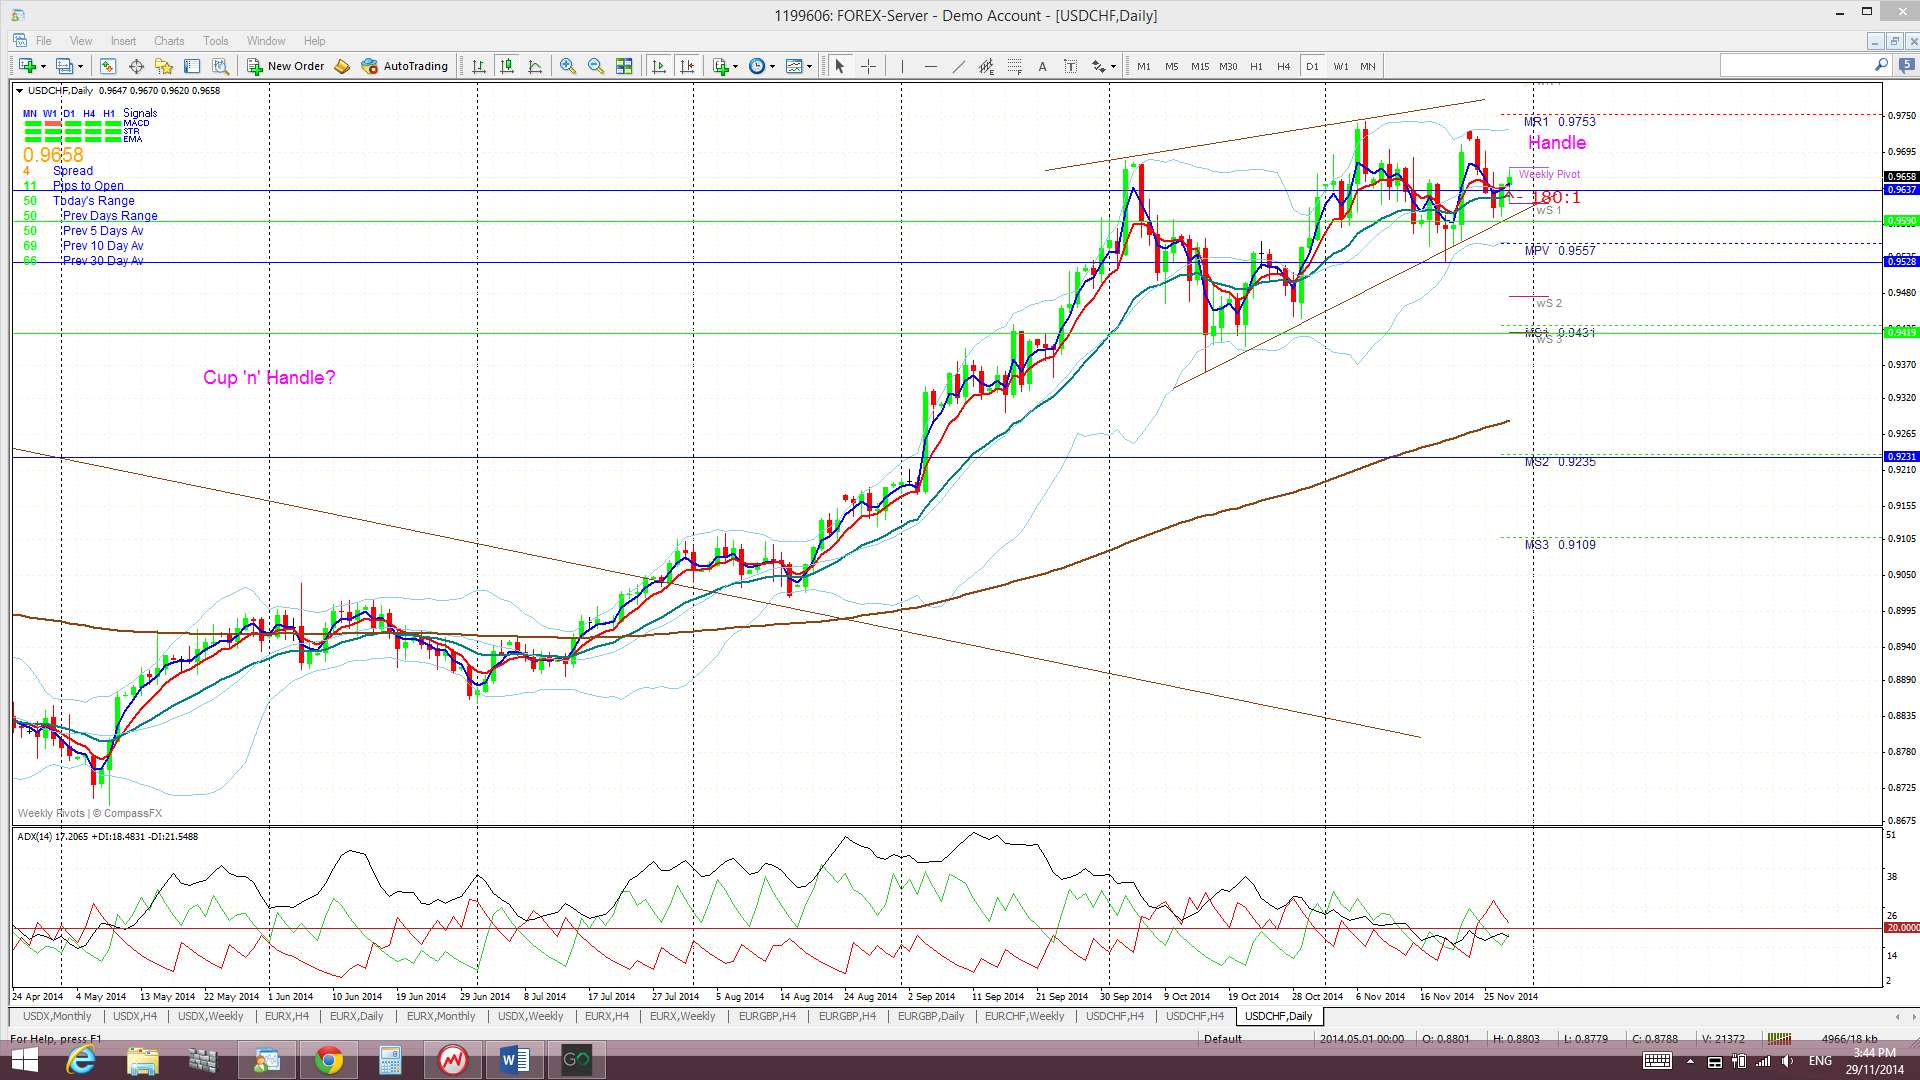
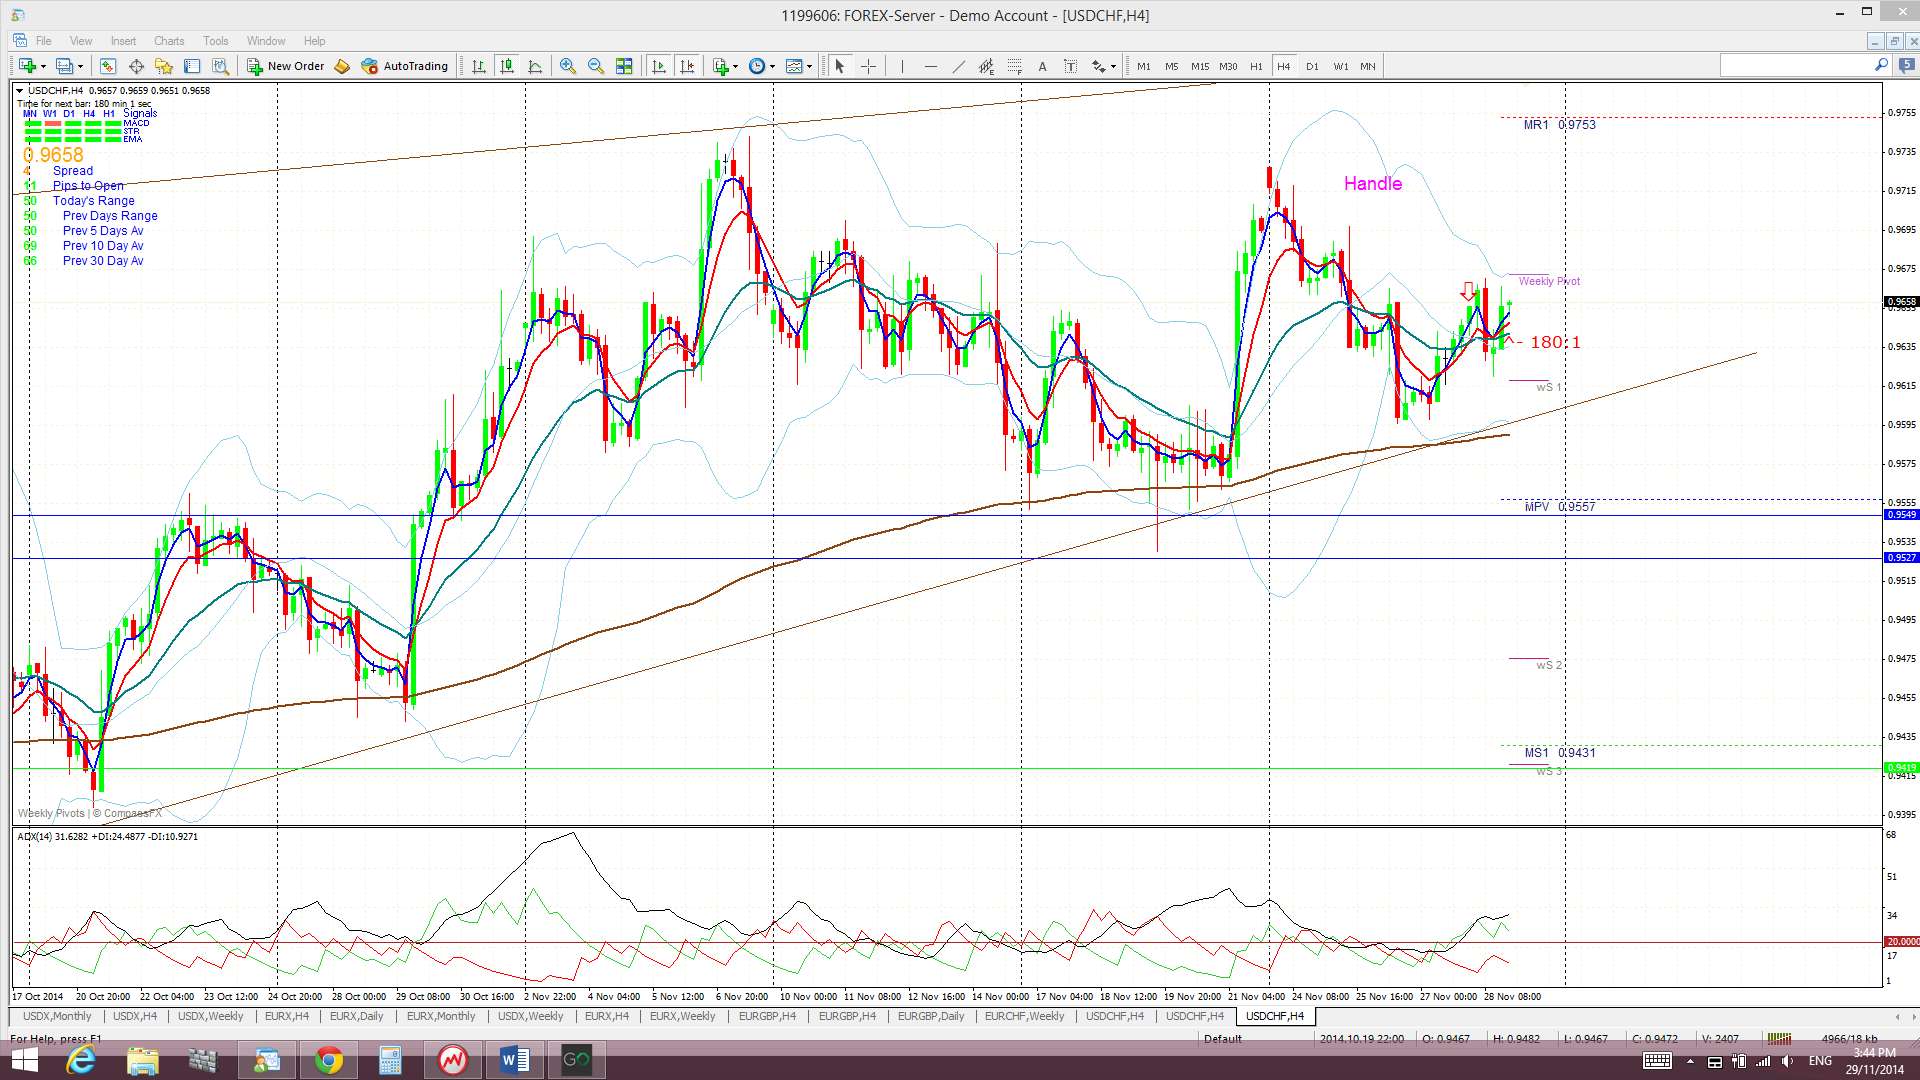
USD/CHF: Not much has changed here again this week. In a similar pattern to last week, price drifted a bit lower to start the week but bounced again up and off from the bottom trend line of the ‘Handle’ of the weekly chart’s bullish Cup ‘n’ Handle pattern.
This bullish Cup ‘n’ Handle pattern is brewing on the weekly chart BUT, given the Swiss Referendum on Nov 30th, I’d be waiting until after then to confirm any such pattern. Fundamental news events will always trump a technically based move.
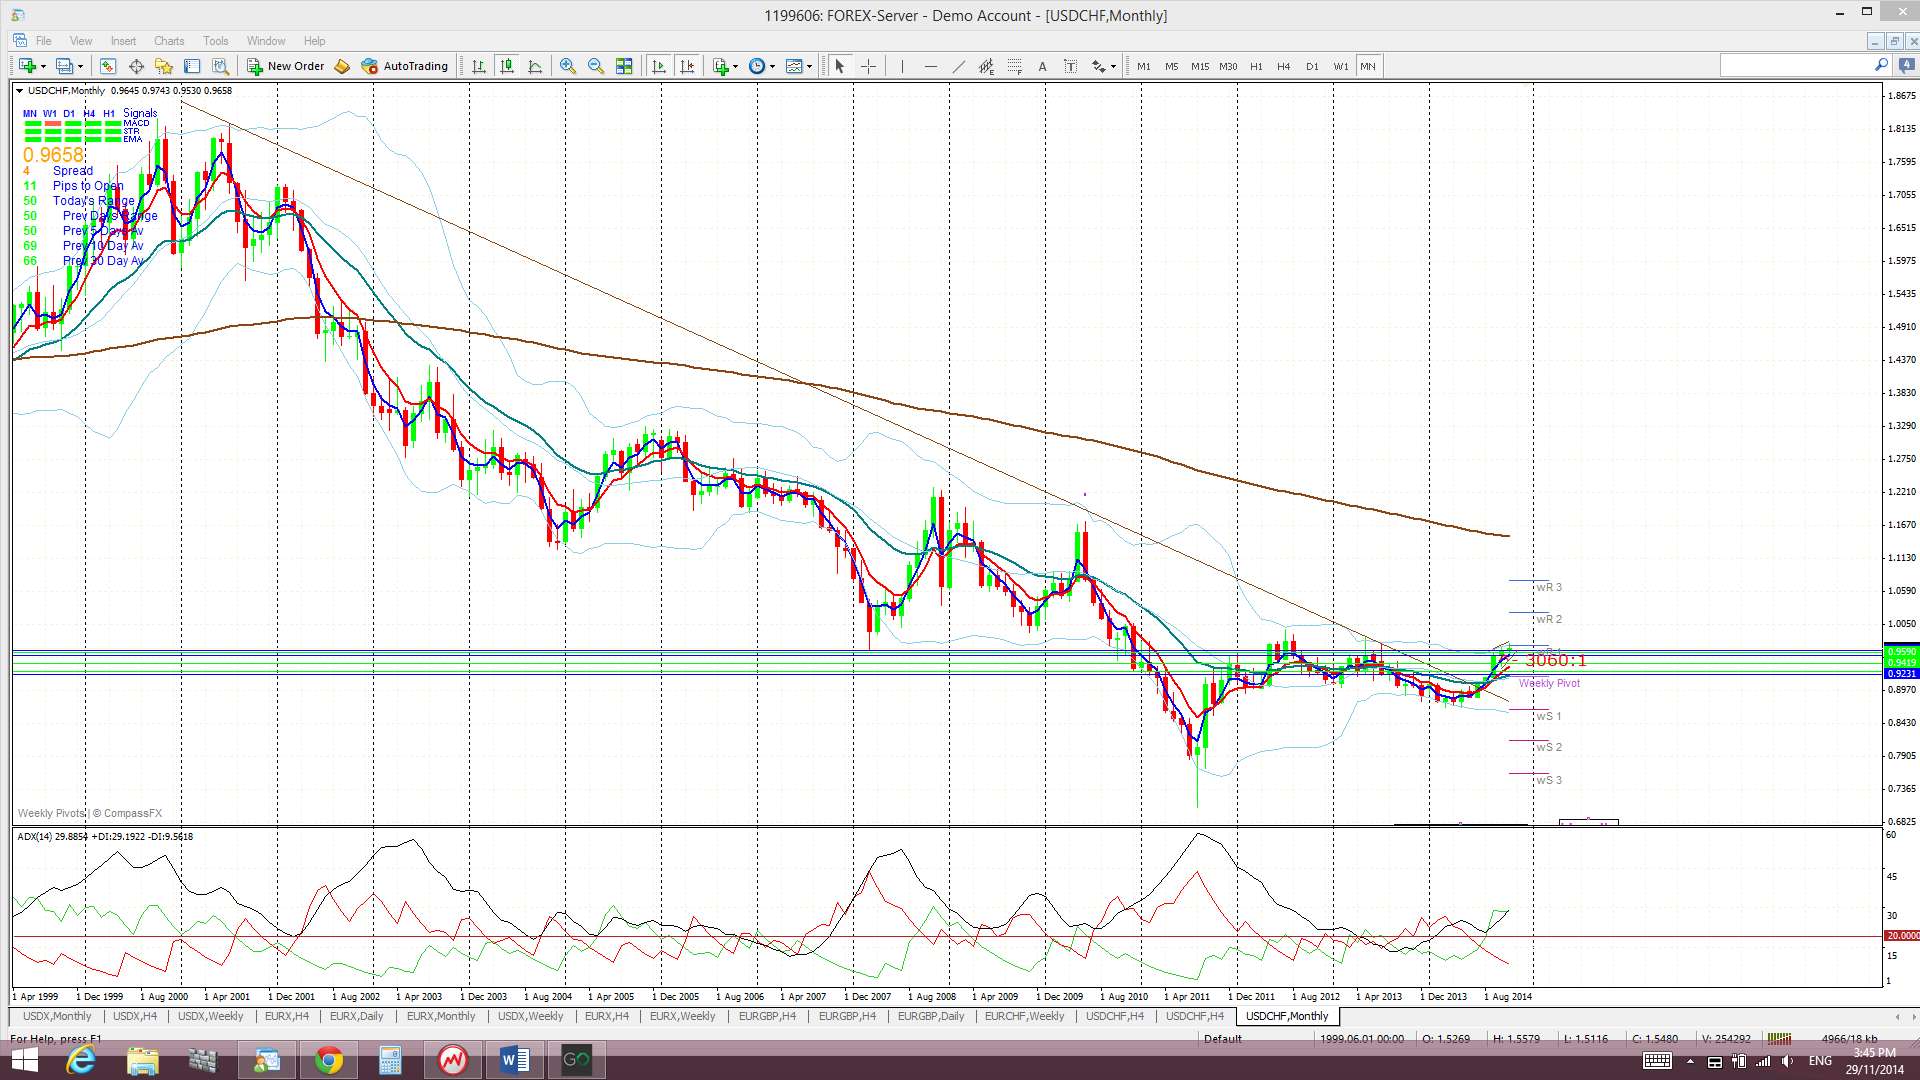
The more significant technical feature of note is the inflection-point shift seen on the monthly chart. A 14 year bear trend line was broken back in July and this major shift was associated with strong momentum, as reflected by the ADX. This polarity shift alone supports a long trade focus but, as mentioned above, I’d be waiting until the Referendum is out of the way as I think price action could chop around until then, thereby helping to form up the ‘Handle’ of any Cup ‘n’ Handle pattern!
The Swissie is now back trading above the Cloud on the 4hr (just), daily and weekly charts and in the top edge of the Cloud on the monthly chart. The more interesting chart is the monthly Ichimoku chart. The Swissie is trading in the top edge of the Cloud on the monthly chart and, whilst it didn’t manage to breakout for November, any subsequent close and hold above this Cloud would be bullish and support the polarity shift seen with the monthly chart’s trend line break:
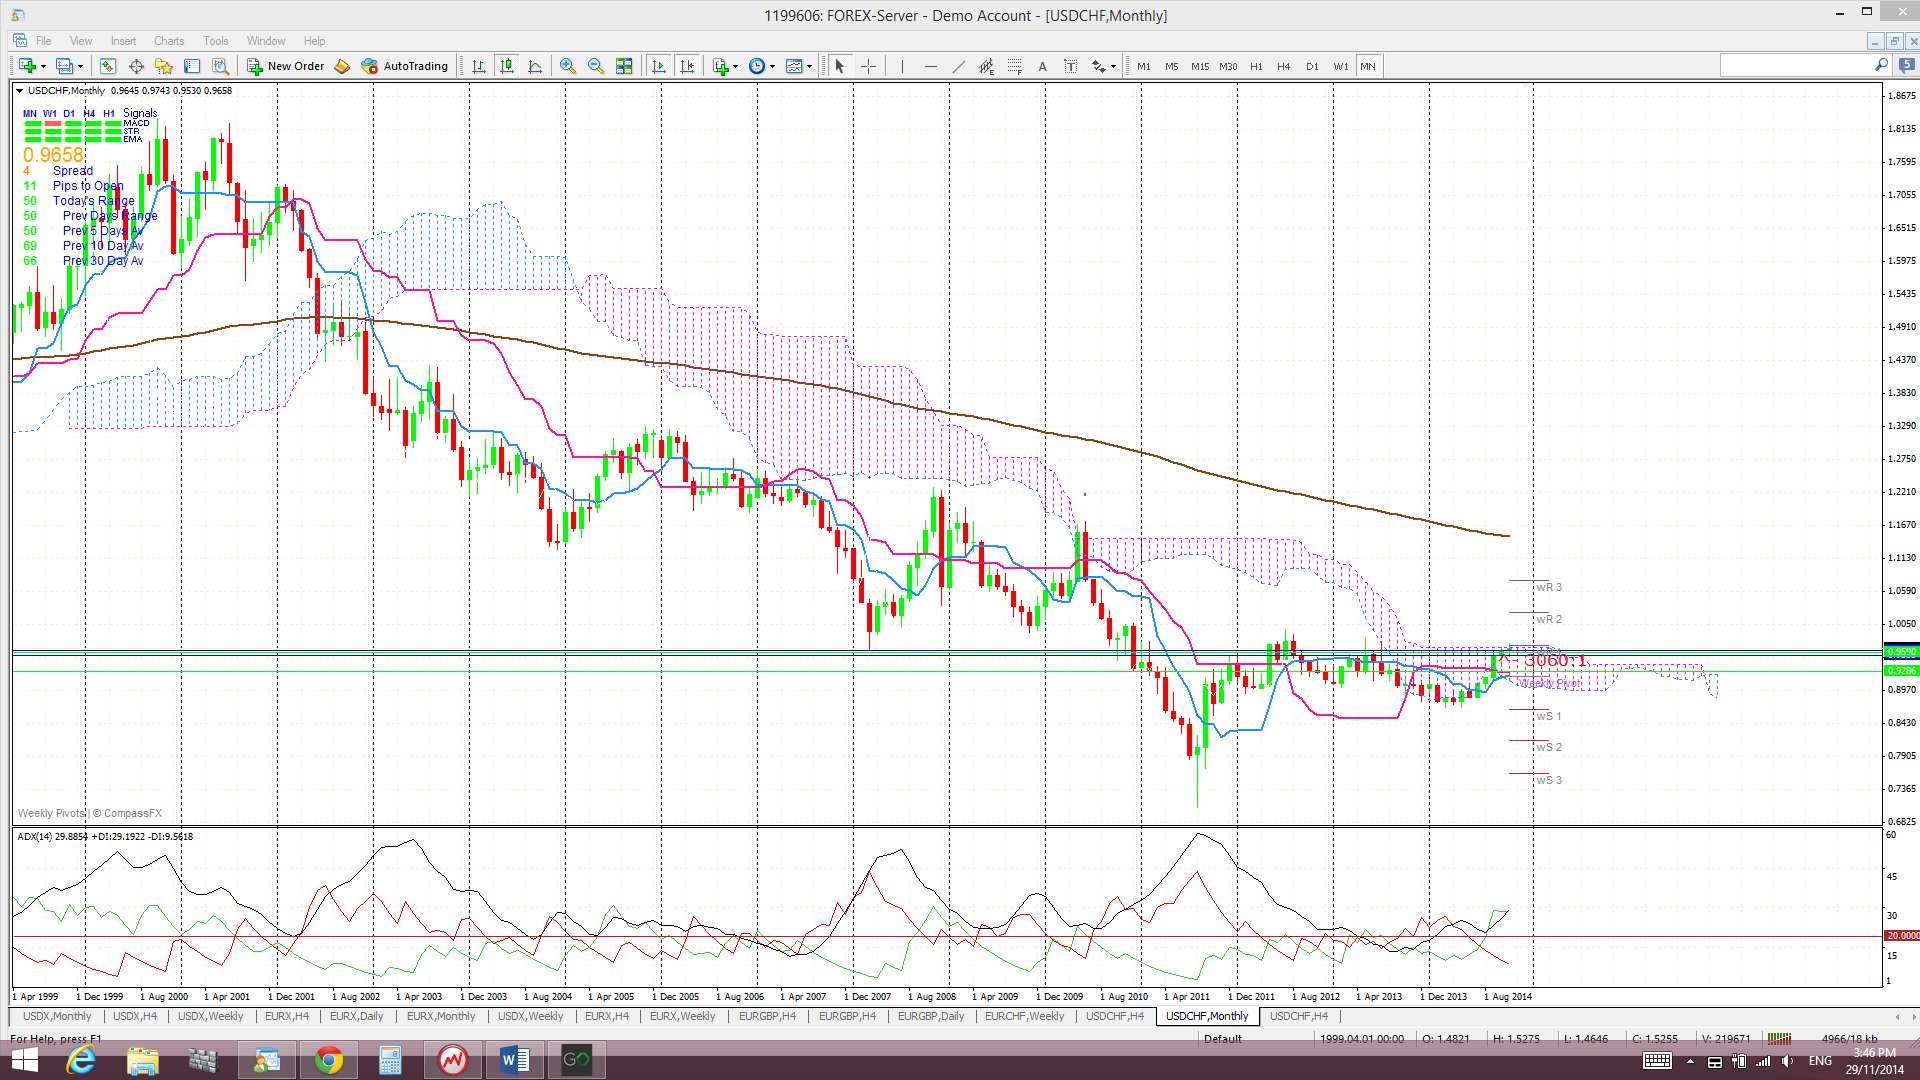
The weekly candle closed as a bearish coloured ‘inside’ candle reflecting the indecision here. The monthly candle closed a bullish coloured ‘Spinning Top’, also an indecision style candle.
- There is an open TC signal here but I am cautious here given the bearish-reversal signal off the weekly USD candle. I’m also watching the bullish Cup ‘n’ Handle pattern.
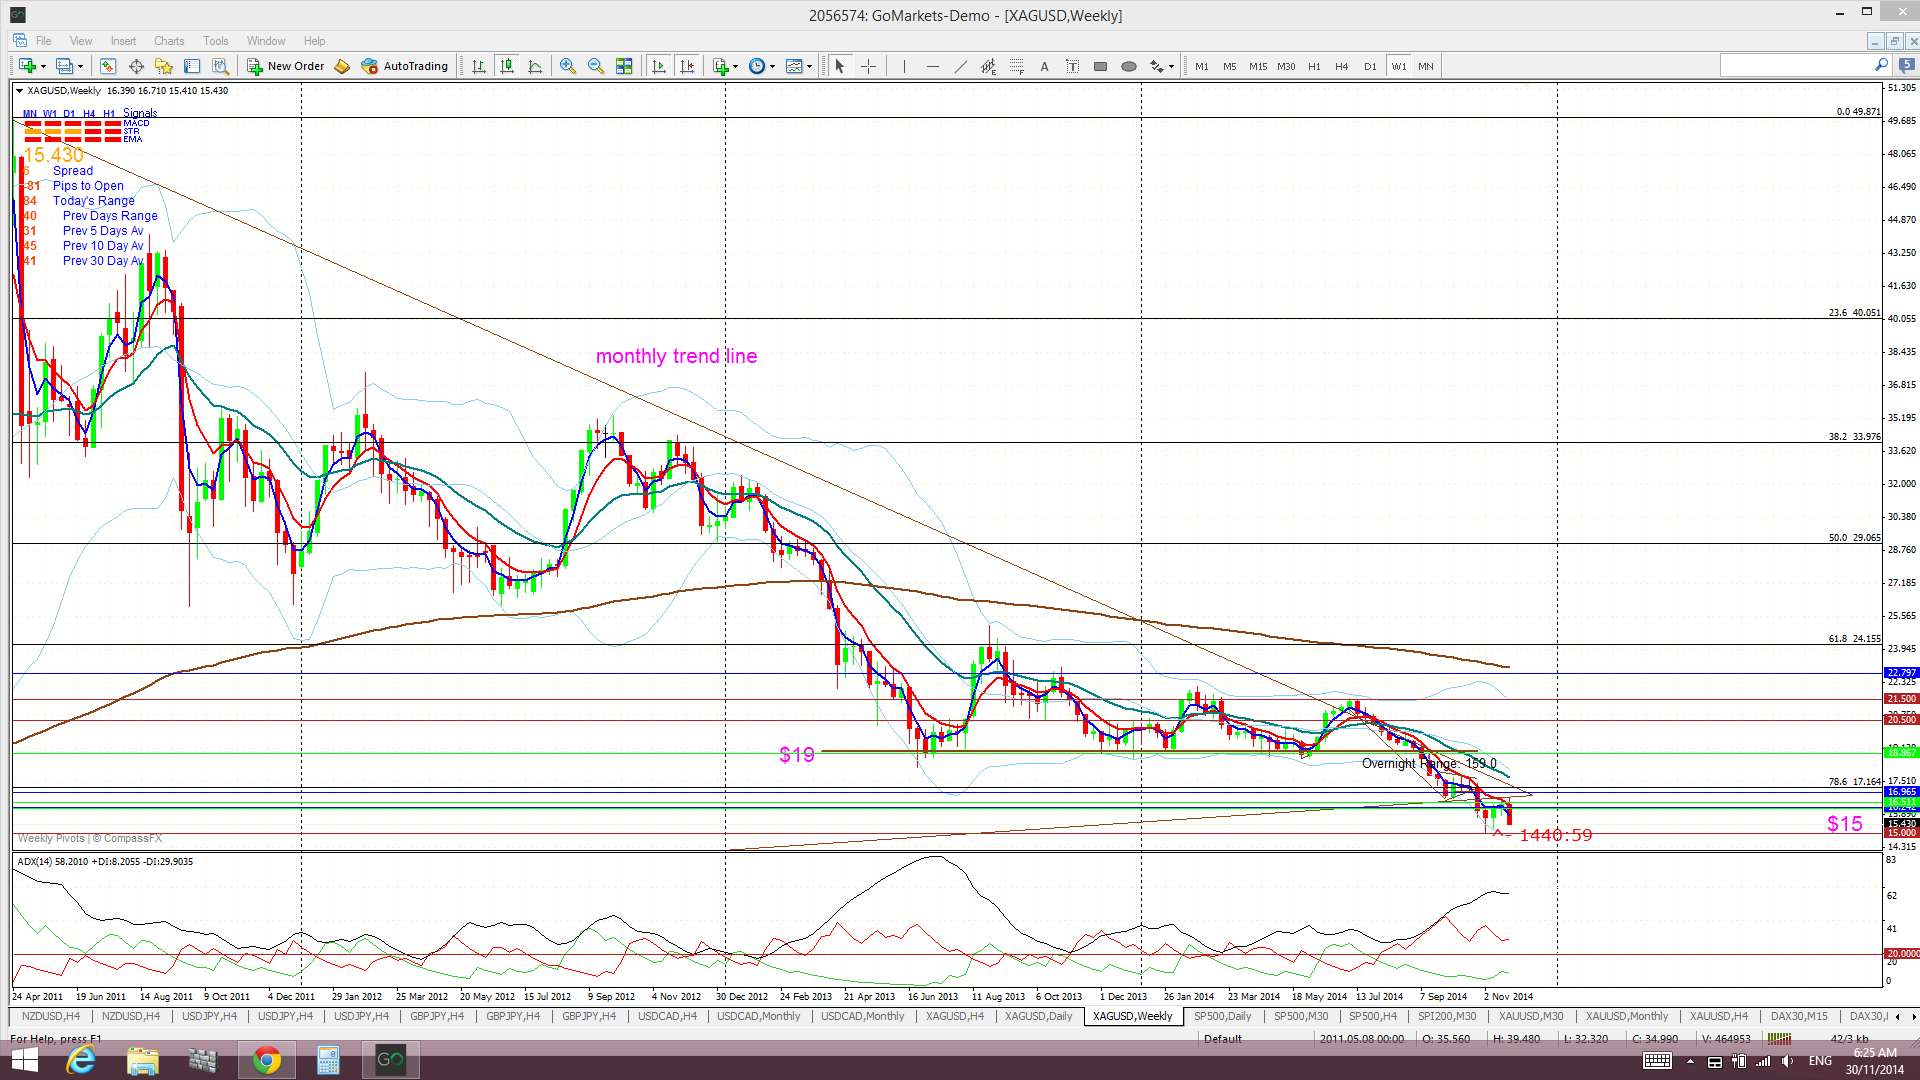
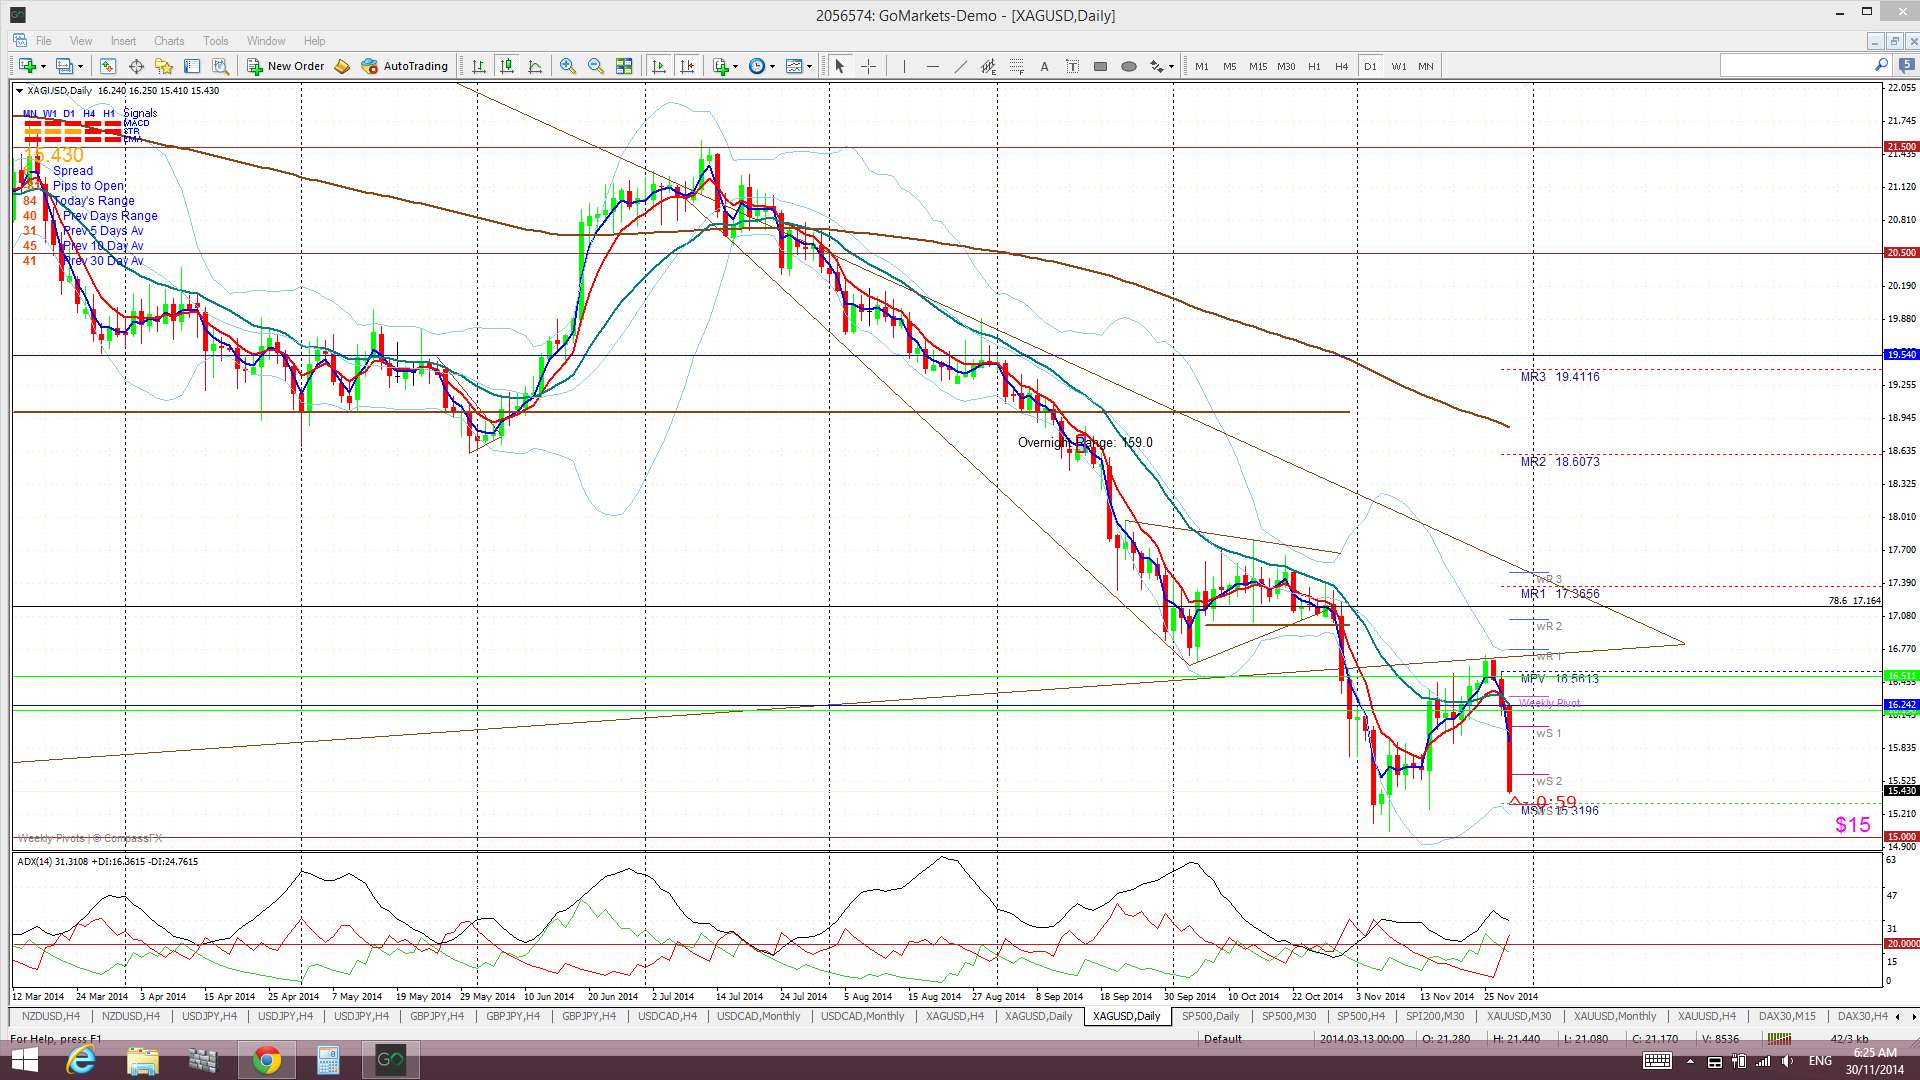
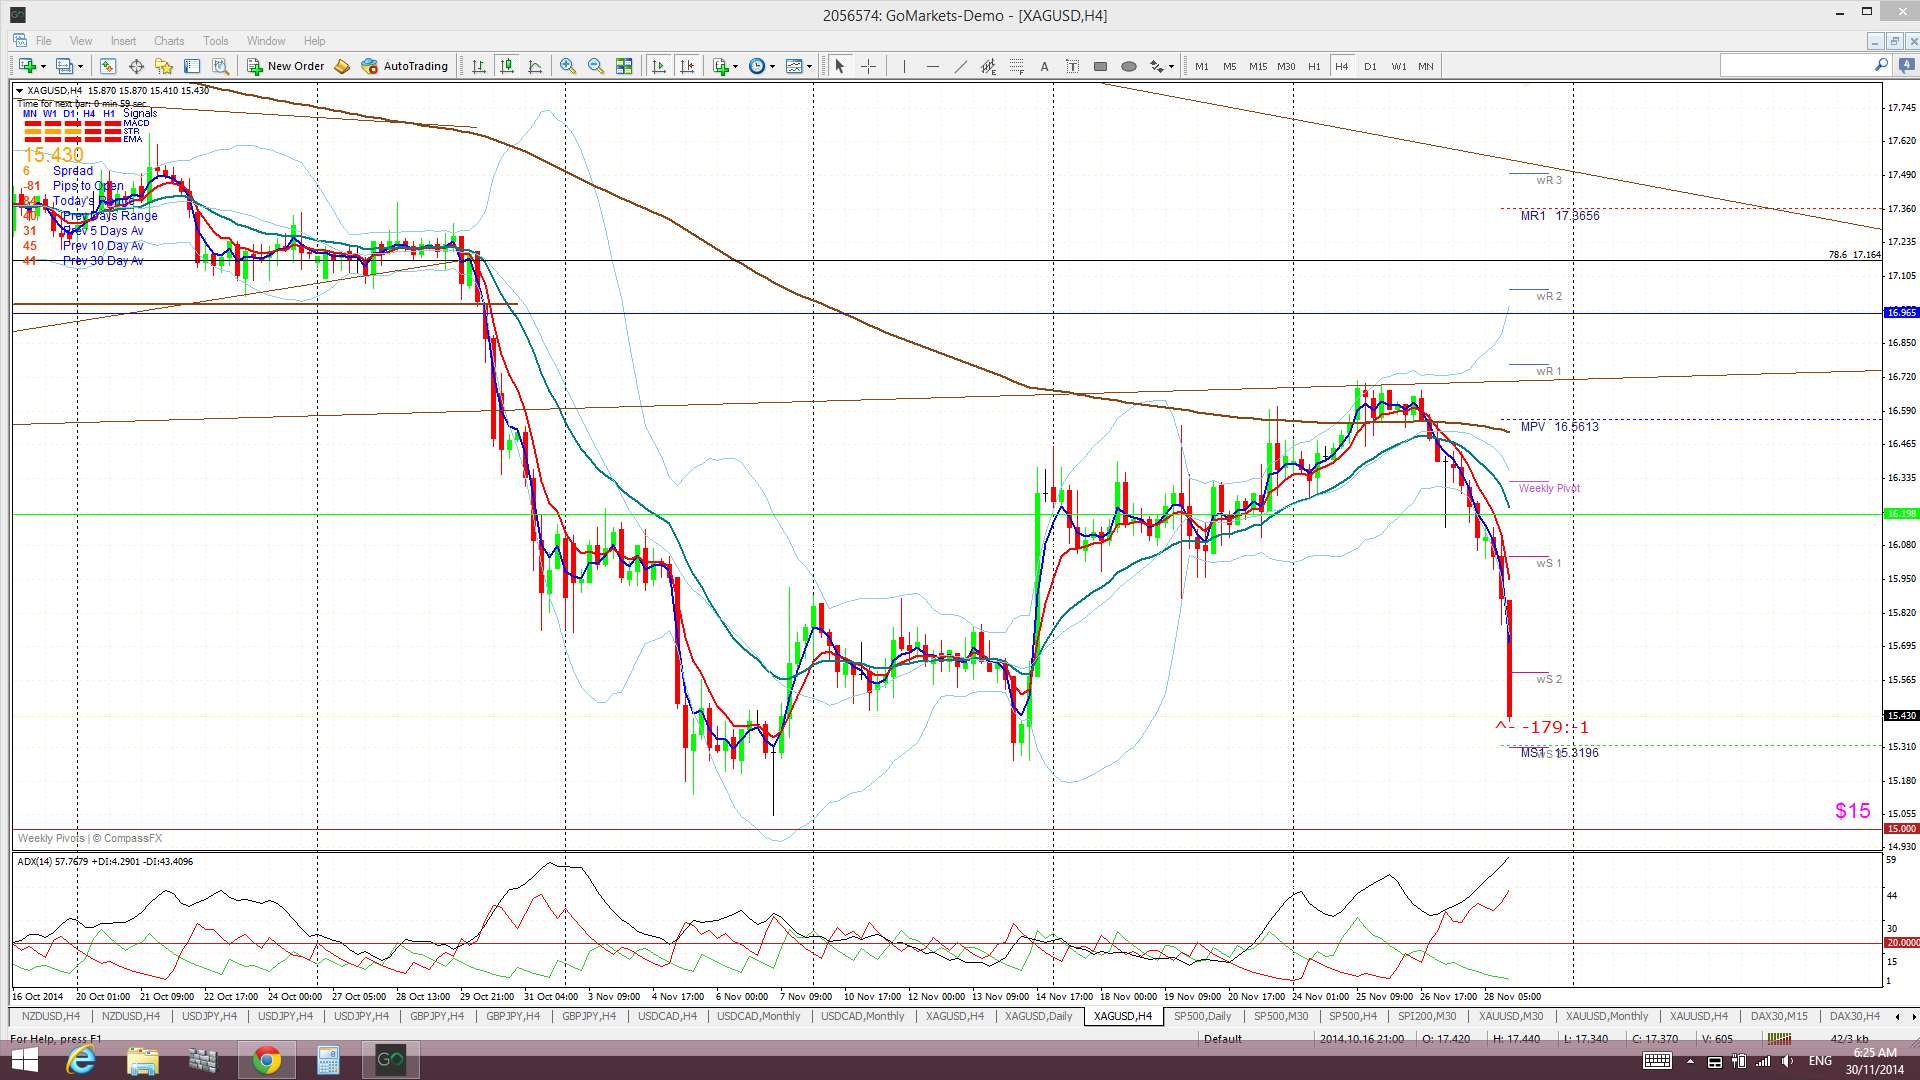
Silver: Silver dropped lower last week but managed to hold out above $15 support ahead of the Swiss referendum.
Silver is back trading below the Ichimoku Cloud on the 4hr, daily, weekly and monthly charts which is a significant bearish development.
The weekly candle closed as a large bearish, almost ‘engulfing’, candle and the monthly candle closed as a bearish coloured ‘Spinning Top’.
- I’m watching for any new TC signal and the $15 level AFTER the Swiss referendum.

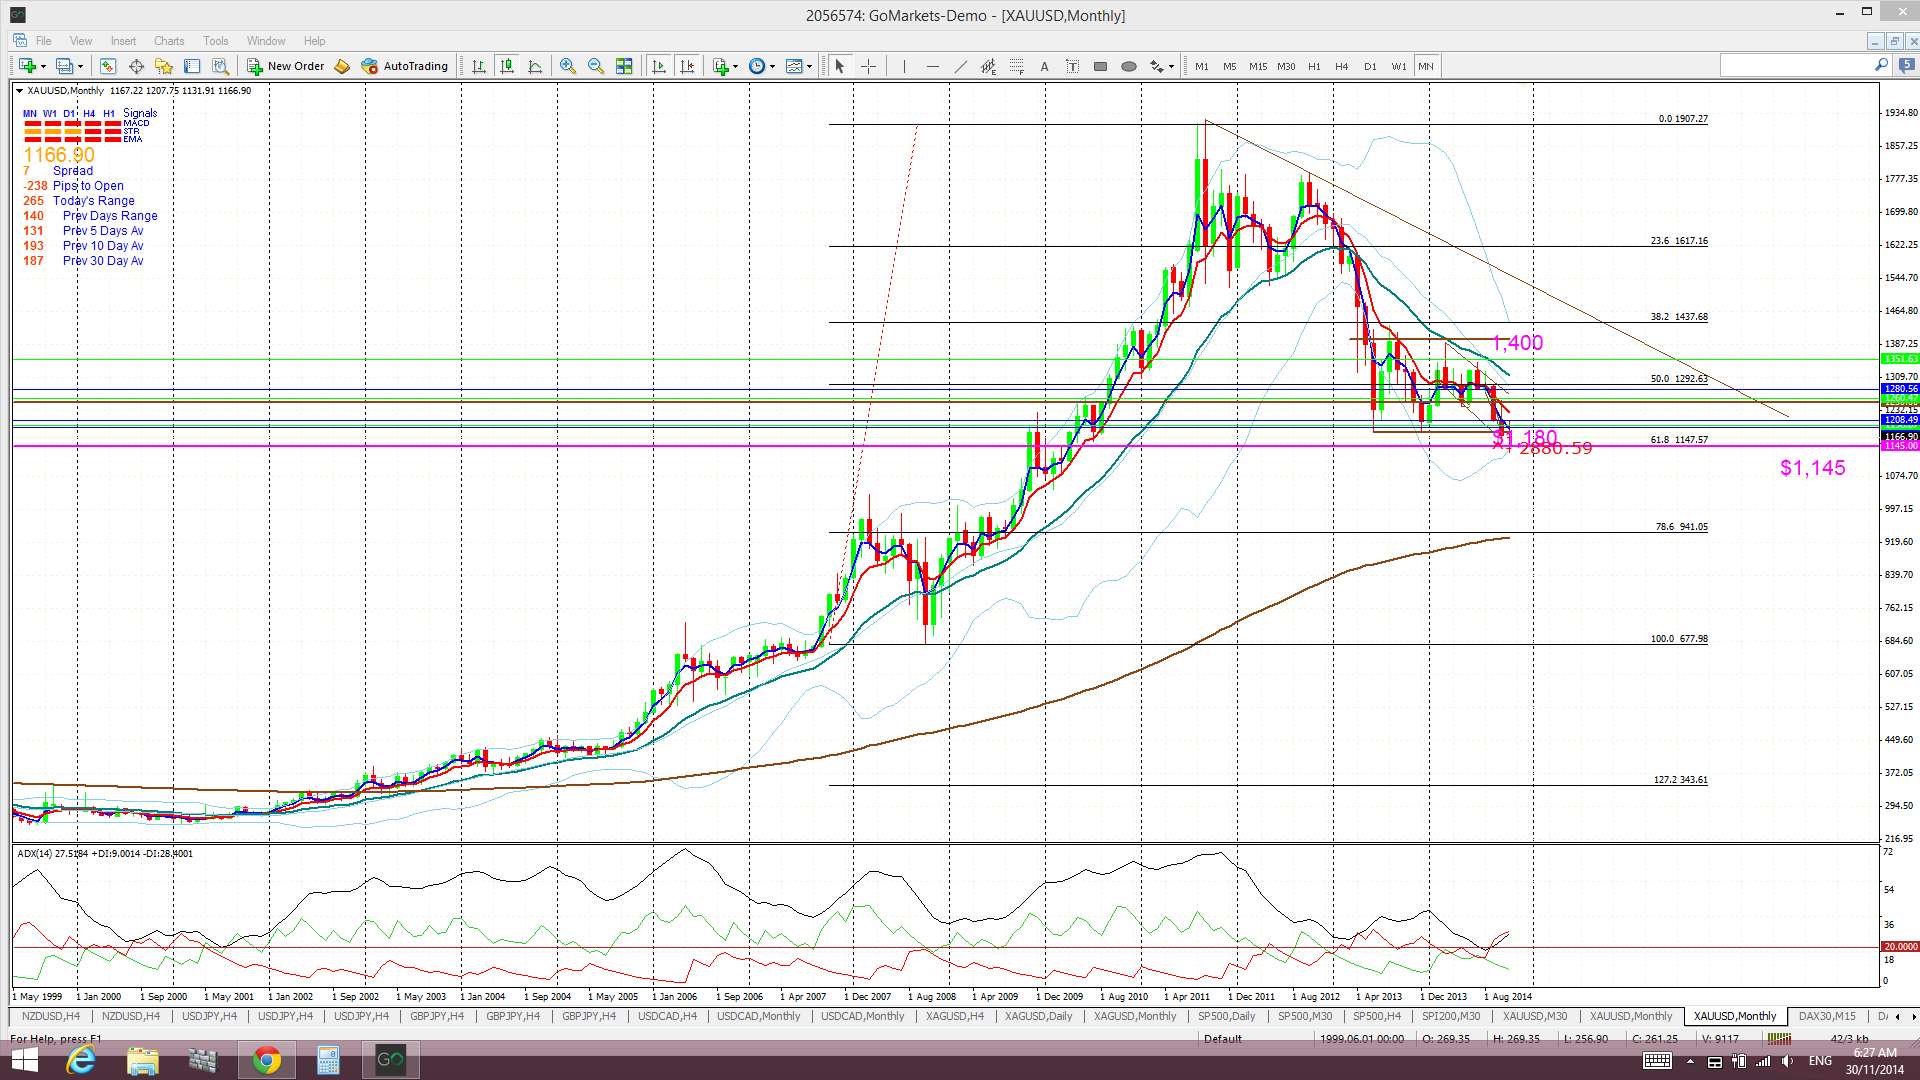
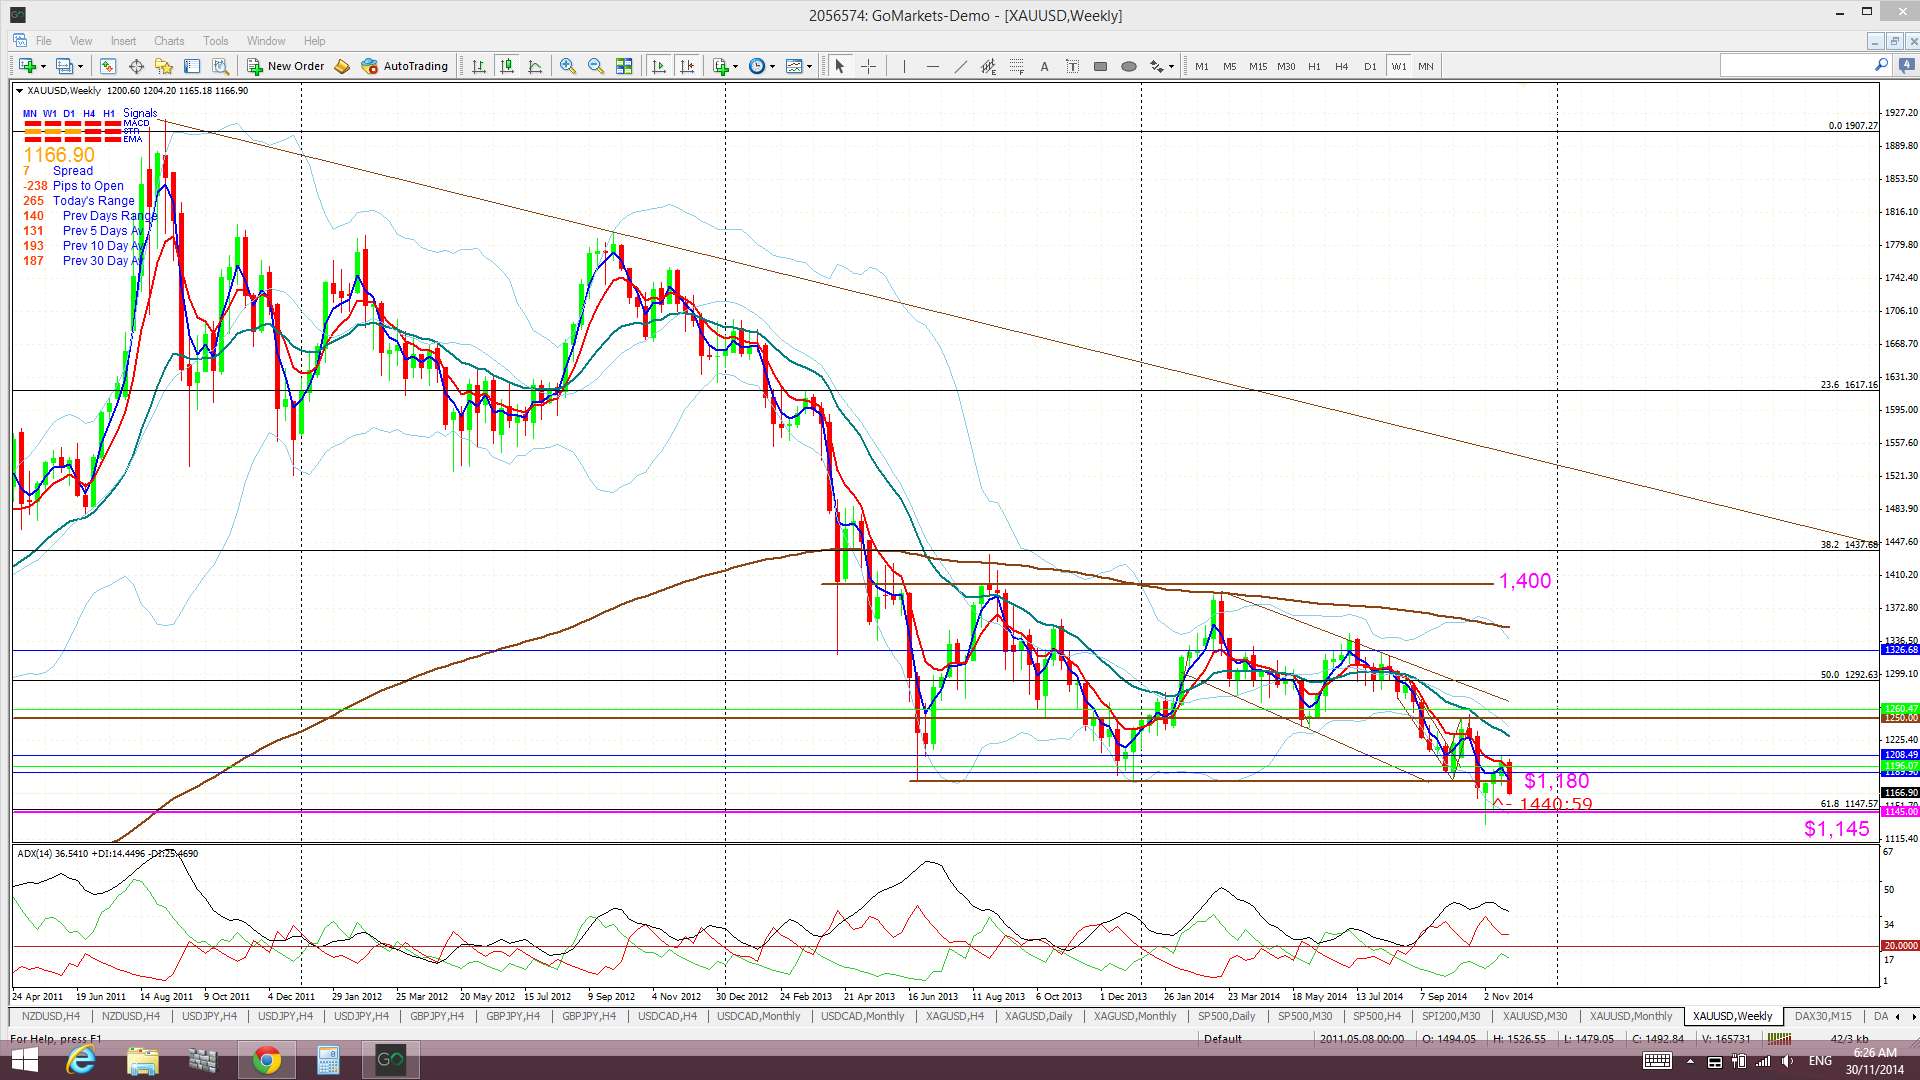
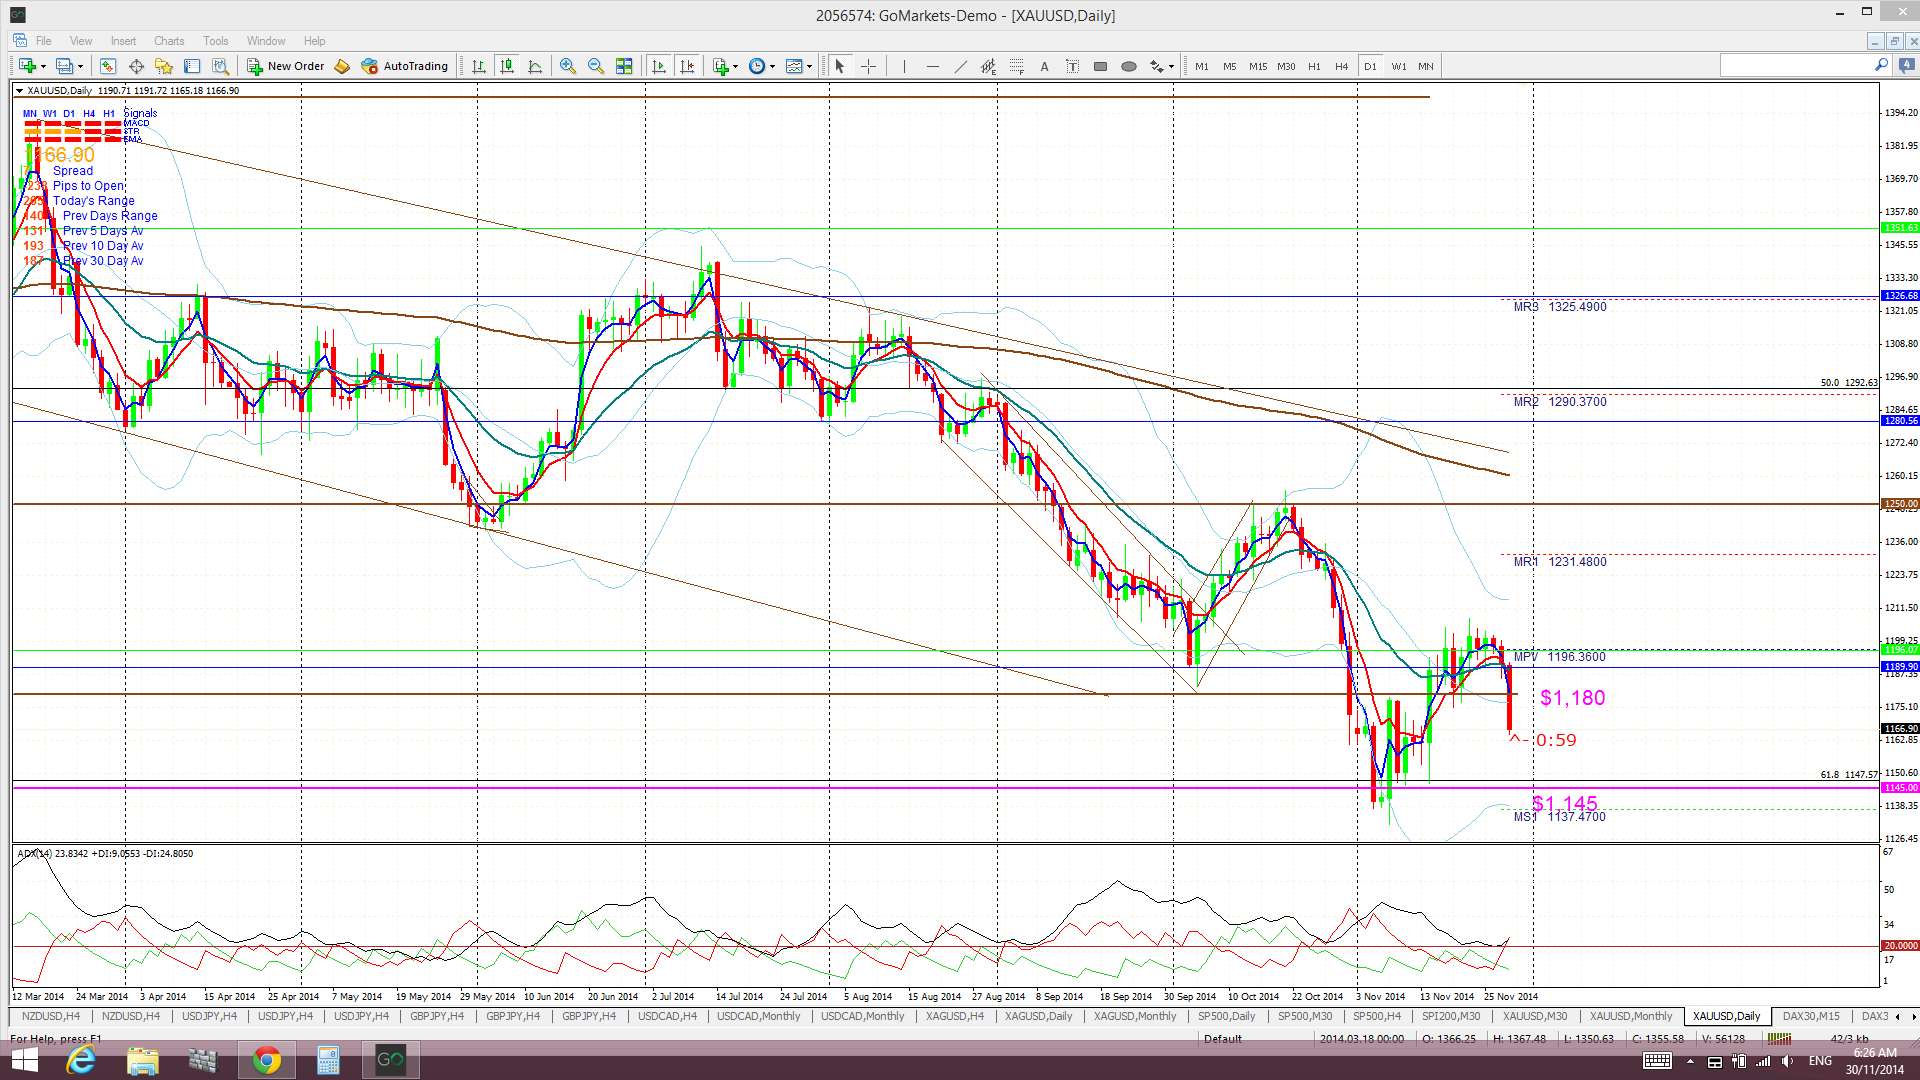
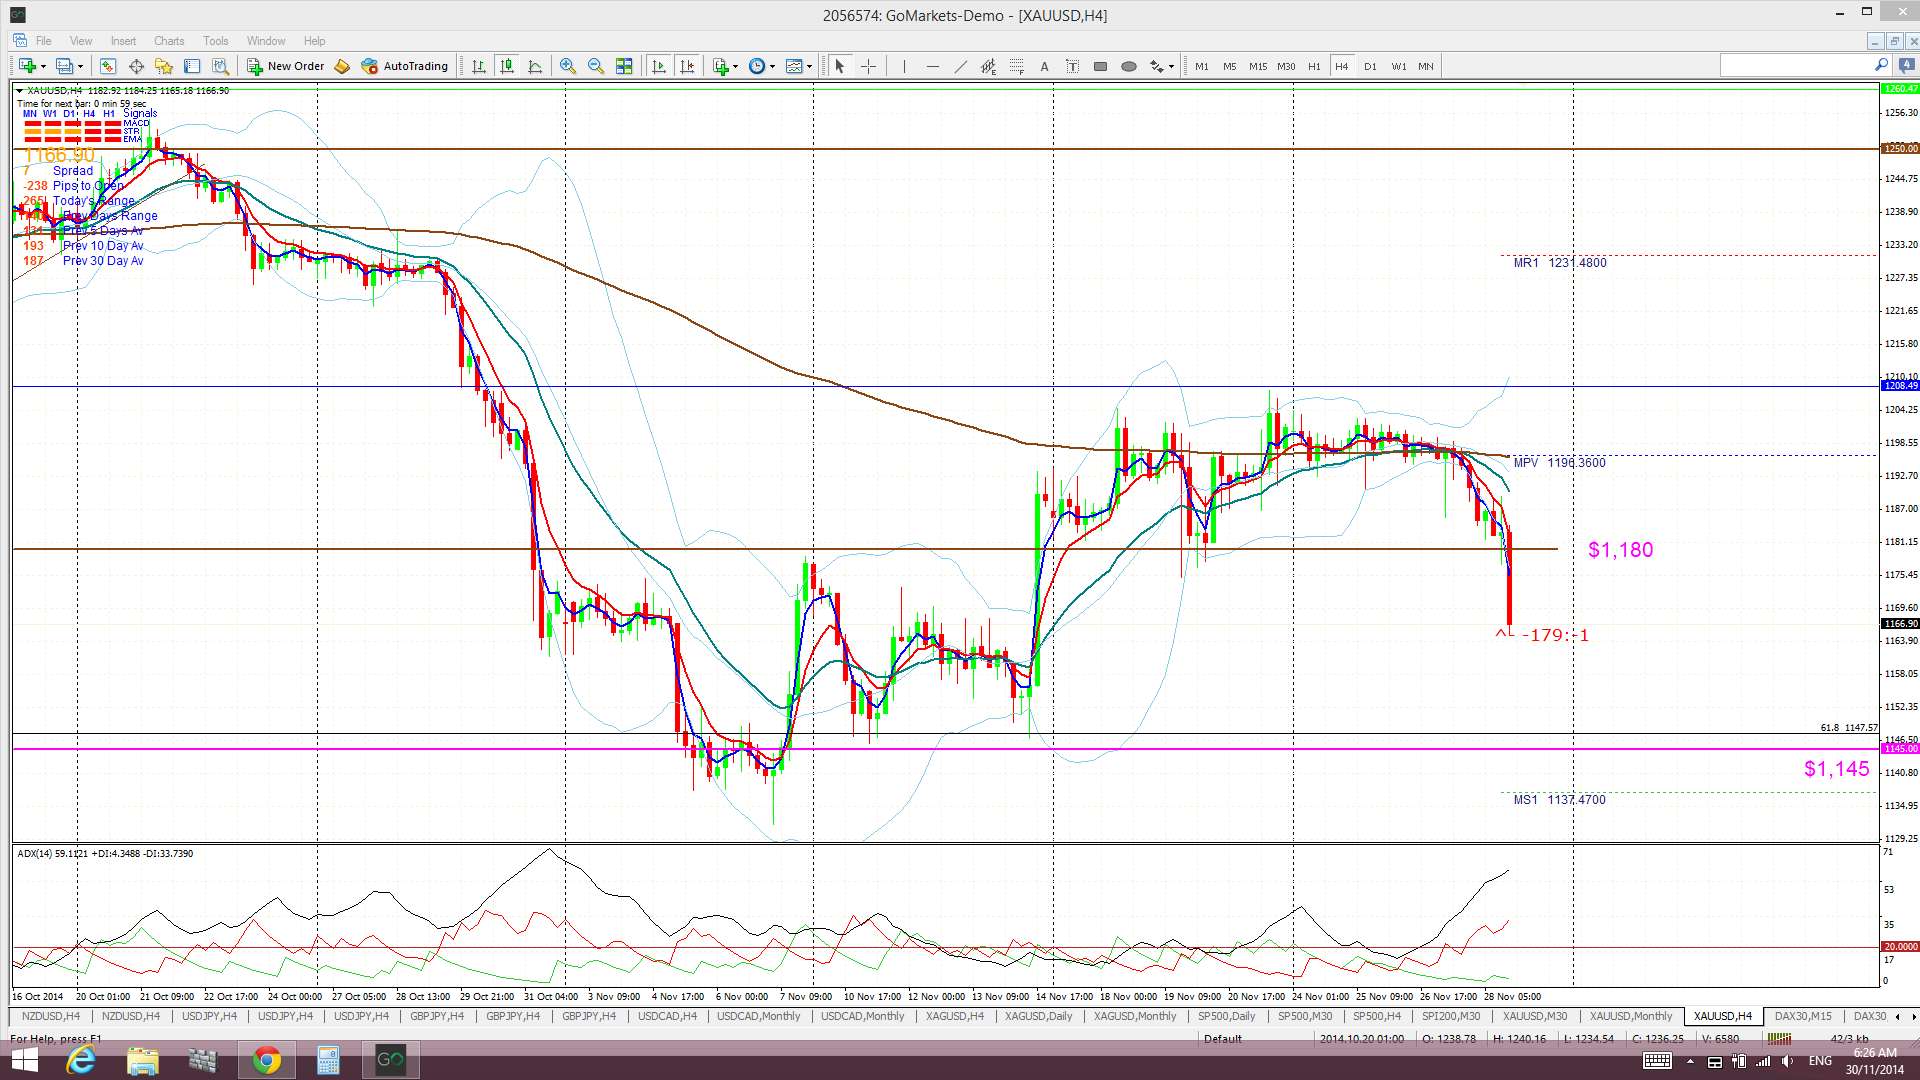
Gold: Gold fell back below $1,200 and $1,180 support last week ahead of the Nov 30 Swiss Referendum.
Gold is back trading below the Ichimoku Cloud on the 4hr, daily, weekly and monthly charts which is a significant bearish development.
The weekly candle closed as a large bearish, almost engulfing, candle but the monthly candle closed a bearish coloured Doji reflecting a certain amount of indecision here ahead of the Referendum.
ForexLive has a good article on Gold and the Swiss Referendum.
- I’m watching for any new TC signal on this pair and the 61.8% fib near $1,145.
The post FX, Stocks & Gold analysis in a big news week. appeared first on www.forextell.com.