Last week: There were some big moves with GBP pairs last week and this has helped to develop the mean reversion profile across some FX charts; a phenomenon I have been monitoring for many weeks now. This movement helped to trigger a number of great trend line breakout trades and decent TC signals as well. There is FOMC in the coming week and so I’ll be watching to see how this impacts the mean reversion trends in play and, also, to see if it triggers any new trend line breakout trades.

Trend line breakout tally: these trades gave the following maximum pip movement and were profiled mid-week here, here, here and here:
- Gold: 150 pips.
- EUR/JPY: 120 pips.
- AUD/JPY: 110 pips & then 100 pips on Friday.
- USD/JPY: 80 pips.
- GBP/JPY: 290 pips and 500 pips.
- GBP/USD: 80 pips and 400 pips.
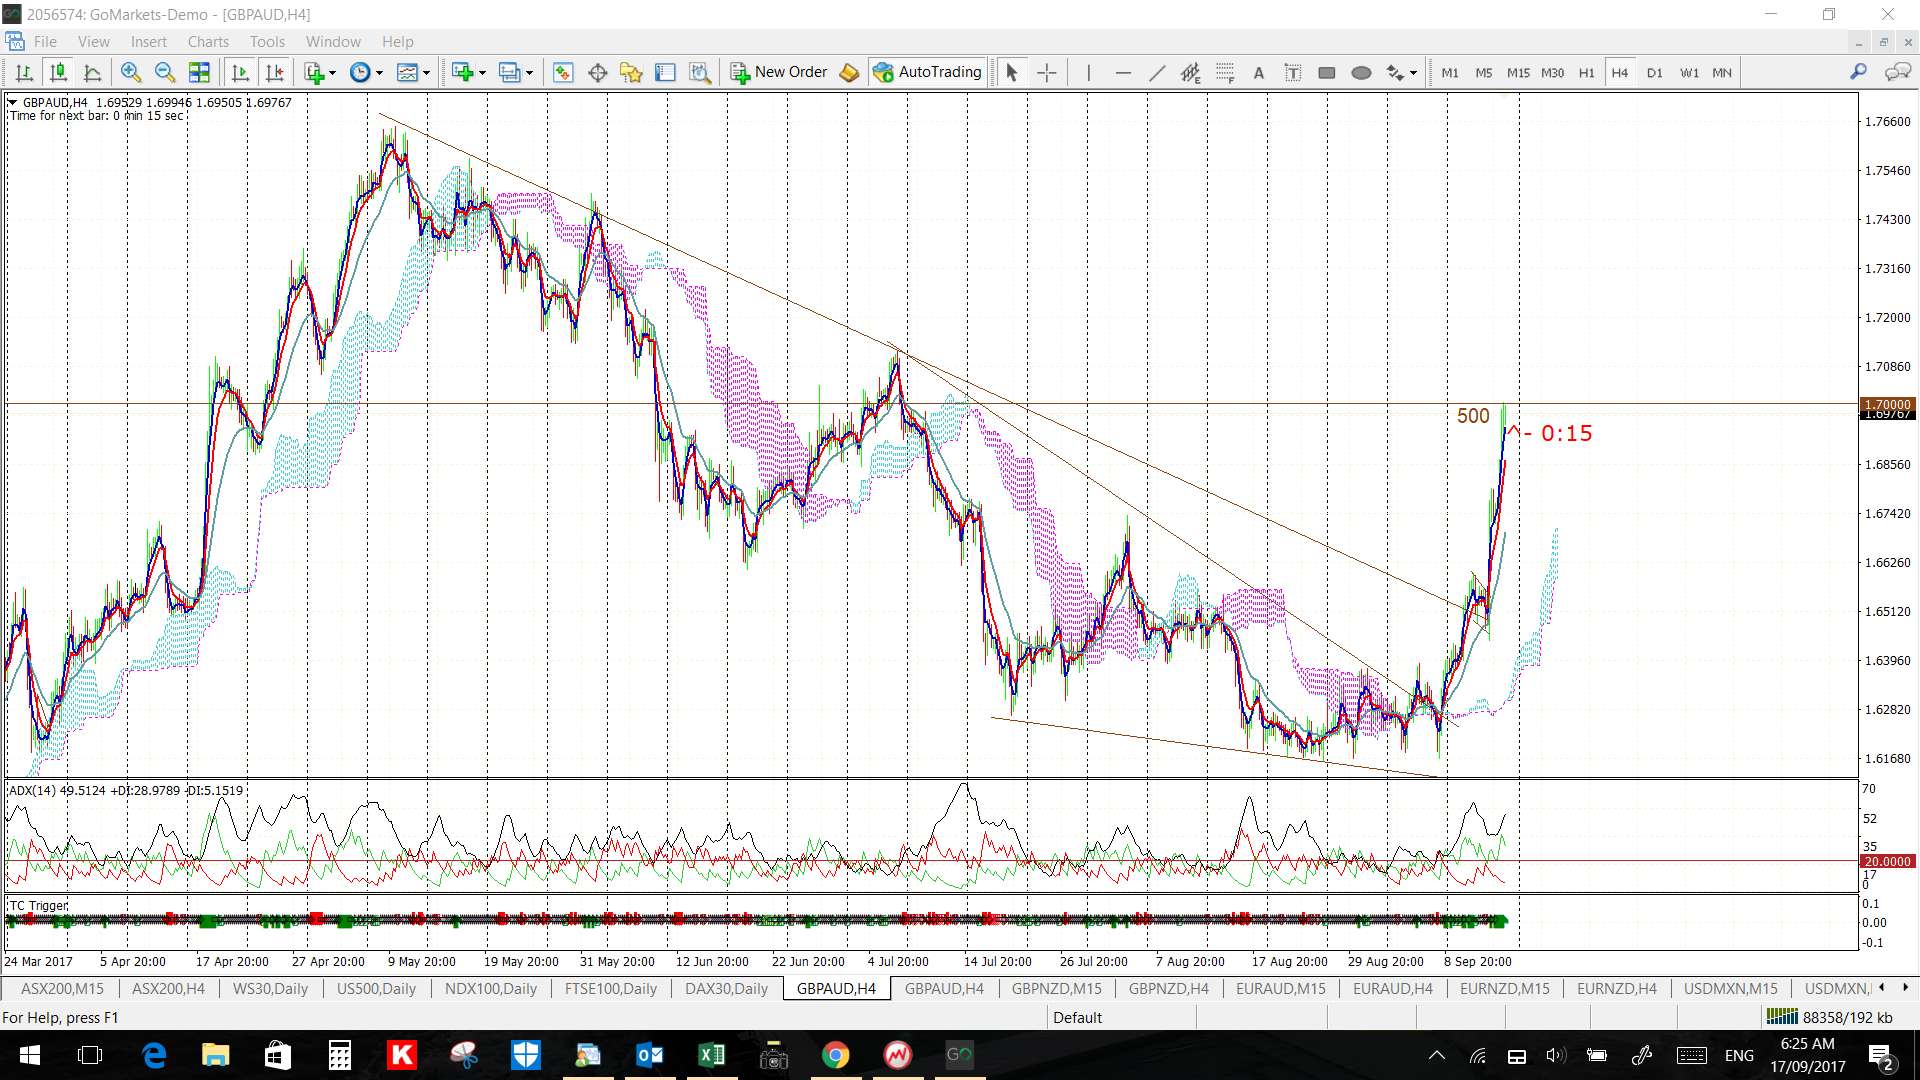
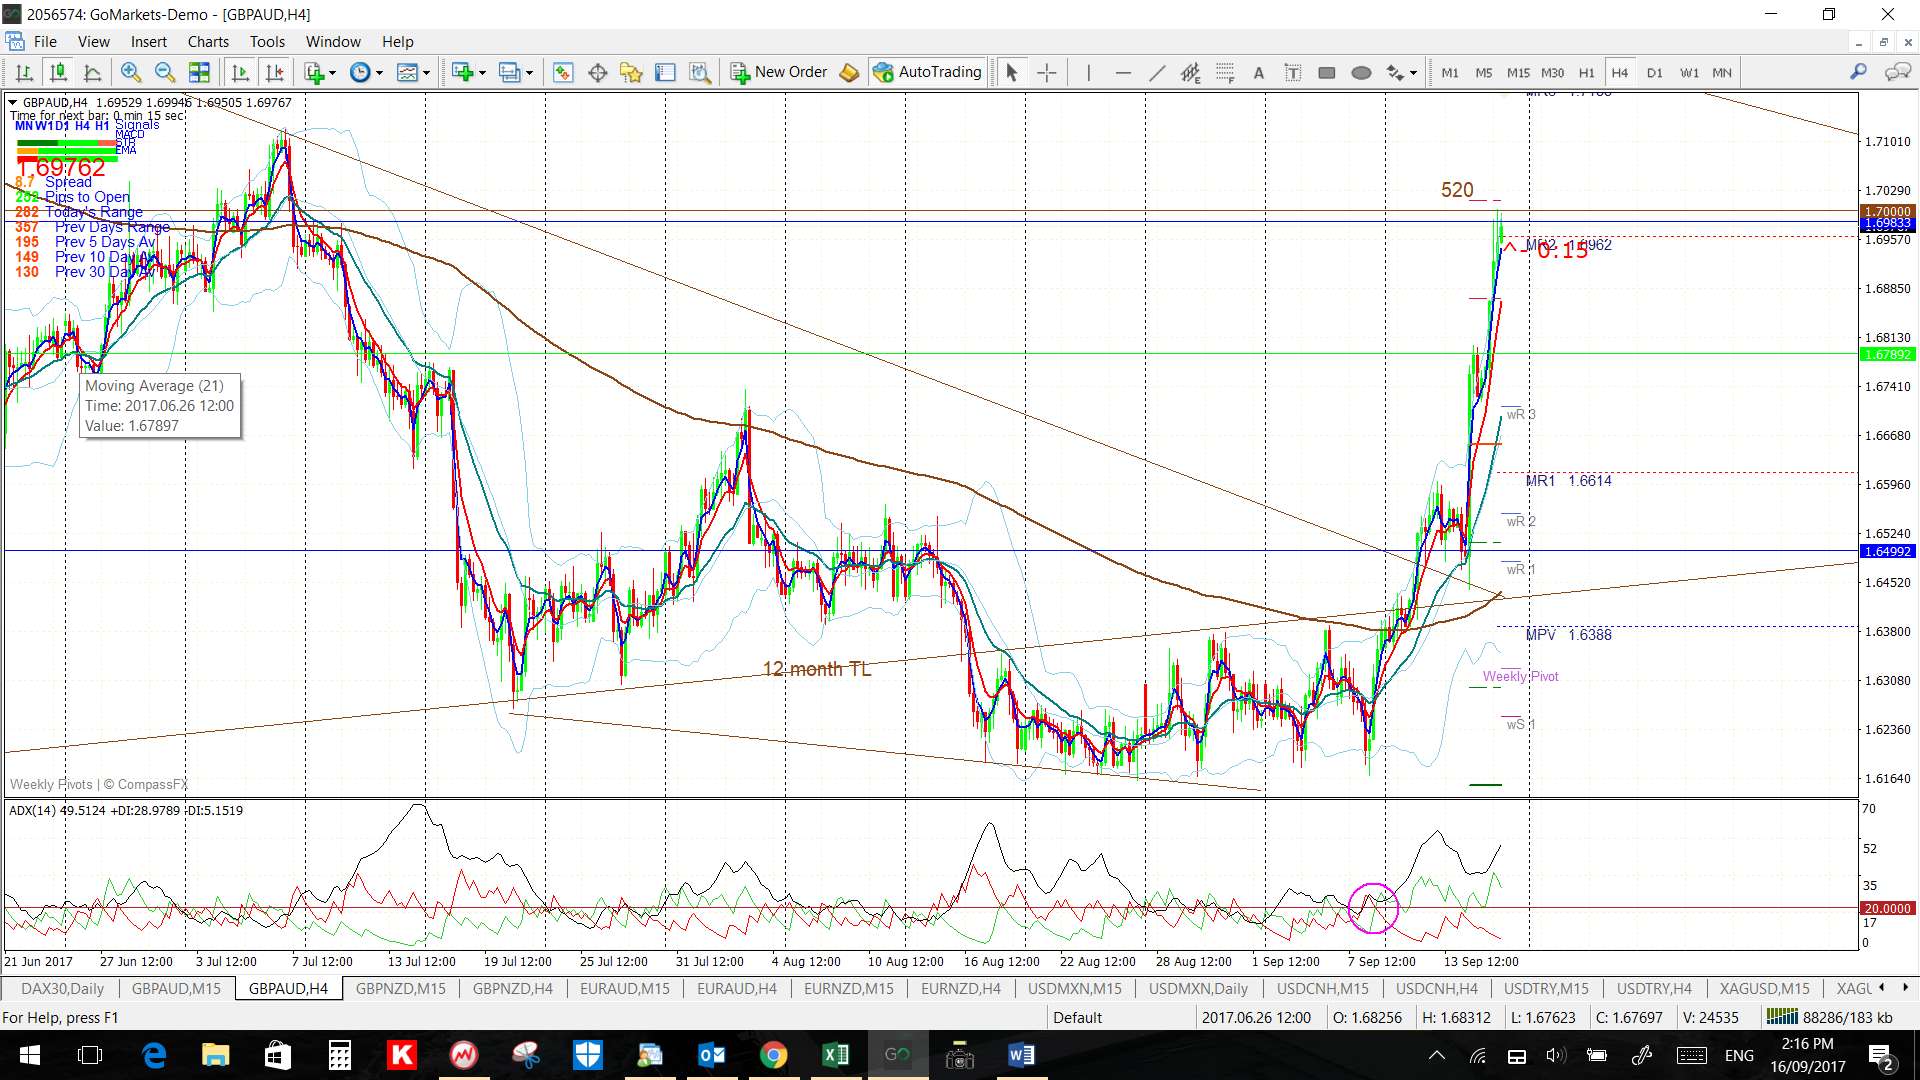
- GBP/AUD: 520 pips.
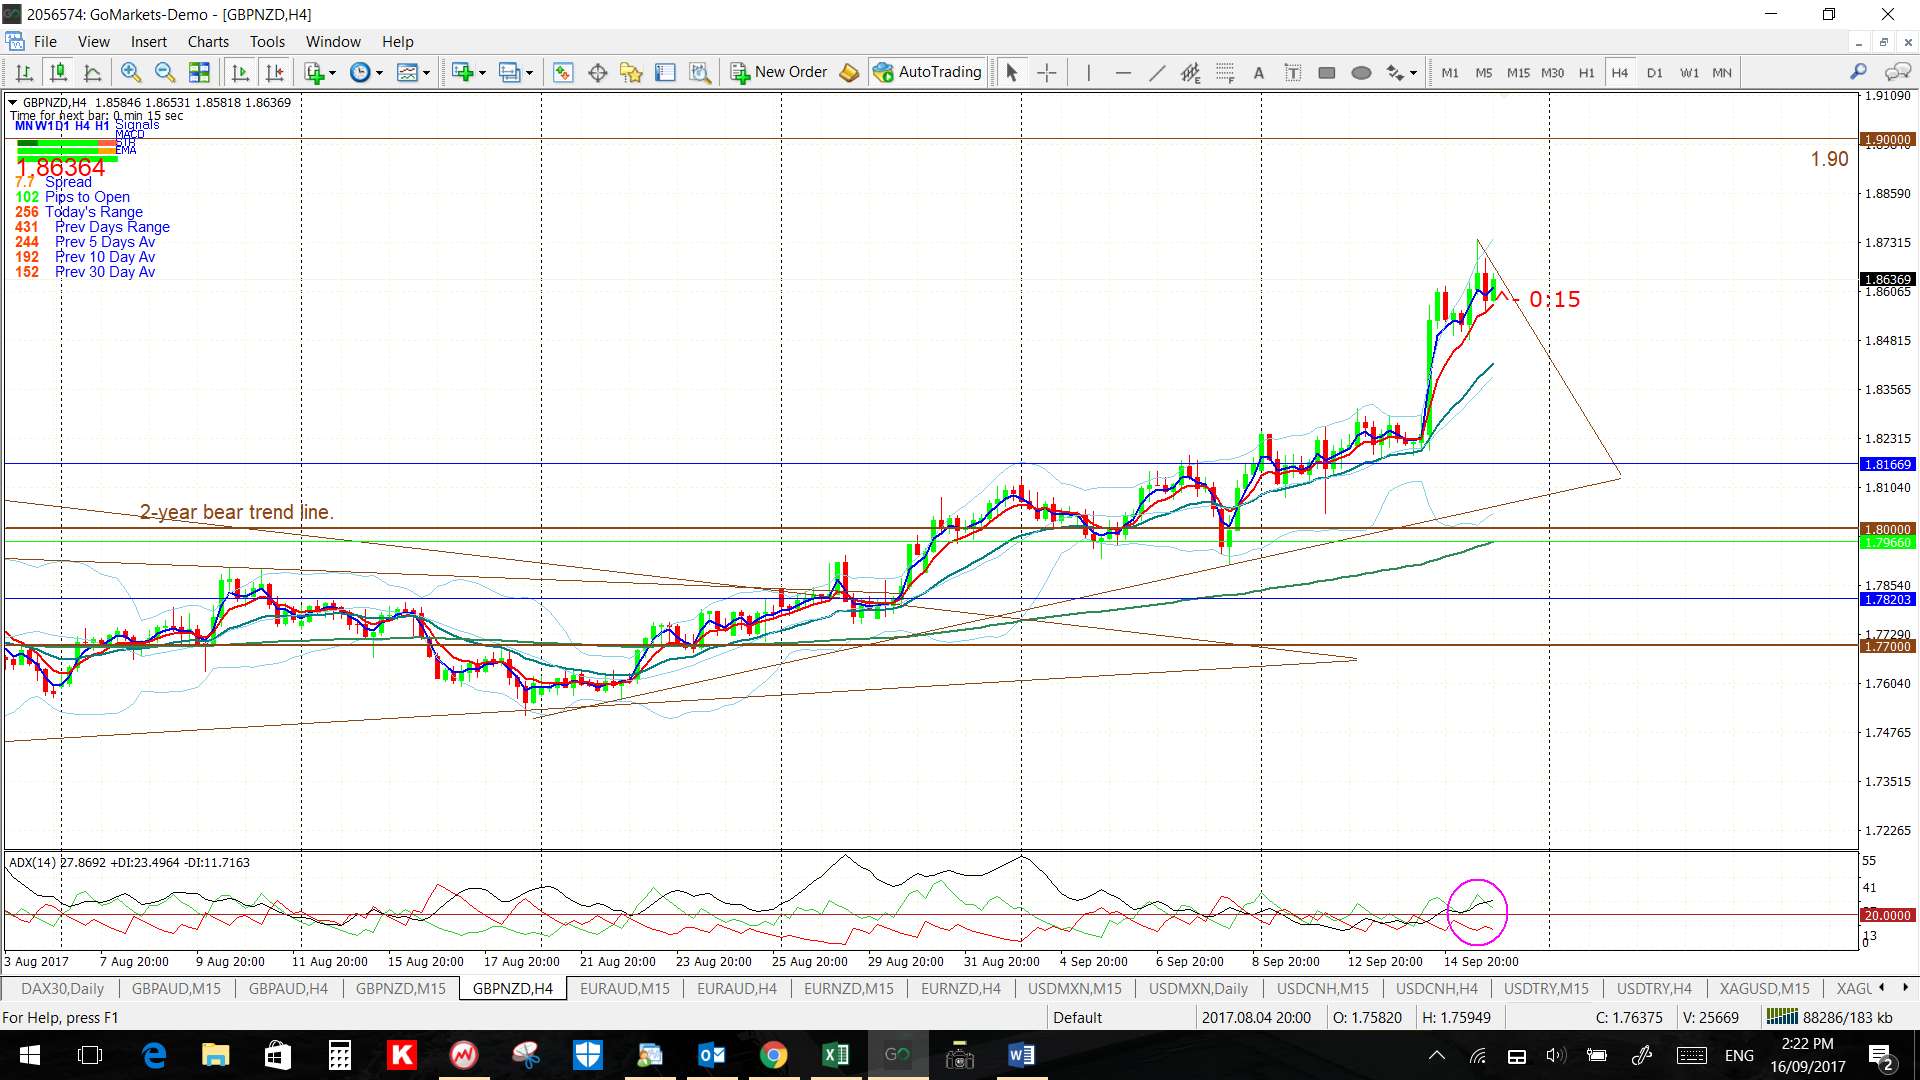
- GBP/NZD: 480 pips.
- Oil: 130 pips.
- EUR/JPY: 140 pips on Friday.
This week:
- US$: the US$ index closed with a bullish reversal weekly candle but still below the key 92.50 level. A review of the FX Indices can be found through this link.
- Data: There are two Central Bank updates this week: FOMC (USD) and BoJ (JPY).
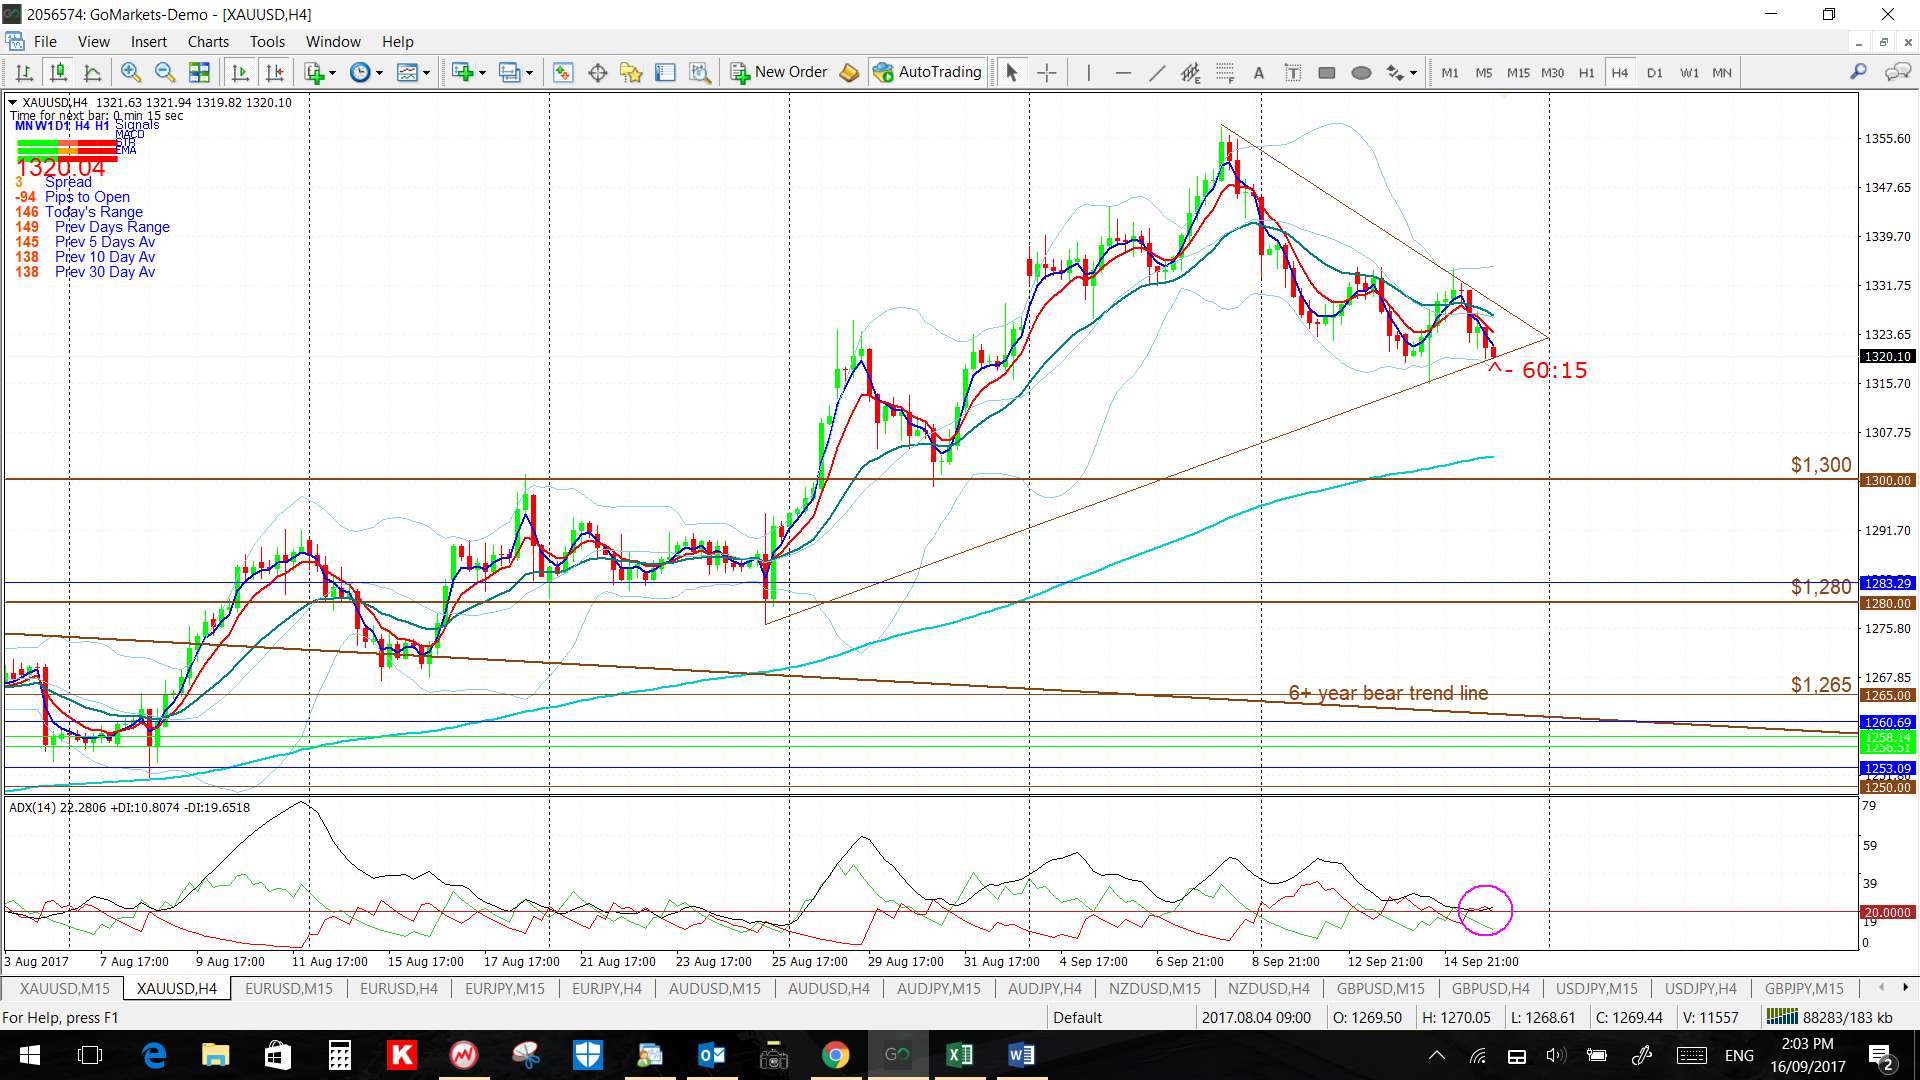
- Gold: printed a bearish weekly candle BUT continues holding above the recently broken 6-year bear trend line. I am still watching for any continuation move up to the weekly chart’s 61.8% fib; circa $1,600.
- GBPJPY and GBP/AUD: both of these pairs made huge moves last week but have now reached major S/R levels worth watching for any new make or break activity:
GBP/JPY

GBP/AUD:
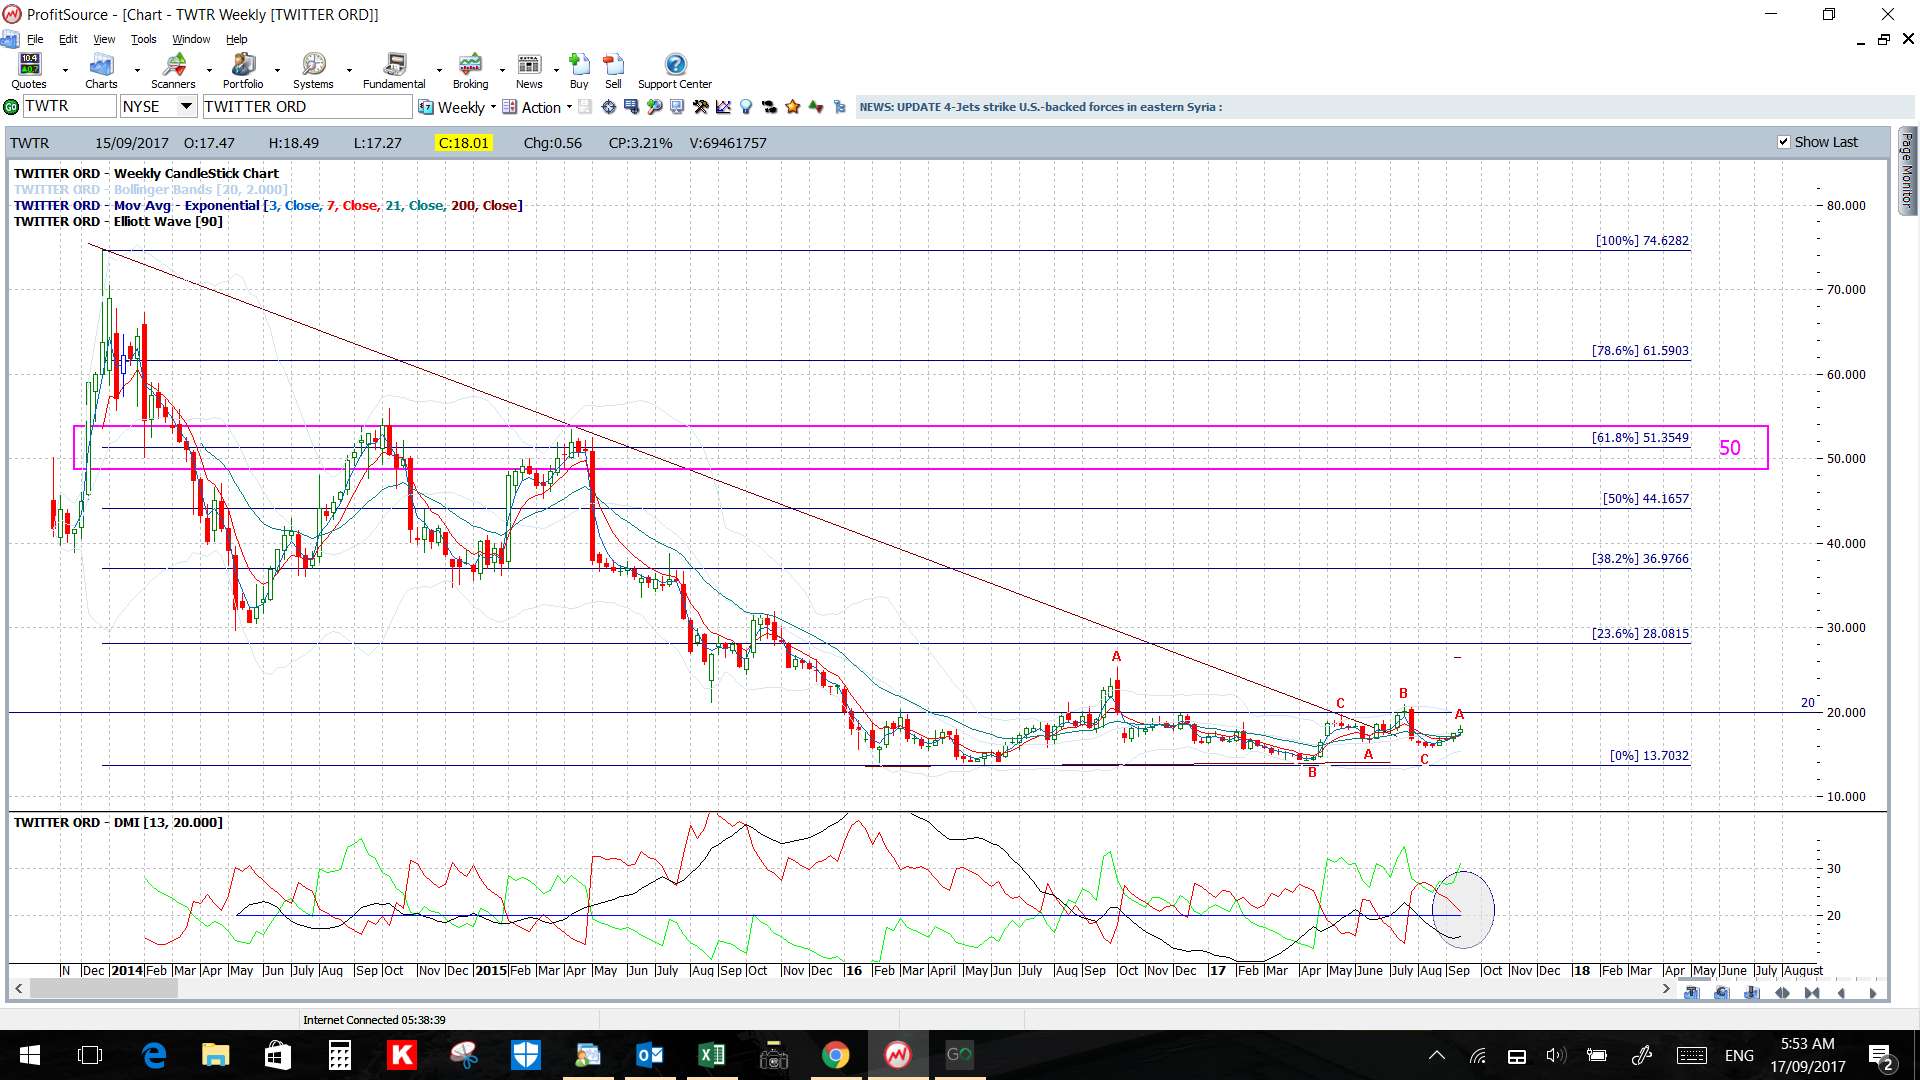
- TWTR: I am still LONG on Twitter and happy with how this trade is unfolding. I initially sold a $19 Put for 0.70 cents and was subsequently assigned; making my b/e around $18.30 (excluding fees). I have now sold a $19 Call for 0.50 cents and this has helped to lower my average cost even further. This is why I always prefer to sell a Put to scale into a trade rather that buy the stock outright. It’s not for everyone but it suits me. BTW: I’m doing the same here atm with AMD and CONN:
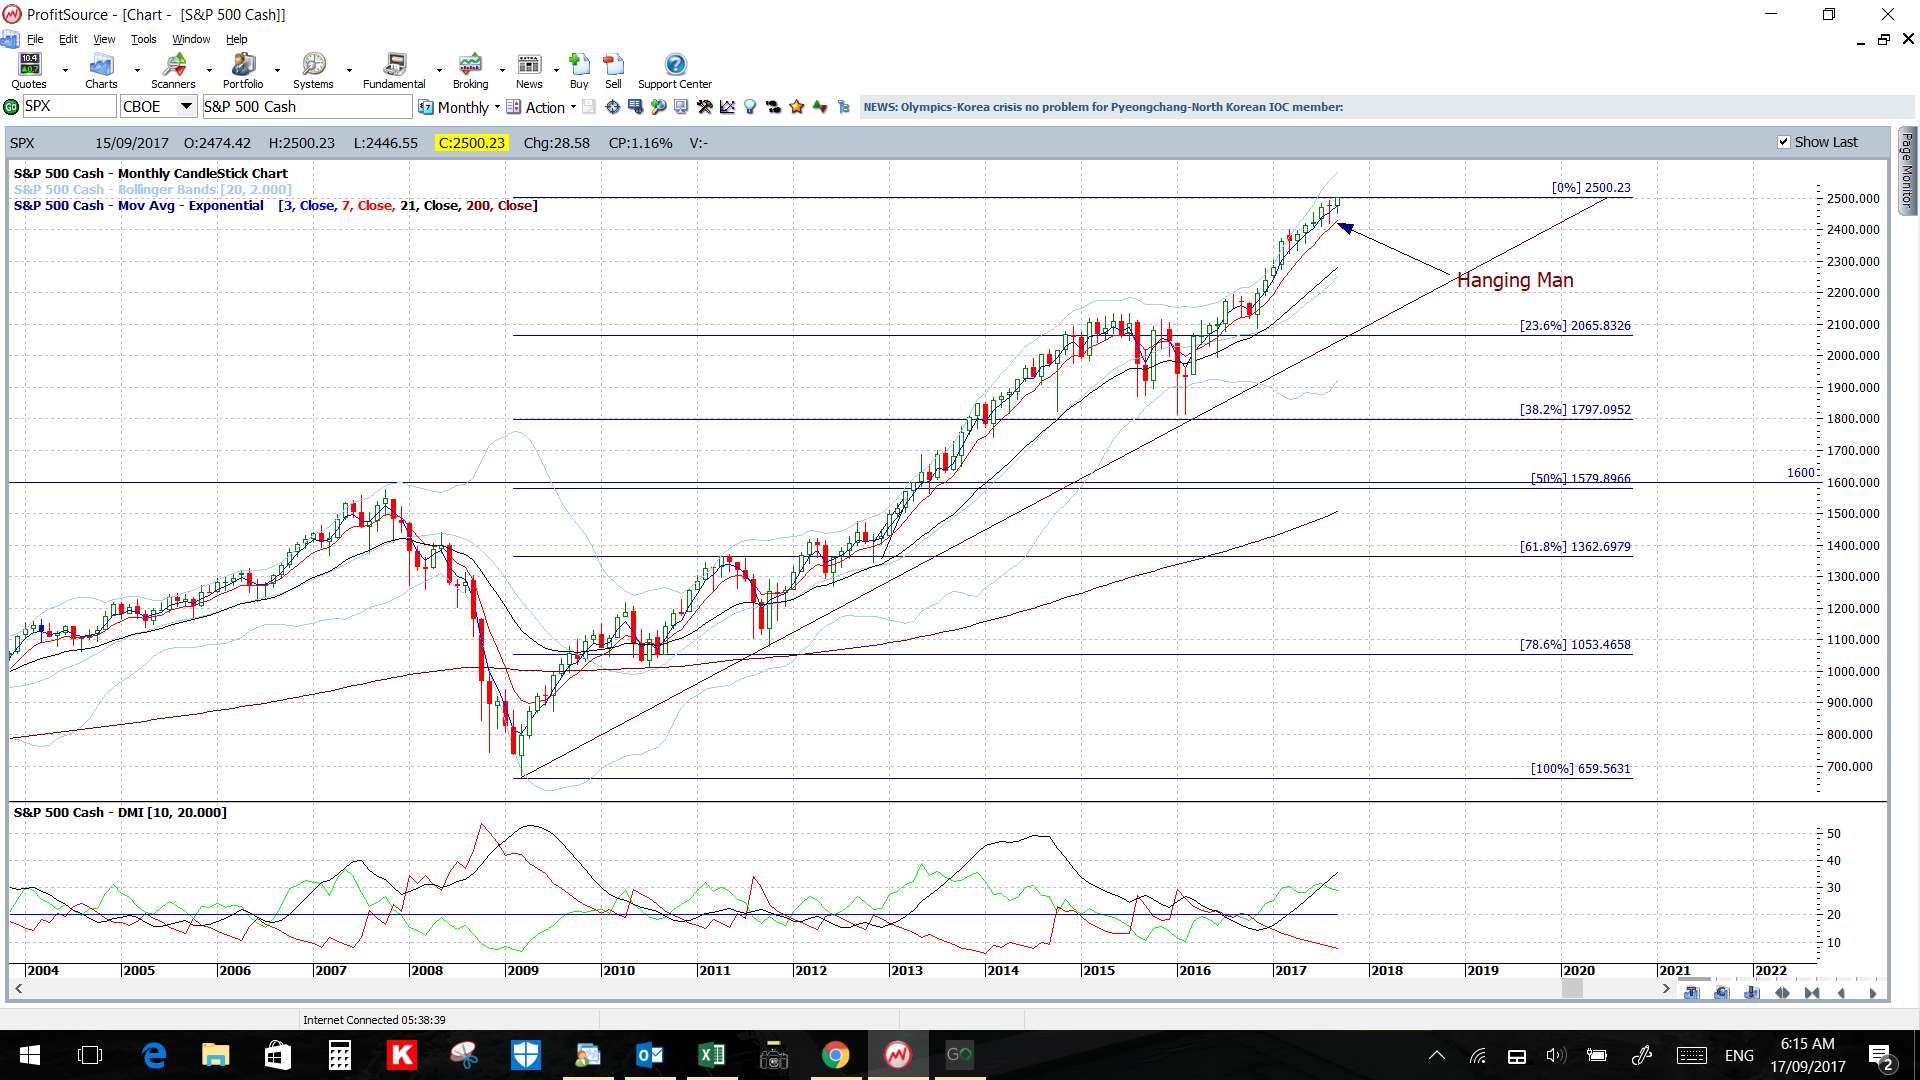
- S&P500 monthly: I continue to keep an open mind with the S&P500. I consider that 1,600 is the base of the next trading range for this index but still consider a test of this region would be healthy before any eventual continuation. The uptrend has been fairly unrelenting since 2009 and so some pause or pullback would not surprise as trends don’t travel in straight lines forever (see earlier post with charts through this link). I note that the 1,600 breakout level currently dovetails in with the 50% fib of this swing high move but the Index could well continue until this region aligns with the 61.8% fib.
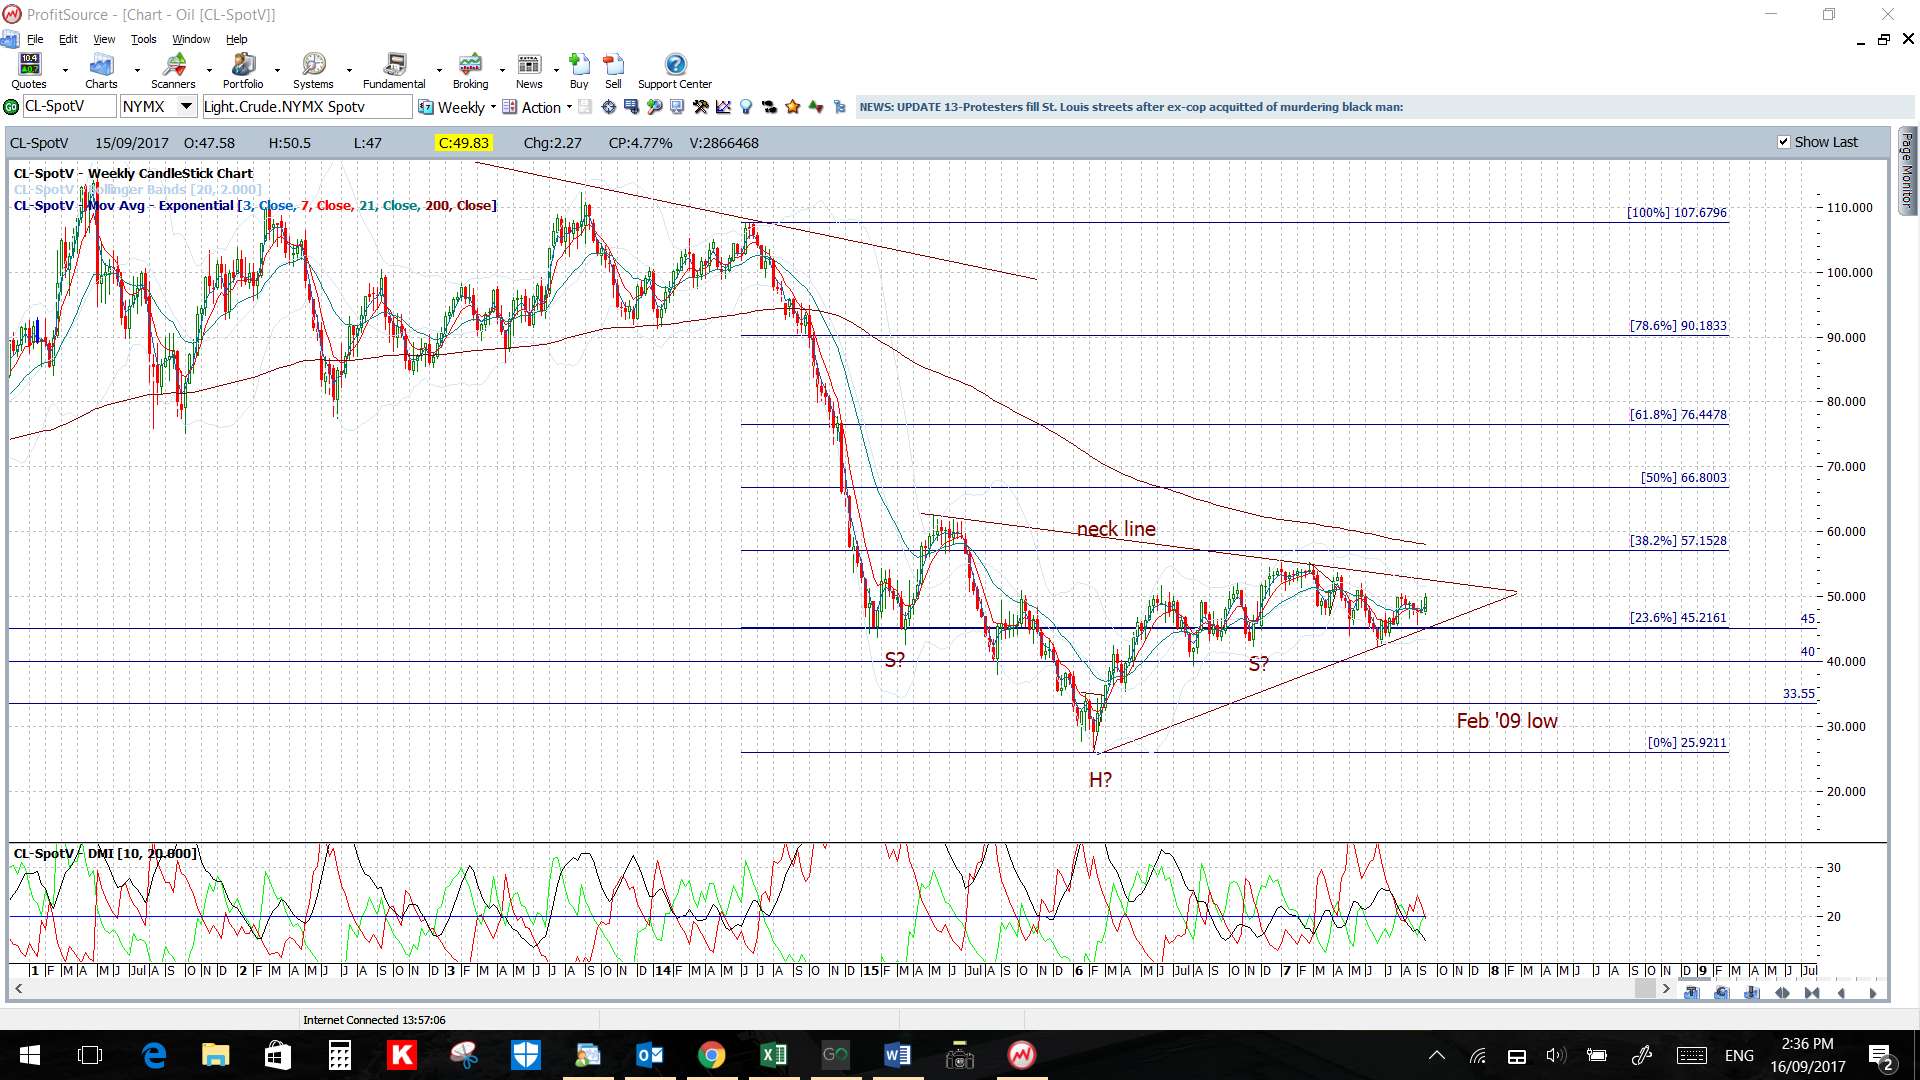
- Oil: this is back up nudging the $50 S/R level and near a 2-year bear trend line so watch for any new make or break activity.
- NB: Next weekend’s update will be the last for about a month as I am away on holidays throughout October.
Calendar:
- Mon 18th: JPY Bank Holiday. EUR Final CPI.
- Tue 19th: AUD Monetary Policy Meting Minutes. USD Building Permits. NZD GDT Price Index.
- Wed 20th: JPY Trade Balance. GBP Retail Sales. USD Crude Oil Inventories & FOMC & Press Conference.
- Thurs 21st: NZD GDP. JPY BoJ Monetary Policy Statement & Press Conference. USD Weekly Unemployment Claims & Philly Fed Manufacturing Index.
- Fri 22nd: EUR lots of PMIs. CAD CPI & Retail Sales. USD Flash Manufacturing & Services PMI.
- Sat 23rd: NZD Parliamentary Elections.
TC signals: there were a lot of great TC signals from last week and I have highlighted three examples that came through on Friday; EUR/JPY, AUD/JPY and on the NZD/USD:
- Trend line breakouts with TC signals:
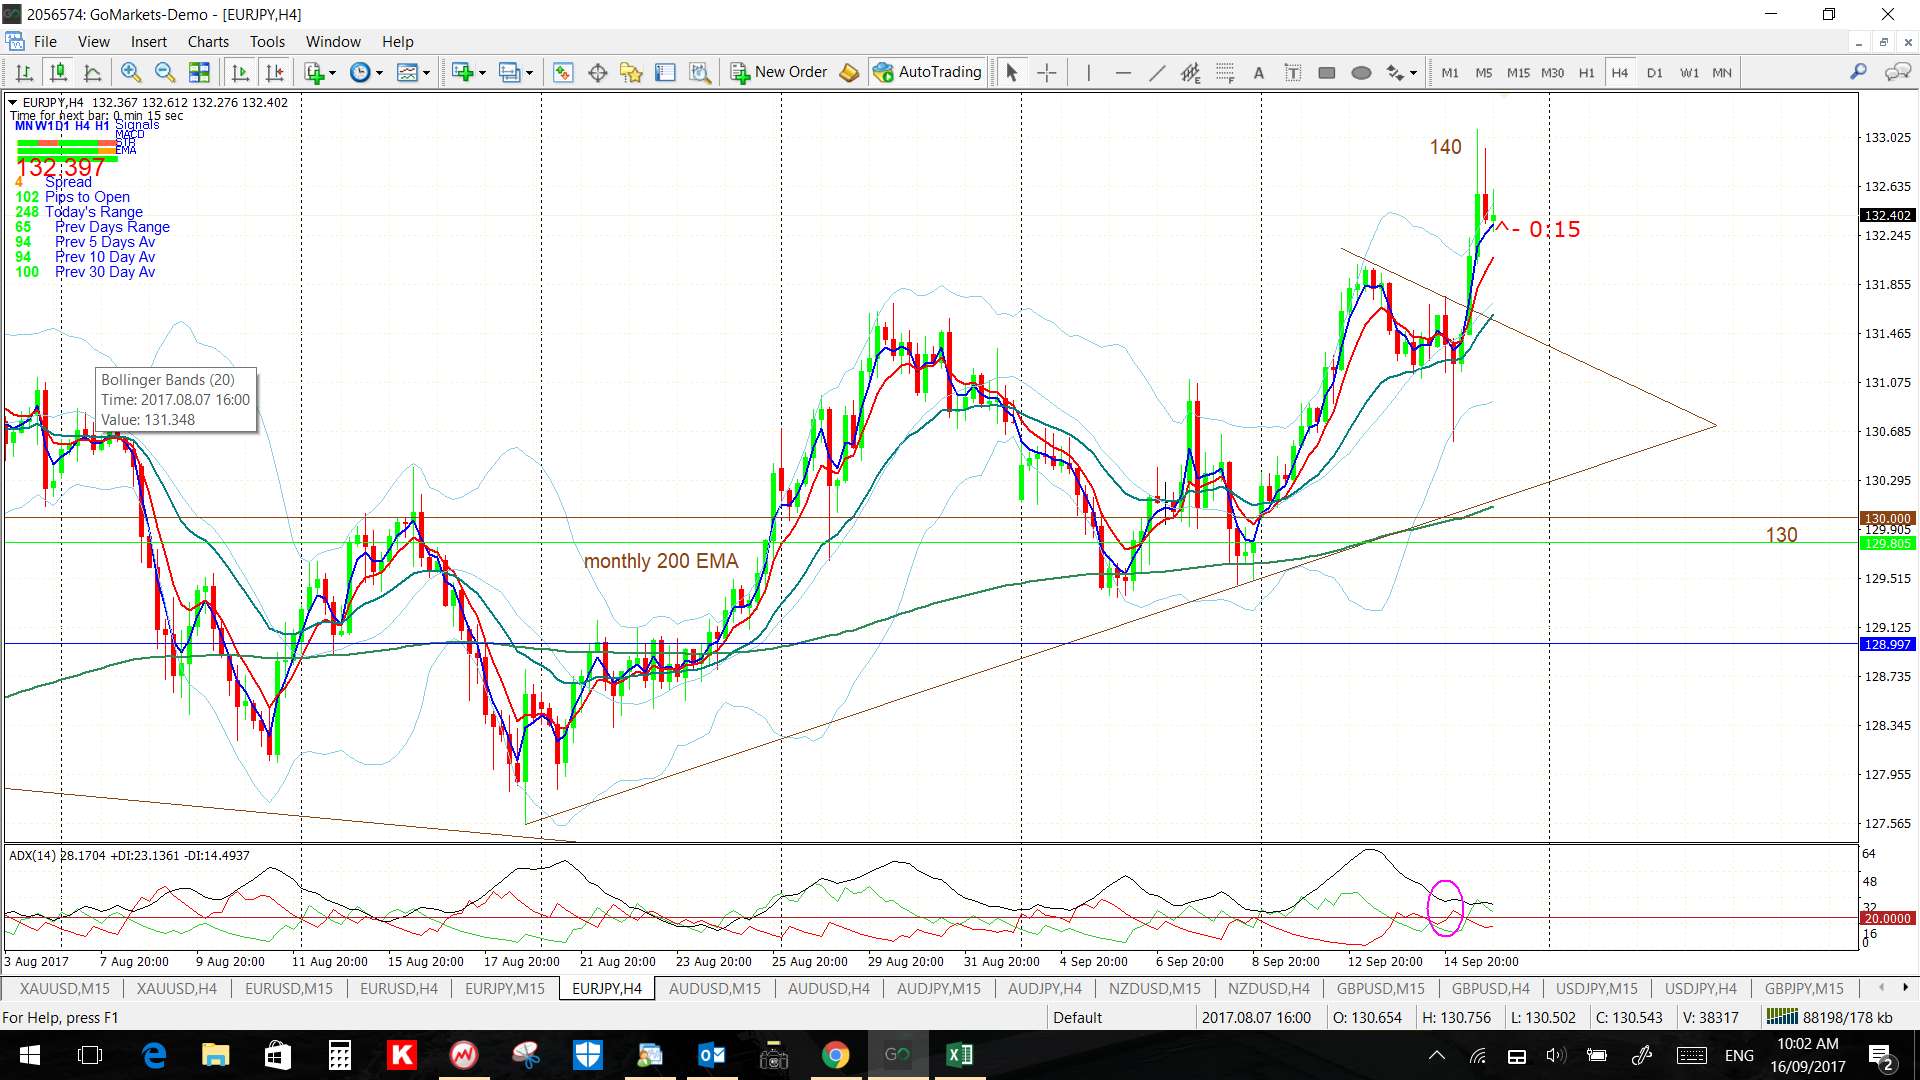
EUR/JPY: there was a new trend line breakout on Friday with a TC signal triggering just prior to the trend line break. TC traders might have waited for the trend line to break before taking the trade, however, there was a generous amount of pips on offer with this move:
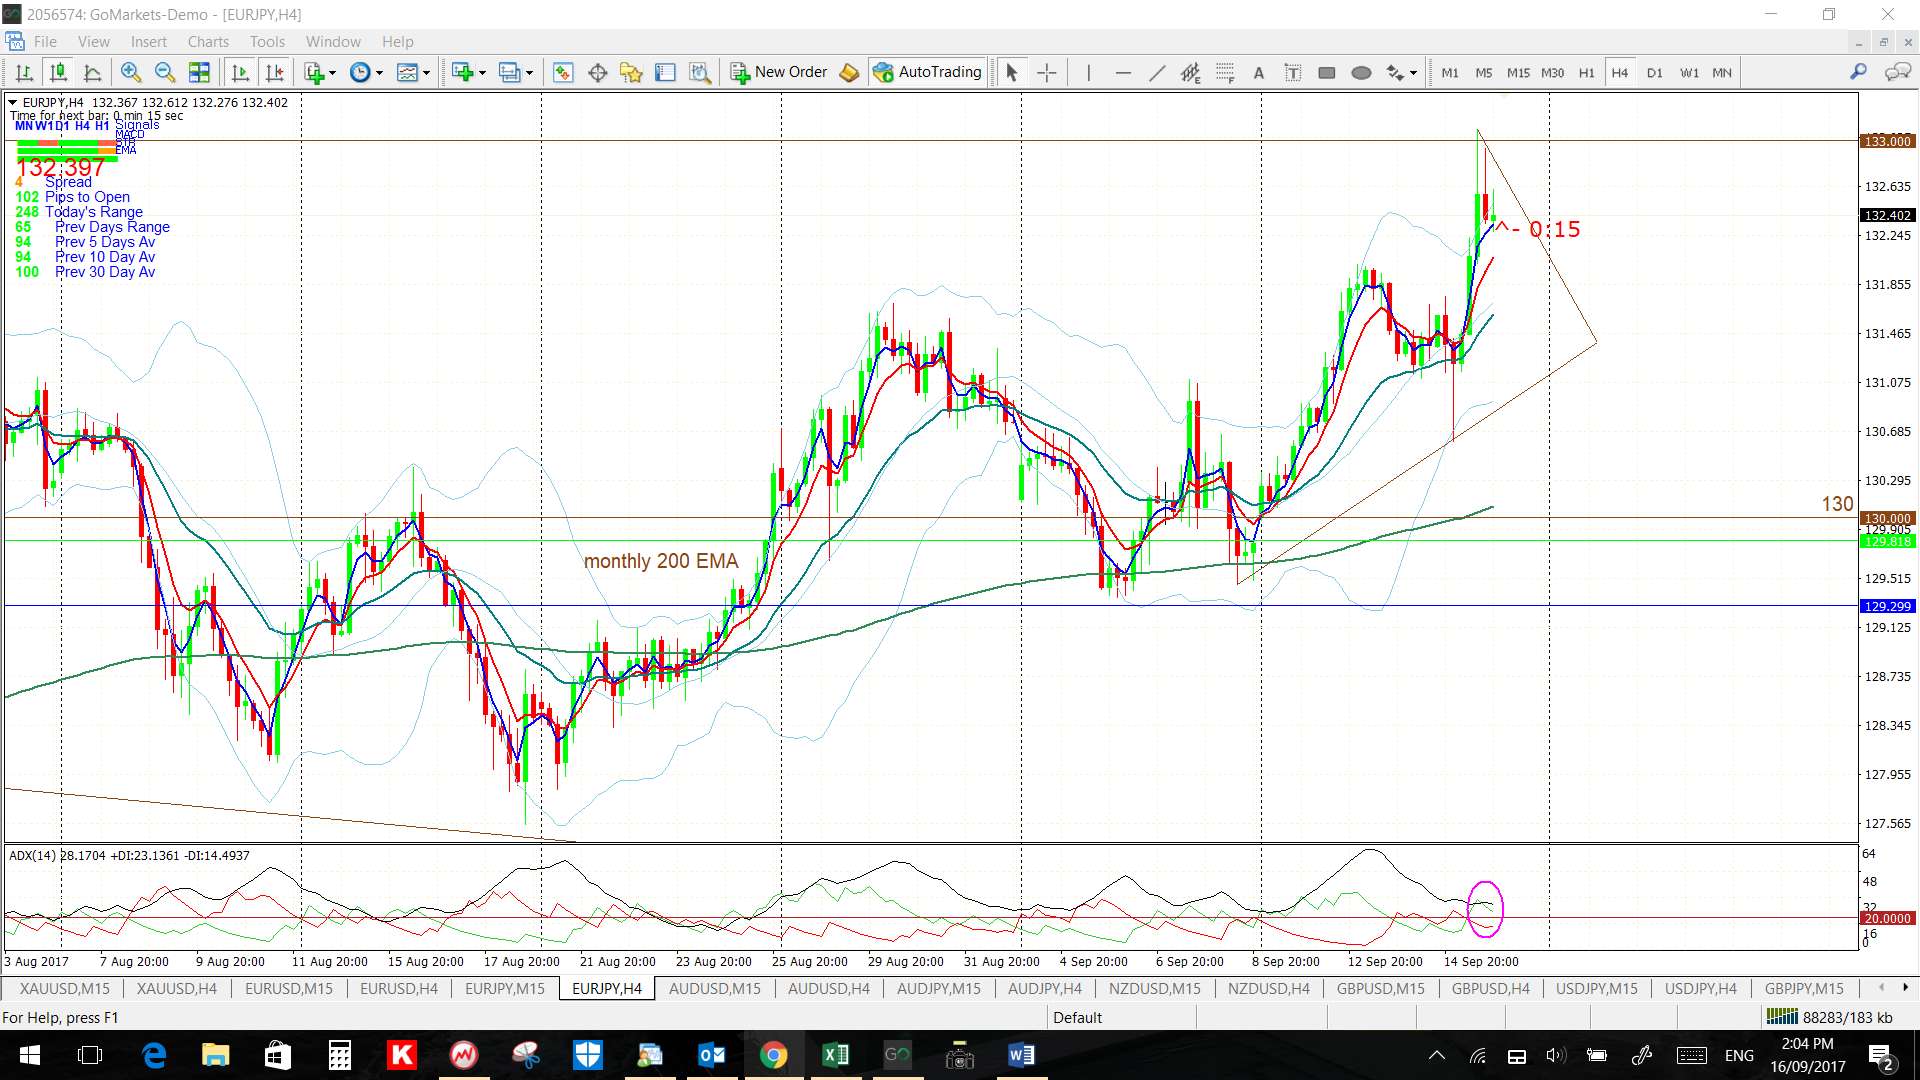
EUR/JPY 4hr: a 140 pip move from the trend line breakout on Friday:
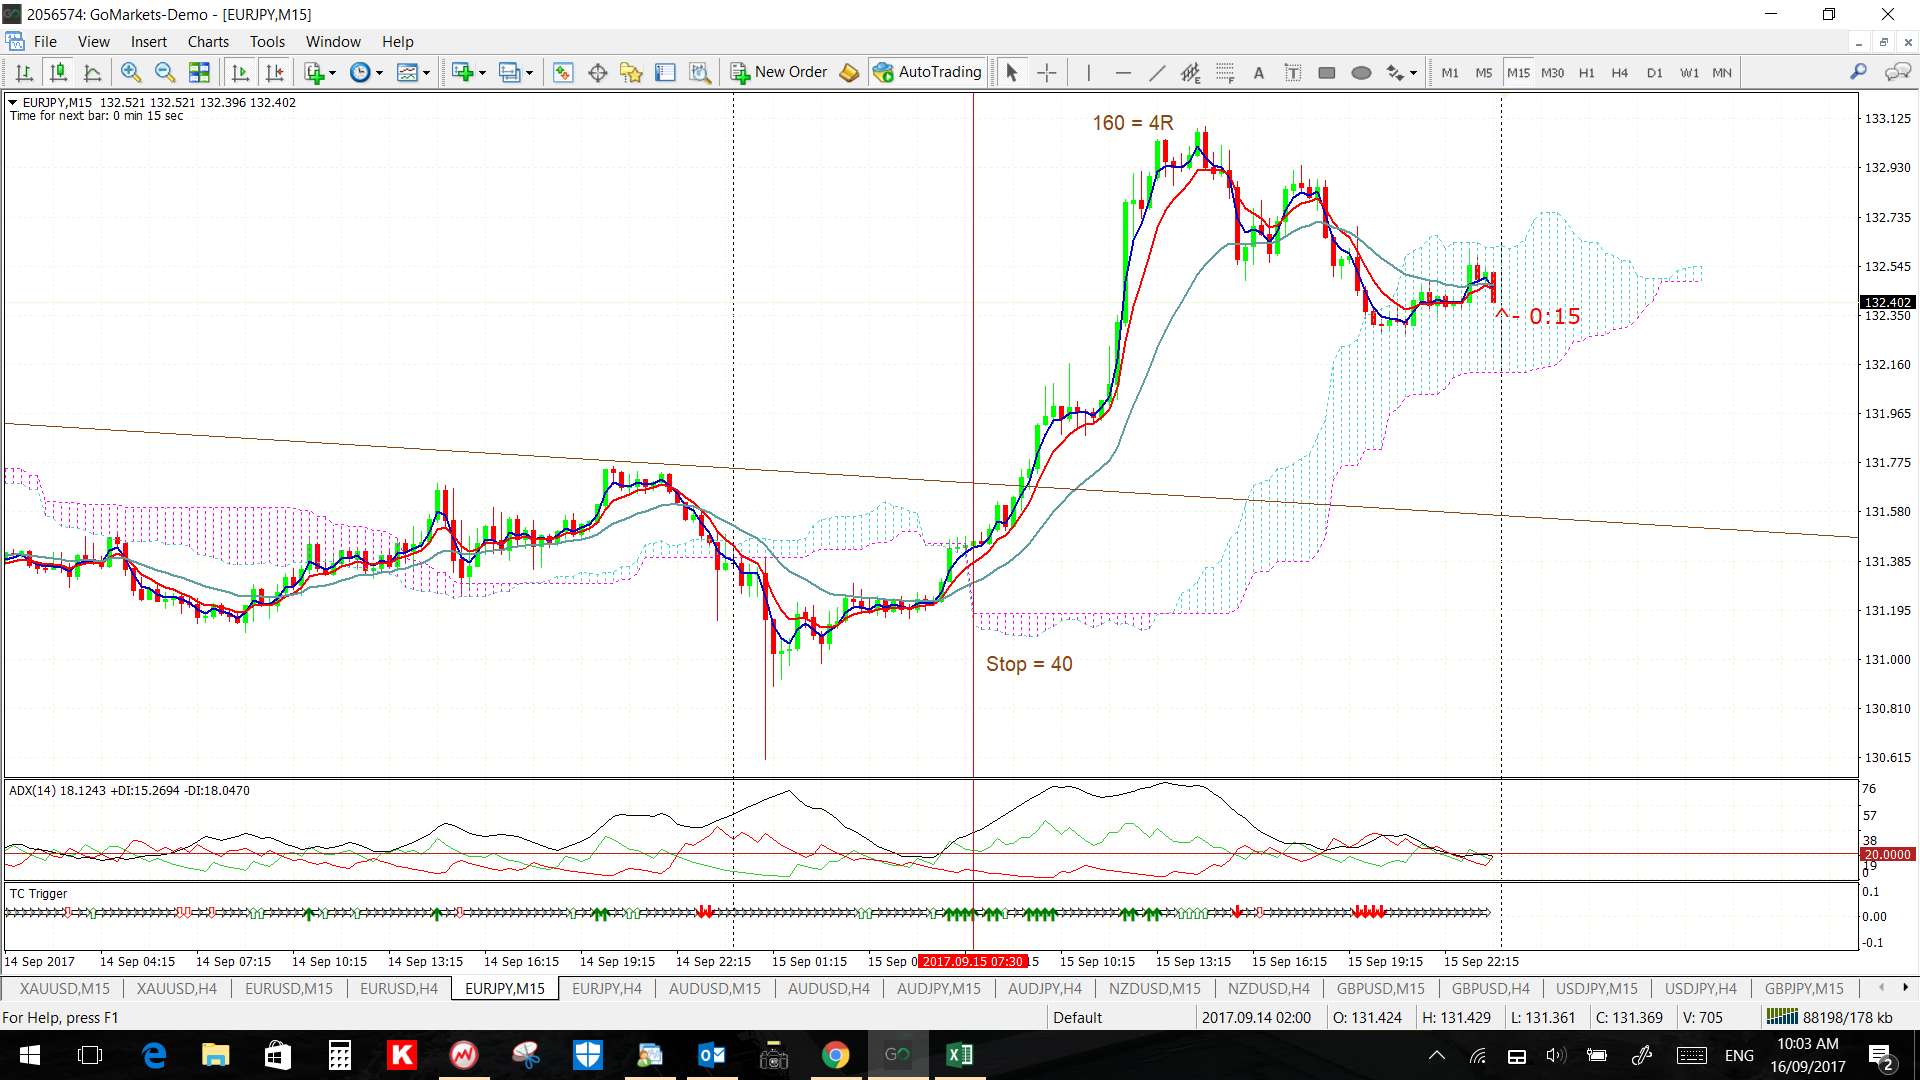
EUR/JPY 15 min: even waiting for the trend line breakout would have worked too but this signal gave a 4R trade result before fading.
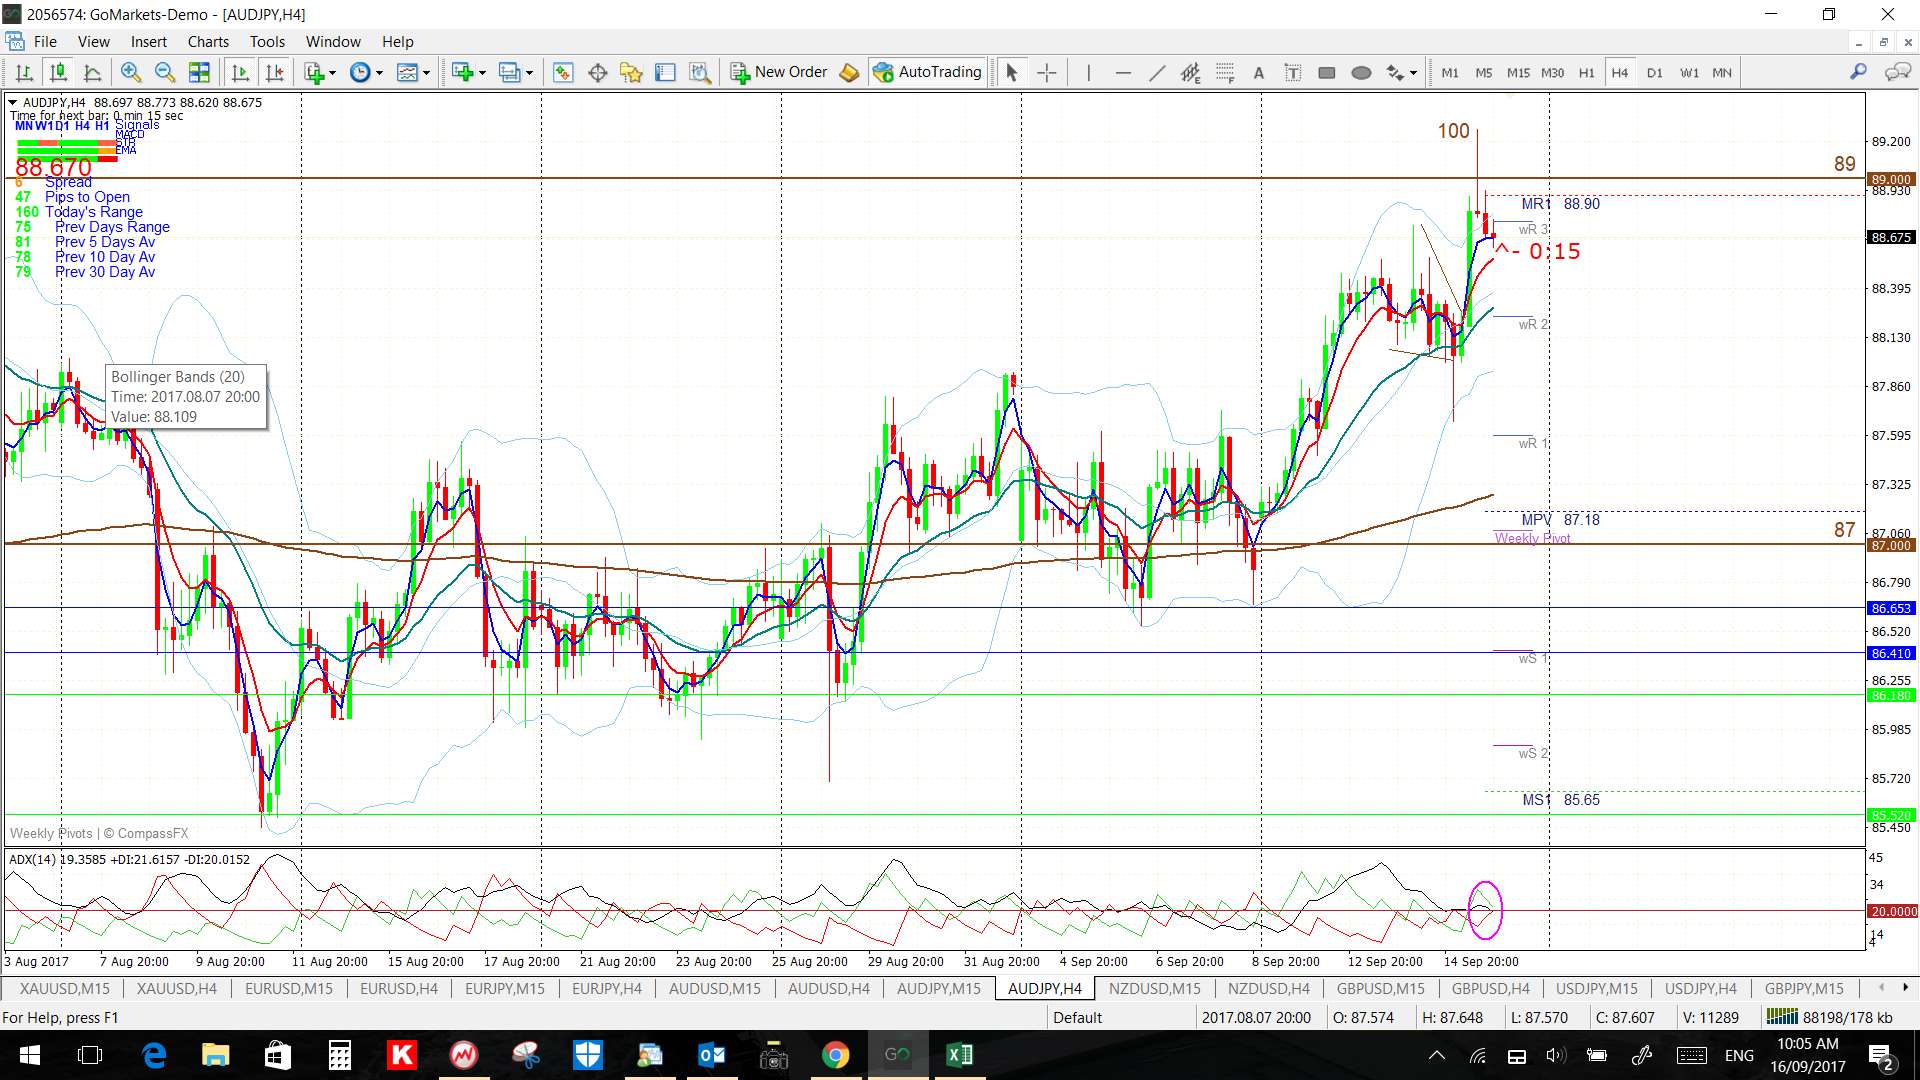
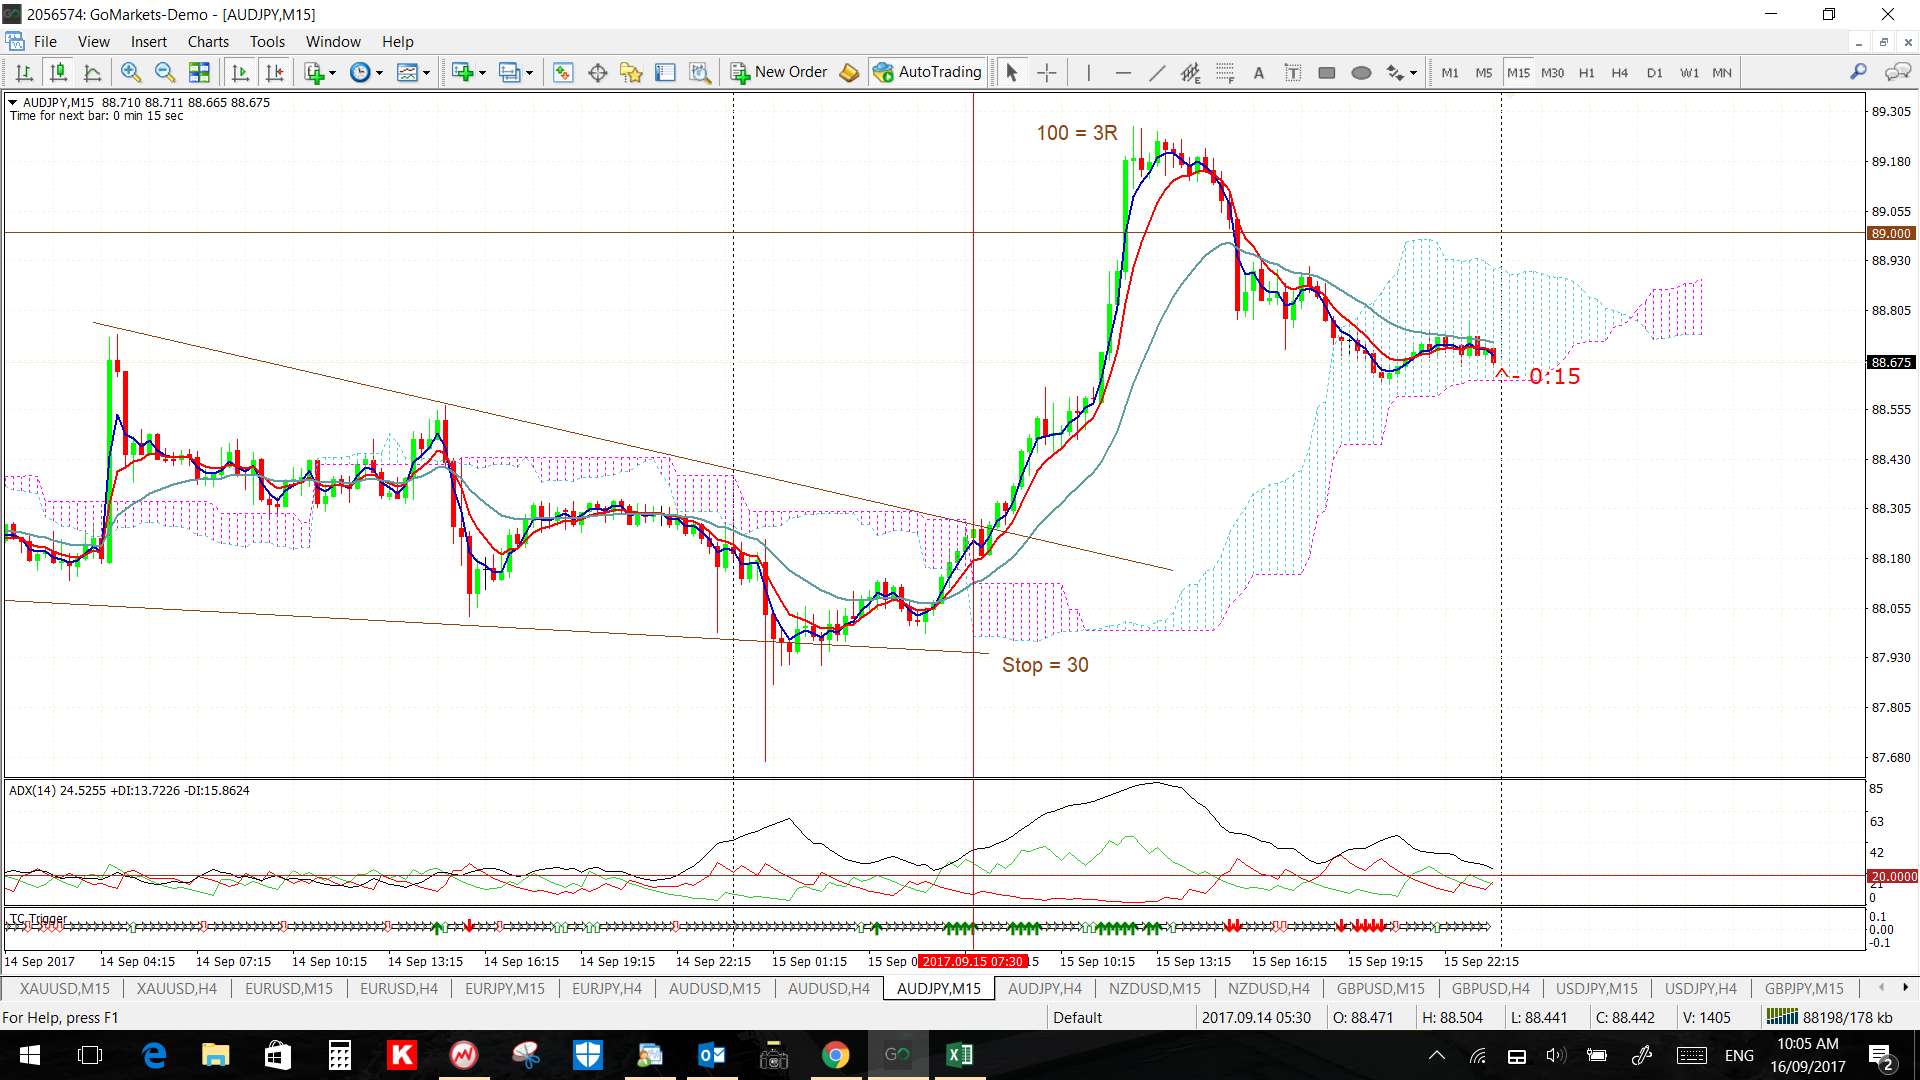
AUD/JPY: this breakout came during the European session on Friday and triggered an Optimal TC signal for 3R:
AUD/JPY 4hr: a 100 pip breakout move:
AUD/JPY 15 min: this was an ideal TC set up producing an Optimal TC signal for 3 R!
- Intra-pattern TC signal:
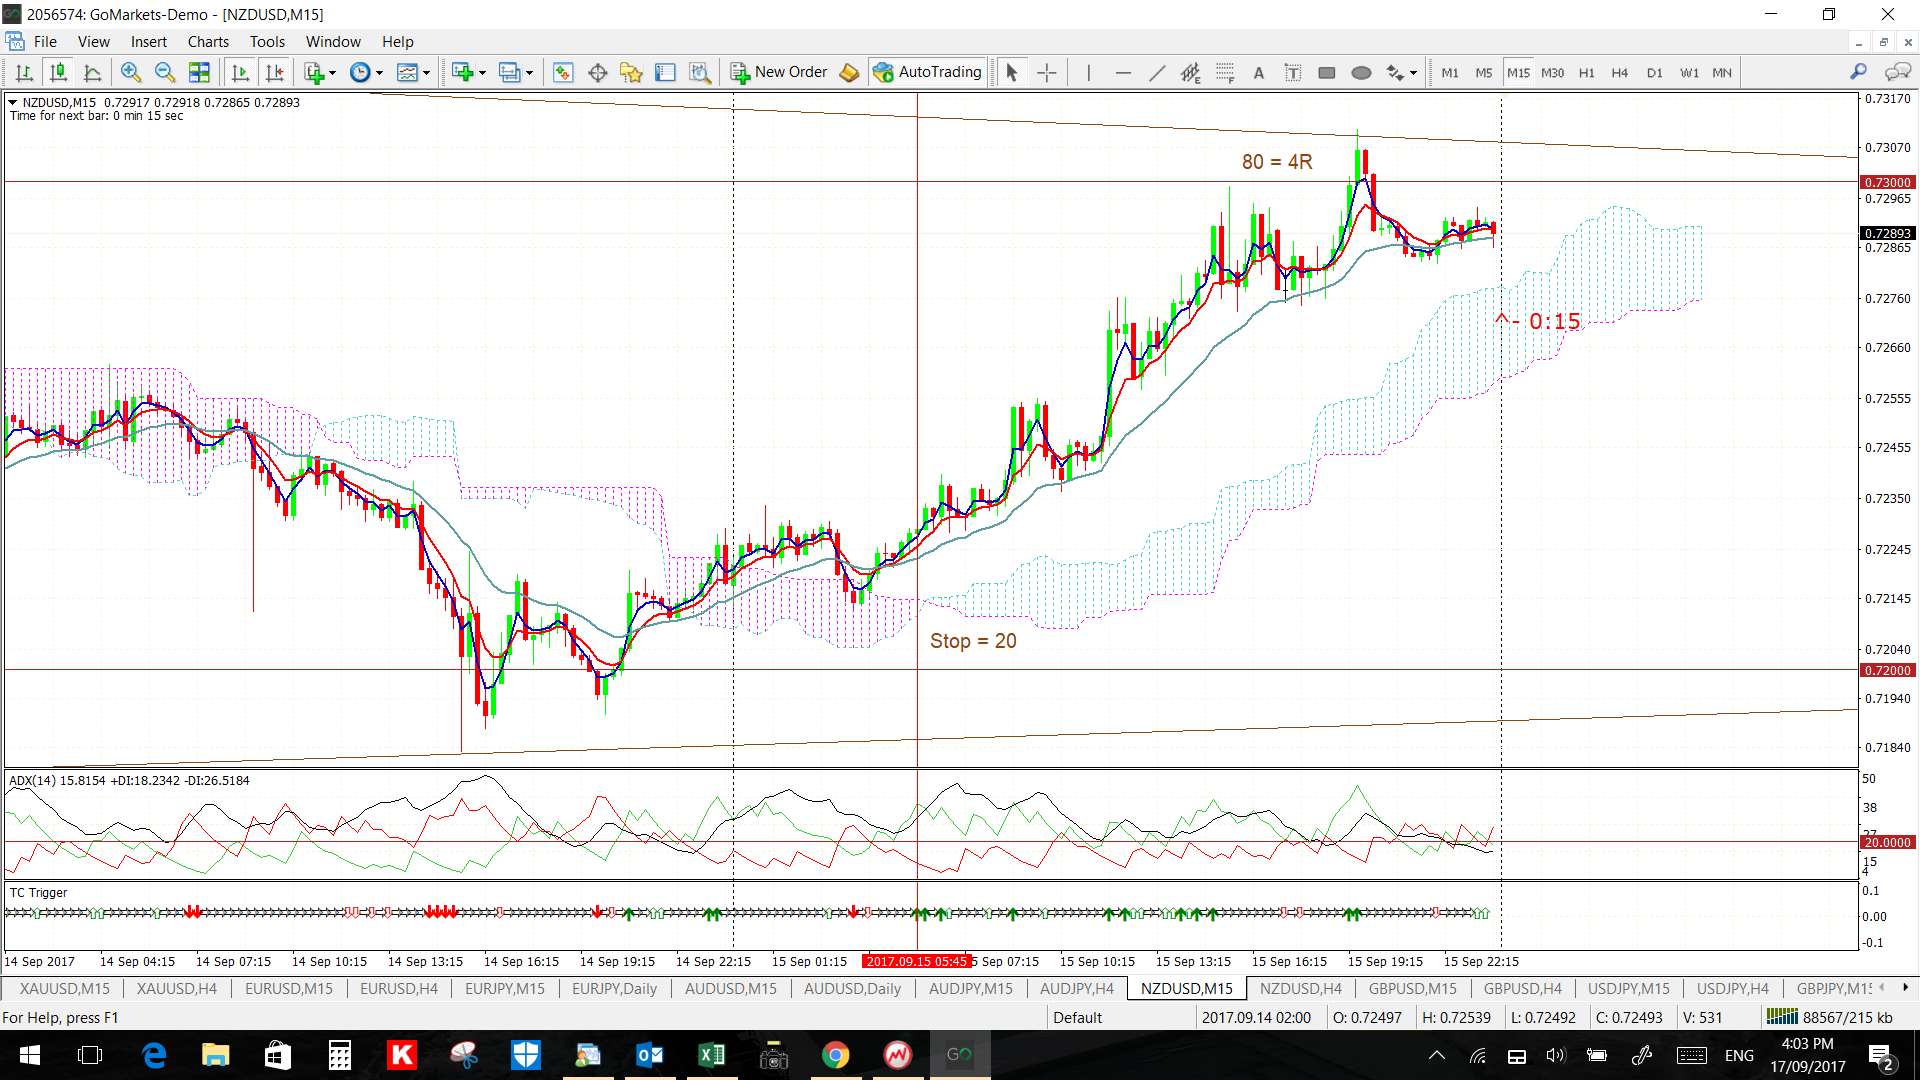
NZD/USD 15 min: this intra-pattern TC signal needed a small Stop of just 20 pips and and gave a 4 R trade result:
General Forex:
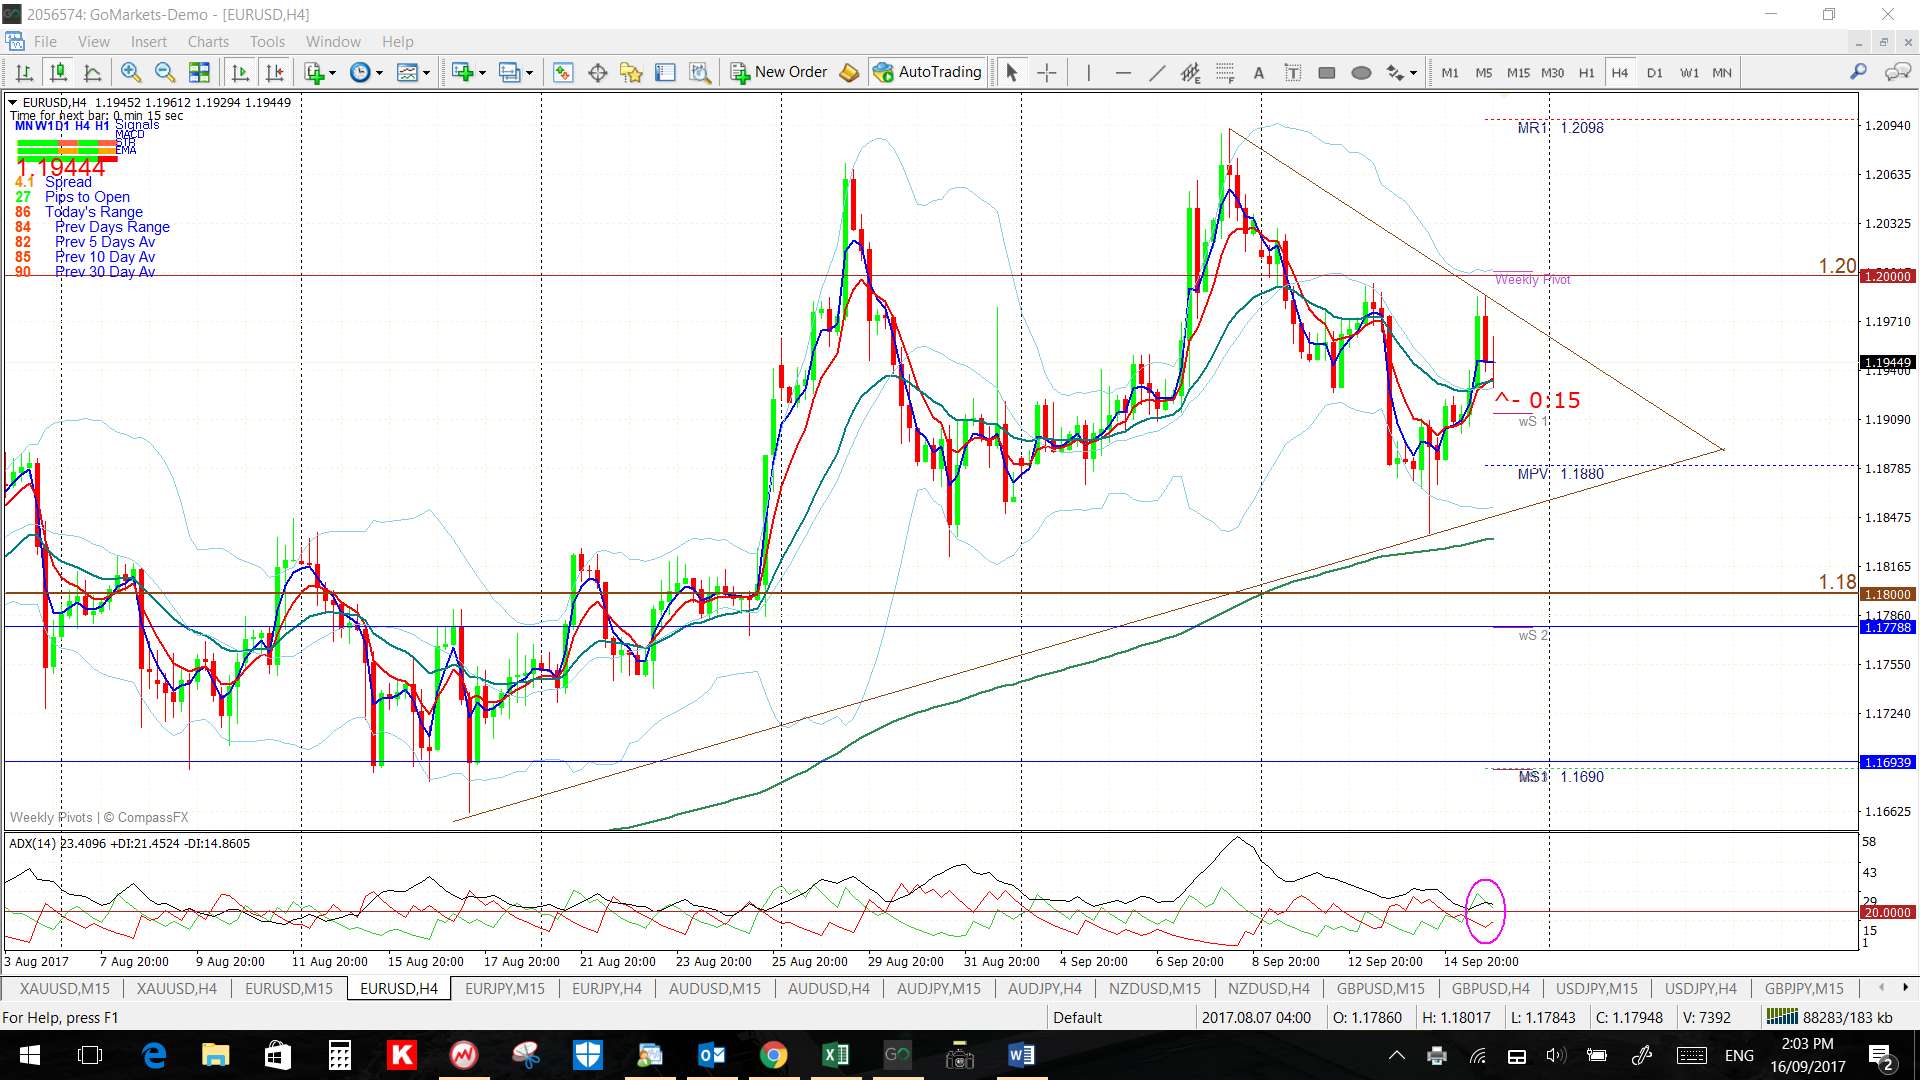
EUR/USD: The EUR/USD spent most of last week consolidating in a triangle above 1.18 but below 1.20. Wednesday’s FOMC might dictate which this pair heads from here.
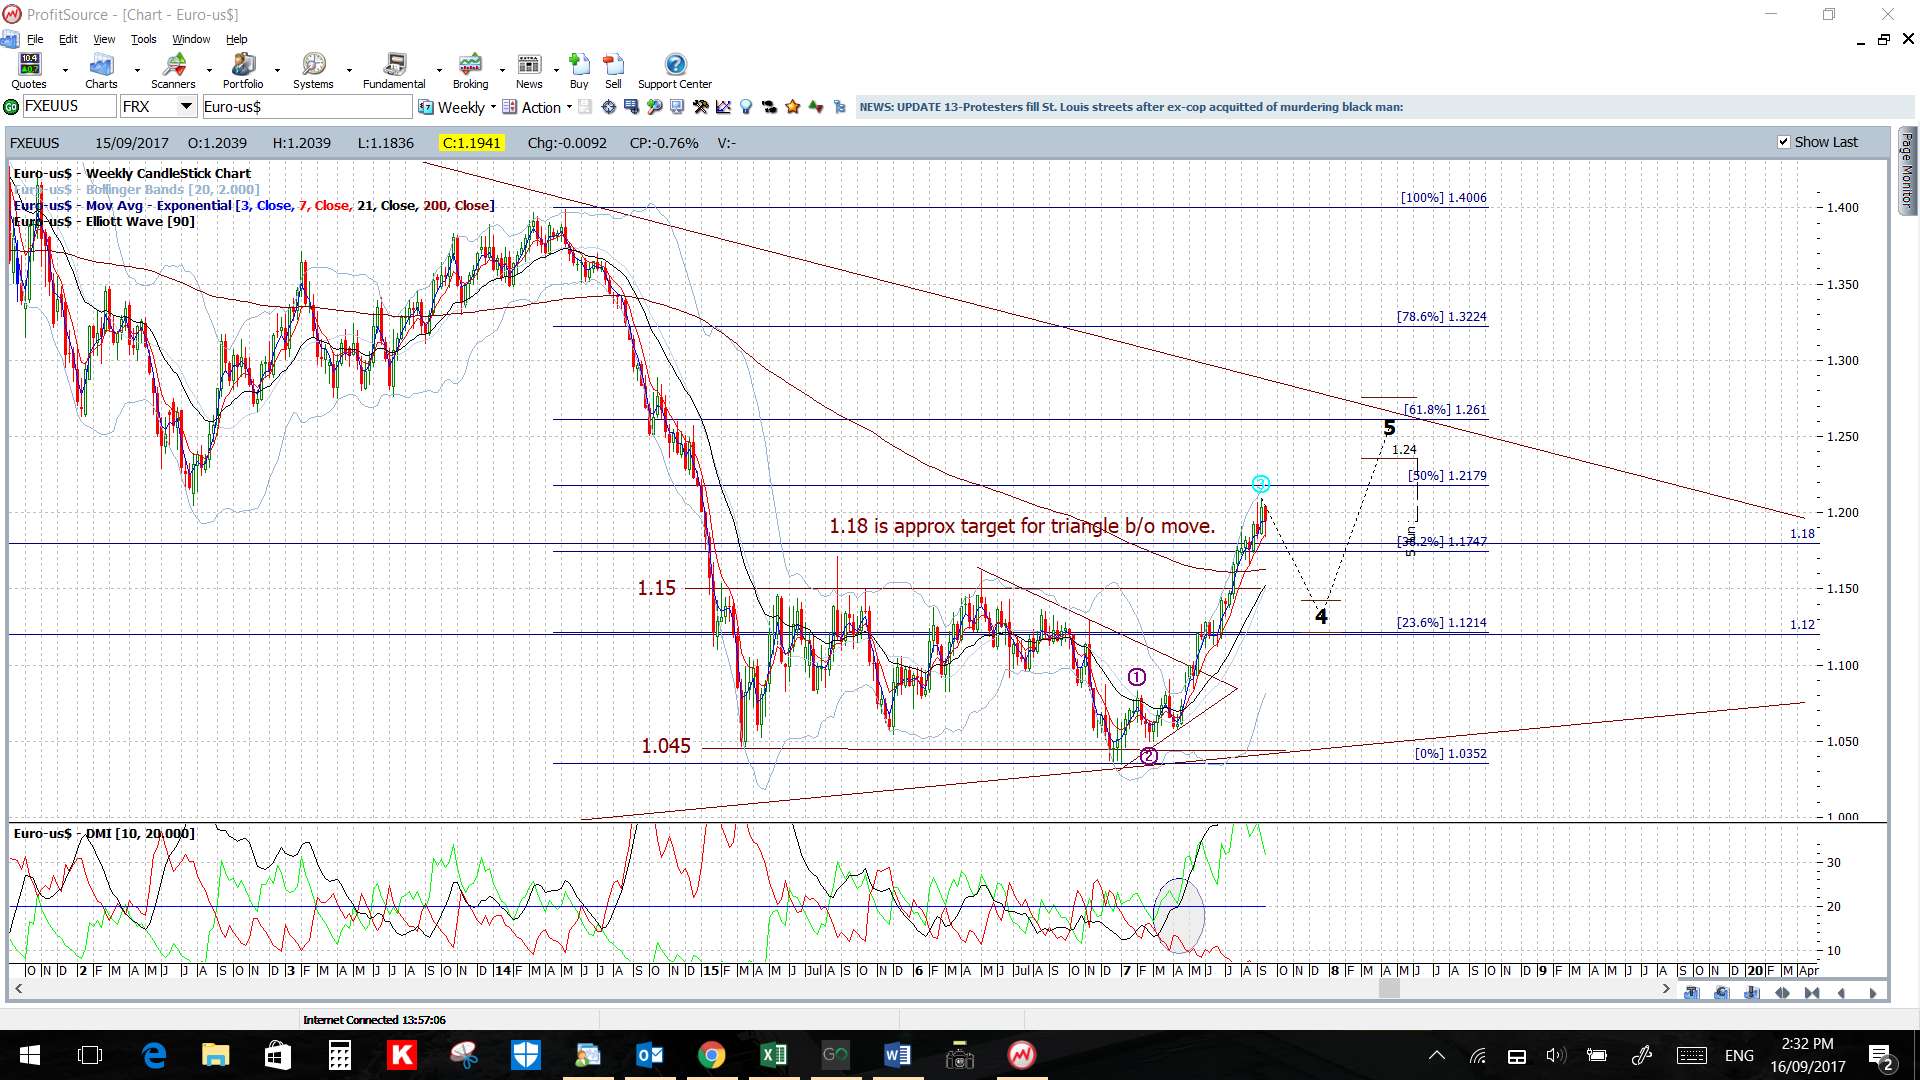
Recall: Just as the US$ index has been in a downtrend since the start of the year, the EUR/USD has rallied. Trends do not travel in straight lines forever though and, even if this pair is set to continue higher, a pause or pullback could occur before that ultimate move. Given this pair has now peaked at the major S/R level of 1.20, a level it hasn’t traded above since January 2015, this could be the resistance to help bring about a pause or pullback. I note, on one of the weekly charts below, that the 61.8% fib of this 2017 swing high move is down near 1.10 so that would be a target for any pullback move here.
Watch the 4hr chart triangle for any new breakout:
- Upper targets: any bullish breakout will bring the S/R level of 1.20 and, then, the longer-term weekly chart’s 61.8% fib, up near 1.25, into focus.
- Lower targets: any bearish retreat would have me looking for a test of 1.18 and then the 1.15 S/R level.

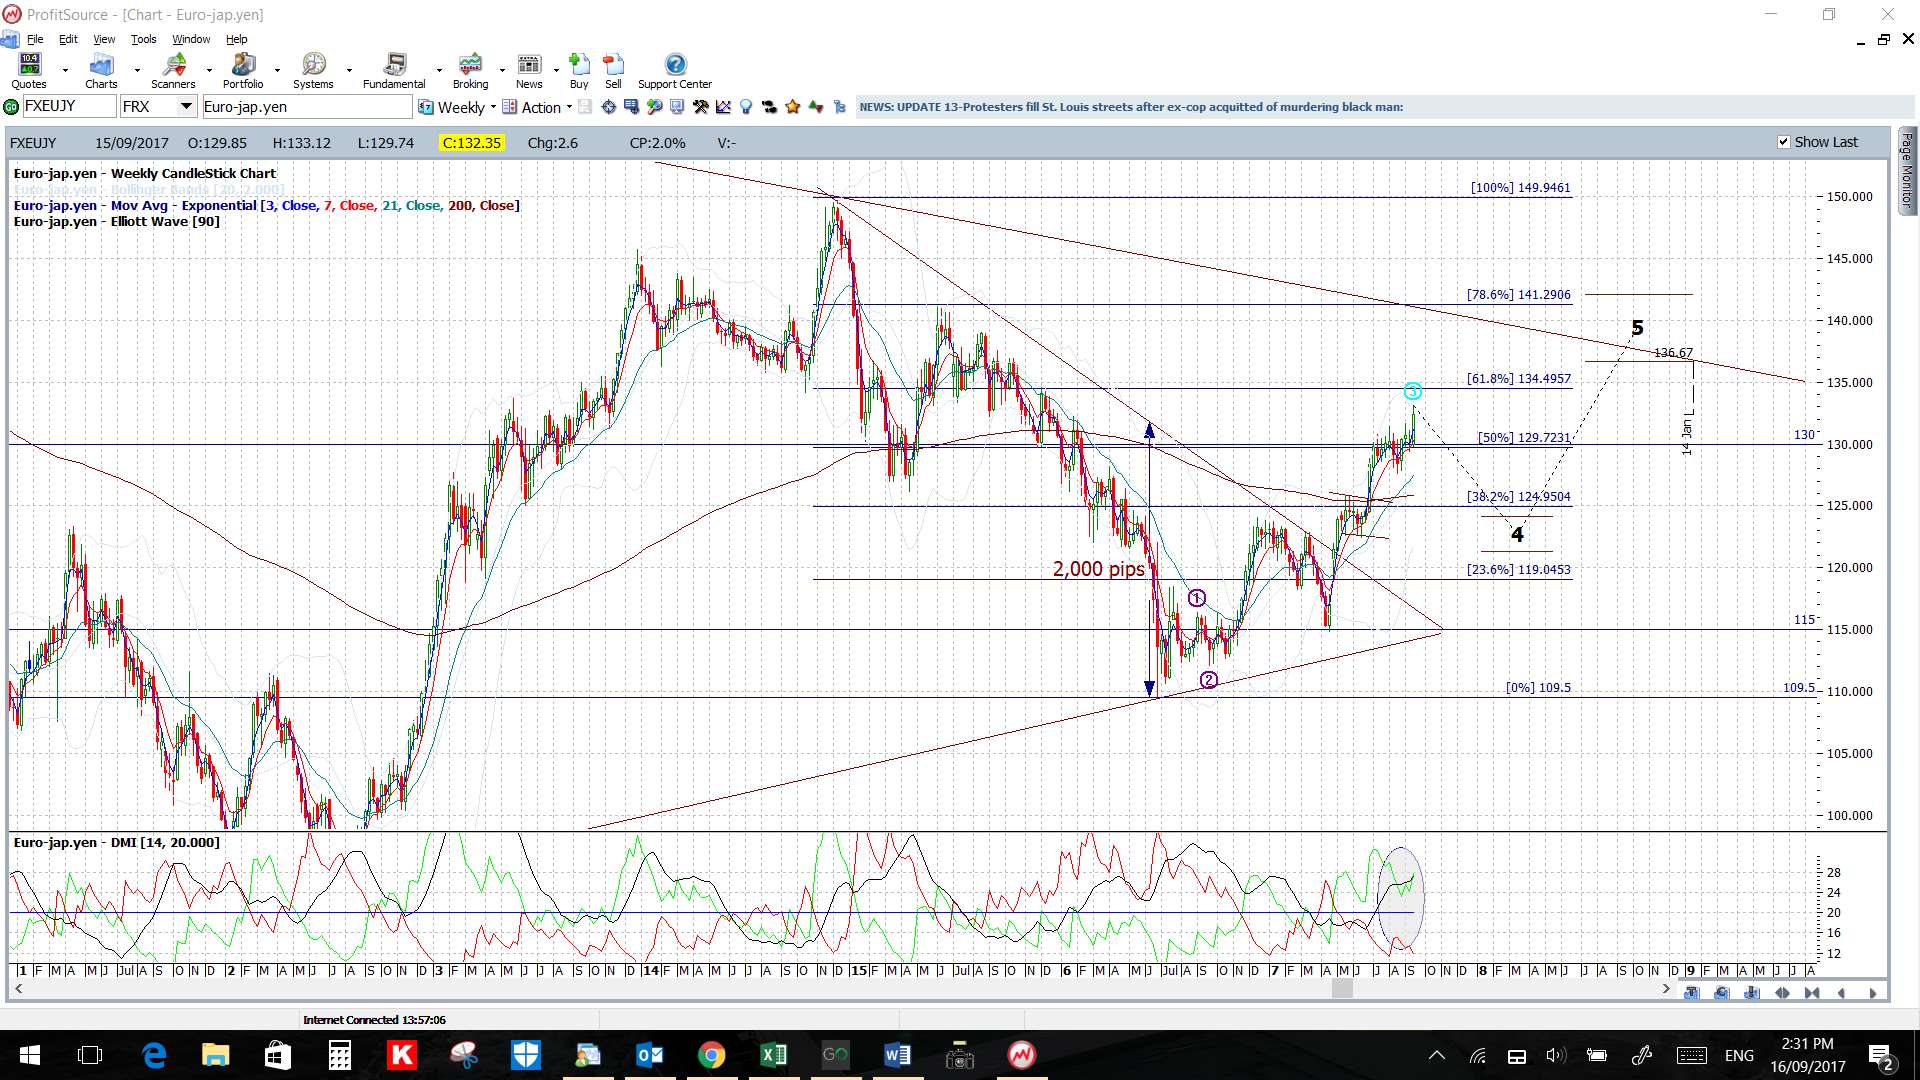
EUR/JPY: This pair seems to have rejected the key 130 S/R level and it broke out of a triangle on Friday giving a great TC trade. The major 135 S/R level looms large above current price now and would be the target if 133 is broken.
NB: There is a still a weekly chart triangle breakout in progress here worth about 2,000 pips and the move thus far has given 1,300 pips.
Watch the revised 4hr chart triangle and key 133 level for any new breakout:
- Upper targets: any bullish breakout above 133 would have me looking for a test of the weekly chart’s 61.8% Fib, near 135.
- Lower targets: any bearish breakdown would have me looking for a test of 130 and, then, the 4hr chart’s 61.8% Fib near 129 S/R.
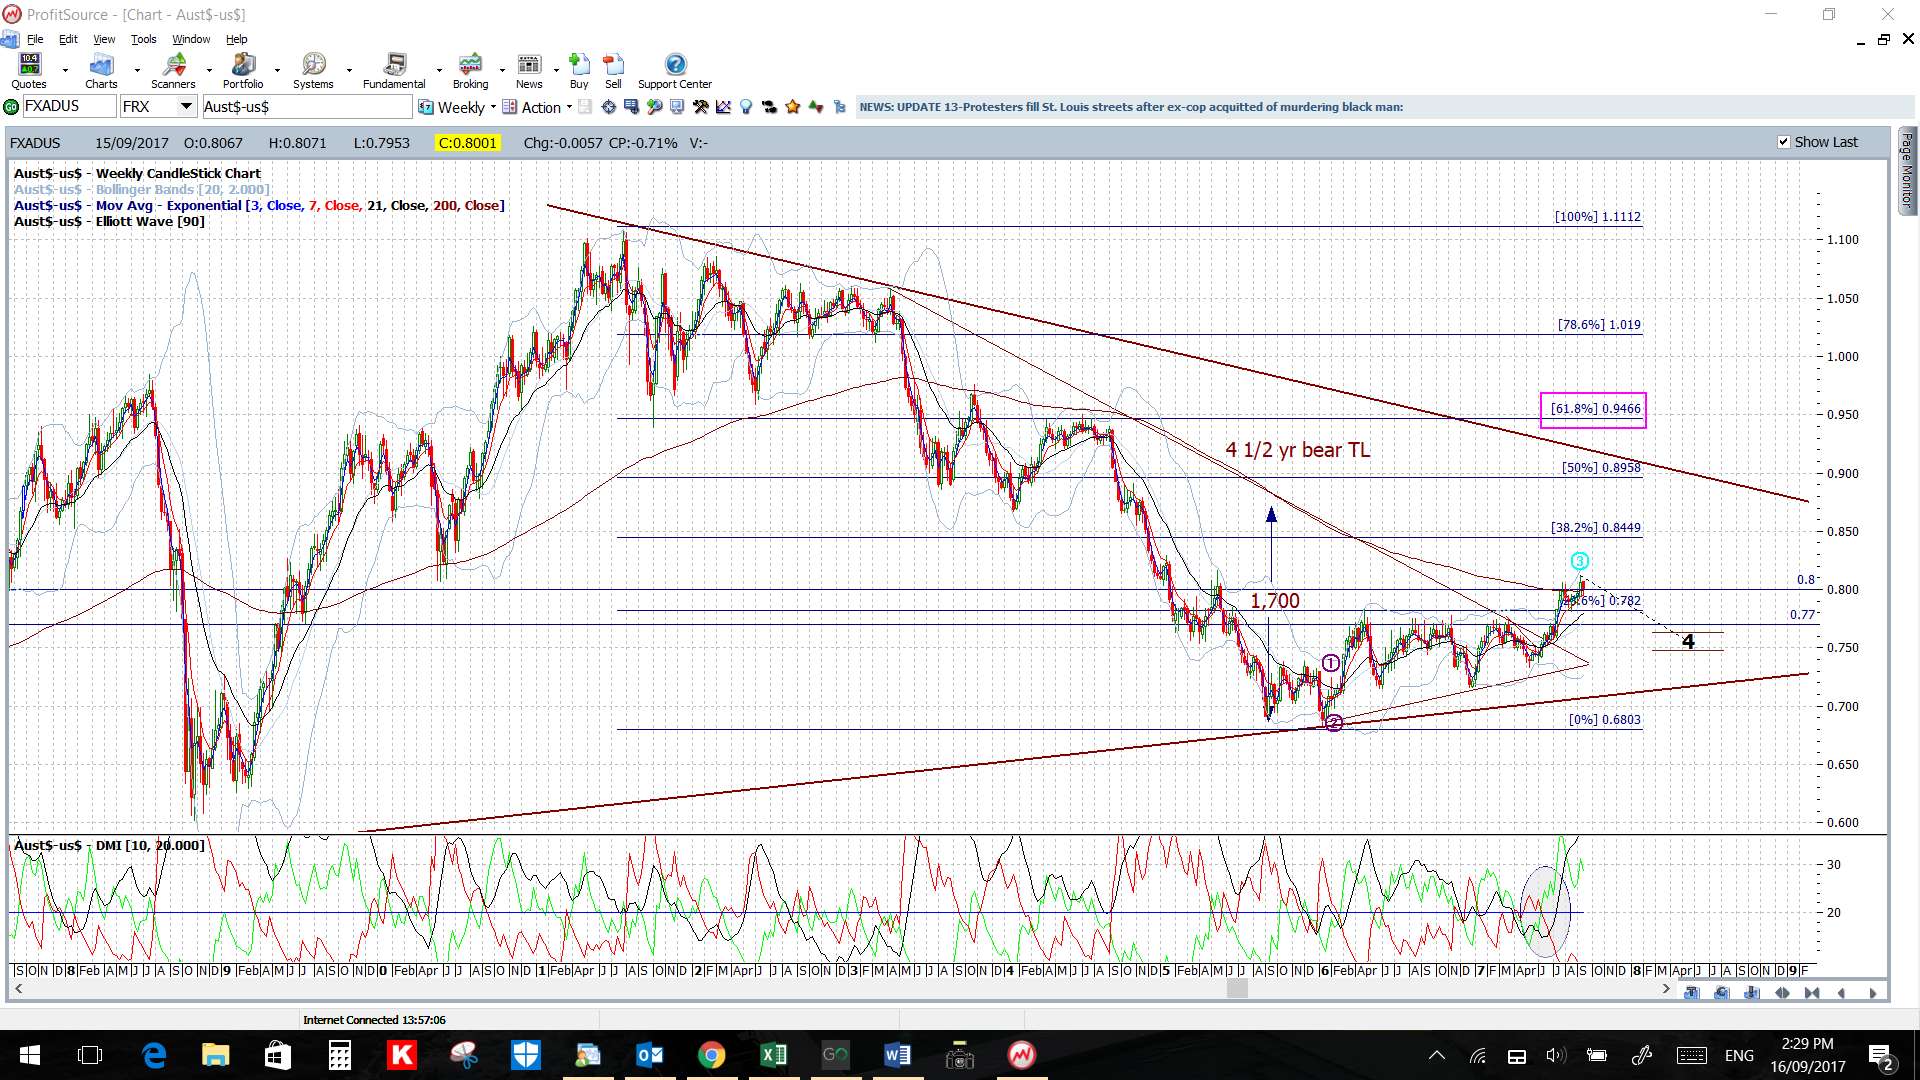
AUD/USD: The Aussie remains pegged near the key 0.80 level but closed the week just a few pips above this major psychological S/R zone. It’s almost like it is trying to acclimatise being this side of the major demarcation zone before trying to head higher.
Recall: that the Aussie is currently in a weekly chart triangle breakout worth up to 1,700 pips and has given around 500 pips thus far.
Watch the 4hr chart’s triangle trend lines and 0.80 level for any new breakout:
- Upper targets: any bullish break will bring ‘whole number’ levels and the monthly 200 EMA followed by the weekly chart’s 50% fib, near 0.90, as this is now also near the monthly chart’s bear trend line.
- Lower targets: any pullback would have me looking for a test of 0.78.

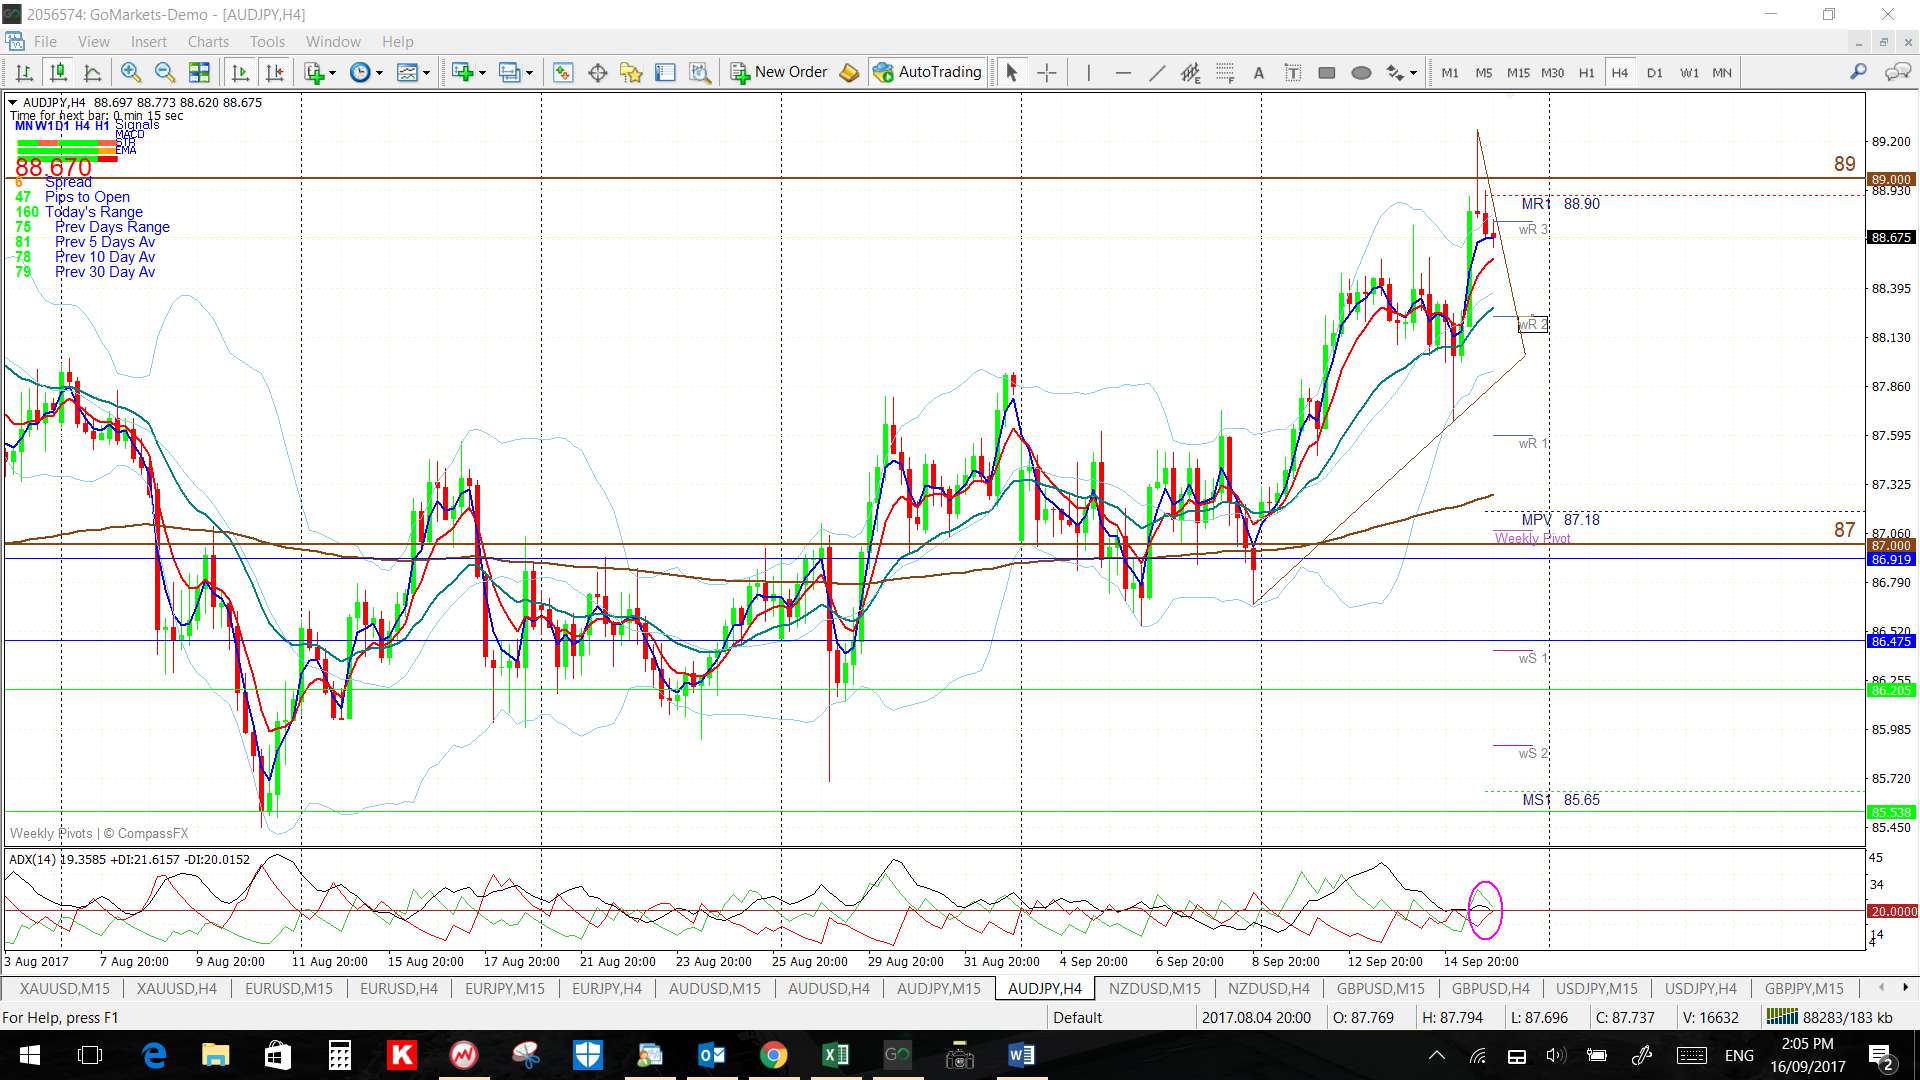
AUD/JPY: The AUD/JPY has been bullish and gave a great TC trade on Friday to close the week just under the key 89 level.
Recall: there is a weekly chart triangle breakout in progress here after the break of a 2 ½ year bear trend line and this could be worth up to 2,000 pips. Note, also, the bullish-reversal Inverse H&S on the weekly chart.
Watch the revised 4hr chart triangle and 89 level for any new breakout:
- Upper targets: any bullish breakout would bring the weekly chart’s 61.8% fib, near 91, into focus.
- Lower targets: any bearish breakdown would have me looking for a test of 87 and then 85 S/R.

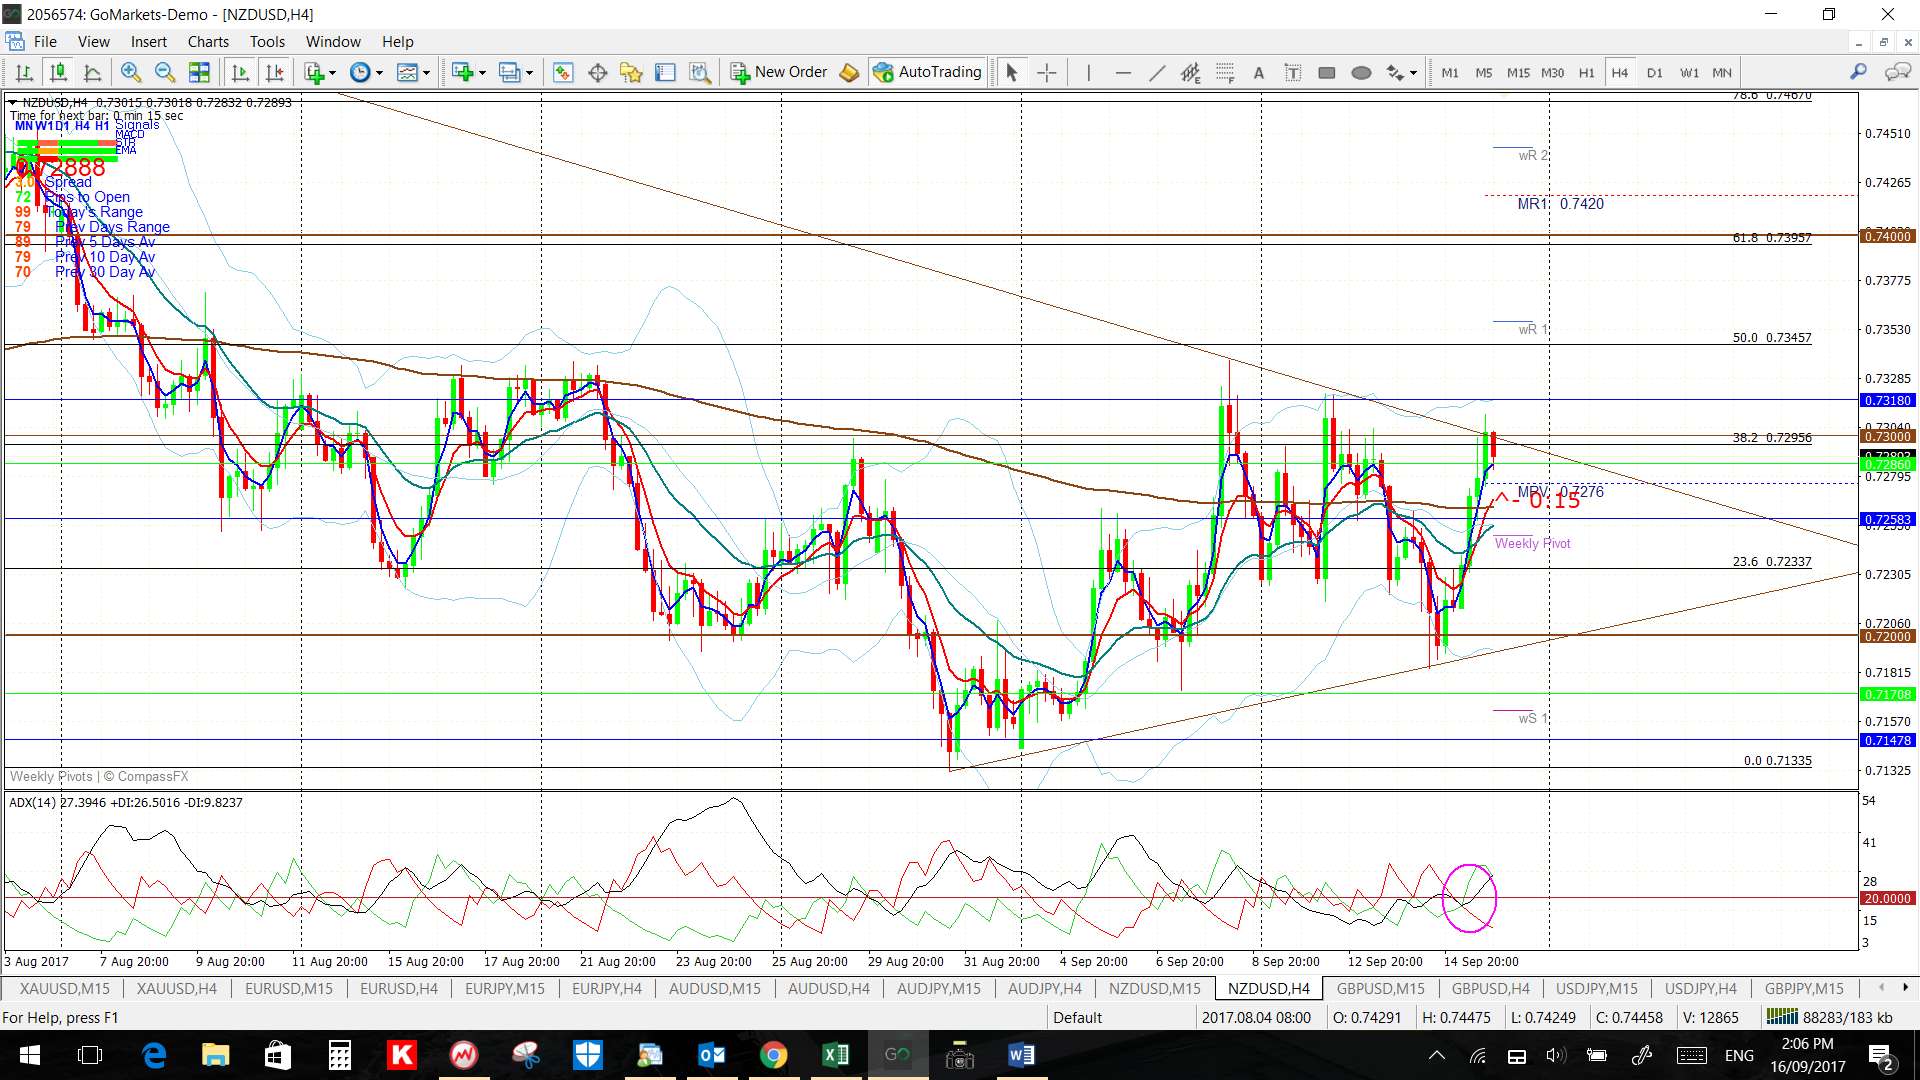
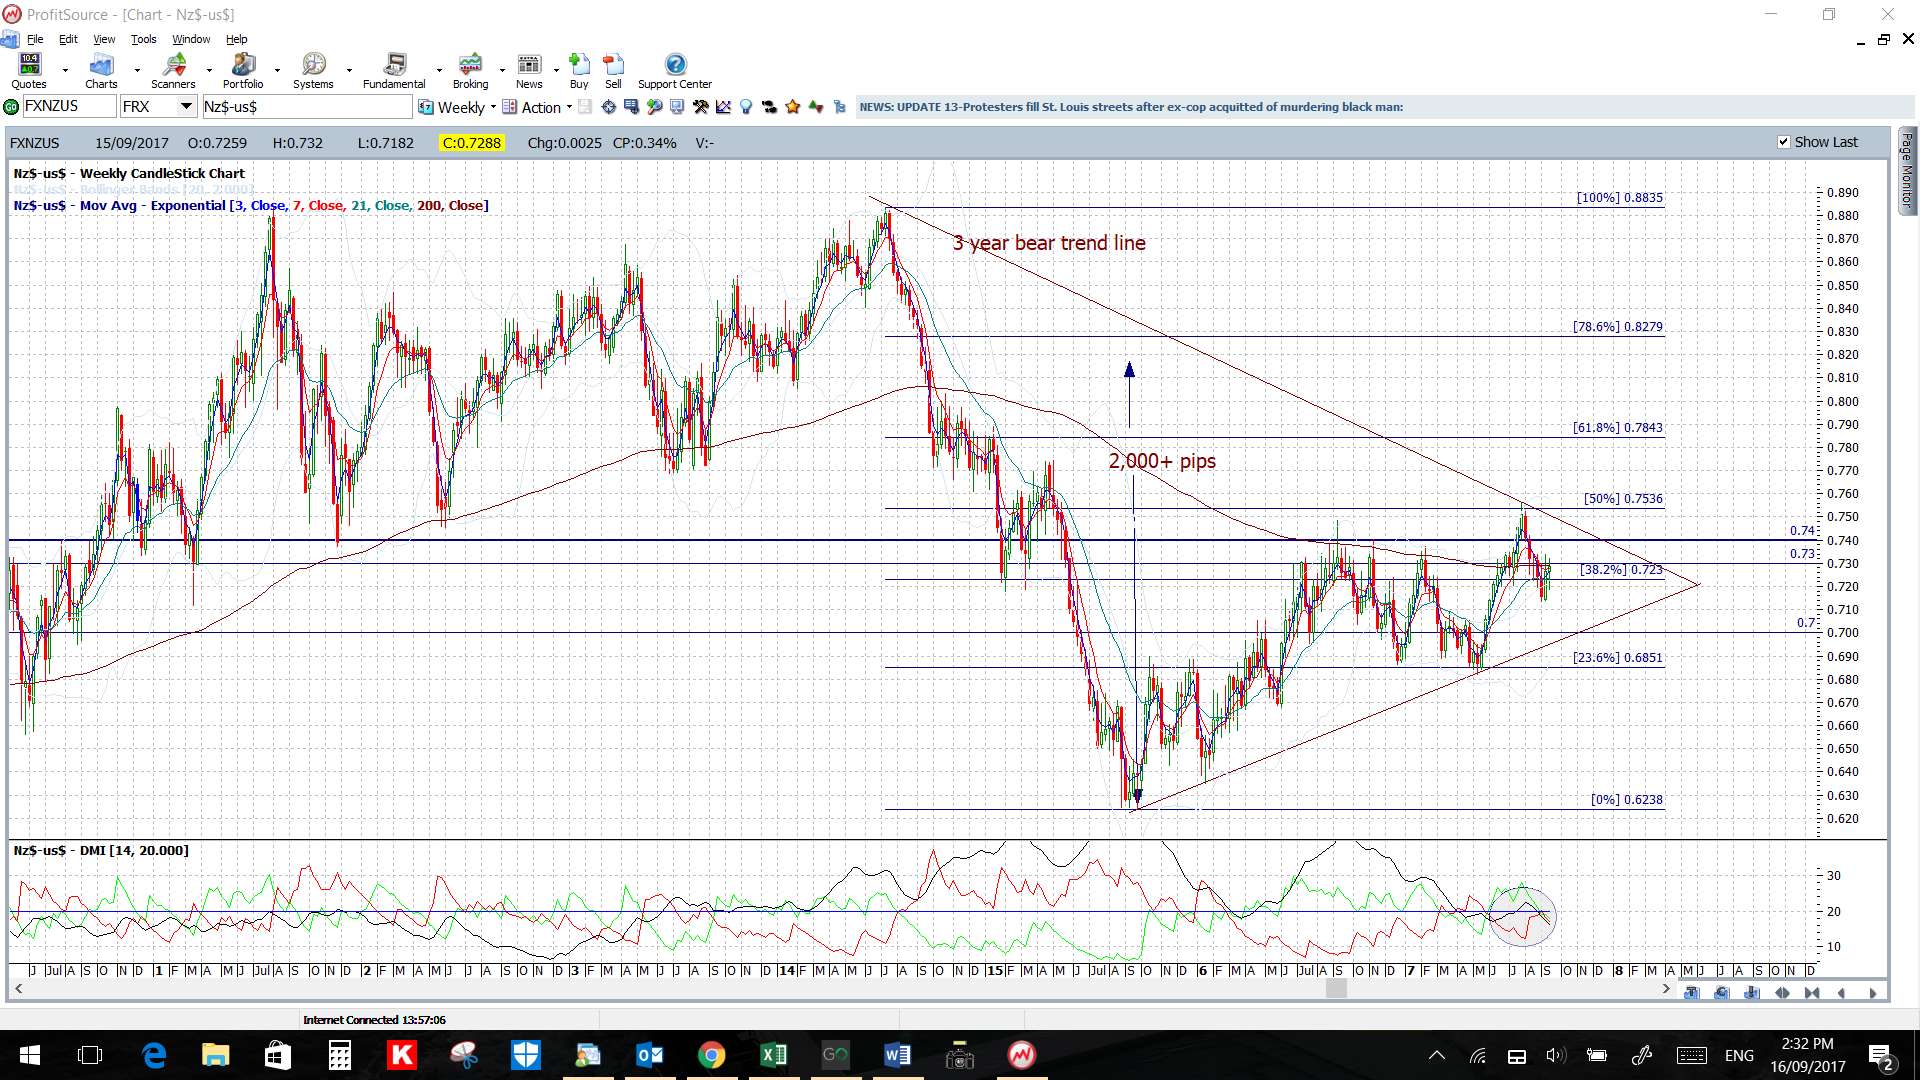
NZD/USD: The Kiwi remains in a 4hr chart triangle (just) and this is set within a larger weekly chart triangle.
Note: that there is a weekly chart triangle developing here that could be worth up to 2,000 pips.
Watch the 4hr chart triangle and key 0.73 level for any new breakout:
- Upper targets: the 0.74 level followed by the longer-term weekly chart’s 50% fib, up near 0.75, and then the 61.8% fib, up near 0.79.
- Lower targets: The 0.71 and 0.70 S/R levels.
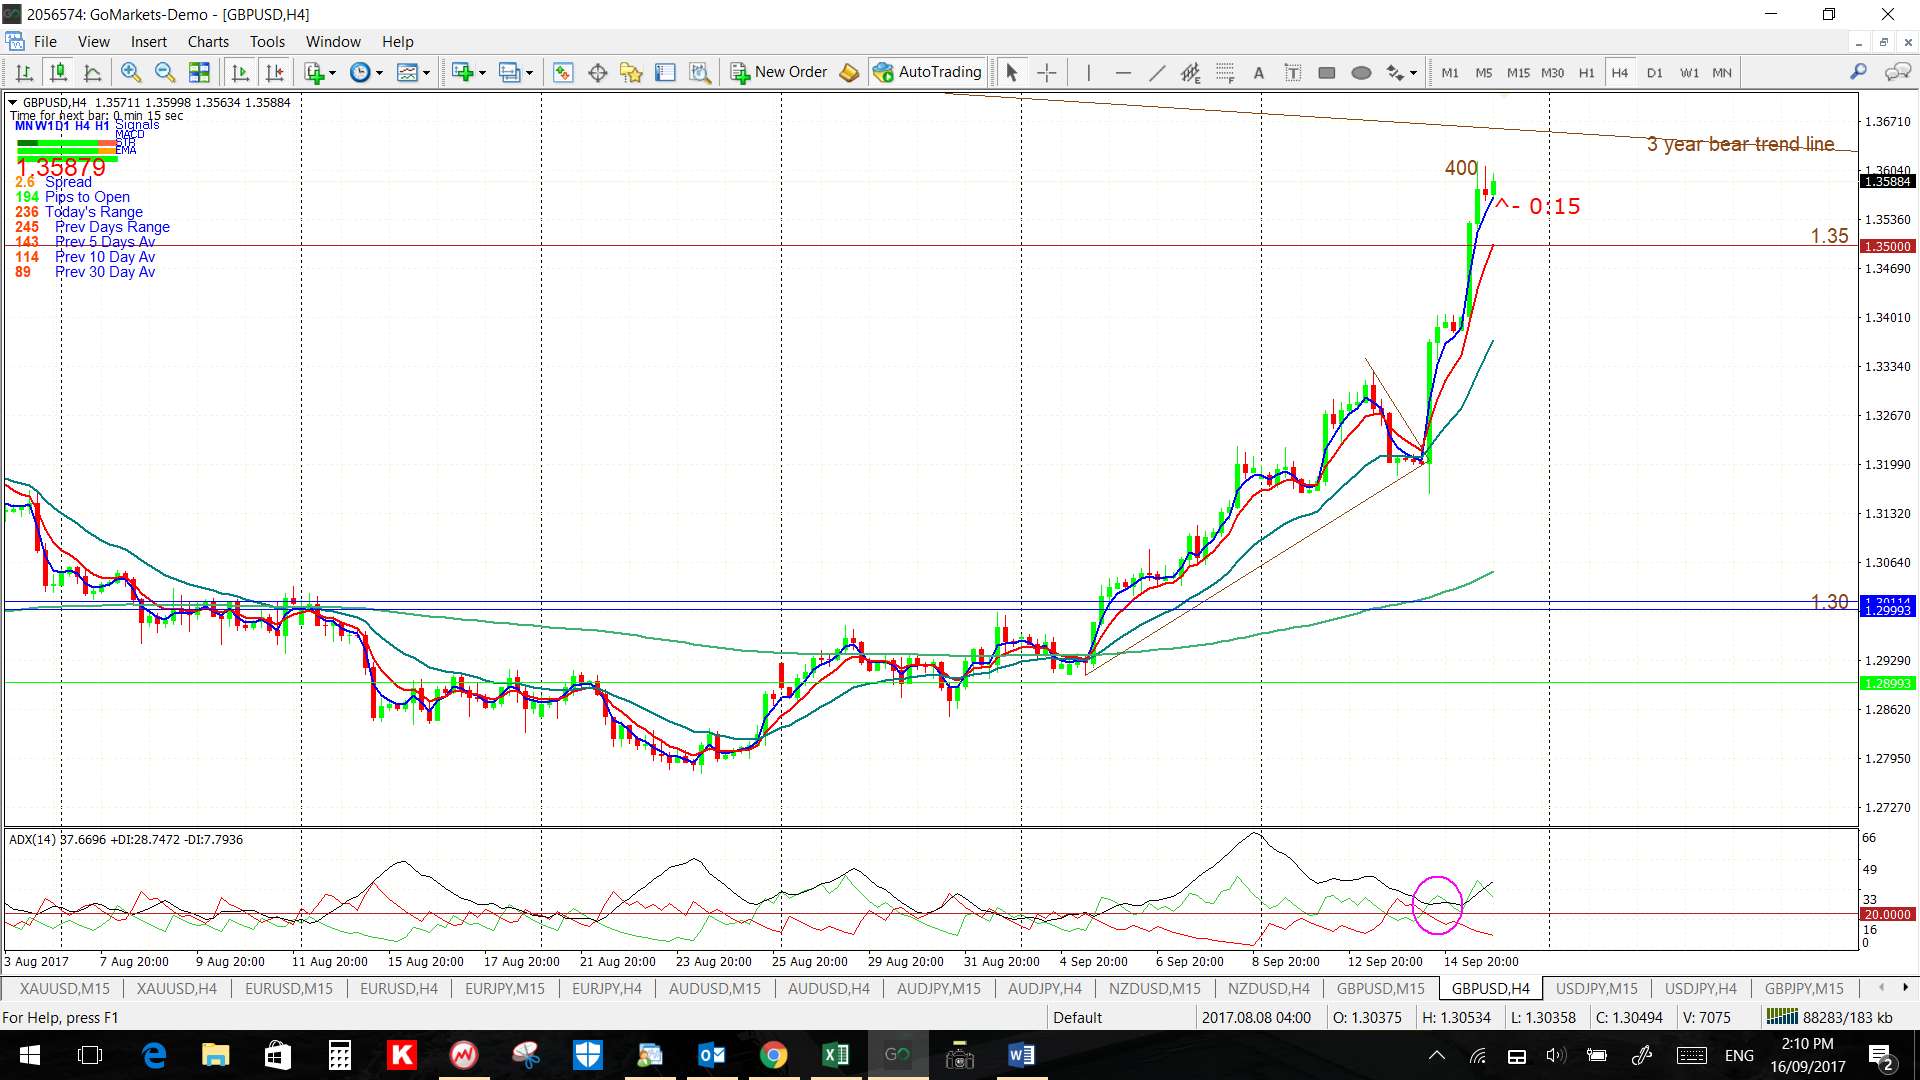
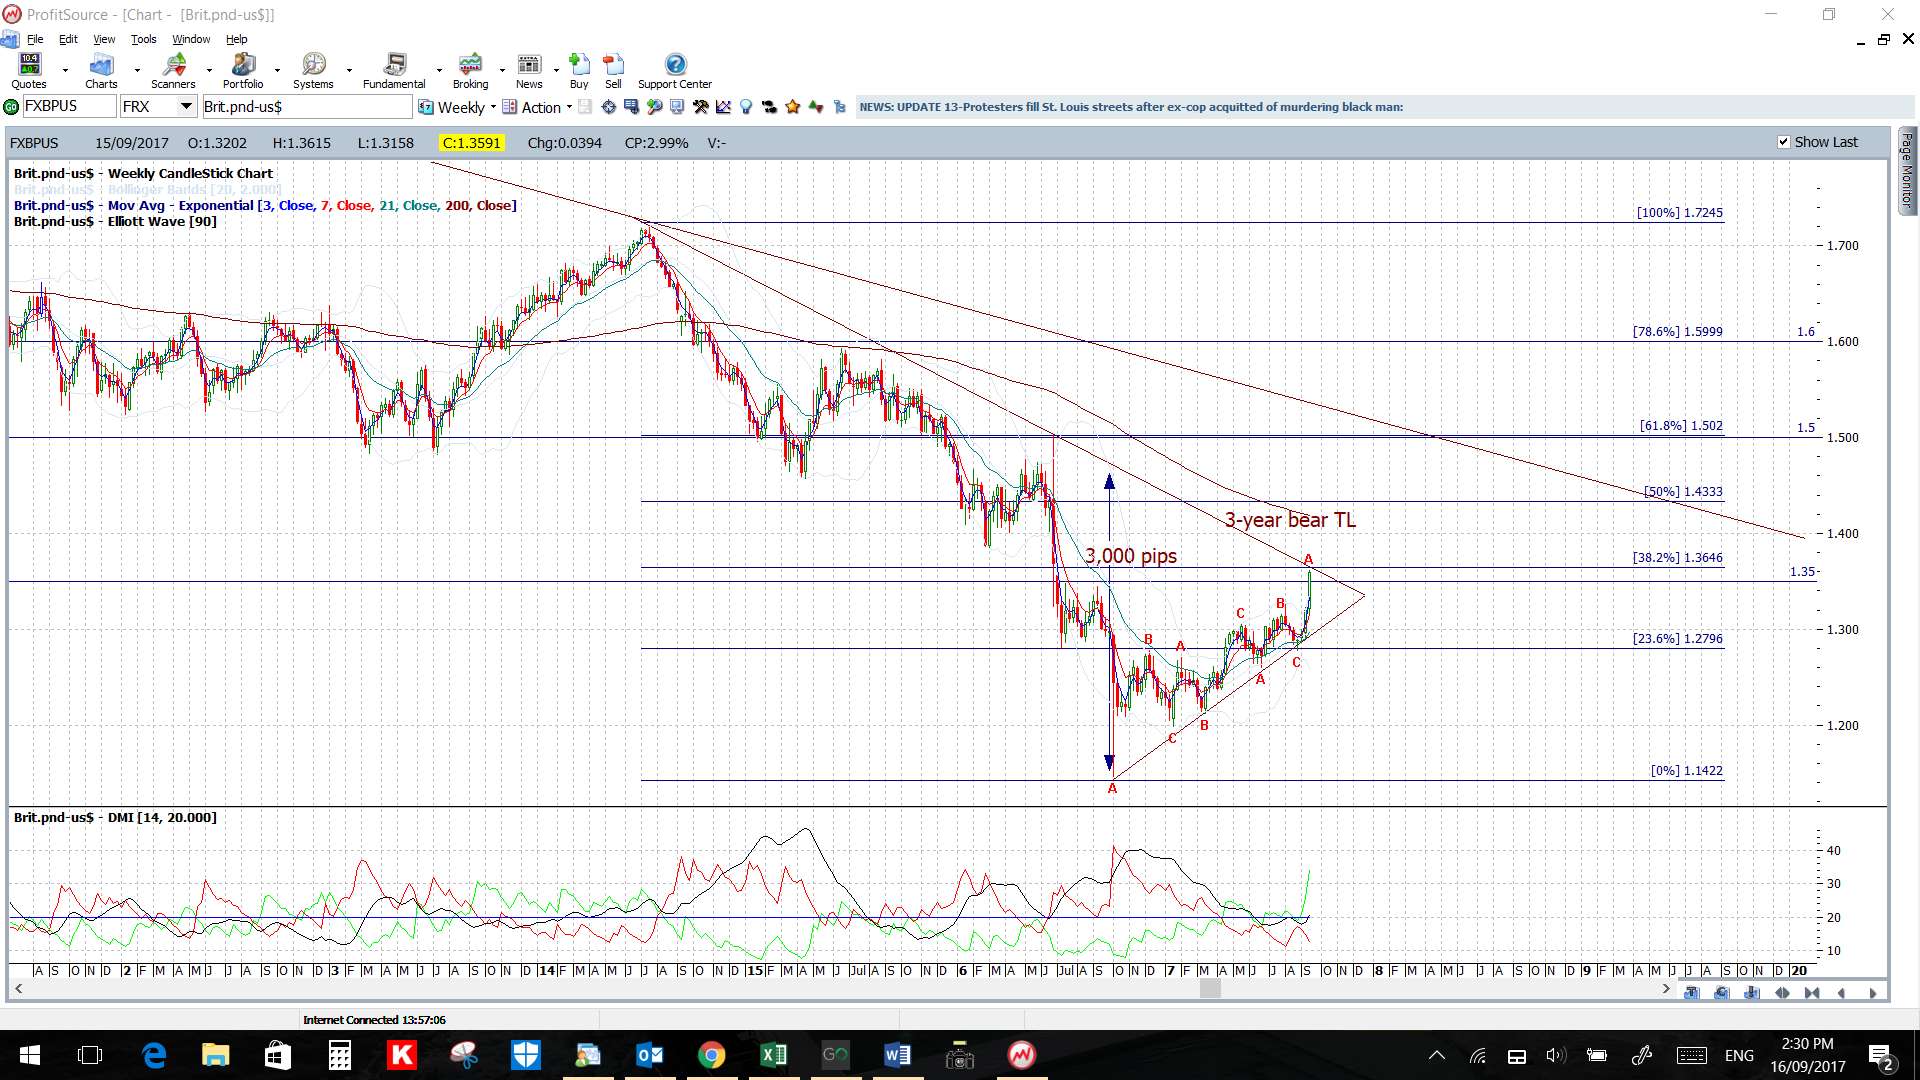
GBP/USD: The Cable made a HUGE move last week breaking up through various 4hr chart patterns and through the key 1.35 S/R level. There is major resistance just above current price now though from the weekly chart’s triangle trend line and this is just above the 1.35 level.
Watch the 1.35 level and weekly chart bear trend line for any new make or break.
- Upper targets: any bullish hold above 1.35 and break above the weekly chart’s triangle trend line will have me looking to the the weekly chart’s 61.8% fib near 1.50.
- Lower targets: any bearish retreat will bring the 1.30 S/R level and, then, the weekly chart’s support triangle trend line into focus.

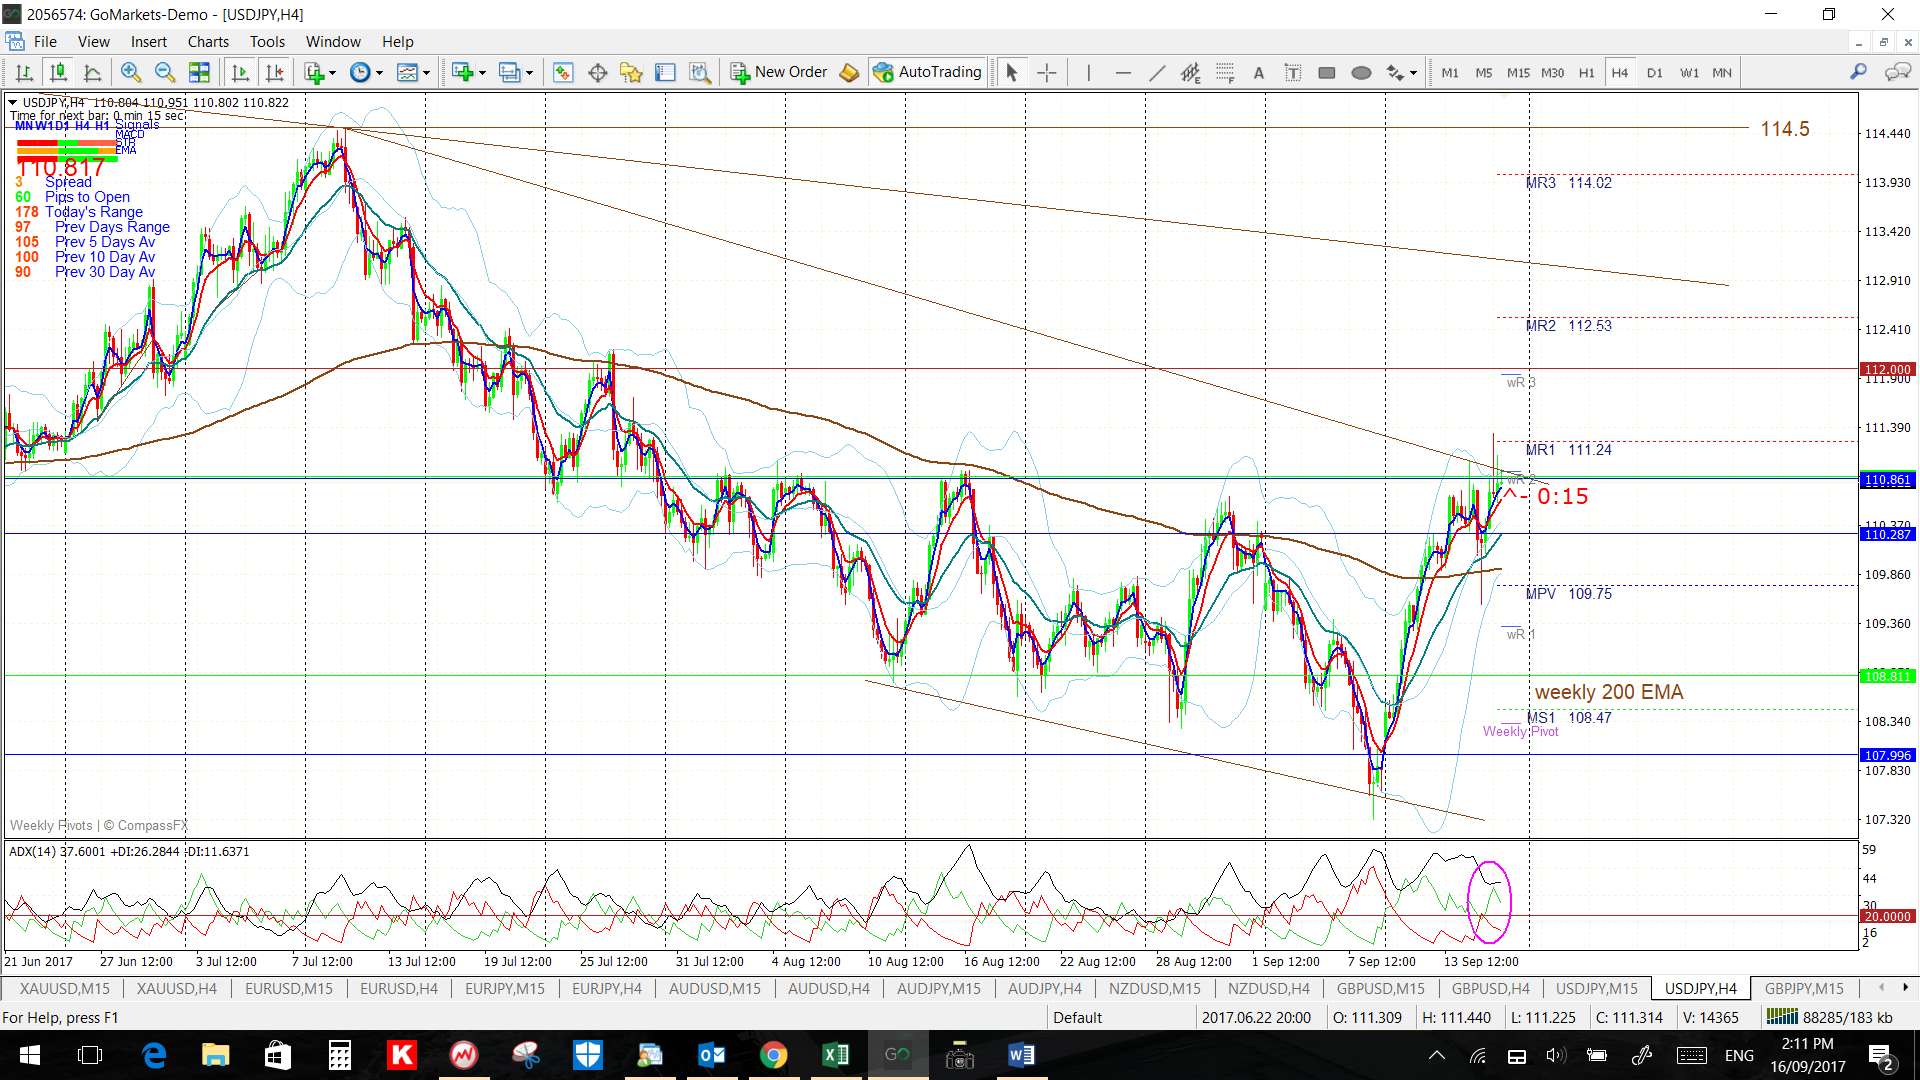
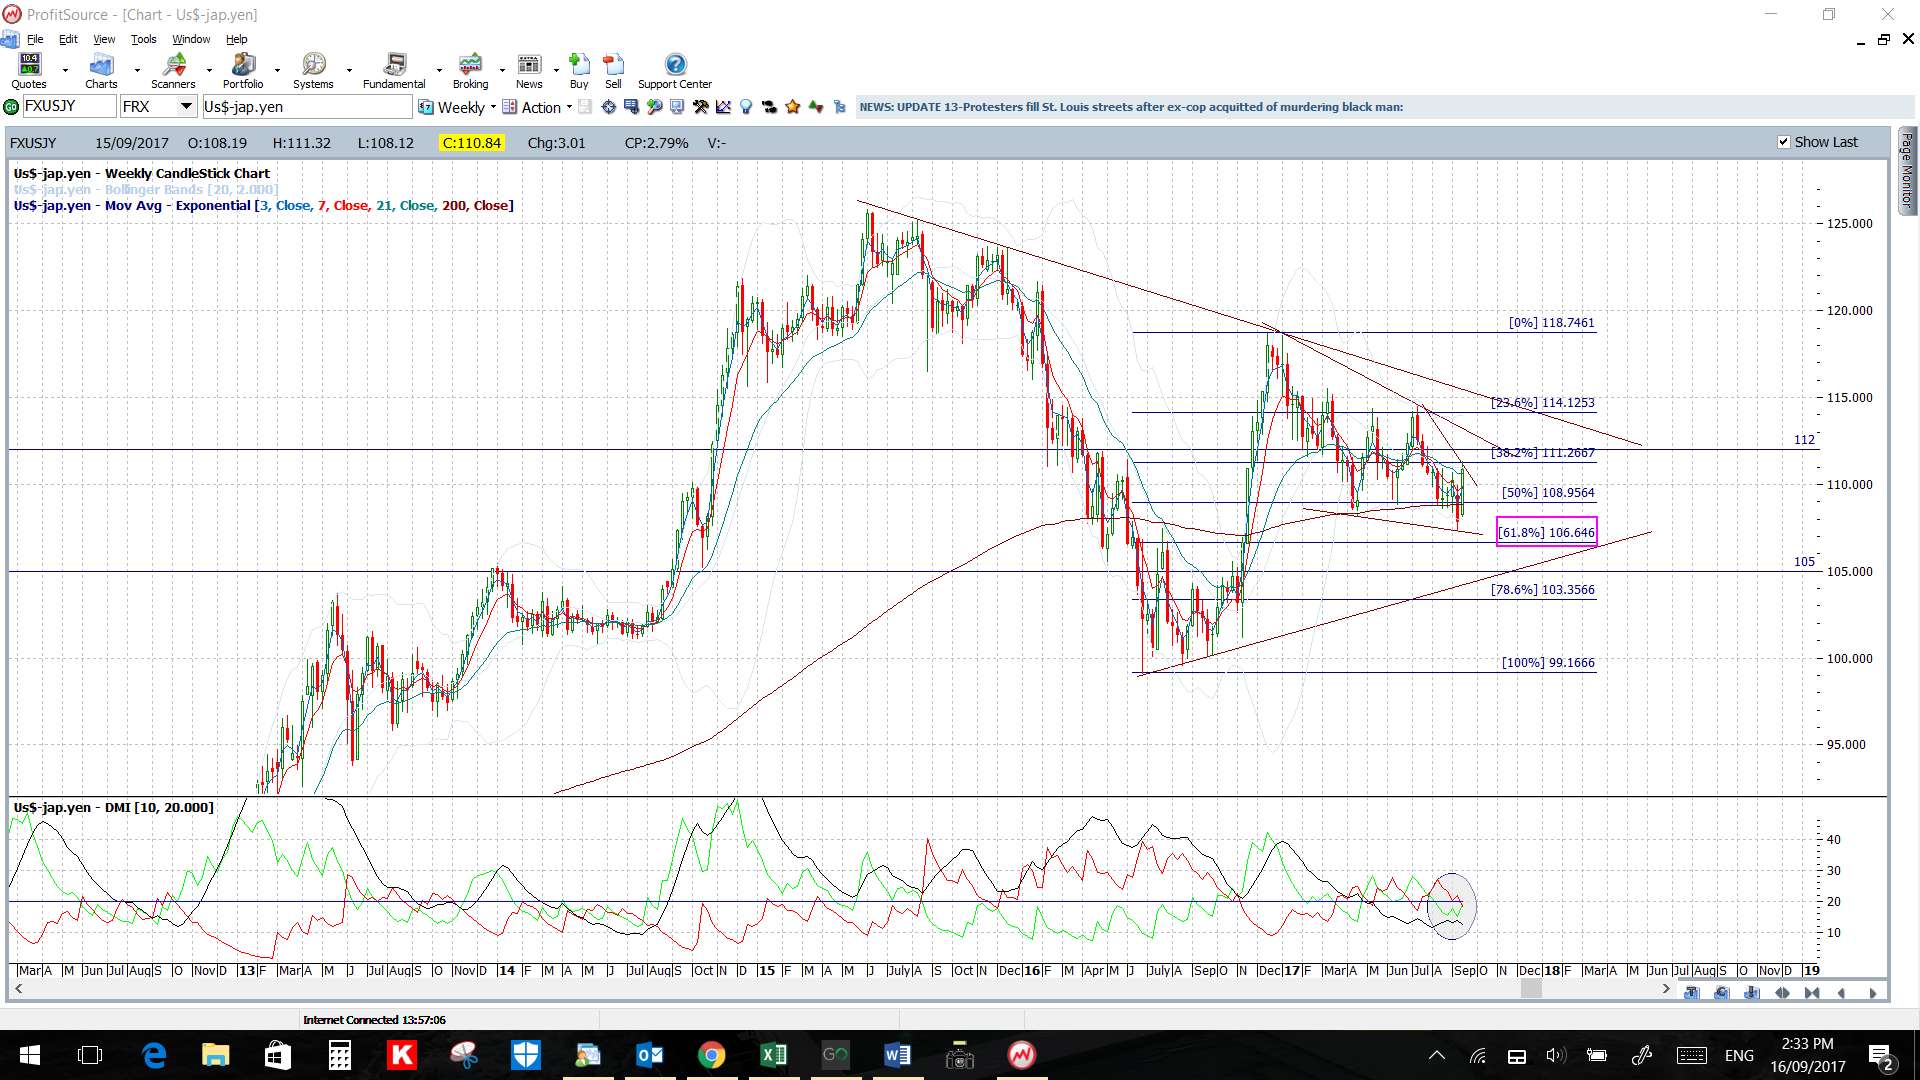
USD/JPY: The USD/JPY is trading within a 4hr chart descending channel and just under the 111 level but this channel is set within larger daily and weekly chart patterns.
There is the FOMC and BoJ rate updates to impact this pair this week.
Watch the 4hr chart’s channel trend lines for any new breakout move:
- Upper targets: any bullish breakout will bring the 112 S/R level followed by the weekly chart’s upper triangle trend line and then 114.50 level into focus.
- Lower targets: any bearish breakout will bring the weekly 200 EMA and 4hr chart’s channel support trend line into focus.
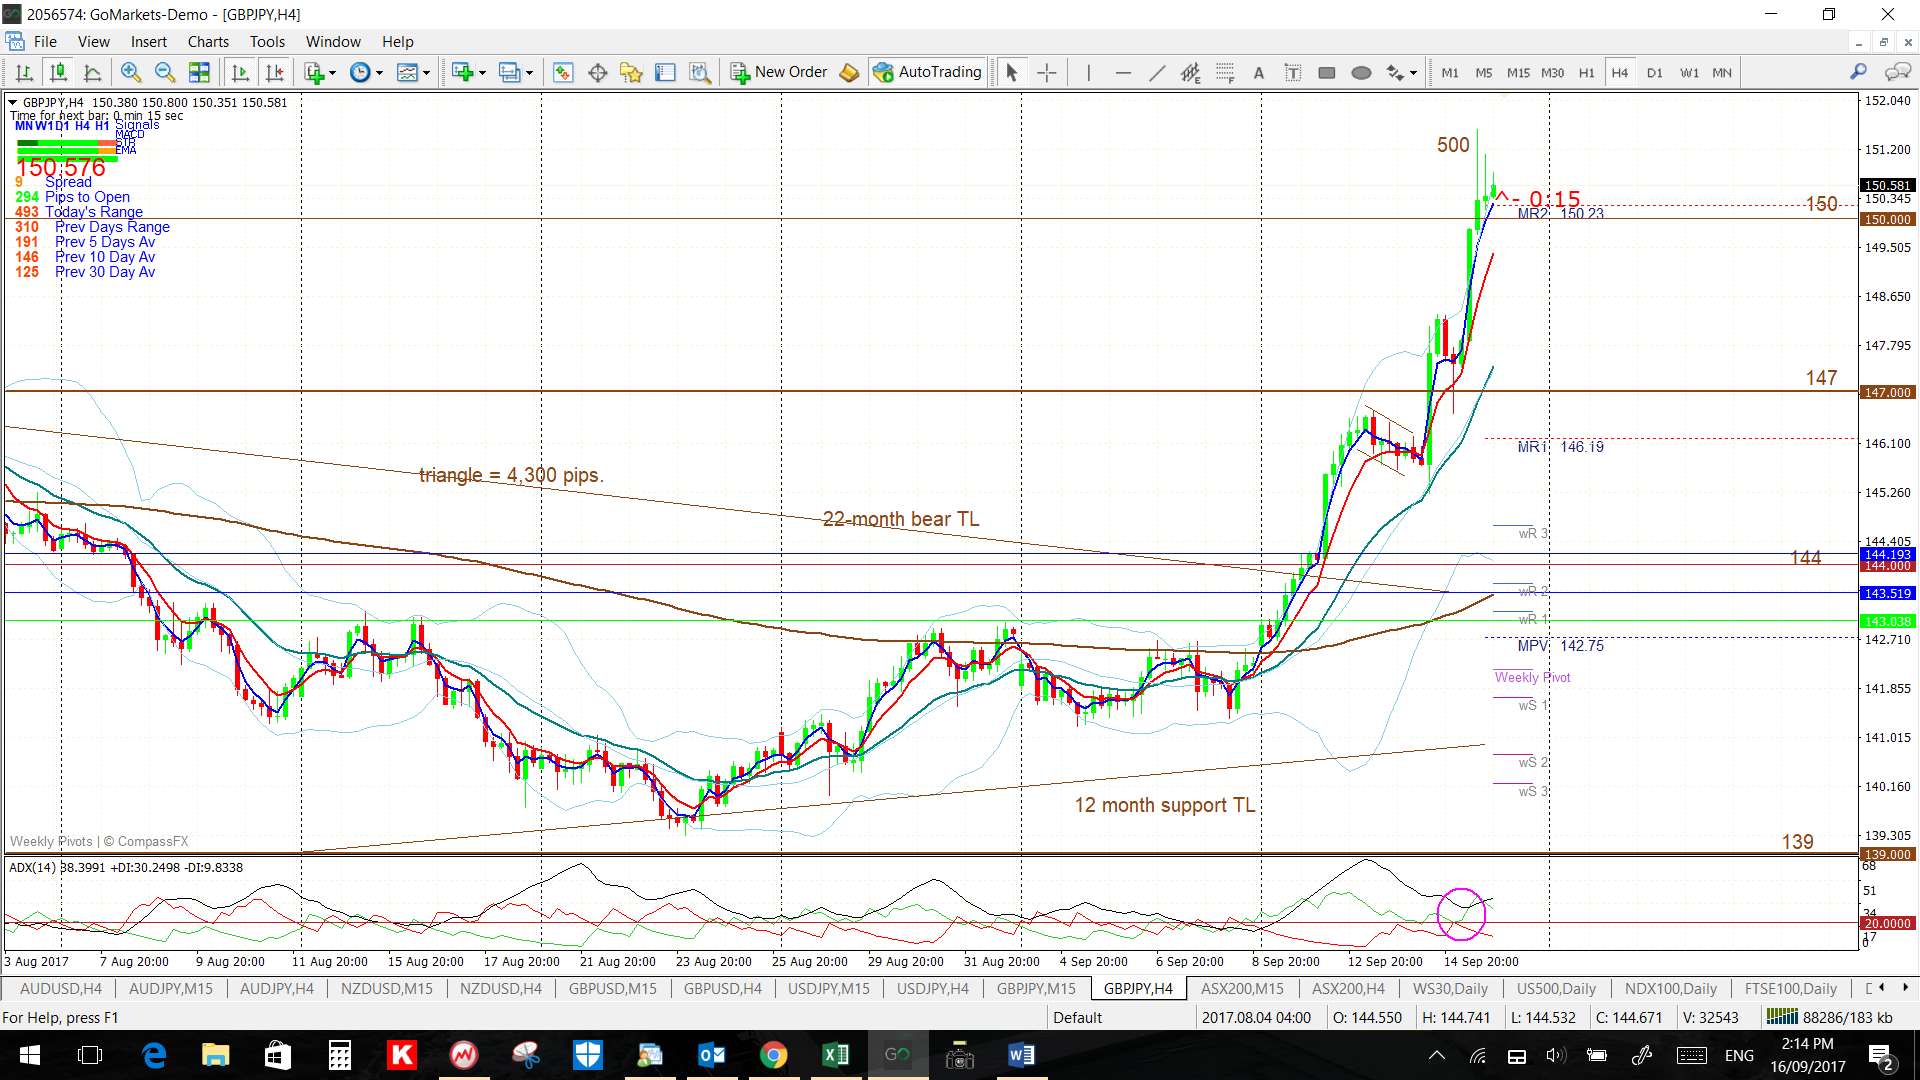
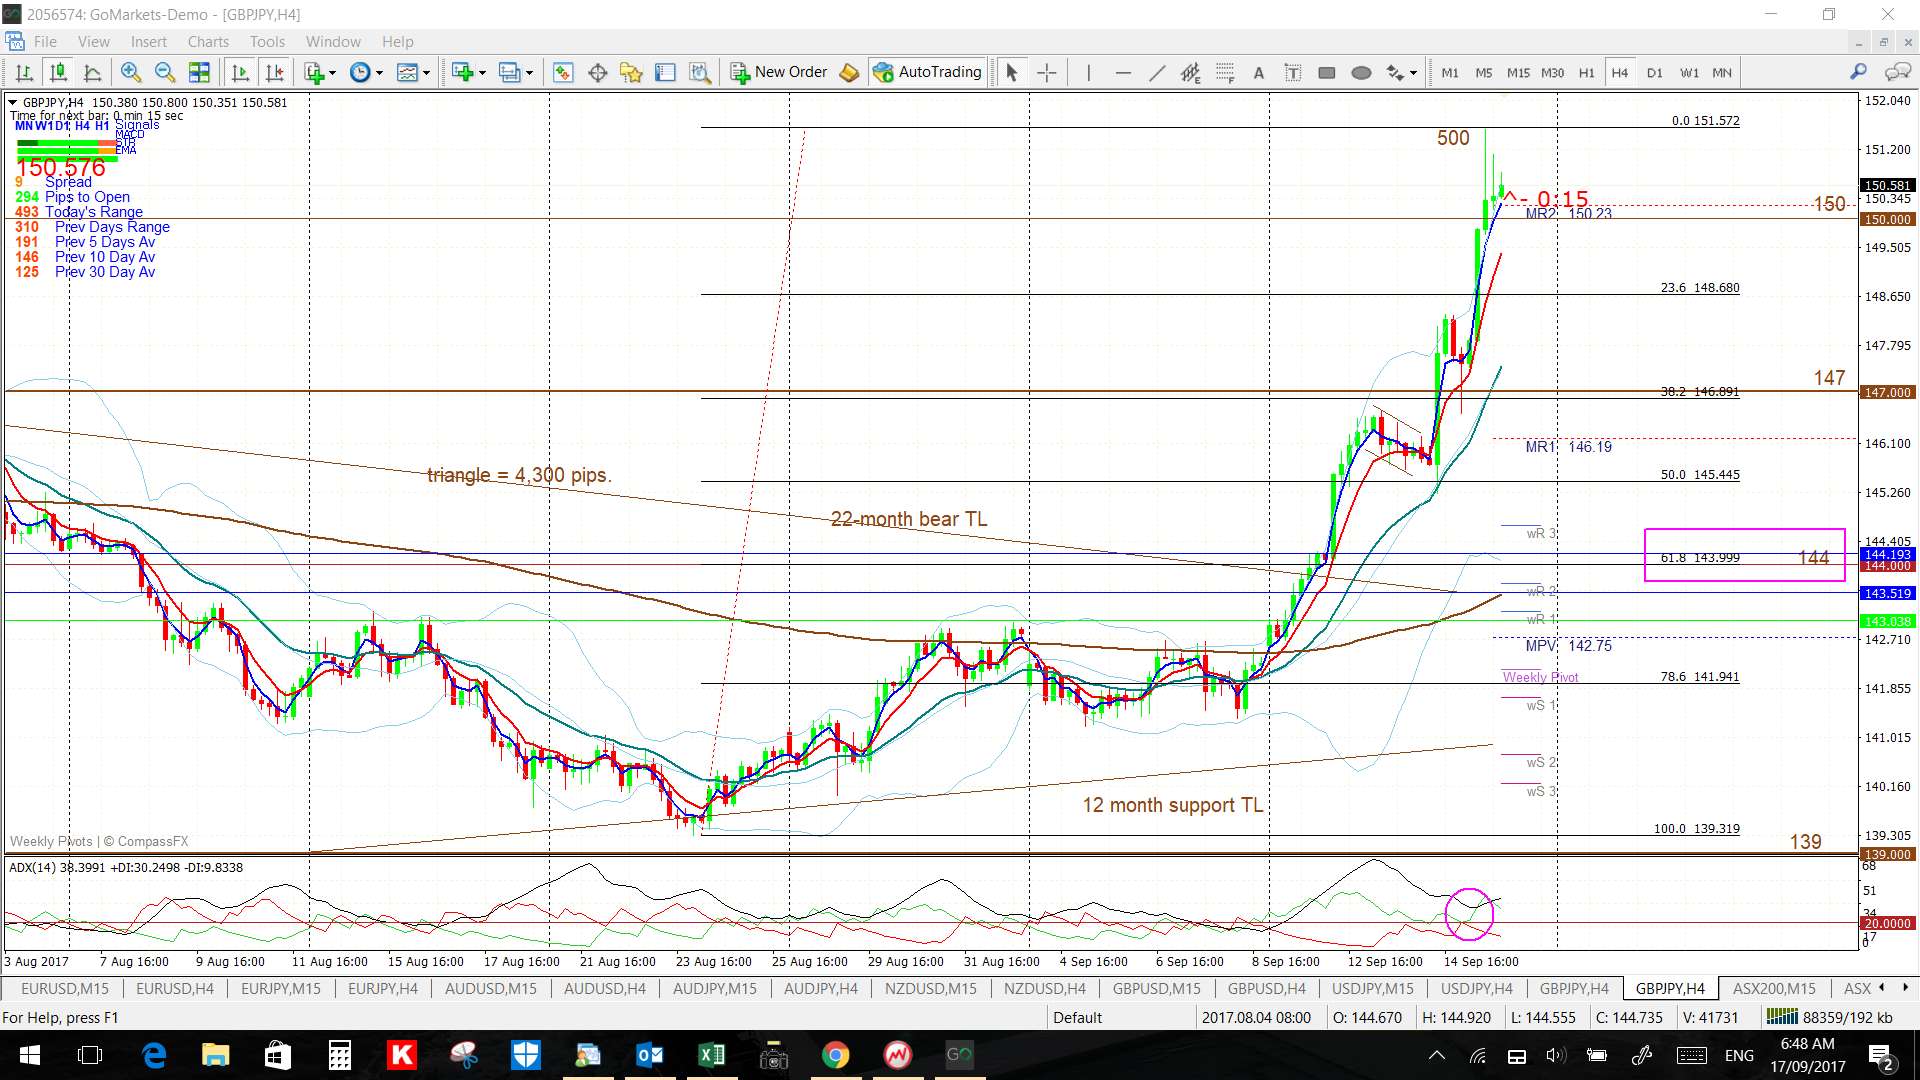
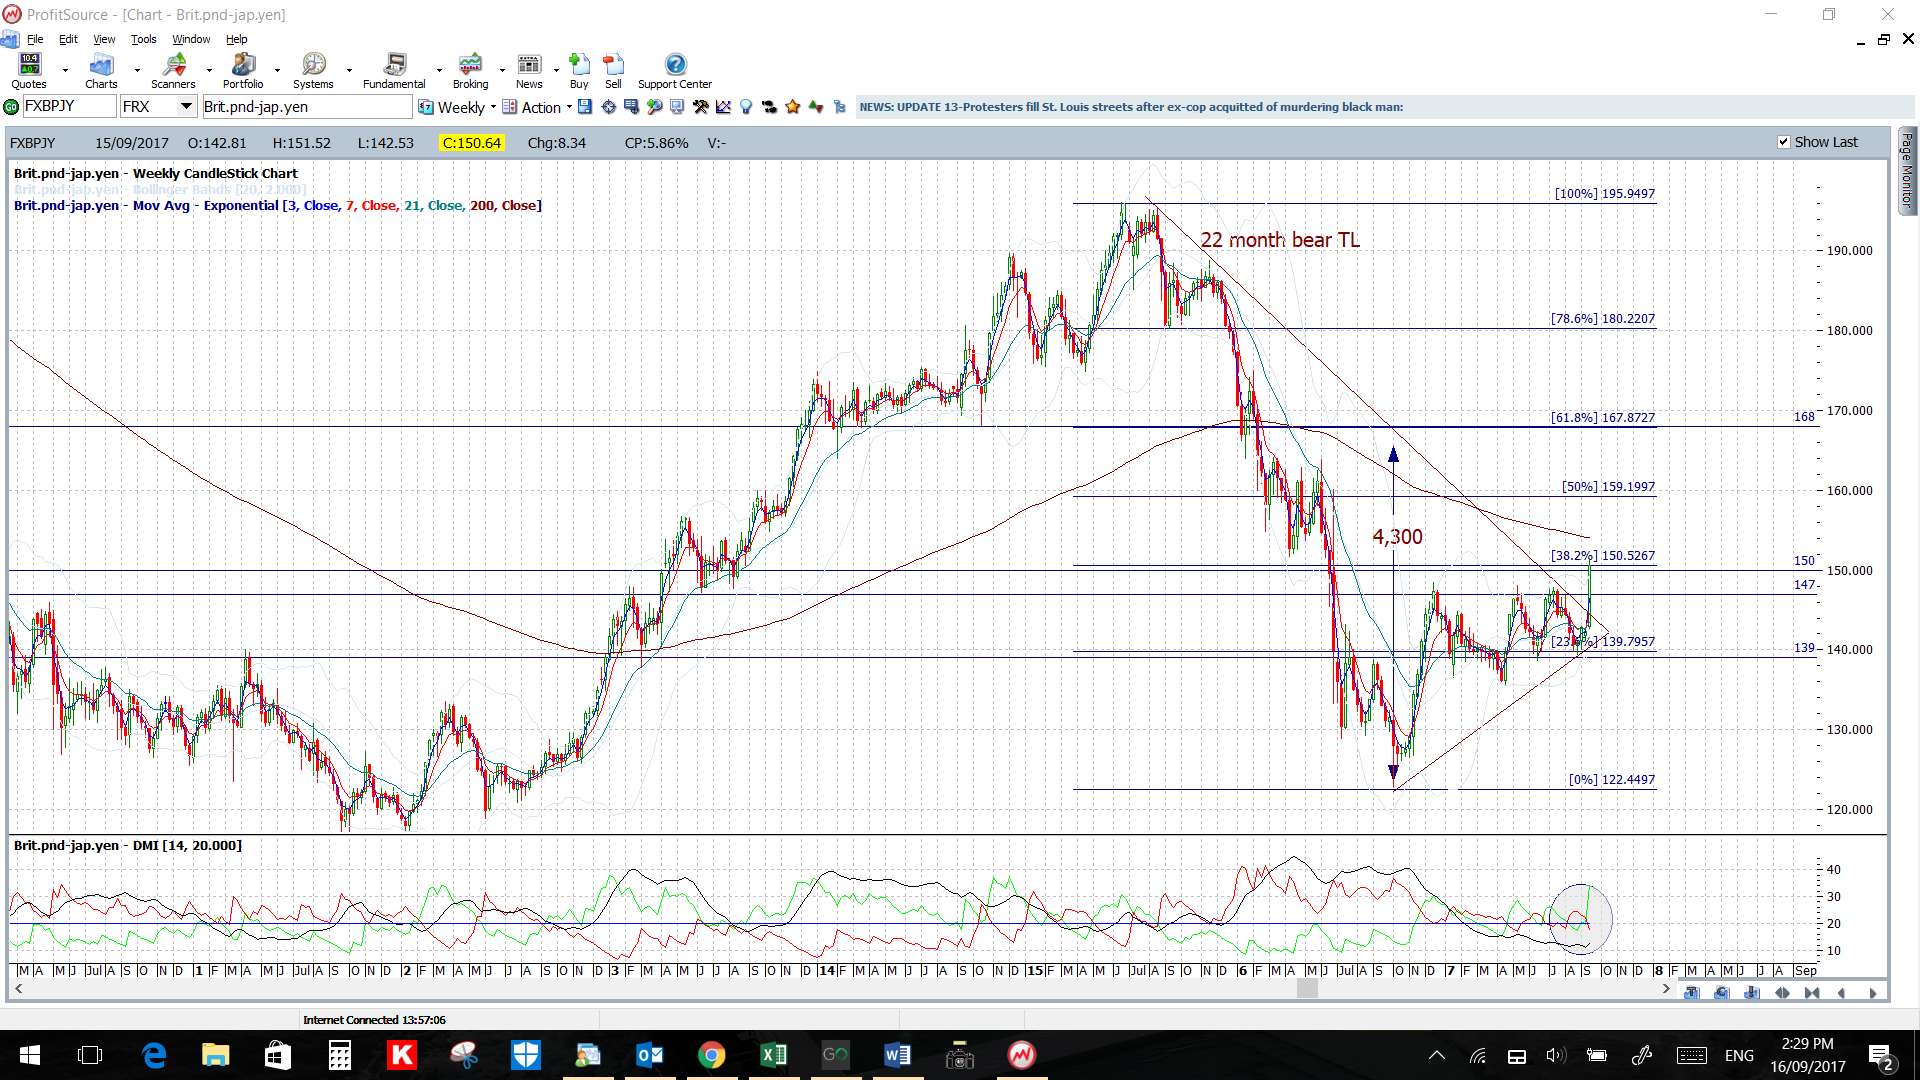
GBP/JPY: The GBP/JPY had a HUGE week breaking up through a 22-month bear trend line, the key 147 level and the key 150 S/R level as well!
The break of the monthly bear trend line suggests some decent mean reversion could be on the way with a triangle breakout that worth up to 4,300 pips. The 150 level is major S/R though, see this level on the monthly chart, so price action could be choppy around here or even pause/pullback a bit before any potential thrust higher.
Watch the 150 level for any new make or break especially with the BoJ rate update:
- Upper targets: any bullish continuation above 150 level would bring the 160 level into focus as this is the weekly chart’s 50% fib.
- Lower targets: any rejection of 150 would have me looking for a test of the 147, 144 and the 139 S/R levels. I note that the 4hr chart’s 61.8% fib is down near the 144 level.

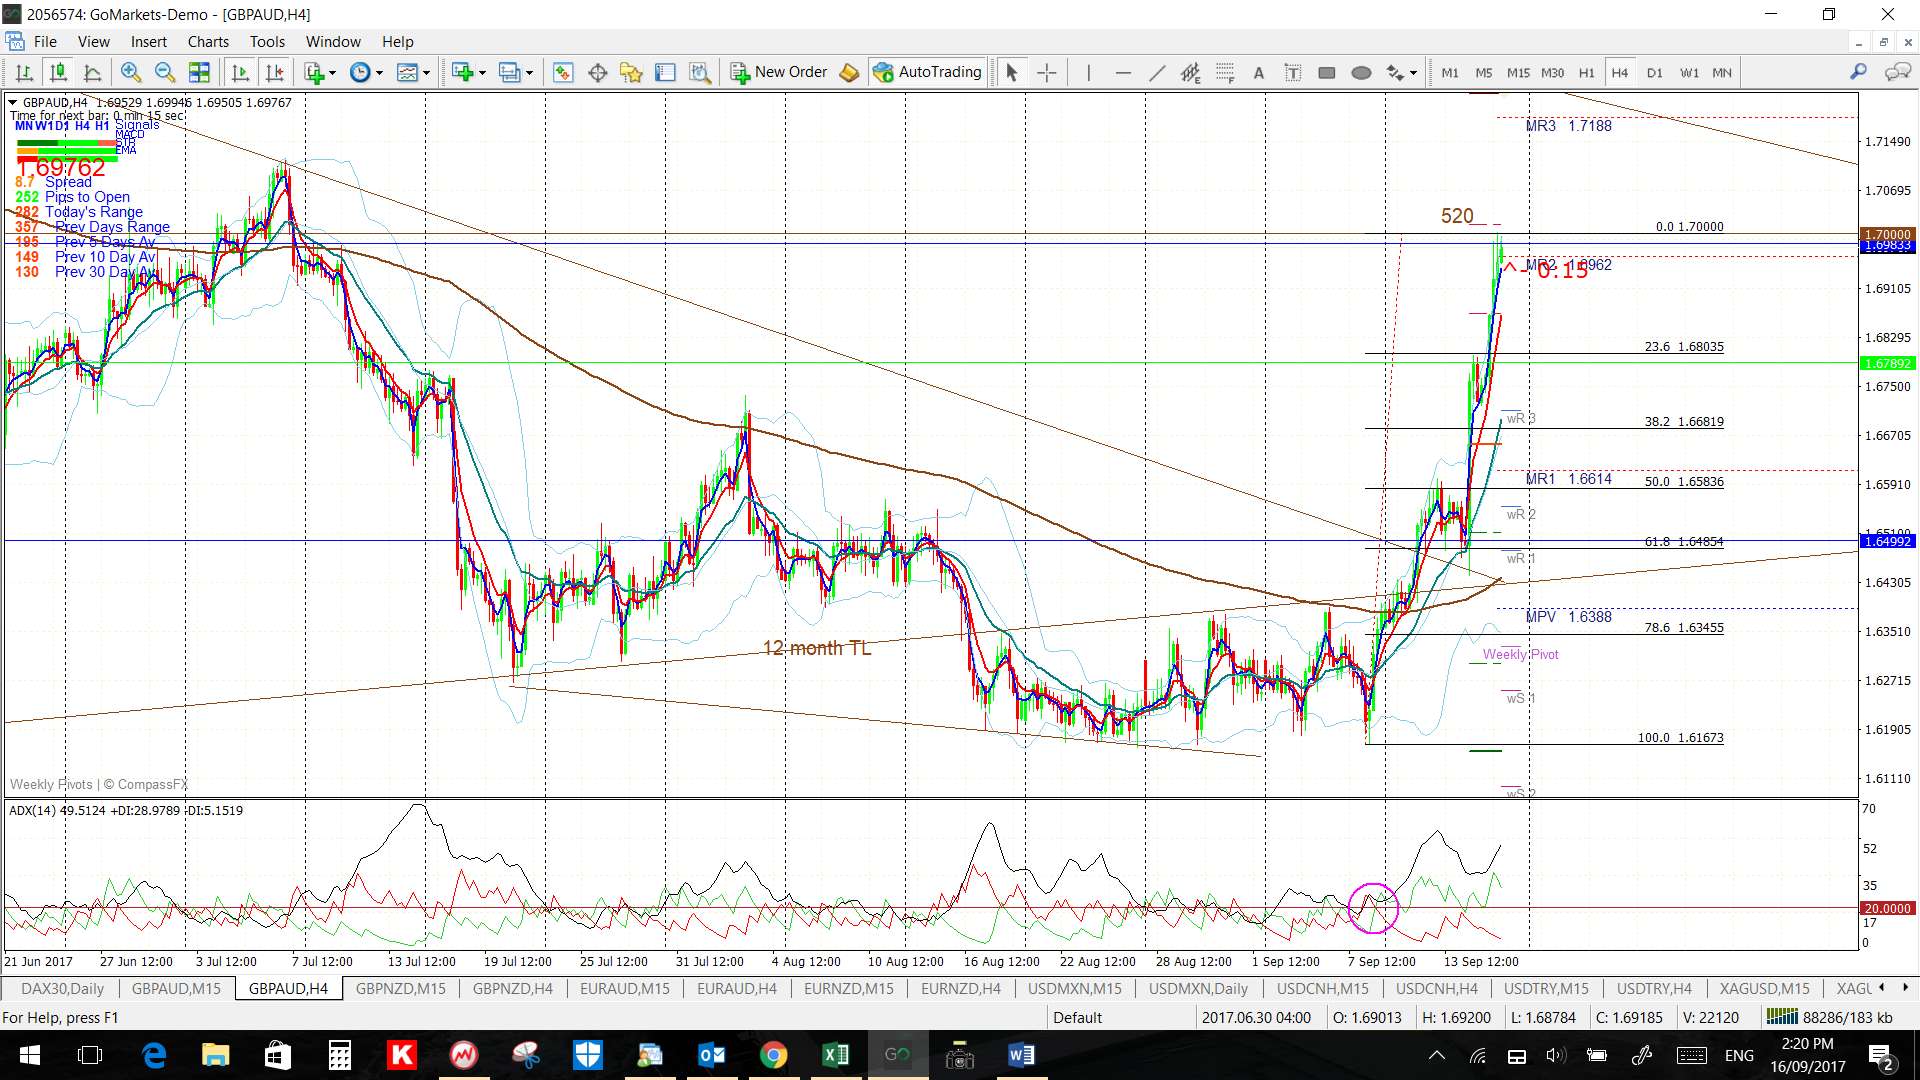
GBP/AUD: The GBP/AUD also had a HUGE run last week, following weeks of sideways action, and it broke up from a bullish descending wedge in a move that gave over 500 pips for the week. Some of this action was captured with TC signals and trend line breakout moves.
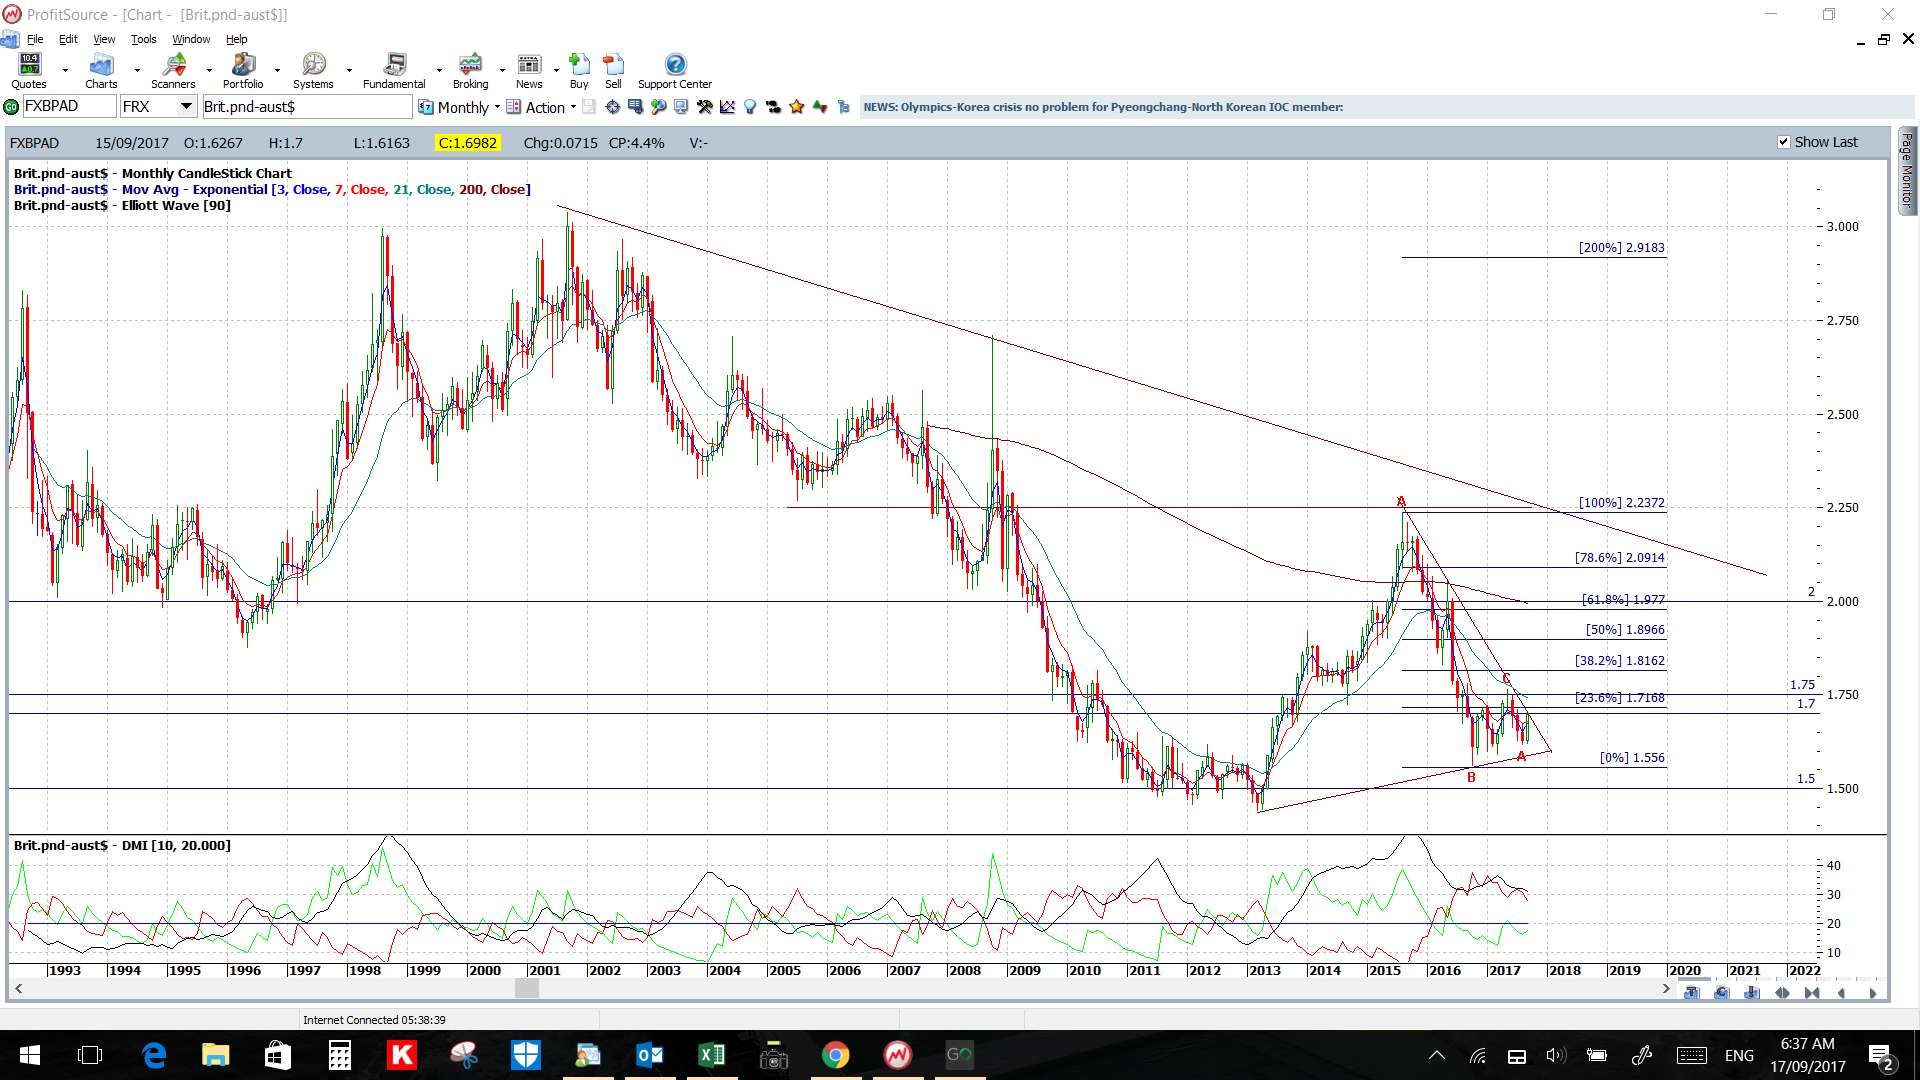
Price action made it up to the major 1.70 S/R level on Friday and this is the region to watch for any new make or break. There is a 26-month bear trend line just above the 1.70 level and, if this breaks, I would be looking towards the 61.8% fib of the most recent swing high as this up near the ‘whole-number’ 2.0 level which is significant S/R in its own right (see monthly chart).
Watch the 1.70 for any new make or break:
- Upper targets: The 26-month bear trend line and, then, the 1.75 and 1.80 levels followed by the weekly chart’s 61.8% fib, near 2.0 S/R.
- Lower targets: any pullback will have me looking to the 4hr chart’s 61.8% fib, near 1.65 and the 12 month support trend line.

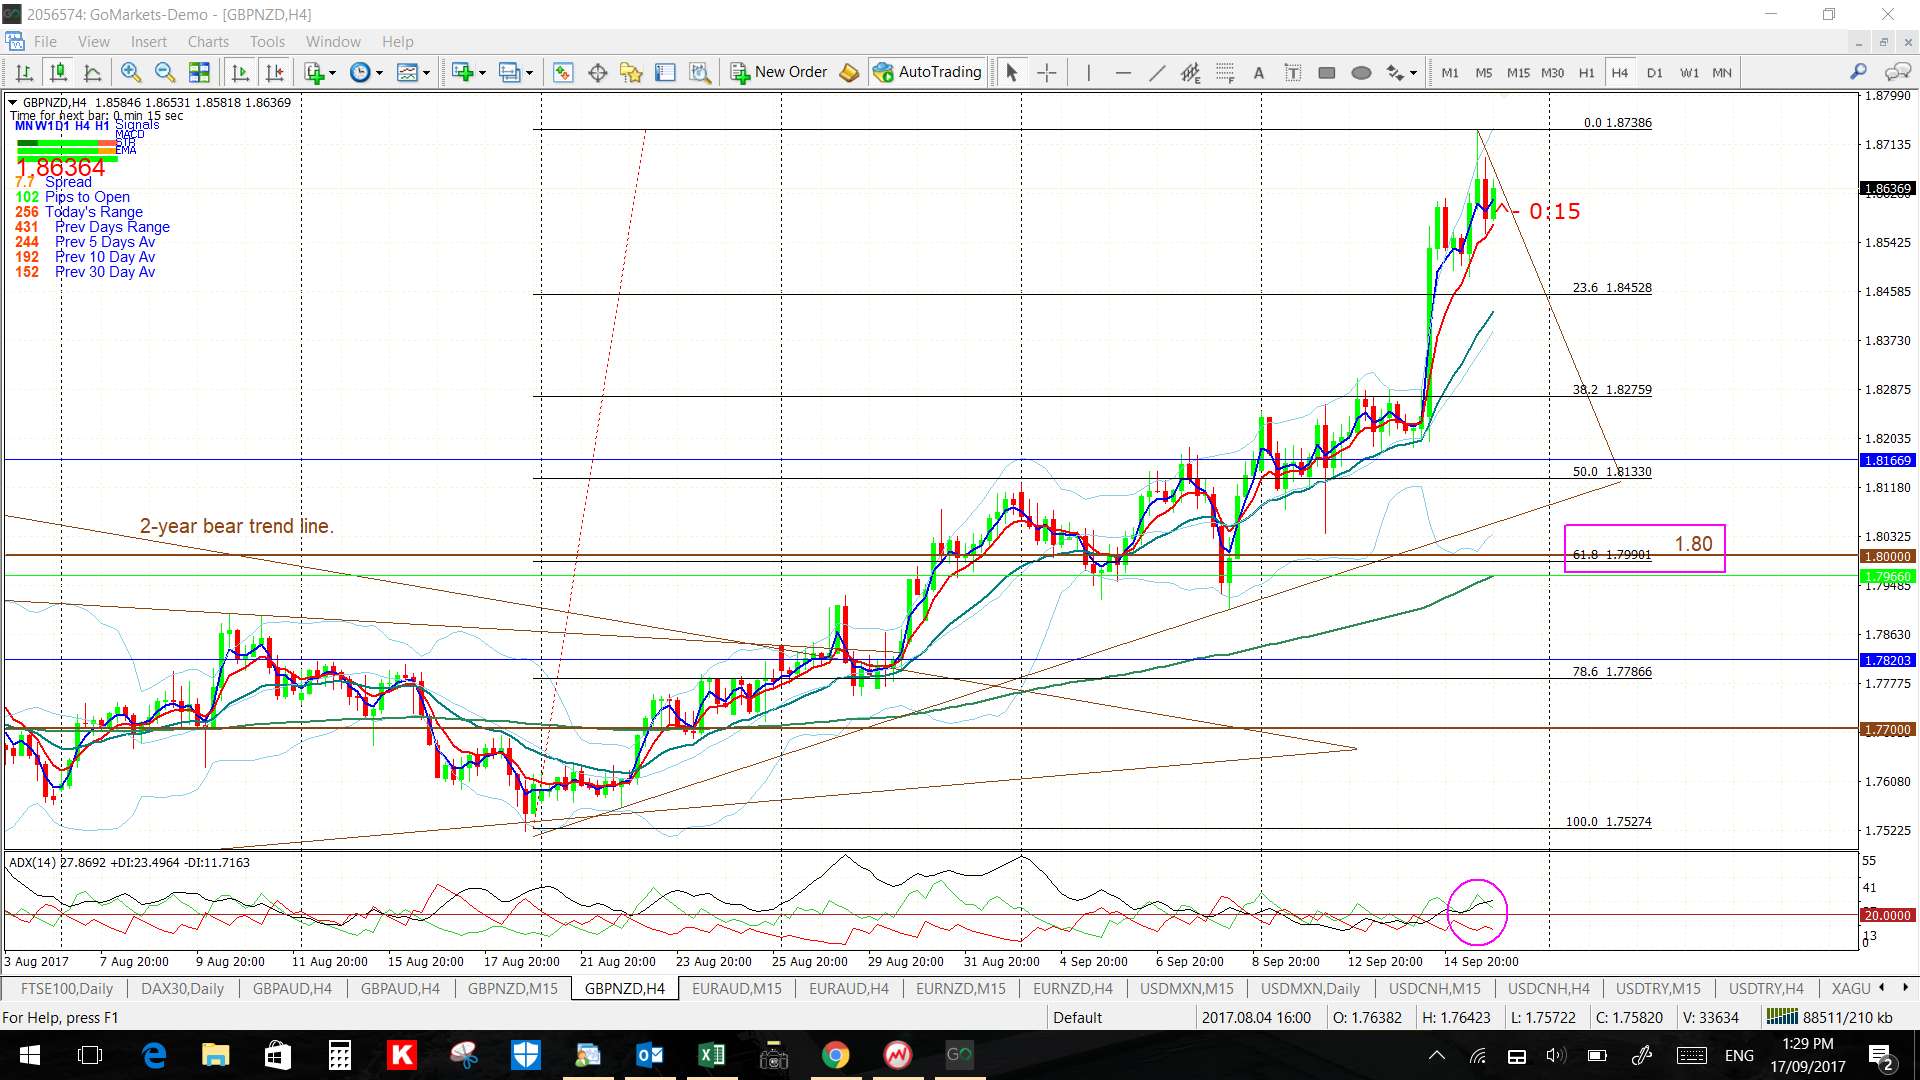
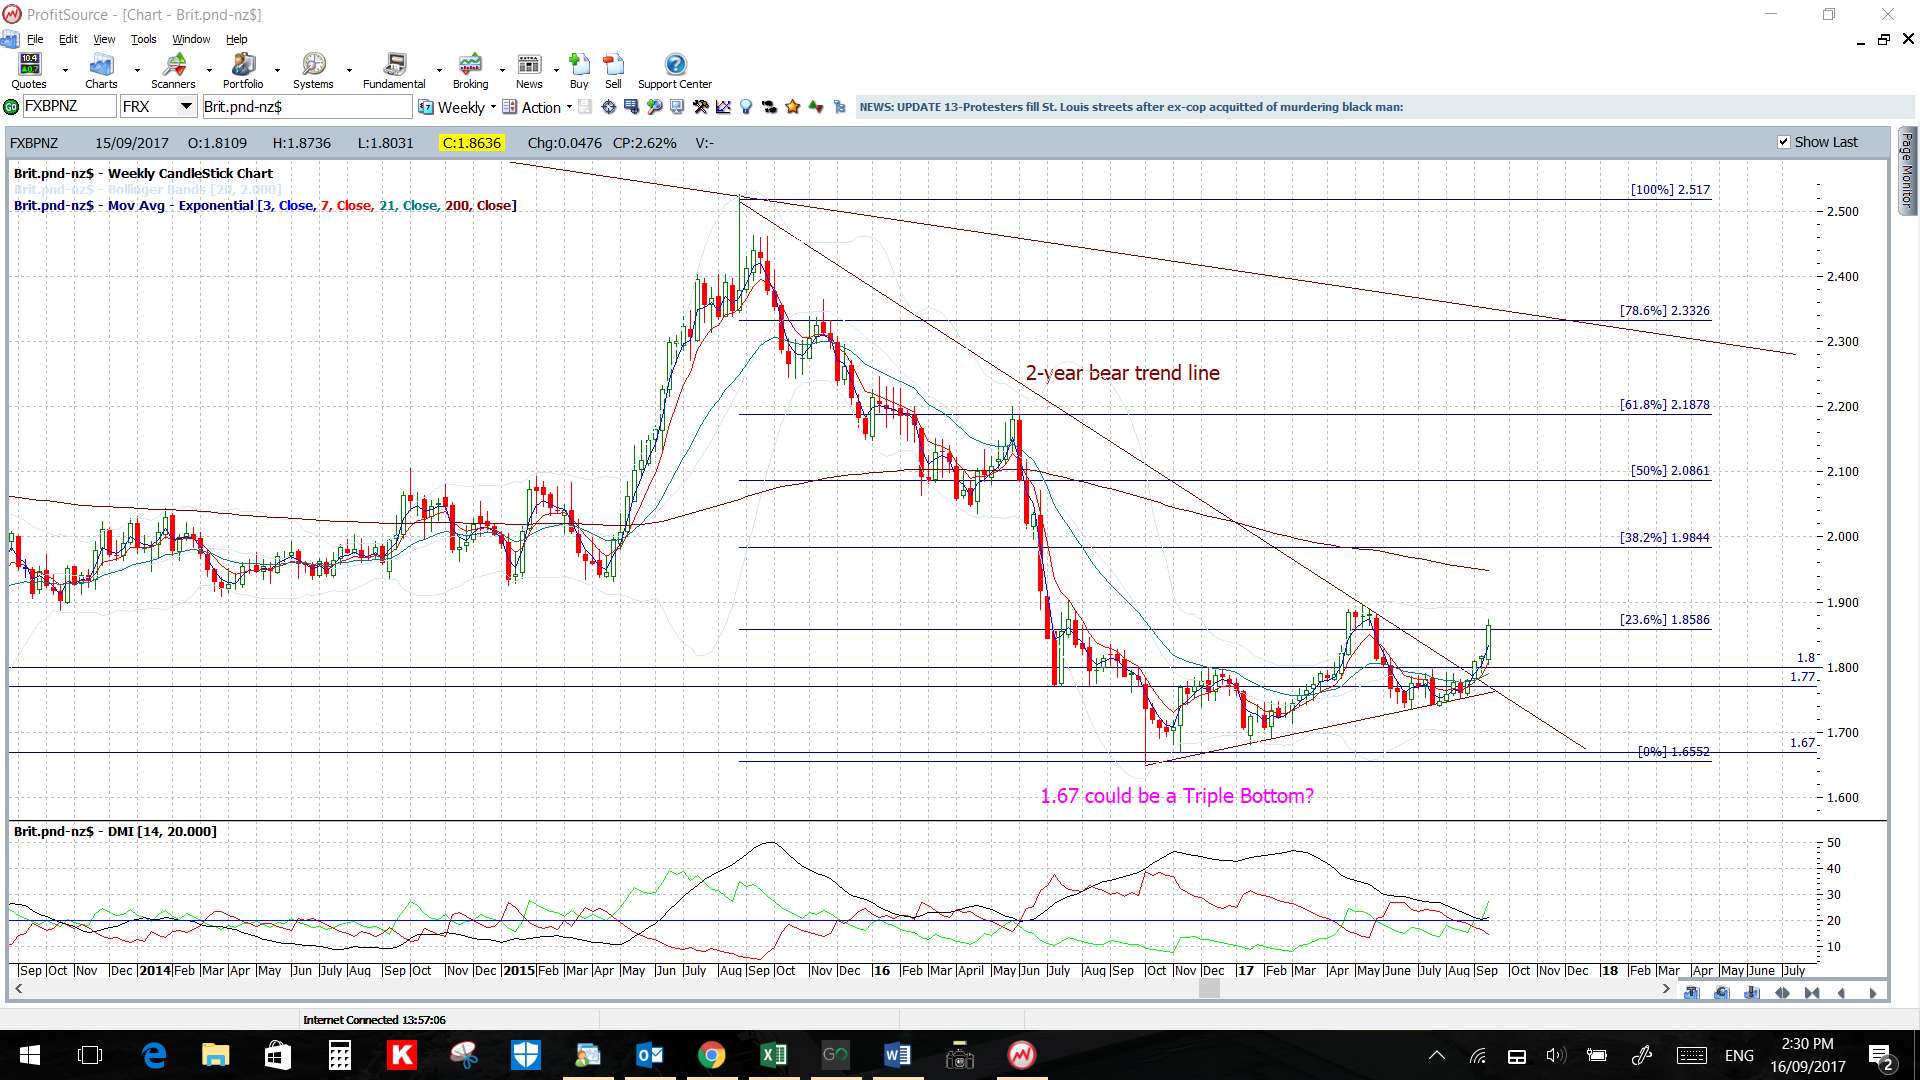
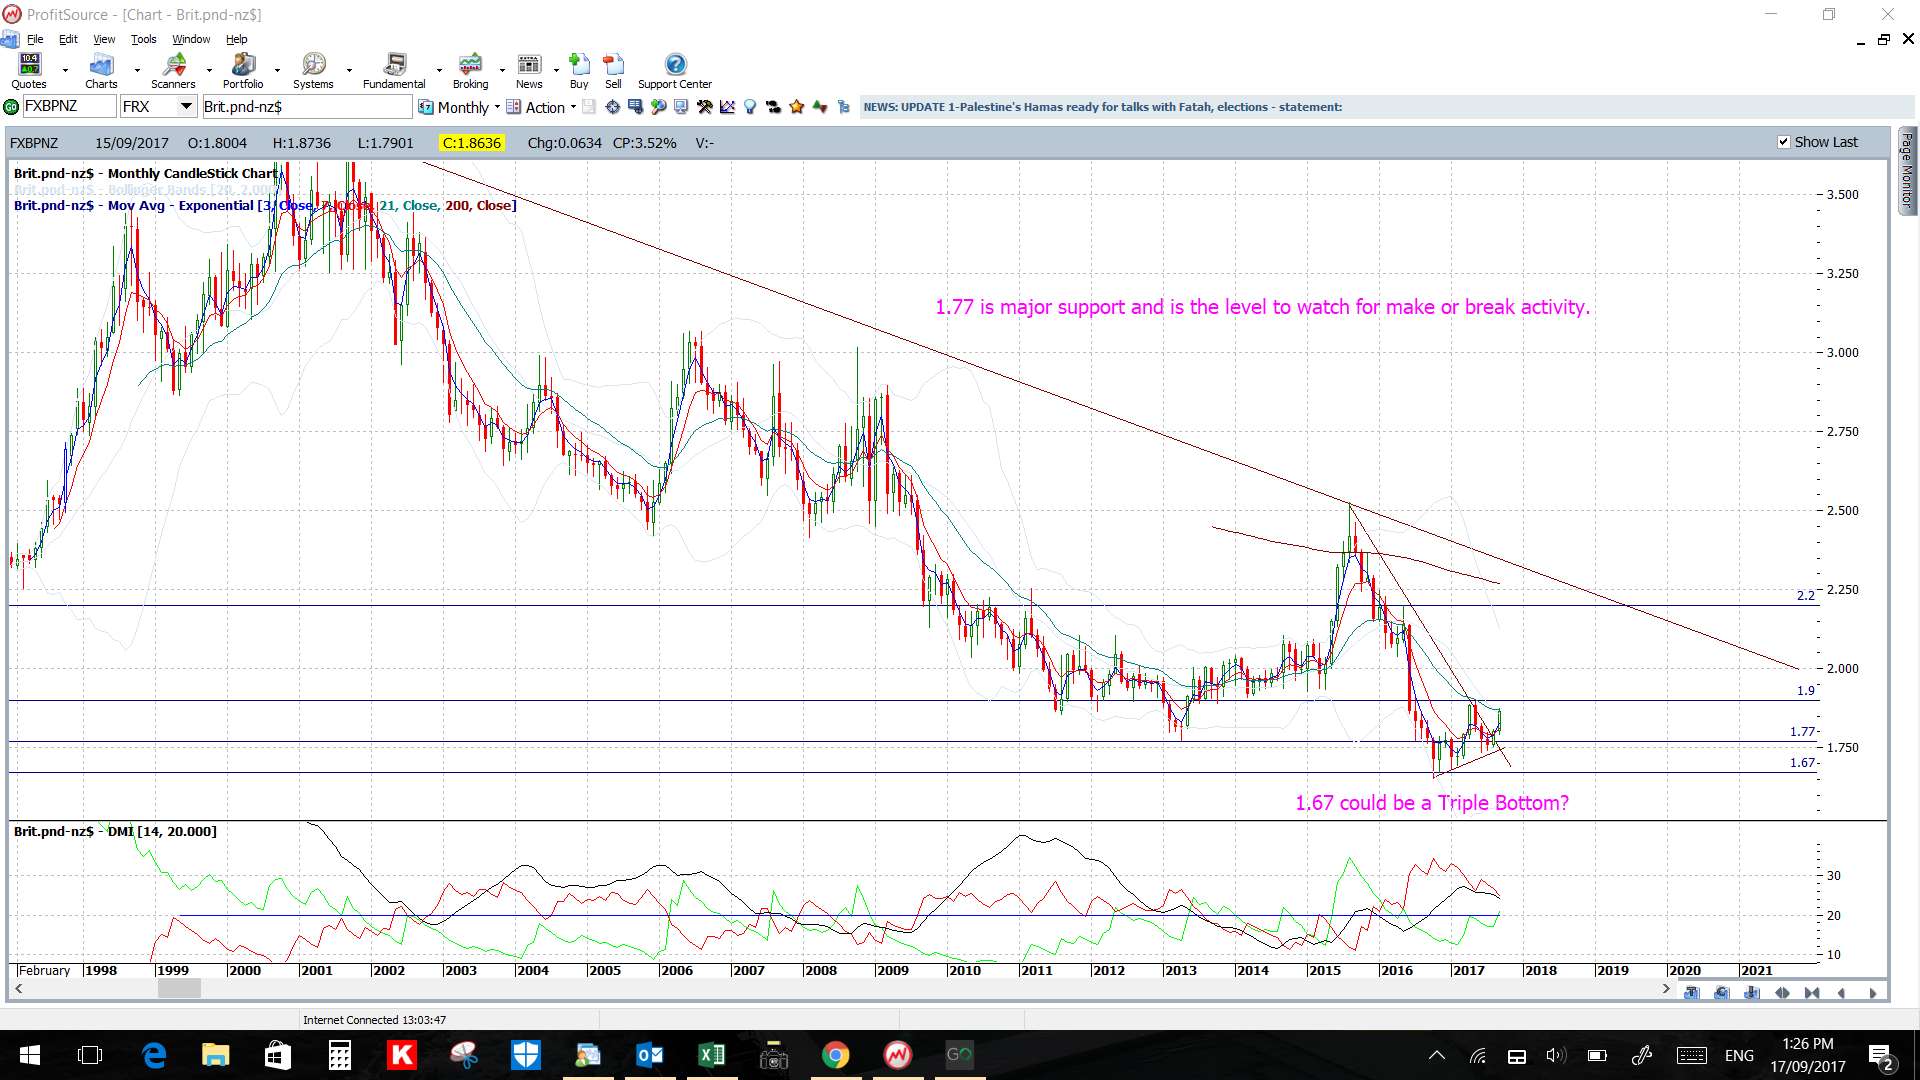
GBP/NZD: The GBP/NZD continues to be bullish after breaking up and out from a monthly triangle some weeks ago and it looks like it might head to test the 1.90 level. The 1.90 level is major S/R, as seen on the monthly chart, so price might become choppy as it negotiates this next major level.
Watch the 4hr chart’s revised triangle trend lines for any new breakout:
- Upper targets: Whole number levels, such as 1.90, on the way to the weekly chart’s 61.8% Fib near 2.20 S/R.
- Lower targets: A test of the 1.80 S/R level.as this ties in with the 4hr chart’s 61.8% fib of the recent swing high move.
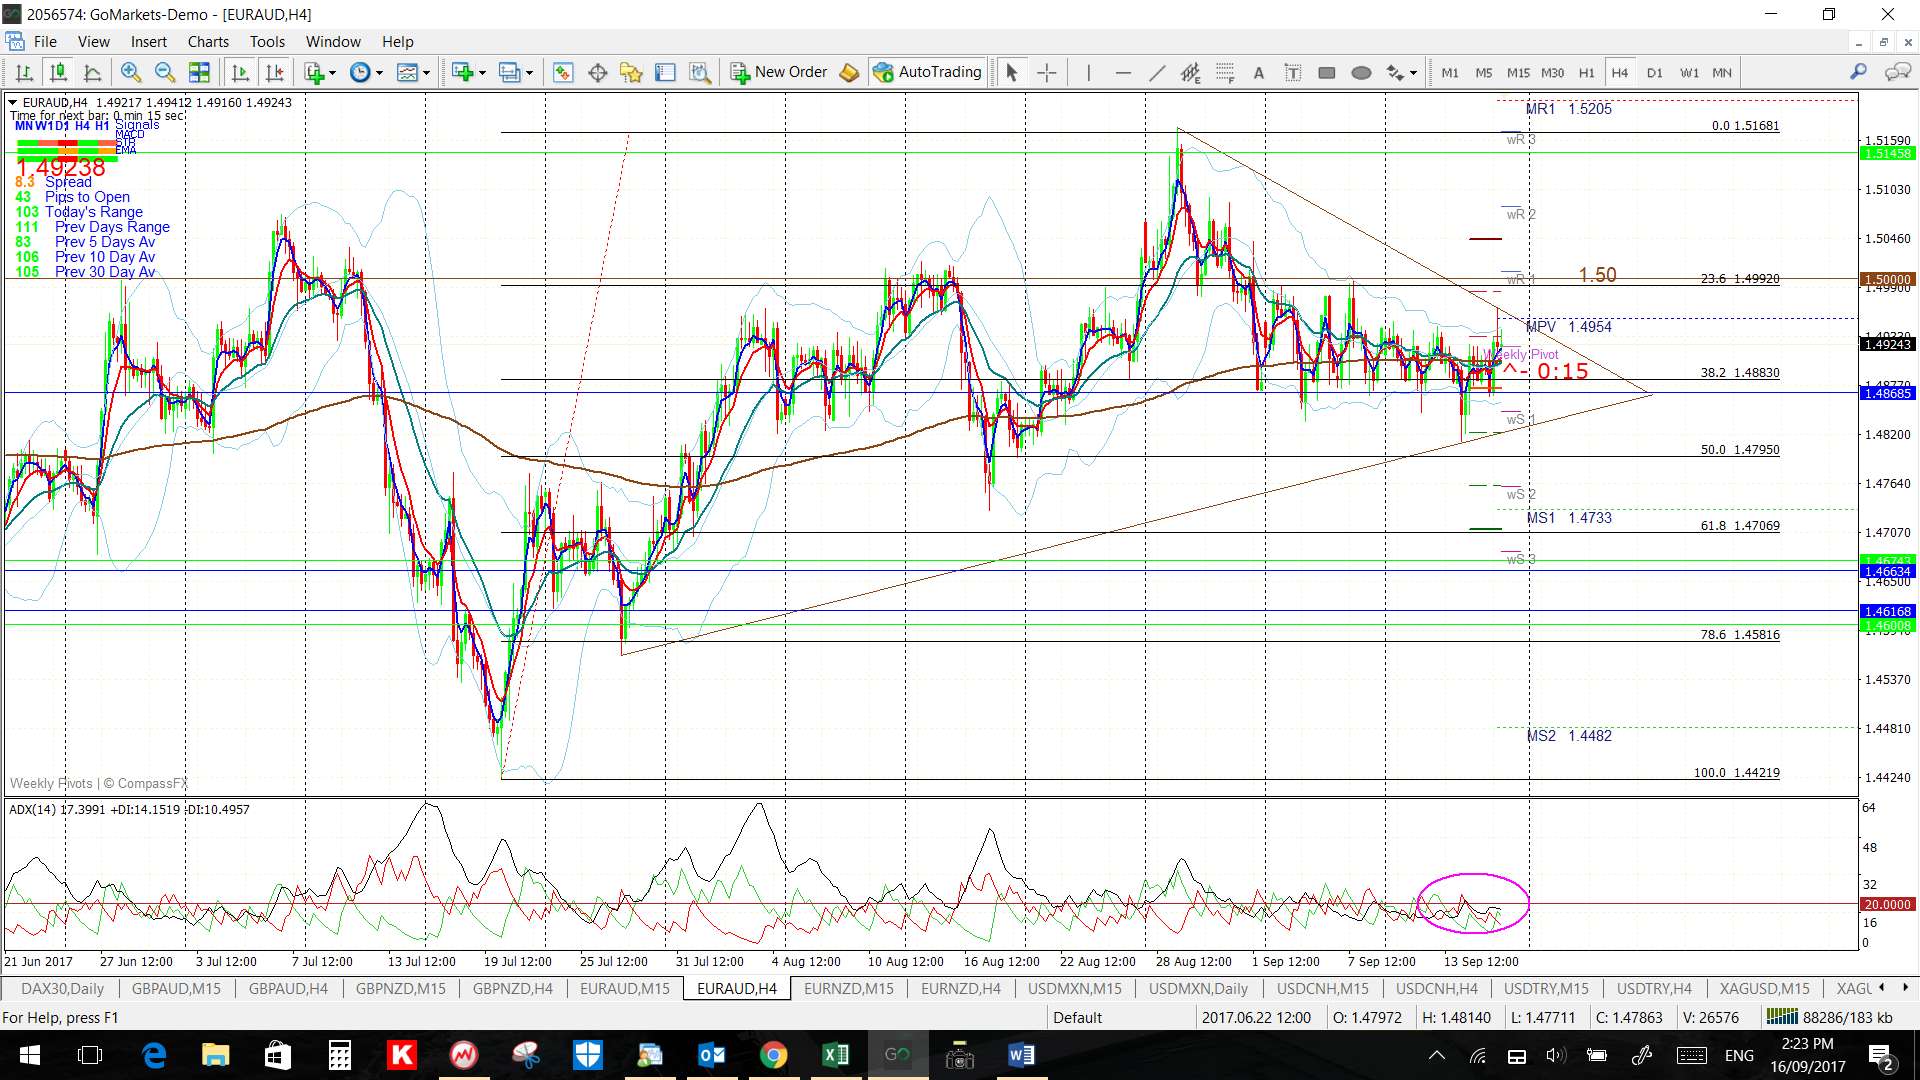
EUR/AUD: This pair continues to chop around in a triangle under the key 1.50 level. Price action has been going sideways for about the last two weeks.
Watch the 4hr chart’s triangle trend lines for any new breakout:
- Upper targets: any bullish breakout above 1.50 would bring the 9-year bear trend line and, then, the previous S/R level of 1.55 into focus.
- Lower targets: any bearish breakdown would bring the 4hr chart’s 61.8% fib, near 1.47, followed by the 1.40 S/R level into focus.

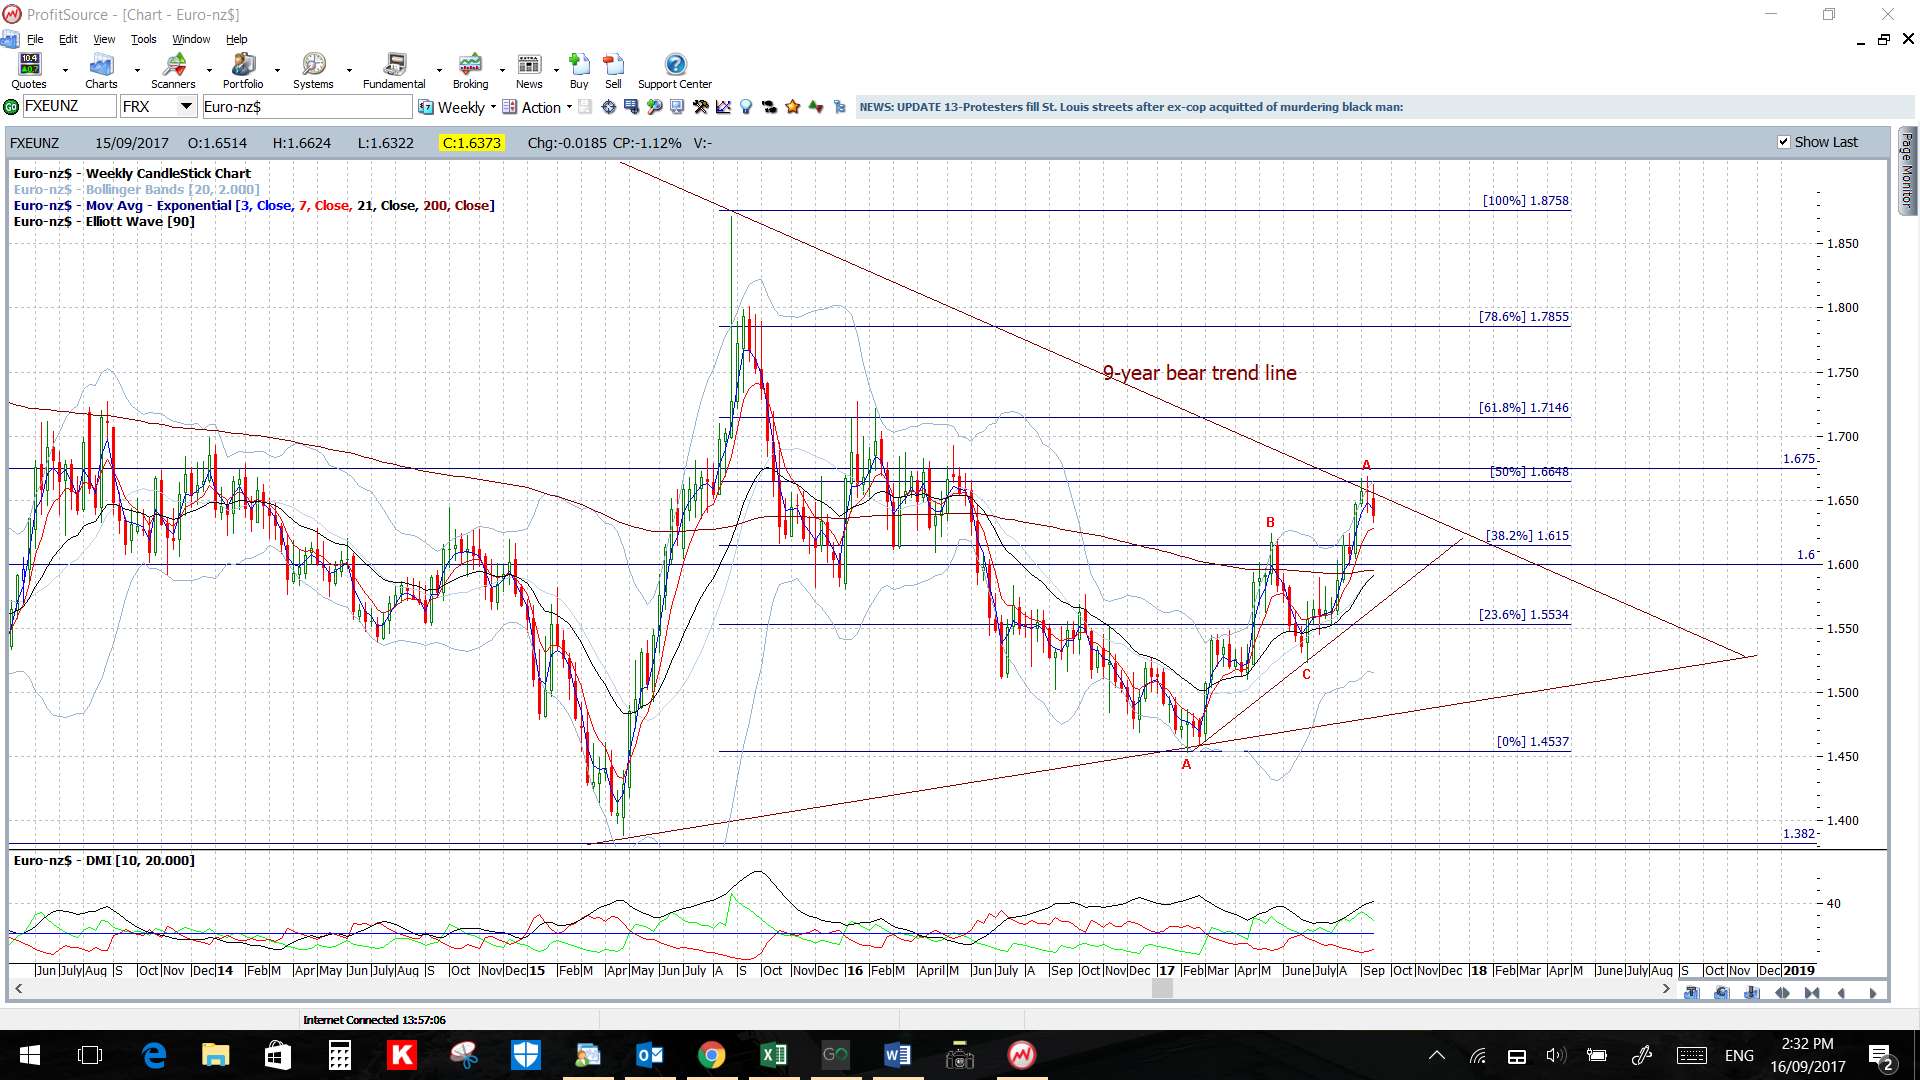
EUR/NZD: The EUR/NZD has spent another week consolidating below the 9-year bear trend line and 1.675 major S/R level.
Watch the 4hr chart’s Flag trend lines for any new breakout move:
- Upper targets: any breakout will bring the weekly chart’s 61.8% fib, near 1.7, into focus.
- Lower targets: any retreat will bring 1.60 S/R into focus.

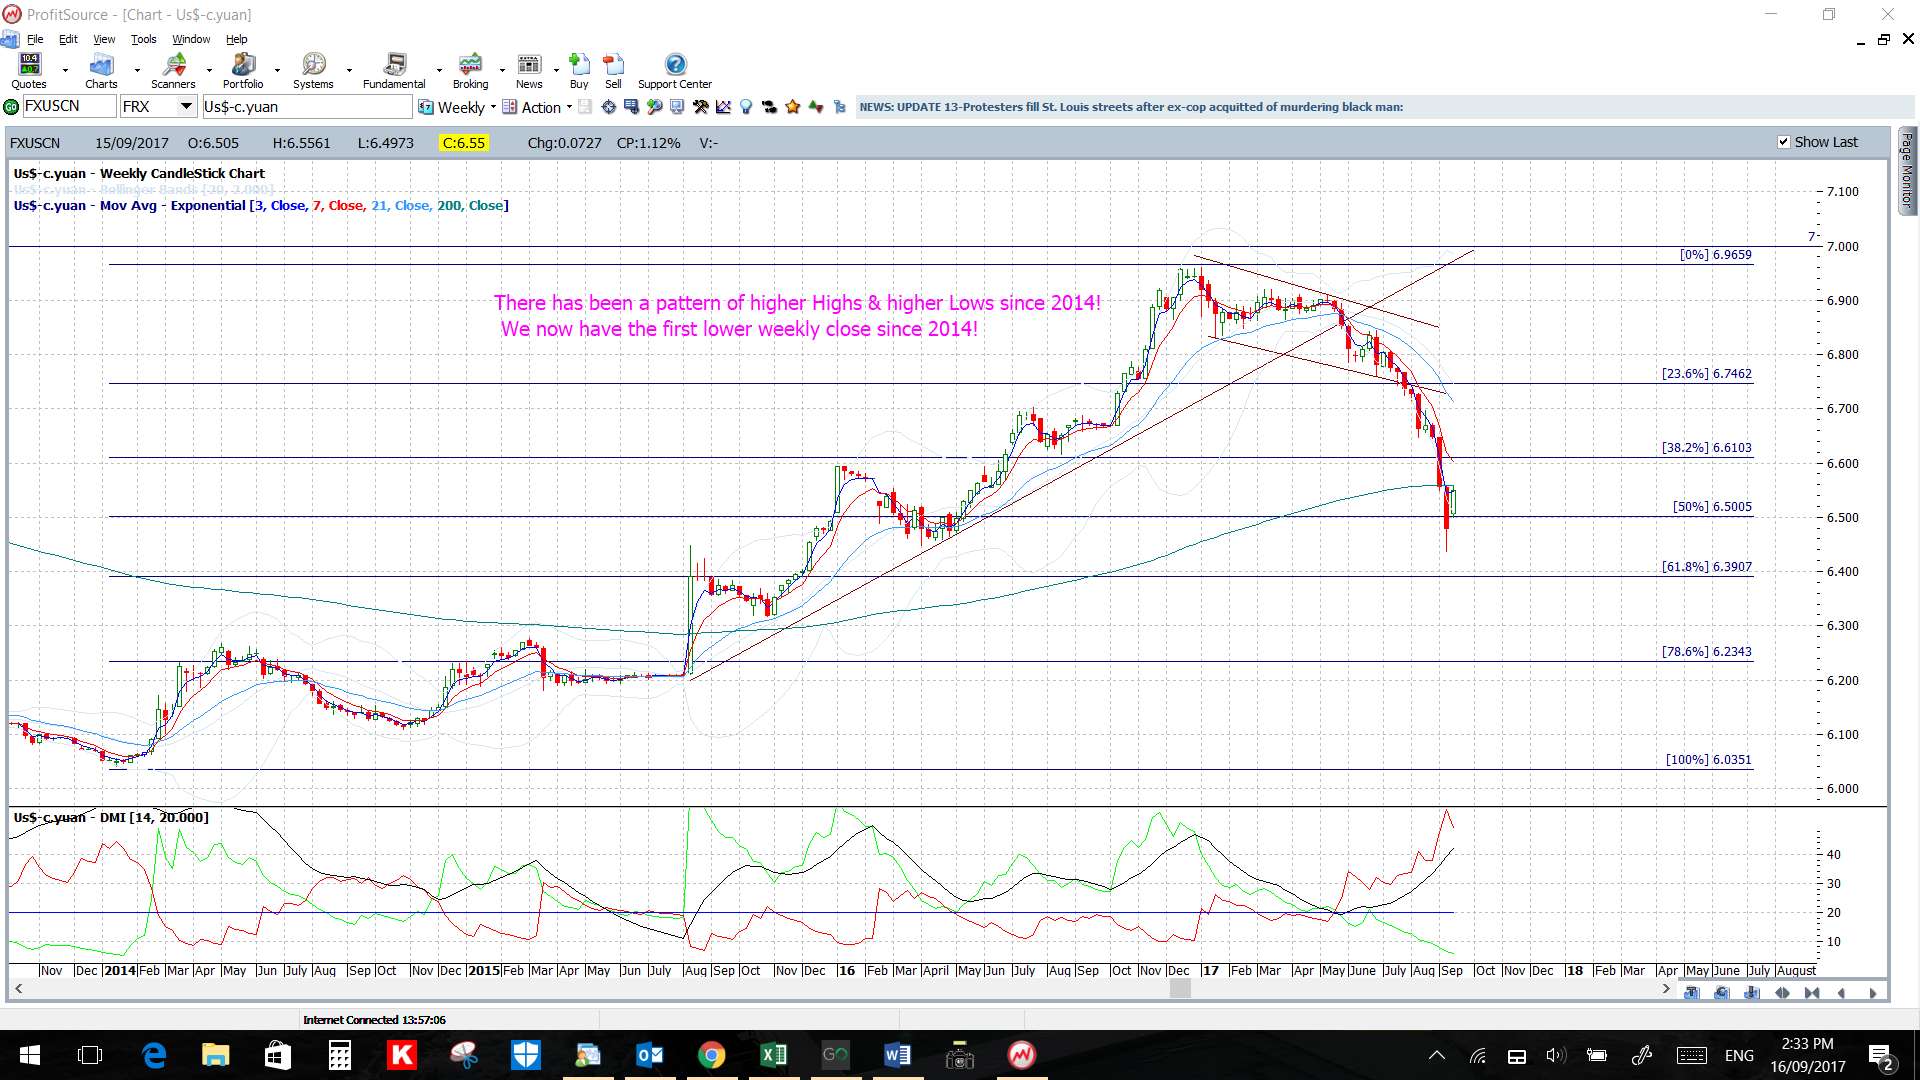
USD/CNH: This pair looks to have bounced up from the weekly chart’s 50% fib level but note the indecision style ‘Inside’ candle.
Watch the revised 4hr chart triangle for any new breakout move:
- Upper targets: watch for any bullish triangle breakout to target the 4hr chart’s 61.8% fib, near 6.70.
- Lower targets: any bearish breakdown would have me looking for a test of the recent low, near 6.45, followed by the weekly chart’s 61.8% fib; near the previous S/R level of 6.40.

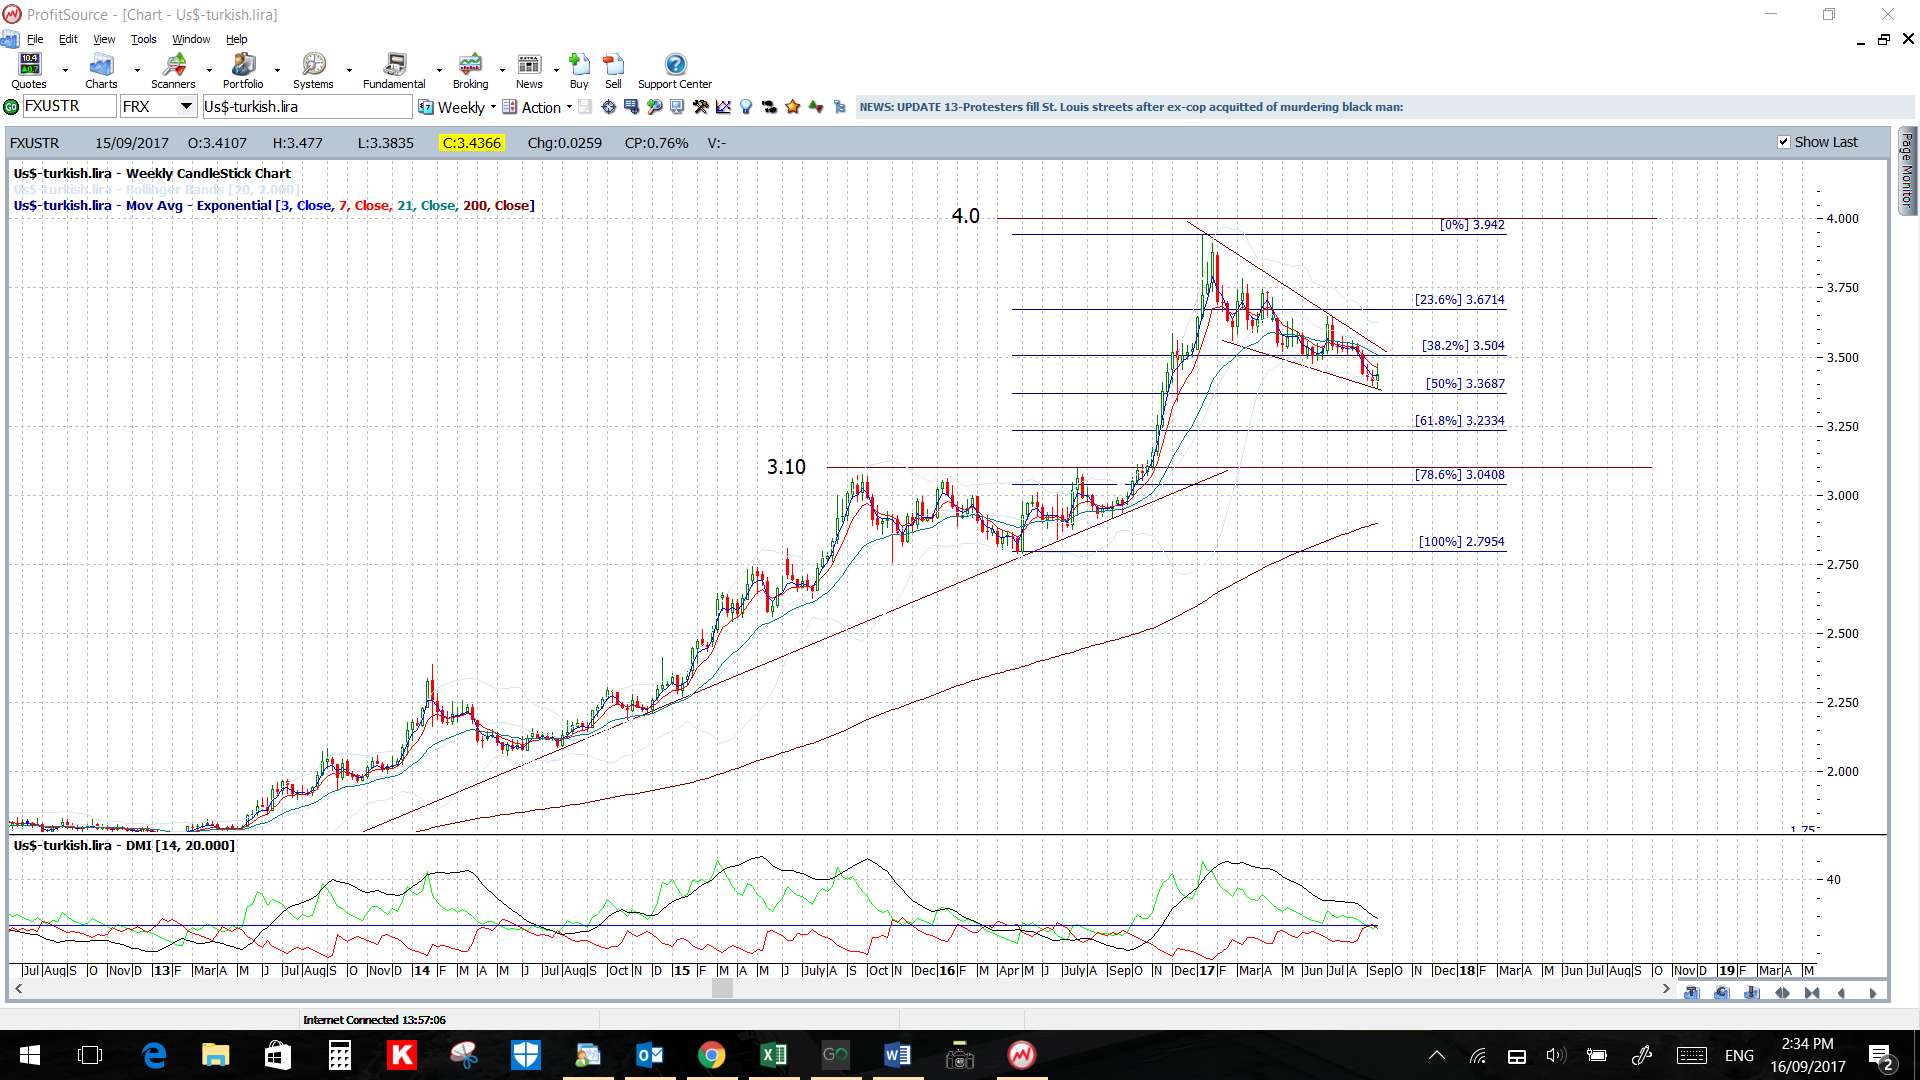
USD/TRY: This pair is holding within a weekly channel pattern and above the weekly chart’s 50% fib.
Watch the 4hr chart’s triangle for any new breakout move:
- Upper targets: any bullish breakout will bring the weekly chart’s upper channel trend line into focus.
- Lower targets: any bearish breakout will bring the weekly chart’s 61.8% fib, near 3.25, and, after that, the 3.10 region as previous S/R into focus.

Commodities:
Gold: Gold continues to consolidate above the broken 6-year bear trend line.
Watch the 4hr chart’s triangle for any new breakout:
- Upper targets: any bullish breakout will bring the $1,380 and $1,400 S/R levels, then the weekly chart’s 50% fib, near $1,485, followed by the weekly chart’s 61.8% fib, near $1,600, into focus.
- Lower targets: any bearish retreat will bring the $1,300, then $1,265 and $1,250 levels into focus.

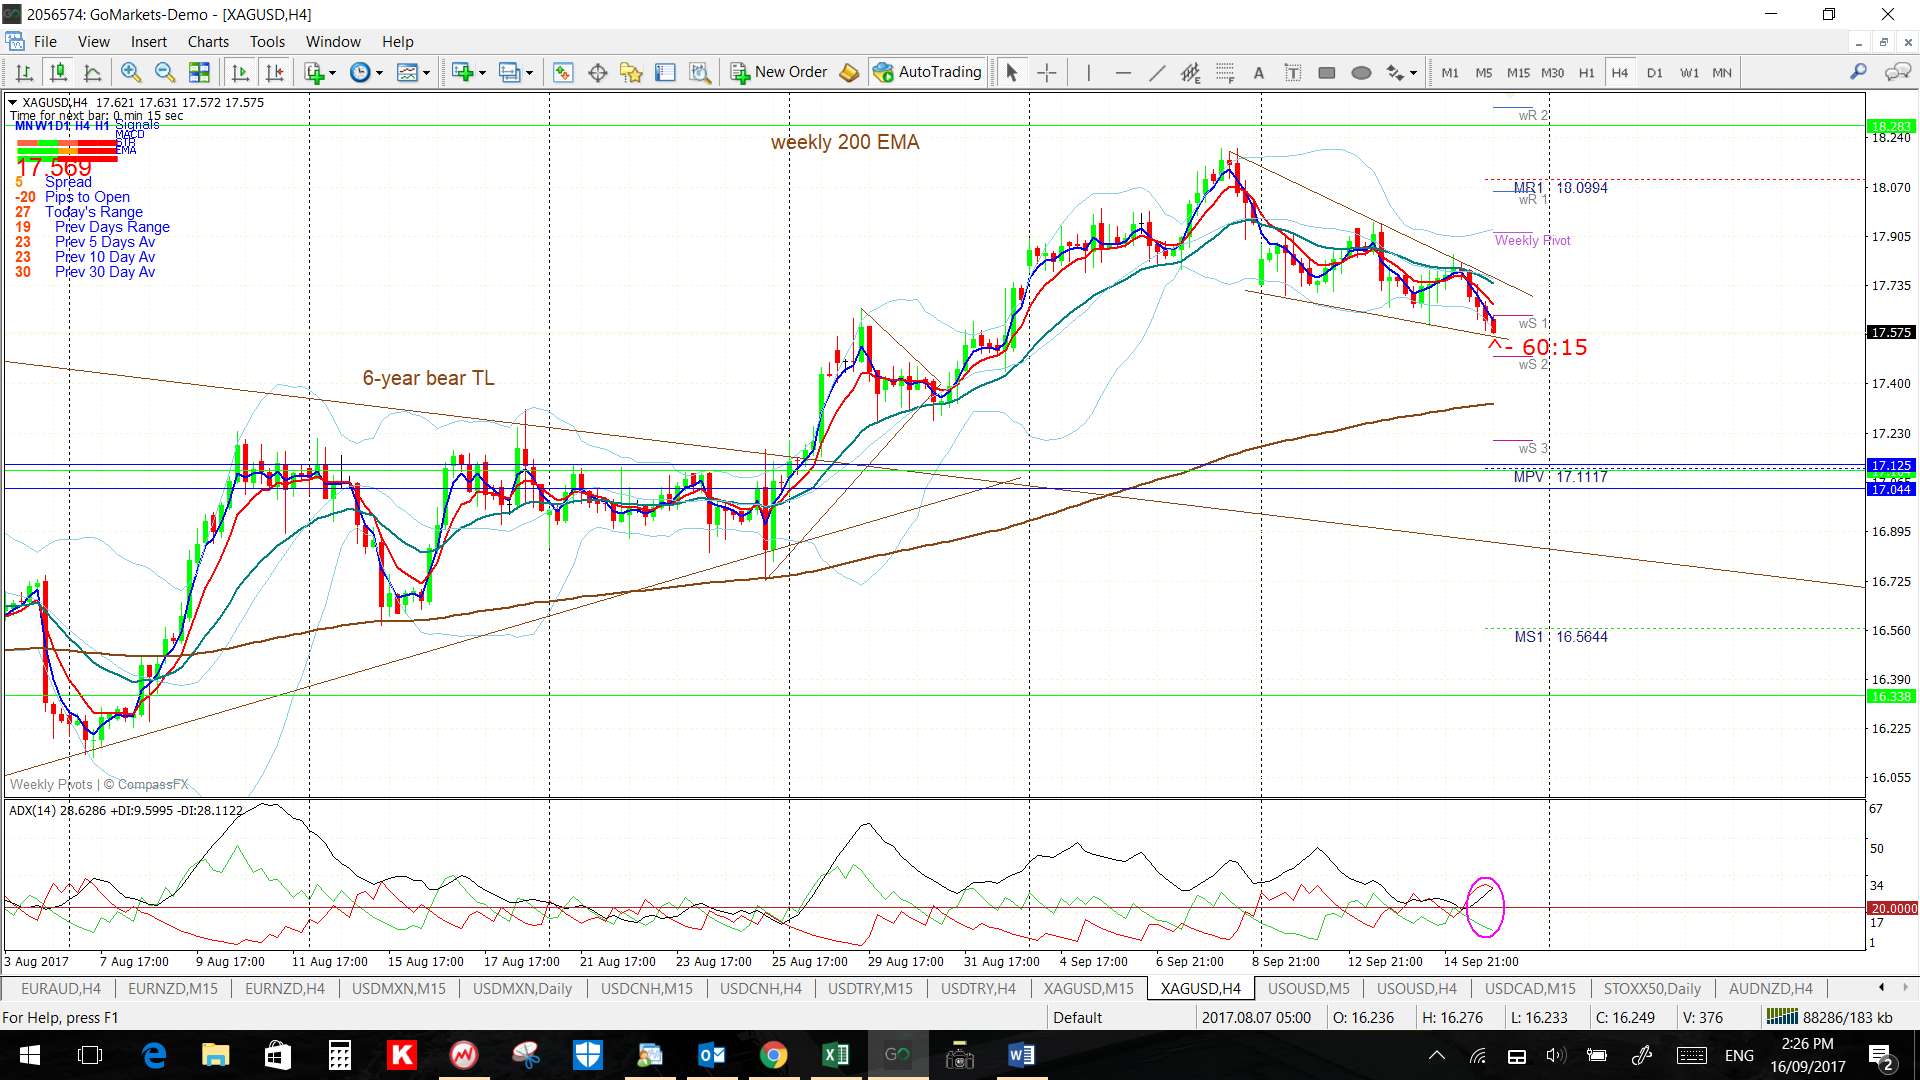
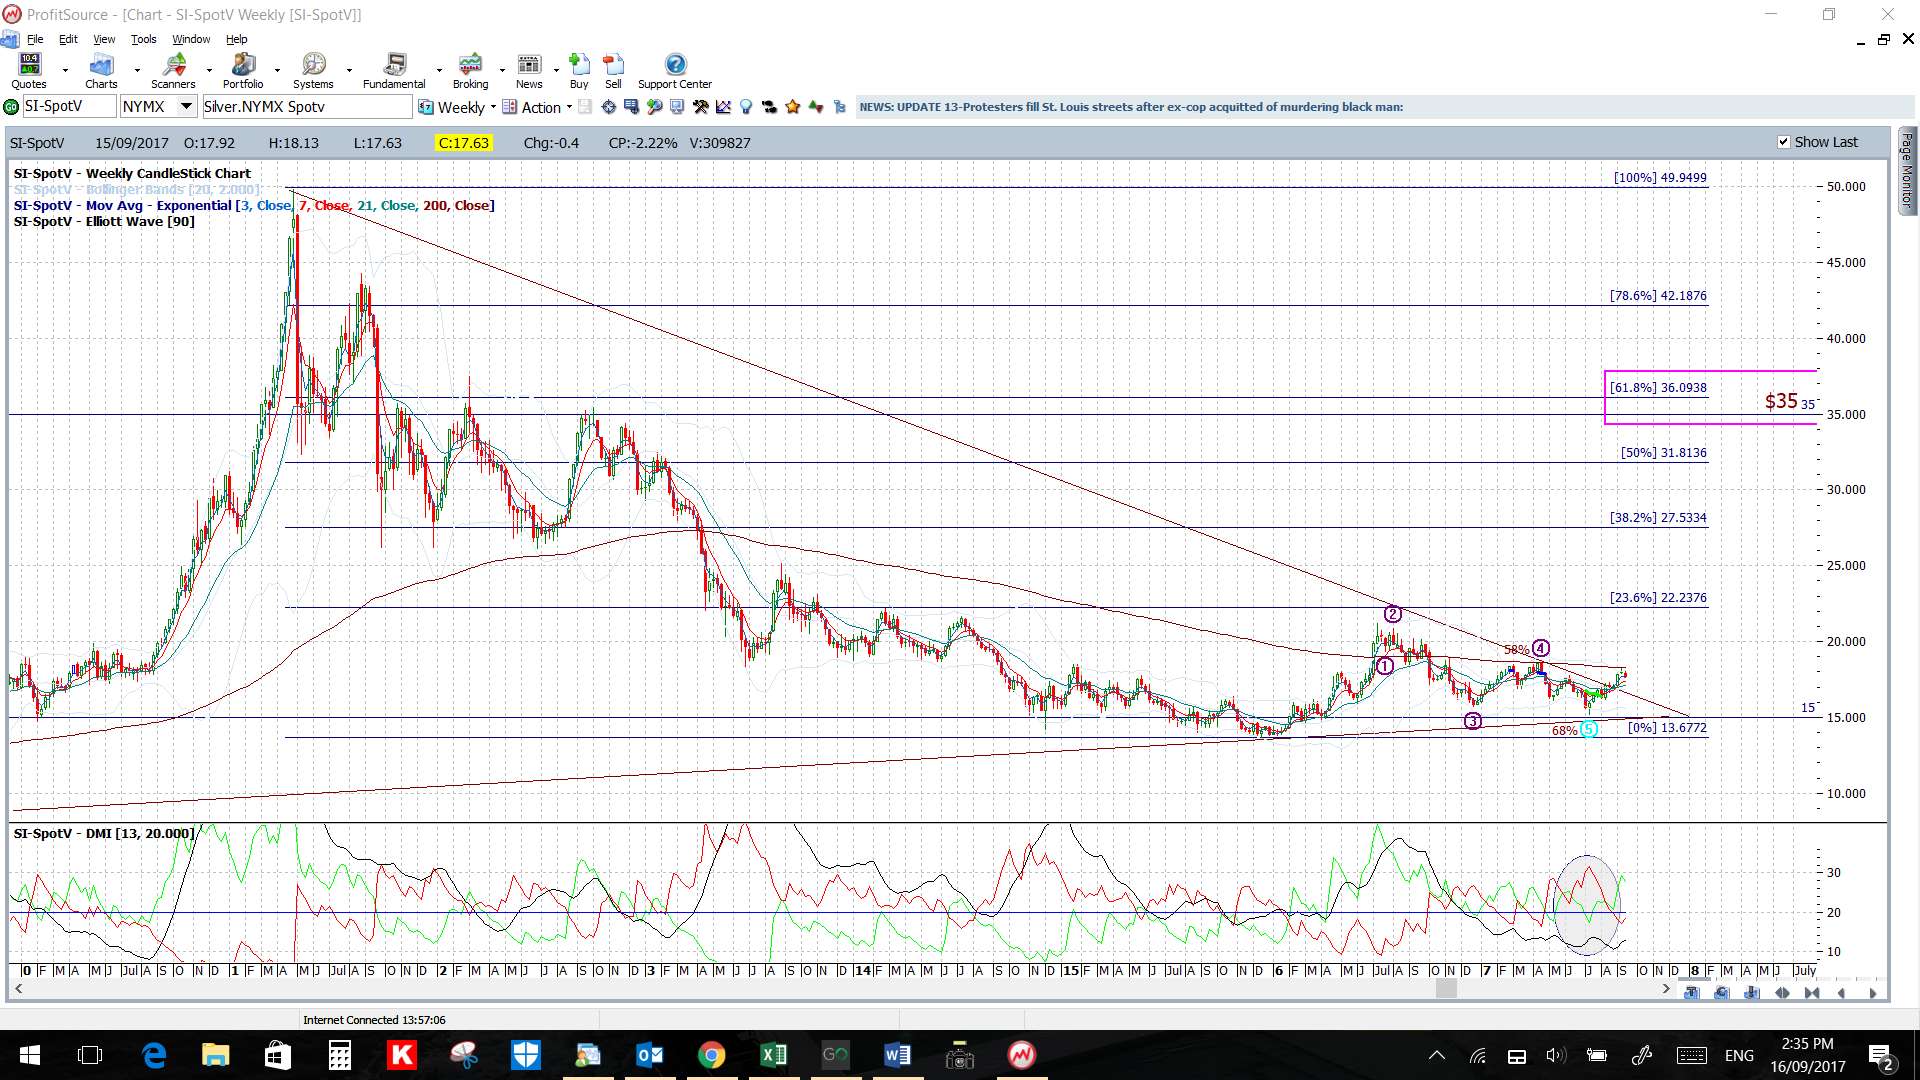
Silver: Silver continues to hold above the previously broken 6-year bear trend line but is pegged by weekly 200 EMA.
Watch the 4hr chart’s Flag trend lines and weekly 200 EMA for any new breakout:
- Upper targets: any bullish breakout will bring whole number levels and the weekly chart’s 61.8% fib, near $35, into focus.
- Lower targets: any bearish retreat will bring whole-number levels down to $15 into focus.
Oil: Oil is back up near the $50 level and edging towards the weekly chart’s bear triangle trend line; a resistance zone that has been in play for over 2 years.
Watch for any breakout from this major weekly chart triangle:
- Upper targets: the $60, $65 and $70 whole-number levels followed by the weekly chart’s 61.8% fib near $75.
- Lower targets: any bearish retreat will bring the 4hr chart’s swing high 61.8% fib, near $45, then the recent low, near $42, and then the $40 S/R level into focus.
Note: There is 2-year bear trend line above current price and this also forms the monthly chart’s ‘Neck Line’ for a potential ‘Inverse H&S’ pattern. This pattern has a height of approximately $30 or 3,000 pips and this puts the target for any breakout move up near the $85 level which ties in with the 50% Fibonacci of the 2008-2016 swing low move.