Key Points:
- Despite the broader uptrend, losses are looking likely to extend.
- Various technical readings suggest that the pair could sink to 142.27
- The broader pennant should remain intact.
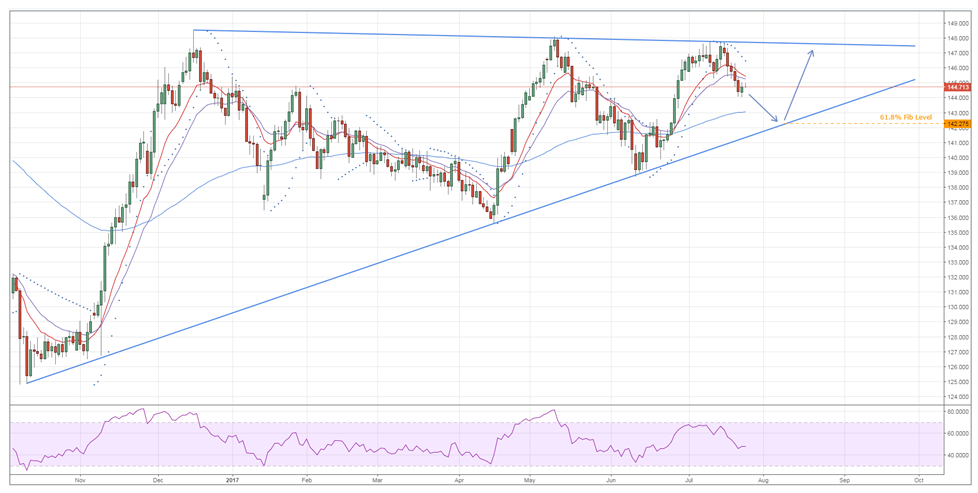
Most JPY crosses have been fairly faithfully retracing a consolidation pattern over the past few months and the GBP/JPY is no exception to this. However, unlike the more often quoted USD/JPY, the GBP/JPY is actually well placed to see further losses which could result in a slump all the way back to the 142.27 handle – by no means an immaterial downtrend.
Indeed, in contrast to the USD/JPY, the GBP/JPY is quite some distance away from the downside constraint of its pennant. As a result, it could still stumble significantly before encountering any strong support. Indeed, even the 100 day EMA – often a decent source of dynamic support/resistance – is notably below price action which gives the bears some room to maneuver.
The main snag here is the fact that, broadly speaking, the pair looks rather bullish from a technical perspective. What’s more, if the USD/JPY starts to recover in the coming days, this could translate into a broader weakening of the Yen which would spur the bulls into action and potentially prevent the forecasted slip from occurring.
Nevertheless, if we look past the EMA bias, there is actually a fairly solid argument for losses to extend over the coming days. Firstly, the parabolic SAR is still indicating that a downtrend is in play and it is also in little danger of inverting this bias any time soon. Secondly, the MACD reading remains in a bearish configuration which suggests that the bears aren’t ready to throw in the towel just yet.
Overall, we expect losses but they should be relatively limited for a number of reasons. For one thing, the long-term trendline is unlikely to give way any time soon unless a major fundamental upset is seen. This is only reinforced by the fact that the 61.8% Fibonacci level intersects with this line around the 142.27 price. Moreover, the 100 day moving average will certainly be helping to rebuff the bear’s efforts at or even before this level so chances of a breakout in the near-term seem fairly remote.
 By Matthew Ashley – Jul 25, 2017
Source: Investing.com

