With the key US stock indices attempting a recovery off their recent lows and with the VIX making a retreat I thought it would be useful to check some global indices and put these recent moves into greater perspective.
VIX weekly: this has pulled back below the 20 level but the Elliott Wave indicator on my chart suggests that this might just be a temporary move!
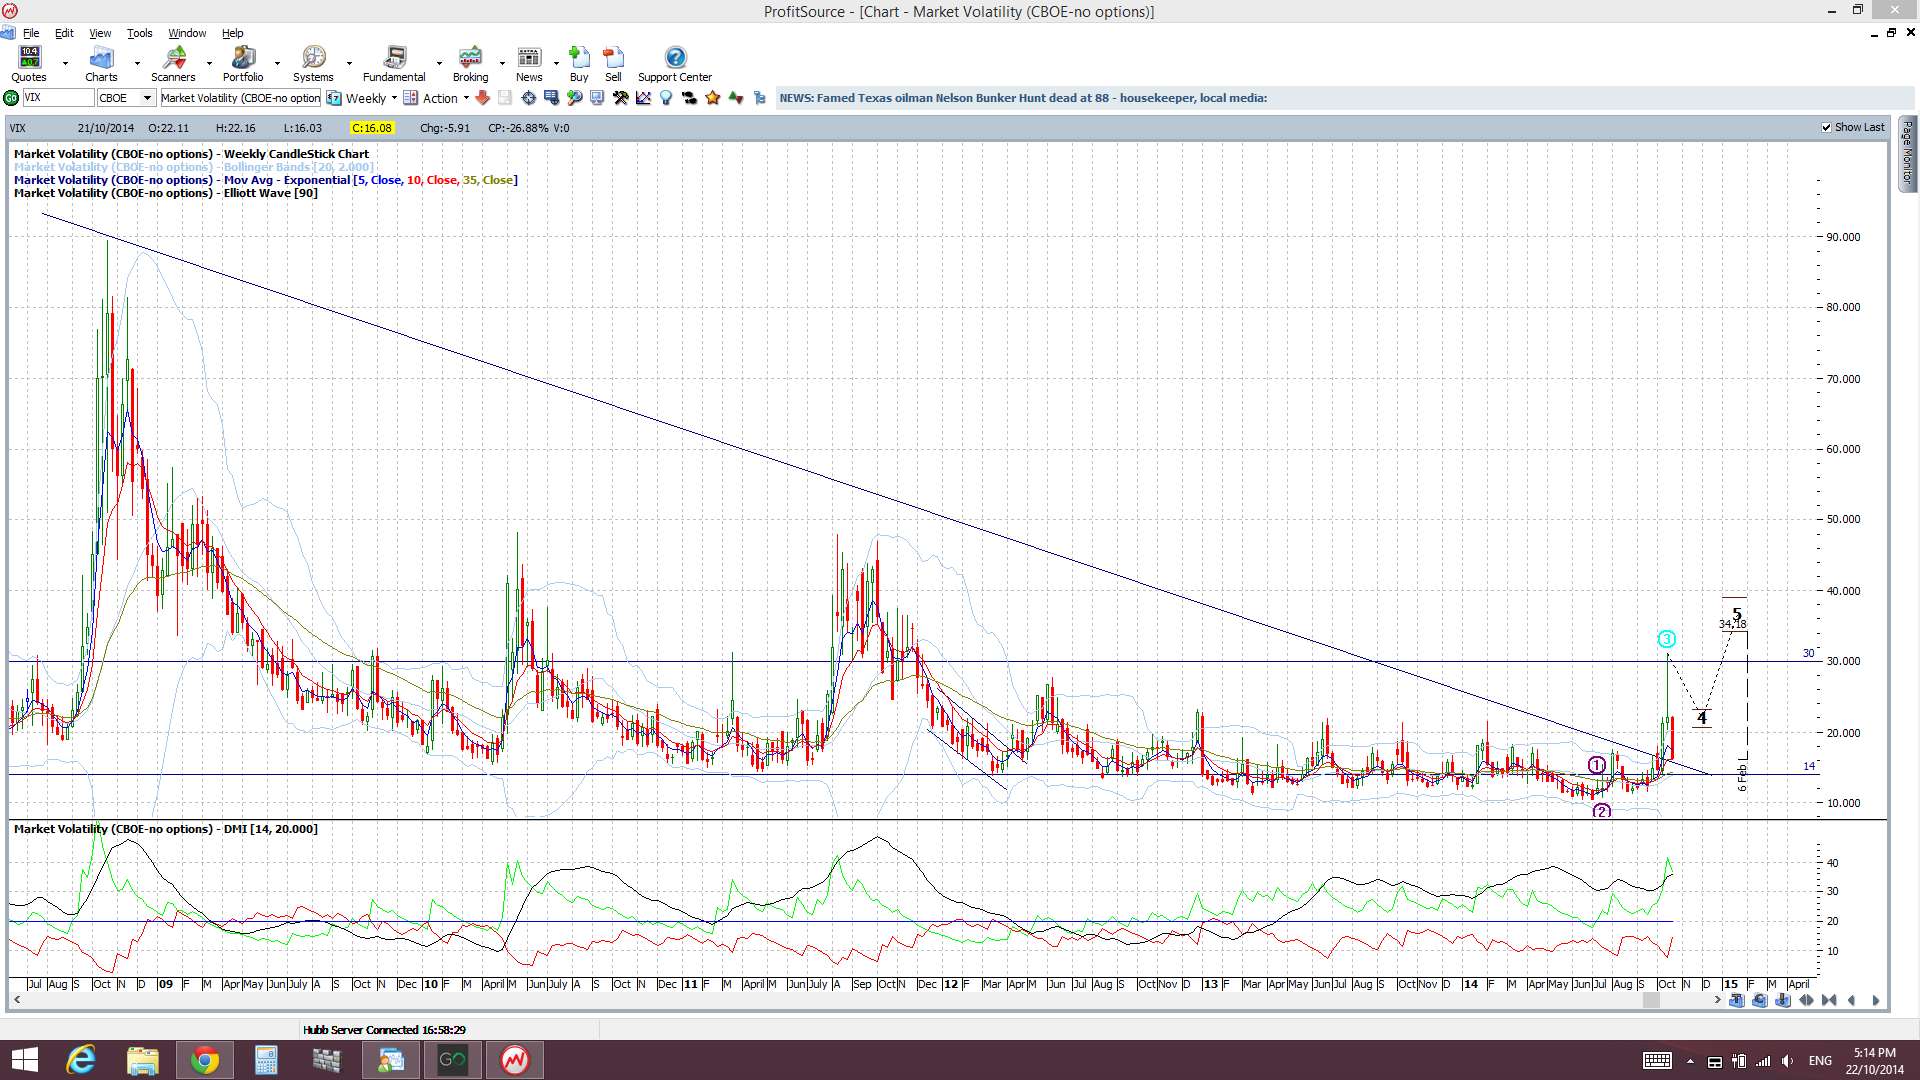
NB: Monthly candles don’t close off until the end of next week.
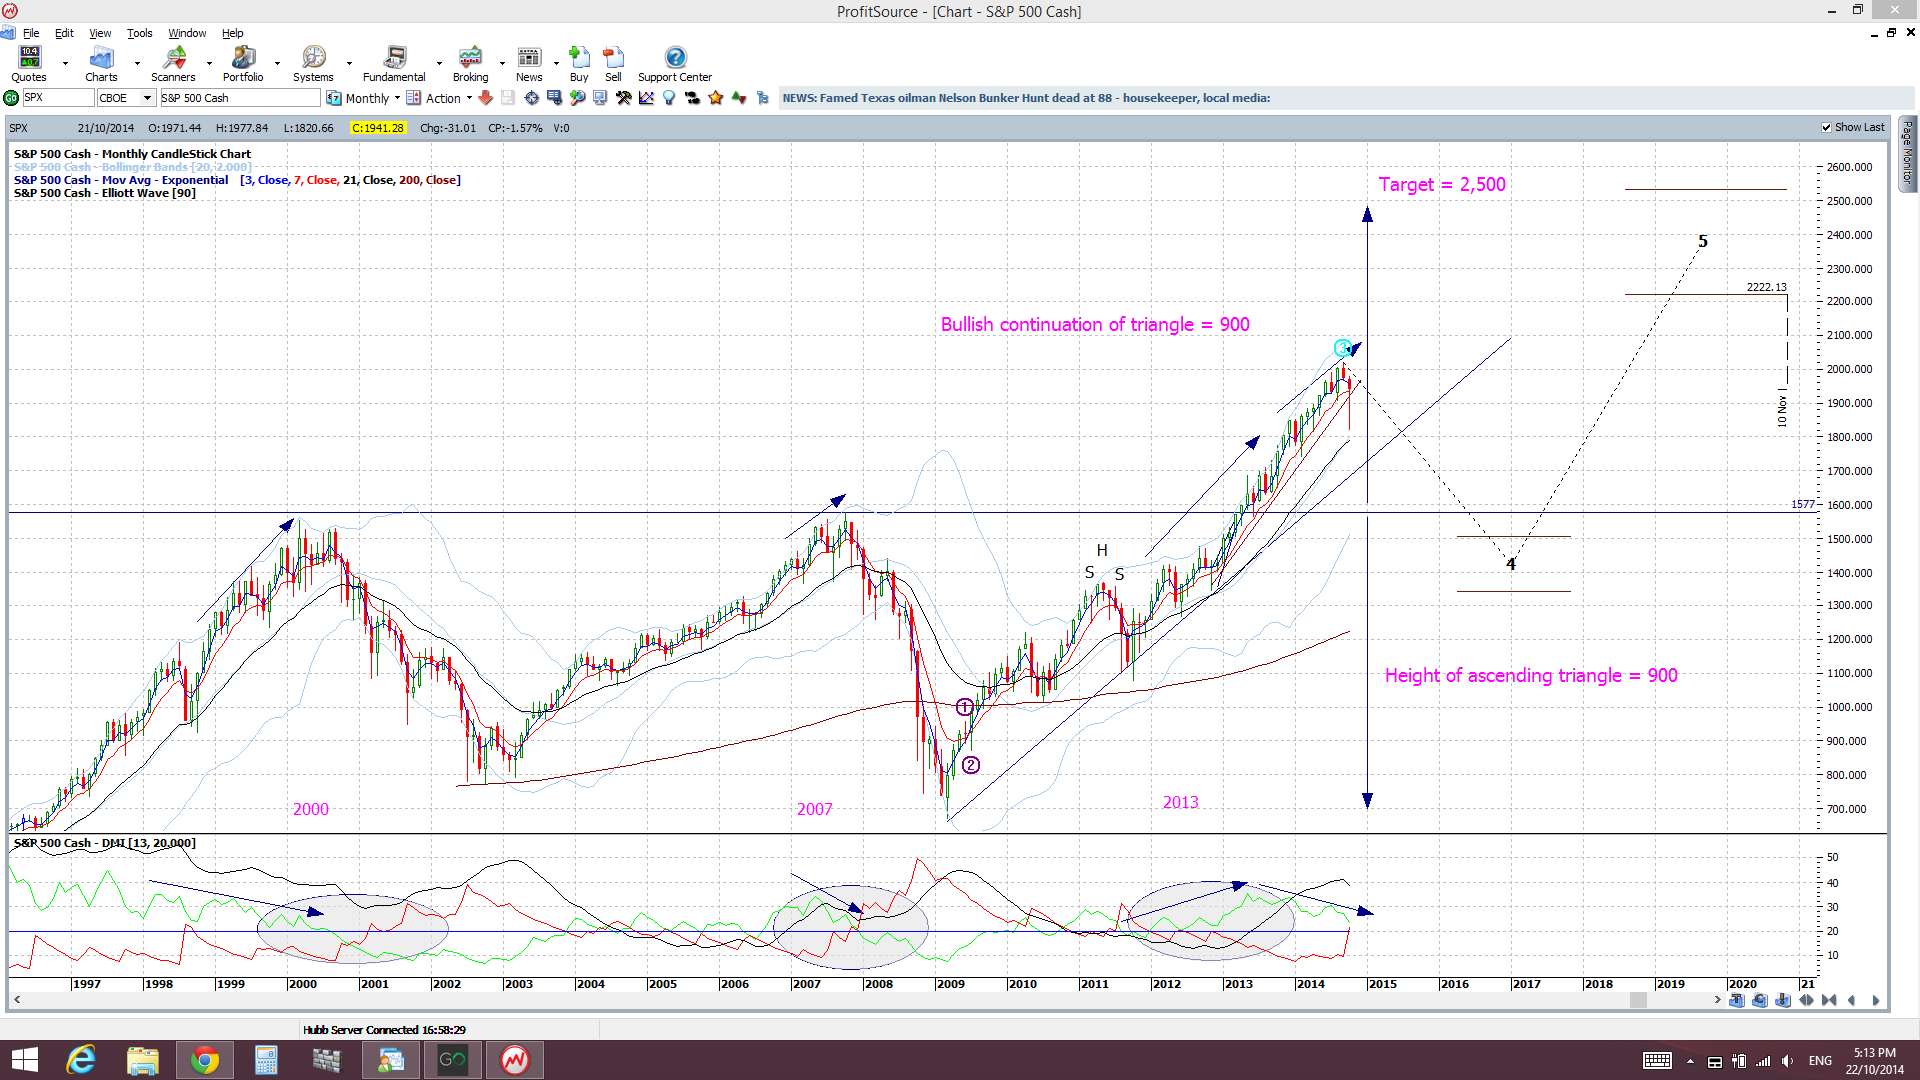
S&P500 monthly: I do see the recent recovery but I’m keeping an open mind here and still thinking a deeper pull back could be seen. A monthly support trend line is still intact here:
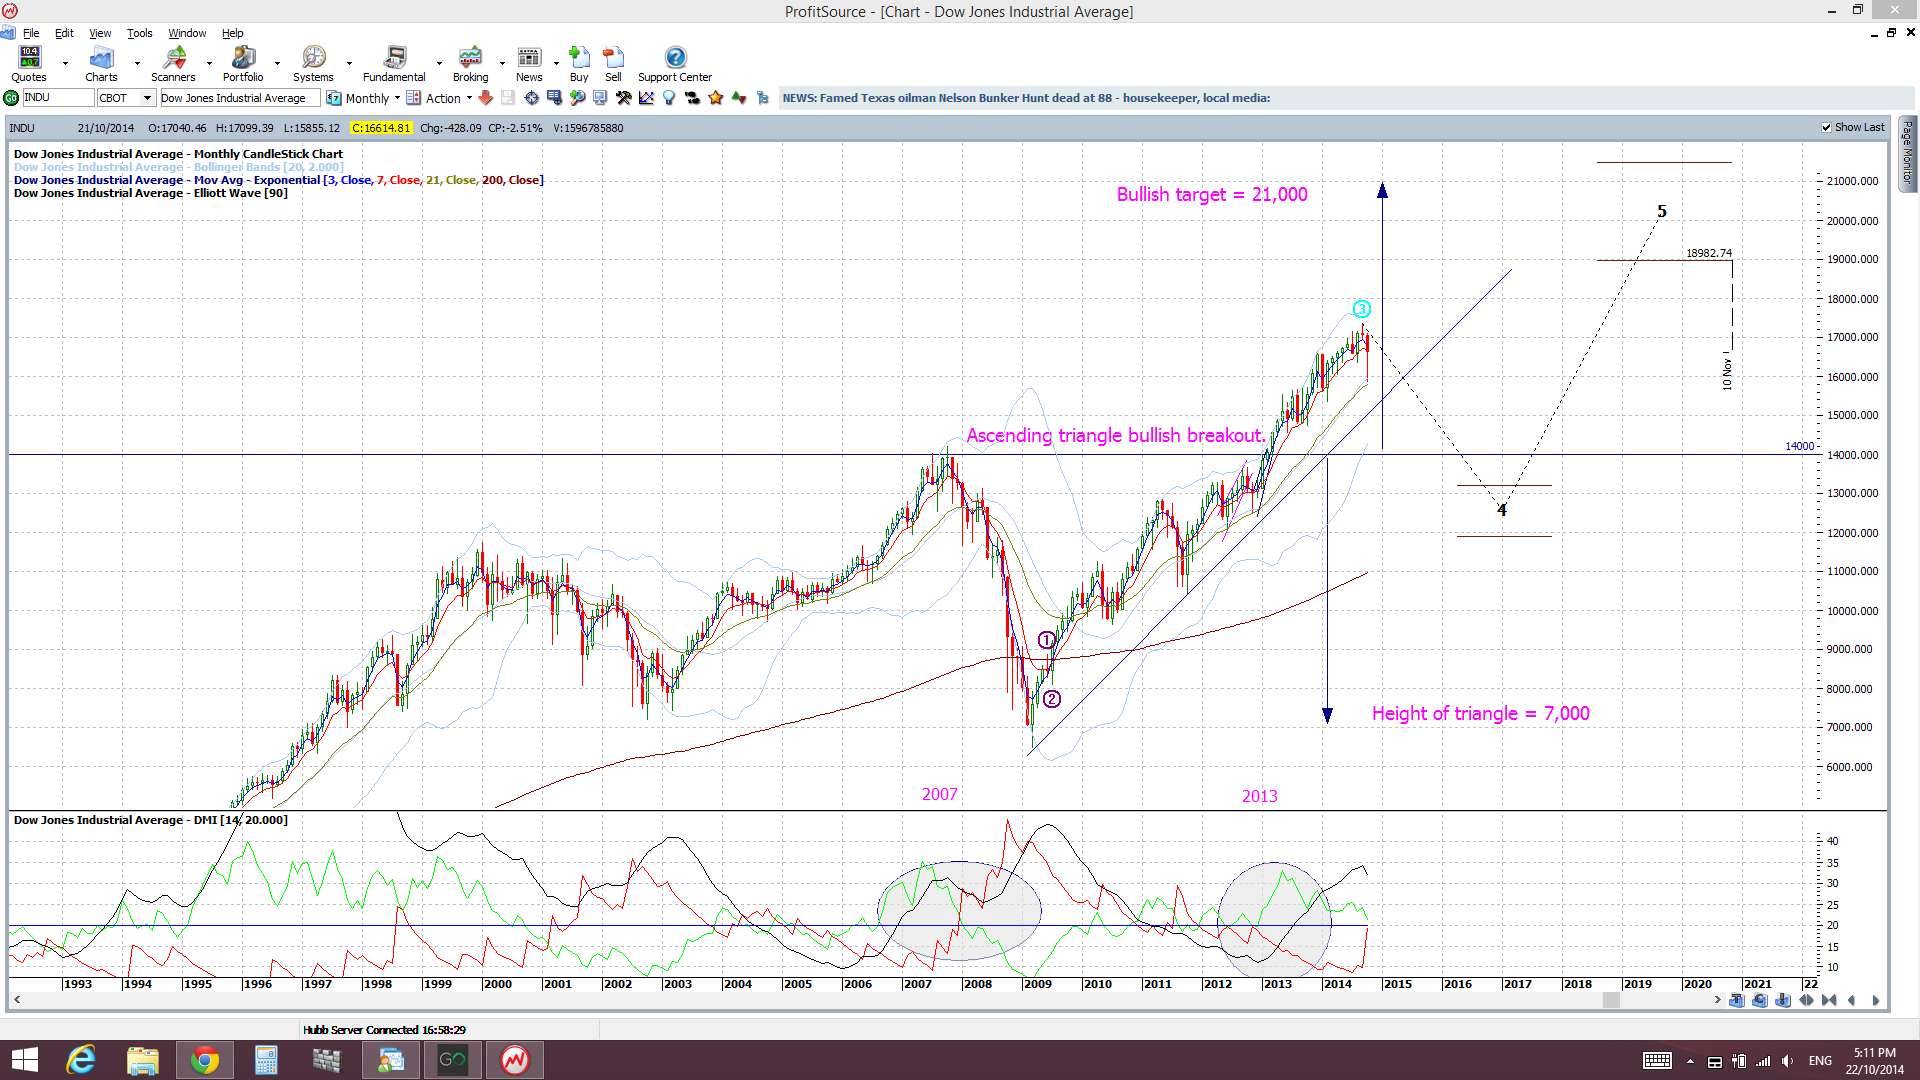
DJIA monthly: ditto here:
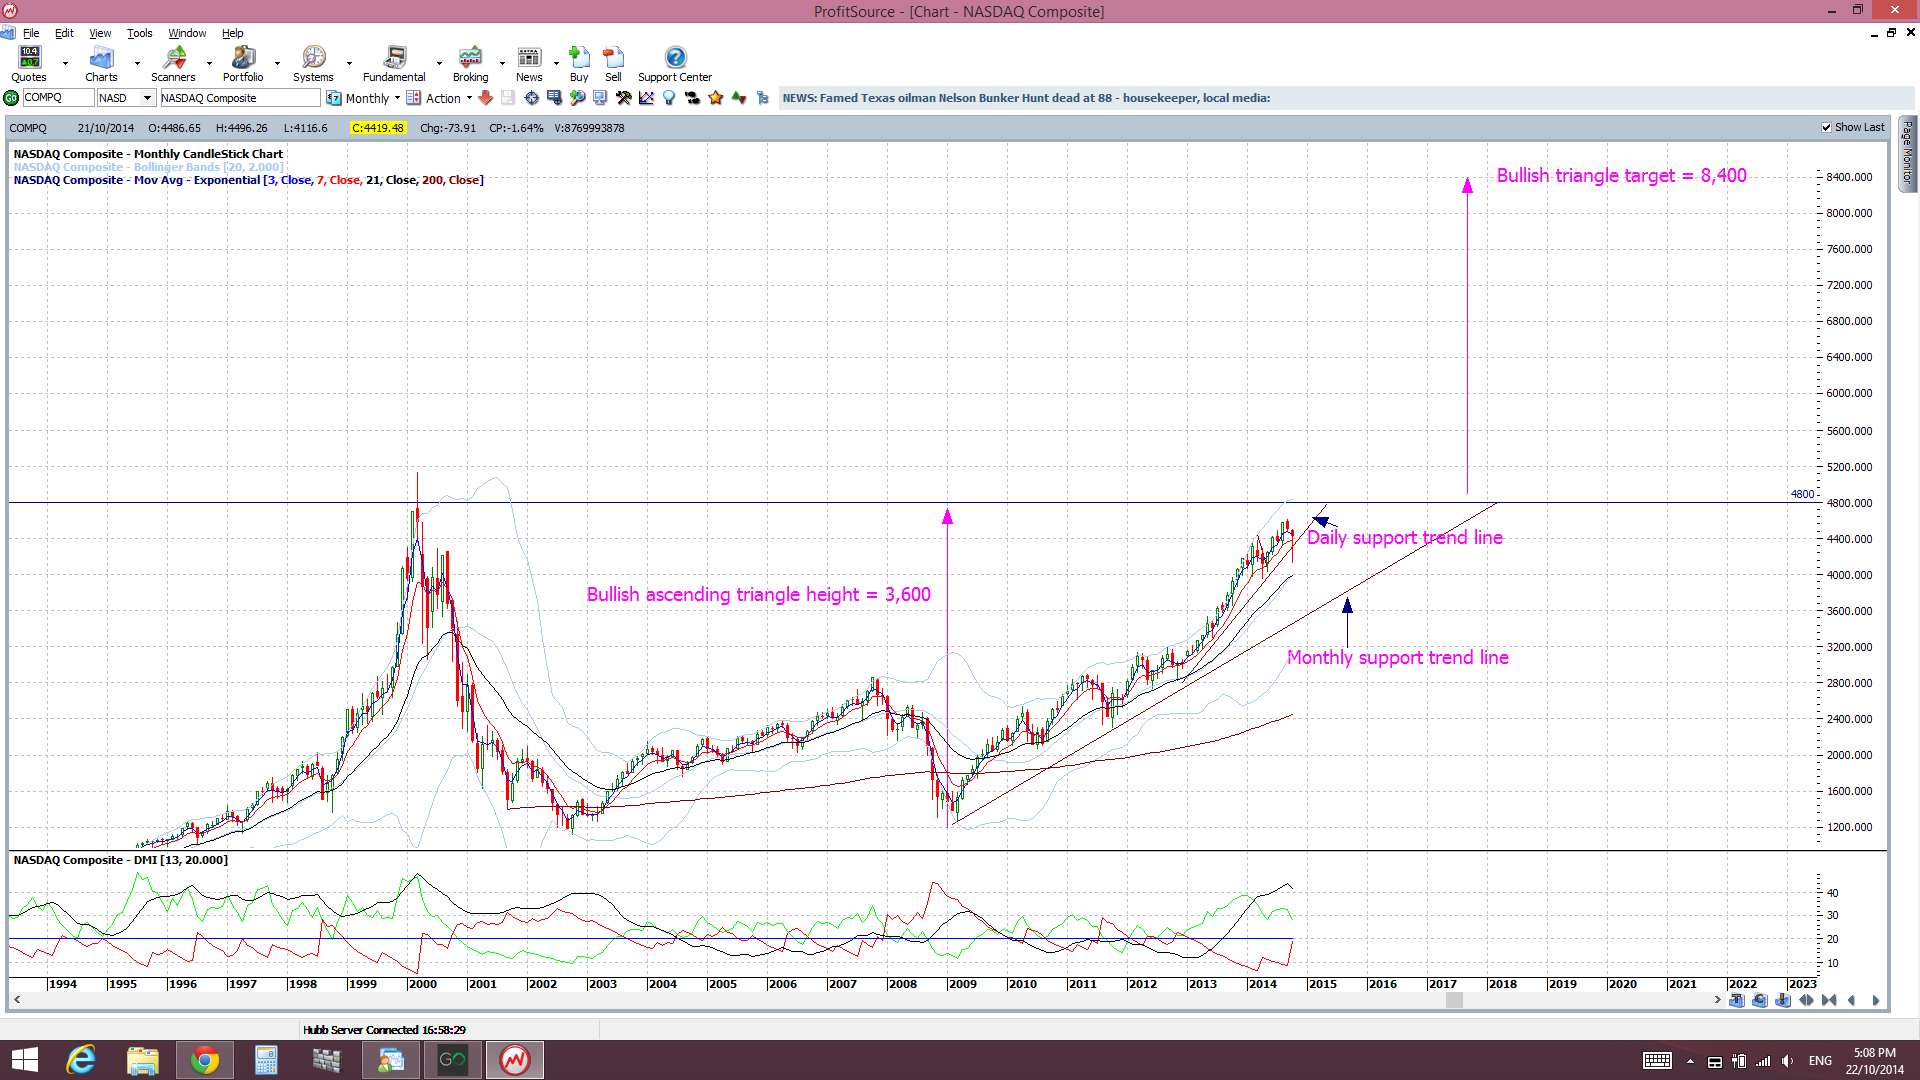
NASDAQ monthly: the 4,800 is a key level to watch here:
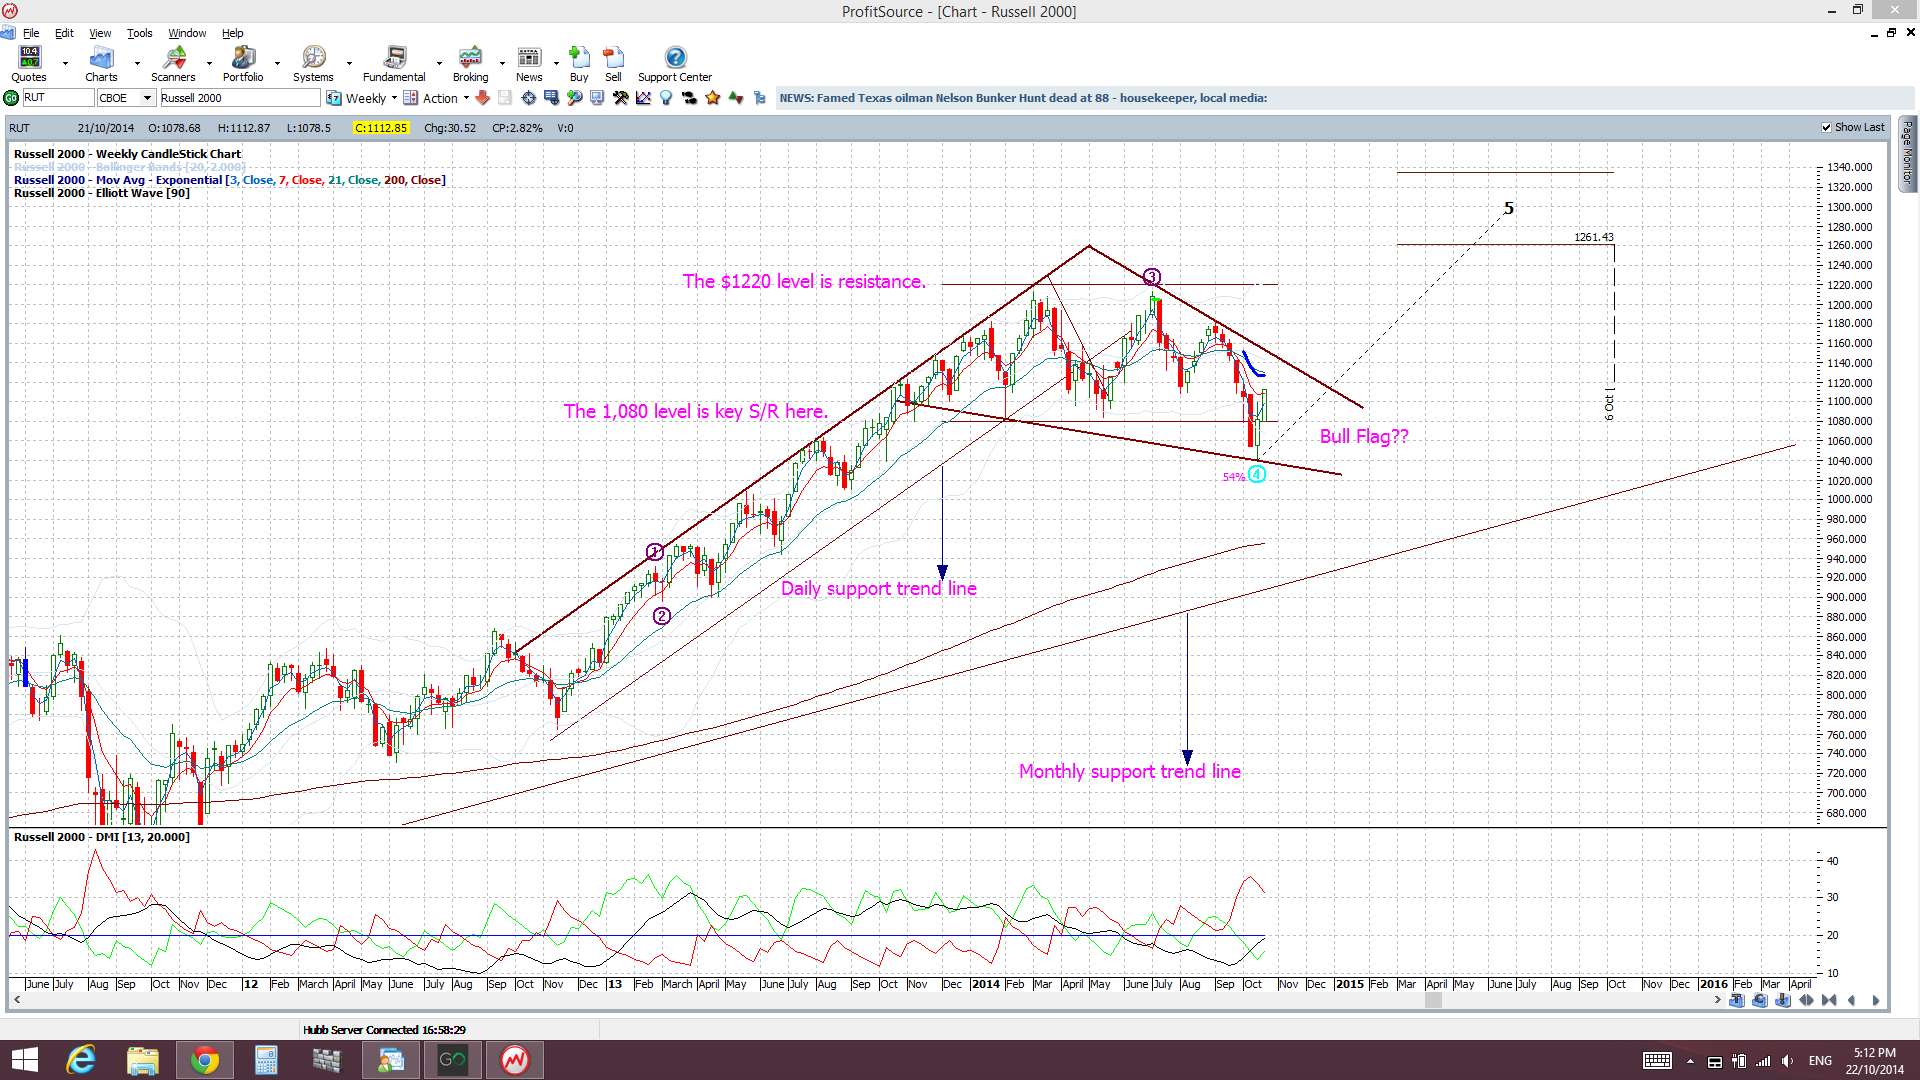
Russell 2000: the bellwether ‘small cap’ index has given a few bearish signals recently BUT this overall pattern does look a tad bullish!
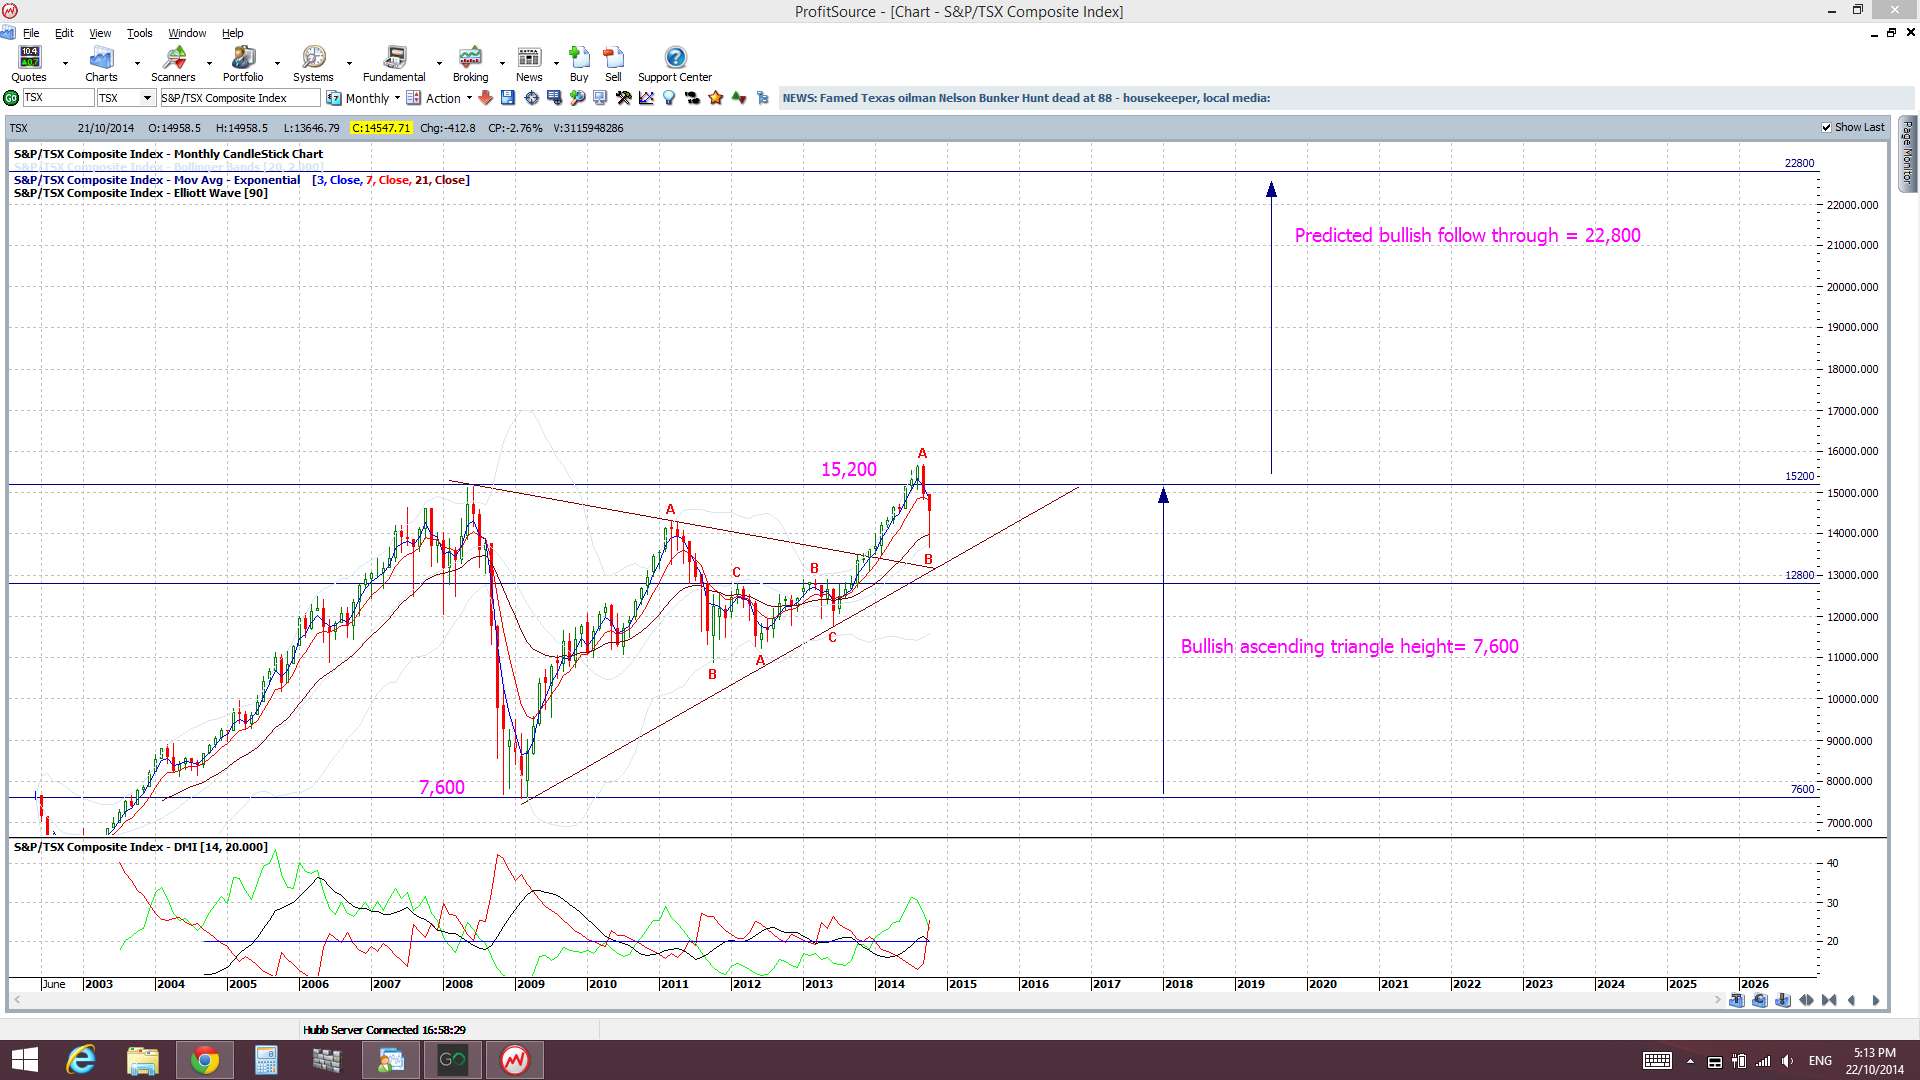
TSX monthly: monthly support intact and the 15,200 still key here:
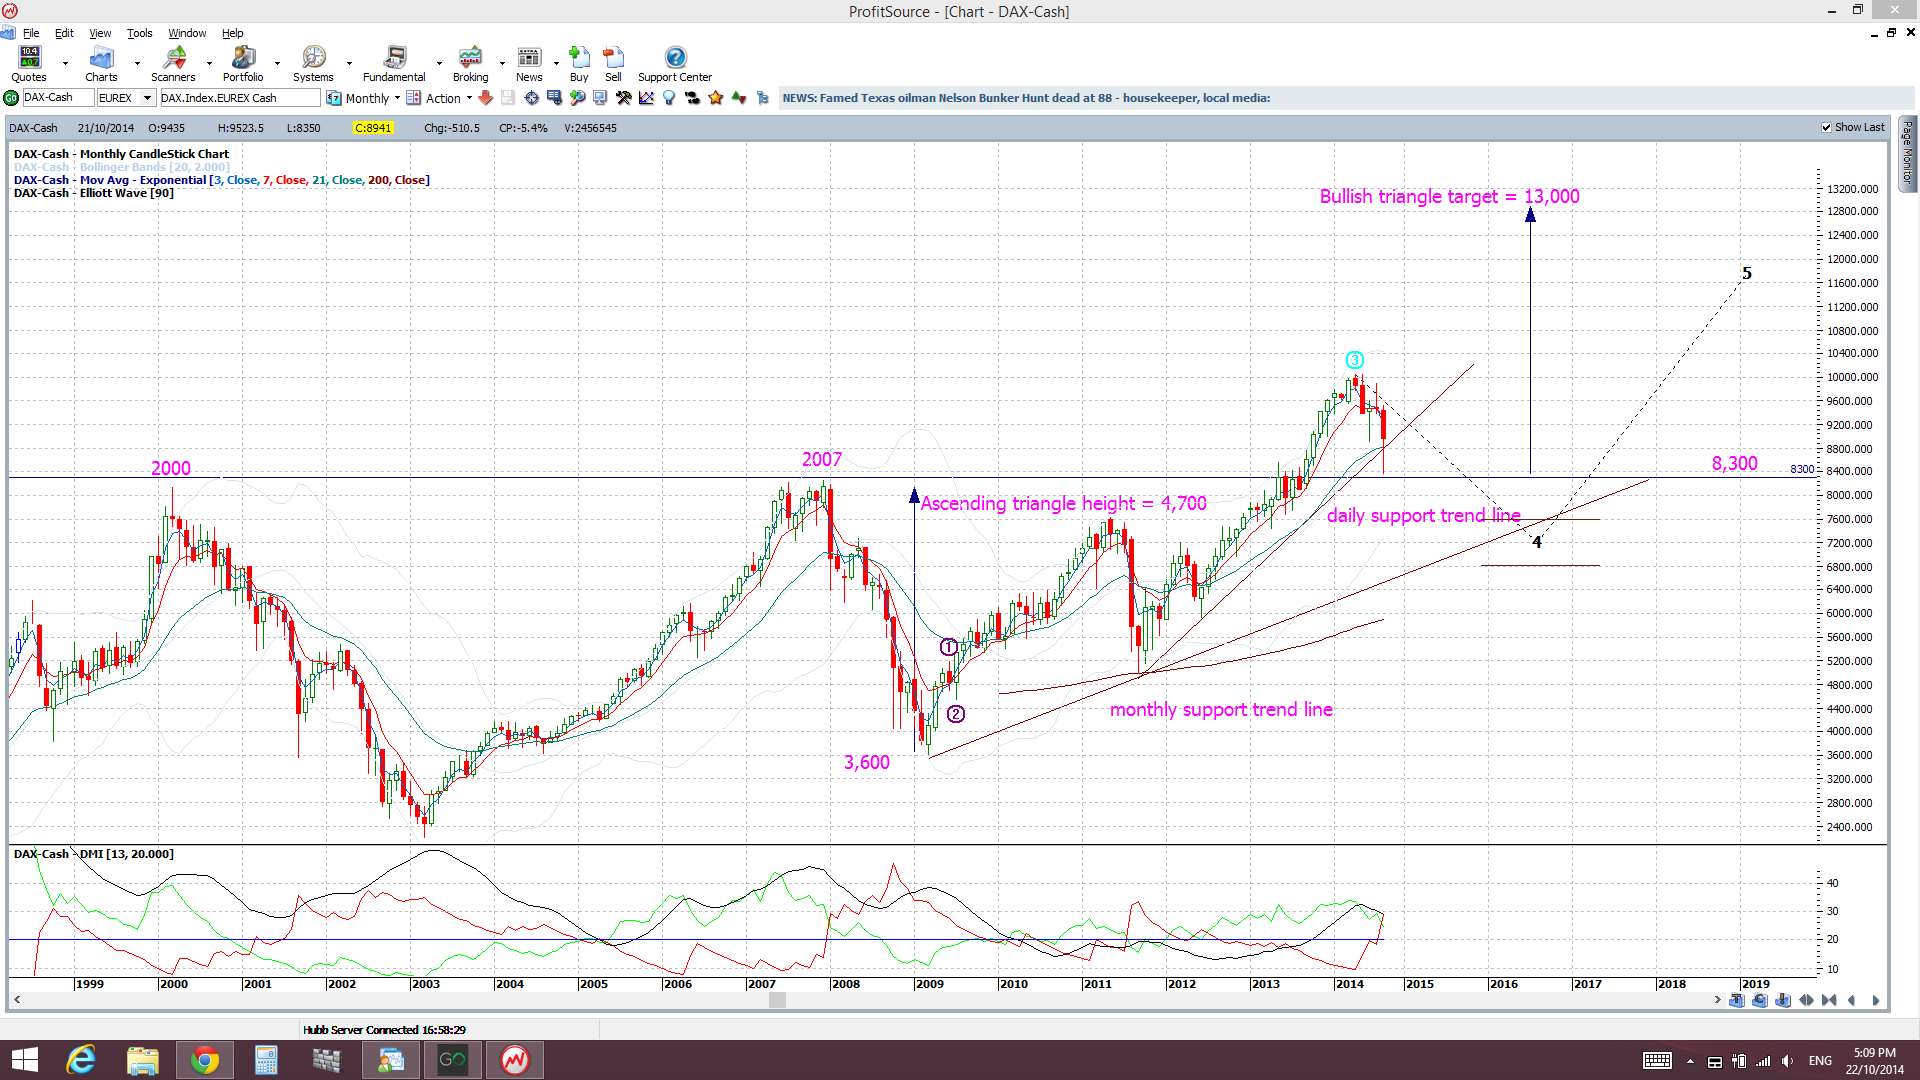
DAX monthly: Germany’s stock index is back above monthly support after a recent test of the 8,300 breakout region:
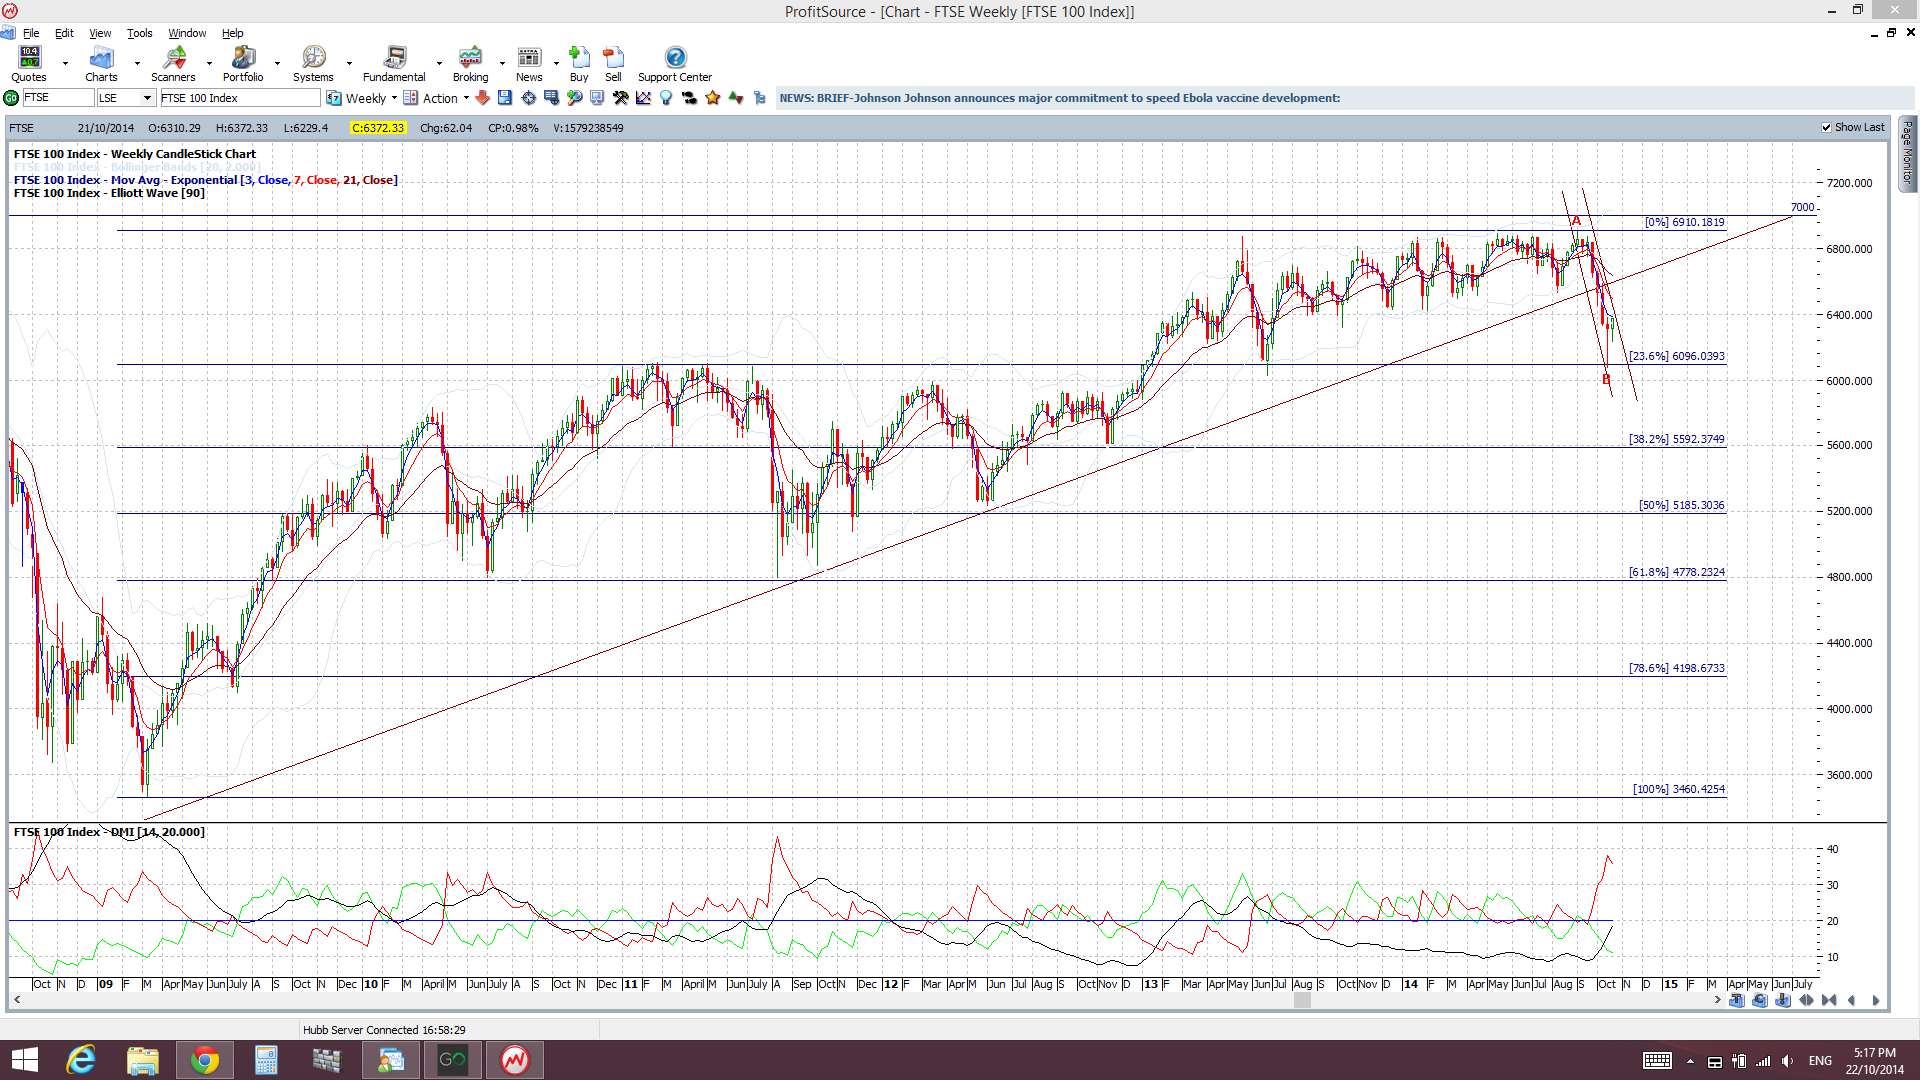
FTSE weekly: this triangle break had looked bearish BUT now it has taken on a bit of a ‘Bull Flag’ appearance. Watch for trend line breaks here:
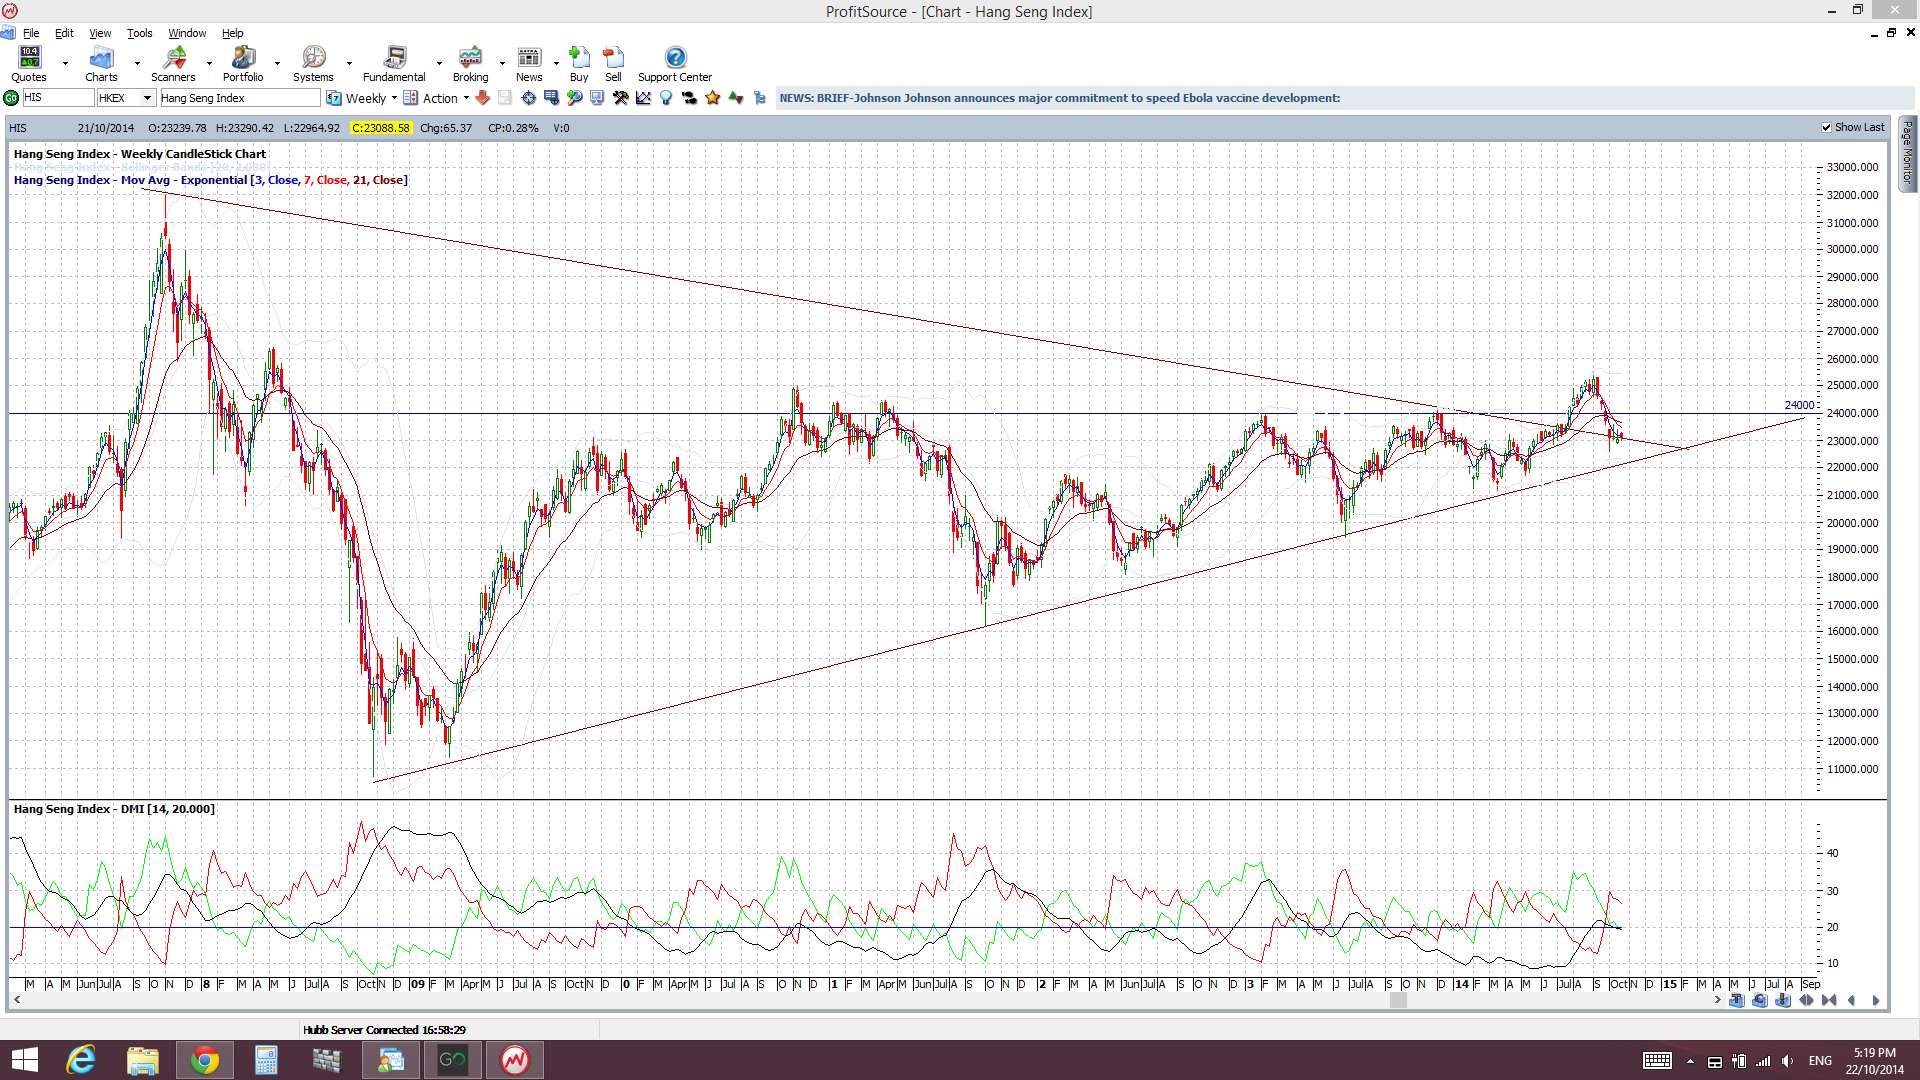
Hang Seng Index weekly: 24,000 still key here:
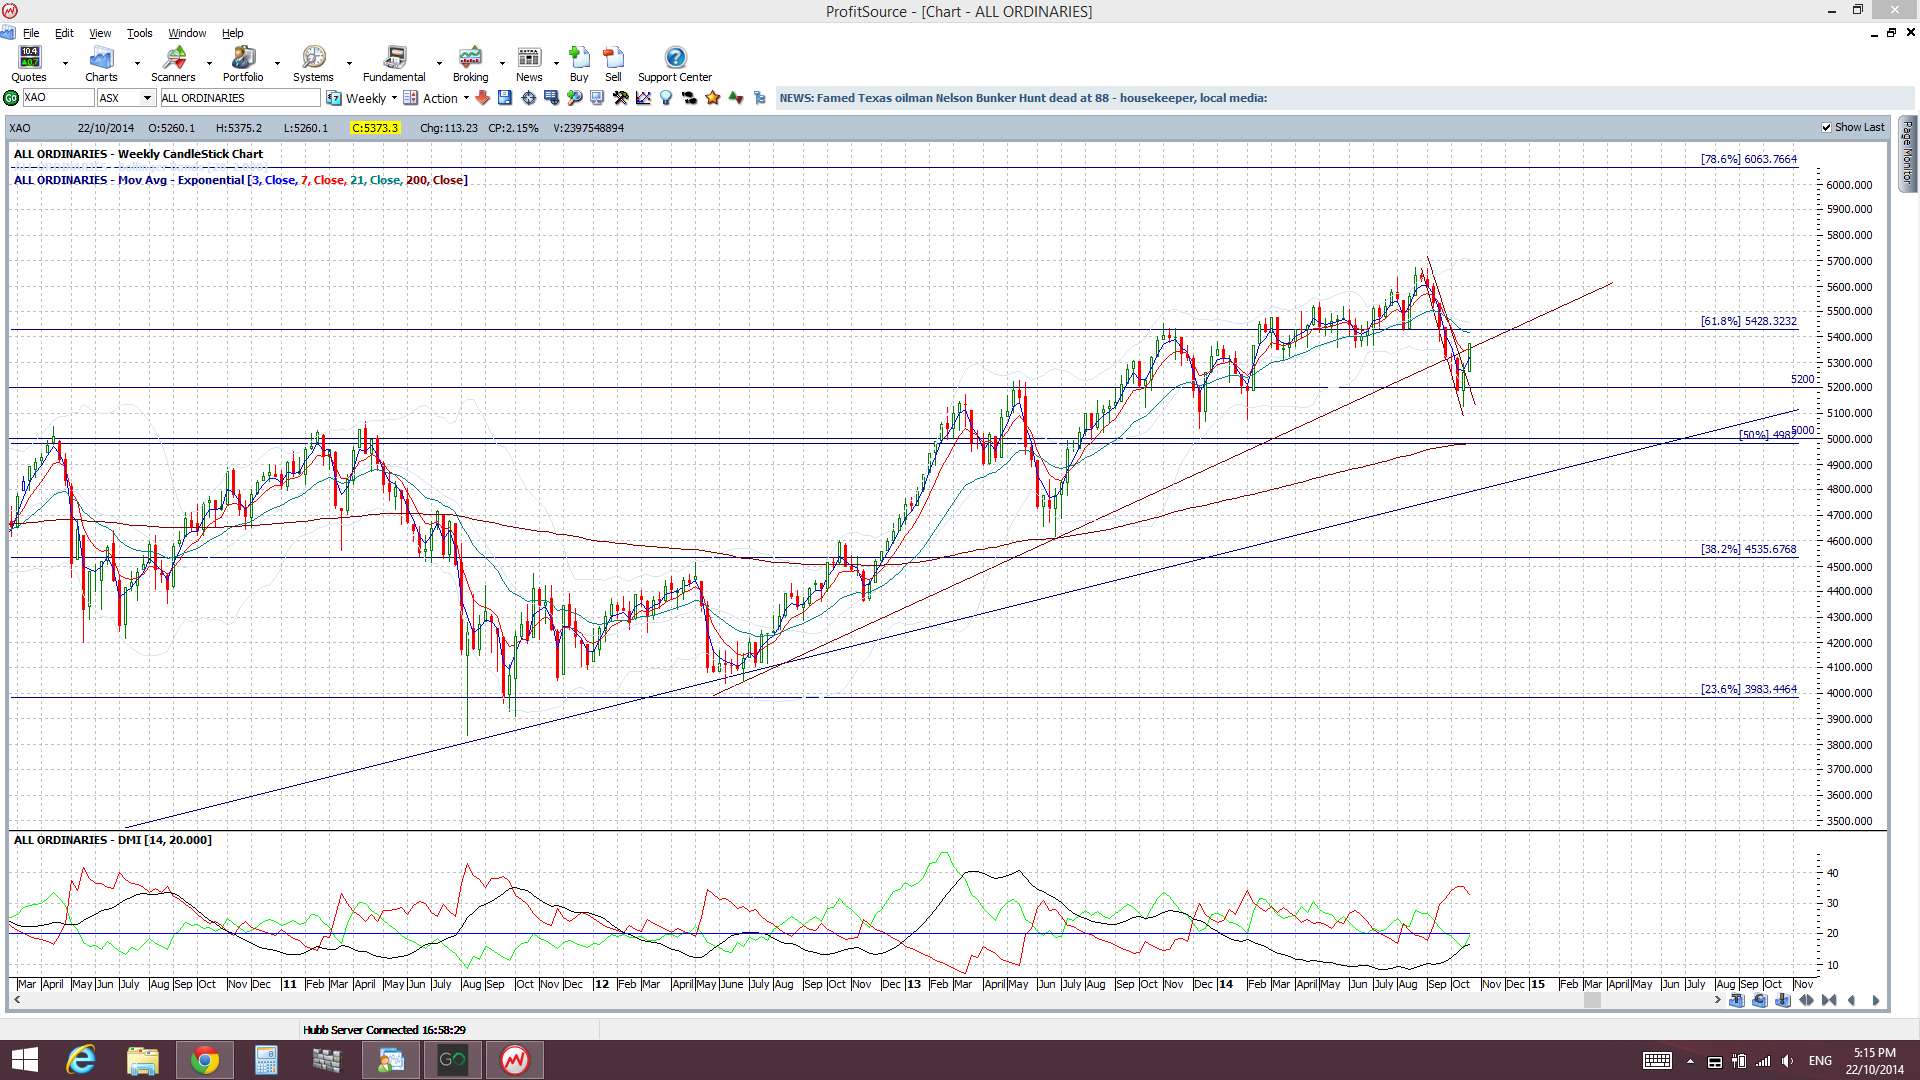
XAO weekly: The Aussie ‘All Ordinaries’ looks to have made a bullish ‘Flag’ breakout:
The post Global stock indices: a quick check. appeared first on www.forextell.com.