Last week: Gold was one of the better TC trading vehicles last week with price action on the precious metal responding to the US President’s Twitter feed. It has been another week where Political news has dominated market movement over Economic news. I’m finding that watching for TC signals that trigger on Gold, following any breakout from the Asian trading zone, is proving to be a low-risk and high reward trading regime in the current market climate. Gold may continue to be the go-to trading vehicle in the coming week, and I suspect Oil as well, given the weekend Syria missile strike and the uncertainty that this will no doubt create.

Trend line breakouts and TC signals: there were a few trend line breakout trades last week and these were updated on my sitehere, here, here and here:
- Oil: a TC signal for 100 pips and 3 R & another for 150 pips and 6 R.
- NZD/USD: 80 pips plus a TC signal for 60 pips and 4R.
- EUR/JPY: 90 pips and a TC signal for 90 pips and 9 R.
- AUD/USD: a TC signal for 50 pips and 1 R.
- GBP/JPY: 260 pips and a TC signal for 100 pips and 6.5 R.
- Gold: 240 pips and a TC signal for 280 pips and 6 R and another for 130 pips and 4 R.
Next week:
- FX Indices: The US$ index printed a bearish weekly candle but both FX Indices remains in sideways consolidation patterns. An update on these Indices can be found through this link.
- Syria: the weekend missile strike against Syria will likely trigger a reaction across trading instruments so watch for impact at market open. It remains to be seen whether any risk-off style reaction might be short lived due to relief that some action was finally taken against Syria or, whether, this might lead to a more protracted conflict and draw in both Russia and Iran.
- Market Gaps: I suspect the weekend news might also trigger Gaps at market open so watch for these and, if they do occur, watch then for any pullback moves to fill these gaps.
- Gold and Oil: I would expect these commodities might be Bid next week, given the Syrian situation, even if the US$ moves higher and my analysis this week starts with a review of this pair.
- Yen pairs: the weekend Syrian attack could trigger a ‘Fight to Safety‘ move to the Yen so watch for any such reaction with Yen pairs.
- Geo-Politics: there are many other events that have the potential to impact markets including NAFTA, US-China Trade relations, North Korea and now the TPP is also back in realm of consideration. Keep abreast of these events as well when considering market risk appetite.
- US Stock Index Majors: the four major US Stock Indices, S&P500, DJIA, NASDAQ and Russell-2000, continue to hold,above trend line support but watch to see how the weekend news events impact these in the coming week:
- S&P500 monthly

- DJIA monthly
- NASDAQ monthly
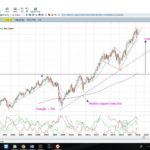
- Russell-2000 monthly
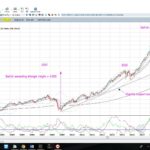
- Bitcoin: Bitcoin is back up near the weekly chart’s 61.8% fib and is looking healthier. Recall this article I wrote a few weeks ago noting the key levels to keep in mind with Bitcoin.

- TC website upgrade: Recall that I am upgrading my website so please be patient throughout this roll-over process but the new site should be up in the next few days. The many stored images are proving to be a challenge in the roll-over process! My blog site started rather humbly as a method of distraction for me back in 2011 when I was undergoing chemotherapy. During that time it has evolved to be a more professional site where I post charts and detailed technical analysis on numerous trading instruments for free and on a very regular basis. Part of this change will involve a small subscription fee, of $10 AUD per month, for access to SOME of my weekday Posts and ALL of my weekend Posts. I consider this a modest cost for my intellectual property given the time taken to prepare and post the various articles of analysis. I have enjoyed a lot of support over the years and received abundant positive feedback and I hope this relationship can continue with my many followers.
- May-June 2018: Just FYI: I will be spending the last week of May and the first three weeks of June in the UK giving my TC system a thorough workout during the European and US trading sessions.
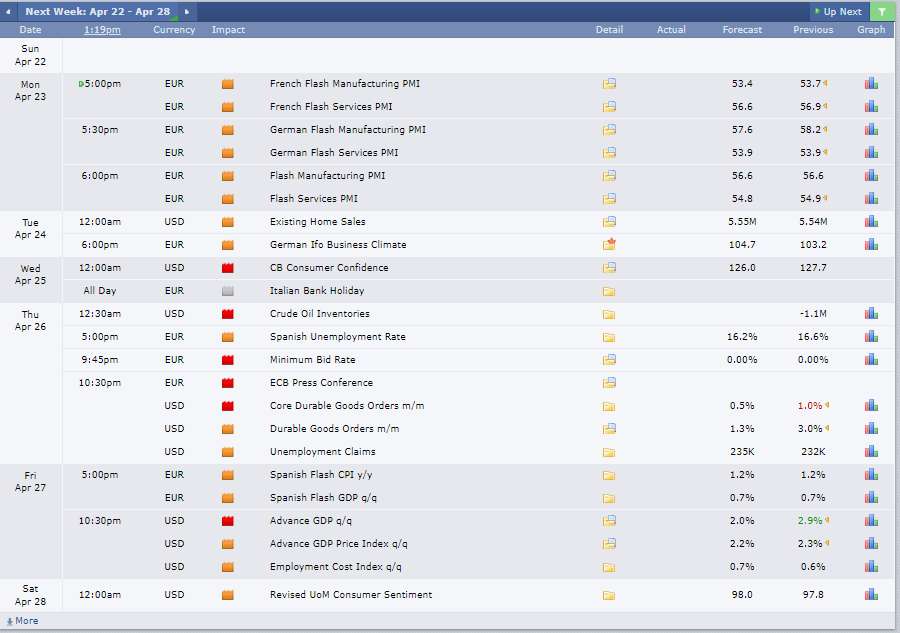
Calendar: News related to the weekend Syrian missile strike will dominate markets to start the week. Chinese GDP will also be one to watch initially as well as US Retail Sales and GBP Employment data. The only other US High Impact data is Building Permits but there is a lot of second tier data and, in particular, Fed speeches to monitor. Watch, also, for unscheduled news items about the Syria situation and any President Trump commentary about Russia, China, NAFTA and Trade Wars.
Forex: I have focused on the FX majors this week, and left out many of the cross-pairs, given the higher probability that US$ movement will dominate FX movement in light of the weekend Syrian missile strike.
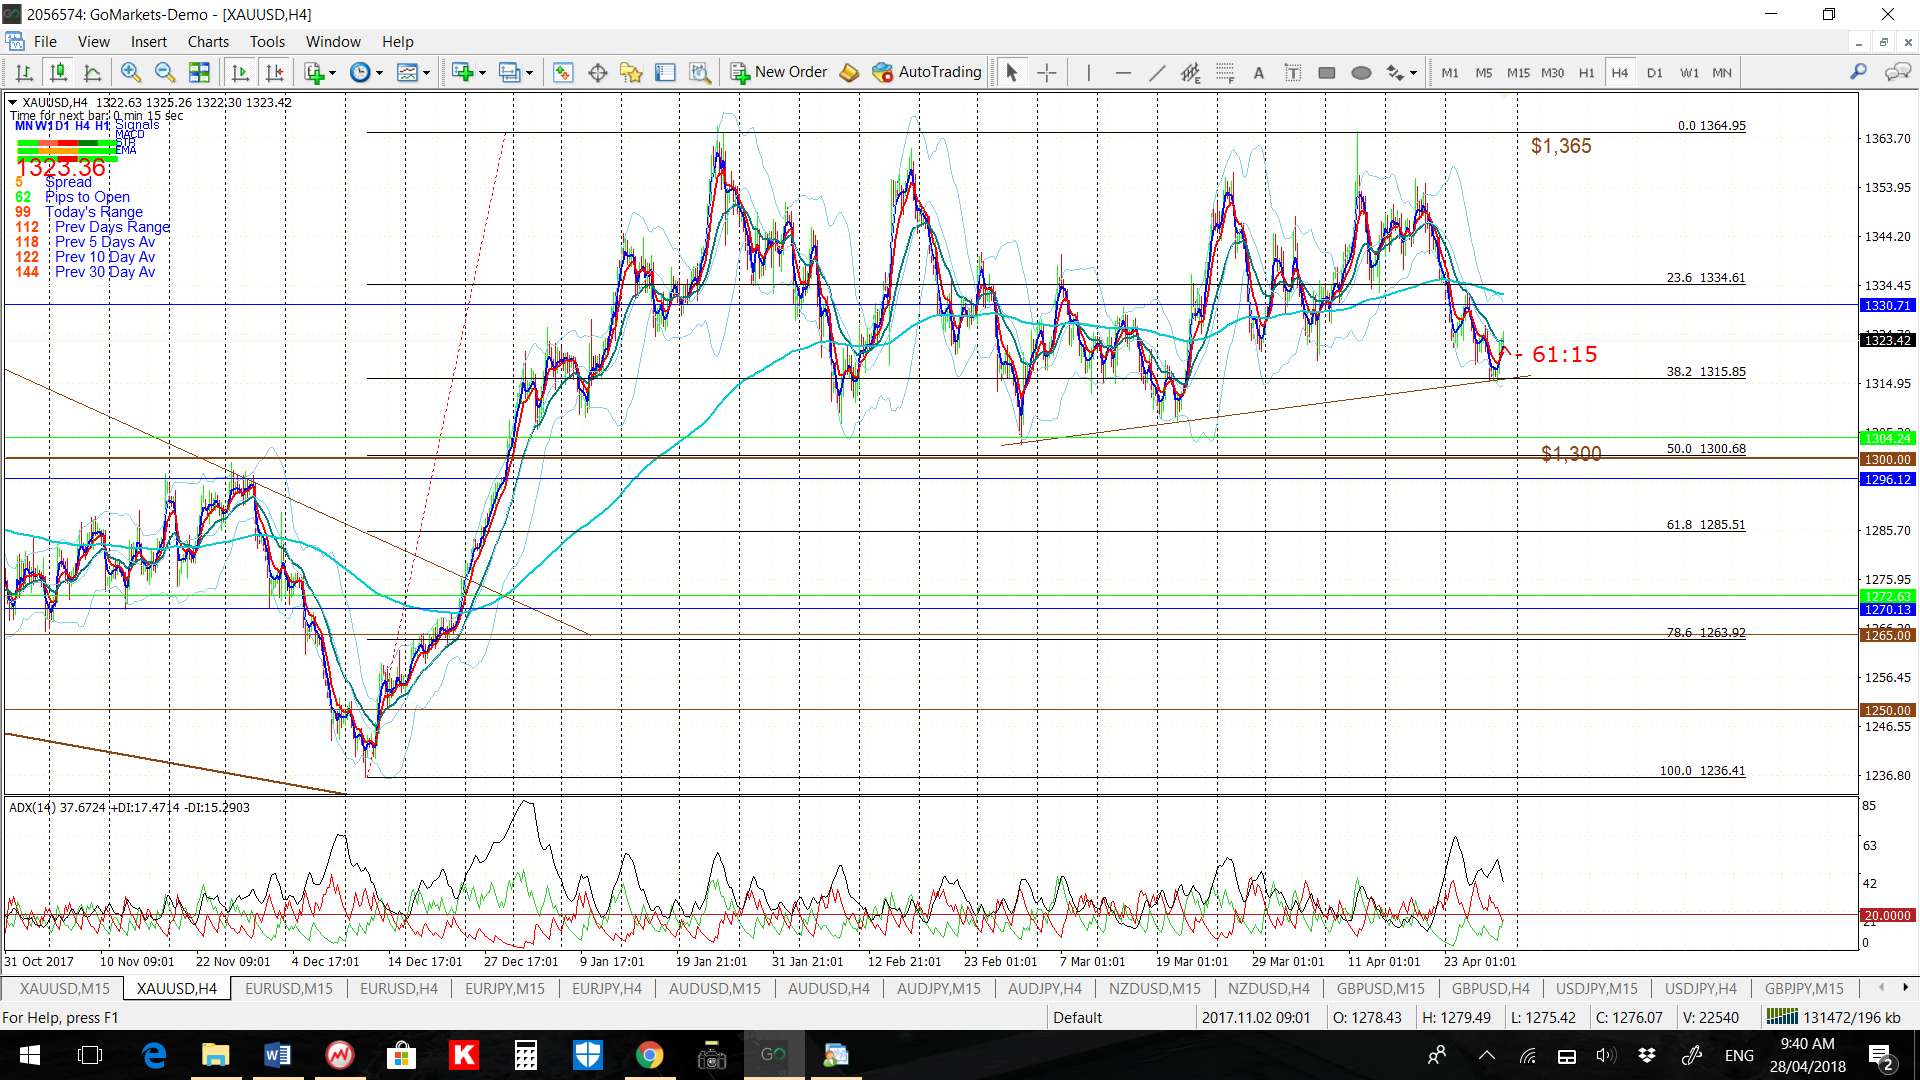
Gold: Gold has been consolidating sideways for the last 3 months as it holds within a 4 hr-chart symmetrical wedge pattern of 12-week duration. This wedge has an upper boundary at $1,365 and this would be the first of the upper levels to watch for any new make or break.
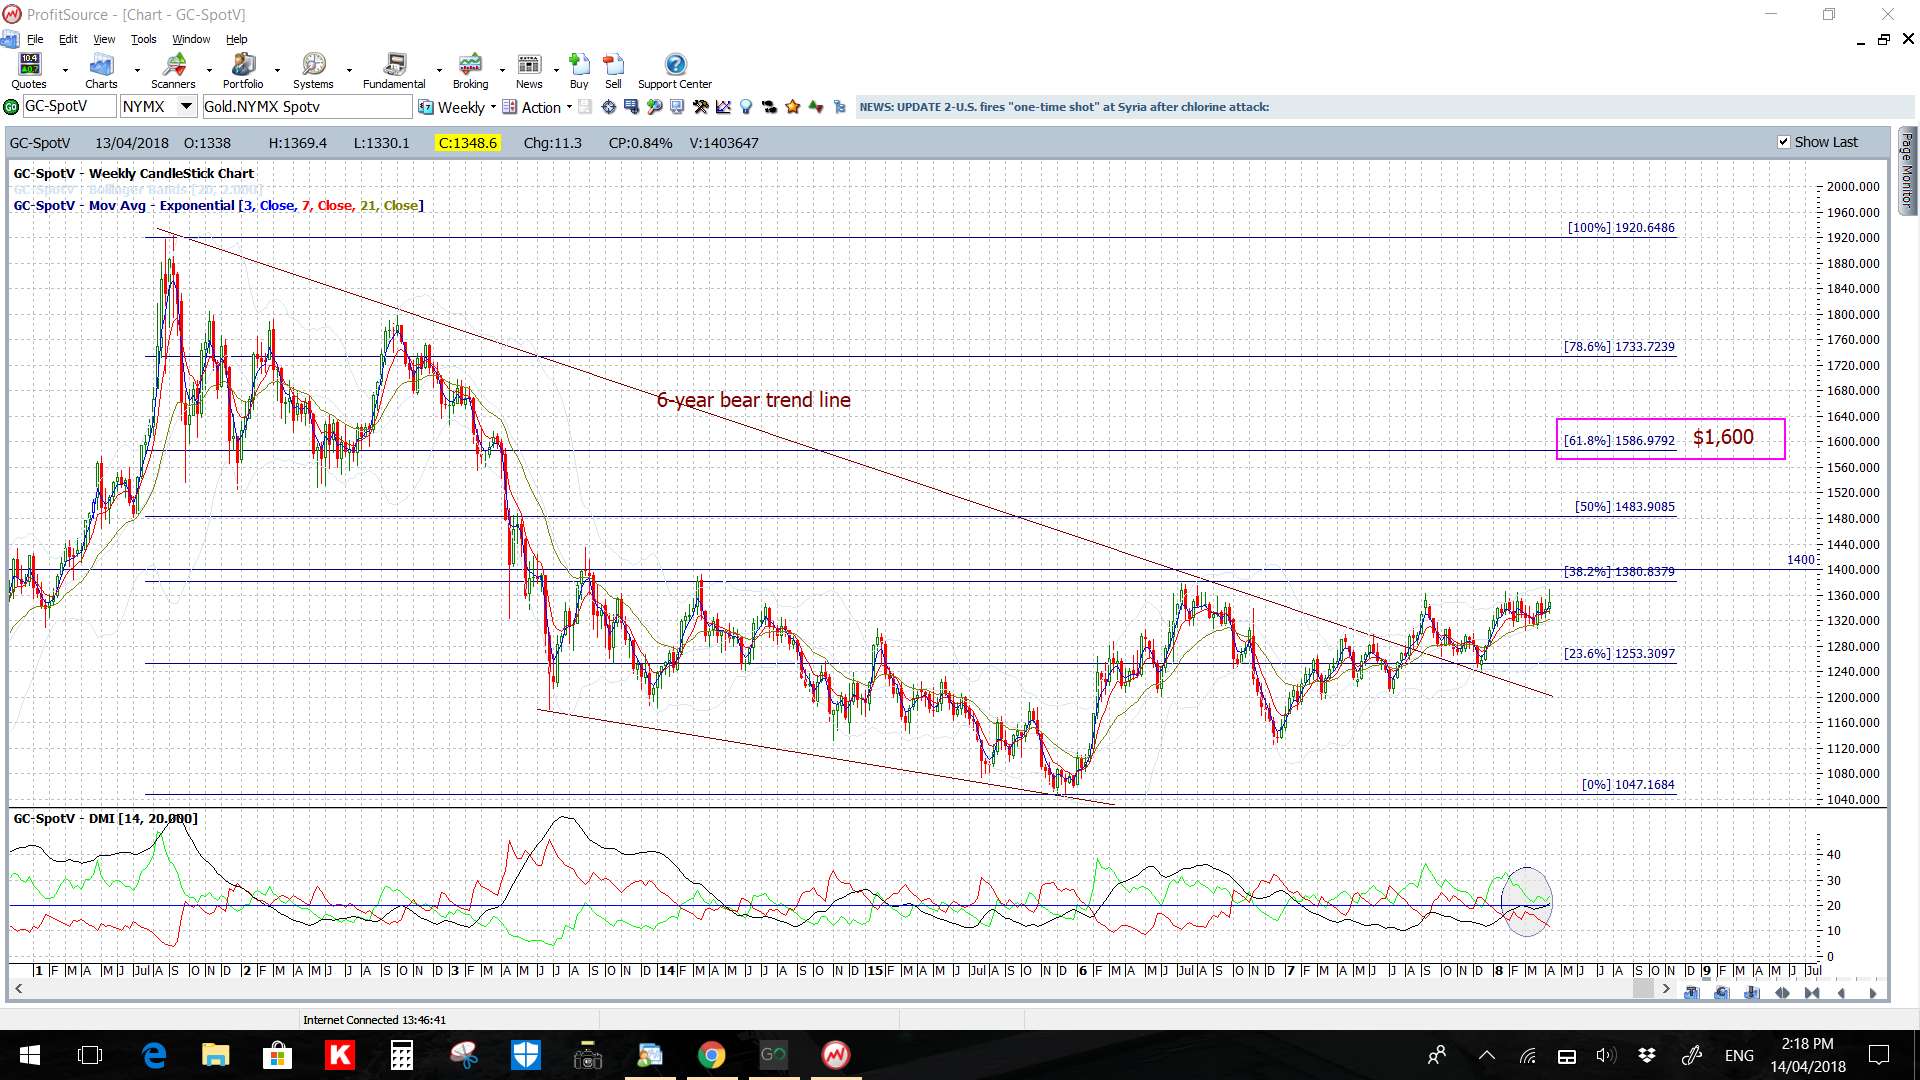
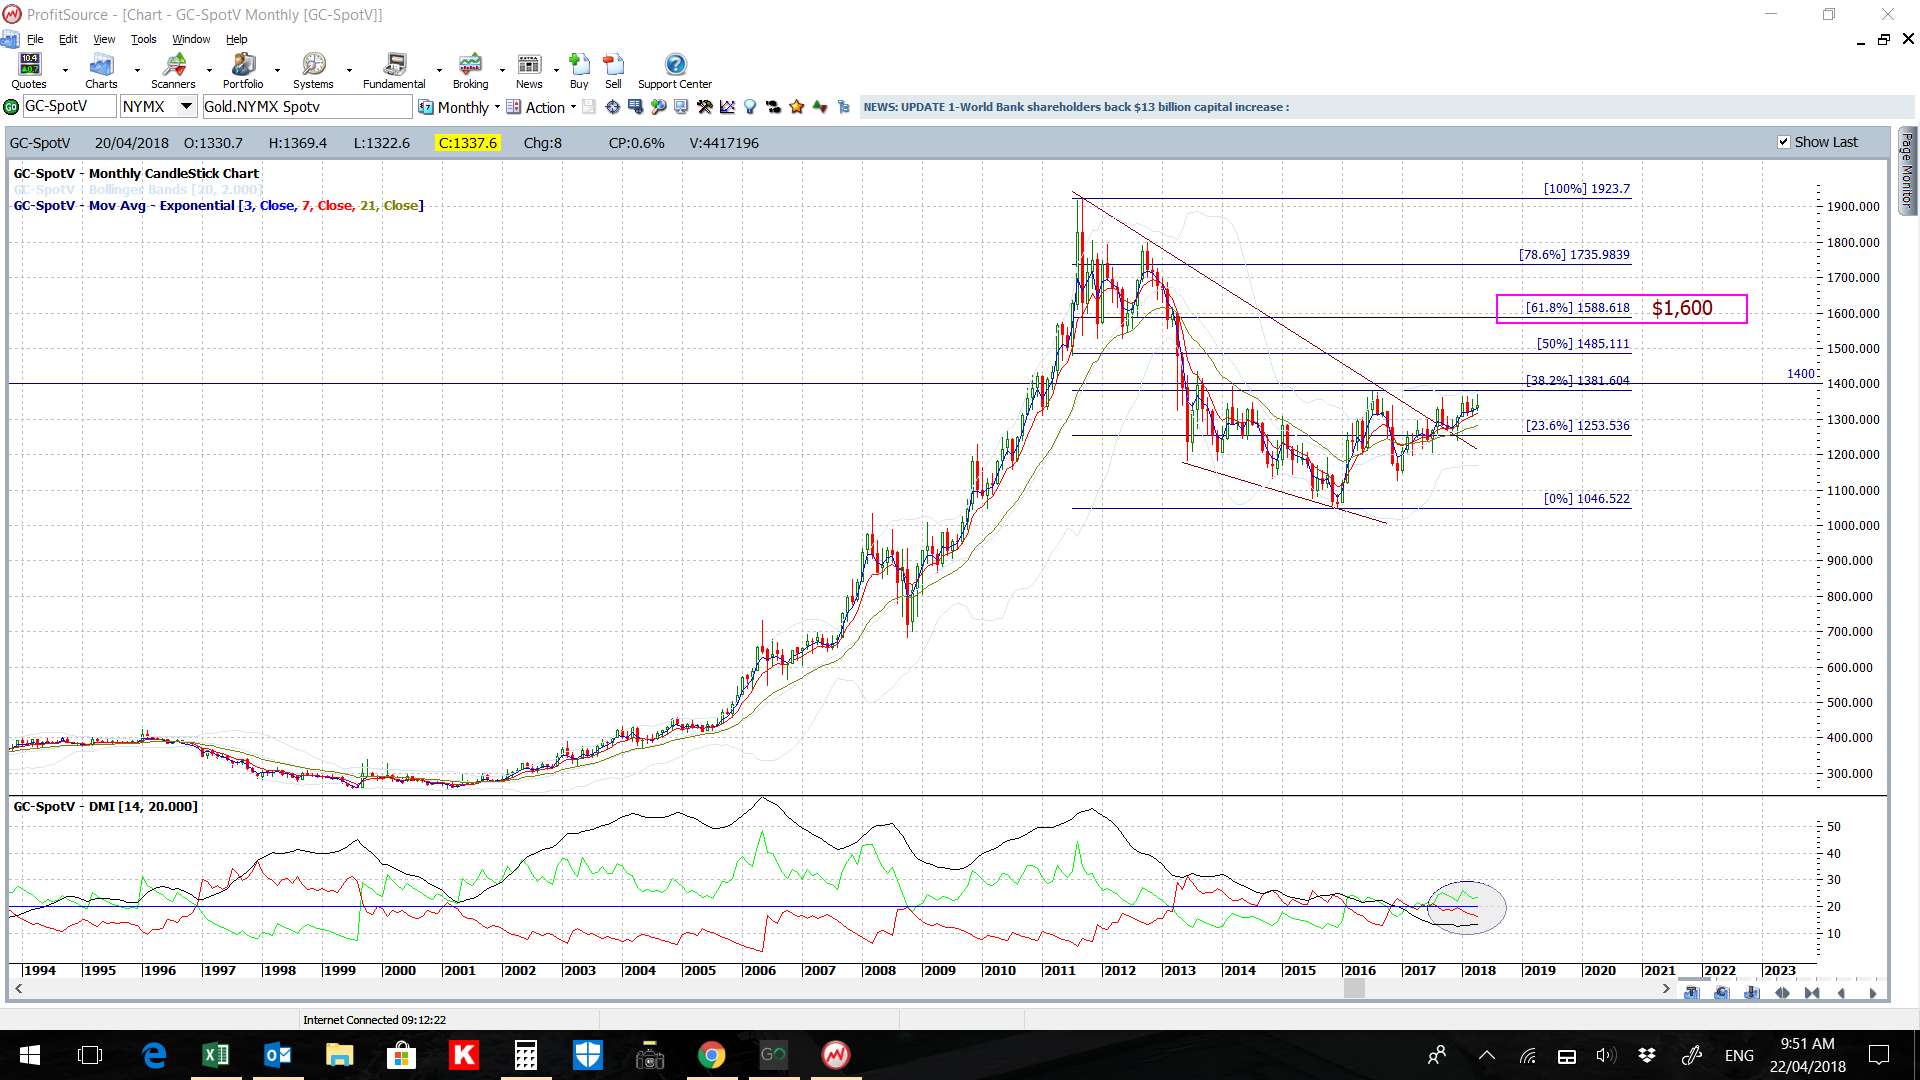
The $1,380 and $1,400 remain as the main S/R levels above $1,365 and these two will be in greater focus if there is a ‘Flight to Safety’ move into the precious metal. Any close and hold above $1,400 would bring the $1,600 level into focus as this is the weekly/monthly chart’s 61.8% fib region.
Momentum on the 4hr Gold chart at the close of the week was low but I expect that might change at market open.
Bullish Targets: any wedge breakout above $1,365 would bring $1,380 and $1,400 into focus.
Bearish Targets: any break below the first support trend line would bring the various other 4hr chart support trend lines into focus followed by the $1,300 S/R level.
- Watch for any 4hr chart wedge breakout.


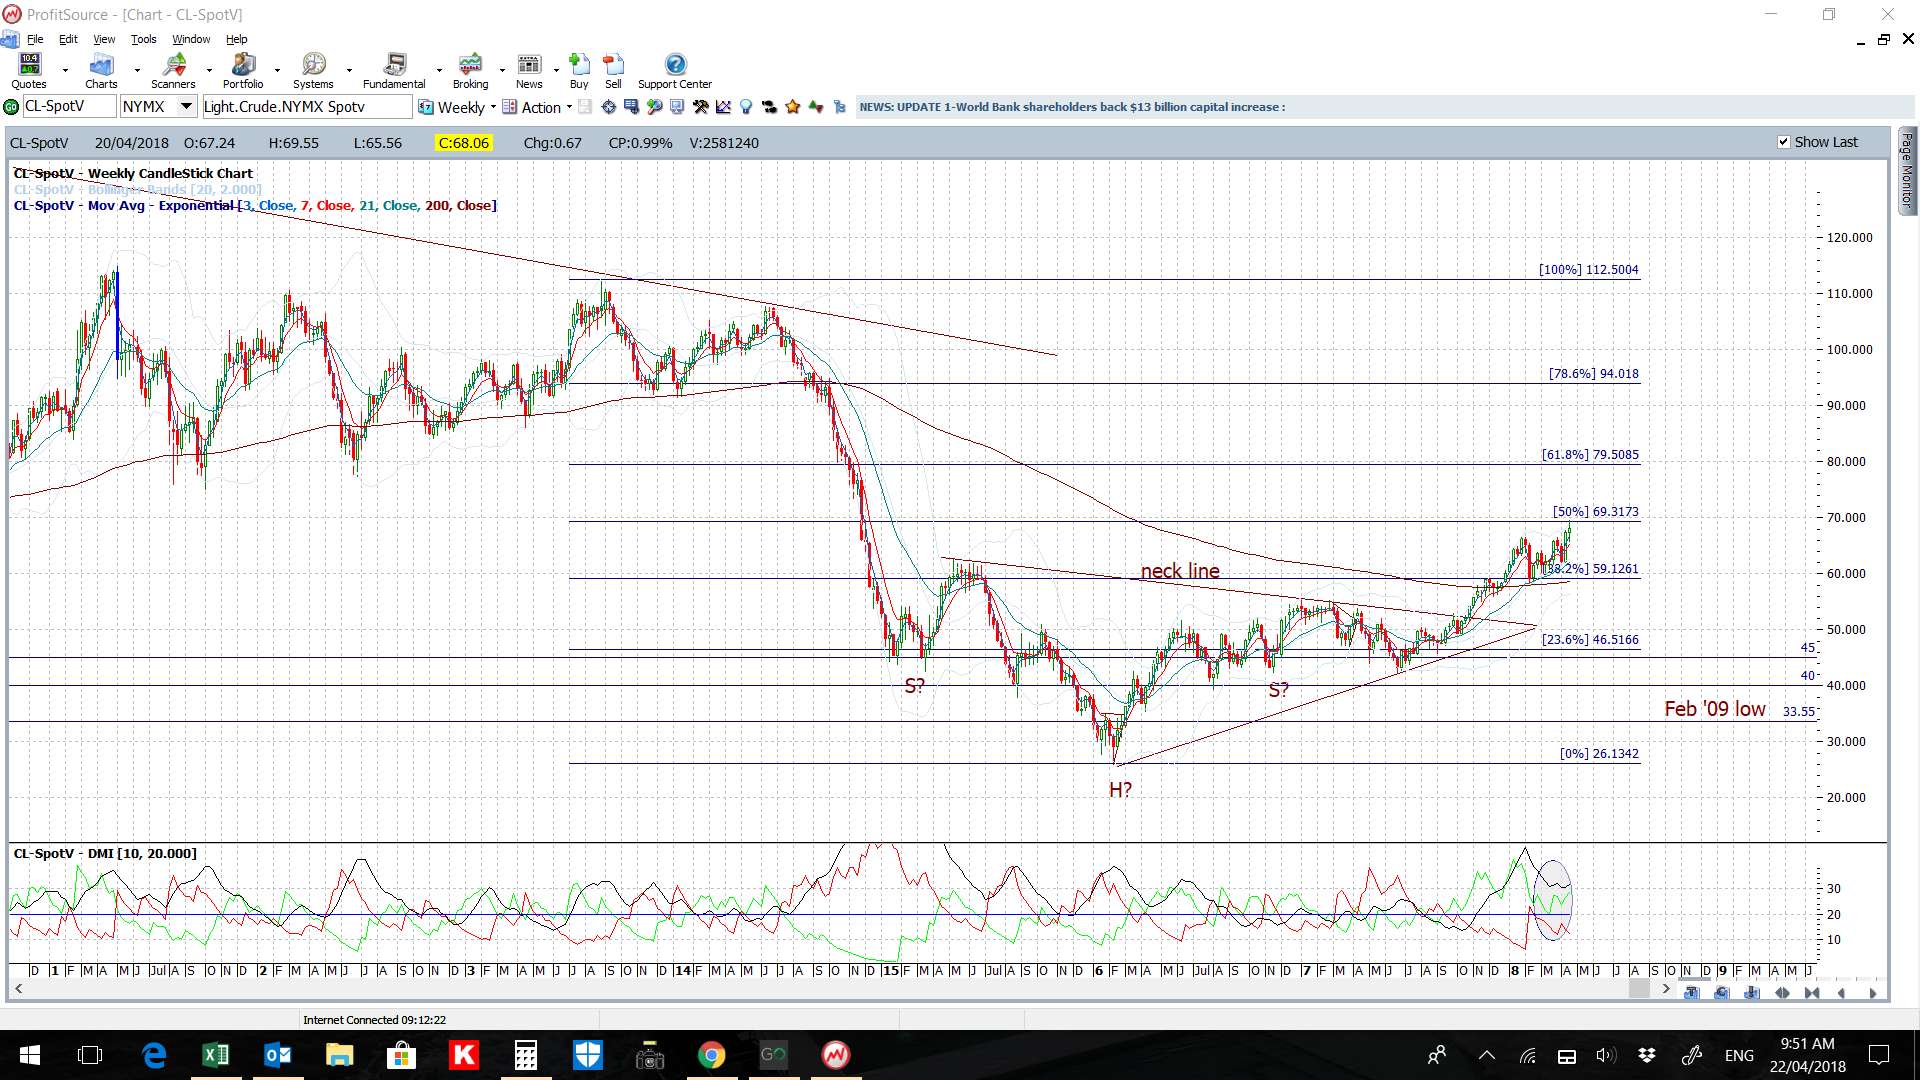
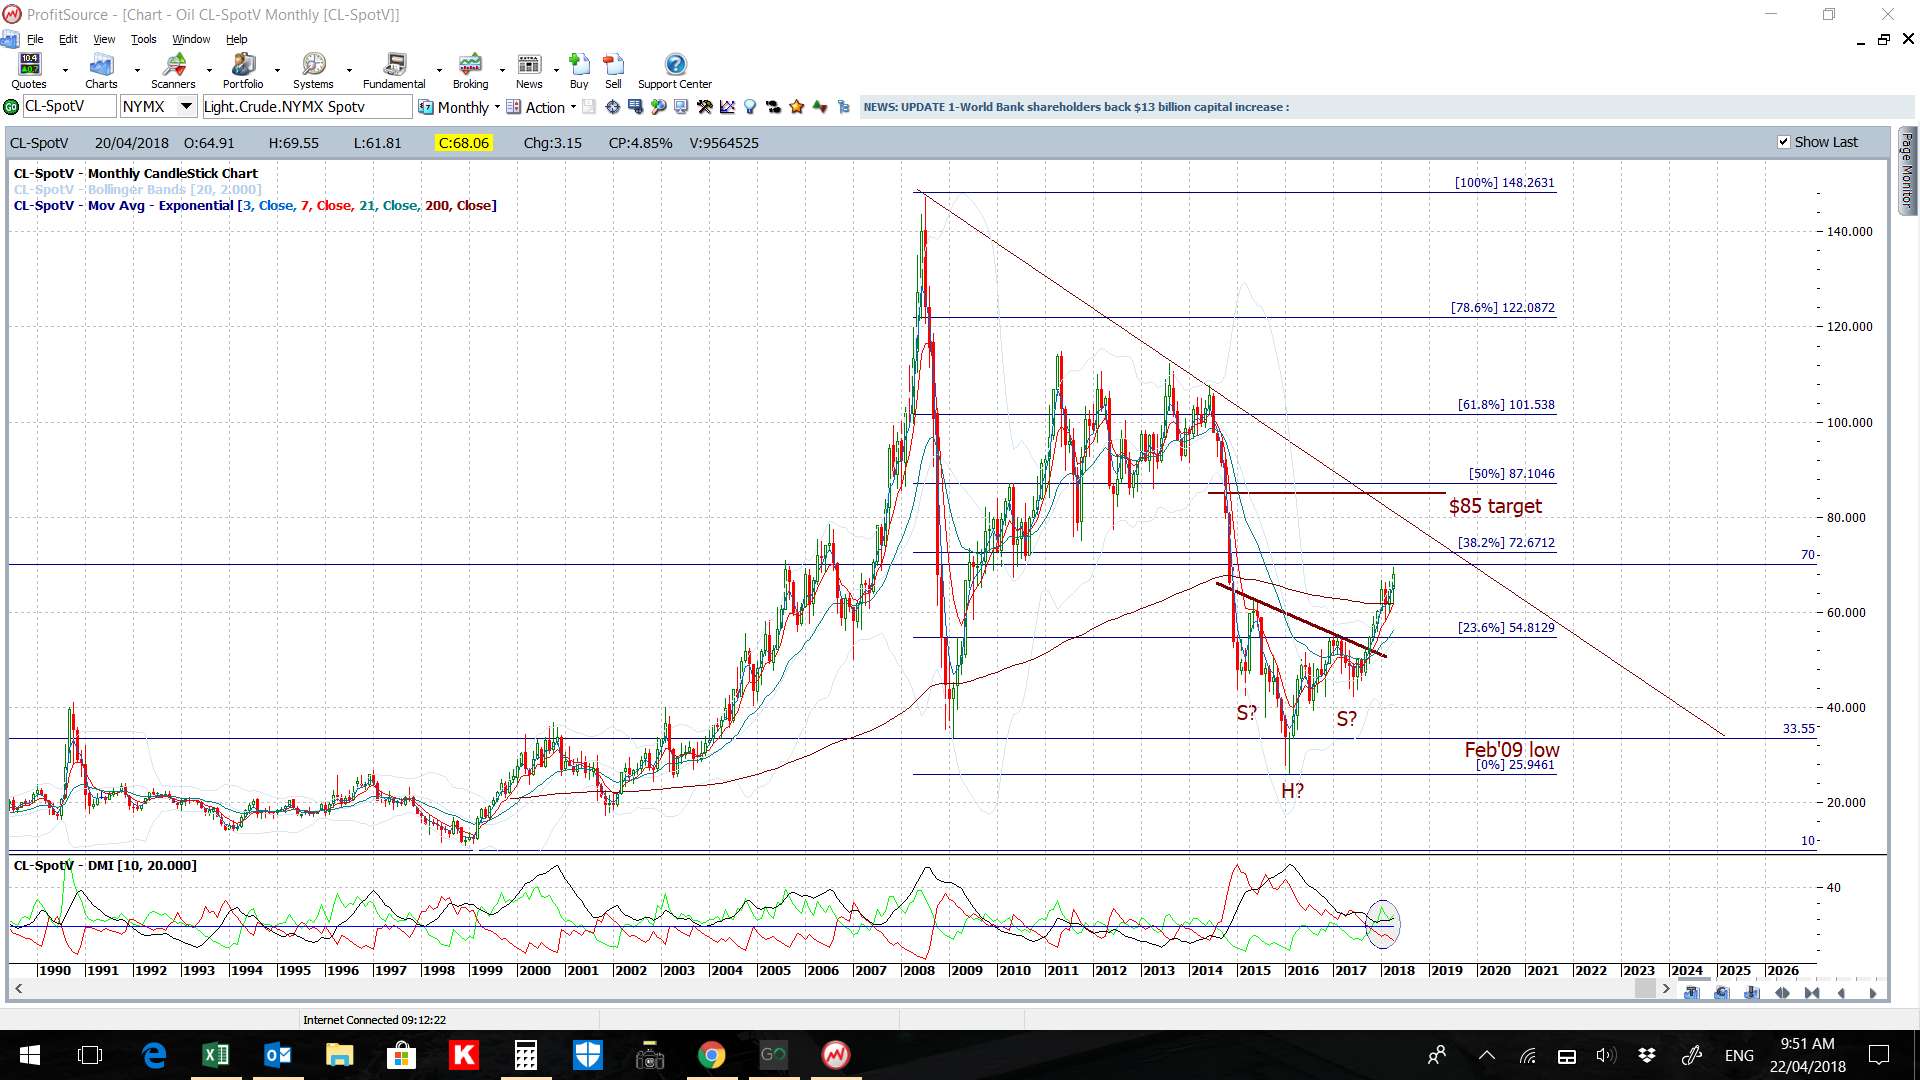
Oil: Oil had a very bullish week and closed with a large bullish, almost ‘engulfing’, weekly candle and I would expect that any ongoing Syrian conflict might help to underpin Oil.
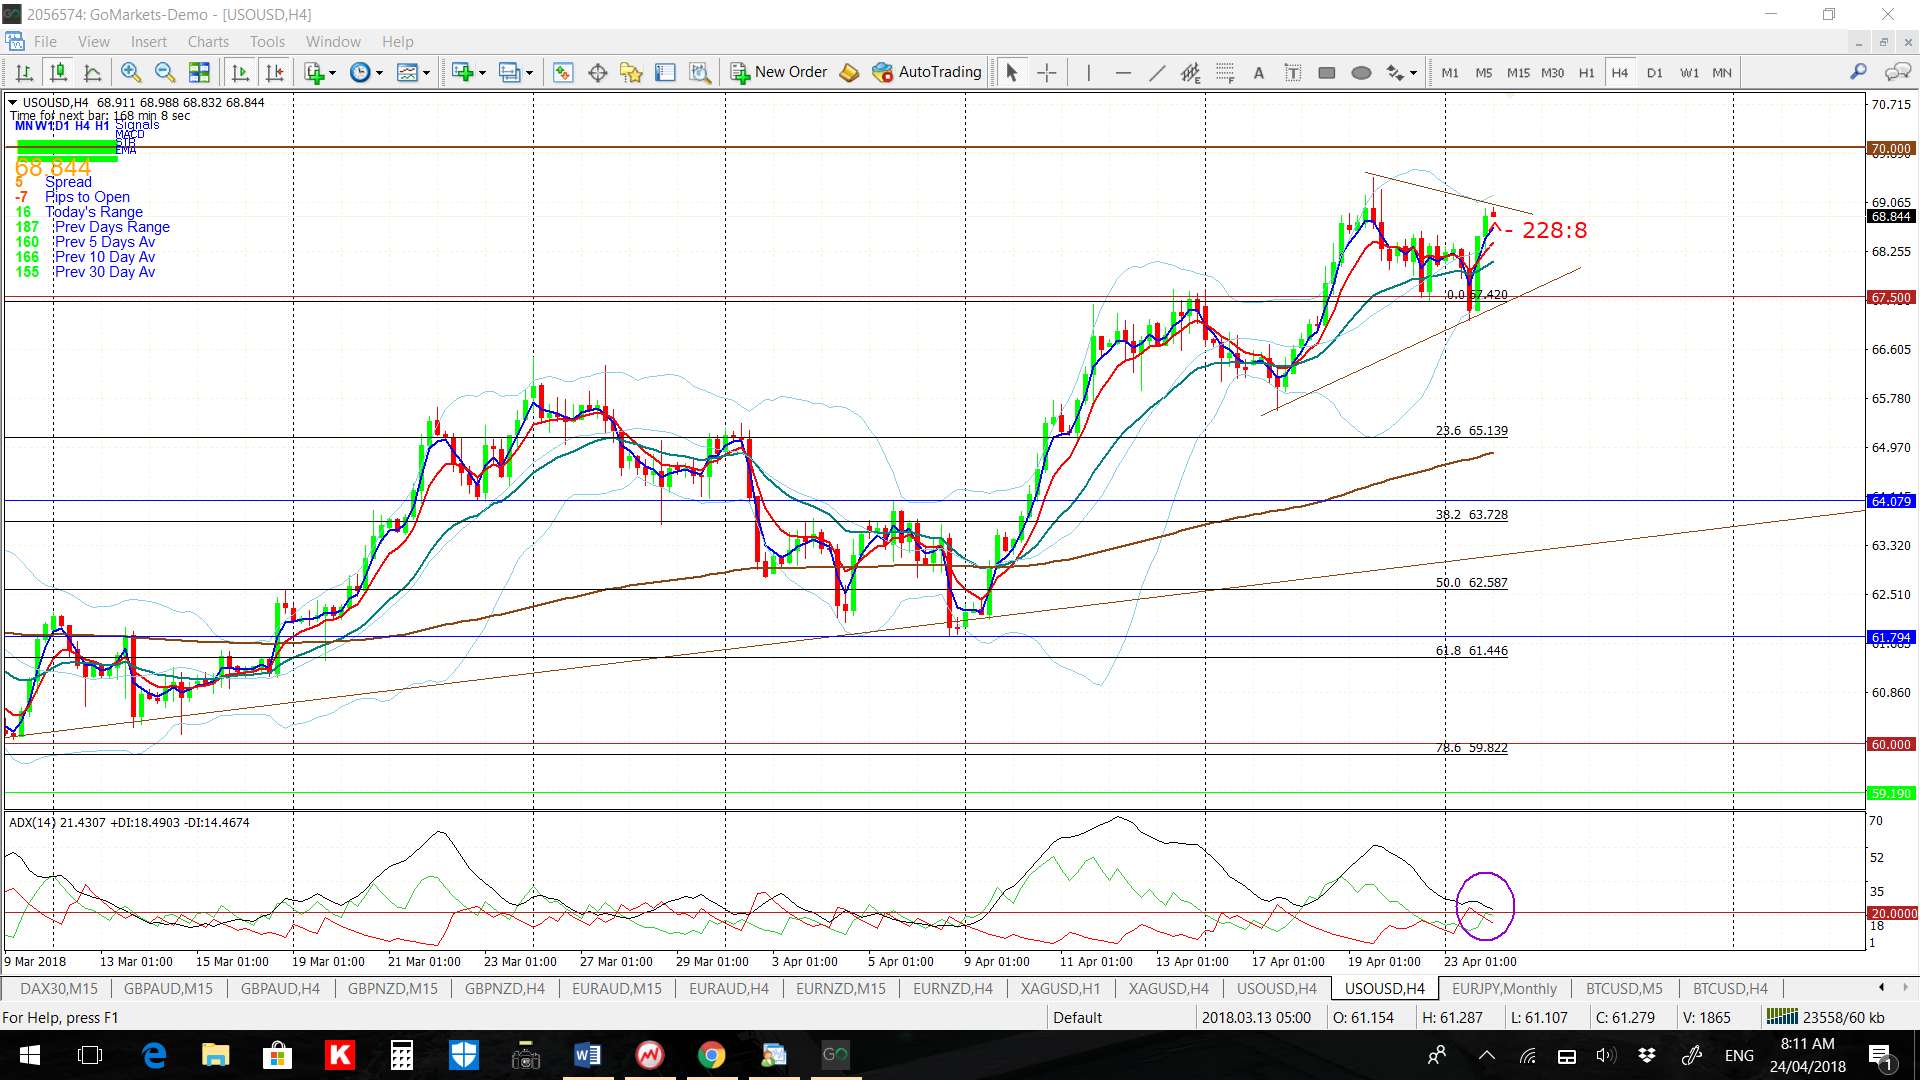
Price action closed near $67.50 but it is the $70 level just above that is in greater focus. The $70 level is previous S/R and is also the weekly charts 50% Fib level. Any break and hold above the $70 level would then bring the 61.8% fib, near $80, into greater focus.
Recall, there has been a bullish ‘Inverse Head and Shoulder’ in play here for some months now and the target for this pattern is near $85.
Bullish Targets: Any close and hold above $67.50 would bring $70, then $80 (whole-number) and $85 into focus.
Bearish Targets: Any break and hold below the 4hr chart’s support trend line would bring the weekly 200 EMA into focus as this is also near the recent Low.
- Watch the 4hr chart trend lines and $67.50 for any new breakout.

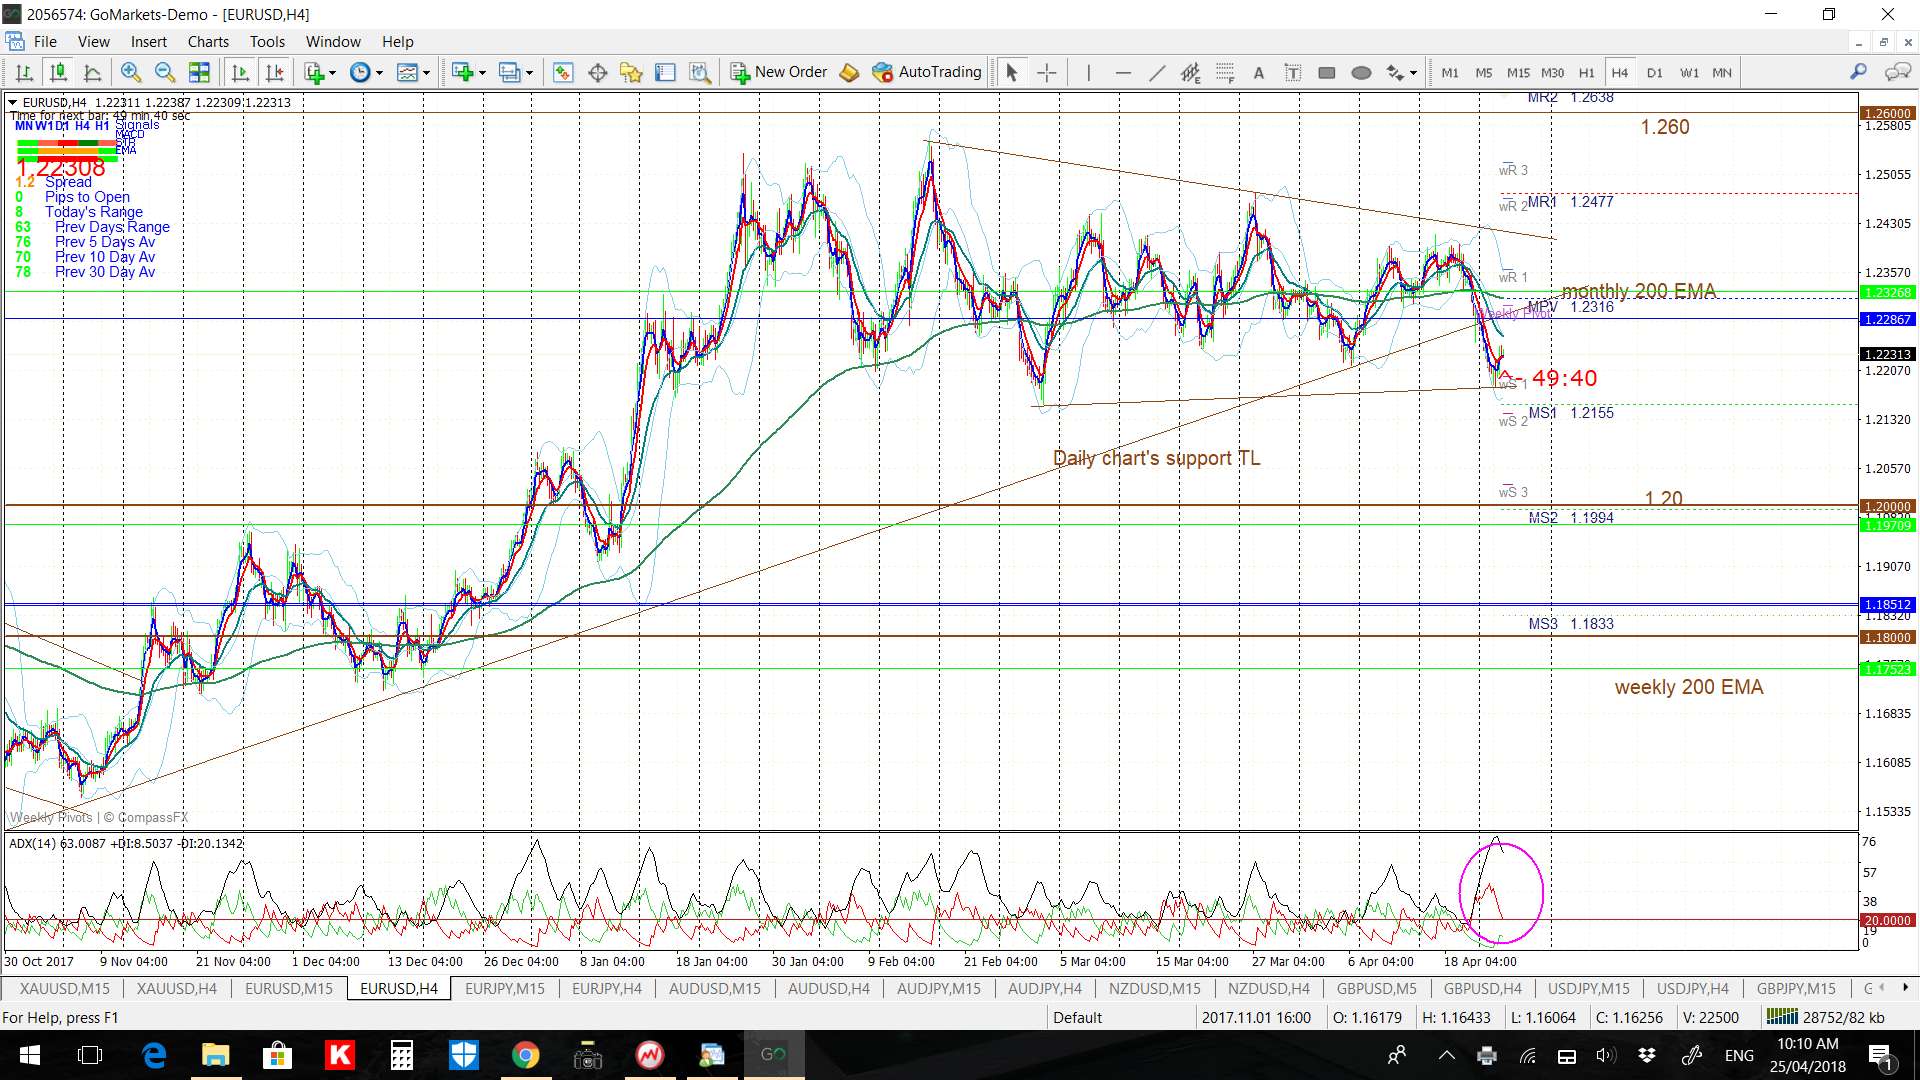
EUR/USD: Yet again, little has changed here with price continuing to hug the monthly 200 EMA and it remains to be seen how this pair will react to the Syrian missile strike news. I would suspect a push higher with the US$ and, hence, this pair lower but one never knows. It depends whether the attack will be viewed with some relief for being decisive action or a harbinger of a more protracted conflict.
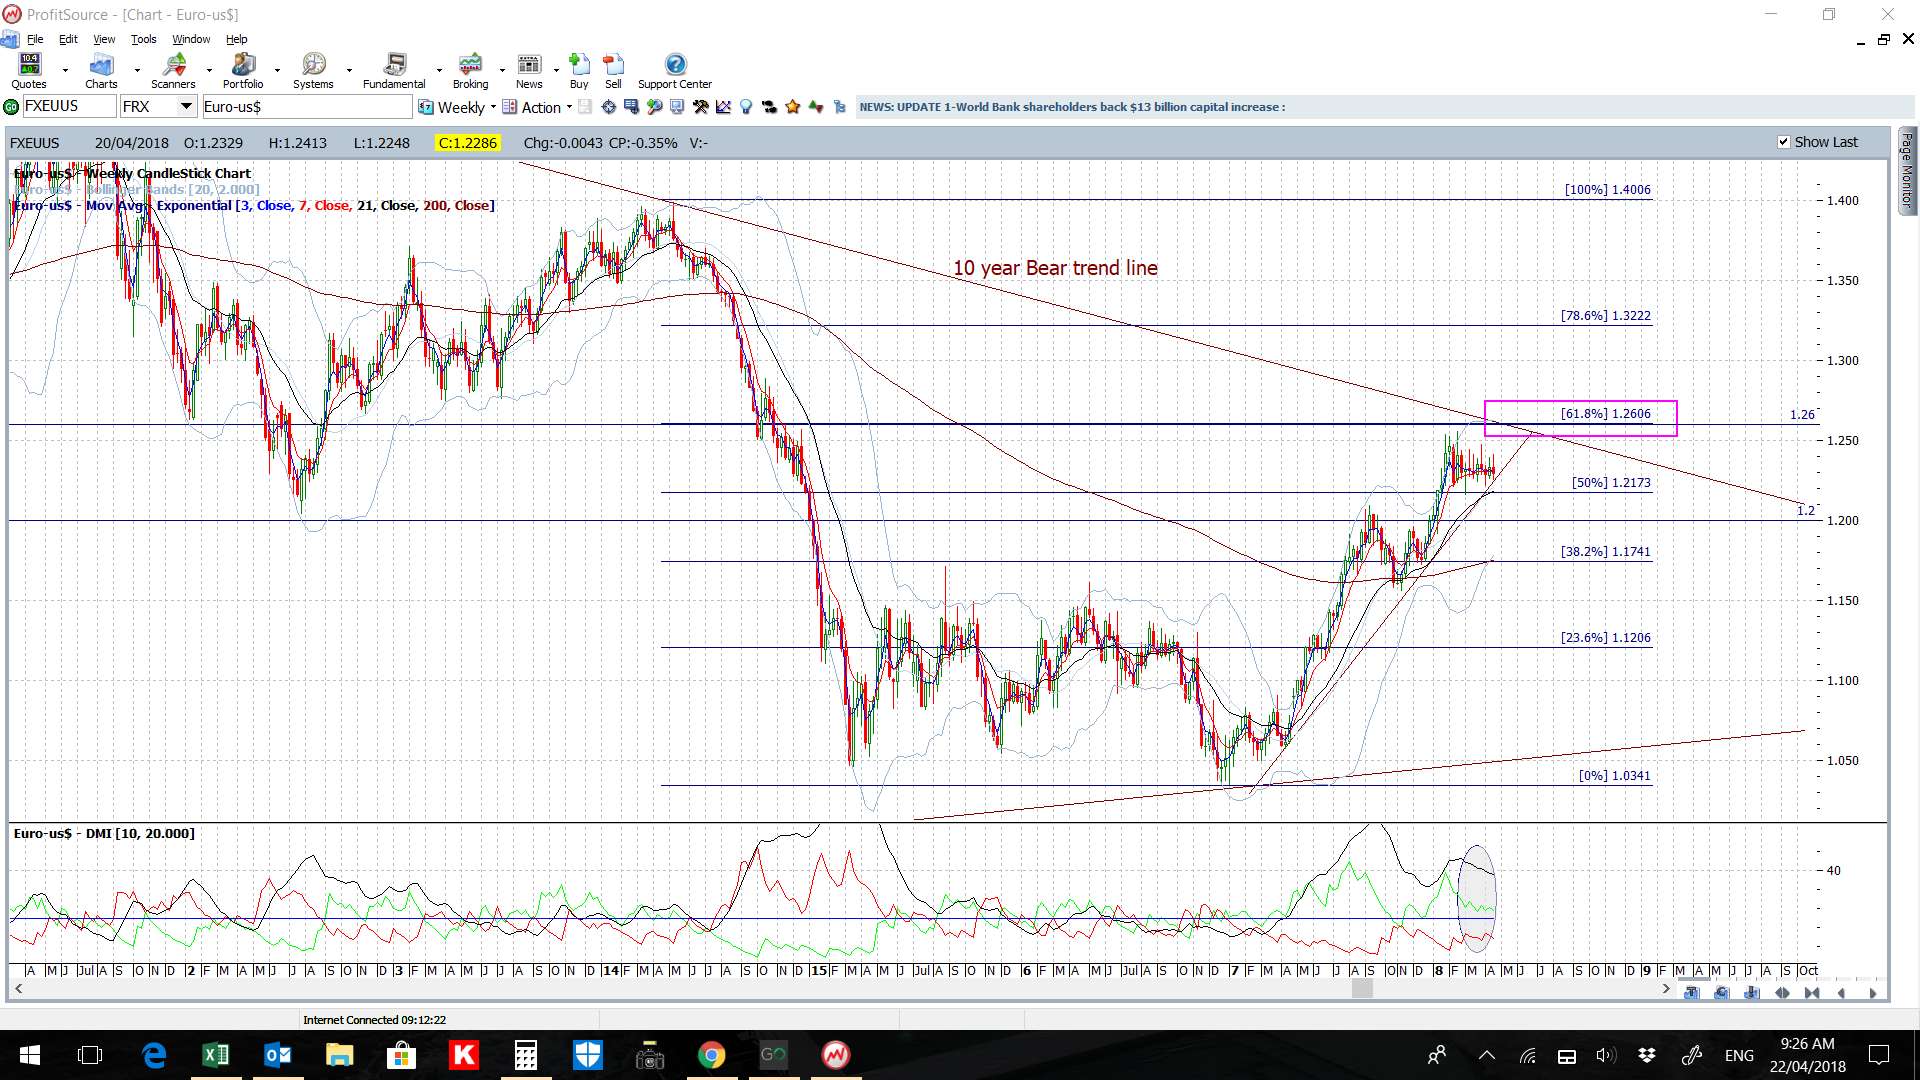
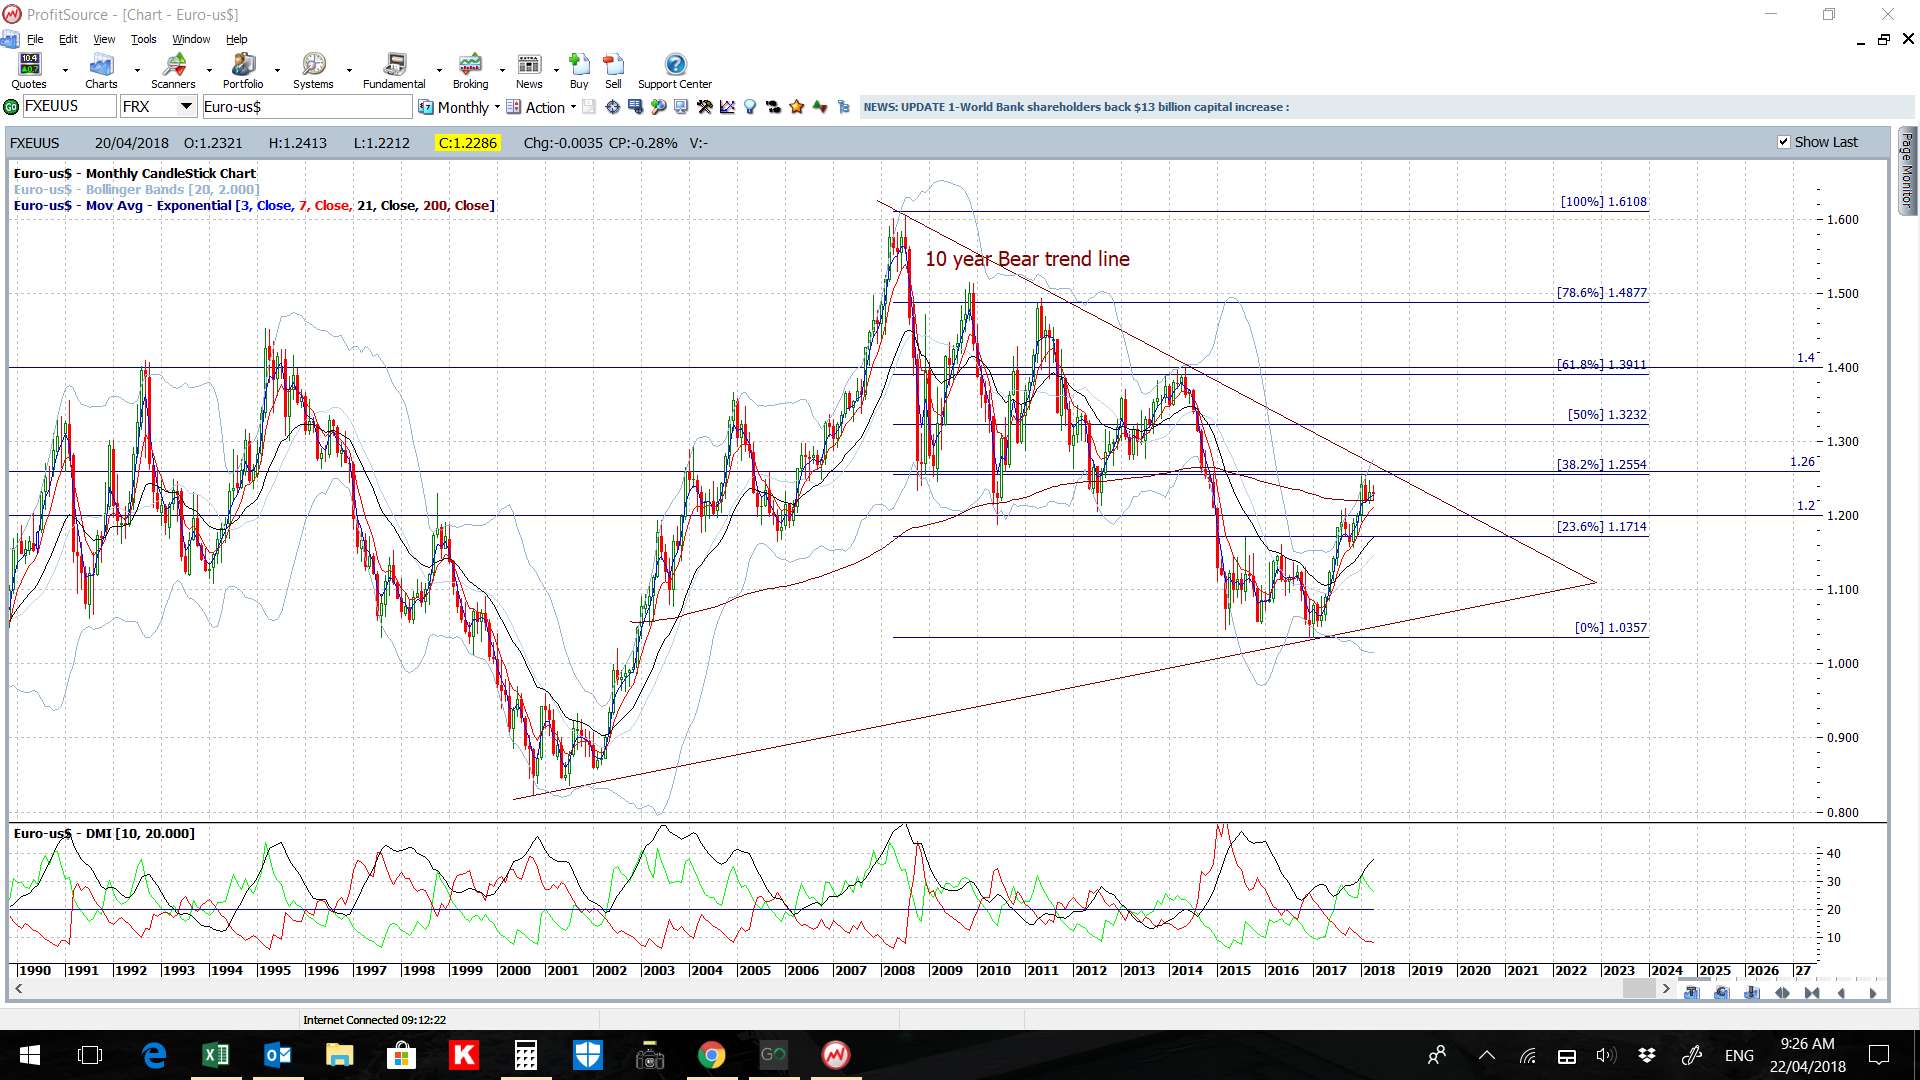
The EUR/USD is still range-bound in a 4hr symmetrical triangle under the key 1.26 level and this pattern is now of 8-weeks duration. As per my commentary over recent weeks, I see all of this as consolidation under this major 1.260 S/R level as this is the weekly chart’s 61.8% fib is nearby and it also intersects with the monthly chart’s 10-year bear trend line. Thus, whilst STILL around 270 pips away, the 1.26 remains the major level to monitor in coming sessions.
Bullish targets: The first target on any bullish 4hr chart triangle breakout would be 1.260 which is about 270 pips away. After that, the 1.40 S/R level would be in focus as this is near the monthly chart’s 61.8% fib. A move from 1.26 to 1.40 comprises about 1,400 pips and so is well worth stalking!
Bearish targets: Any bearish triangle breakout would have me looking for a test of the key 1.20 level.
- Watch the 4hr triangle trend lines for any new breakout:
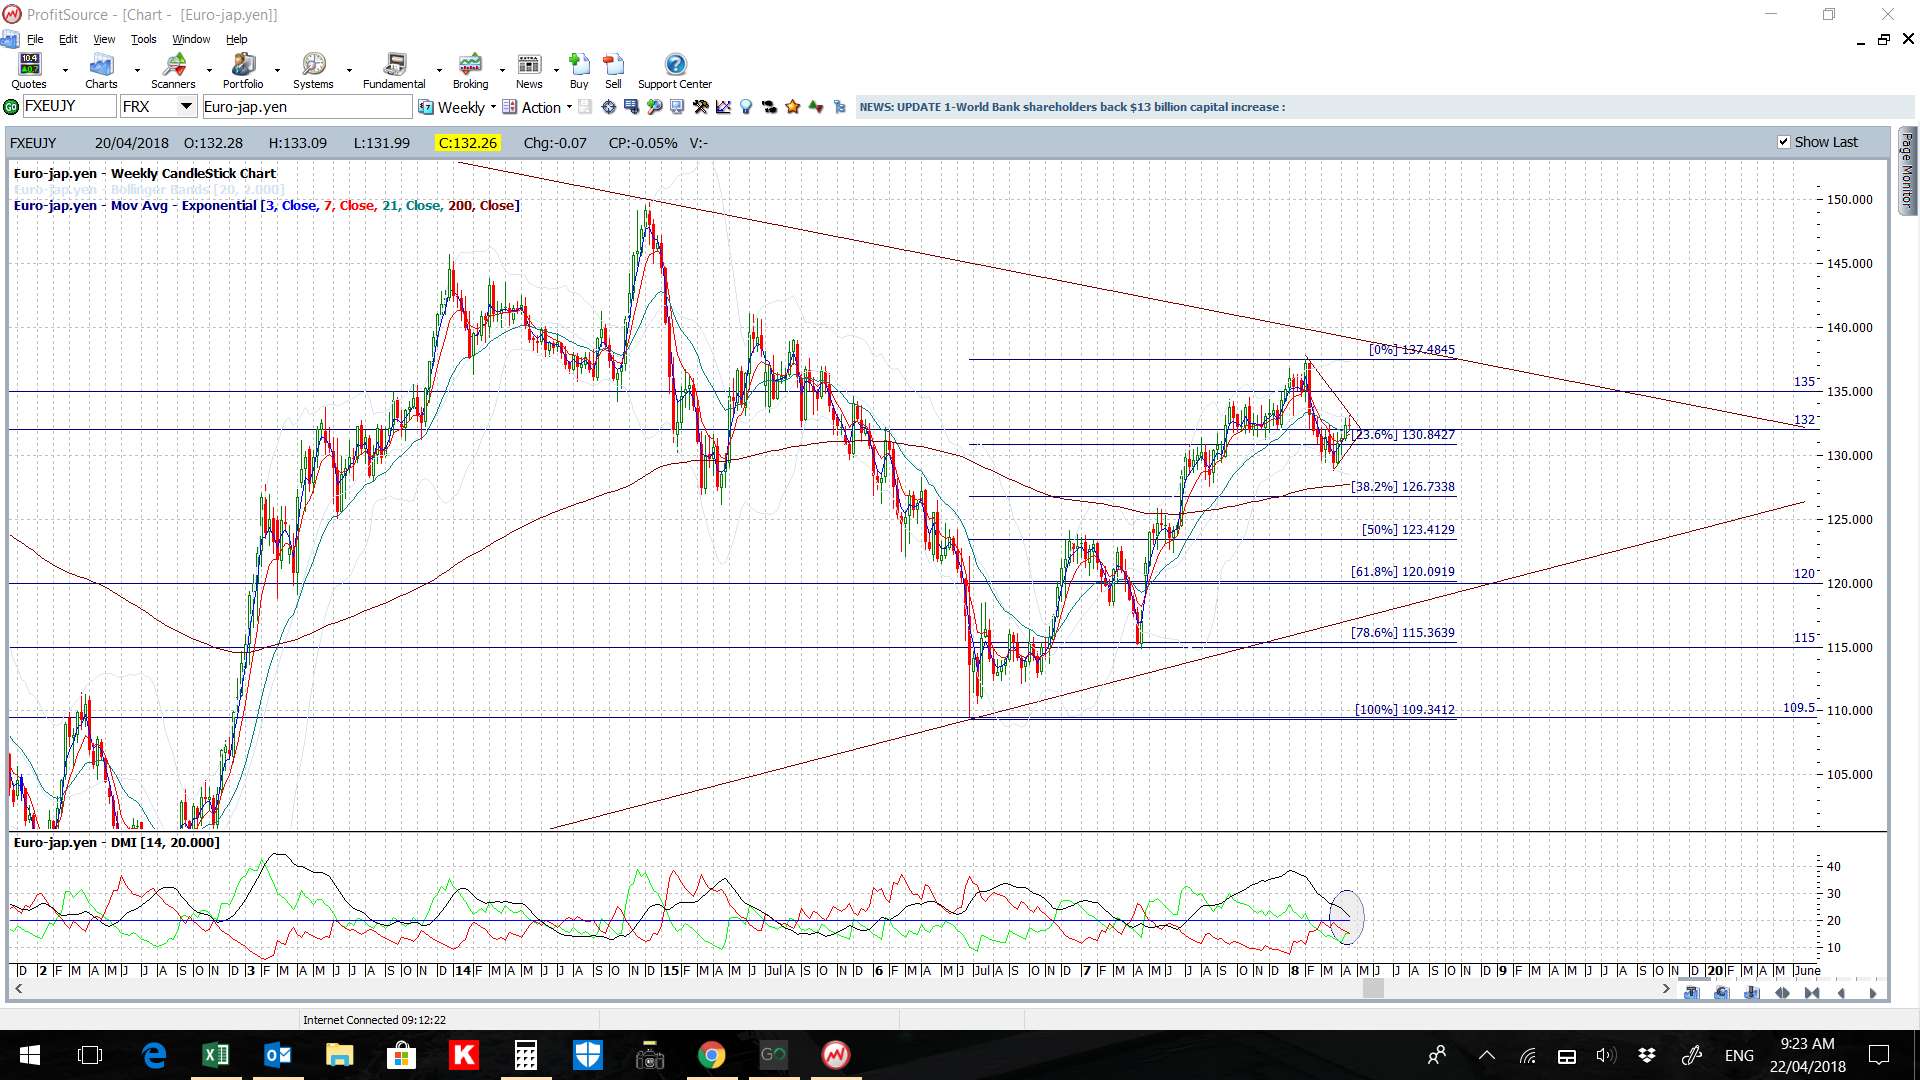
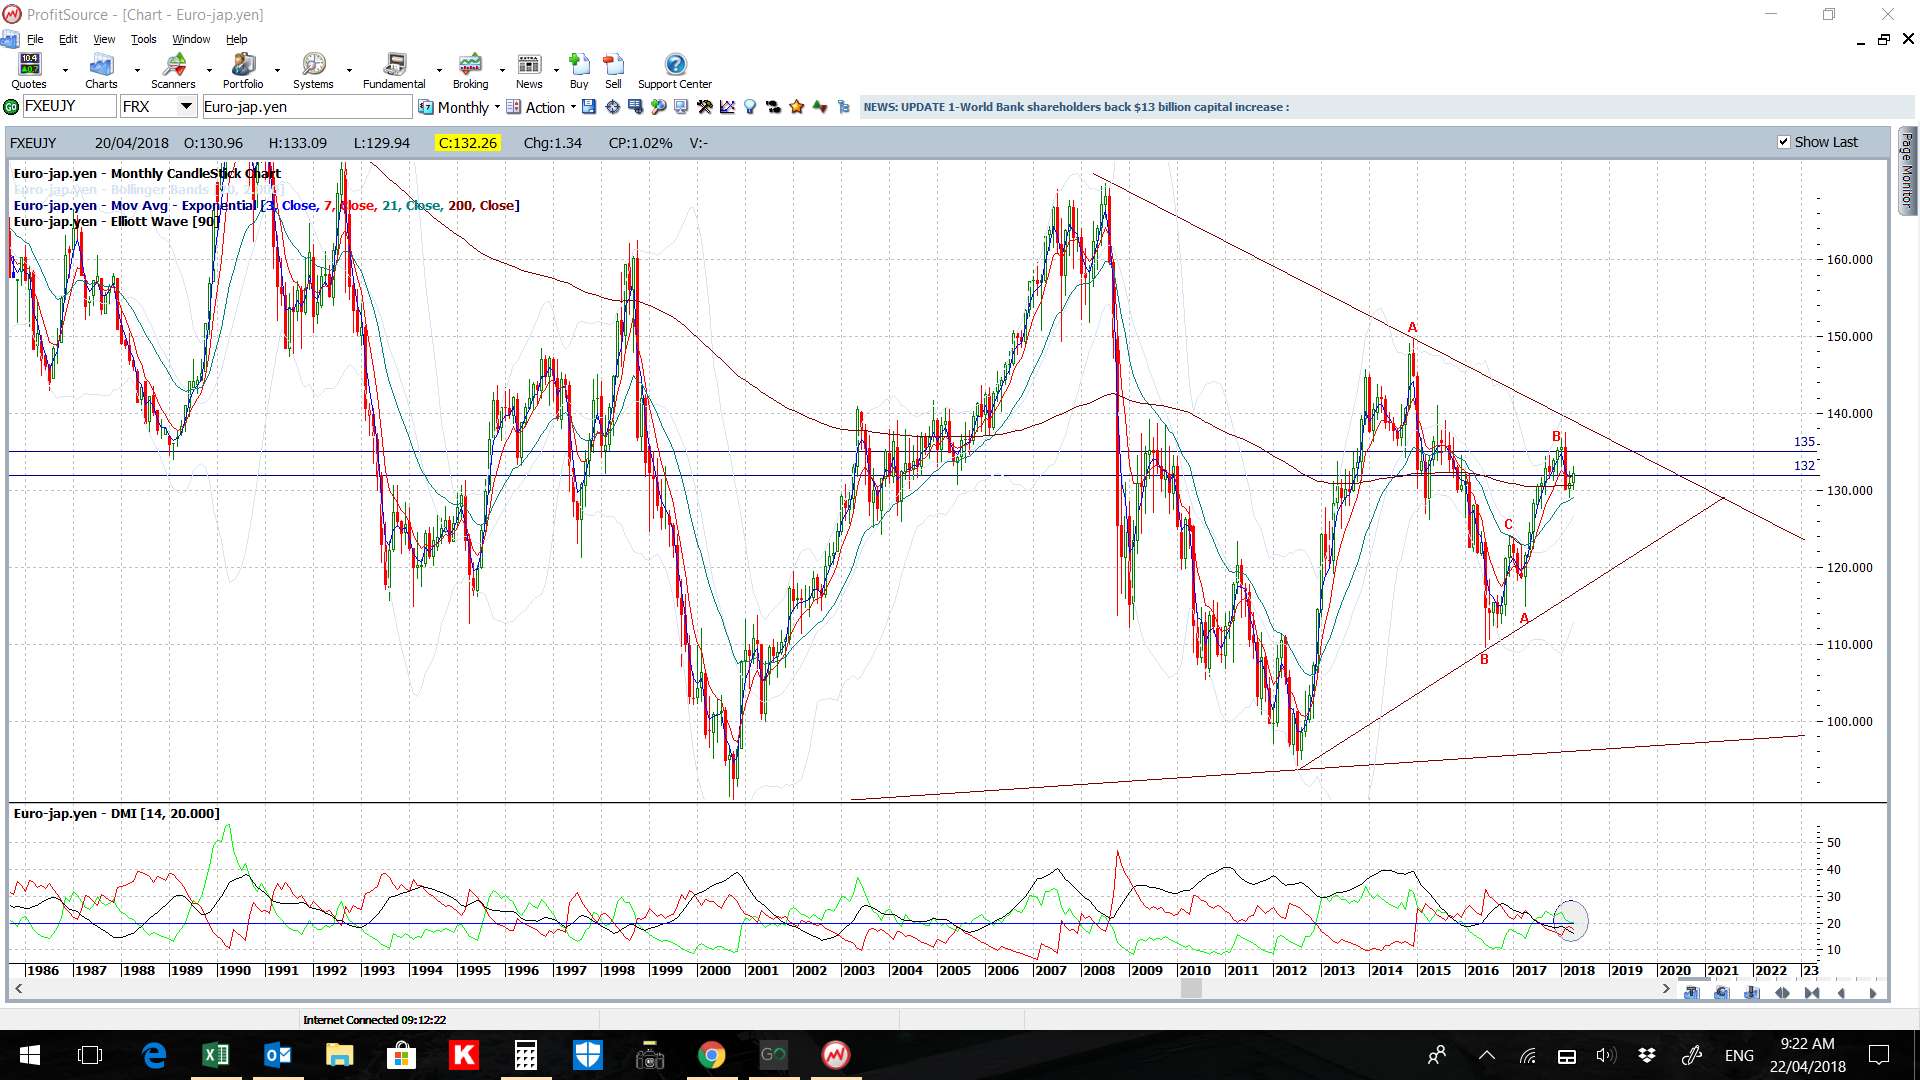
EUR/JPY: I have been watching for a push up to the 135 / 61.8% fib level for weeks now and, whilst it is moving along, it has been a slow process. The weekend news about the Syrian strike could undo these efforts though if there is any Flight to Safety reaction. Thus, watch the 4hr chart trend lines for clues about the next directional move here.
Bullish targets: Any bullish 4hr chart triangle breakout would keep the major 135 S/R level in focus as this is still up near the 4hr chart’s 61.8% fib.
Bearish targets: Any bearish 4hr chart triangle breakout would have me looking to the 130 S/R region and, after that, the 120 region as this is the weekly chart’s 61.8% fib level of the last swing high move.
- Watch the 4hr chart triangle trend lines for any new breakout:

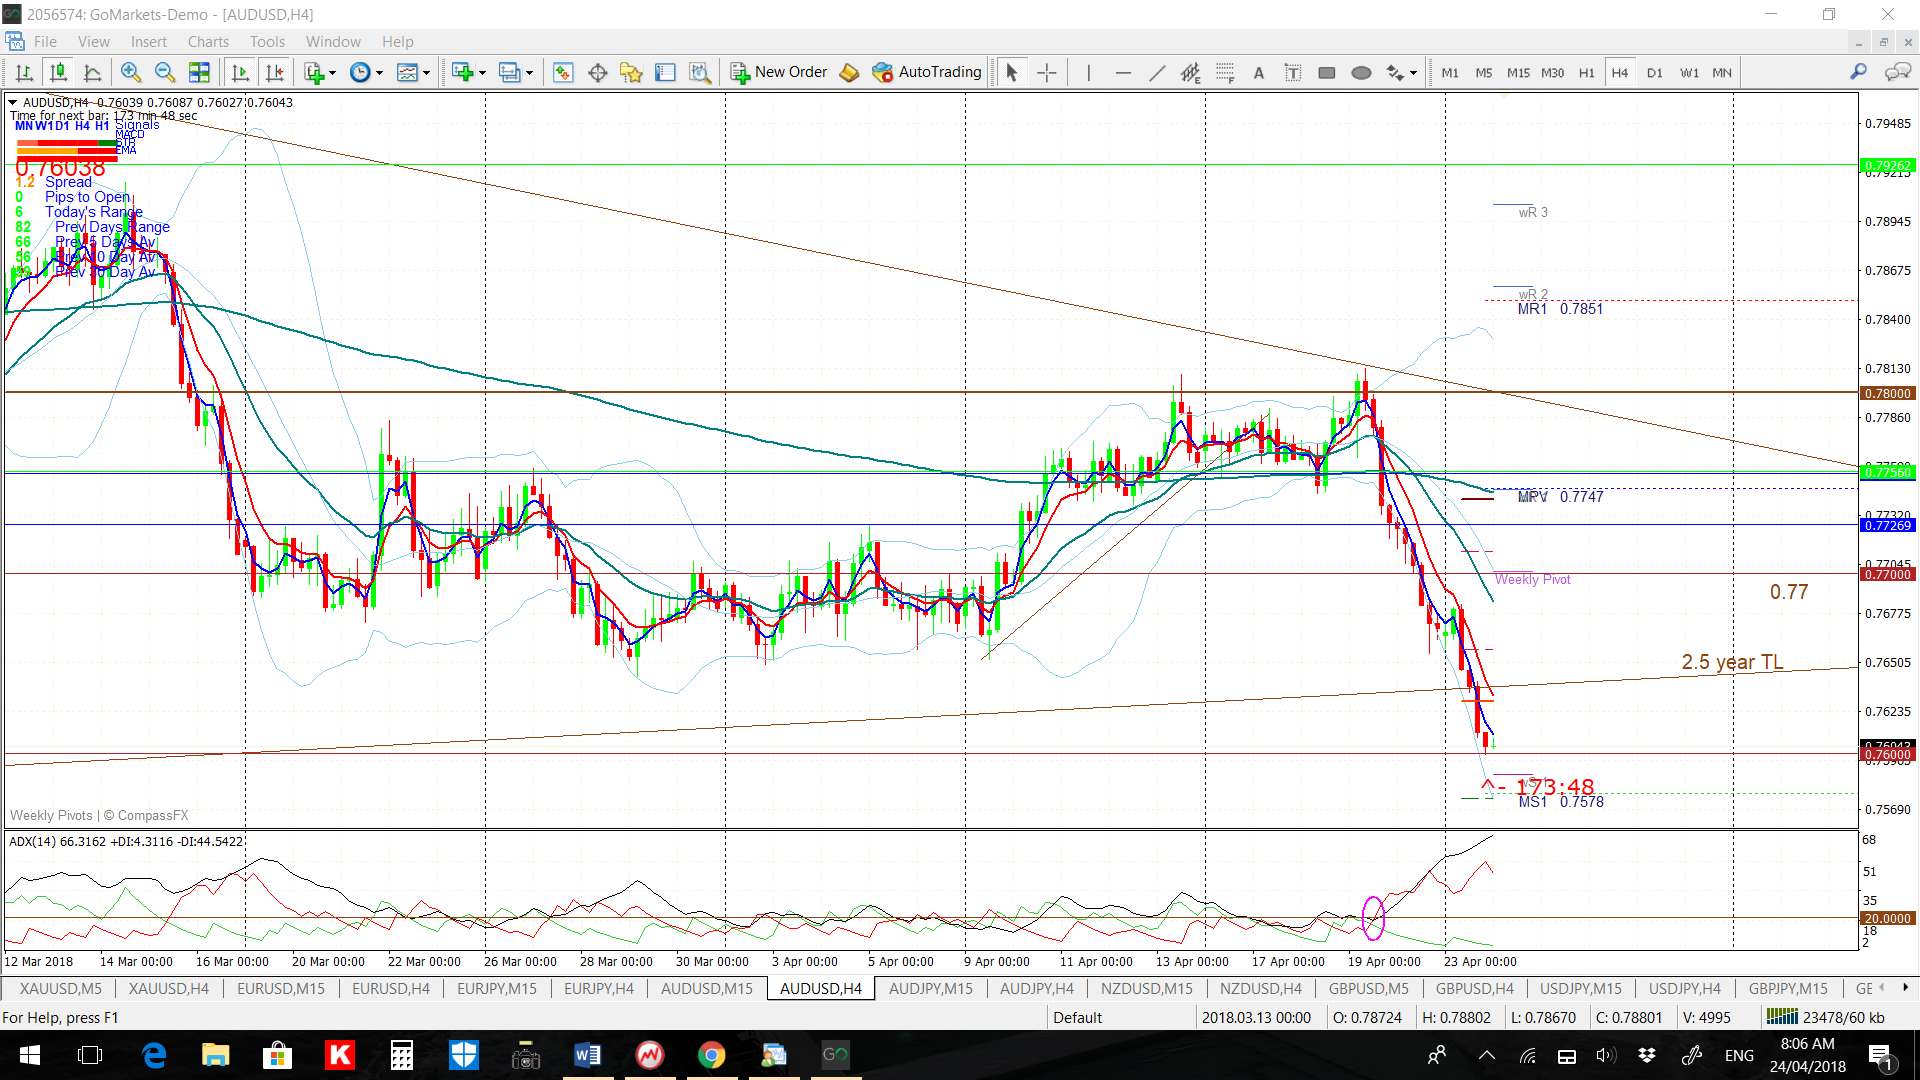
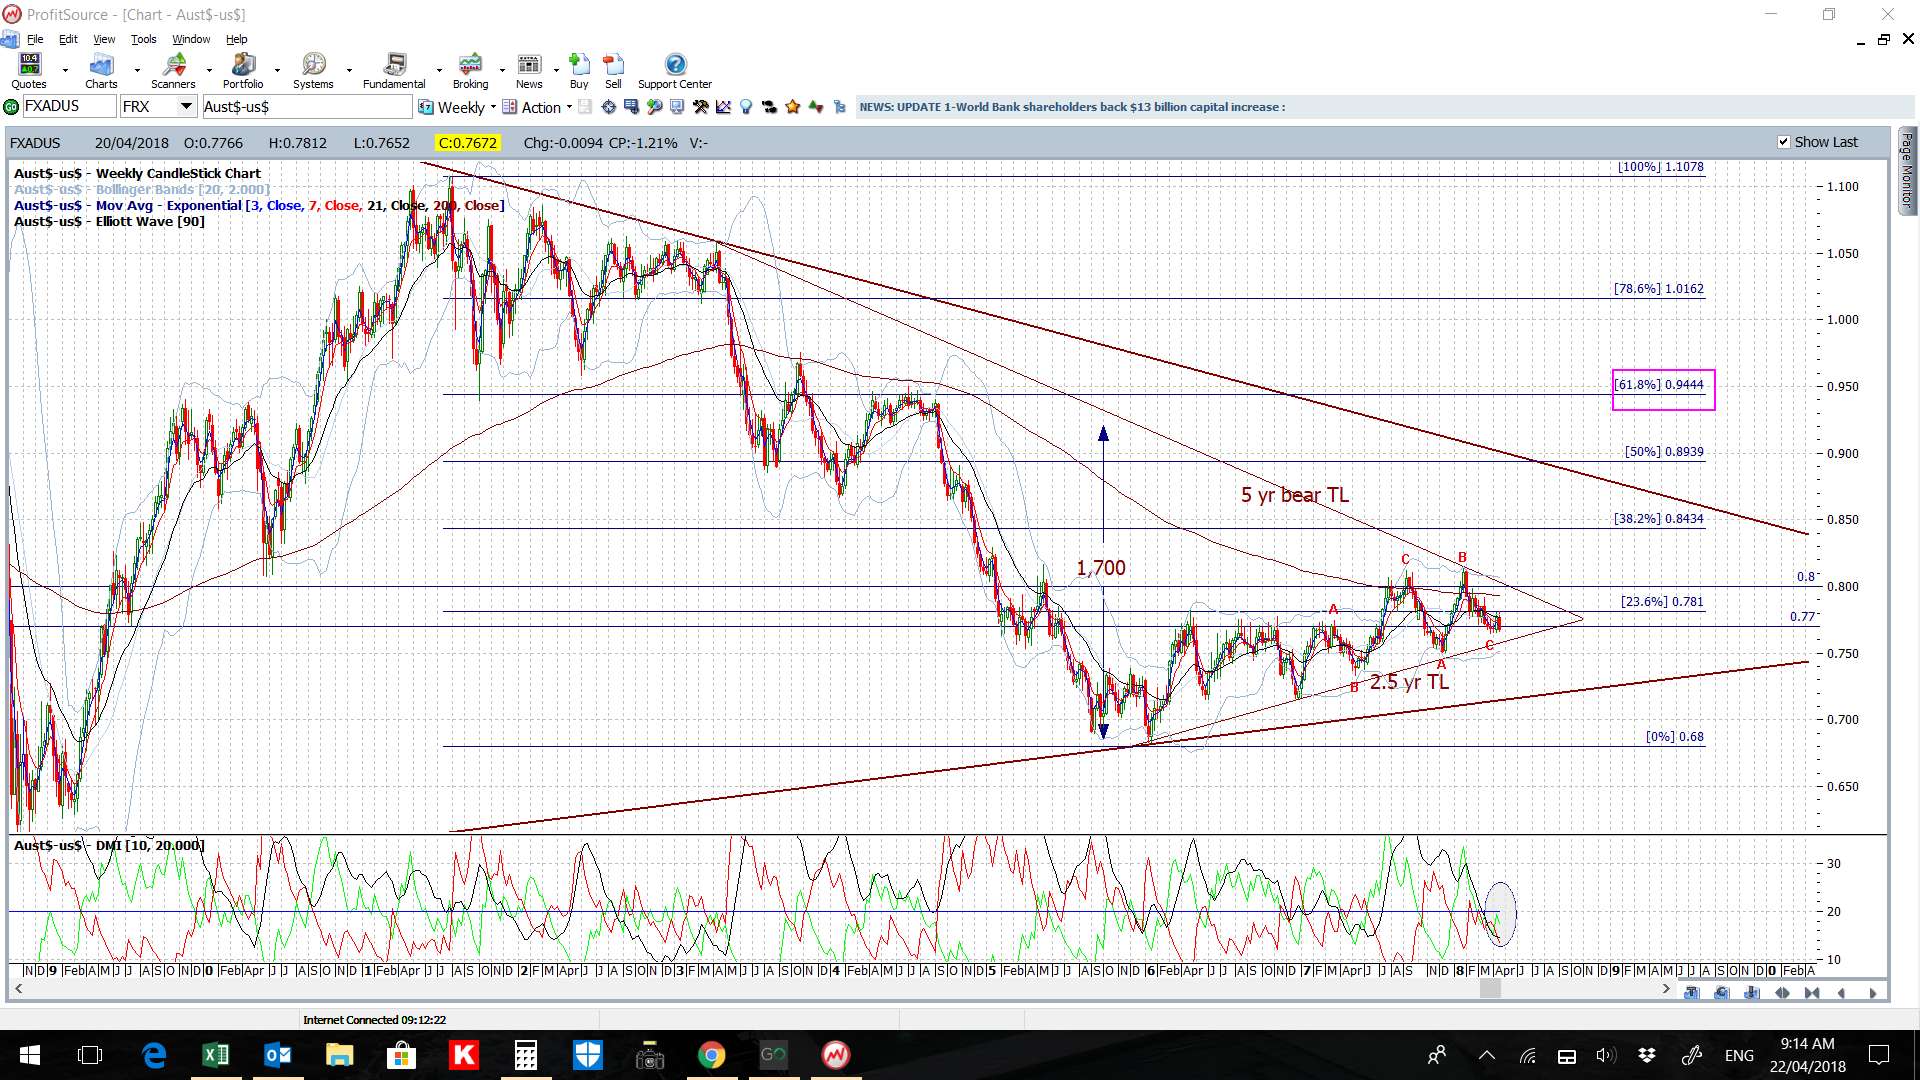
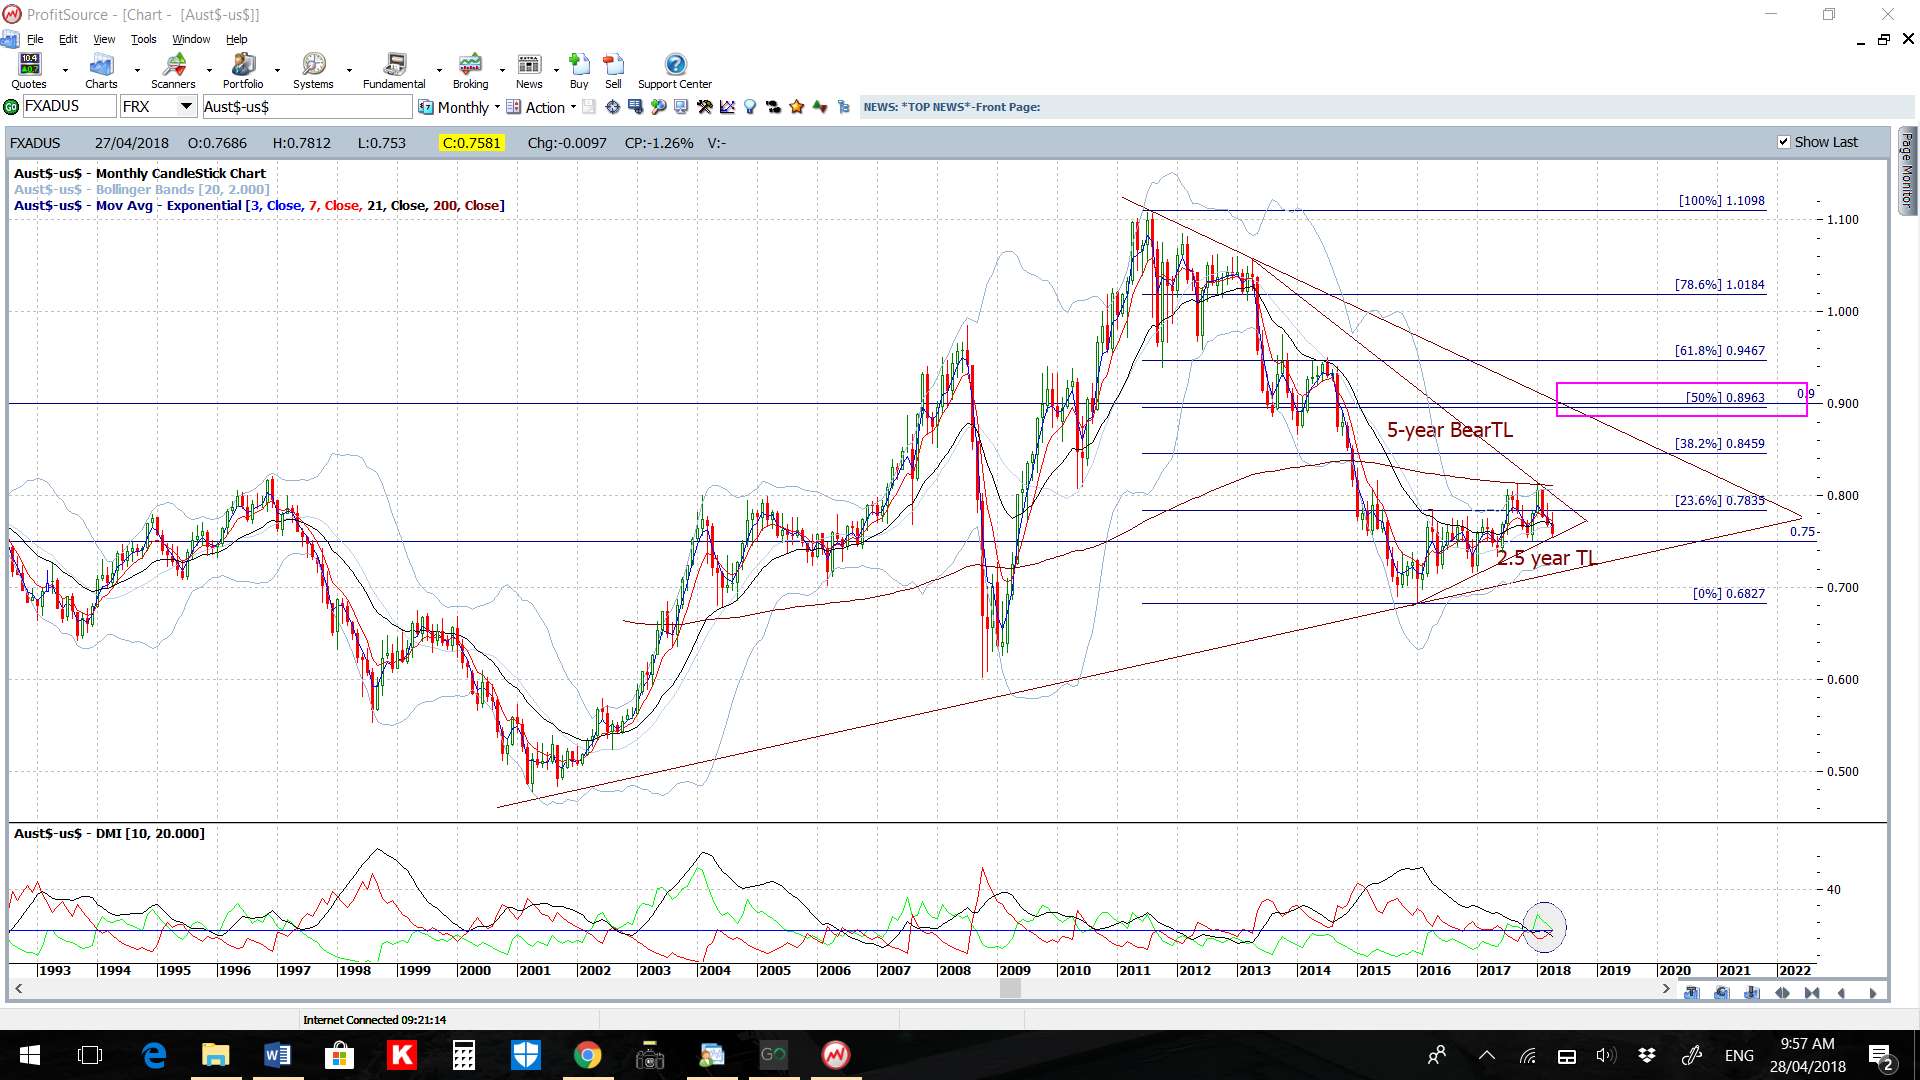
AUD/USD: Price action is trading up under the 0.78 level but the weekly chart shows a progression of higher Highs and higher Lows suggesting the uptrend is still intact. However, any risk-off shift following the weekend Syria news could undermine this pair so watch the 4hr chart trend lines for clues as to the next directional move.
Bullish targets: Any bullish 4hr chart triangle breakout above 0.78 would bring the weekly 200 EMA into greater focus.
Bearish targets: Any bearish 4hr chart triangle breakout would bring the 0.77 followed by 2.5 year support trend line into focus.
- Watch the 0.78 level and 4hr chart triangle for any new breakout.
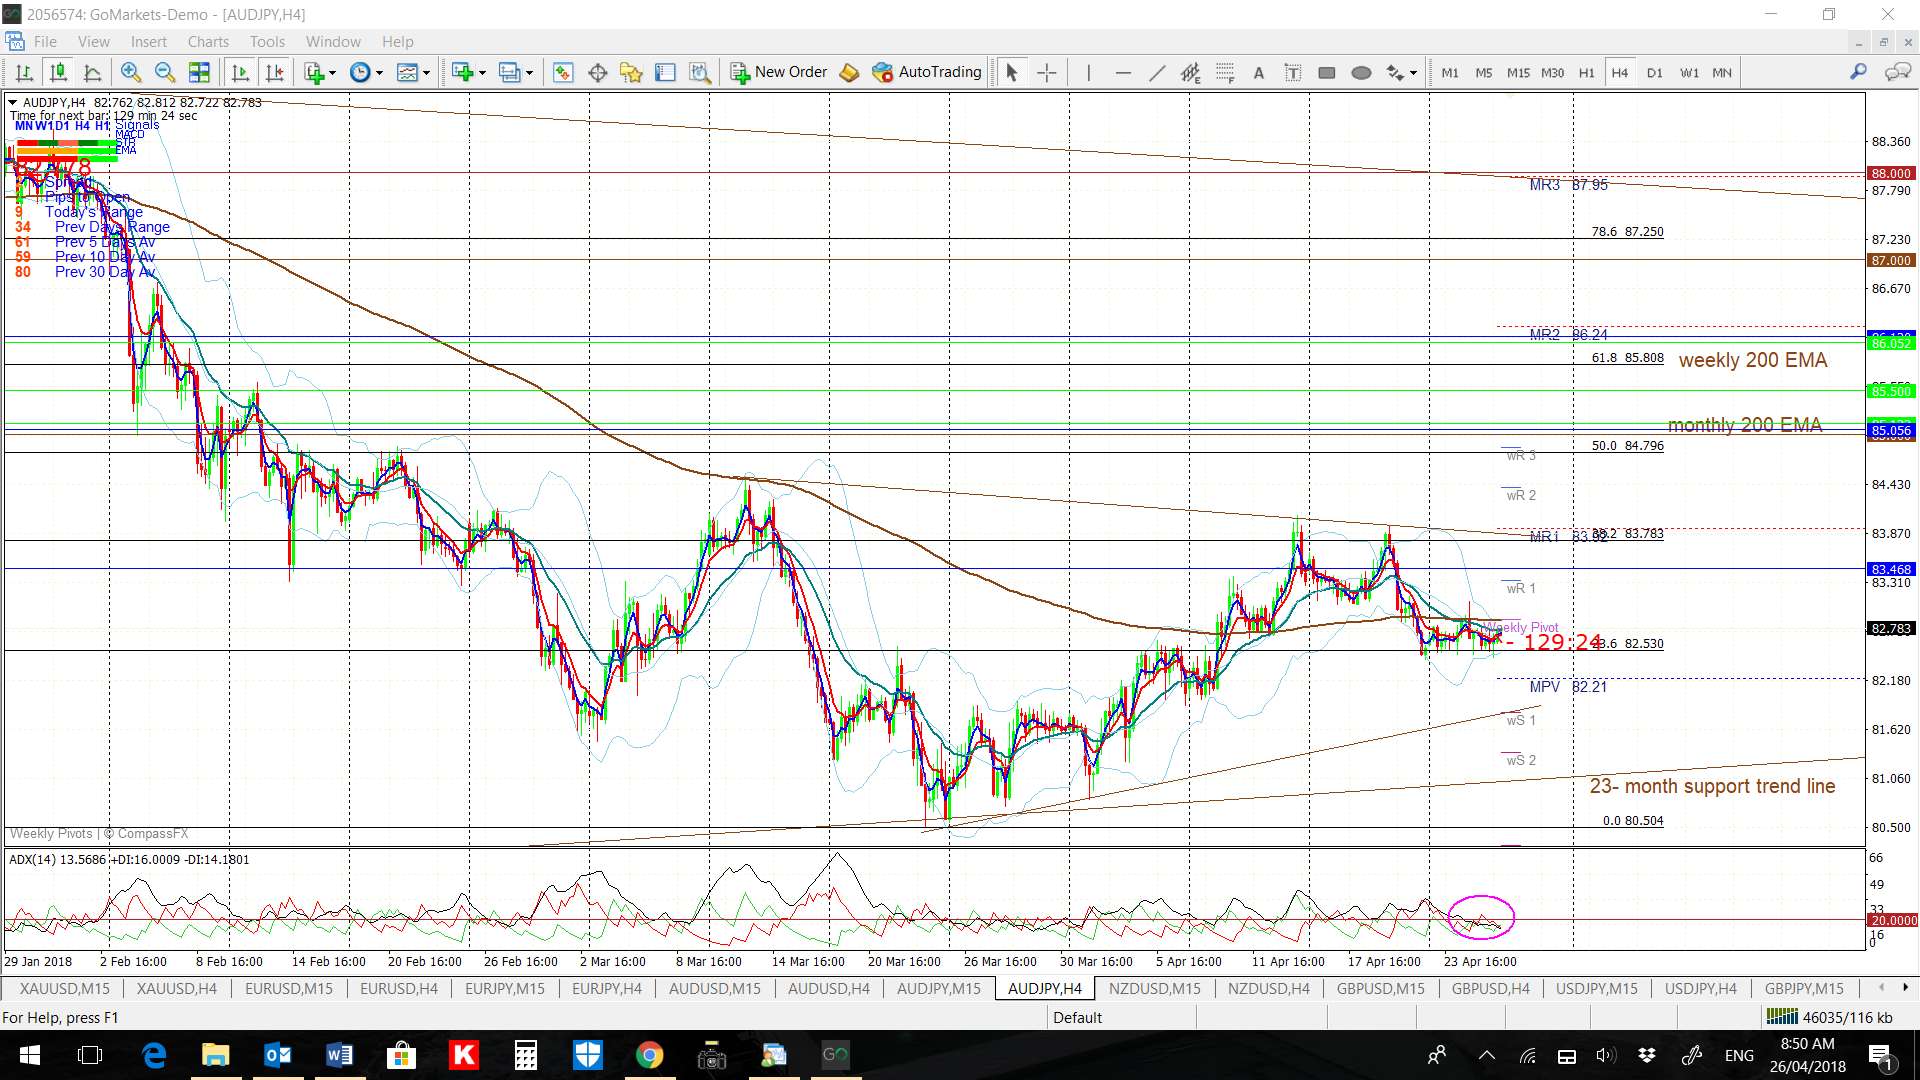
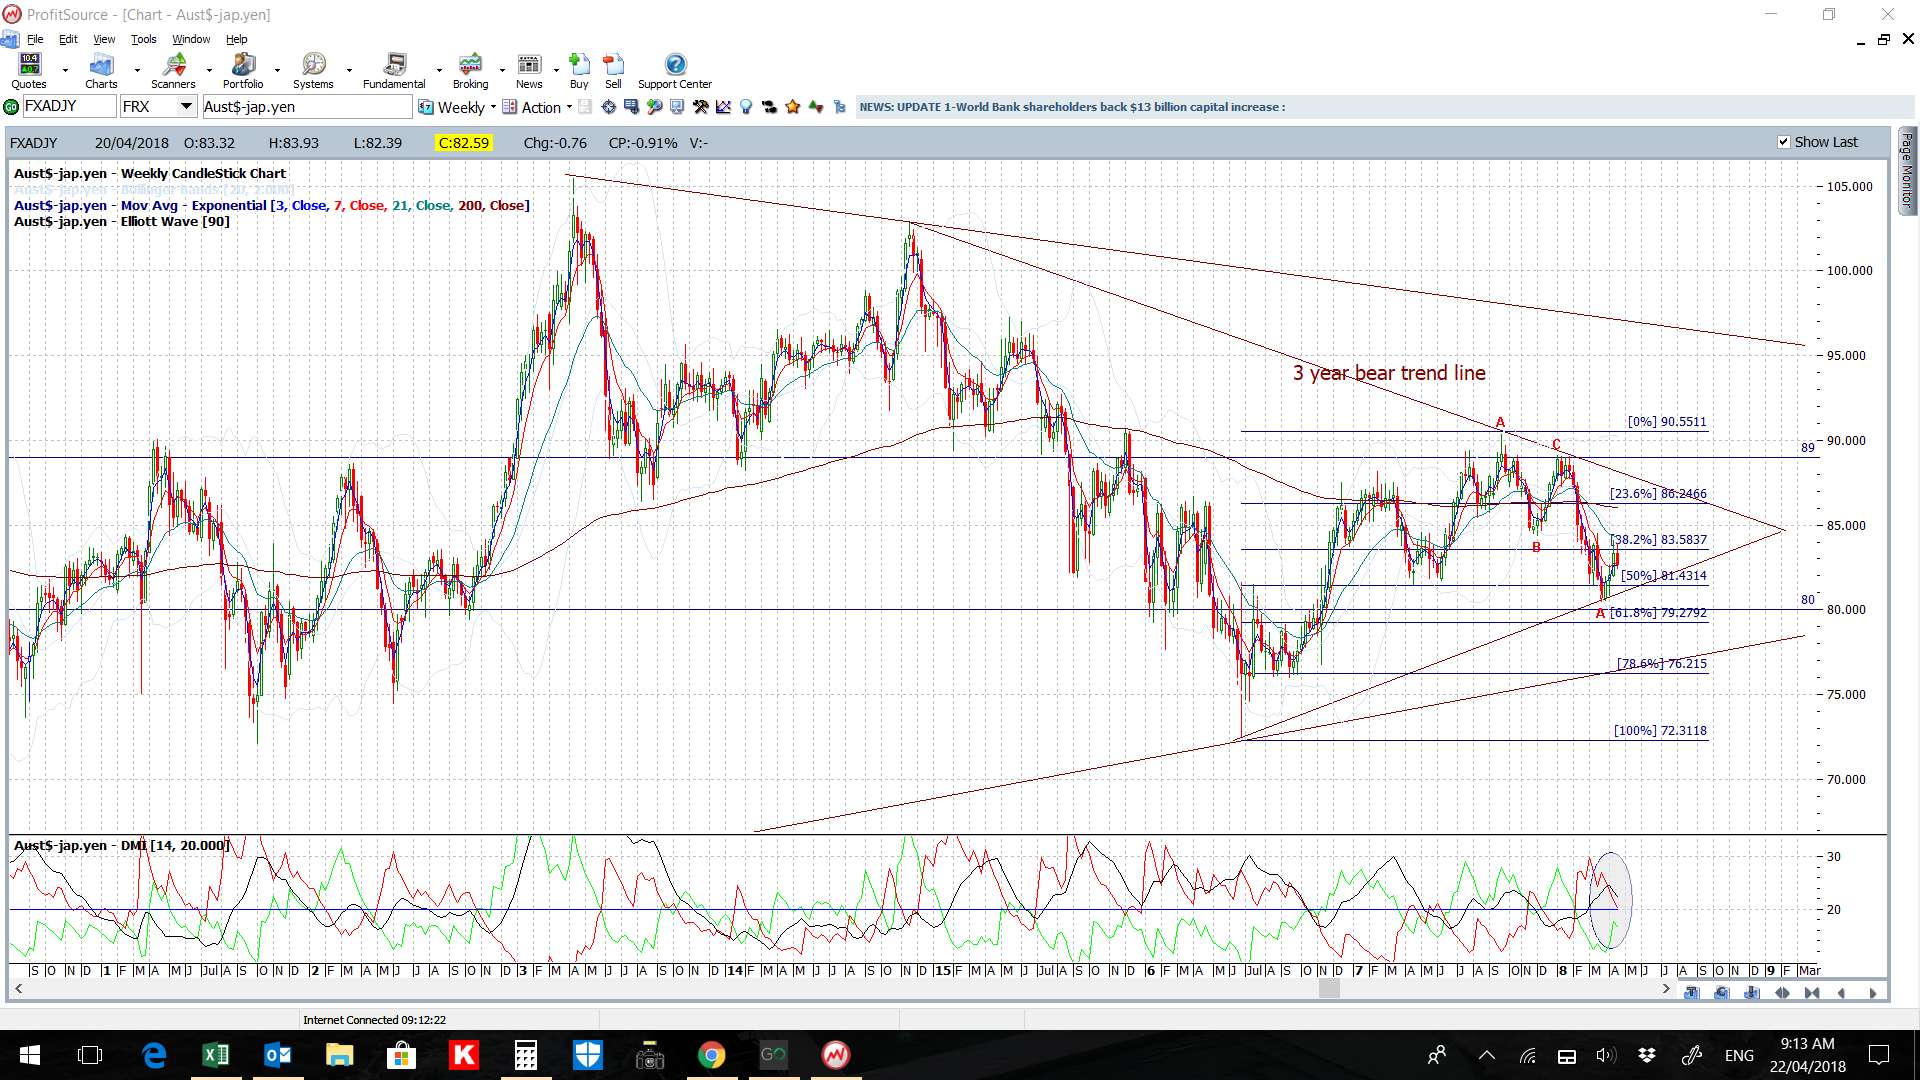
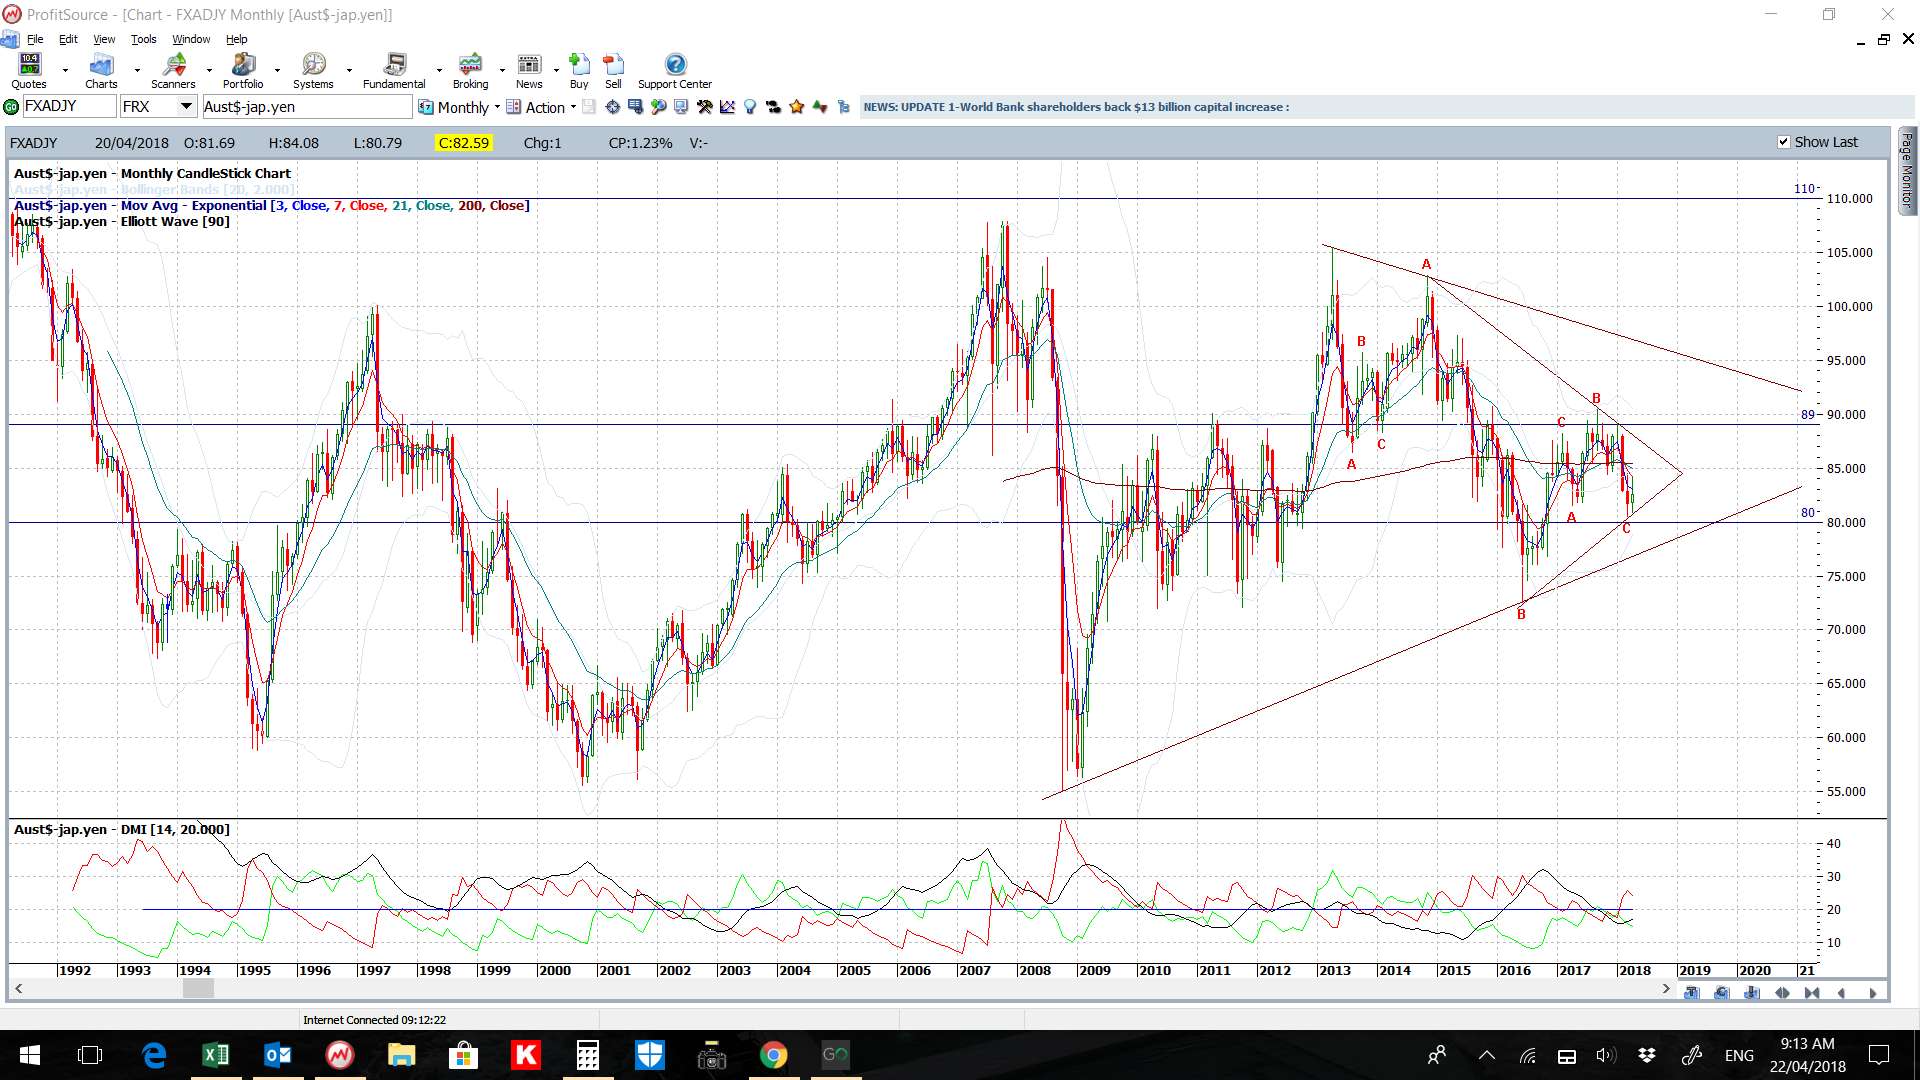
AUD/JPY: The same Yen caveat applies on this pair too; watch for any push lower if Yen strength triggers from Flight to Safety activity.
Bullish targets: Any bullish 4hr chart triangle breakout would bring the 85 region into focus as this is near the 4hr chart’s 50% fib and monthly 200 EMA and is previous S/R. After that, the whole-number 86 and 87 S/R levels would come into focus.
Bearish targets: Any bearish 4hr chart triangle breakout would bring the 80 level into focus as this is near the weekly chart’s 61.8% fib level and the monthly chart’s 23-month support trend line.
- Watch the 4hr chart triangle trend lines for any new breakout:
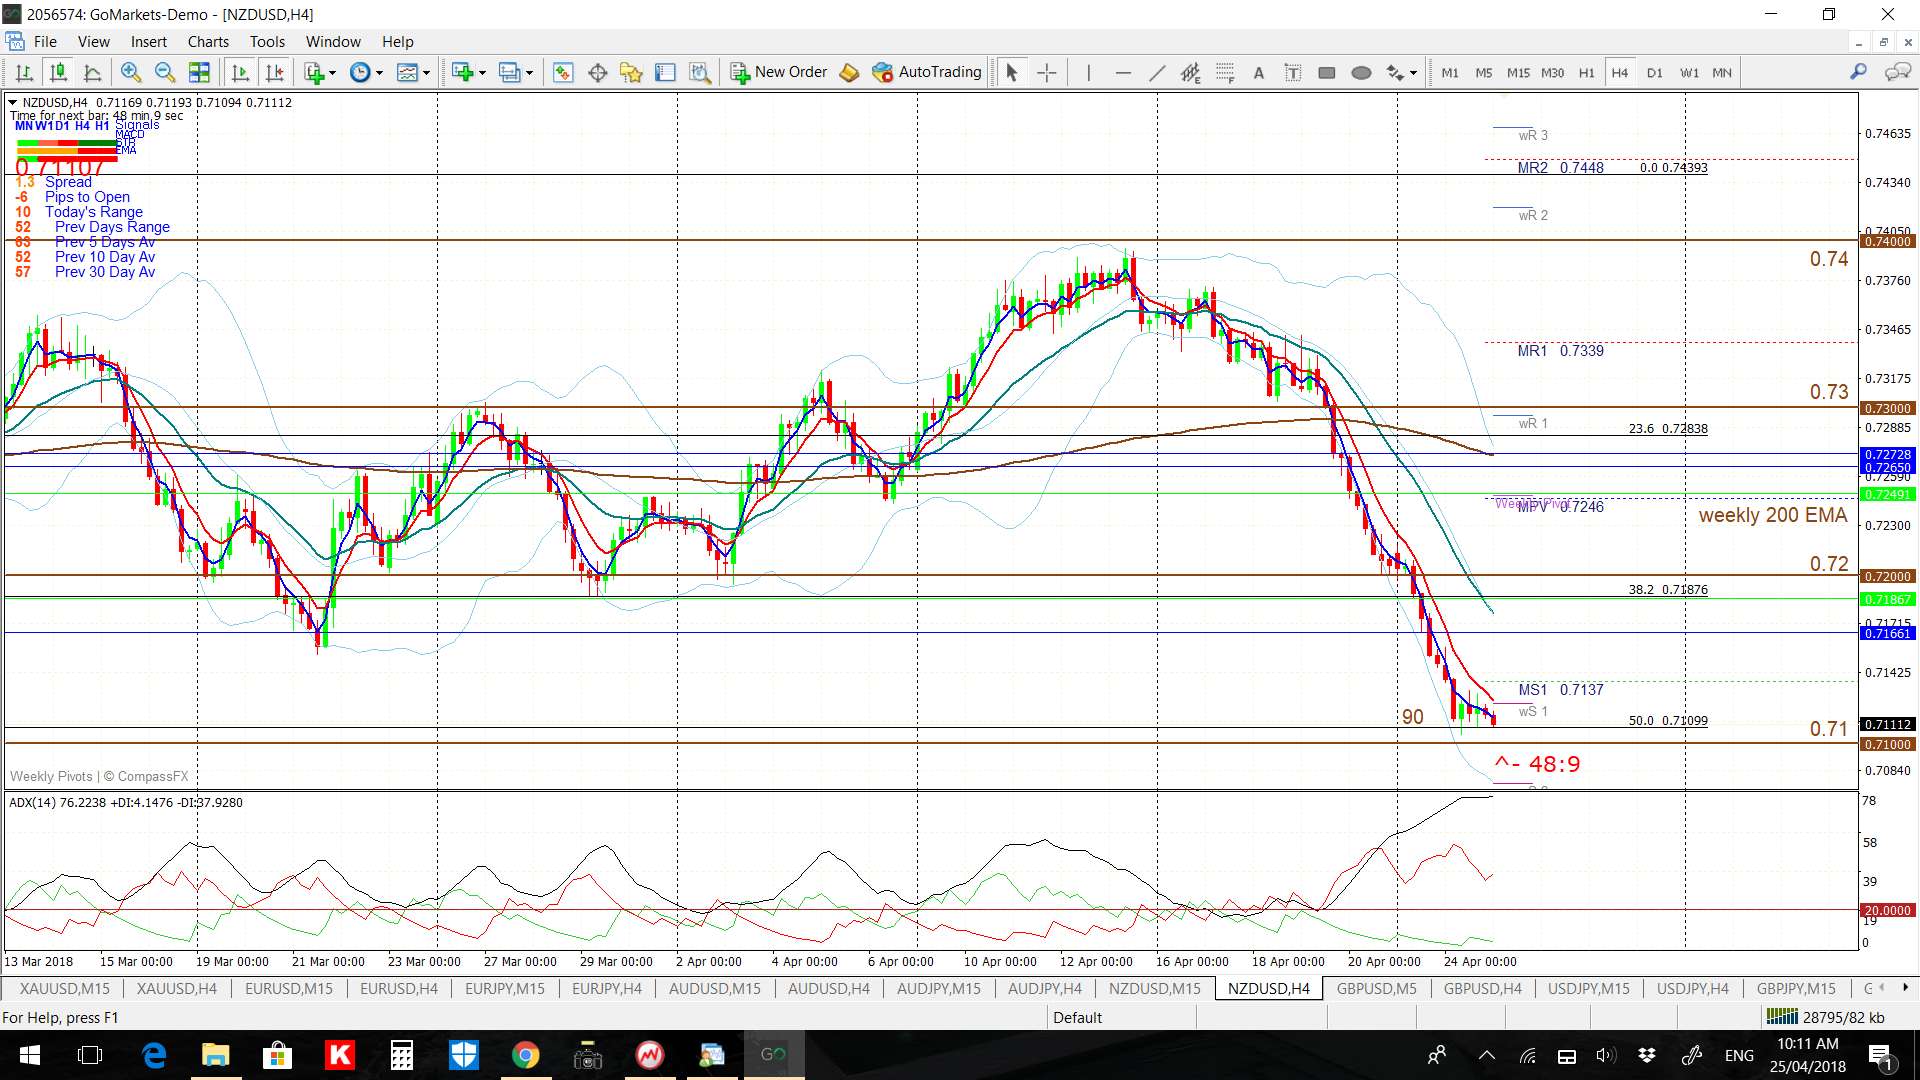
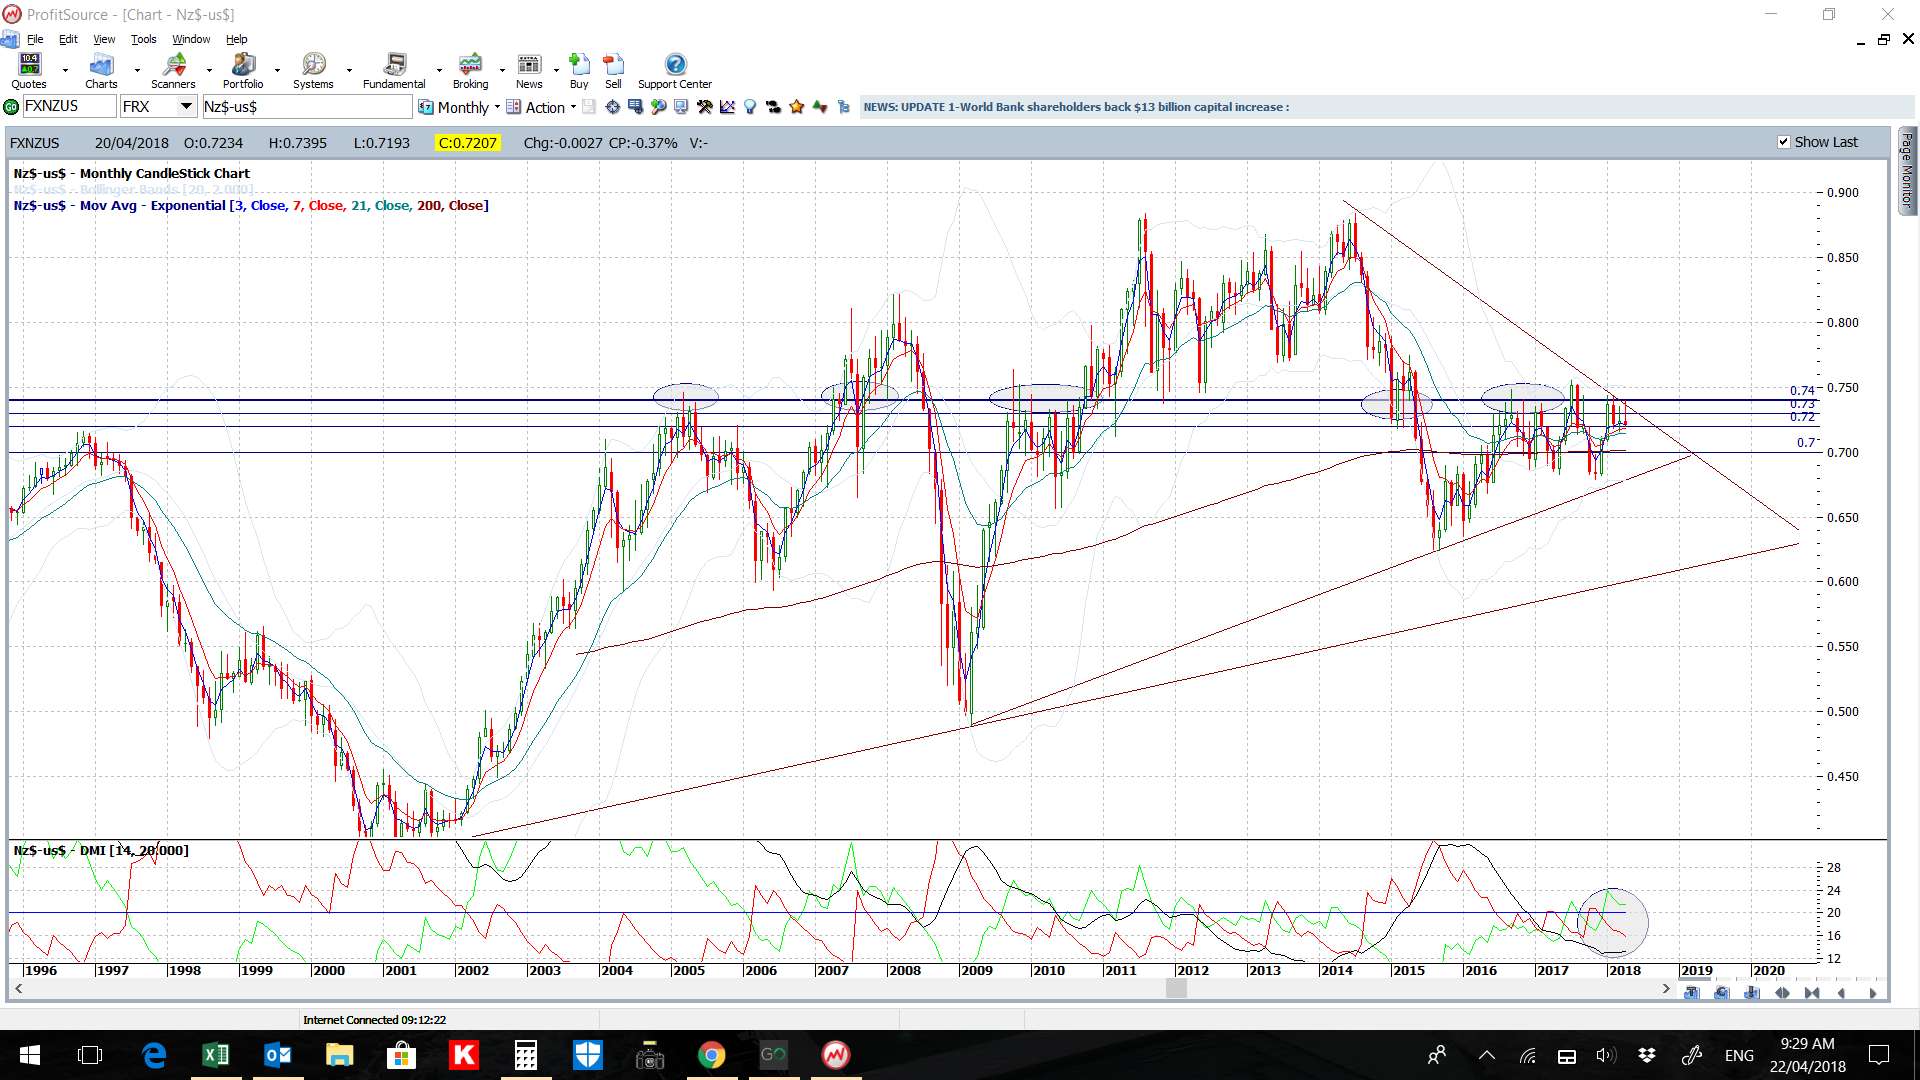
NZD/USD: The Kiwi had a bullish week and although price stalled at the major 0.74 S/R level this remains the level to watch in coming sessions for any new make or break activity.
Bullish targets: any bullish triangle breakout above 0.74 would bring the recent High, near 0.744, into focus and 0.75 after that.
Bearish targets: any bearish triangle breakout would bring 0.73 into focus followed by 0.72 and 0.71 and other whole-number levels.
- Watch for any 4hr chart triangle and 0.74 breakout.

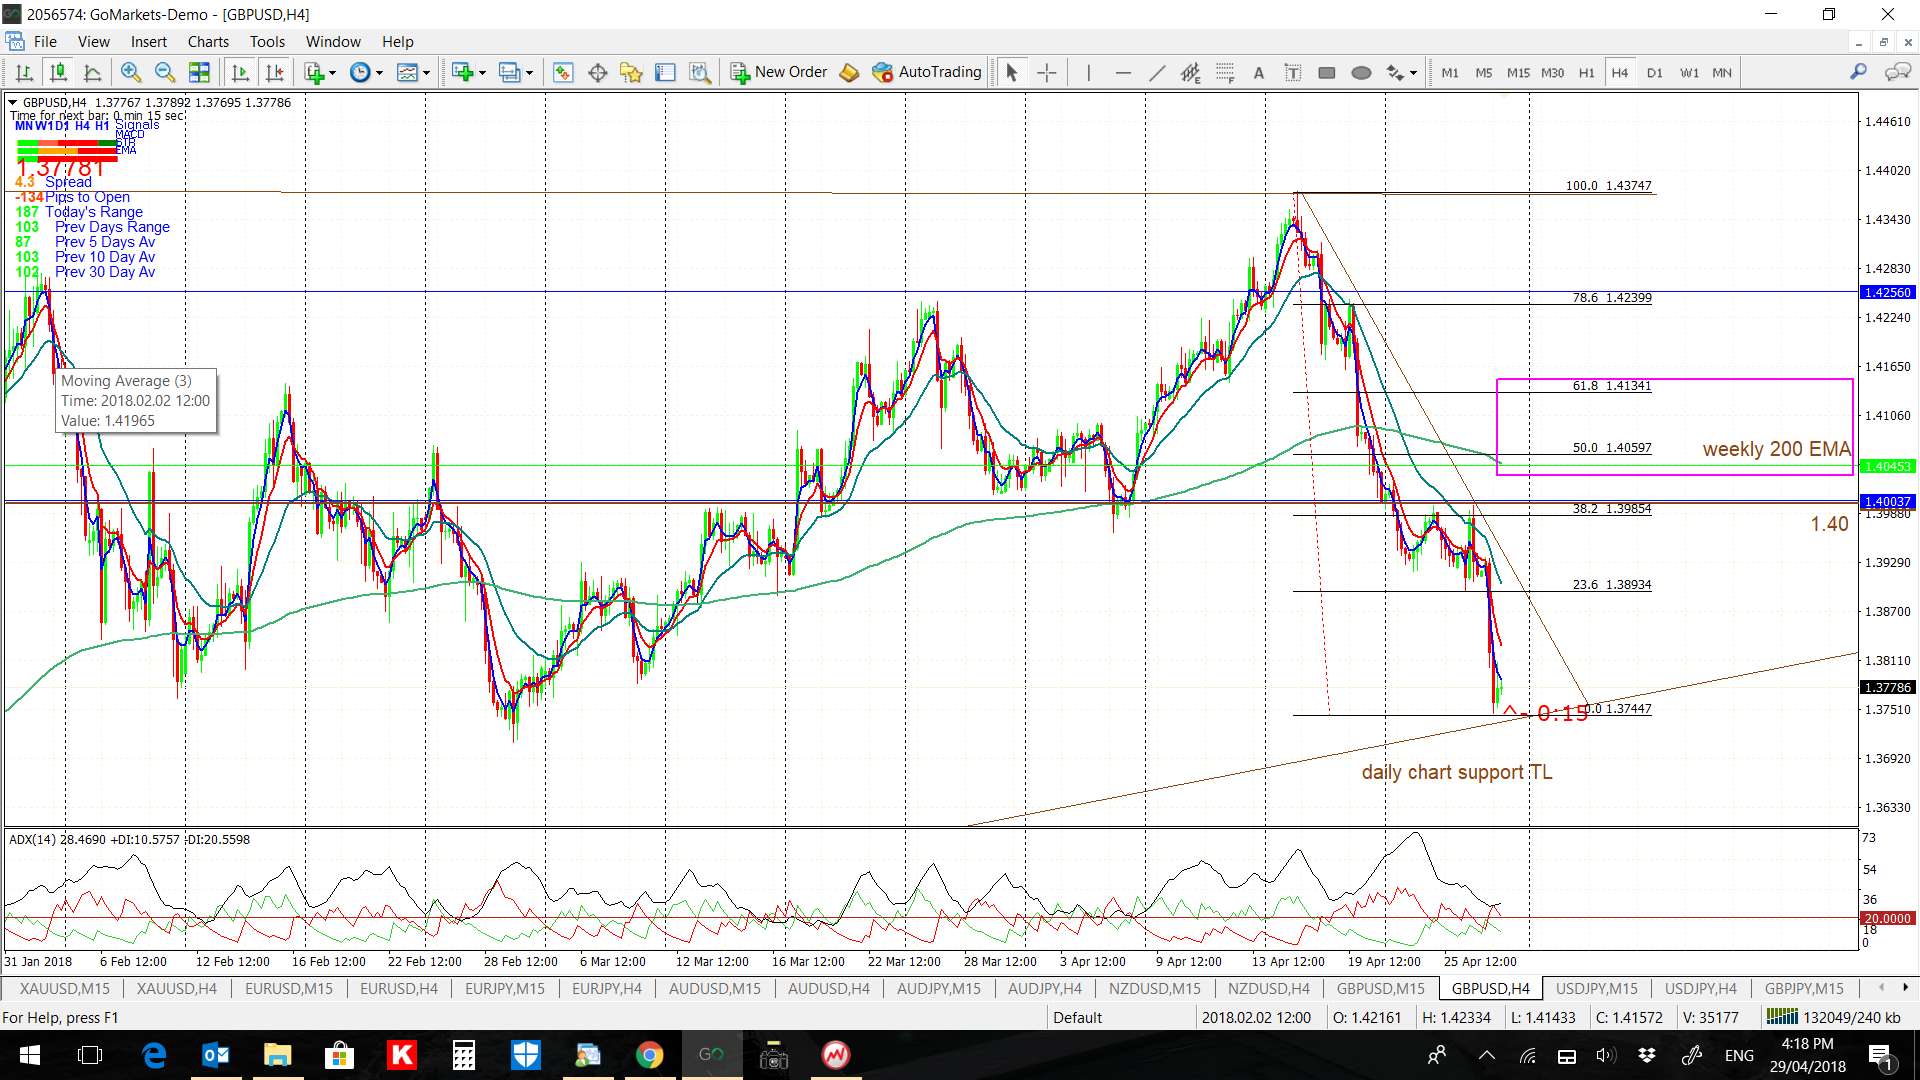
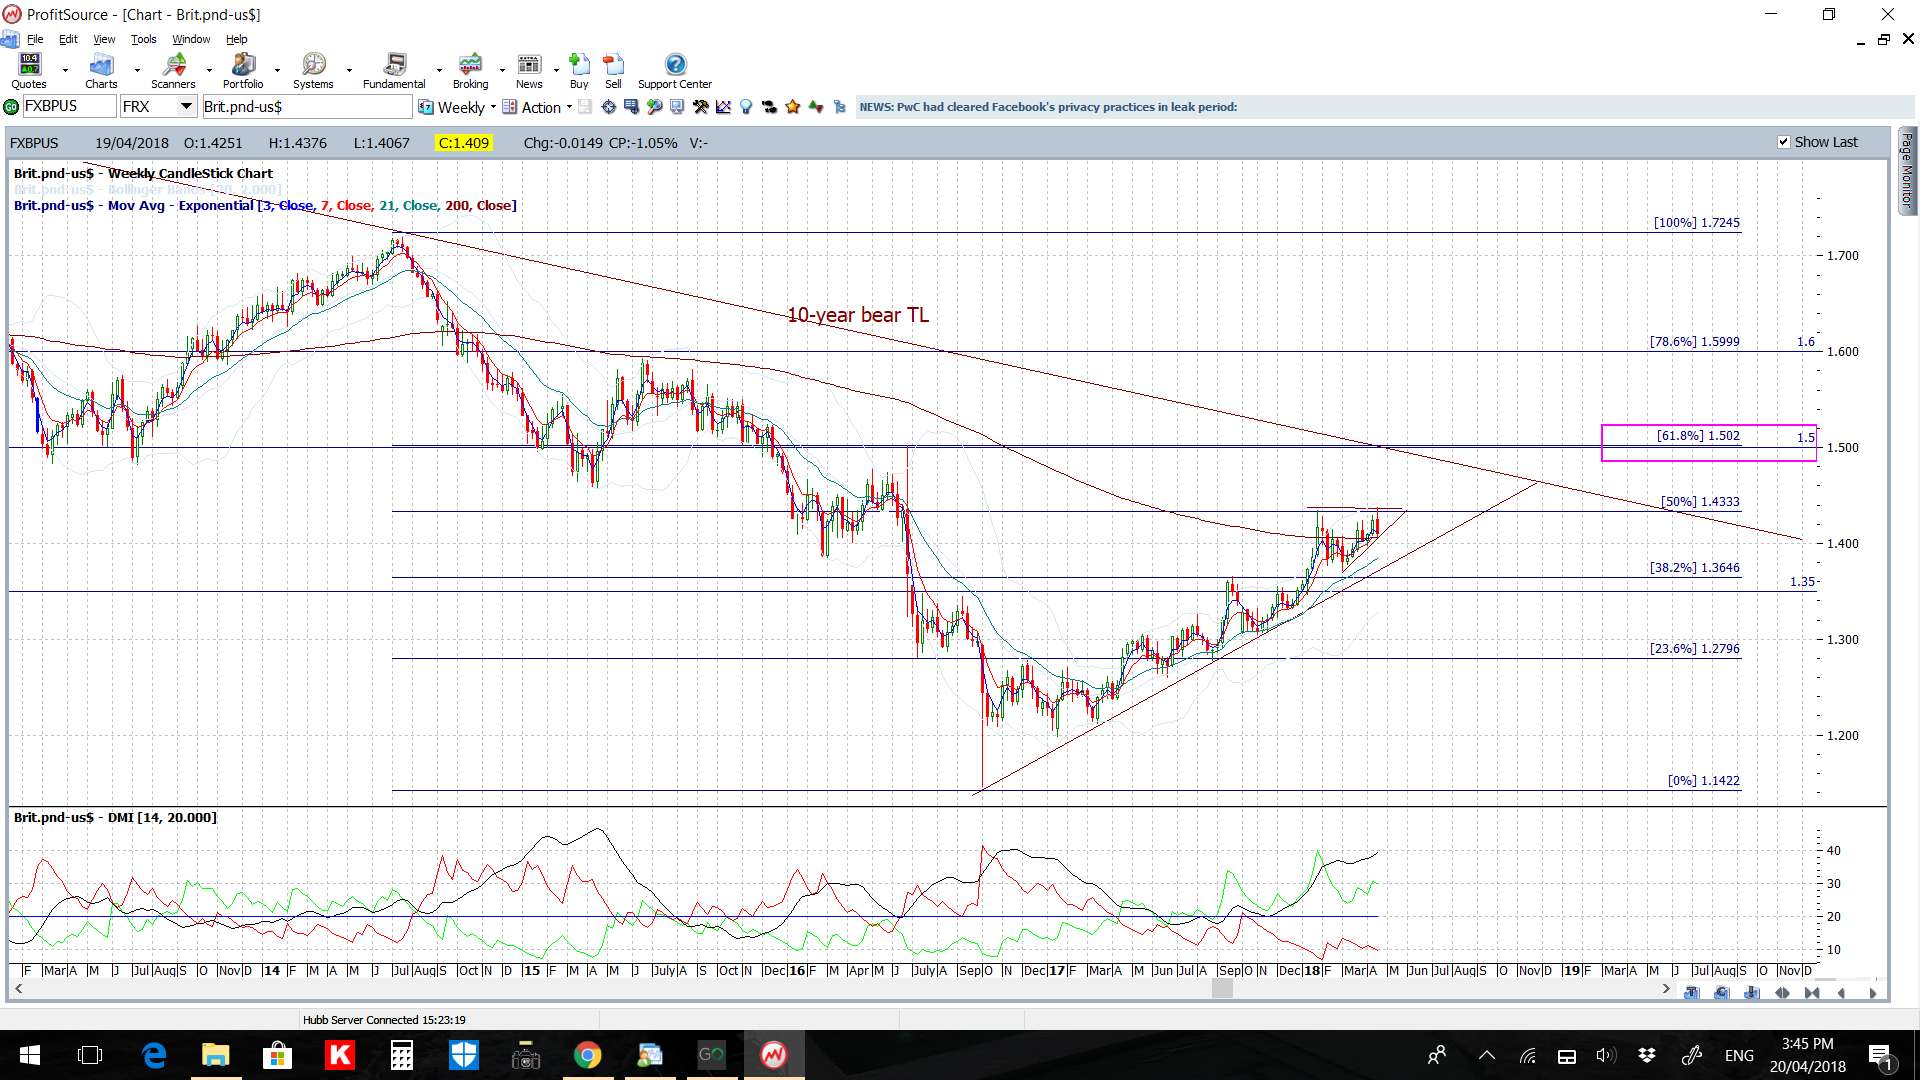
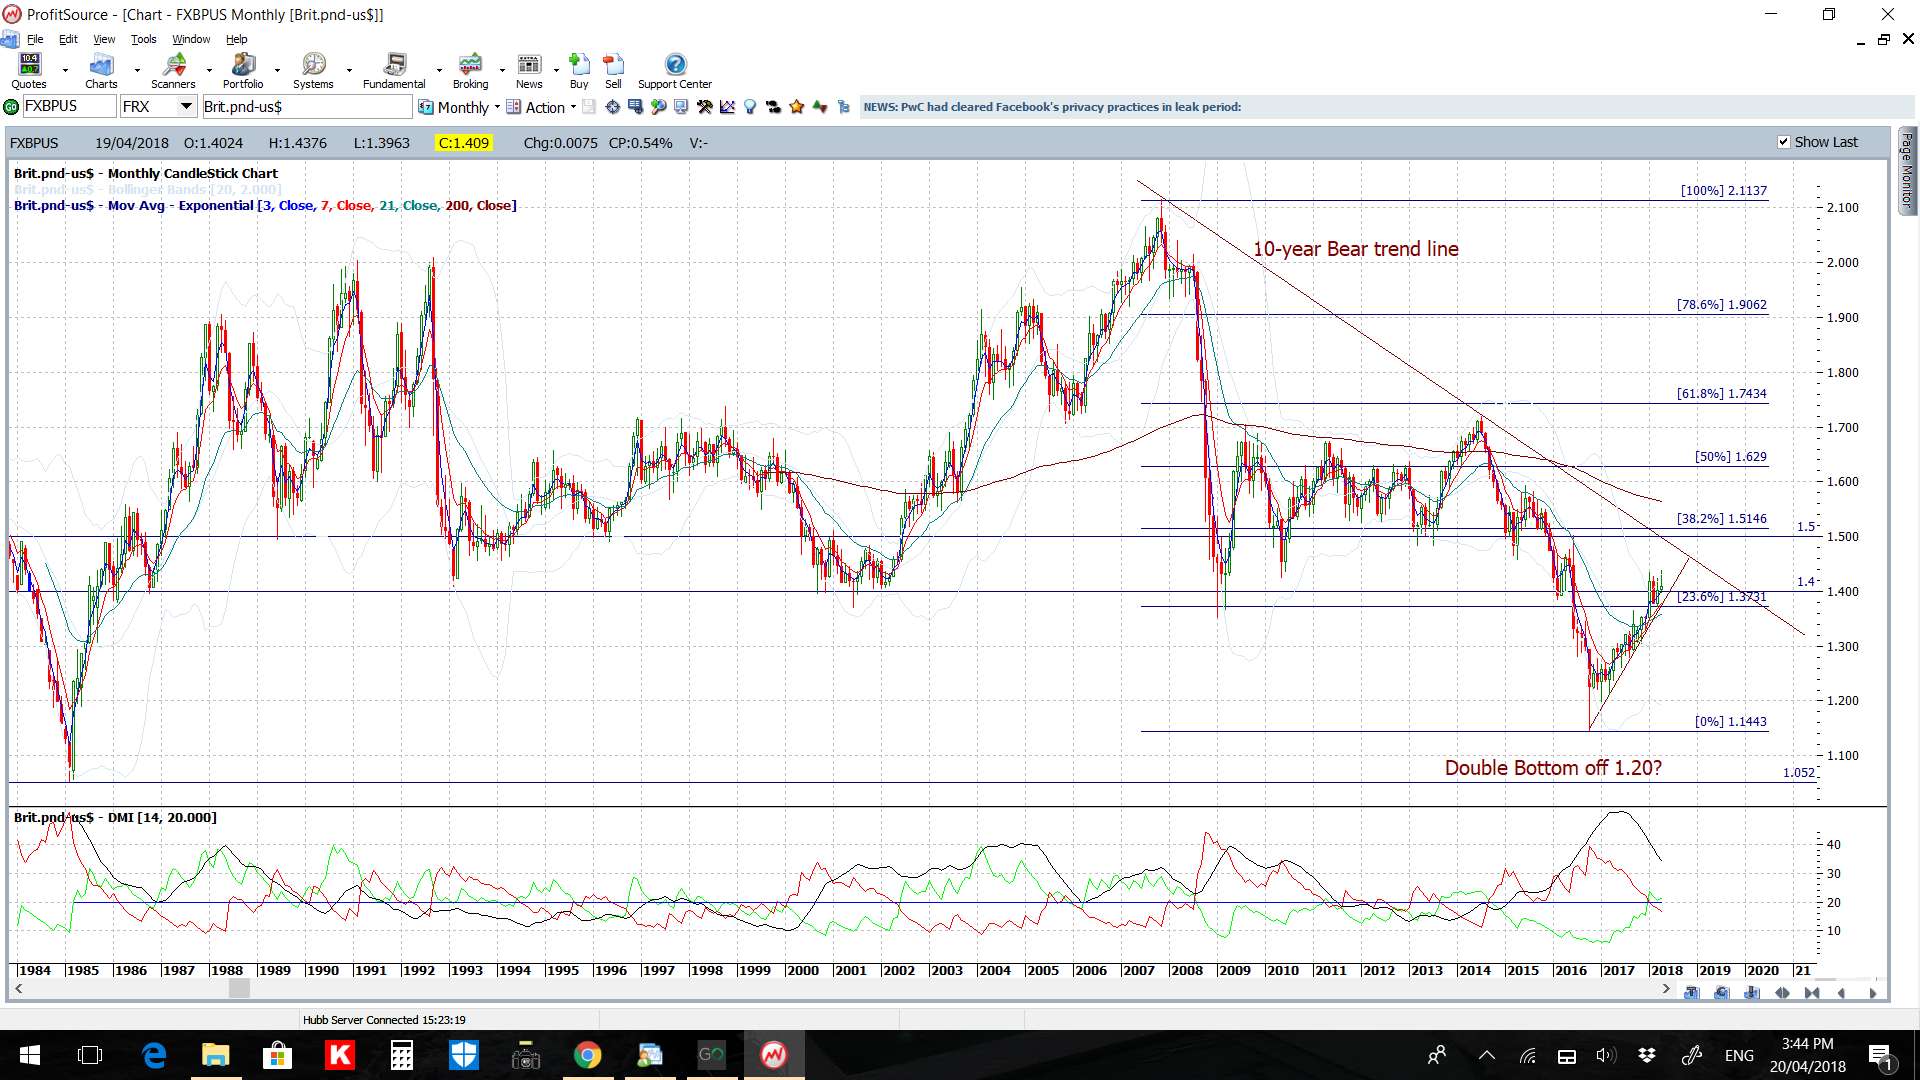
GBP/USD: The Cable keeps ticking higher but watch for any pullback following the weekend Syrian news.
Bullish targets: Any bullish 4hr chart triangle breakout would have me looking to the recent High, near 1.434, which isn’t too far away at all now. After that, the 1.50 region would come into greater focus as this is the 61.8% fib of the weekly chart’s longer-term swing low move. This is a move now worth around 700 pips and so is still worth stalking!
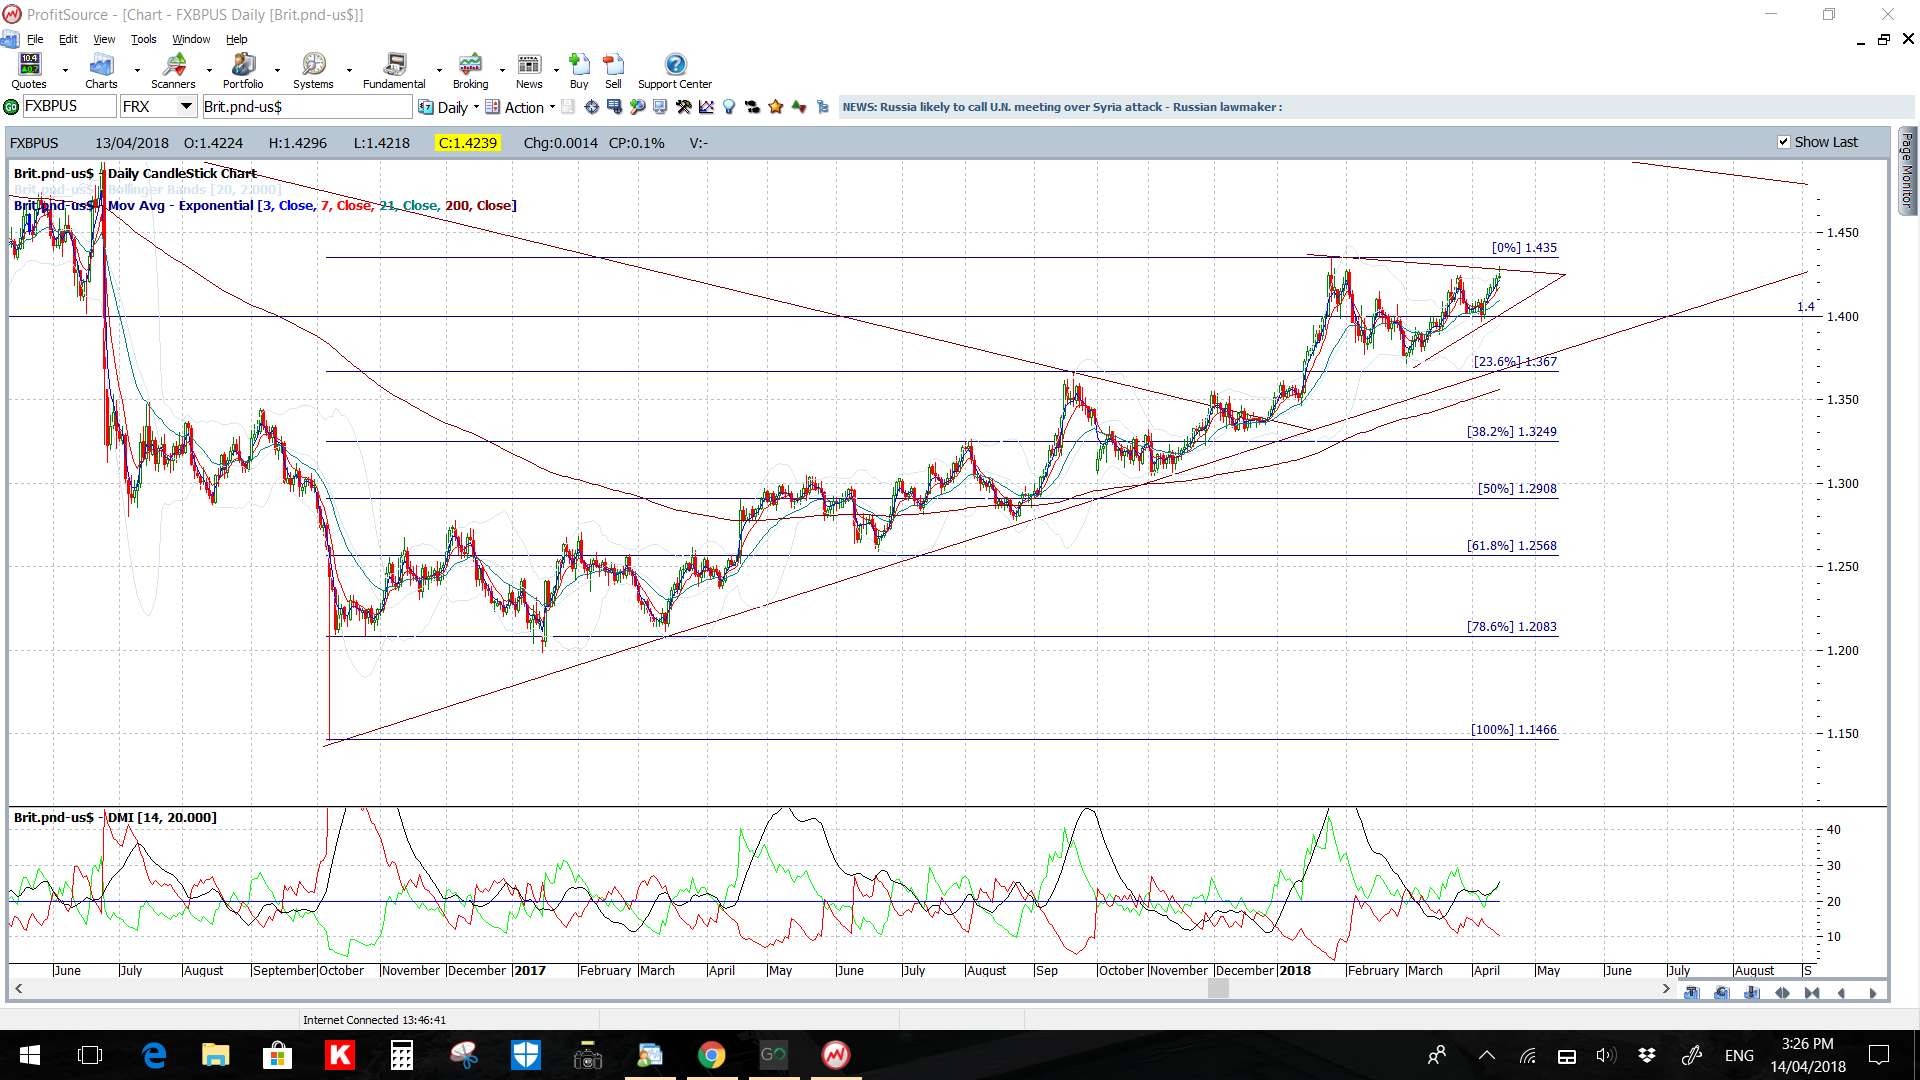
Bearish targets: Any bearish 4hr chart triangle breakout would bring the weekly 200 EMA into focus and, after that, the key 1.40 level followed by the recent low near 1.371. The daily chart shows a weekly support trend line in play and any break below this would have me looking down to the 1.25 level as this is the 61.8% fib of the last major swing high move (see daily chart).
- Watch for any 4hr chart trend line breakout.
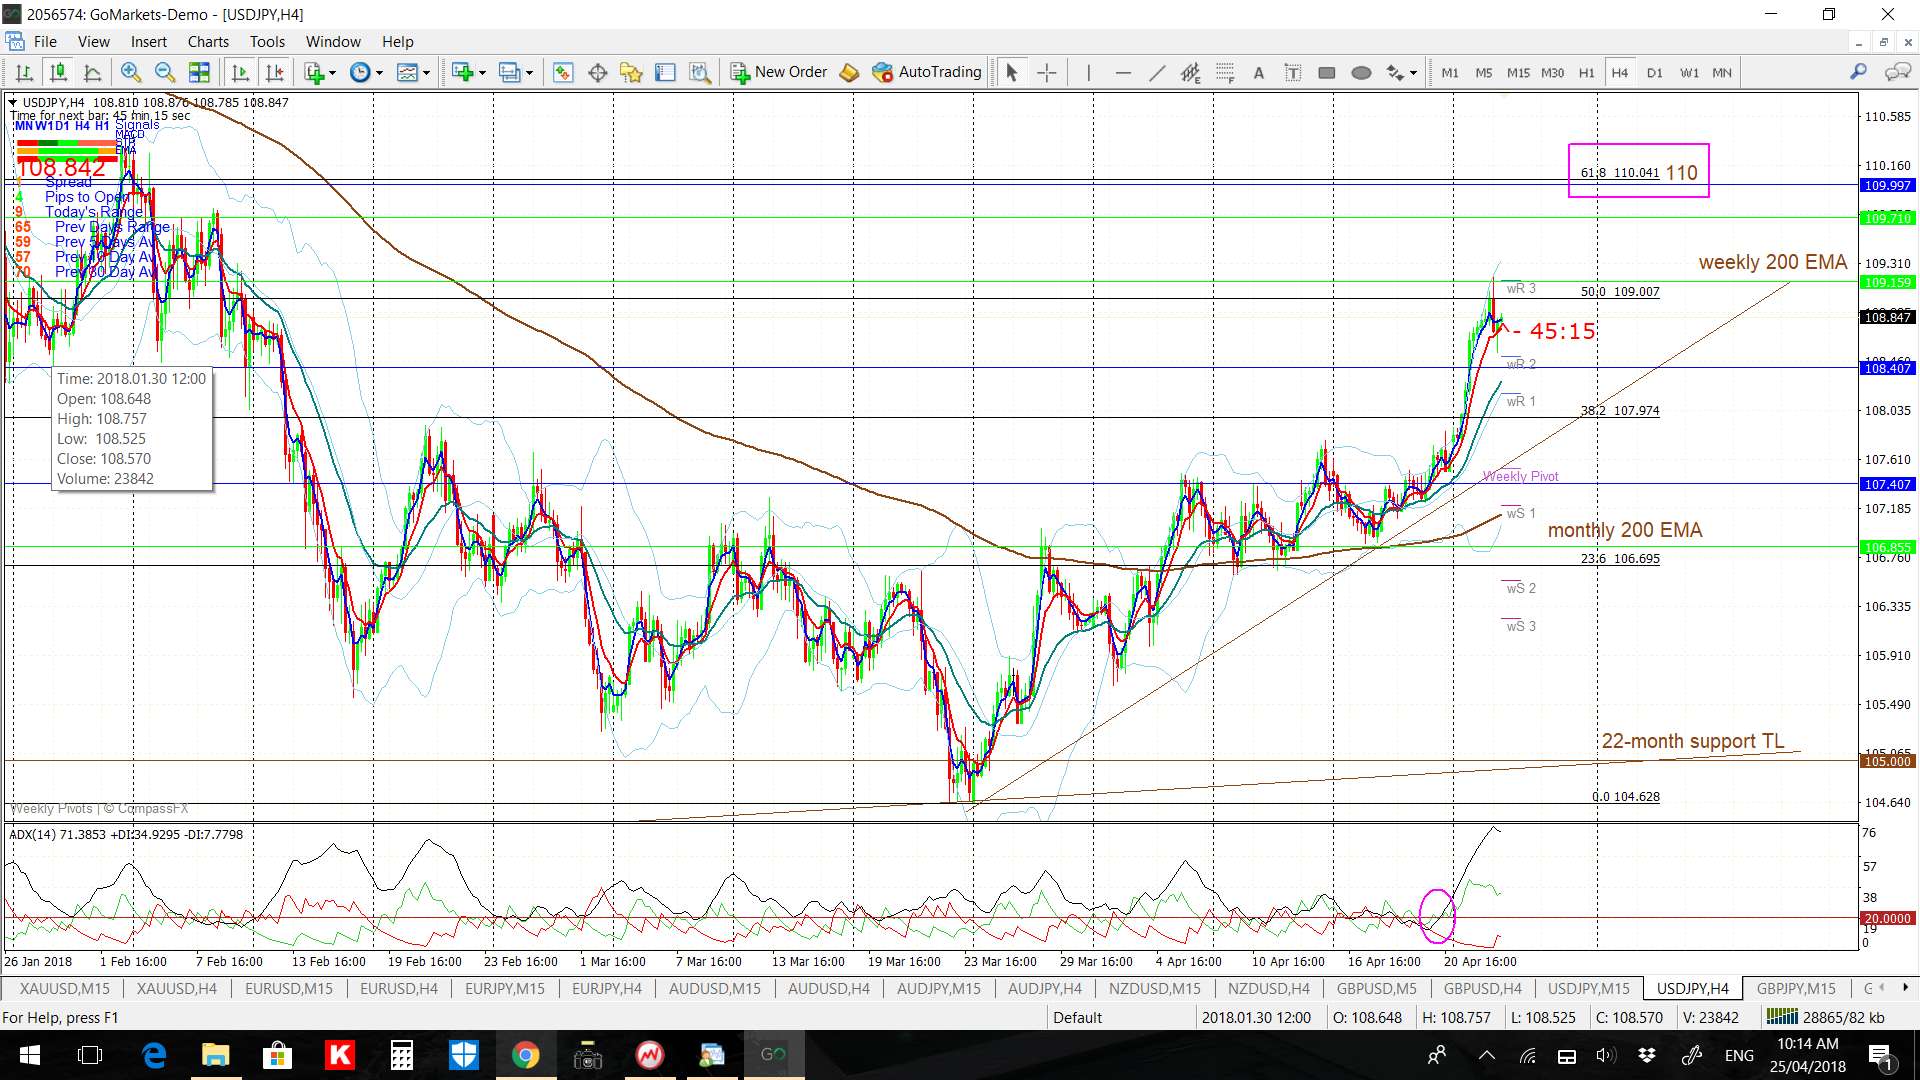
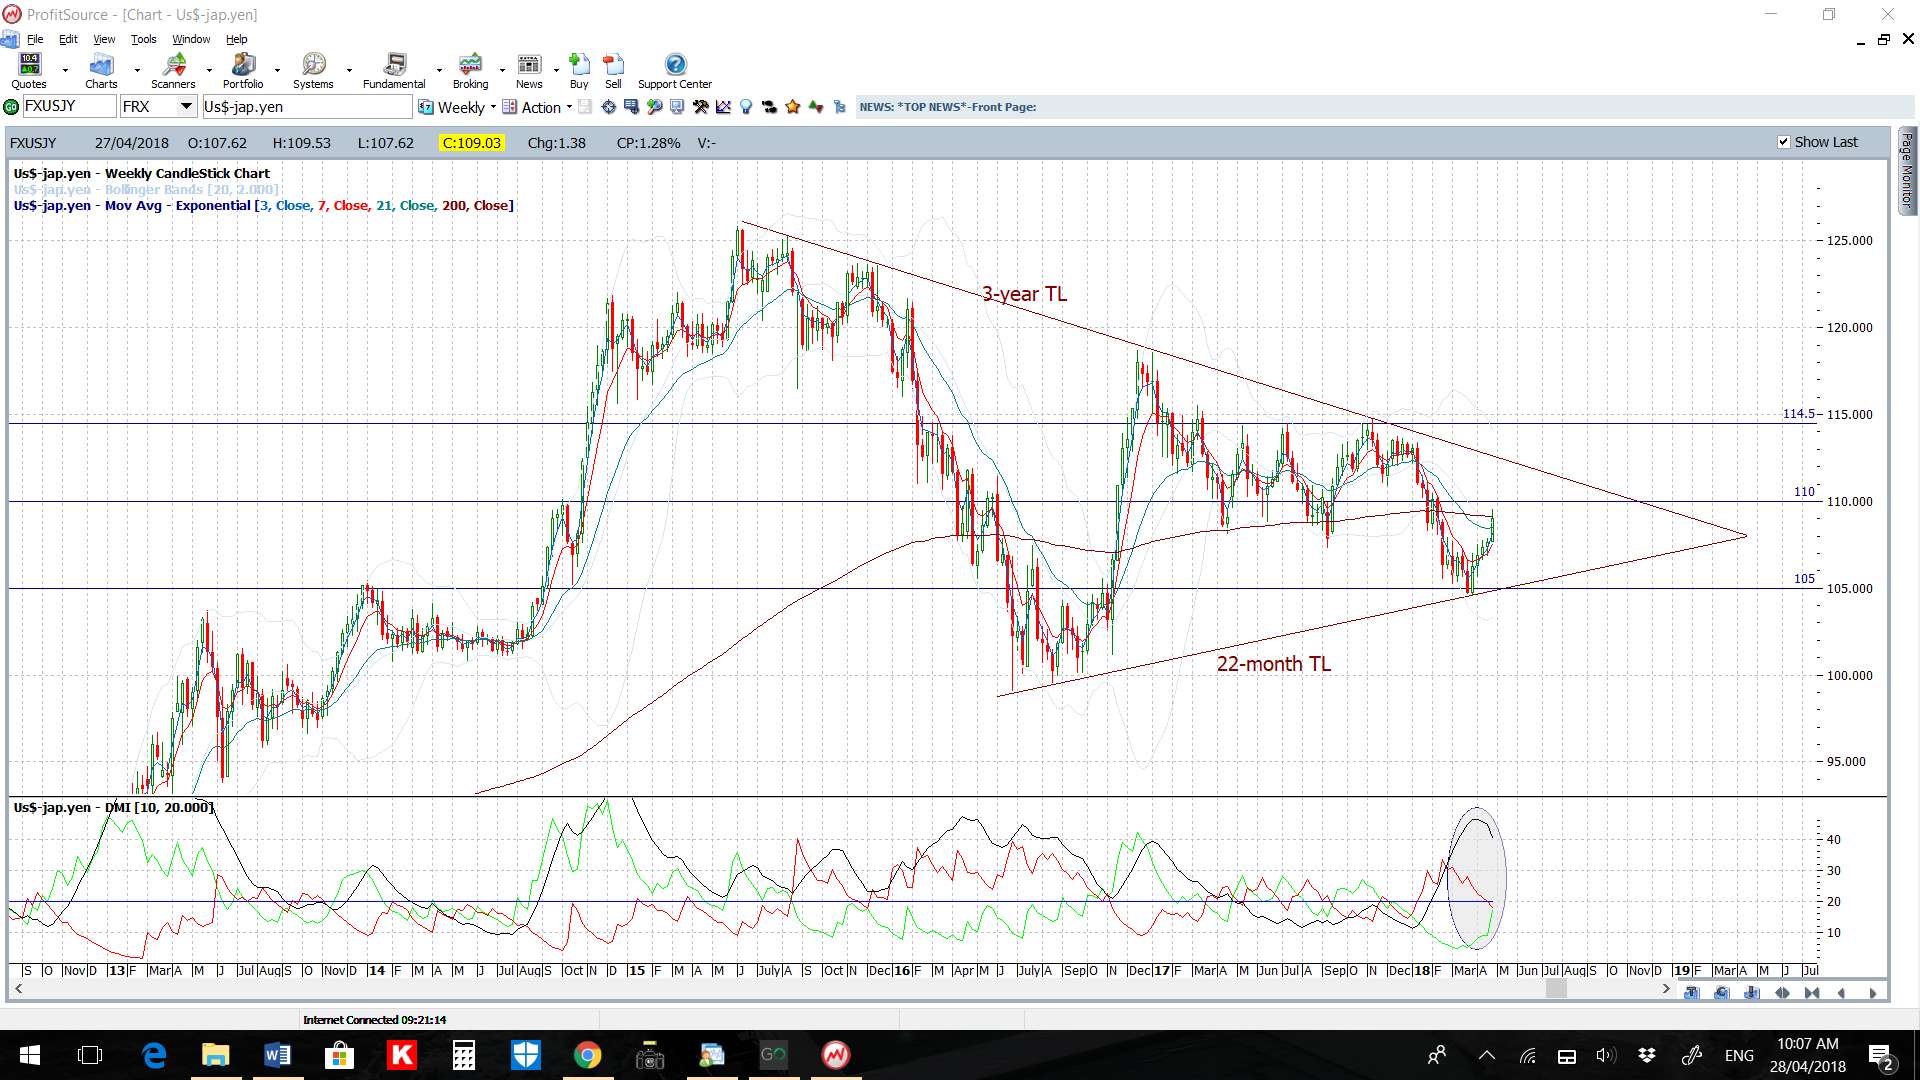
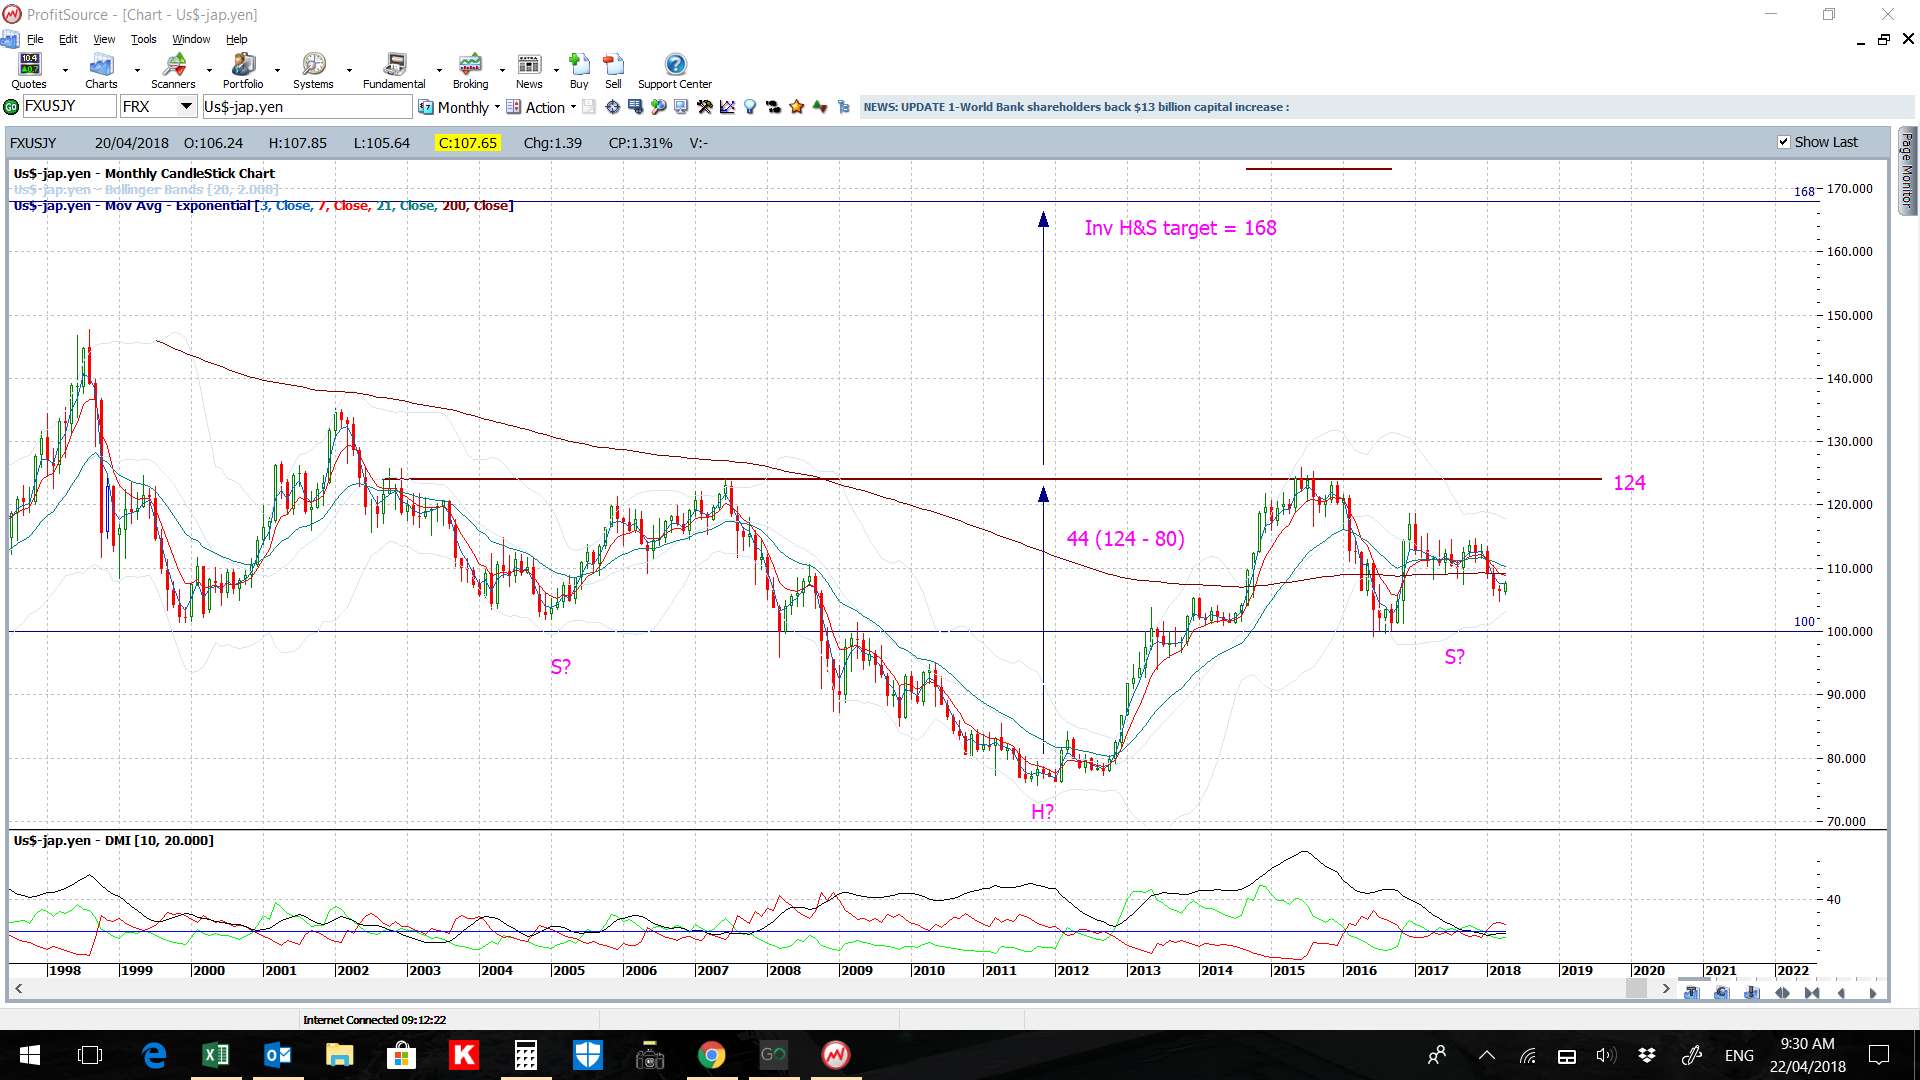
USD/JPY: The same caveat applies here with any Flight to Safety inspired movement to the Yen.
Bullish targets: any bullish push higher would bring the weekly 200 EMA, near 109 and the 4hr chart’s 50 % fib, followed by the key 110 S/R level, near the 4hr chart’s 61.8% fib level, into focus.
Bearish targets: any bearish break below the 4hr chart’s support trend line would bring the monthly 200 EMA followed by the whole-number 105 S/R level back into focus and, after that, the 100 level followed by the 2016 Low, near 99.
- Watch for any make or break at the 4hr chart’s support trend line.
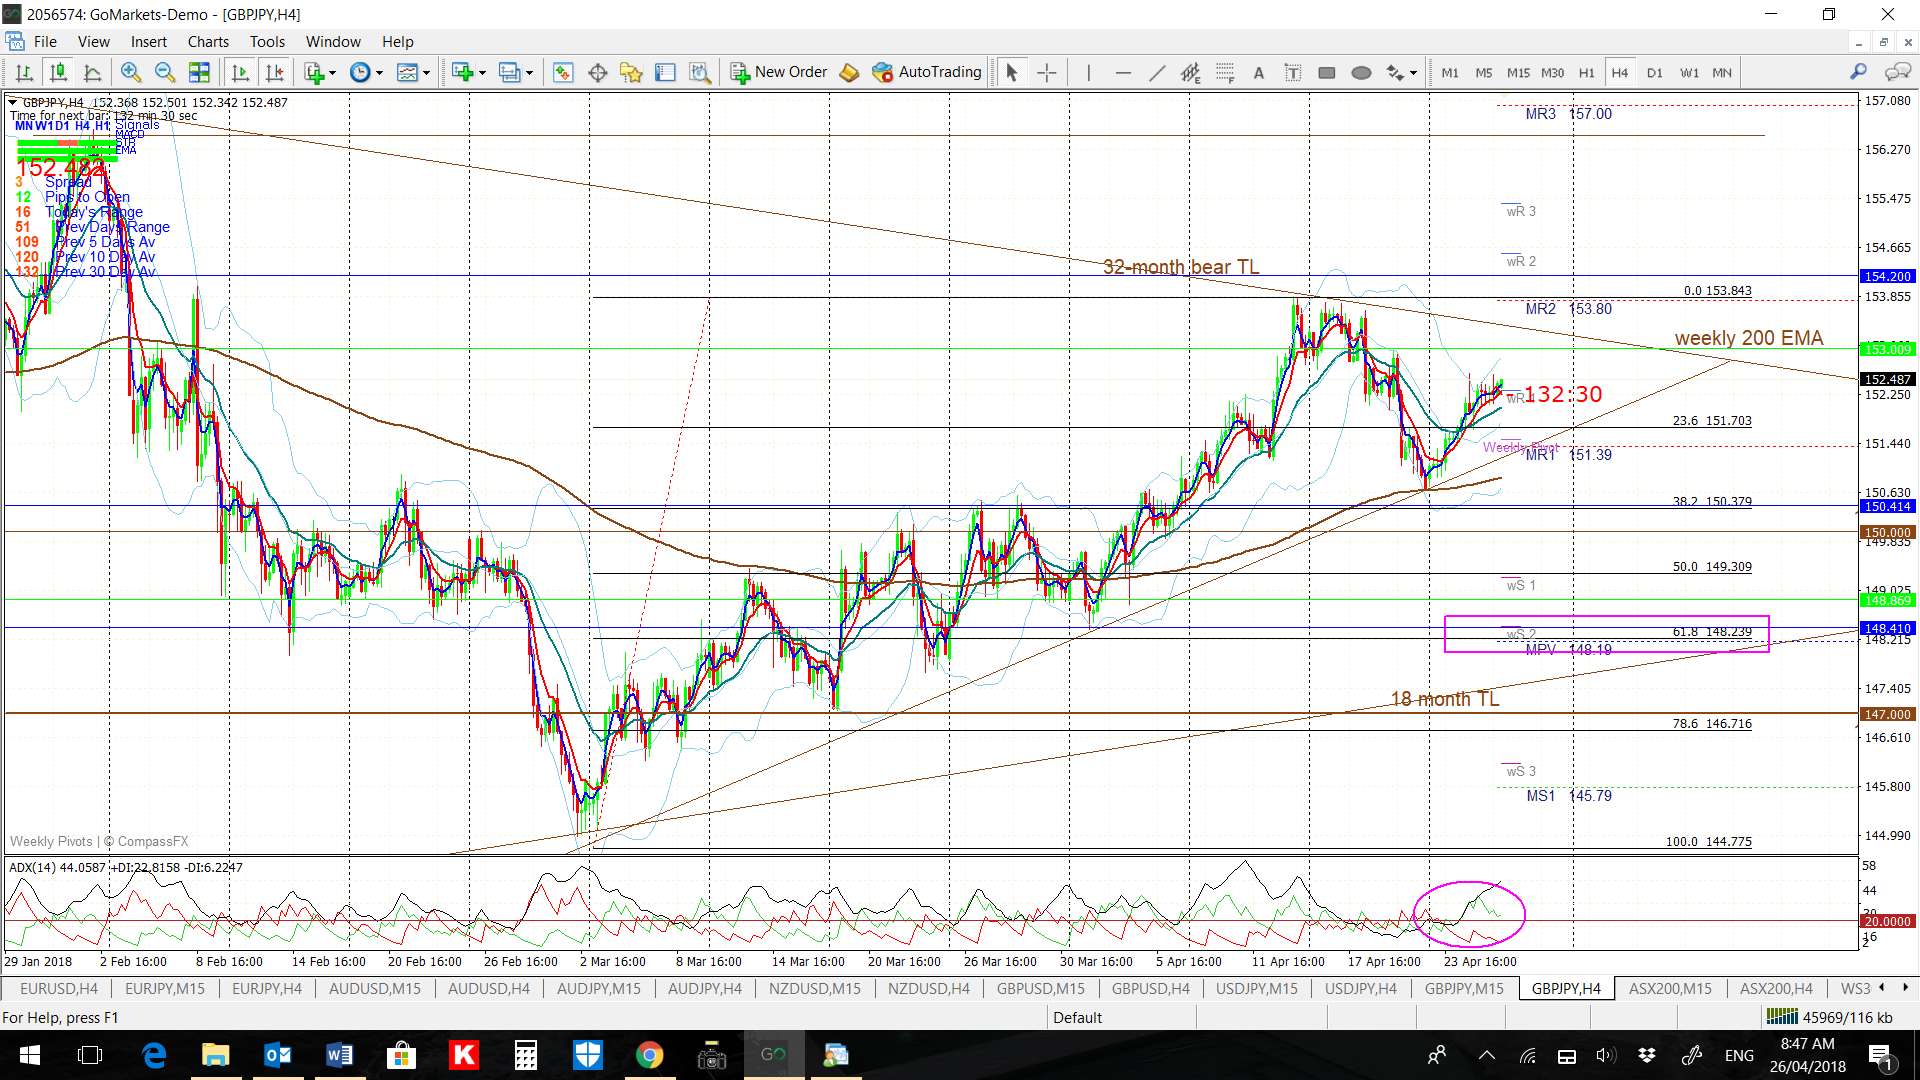
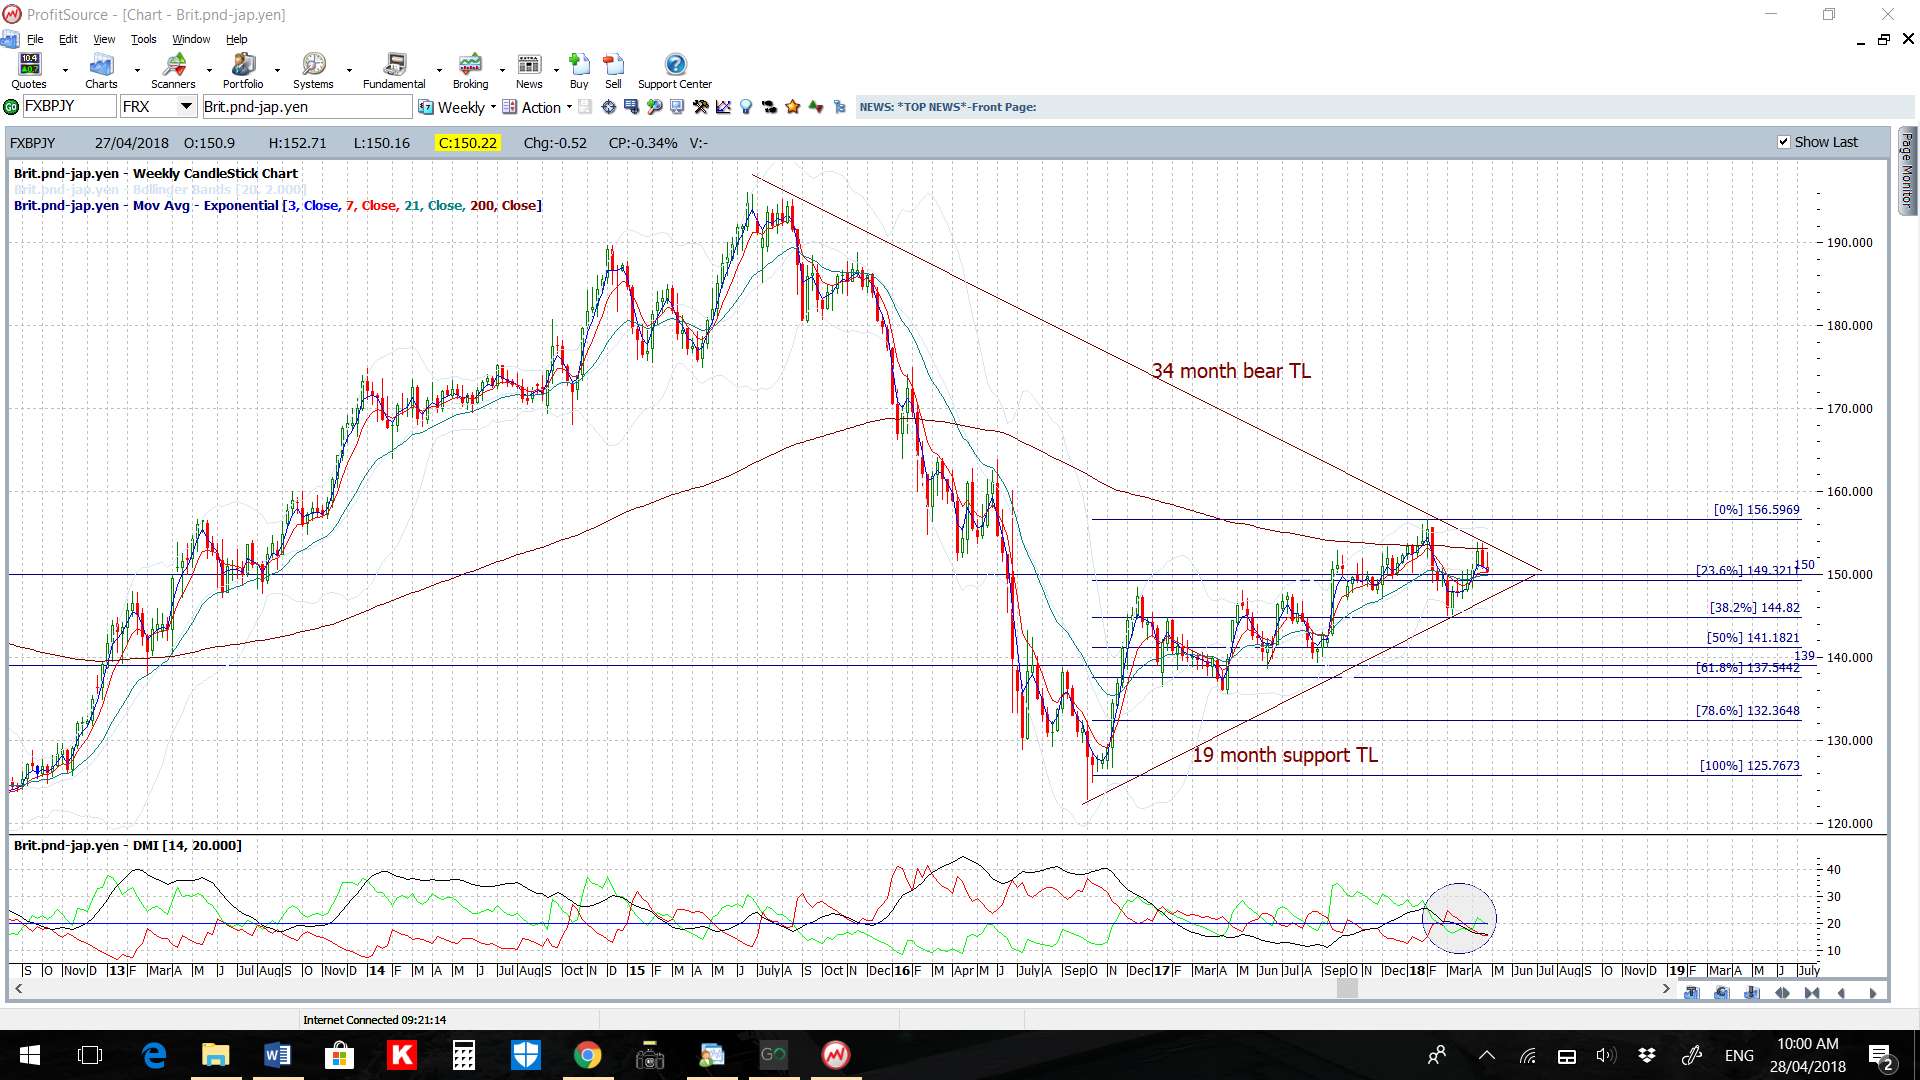
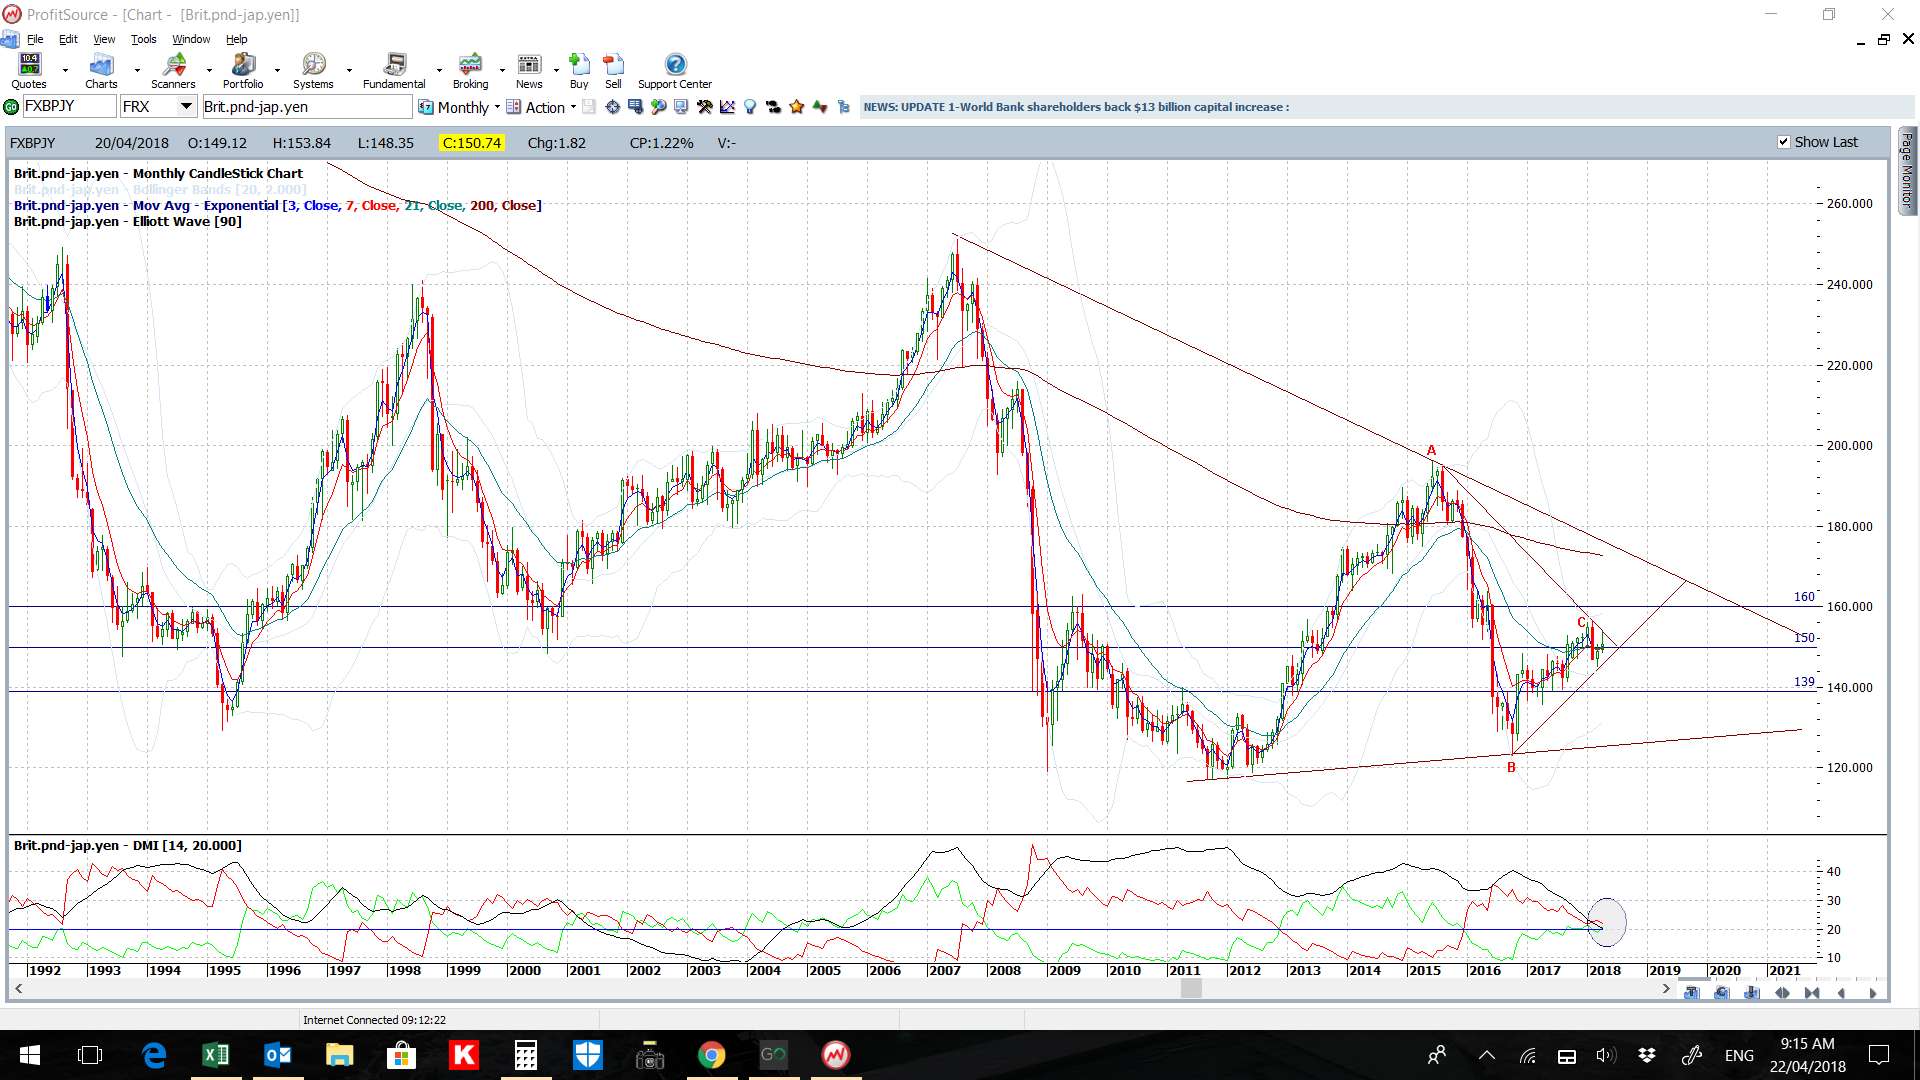
GBP/JPY: Ditto here for the Yen caveat with the Syrian news. The GBP/JPY pair closed the week just under a major long-term bear trend line and the weekly 200 EMA. This is a major resistance zone for this pair so I would not be surprised to see a pullback from here, especially in light of the weekend Syrian news and chance for some Yen strength to potentially develop.
Bullish targets: any bullish triangle breakout would bring the recent High, near 156.50, into greater focus.
Bearish targets: any bearish triangle breakout would bring the 150 followed by 148 levels into focus with the latter being near the long-term support trend line and 4hr chart’s 61.8% fib. After that, the 147, 145 and 139 levels would loom with the latter of these being near the weekly chart’s 61.8% fib region for added confluence.
- Watch for any new 4hr chart triangle breakout: