The Loonie is edging closer towards the apex of a monthly chart triangle pattern and looks to be setting up for an eventual breakout. Technical chart theory suggests this breakout could be worth up to 2,500 pips!
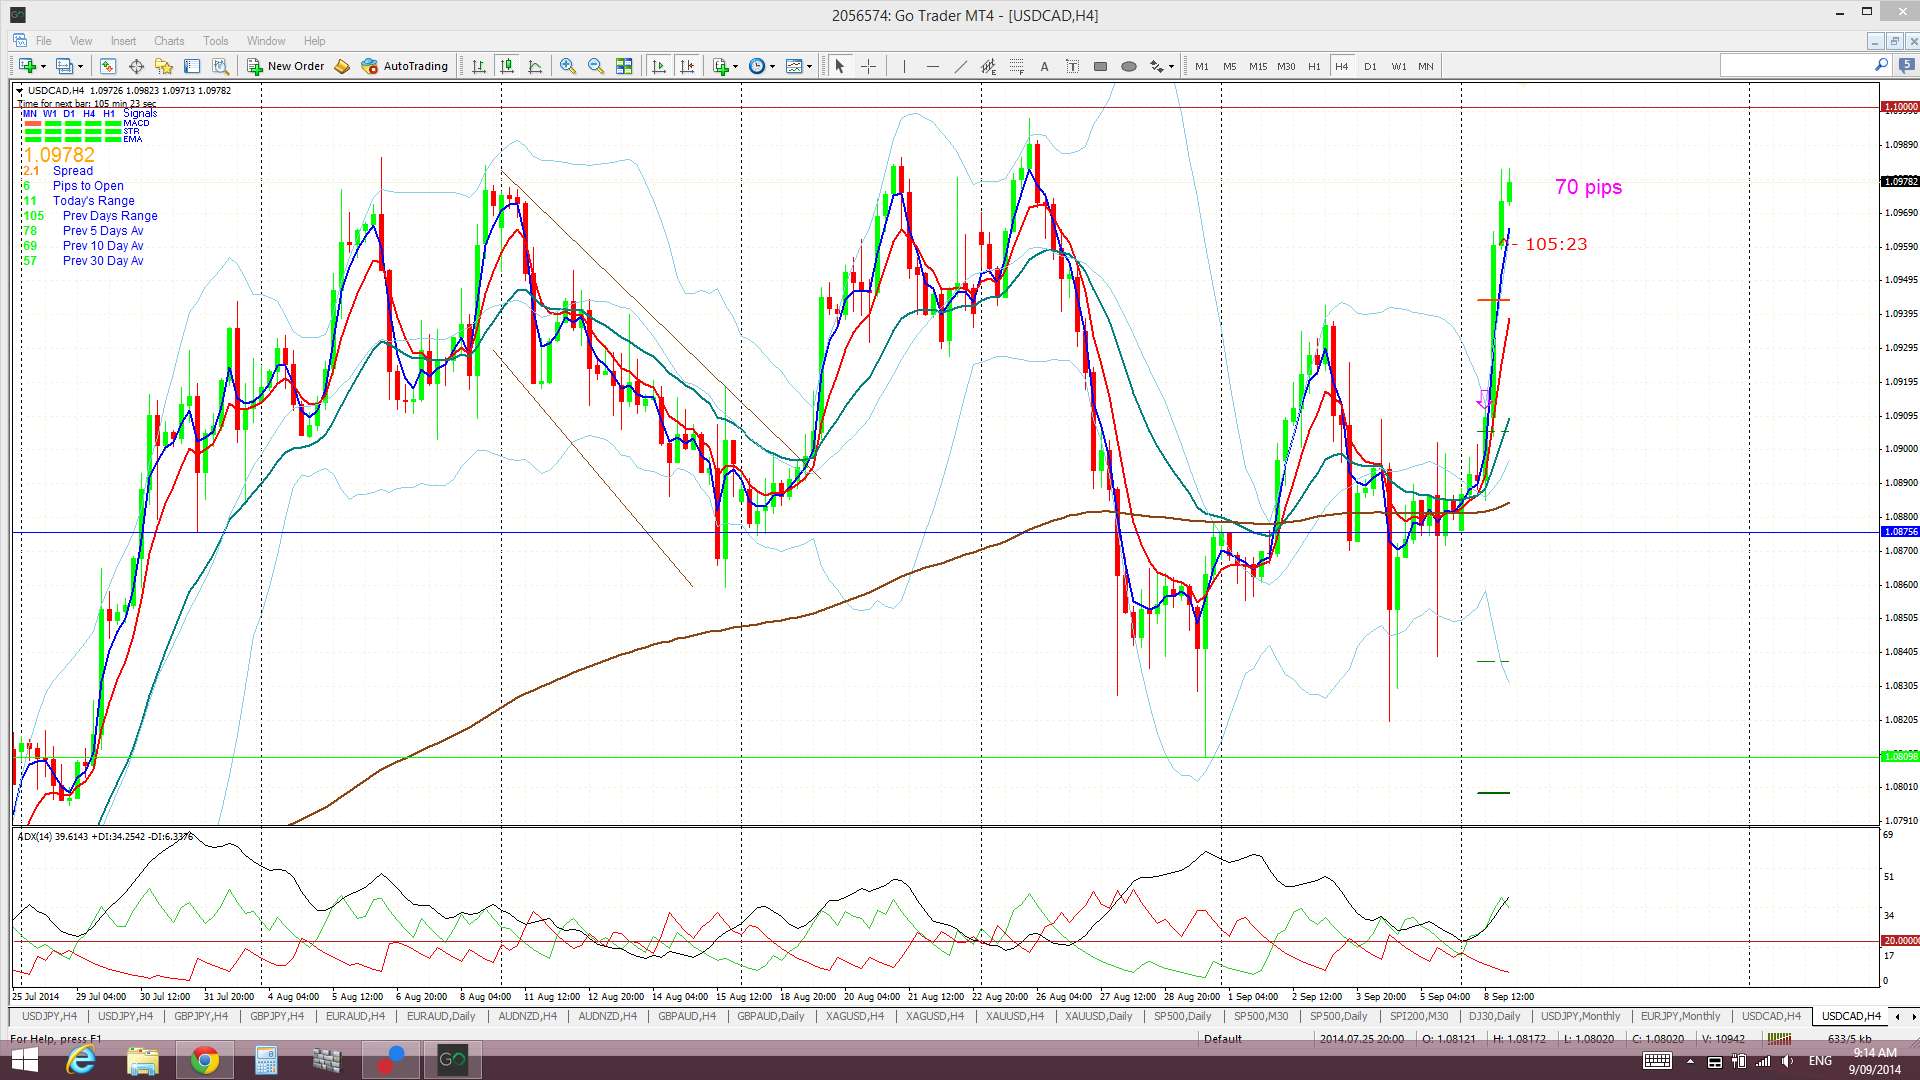
Those of you who follow this blog will know I was expecting a new TC signal to form up on my 7 pm signal last night. The slight pause in price action at the time, ahead of high impact CAD data, meant that a bearish candle printed and thus, no TC signal evolved. The next candle at 11 pm did trigger a new TC signal though and this has moved on by up to 70 pips.
Loonie 4hr: signal triggered off my 11 pm candle. This Loonie strength came despite better than expected CAD data and one could be forgiven for thinking this result might have lowered the Loonie. Hence, the ‘Loonie by name and Loonie by nature’ mantle continues to hold here. Not so my TC signal that I missed though:
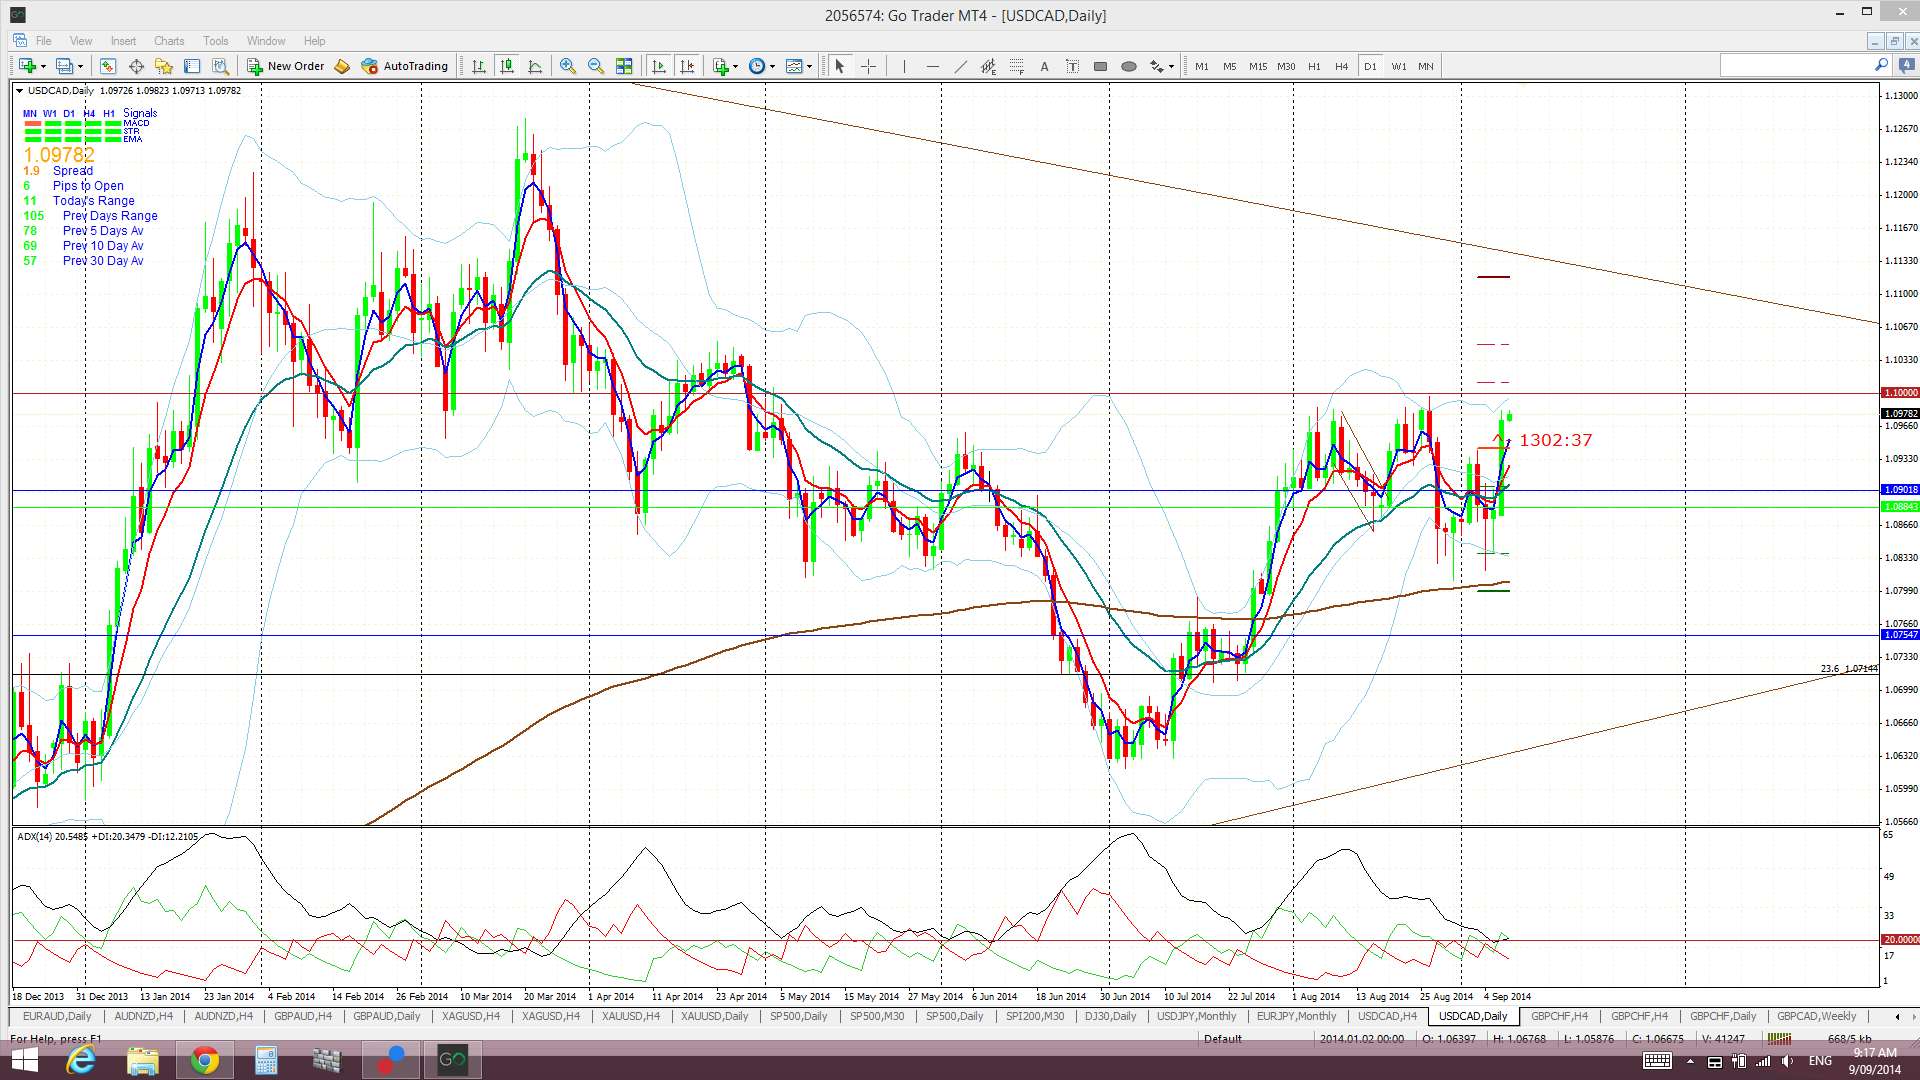
So where to now for the Loonie as it sits just under the key 1.10 resistance level?
Loonie daily: price sitting back up under the 1.10 level:
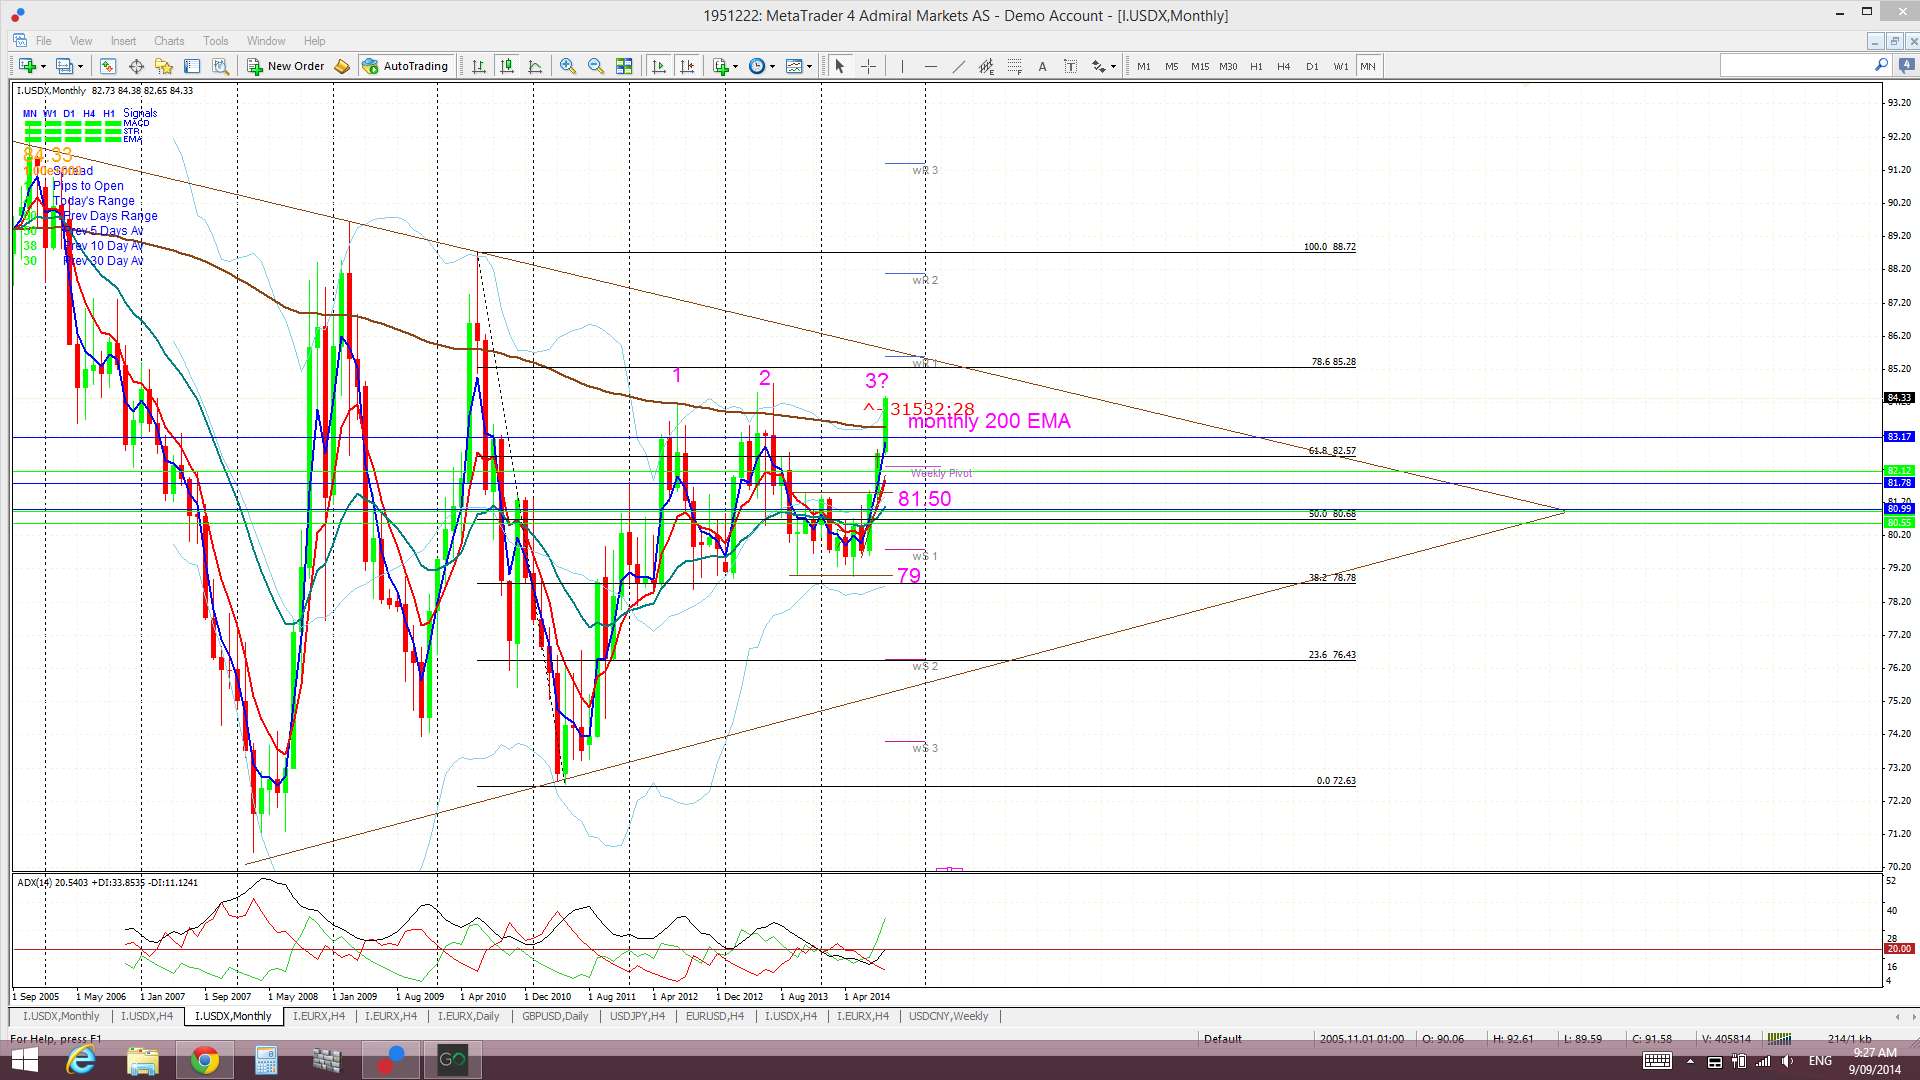
USD strength seems to be the dominant driver of price action here. The USD index is approaching some key resistance of its own though and this may feed into some uncertainty with the Loonie. Looking at the USD index monthly chart will help to explain this situation:
USDX monthly: the monthly chart shows that the index has been busy knocking off some key resistance levels but is about to face a major hurdle. This being a combination of the monthly 200 EMA and the monthly chart’s bear triangle trend line. Now the index may continue on its bullish mission and cut right through these but previous efforts at doing so over the last two years have failed and this has contributed to the developing bearish ‘Triple Top’ formation. The success, or otherwise, of the USDX bullish mission might determine the next directional move on the Loonie:
The Loonie is setting up in a triangle pattern of its own on the monthly chart as well and looks set to make an eventual breakout.
Loonie weekly: showing the Loonie is moving closer towards the apex of this consolidation triangle. Price is only about 140 pips under this major bear trend line and about 300 pips above the bull trend line:

Loonie monthly: this chart shows the triangle pattern fully and the extent of the bear trend line. The bear trend line has been active since 2001, that is, for over 13 years! The triangle pattern is symmetrical in nature and, thus, offers little guidance as to whether this breakout might be bullish or bearish. Either way, it doesn’t really matter as trend line breaks will hopefully offer some guidance here. The interesting point to note is that technical theory suggests a breakout move of up 2,500 pips!
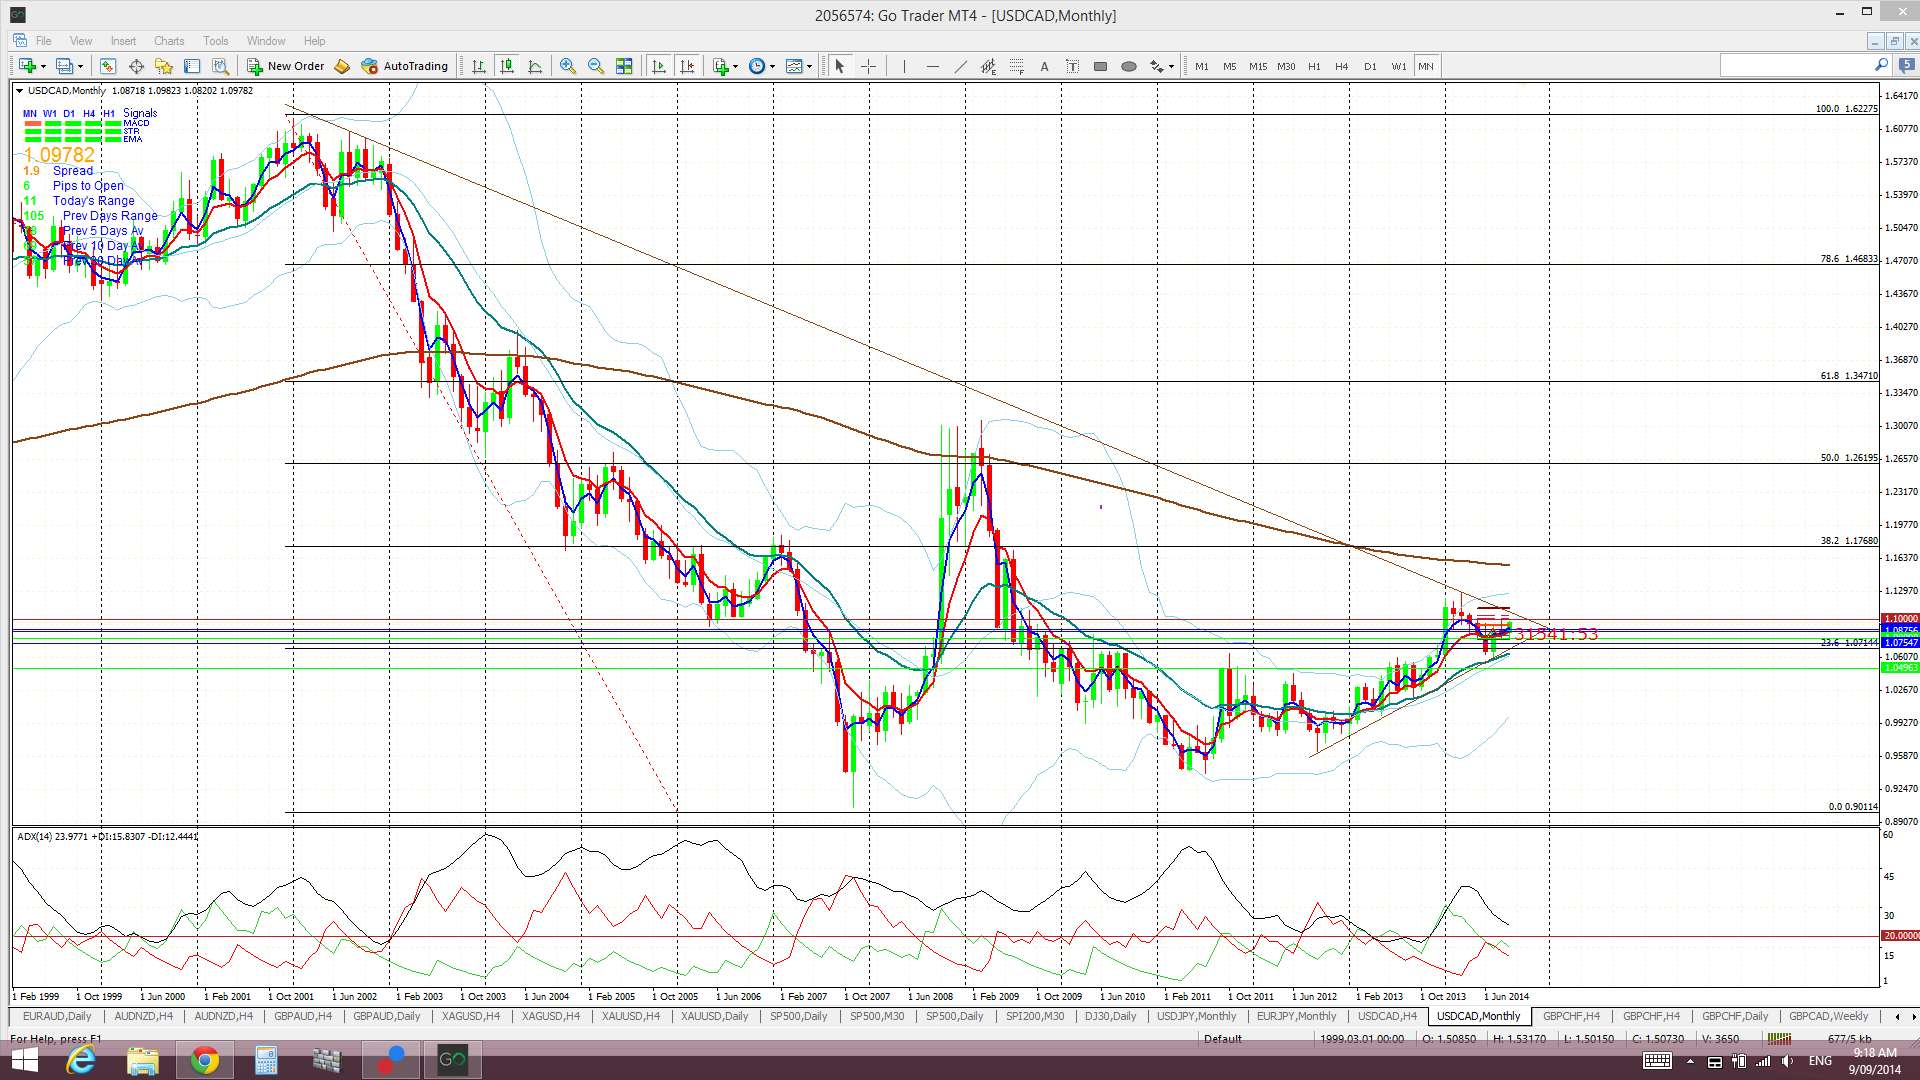
Triangle breakout target: This 2,500 pip figure is evaluated from the height of the triangle. I have been conservative here and used the triangle height from the beginning of the bull trend line, as shown in the chart below. The height of the triangle is around 2,500 pips and, thus, this could be the expected move from any breakout action. This is where it gets interesting! Extrapolating a bullish move from this triangle places price up at the 61.8% fib level. These fibs are popular targets in retracement moves and so this adds some confluence to this as a possible target.

Summary:
- The Looonie ie edging towards the apex of a monthly chart triangle pattern and looks set to make an eventual breakout.
- Technical chart theory suggests a breakout move of up to 2,500 pips.
- Watch trend line breaks for clues with this breakout move.
- The directional break on the Loonie might be dictated by the next major move on the USD index: a bullish breakout on the USDX might support a bullish triangle breakout on the Loonie. Reversal on the USDX might support a bearish Loonie breakout.
The post Loonie: 2,500 pip breakout looming? appeared first on www.forextell.com.