Last week: I had a disrupted week and missed noting some new TC signals on the Cable, Kiwi and Gold although these were short lived and had closed off by Friday. The Commodity currencies have held up fairly well for now though and some of them might get a shove on Monday following the release of some Chinese high impact data. It’s also been a bit strange, trading-wise, with both US$ and EUR$ weakness peaking through and this might help to explain the large number of indecision-style weekly candles that have evolved on many instruments. It’s also no surprise then that the major market S&P500 index is trading within a consolidation-style triangle pattern!
Next week:
The US$ has been under pressure for the last few weeks but remains range bound for the time being although the lower level of this range is coming into greater focus. A review of the FX indices can be found through this link.
The main items of high impact economic data start their appearance on Monday with Chinese GDP and Industrial Production and these could set the tone to start off the week. There is also the BoC (CAD) and ECB (EUR) interest rate announcements, on Wednesday and Thursday respectively, where the ECB commentary will be closely watched for any guidance about future easing.
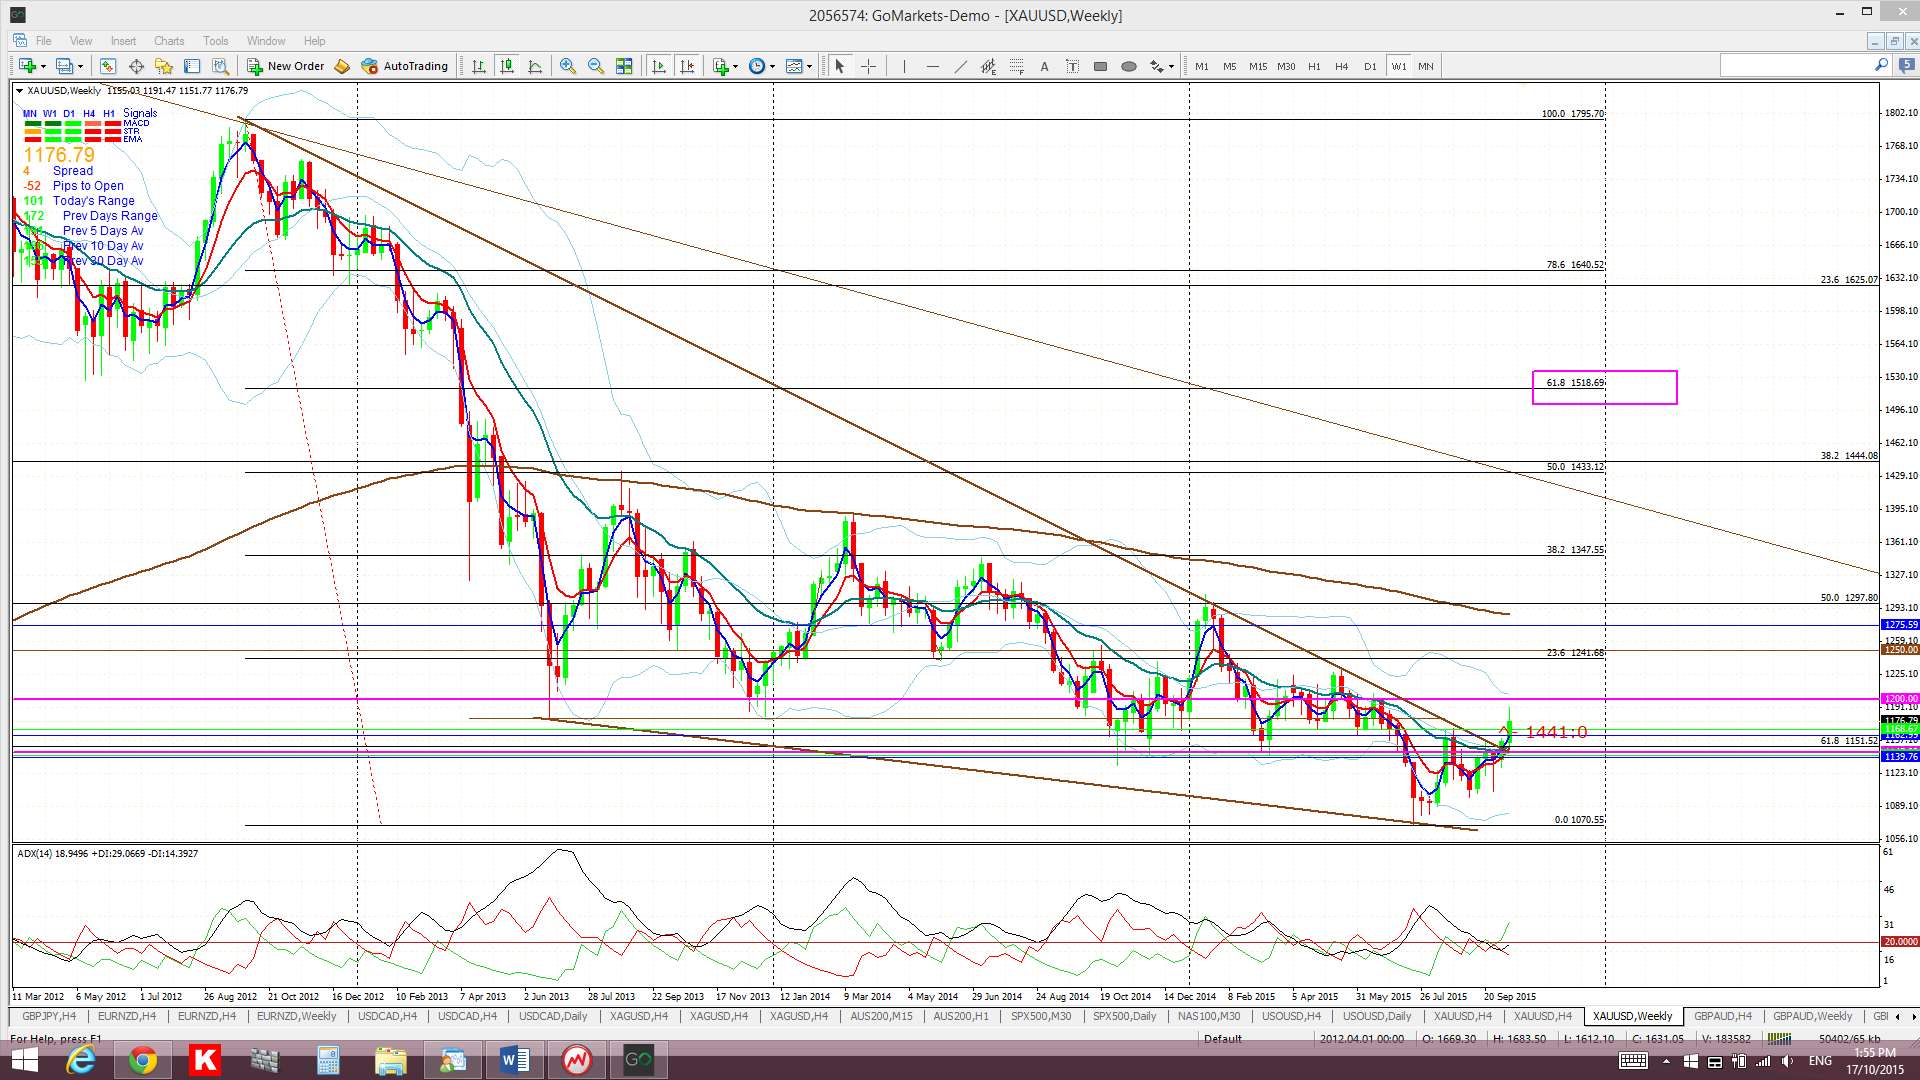
Gold: the bullish wedge breakout is continuing but I would not be surprised if this pulled back for another test of the key $1,150 / $1,145 region again before any possible bullish continuation.
S&P500: this is a significant metric of broad-based market sentiment and I have tallied the bearish and bullish technical signals currently seen on this index. I have long claimed that currency traders should keep abreast of the sentiment on stocks in a kind of ‘left hand knowing what the right hand is doing’ kind of way.
Indecision candles: A large number of trading instruments seem to be having this problem:

Indecision-style weekly candles have been printed on a large number of trading instruments in the form of either Doji, Spinning Top or Inside candles. The victims that I have noted include the: E/U, E/J, A/U, A/J, GBP/JPY, USD/CAD, GBP/AUD, DAX, FTSE, Russell 2,000, Canada’s TSX, Australia’s XJO / XAO and, finally, Copper. Thus, you’re not alone if you’re struggling to work out direction!
NB: I am away next w/e and so there will only be brief updates during that time.
Stocks and broader market sentiment:
Global stock indices closed mixed for the week with the S&P500, DJIA & NASDAQ closing higher but the FTSE, DAX, TSX (Canada), Russell 2000 and the XJO (Aussie) closing lower. US stocks seem to have been buoyed by the thought of continuing ZIRP whereas other markets remain a bit nervous about global growth following some weak Chinese data.
The S&P500 is a major market index and is a bit of a barometer of overall market appetite for risk. There are a range of technical signals on this index at the moment and I have classified these into bullish vs bearish to see if one sentiment dominates and this is what I came up with. So, you decide:
S&P500 Bullish Signals:
- trading above the psychological 2,000 level.
- trading above the daily Cloud.
- has triggered a recent bullish Tenkan/Kijun cross on the daily chart.
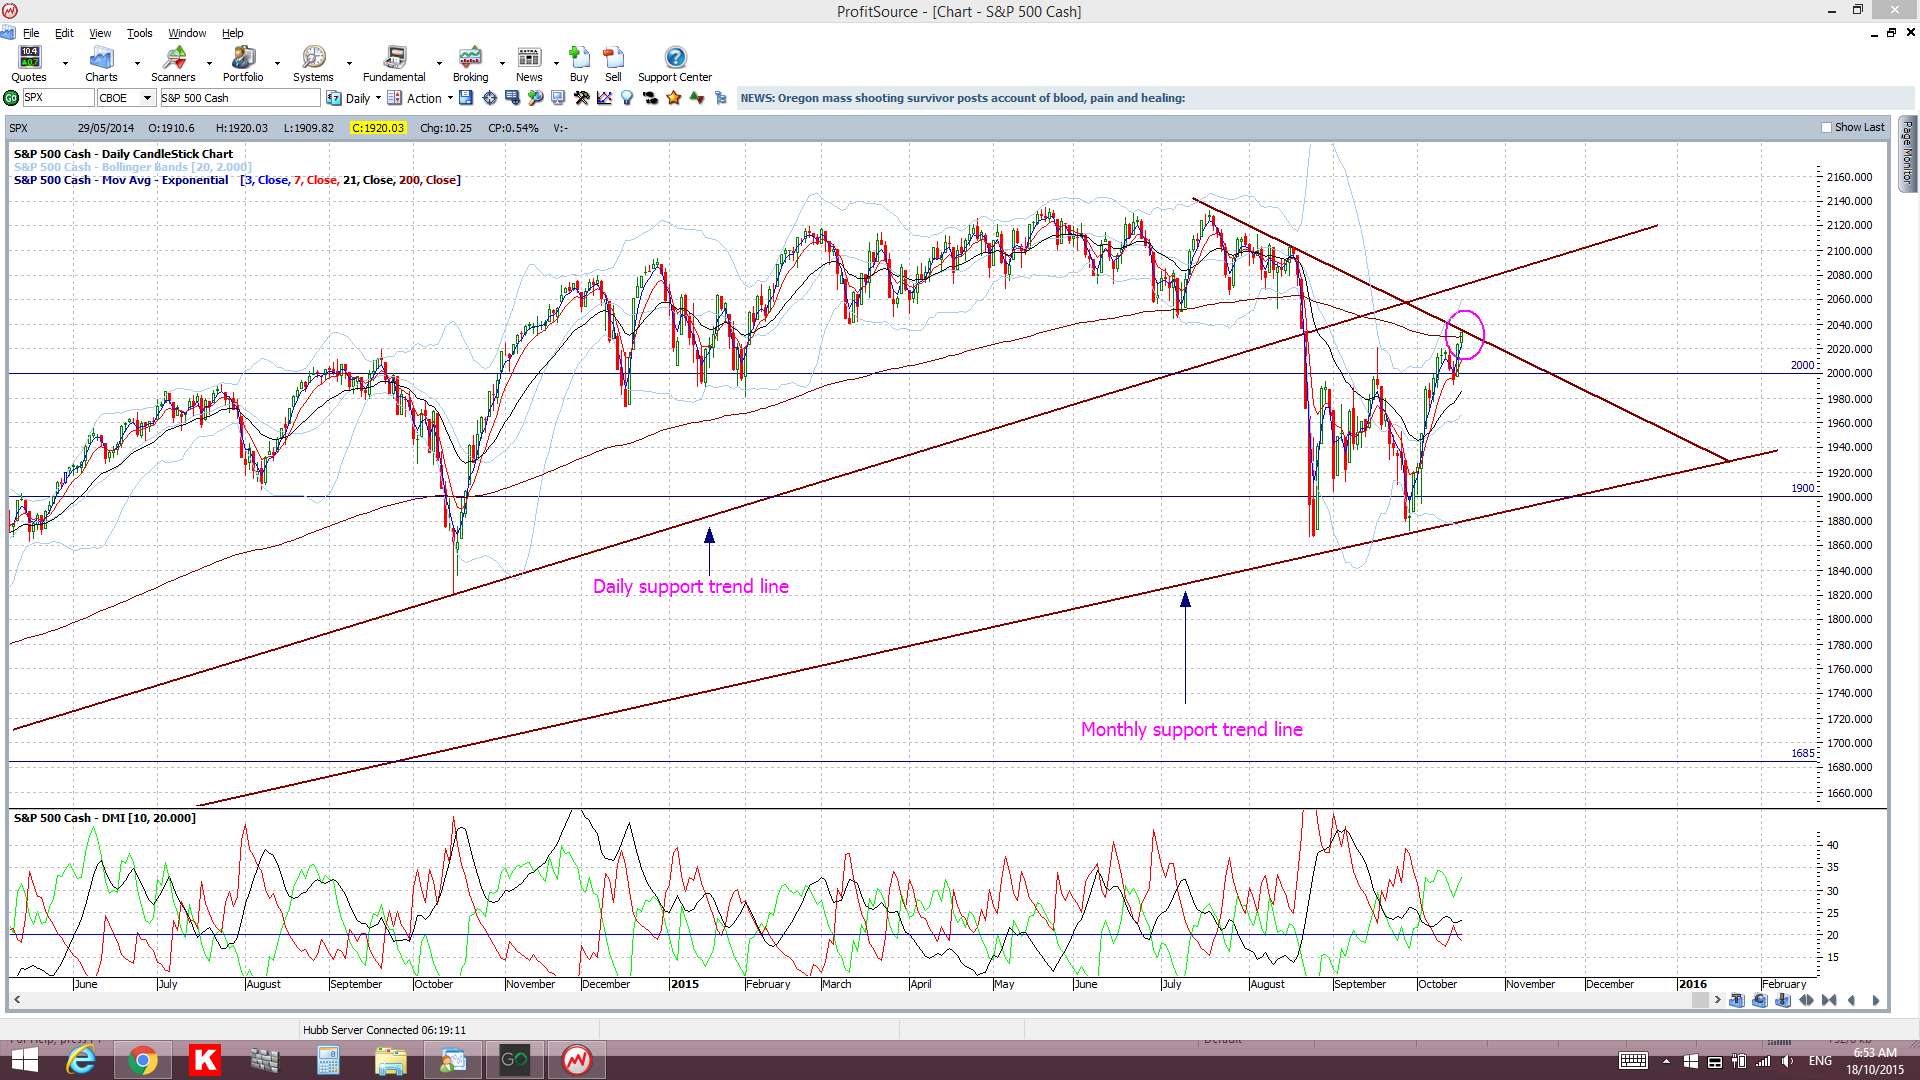
- trading above a monthly support trend line.
- the current monthly candle is bullish and engulfing.
- Friday’s daily candle closed back above the 200 EMA.
S&P500 Bearish Signals:
- the daily chart’s ‘Death Cross’ remains open.
- trading within the weekly Cloud.
- a bearish Tenkan/Kijun cross remains open on the weekly chart.
- trading below a daily support trend line.
- trading below the all time high.
Thus, I continue to watch out for further clues as to any new momentum move, long or short though! In particular I’m looking out for:
S&P500 daily chart: The index has closed above the psychological 2,000 level but is still trading between the daily and monthly support trend lines. I have adjusted the recent bear trend line here though as the previous, apparent, breakout was not fully supported by the ADX and, thus, it has been adjusted. This is giving a symmetrical triangle appearance to the daily chart but a bit of a Bull Flag look to the weekly. I also note that Friday’s candle closed back above the 200 EMA and that is something to crow about! I may have to give up on my hope for a test of 1,600 though 
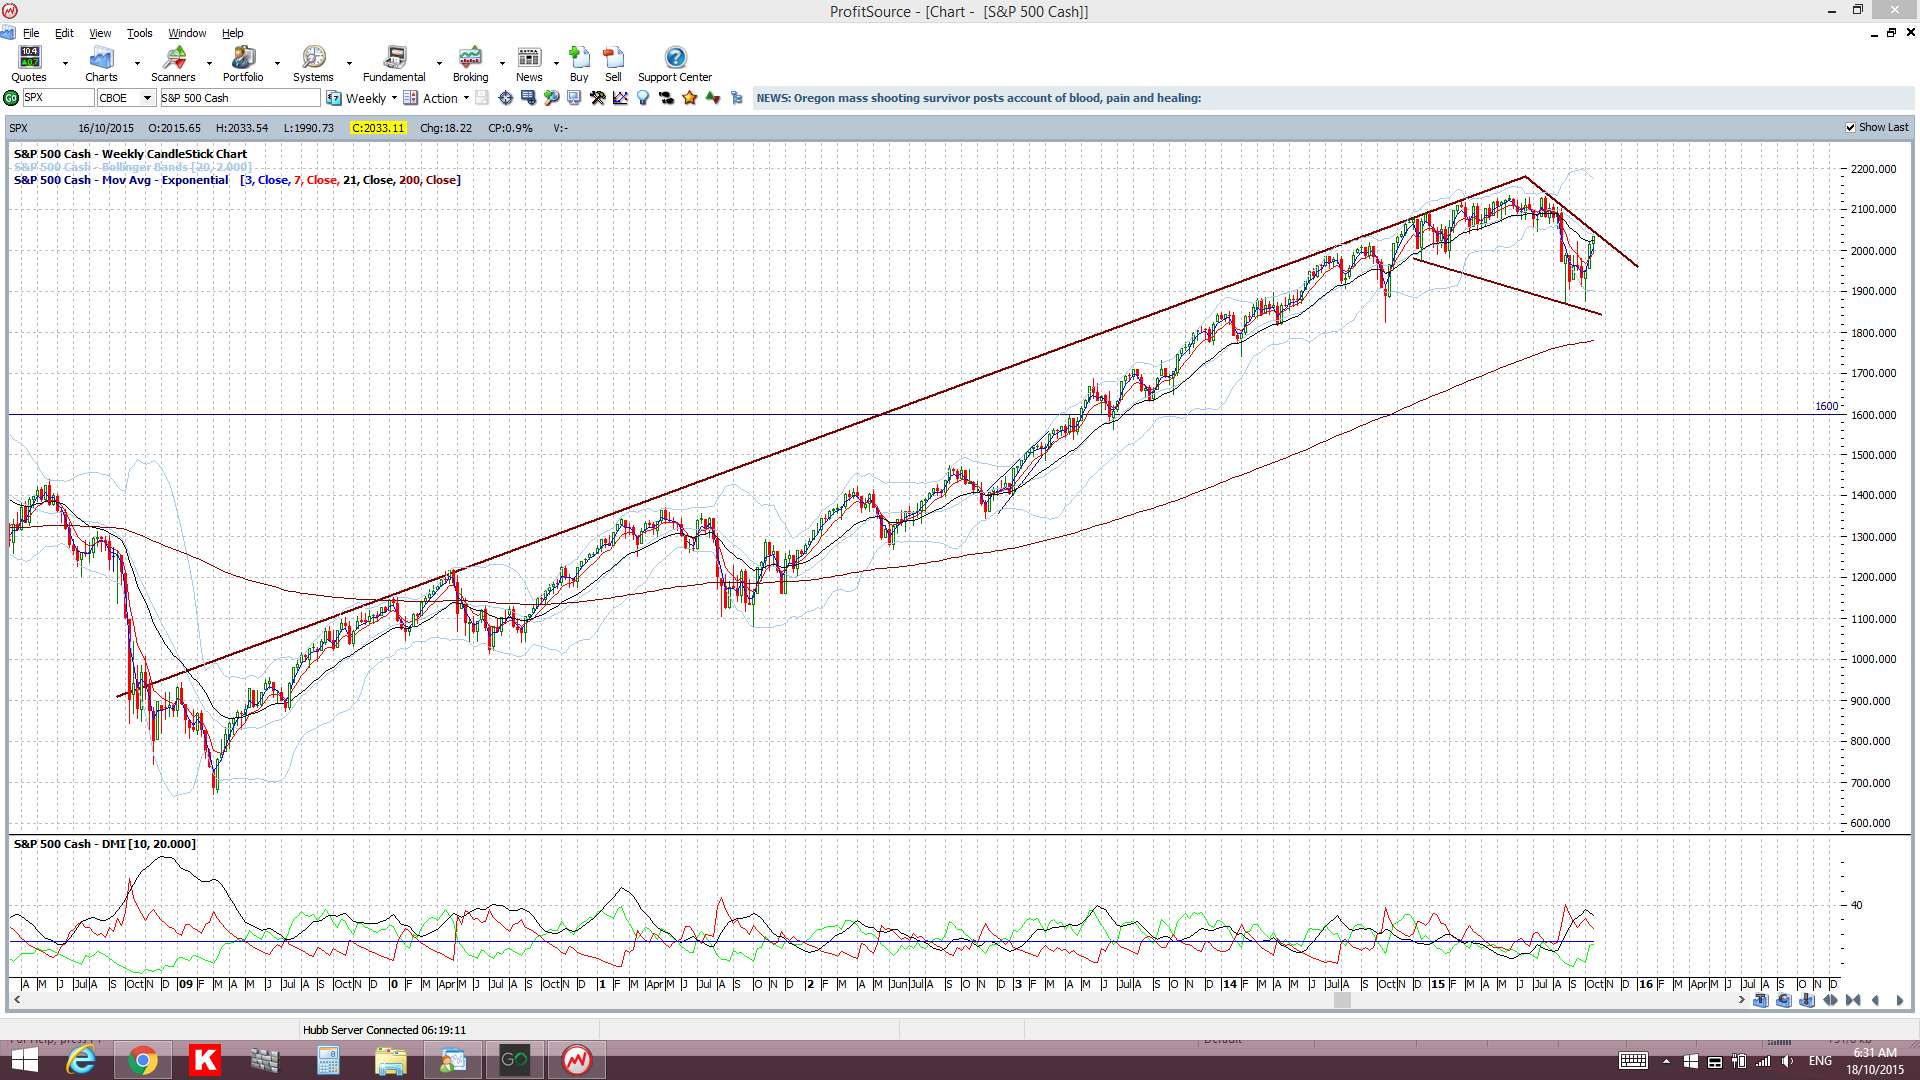
S&P500 weekly: this still has a bit of a Bull Flag look to it. I have adjusted the trend lines here though as the previous breakout did not evolve with supporting ADX momentum on the daily or weekly charts:
Ichimoku S&P500 daily chart: a clear cross of the blue Tenkan-sen line below the pink Kijun-sen line. There has been a new bullish Tenkan/Kijun cross, albeit a ‘weak’ signal, but price is also above the Cloud and the key 2,000 level:

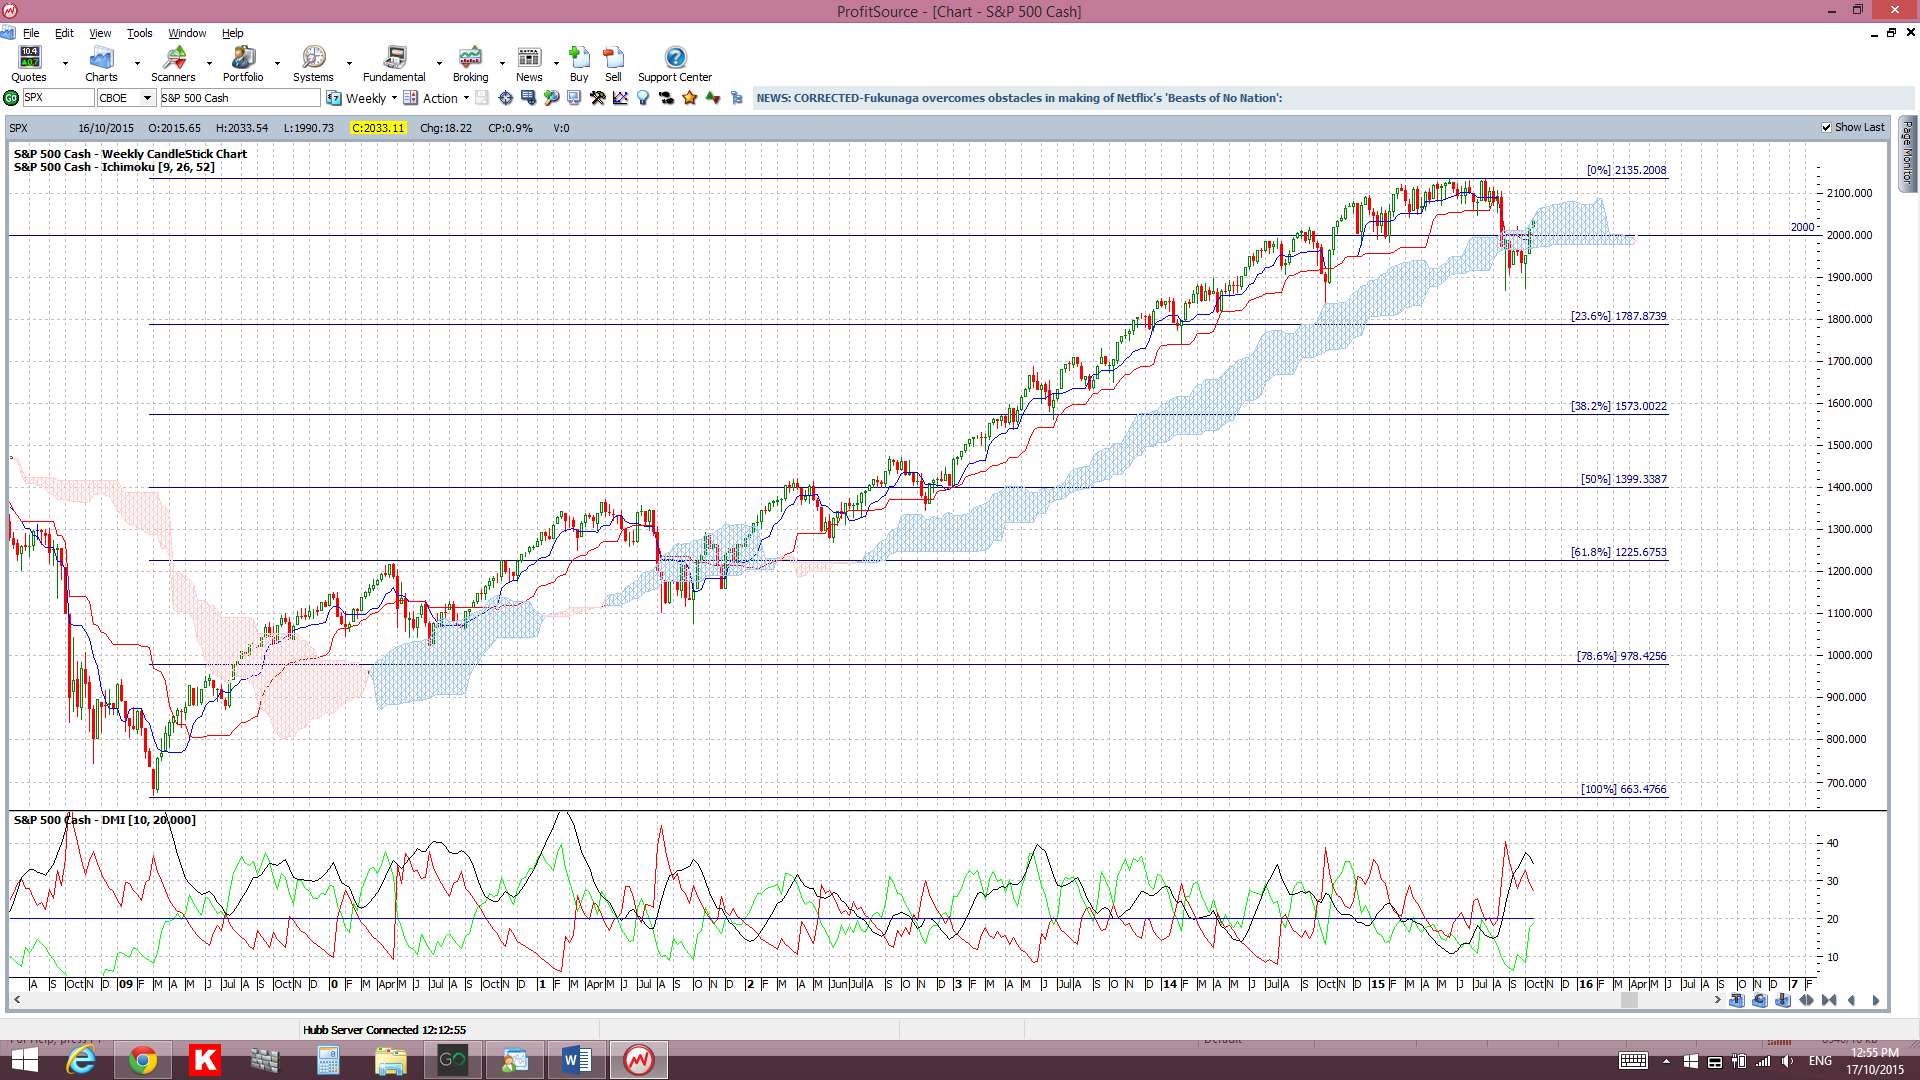
Ichimoku S&P500 weekly chart: the weekly candle closed as a bullish candle but still within the weekly Cloud. A bearish Tenkan/Kijun cross remains open BUT I would want to see a sustained bearish move below the Cloud to support bearish sentiment. Note how the weekly Cloud remains aligned along the key 2,000 level:
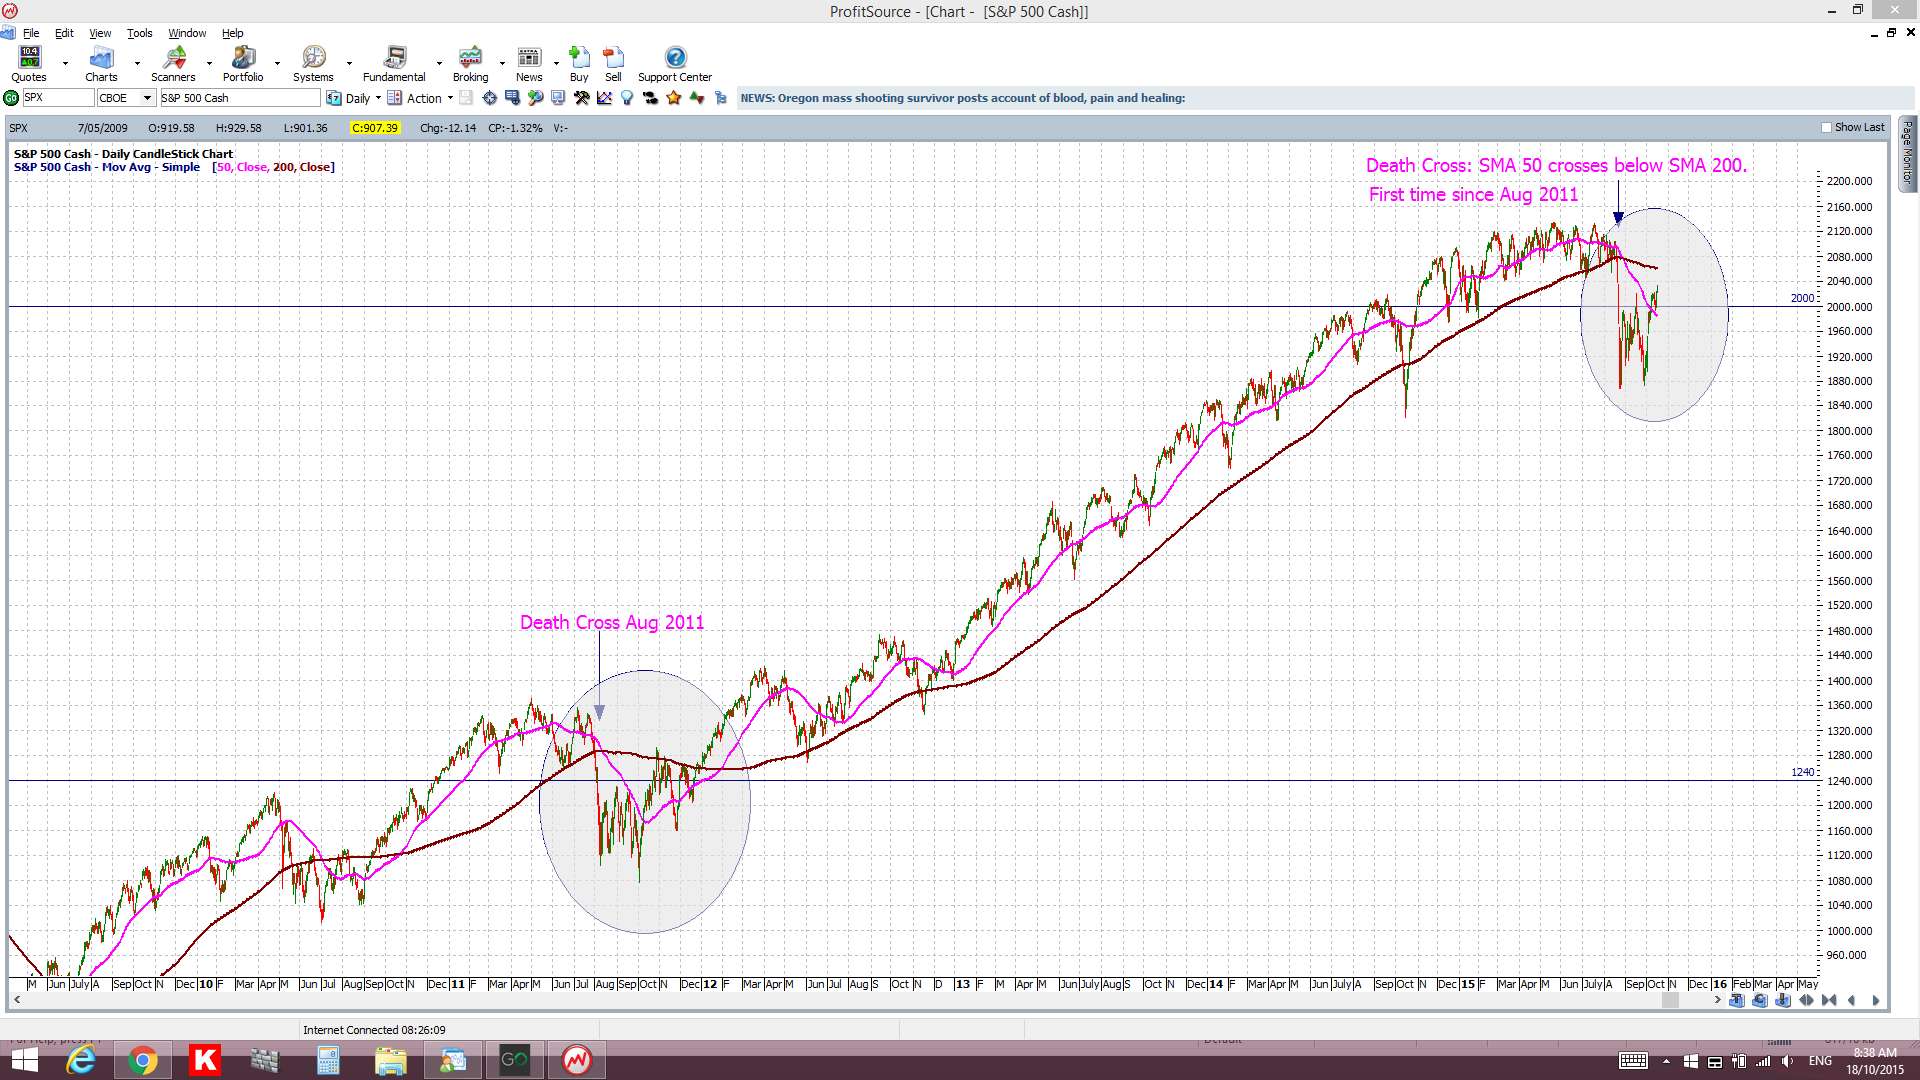
S&P500 Death Cross: the daily chart still shows an open Death Cross. However, I do note the last Death Cross, back in Aug 2011, was relatively short-lived and, given that the recent Cross looks to be shaping up rather similarly, I’m wondering if it might be short-lived too?!
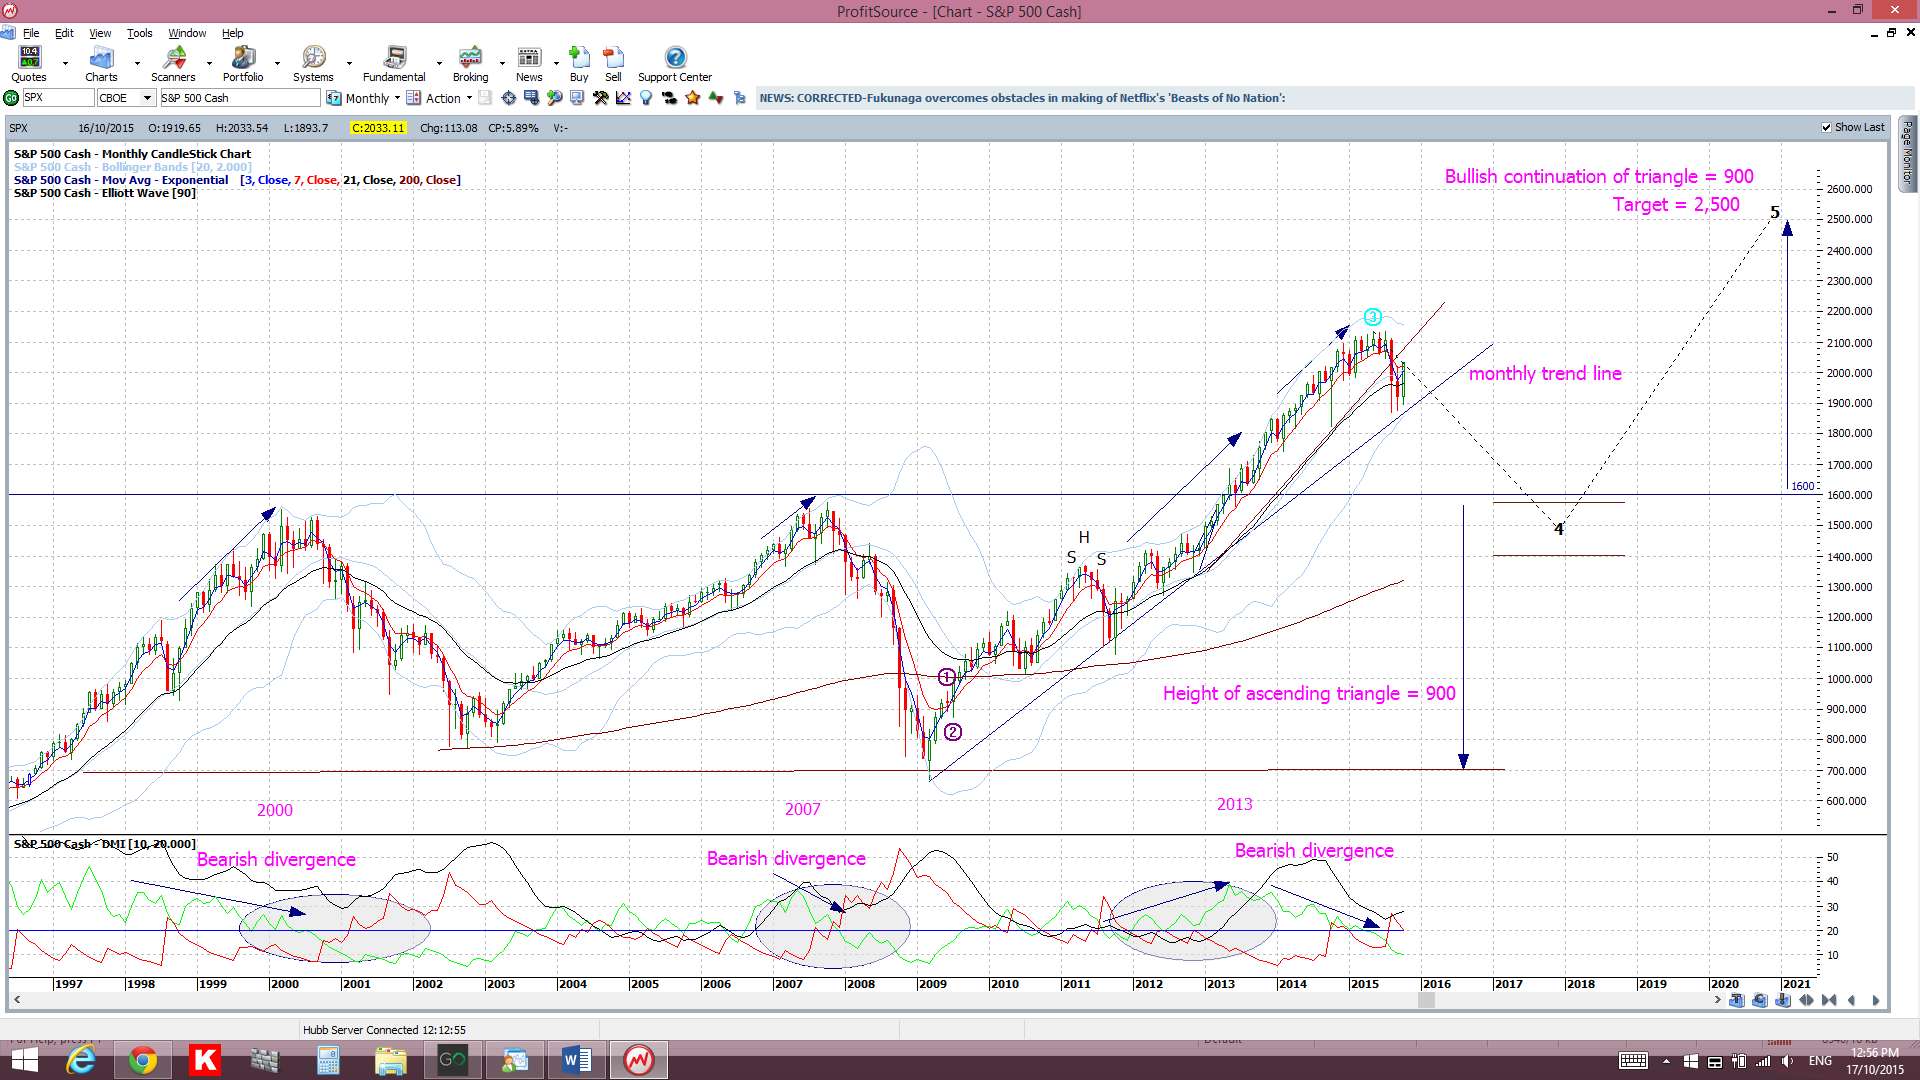
S&P500 monthly chart: a break of the monthly support trend line. The monthly trend line remains intact for now but a break of this support level would suggest to me of a more severe pull back. Bearish divergence on the monthly chart had warned of recent weakness and I, like the Elliott Wave indicator, had been looking for a test of the 1,600 region but this might not evolve. Any new monthly close back above the 2,000 level would help to support the recovery thesis here:
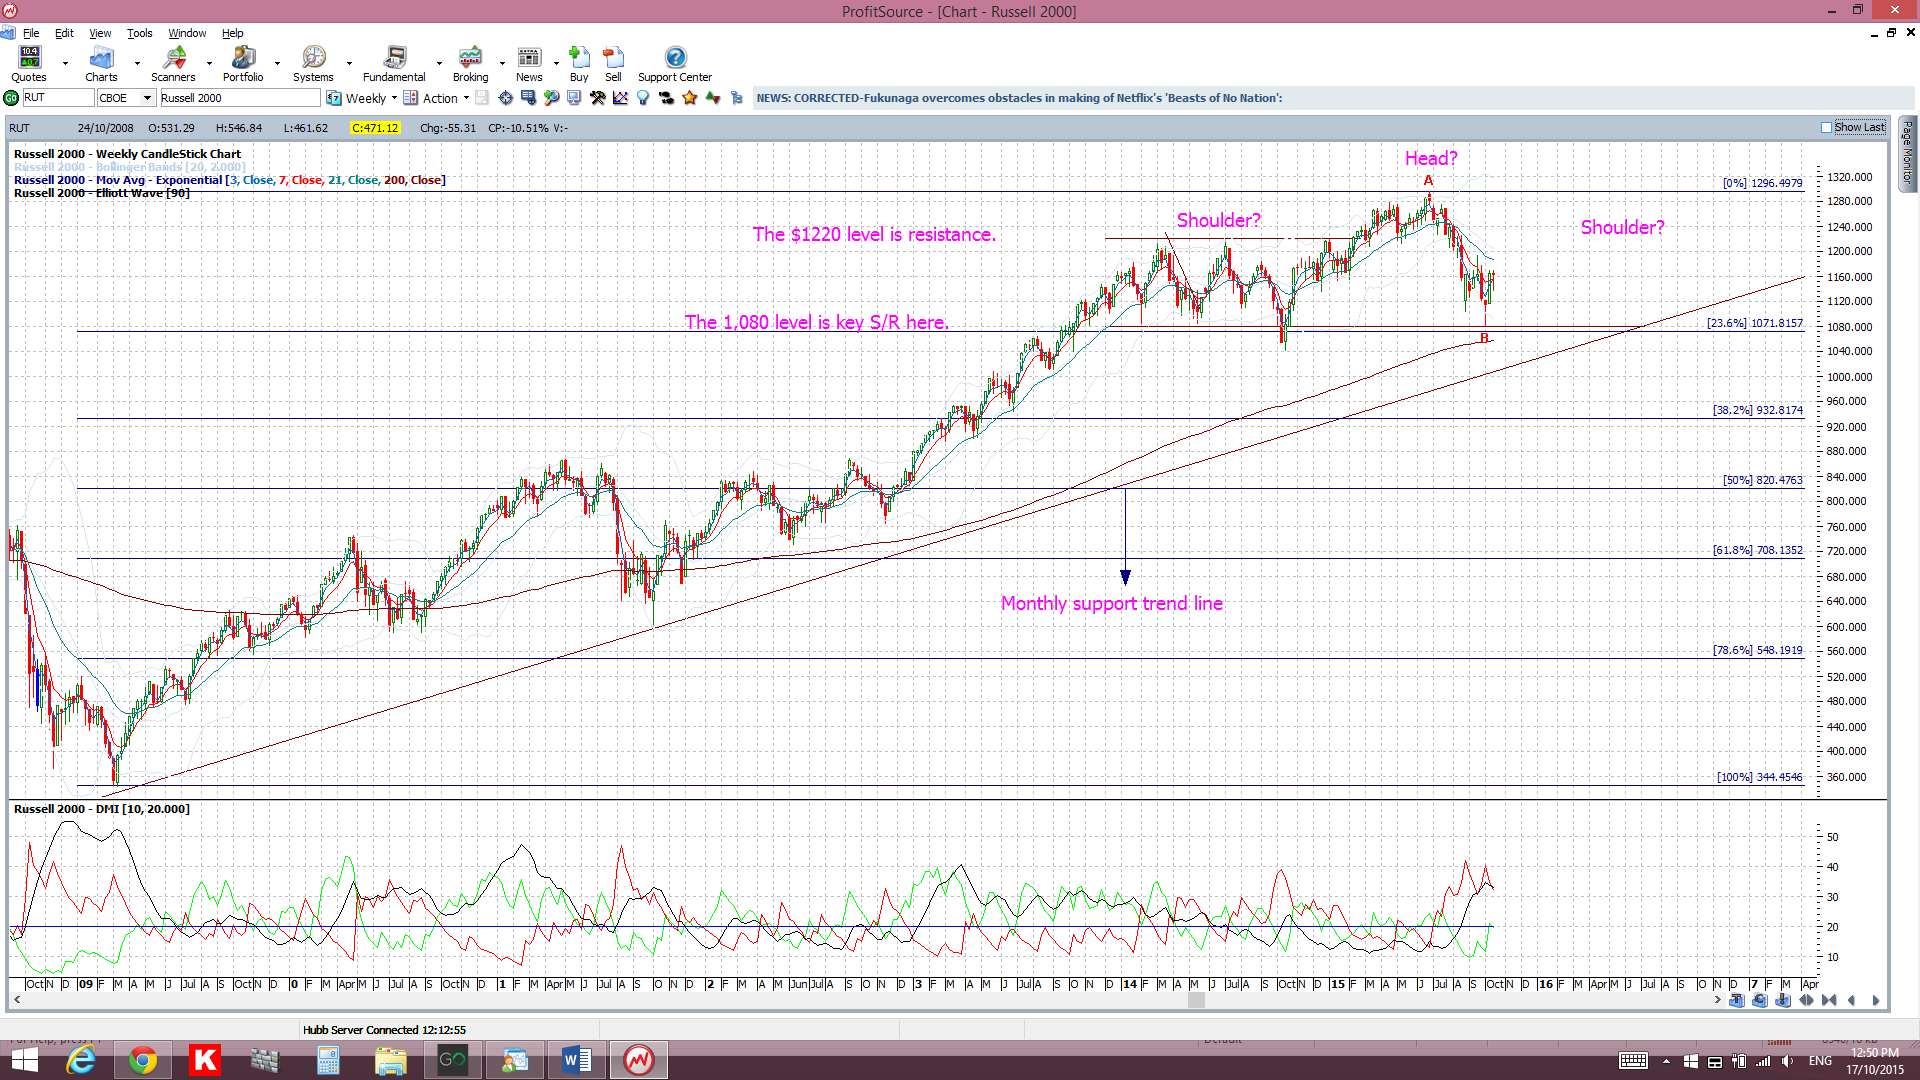
Russell 2000 Index: this small caps index is considered a US market ‘bellwether’ and does have a bit of a potential bearish H&S brewing but any new close and hold back above $1,220 would void this. The weekly candle closed as a bearish coloured Doji and ‘Inside’ candle with both patterns reflecting indecision.
VIX Index: The ‘Fear’ index is below the 30 level and has printed a bearish weekly candle.

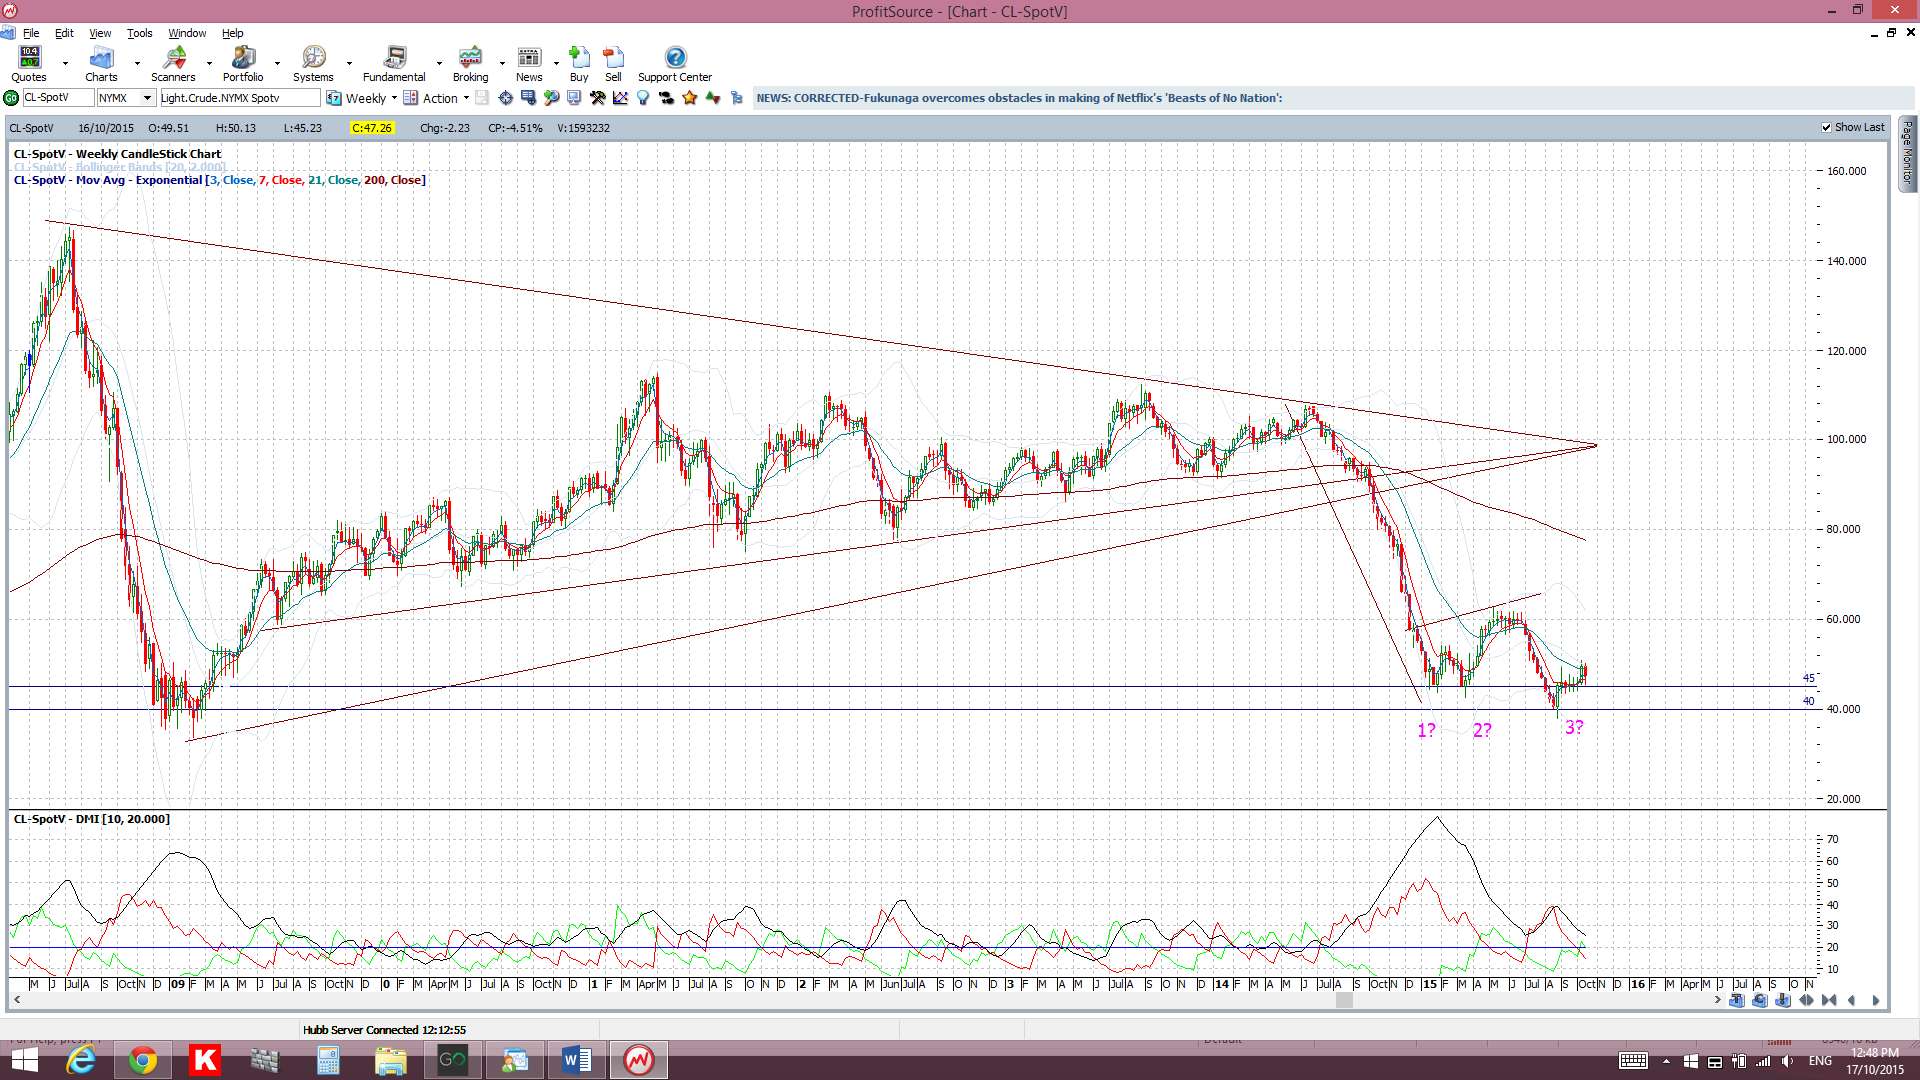
Oil: The ‘Triple Bottom’ continues to take shape with the $45 level holding as decent support. The weekly candle closed as a bearish coloured, almost ‘Inside’ candle reflecting some indecision here too.
Trading Calendar Items to watch out for:
- Mon 19th: CNY GDP & Industrial Production.
- Tue 20th: AUD Monetary Policy Meeting Minutes. USD Building Permits. NZD GDT Price Index.
- Wed 21st: CAD Interest rates, Policy Statement & Press Conference.
- Thurs 22nd: GBP Retail Sales. ECB Min Bid Rate & Press Conference. CAD Core Retail Sales. USD Unemployment Claims.
- Fri 23rd: EUR French & German Flash Manufacturing PMI. CAD Core CPI.
Forex:
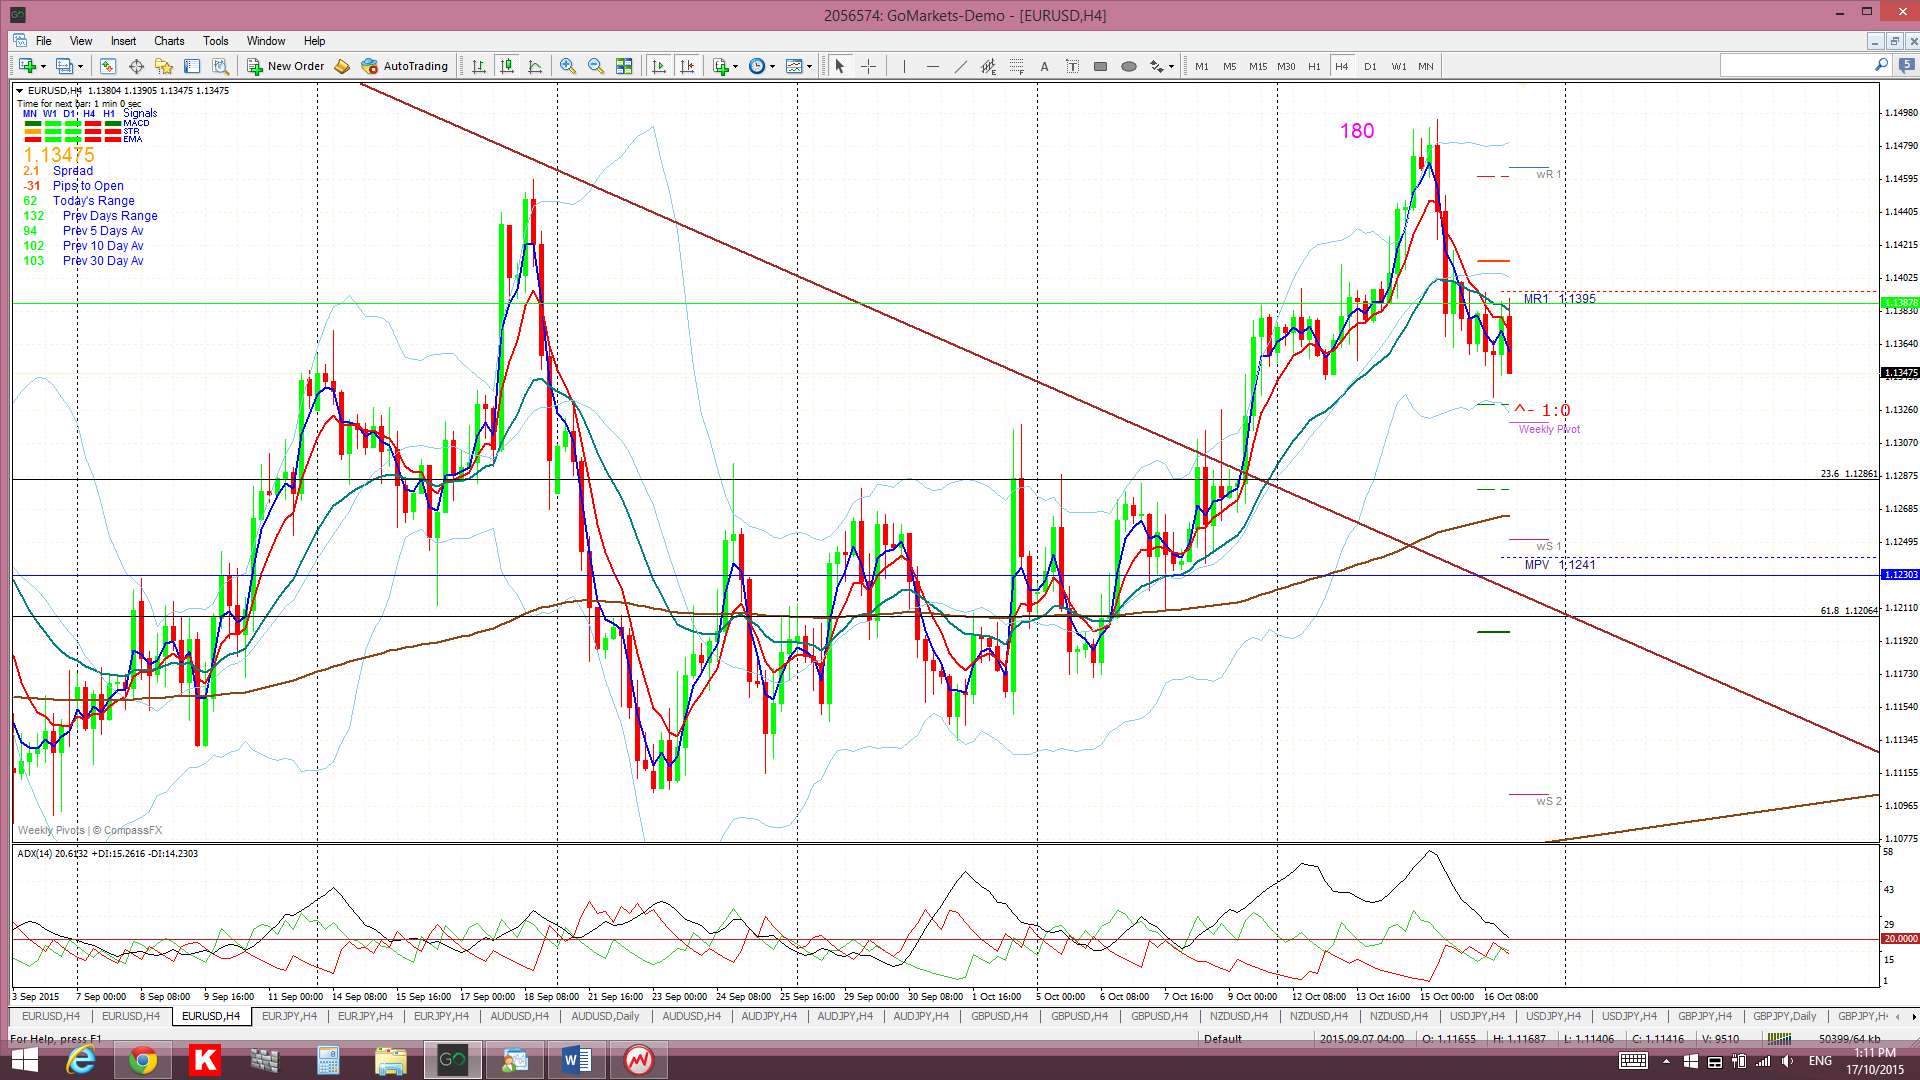
E/U: The E/U triangle breakout gave over 180 pips before reversing after Thursday’s dovish ECB comments.
The weekly chart remains the bigger picture story here though and, like with the EUR index, the E/U has been trading in what looks like a Bear Flag for many months now. The top region of this Bear Flag is the 1.18 level and this is also the baseline of the previously broken monthly-chart based triangle pattern and a key S/R region so any move and hold back above this trend line may prove significant and indicate a polarity shift here.
As I have been noting over recent weeks, traders need to keep an eye on the weekly chart’s Flag trend lines for any breakout, bullish or bearish:
- Any new trend line breakdown and continuation could signal the start of a weekly-chart Bear Flag breakdown worth up to 3,500 pips. Keep an eye on the lower flag trend line, and also the recent low down near 1.045, in case they offer up any support.
- Any break and hold back above the 1.18 region could signal continued bullish momentum.
Descending triangle on the monthly chart: There is still an overall bearish pattern in play on the E/U monthly chart: a 4,300 pip bearish descending triangle breakdown on the monthly chart. The descending triangle pattern is a bearish continuation pattern and has a base at around the 1.18 level. The height of this triangle is about 4,300 pips. Technical theory would suggest that the bearish breakdown of this triangle below 1.18 might see a similar move. It is worth noting that this would bring the E/U down near 0.80 and to levels not seen since 2000/2001!
Price is trading above the Cloud on the 4hr & daily charts, in the bottom of the weekly Cloud but below the Cloud on the monthly chart.
The weekly candle closed as a bearish coloured Doji reflecting some indecision.
- I’m watching for any new TC signal on this pair and the Bear Flag trend lines.


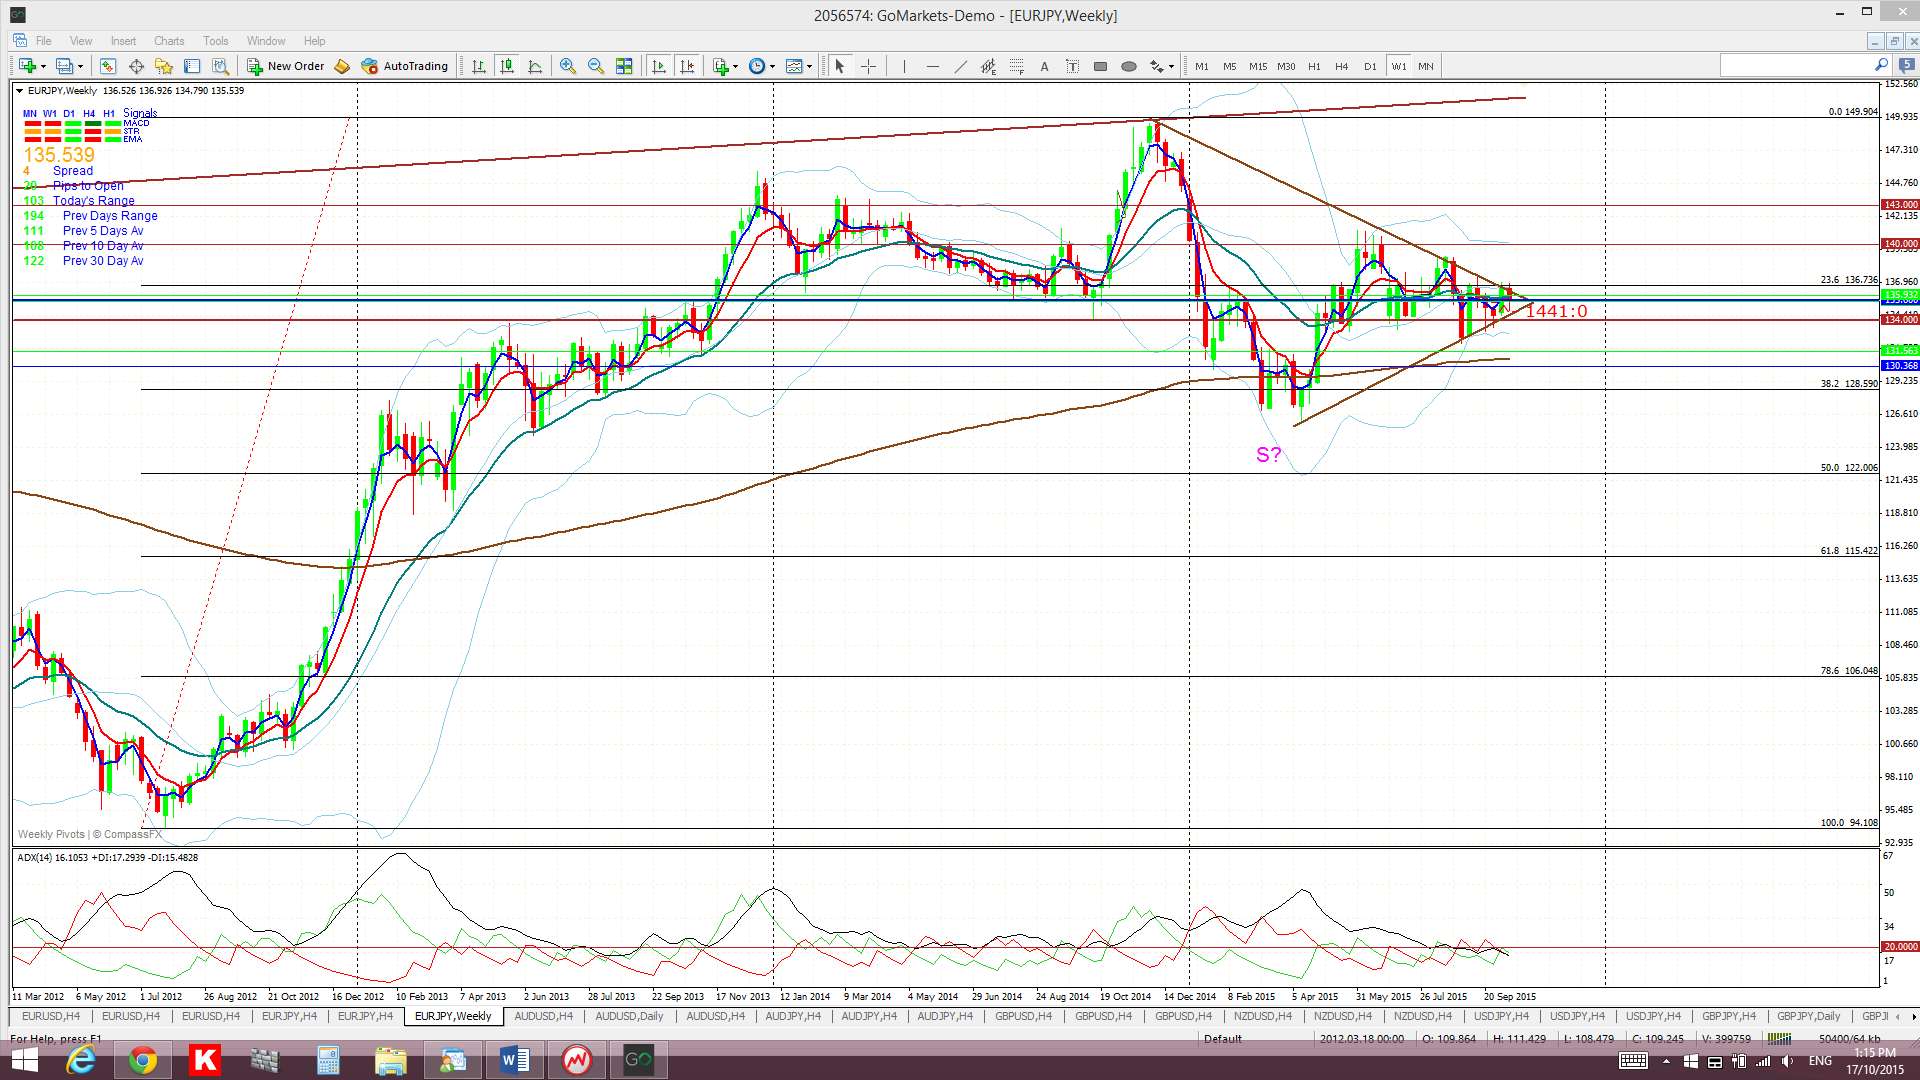
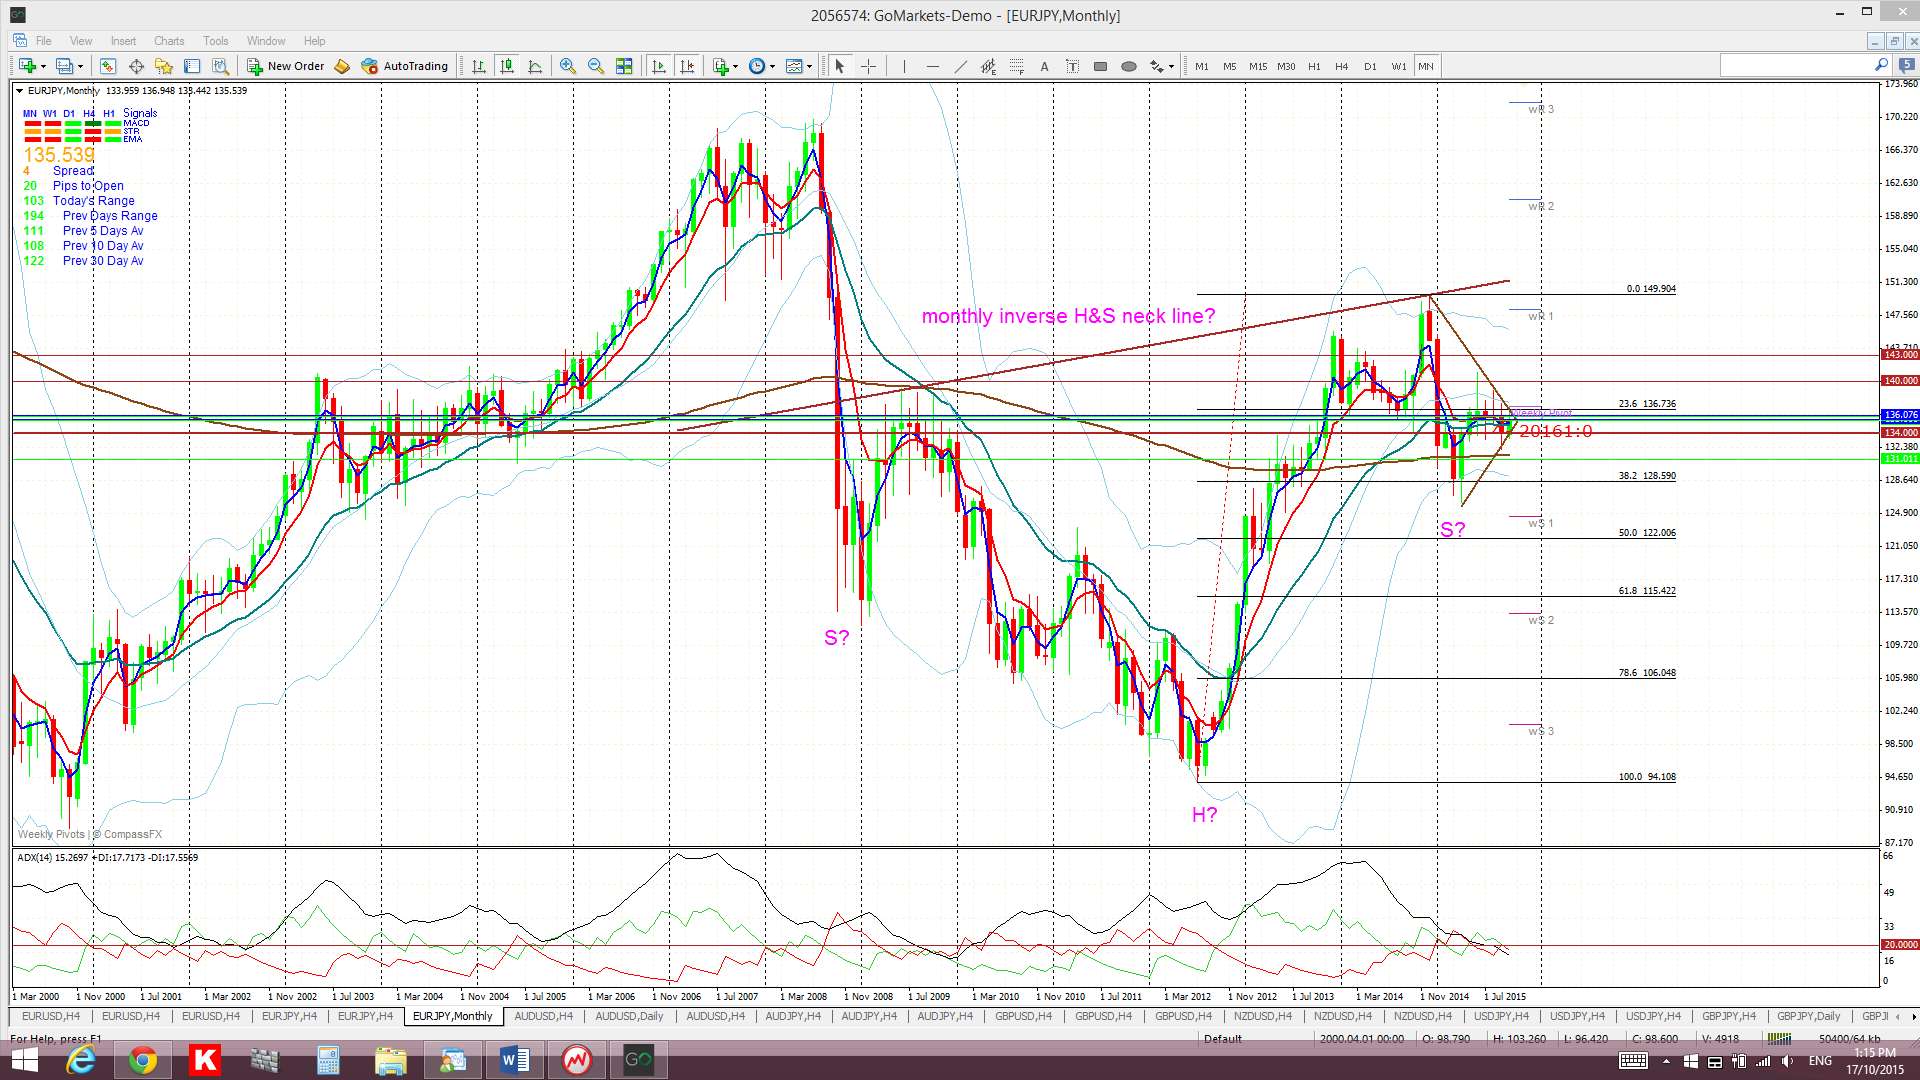
E/J: The E/J continues consolidating within the daily chart’s triangle pattern.
FWIW: I’m still seeing a potential bullish ‘inverse H&S’ pattern building on the monthly chart.
Price is trading in the Cloud on the 4hr, daily & weekly charts but above the Cloud on the monthly chart.
The weekly candle closed as a bearish coloured ‘Inside’ candle reflecting some indecision.
- I’m watching for any new TC signal on this pair and the daily chart’s triangle trend lines.


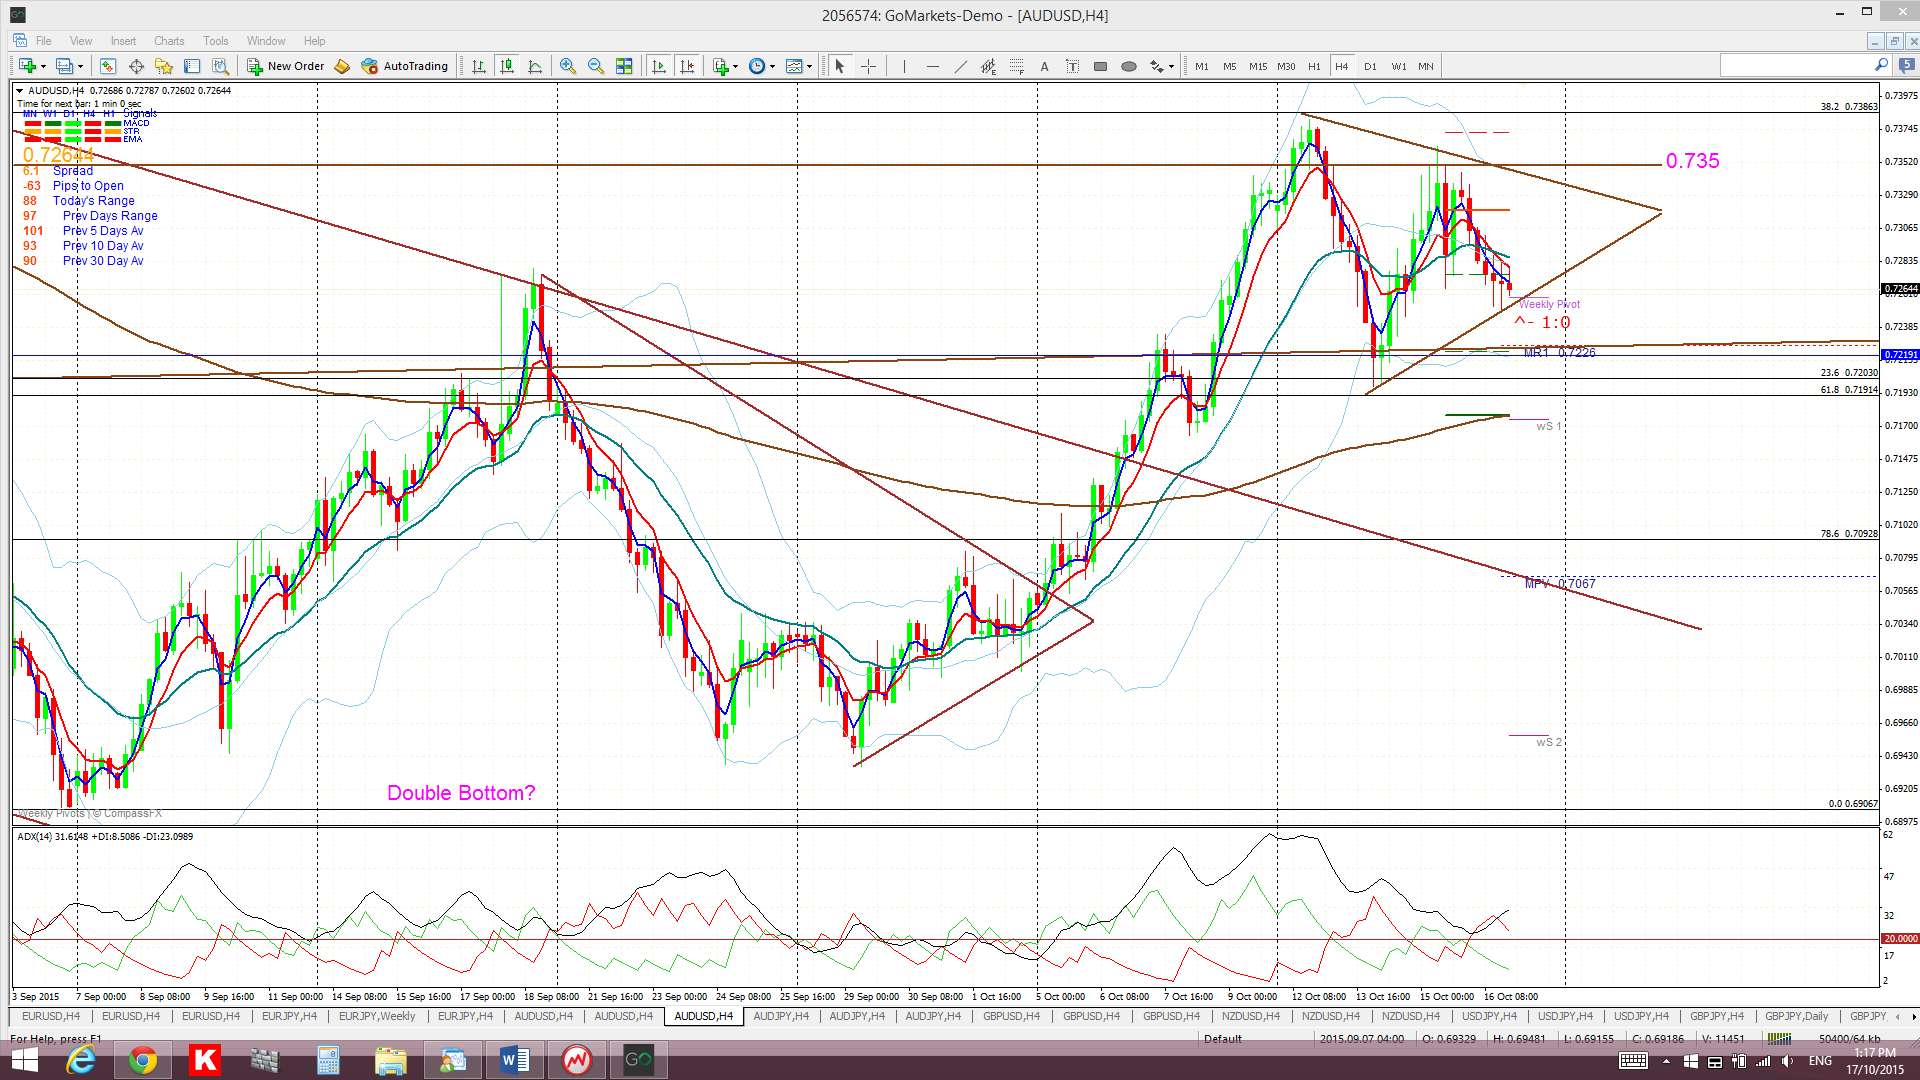
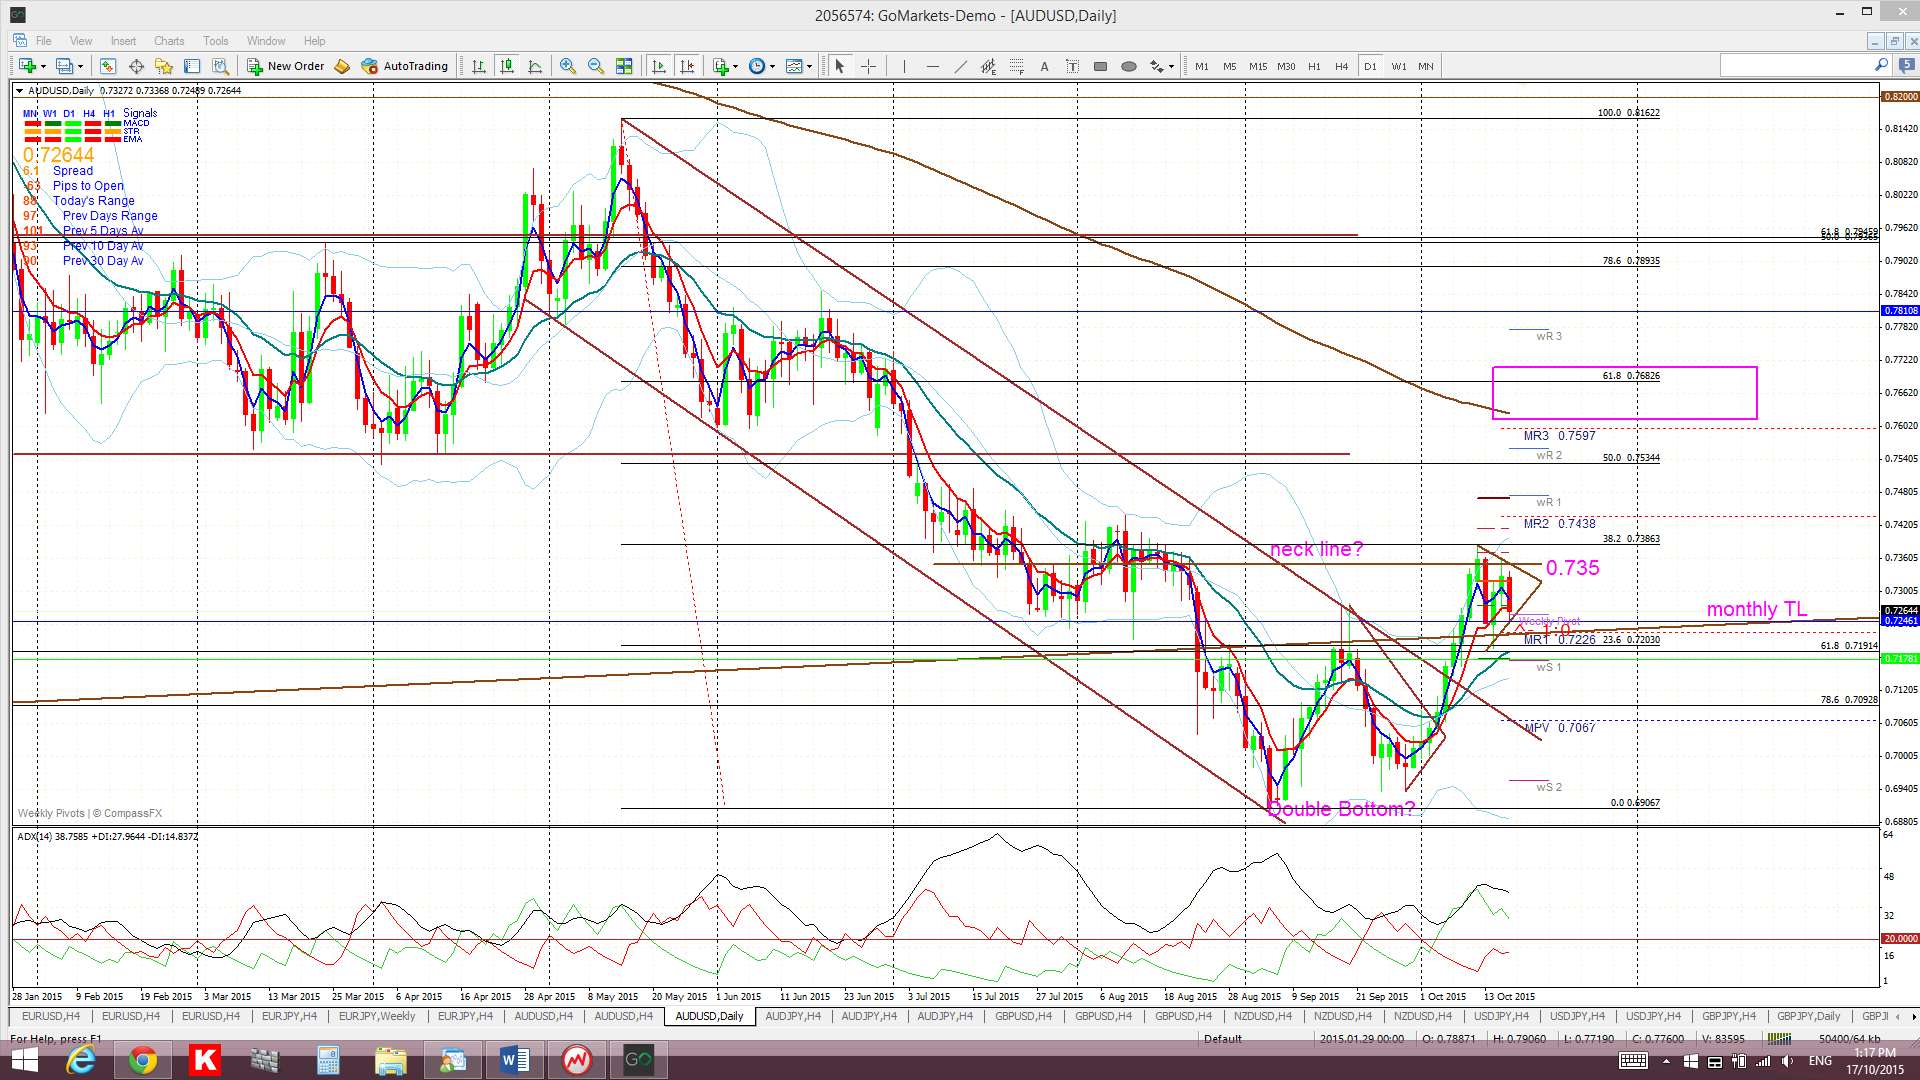
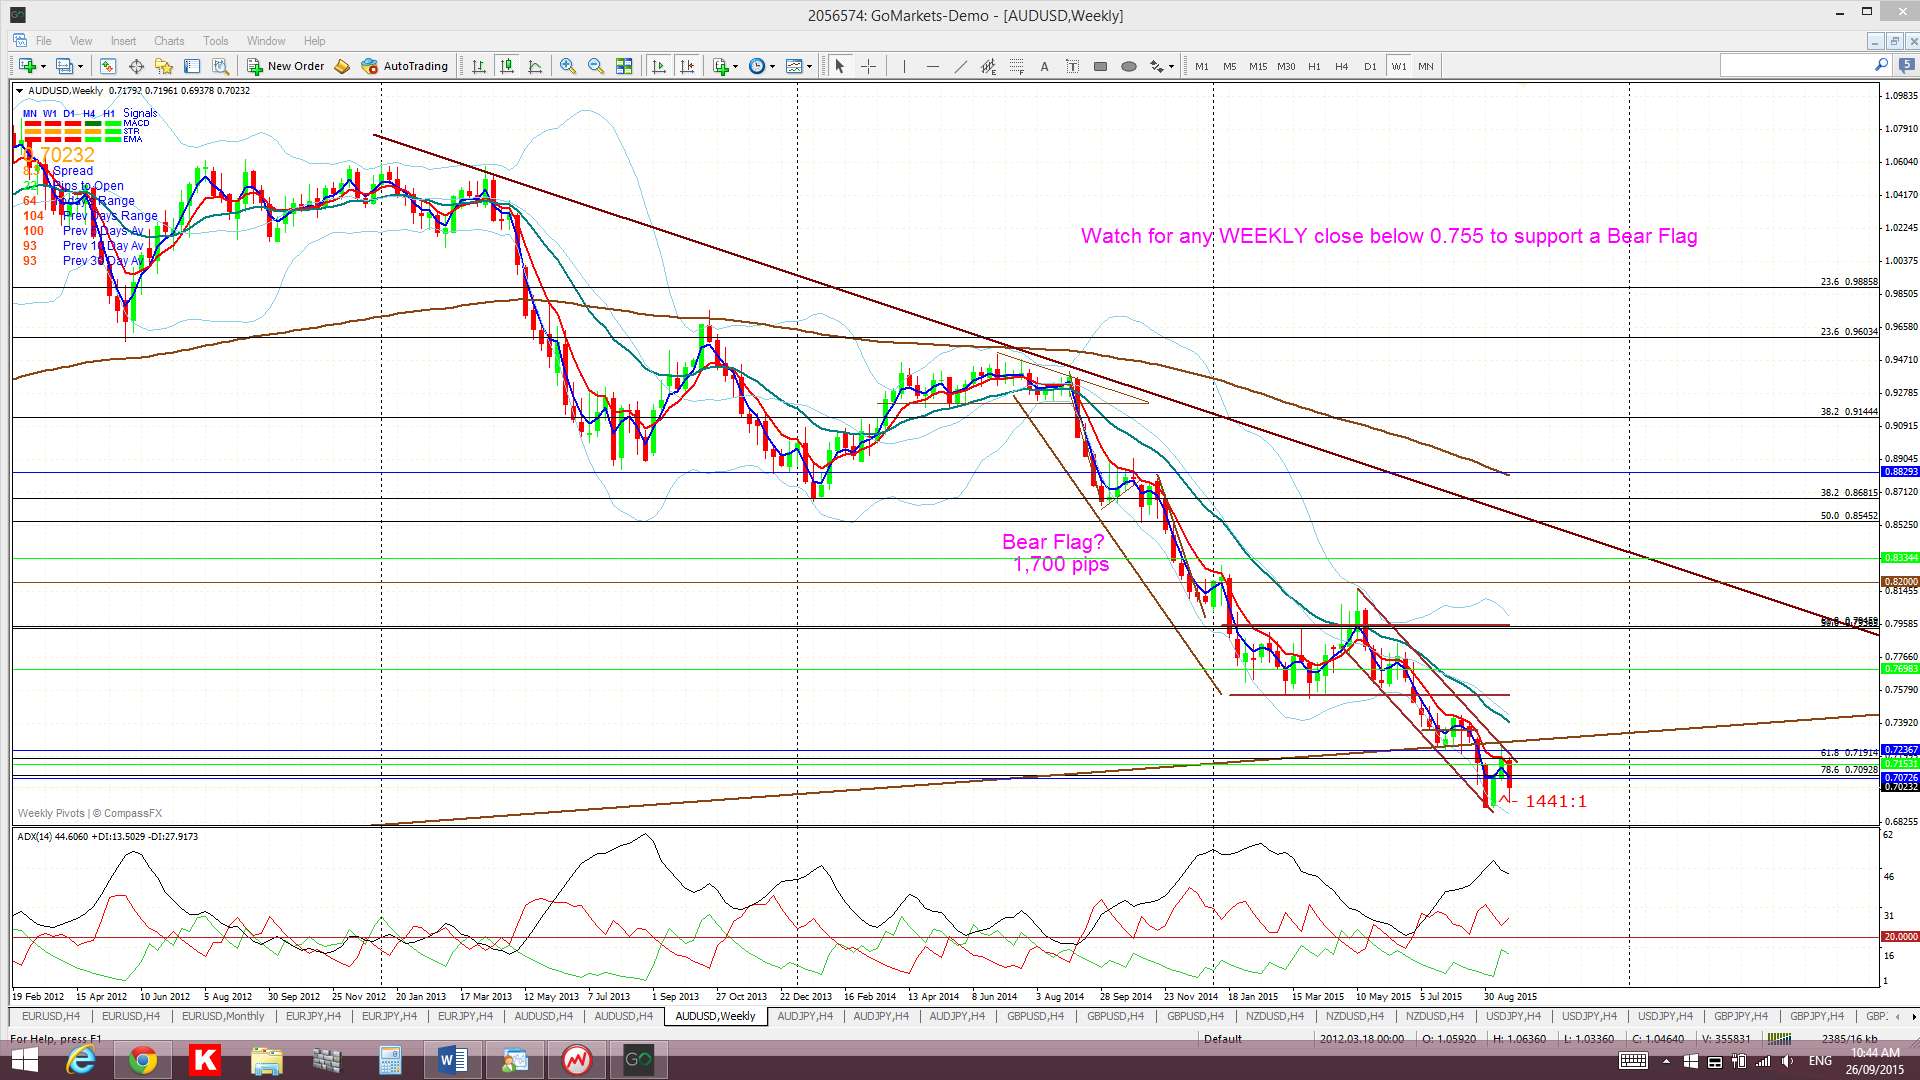
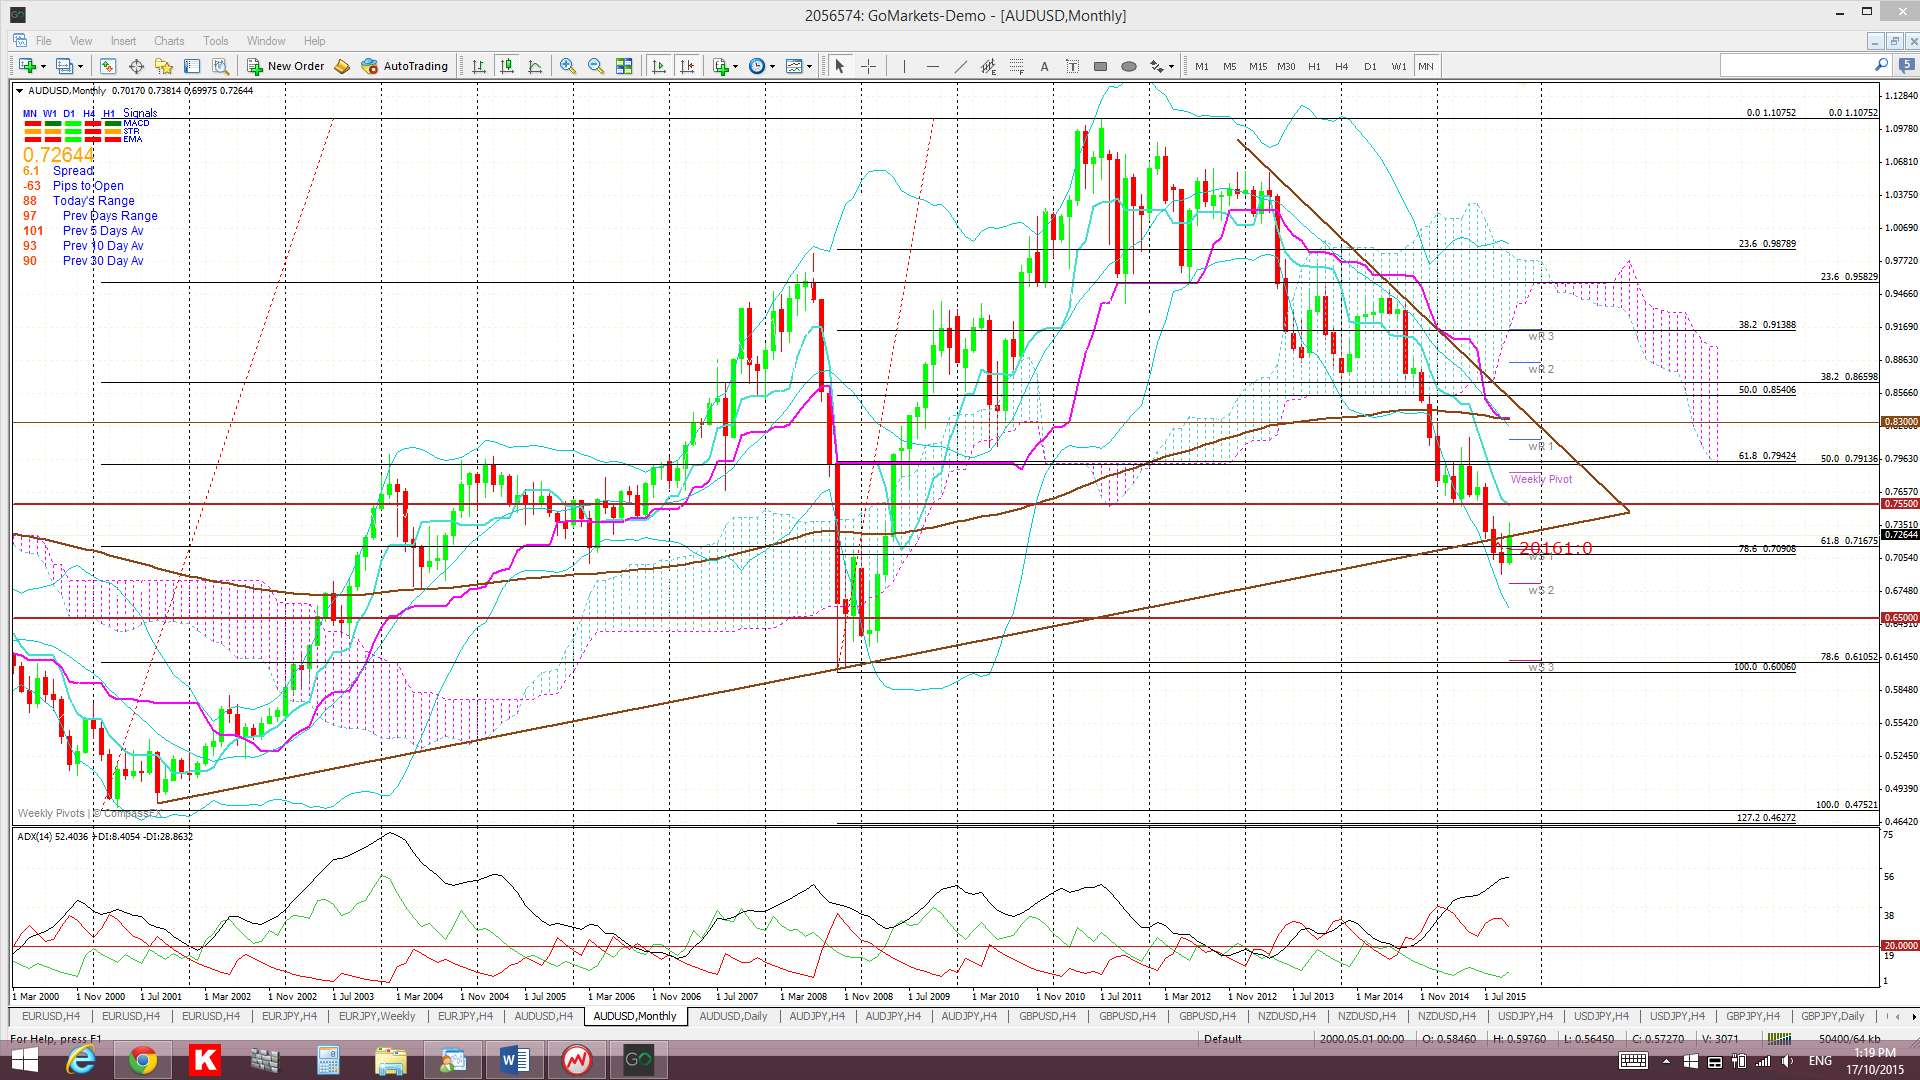
A/U: The A/U is consolidating within a new 4hr-based triangle pattern and just below the 0.735 ‘neck line’ level of a possible bullish-reversal ‘Double Bottom’. It is also now trading just above support coming from three major areas:
- the previously broken monthly trend line.
- The 61.8% fib of the major swing high move from 2000 to 2011 near 0.715 and
- The 78.6% fib of the 2008-2011 swing high move near 0.71.
Traders need to keep an eye on the precious metals as any continued bullish momentum with Gold and Silver might help to keep the AUD supported.
Price is trading above the Cloud on the 4hr chart, in the top edge of the Cloud on the daily chart but below the Cloud on the weekly and monthly charts.
The weekly candle closed as a bearish coloured ‘Inside’ candle reflecting some indecision.
Traders should be on the lookout for any triangle breakout following Monday’s Chinese GDP and Industrial Production data release.
- I’m watching for any new TC signal on this pair, the triangle trend lines and the 0.735 level.
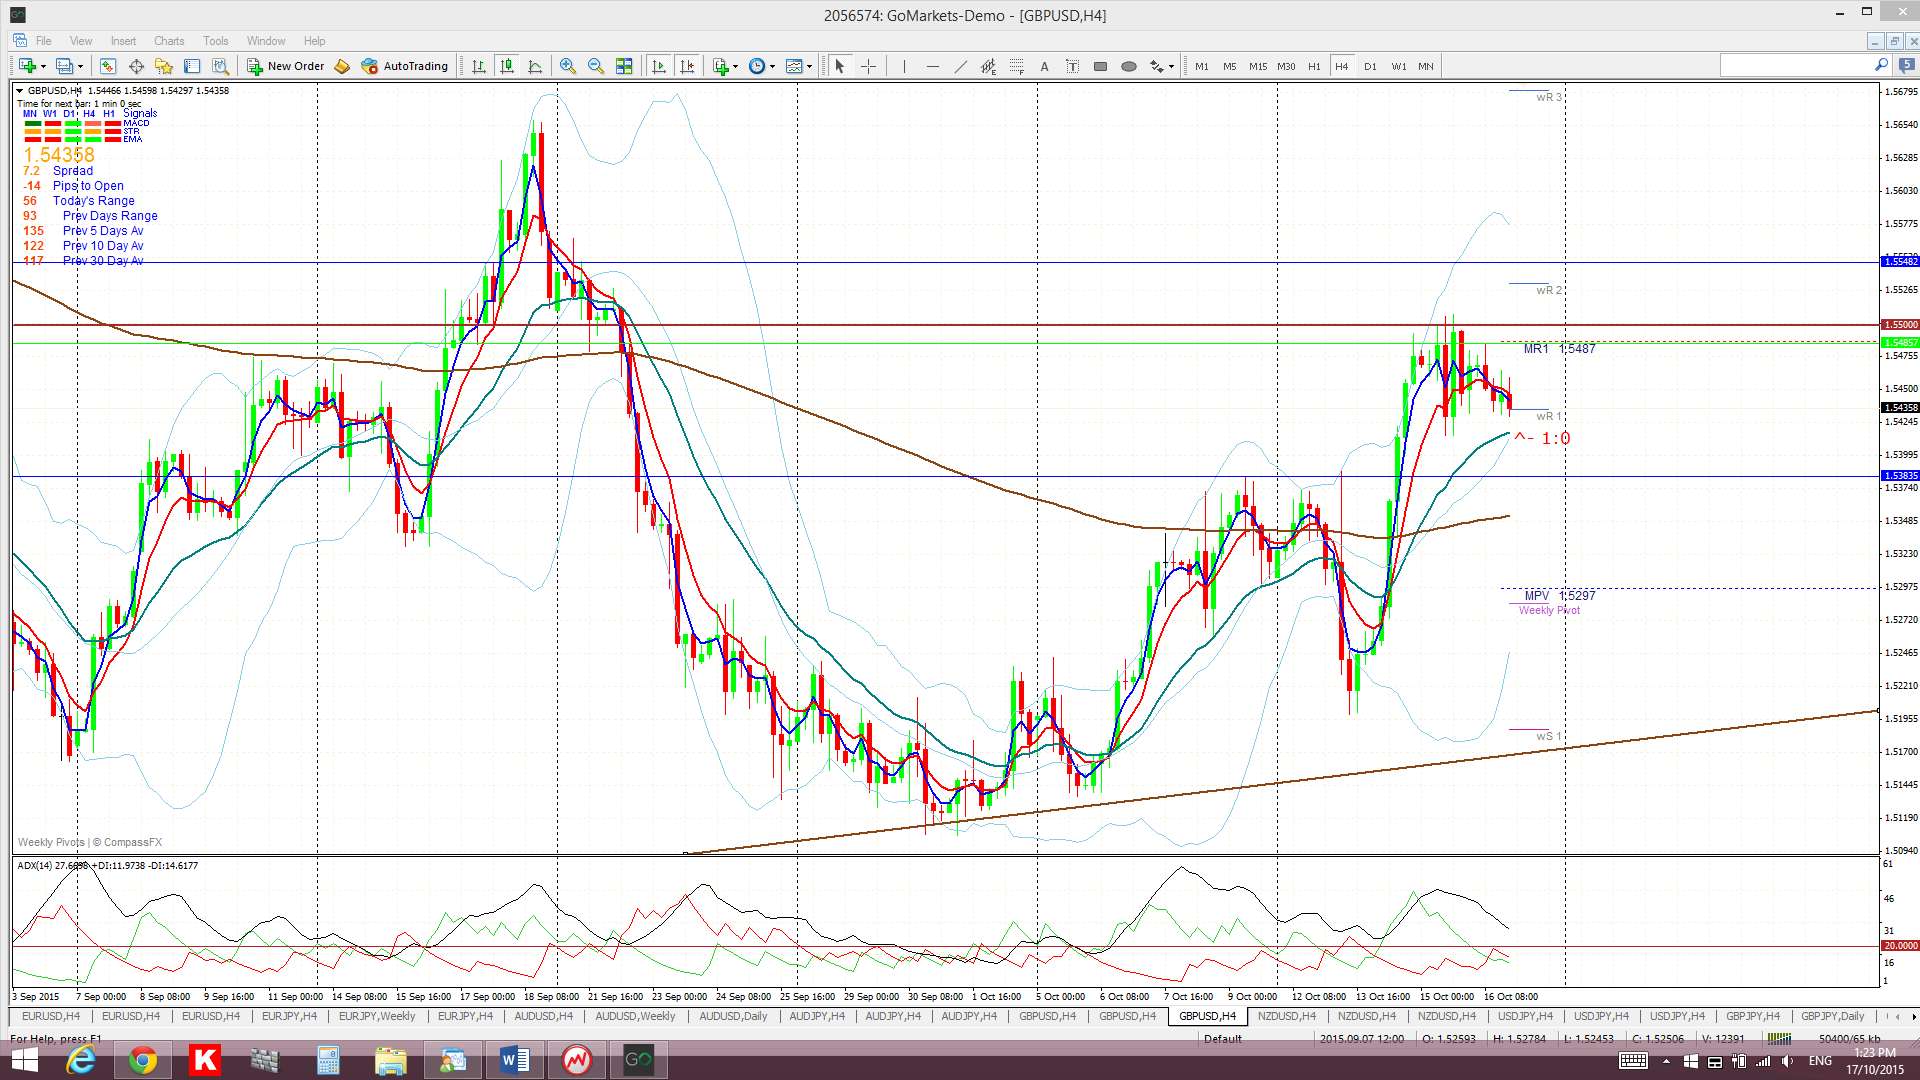
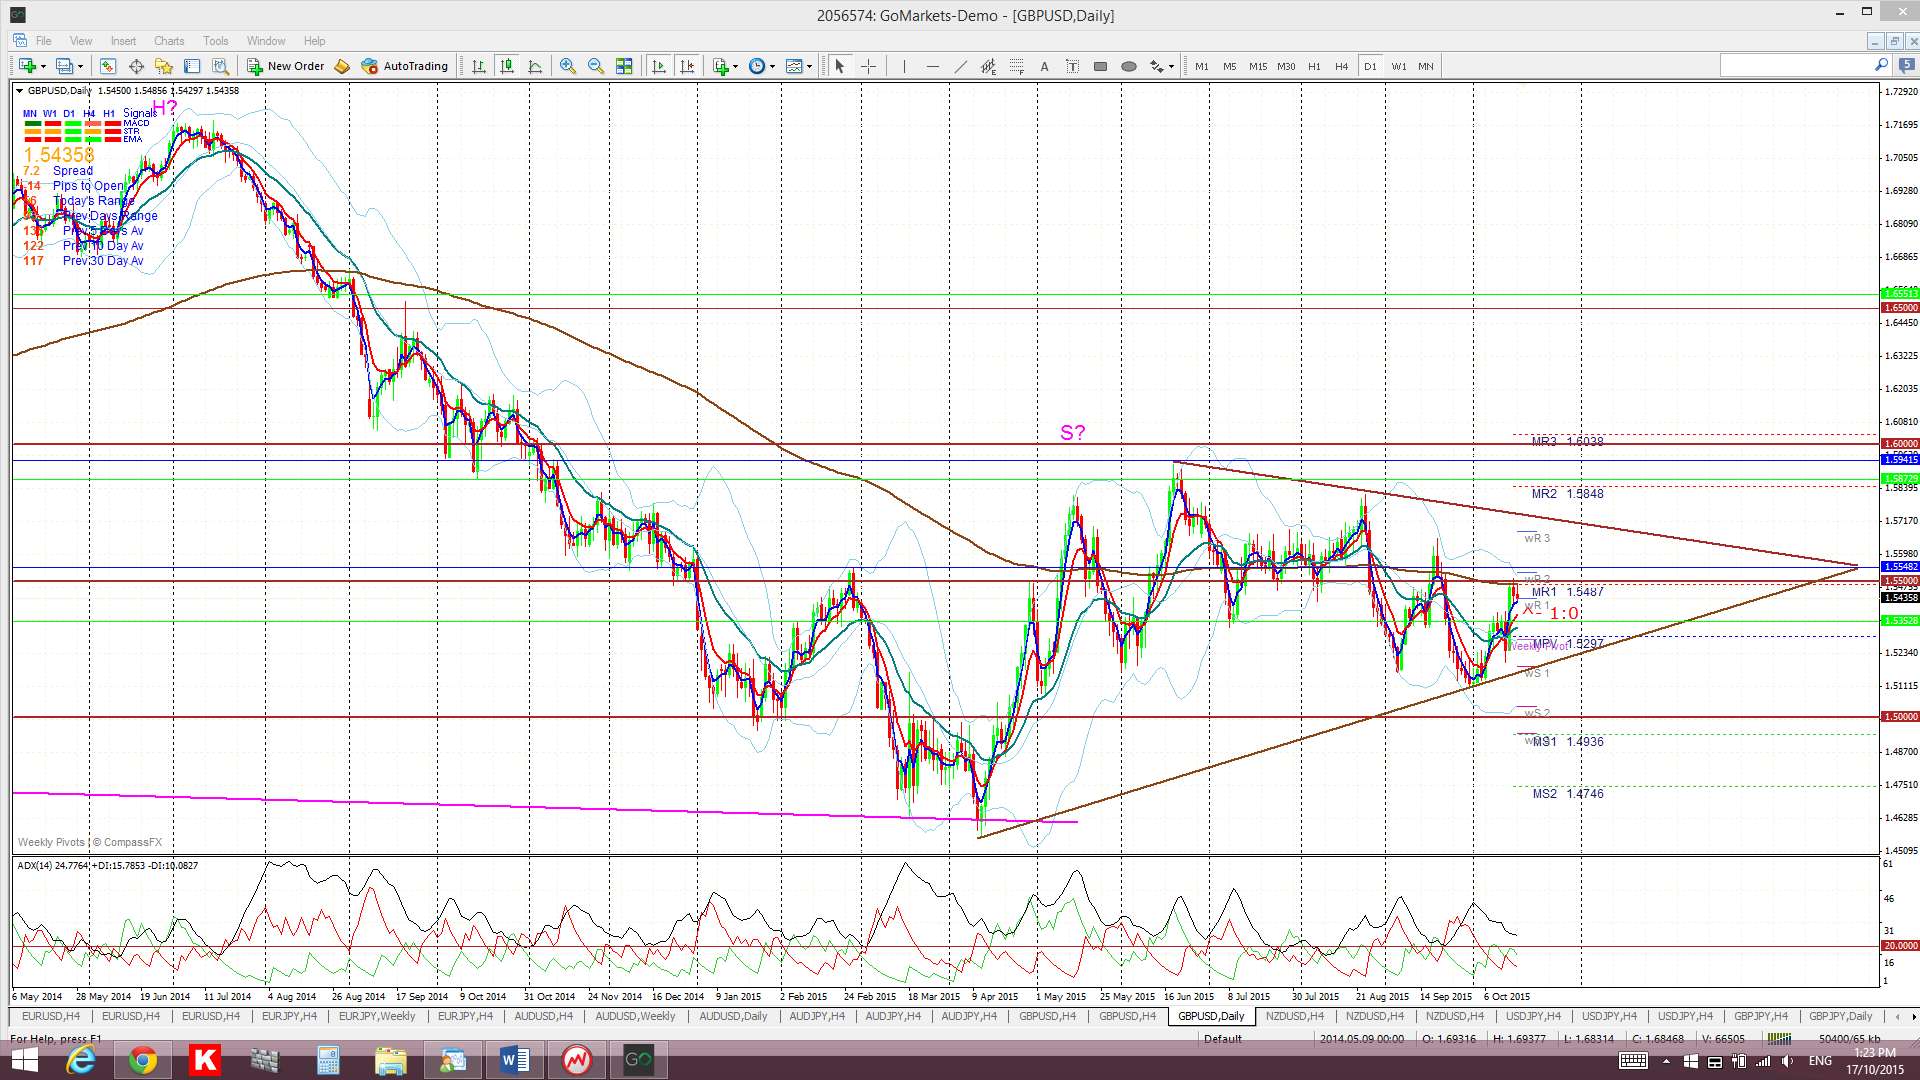
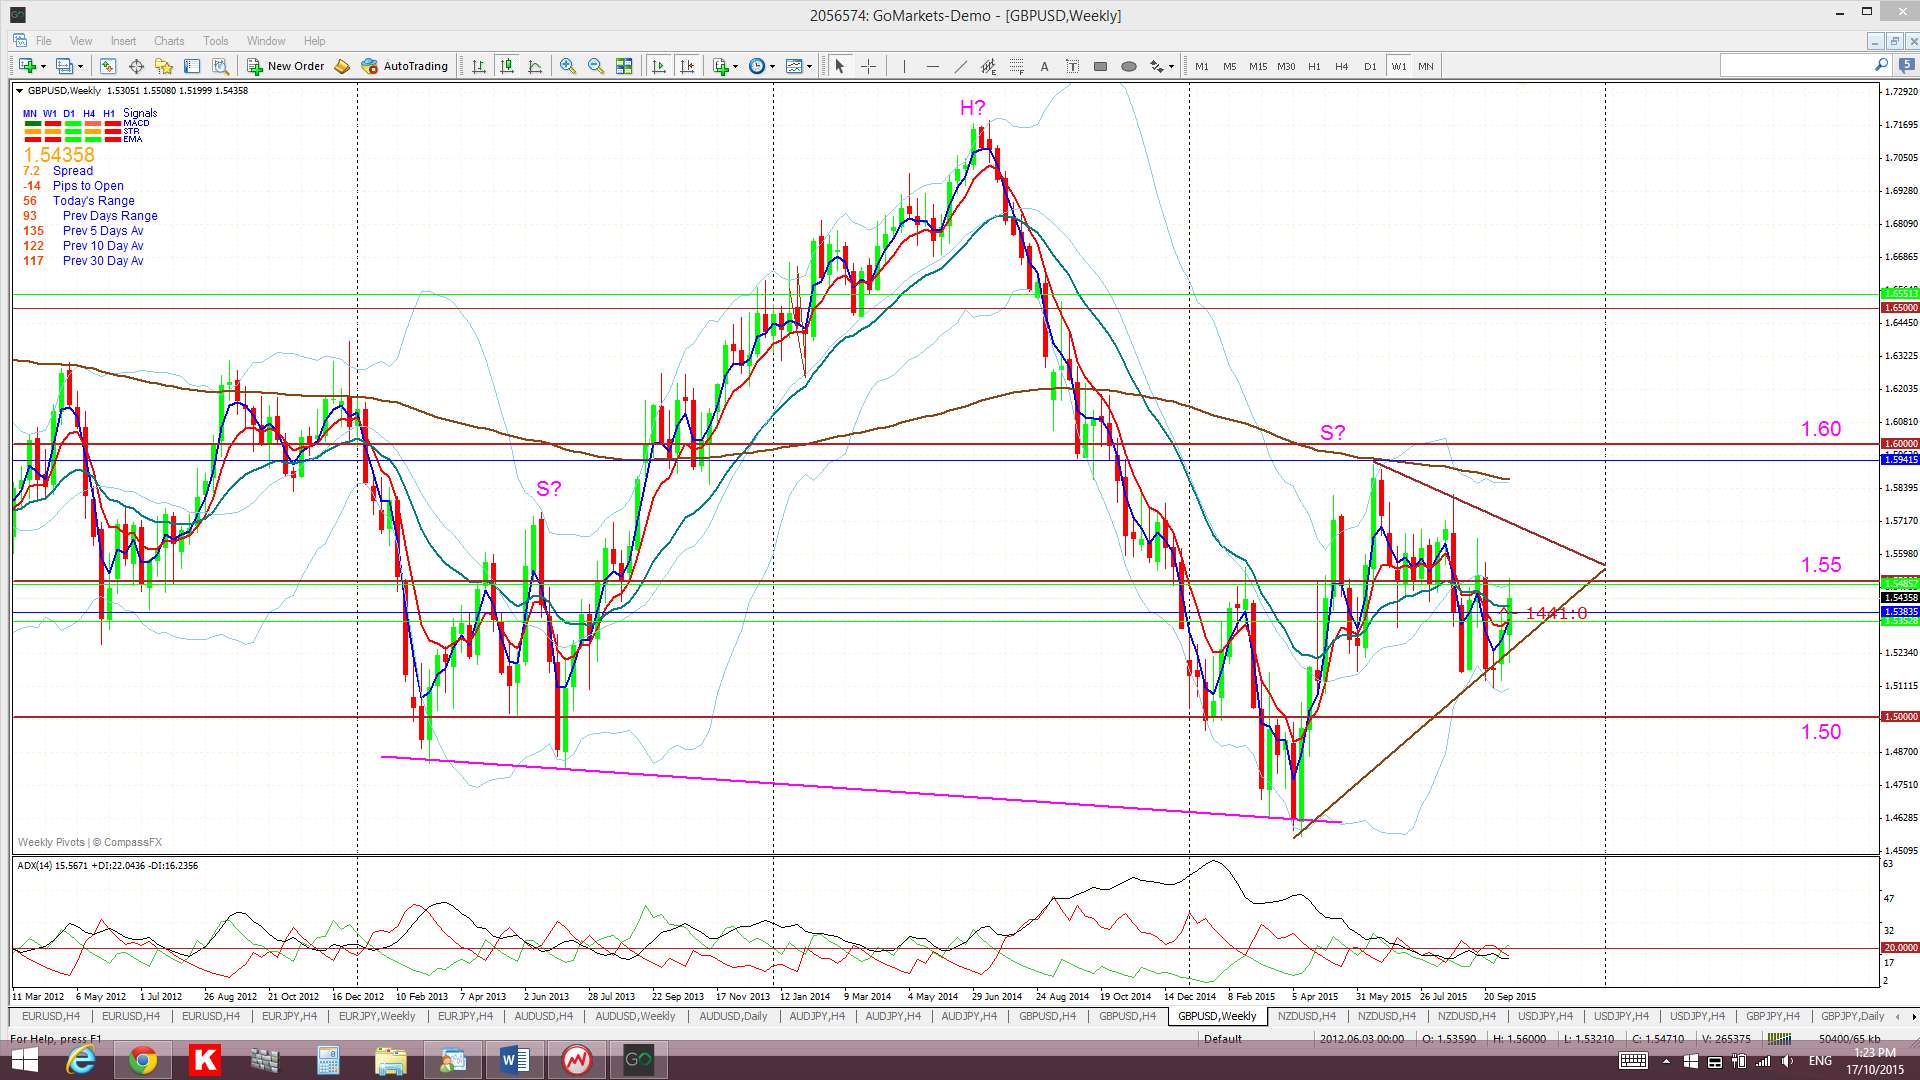
G/U: The Cable bounced off trend line support last week and rallied up to the 1.55 region but continues consolidating within a daily chart triangle pattern.
Weekly chart H&S: There is still a possible bearish H&S pattern forming on the weekly chart but the failure to break below the ‘neck line’ is holding this pattern off the time being. The height of the pattern is about 2,400 pips and suggests a similar move lower with any break and hold below the ‘neck line’. I would consider that any close and hold back above 1.60 would void this pattern.
Price is trading above the Cloud on the 4hr chart, in the Cloud on the daily and weekly charts but below the Cloud on the monthly chart.
The weekly candle closed as a bullish candle.
- I’m watching for any new TC signal on this pair, the daily chart’s triangle pattern and the 1.55 level.
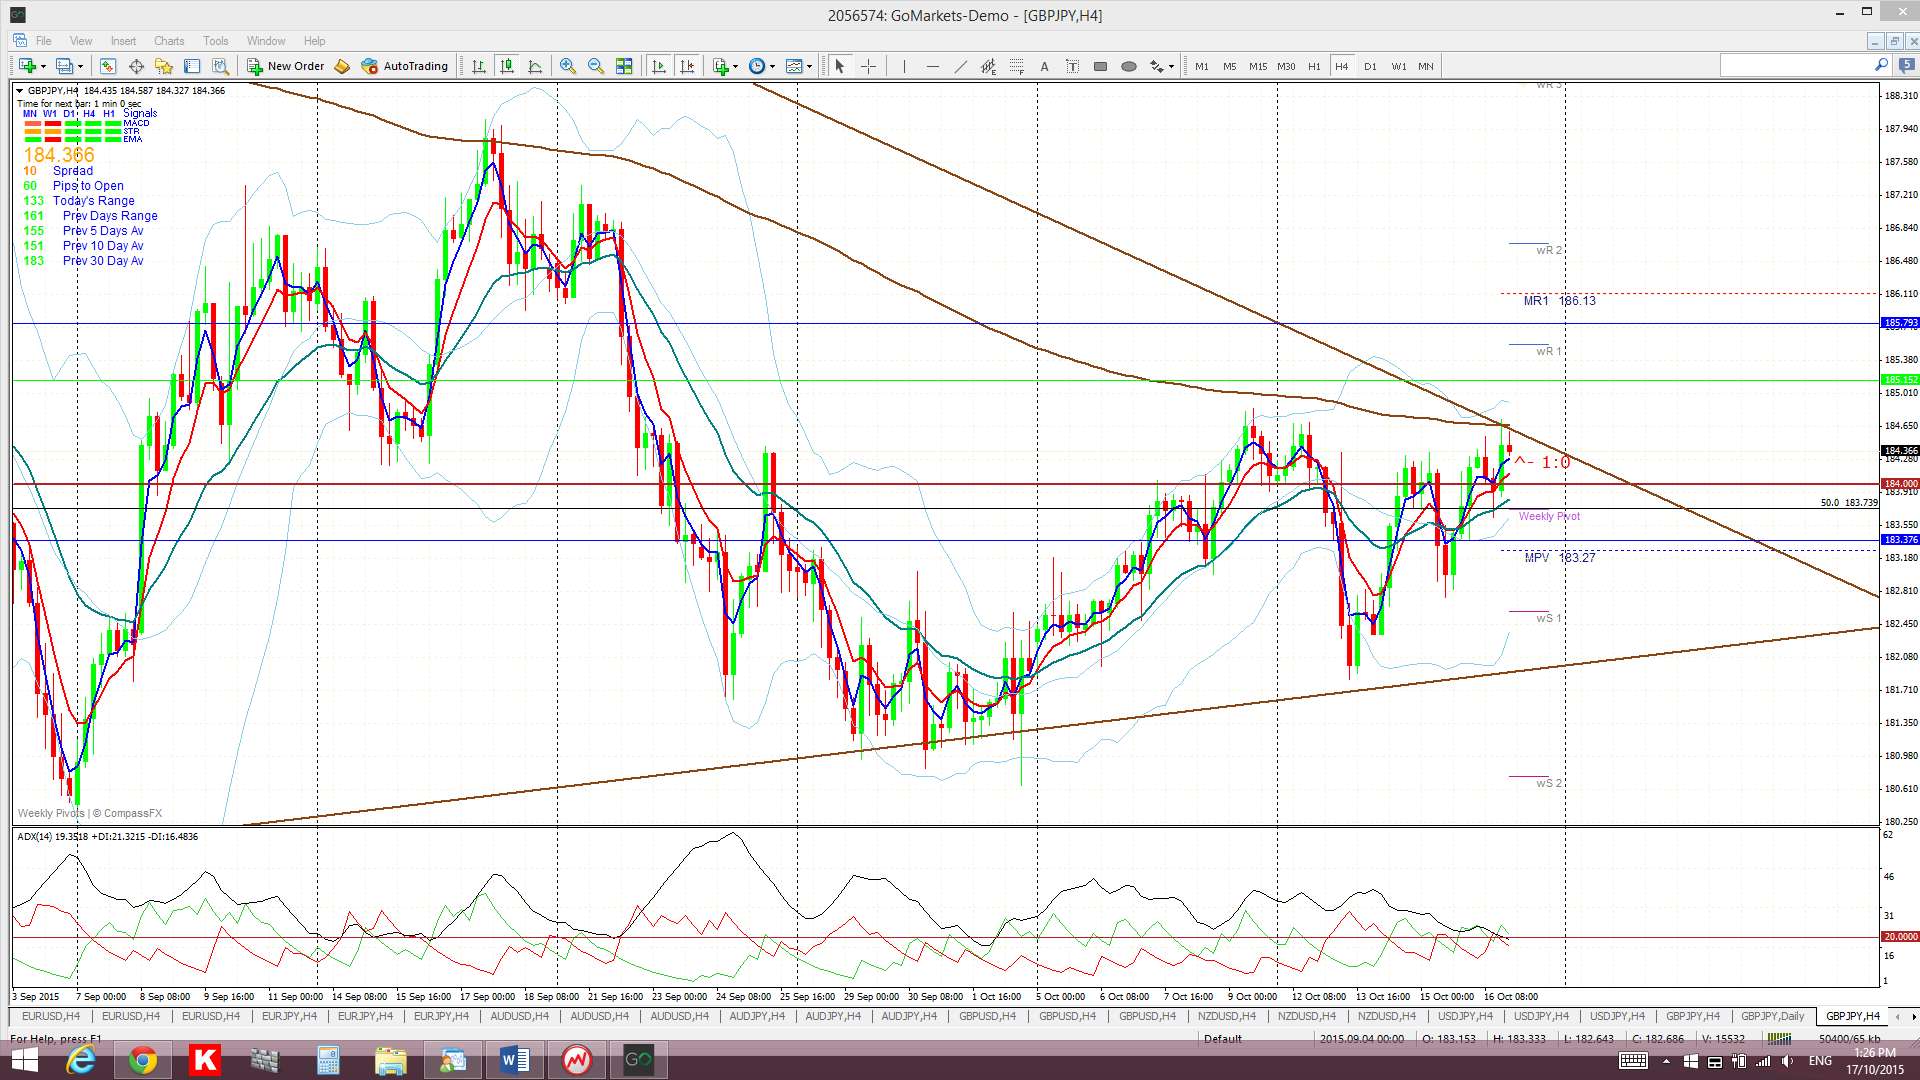
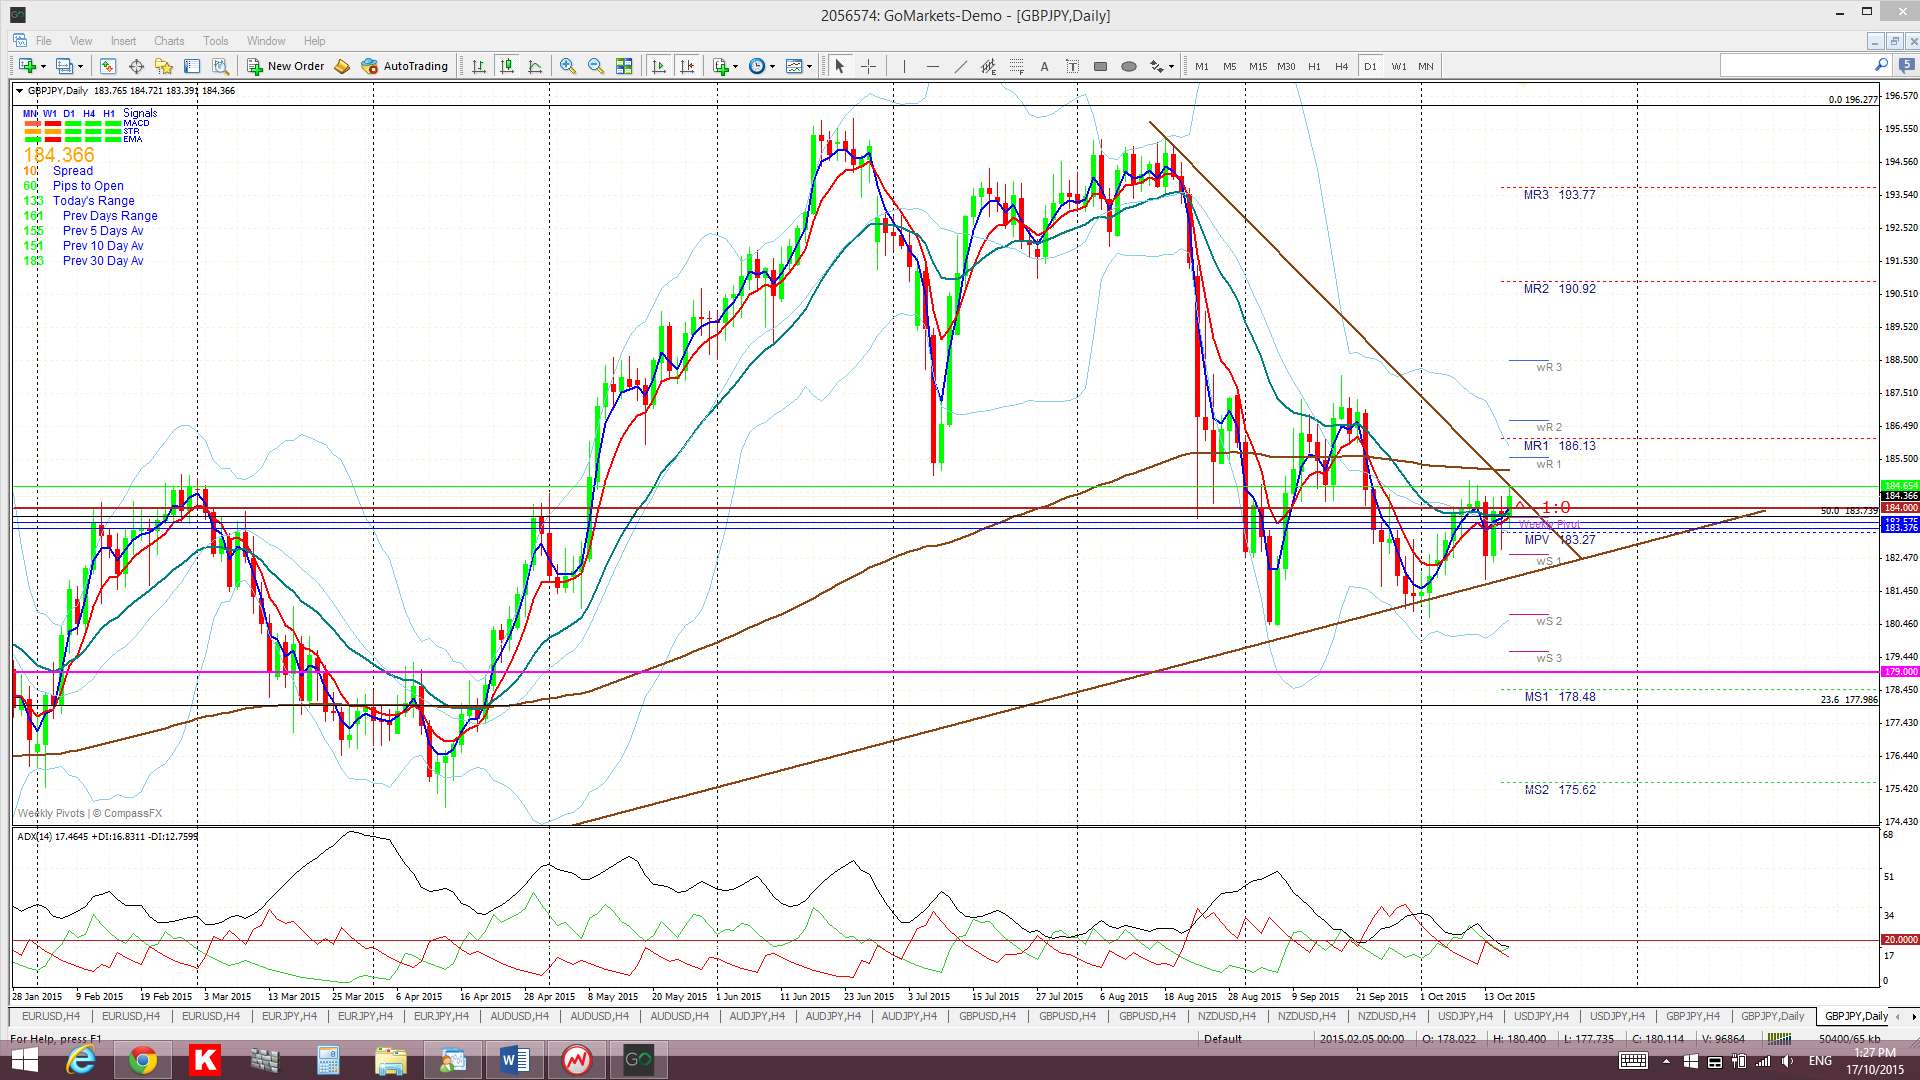
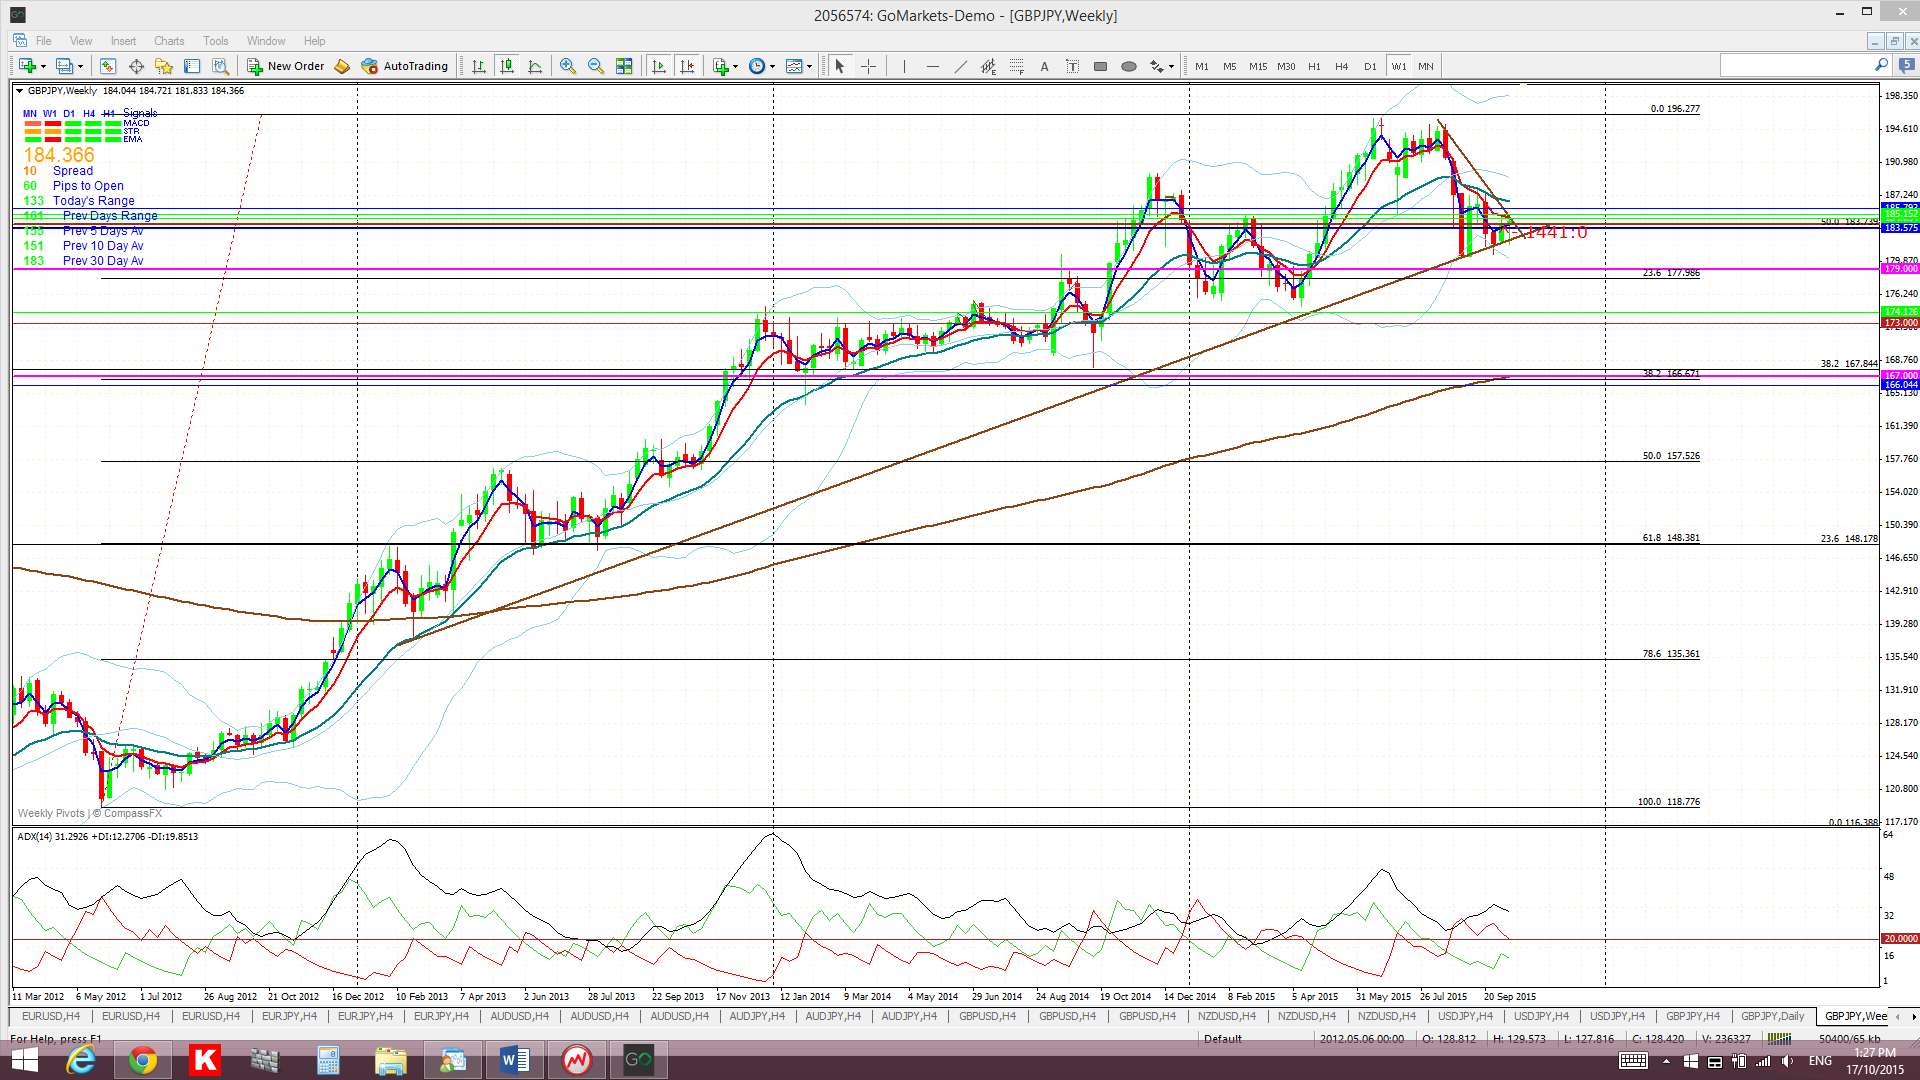
 GBP/JPY: The GBP/JPY chopped around either side of the key 184 last week and a new bear trend line is helping to form up a triangle pattern.
Price is trading below the Ichimoku Cloud on the daily chart but above the cloud on the 4hr, weekly and monthly charts.
The weekly candle closed as a bullish coloured Doji candle.
- I’m watching for any new TC signal on this pair, the 184 level and the revised triangle pattern.

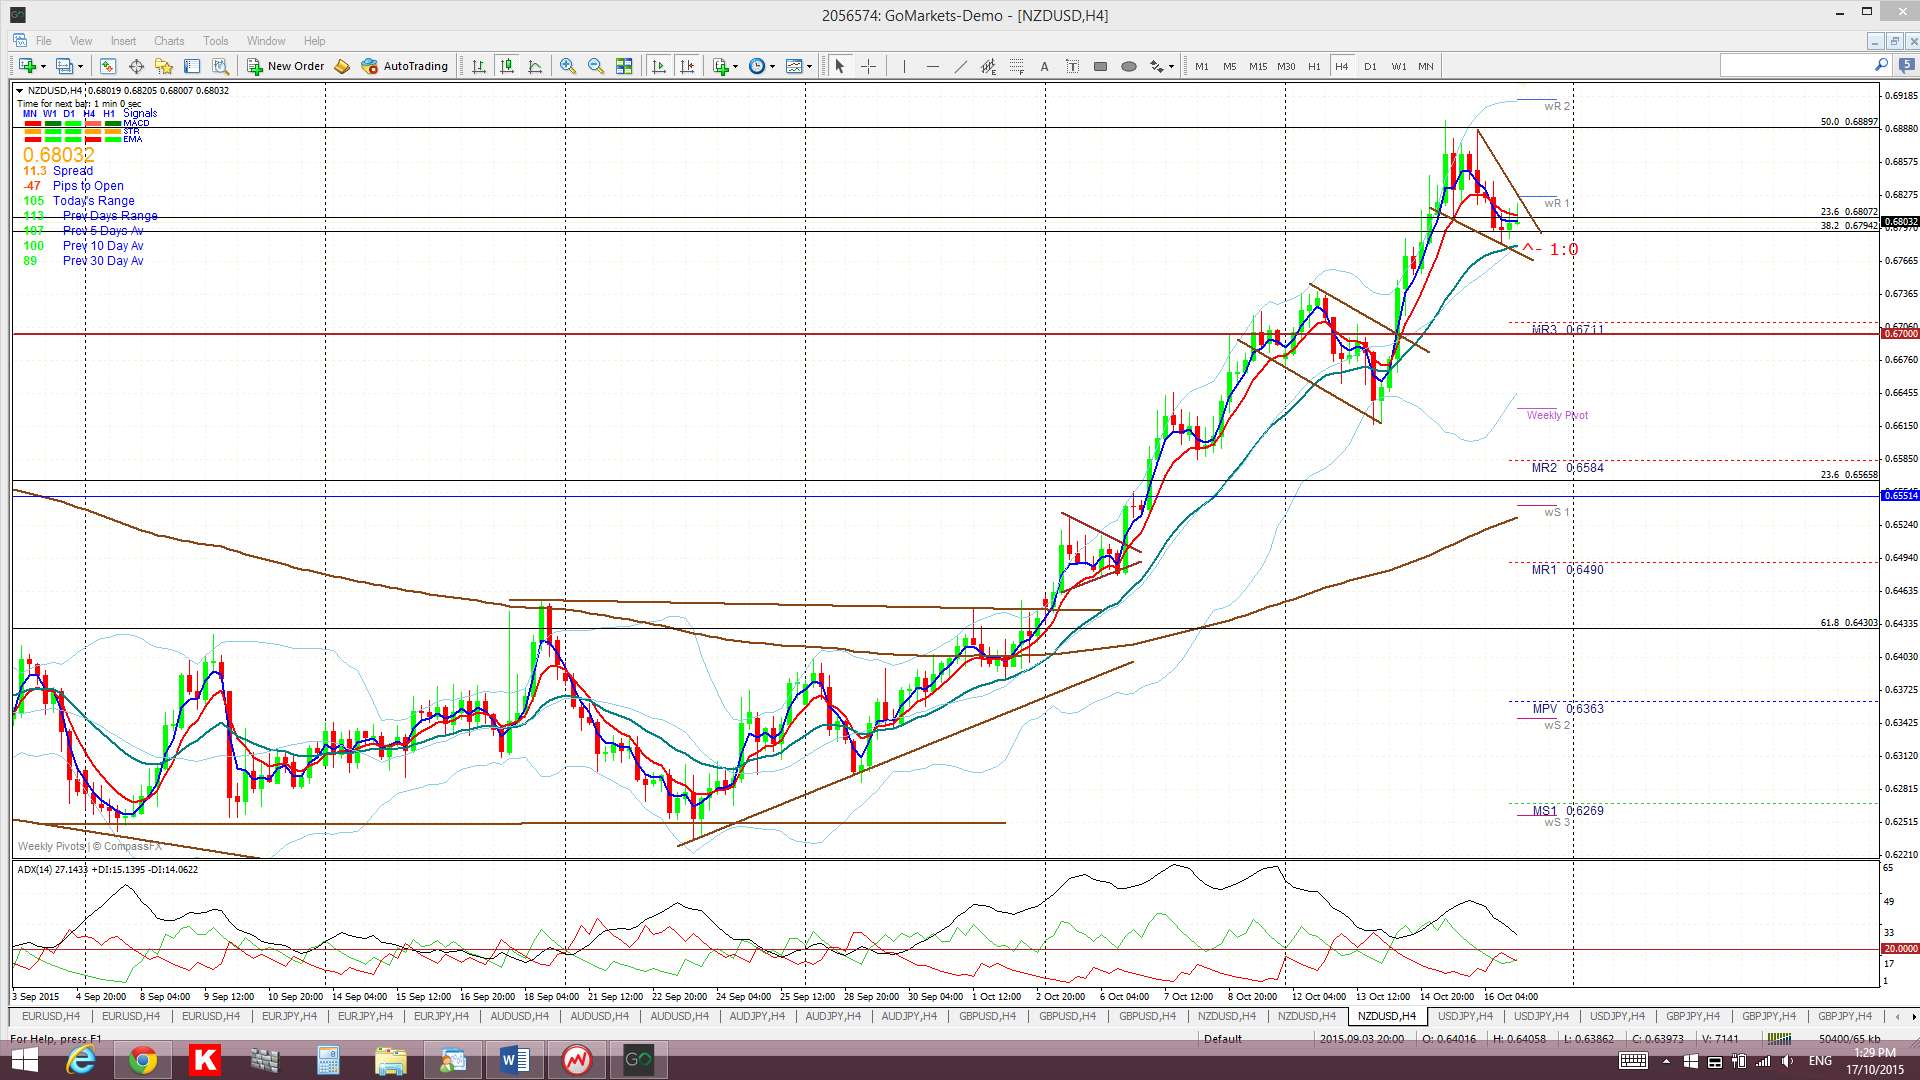
Kiwi: NZD/USD: The NZD/USD rallied up to close above the key 0.67 level last week and finished the week off at the next whole number level near 0.68. It seems to be consolidating within yet another Flag pattern just above this whole number level.
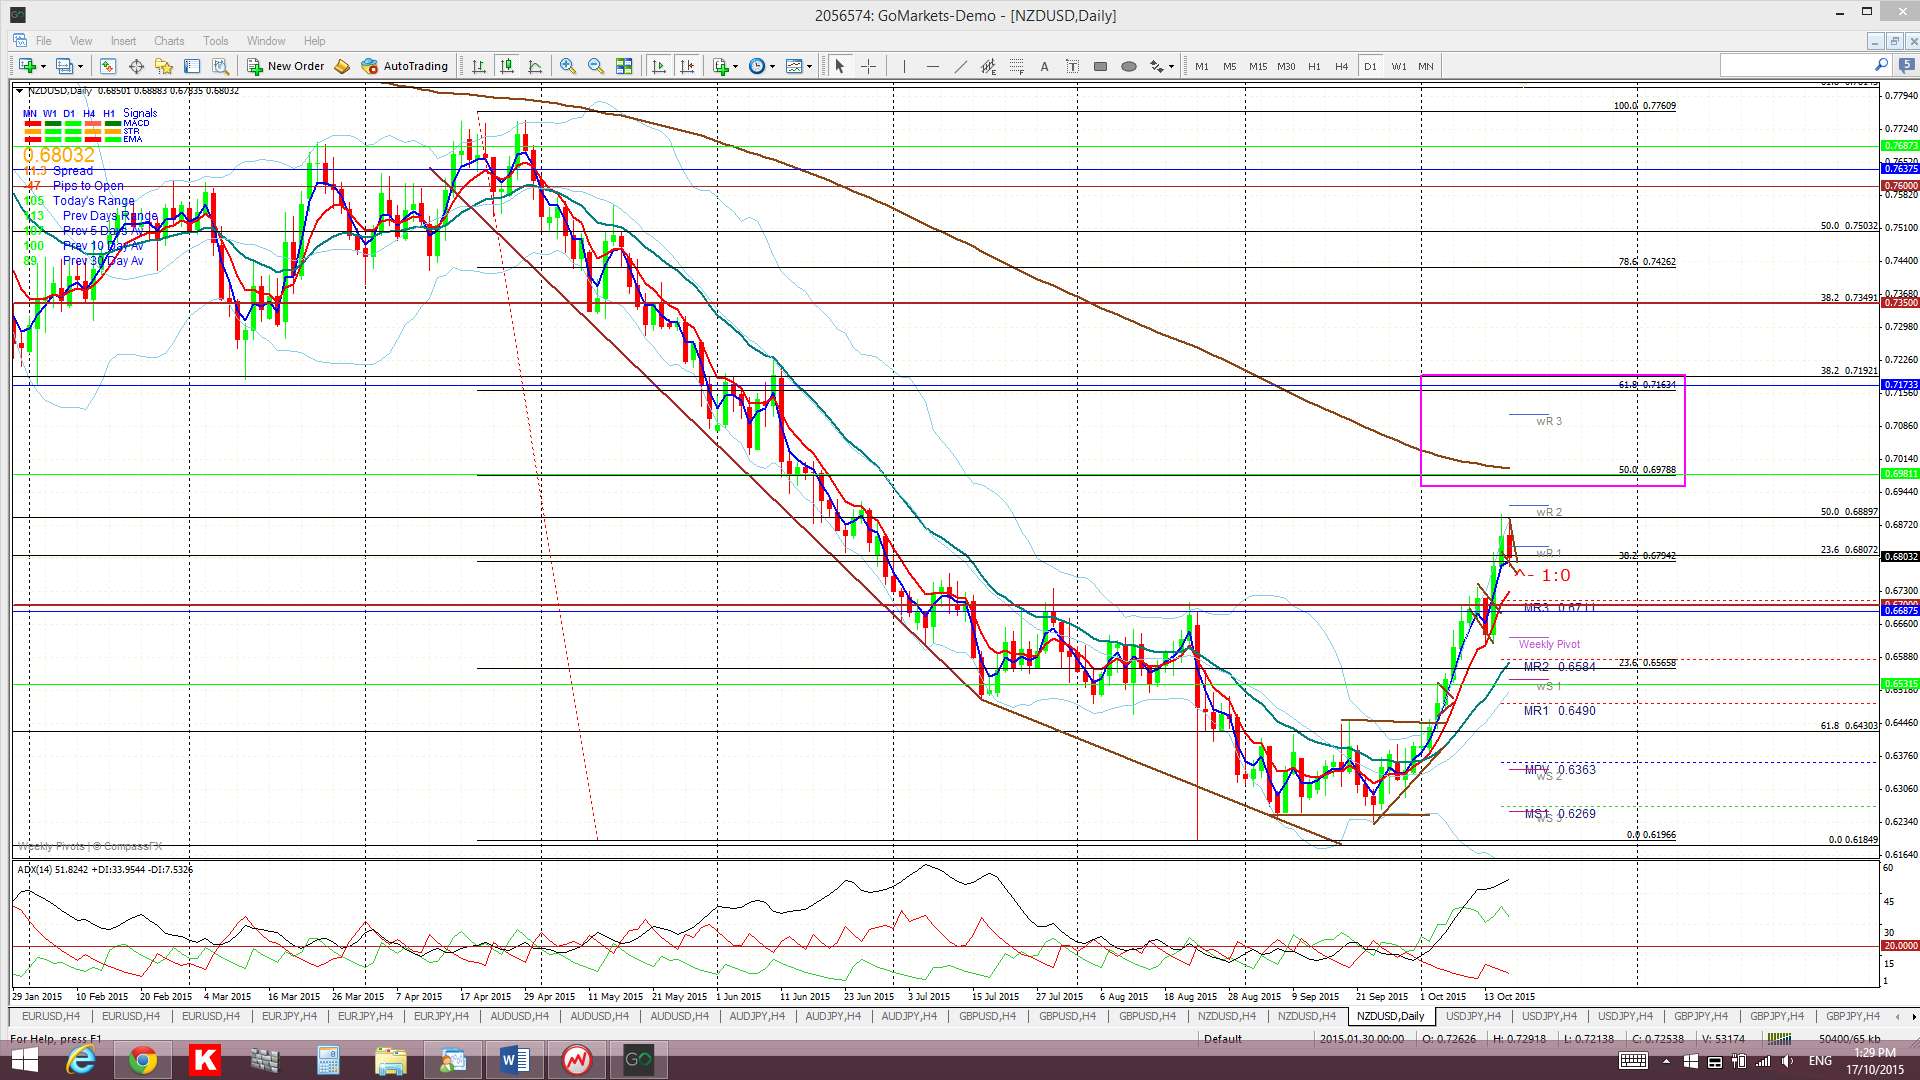
Daily Chart: The daily chart shows a possible short term target for this bullish move to be near 0.70 as this is between the 50% and 61.8% fib regions of the recent swing low and also near the daily 200 EMA.
Weekly chart: The weekly chart reveals potential bullish targets if price action continues higher than the 0.70 region though. Placing Fibs on the longer-term swing low move shows the 61.8% fib up near 0.78 and weekly 200 EMA and so this might be a target for any bullish continuation move. The previous S/R level of 0.735 is also tucked in there as well!
Price is trading above the 4hr and daily Clouds but below the Cloud on the weekly charts and monthly charts.
The weekly candle closed as bullish candle.
- I’m watching for any new TC signal on this pair, the 4hr chart’s Flag trend lines and the 0.68 level.

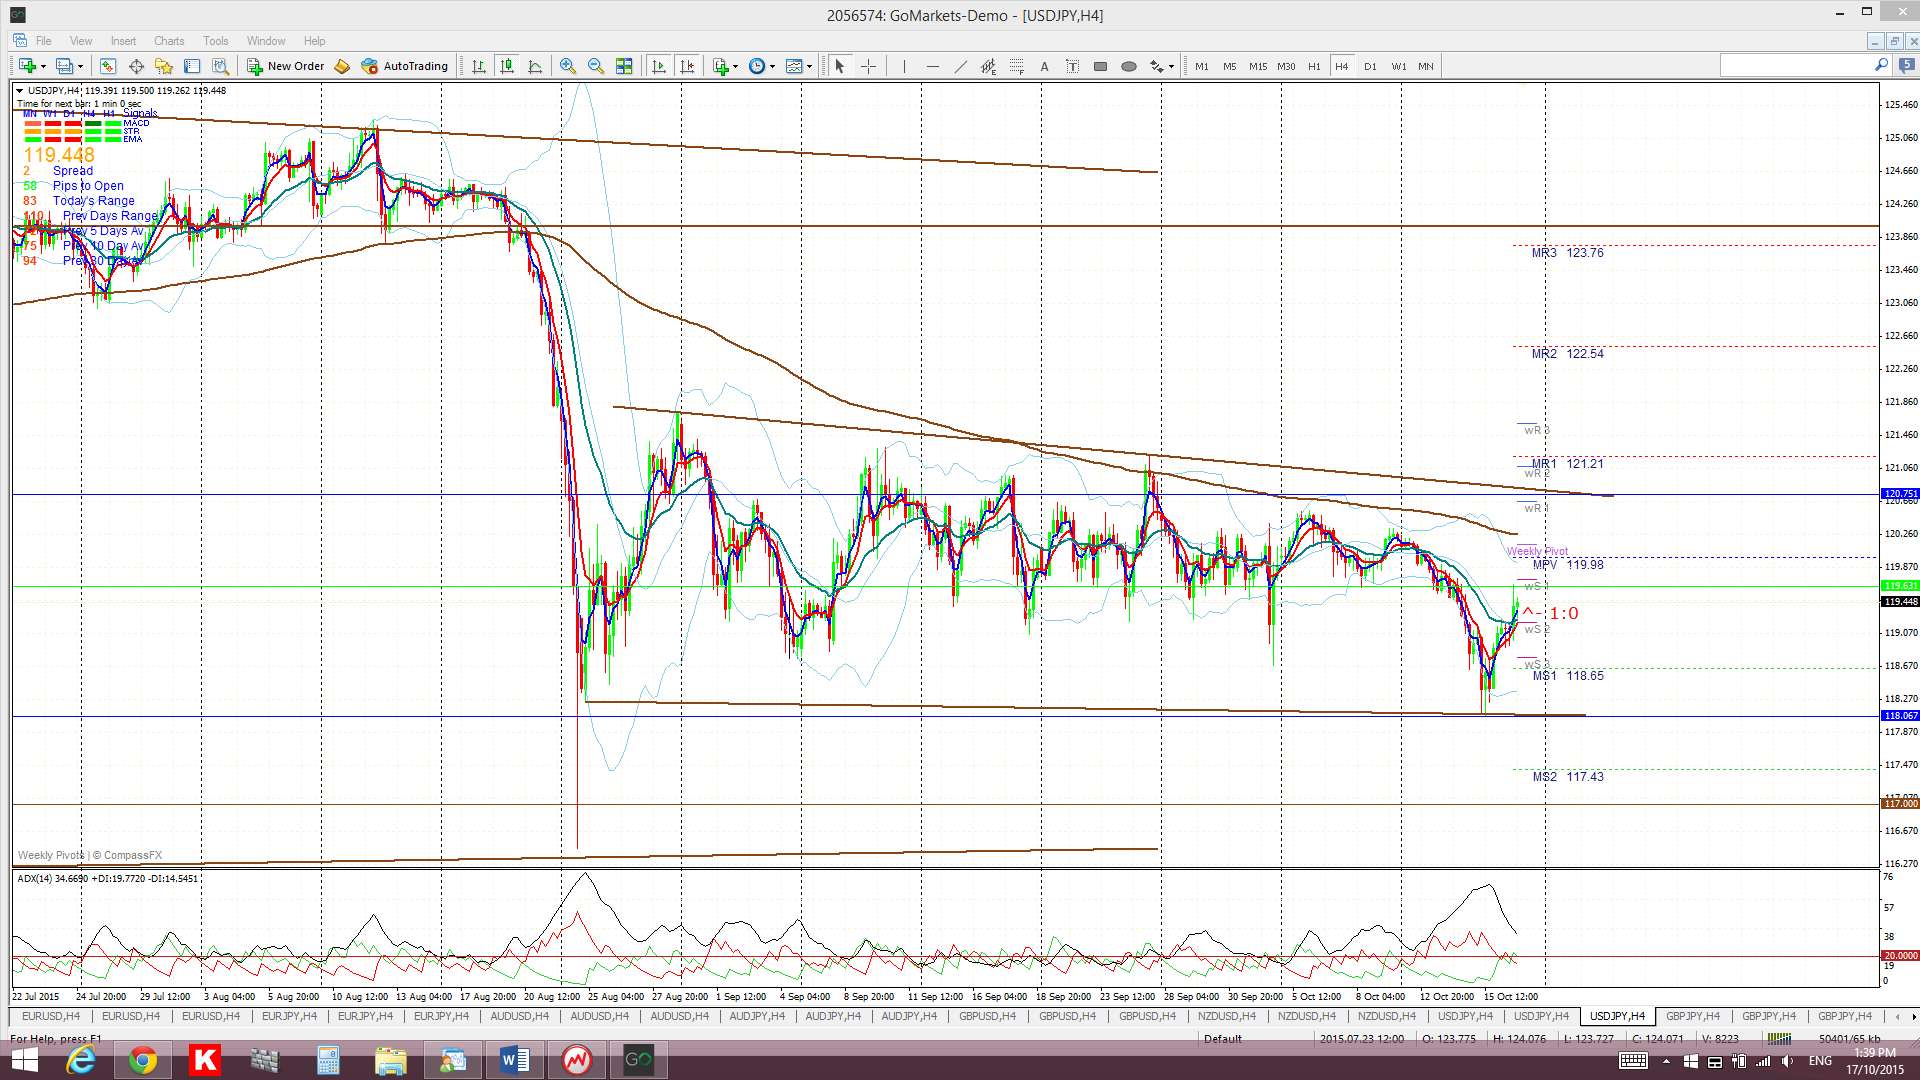
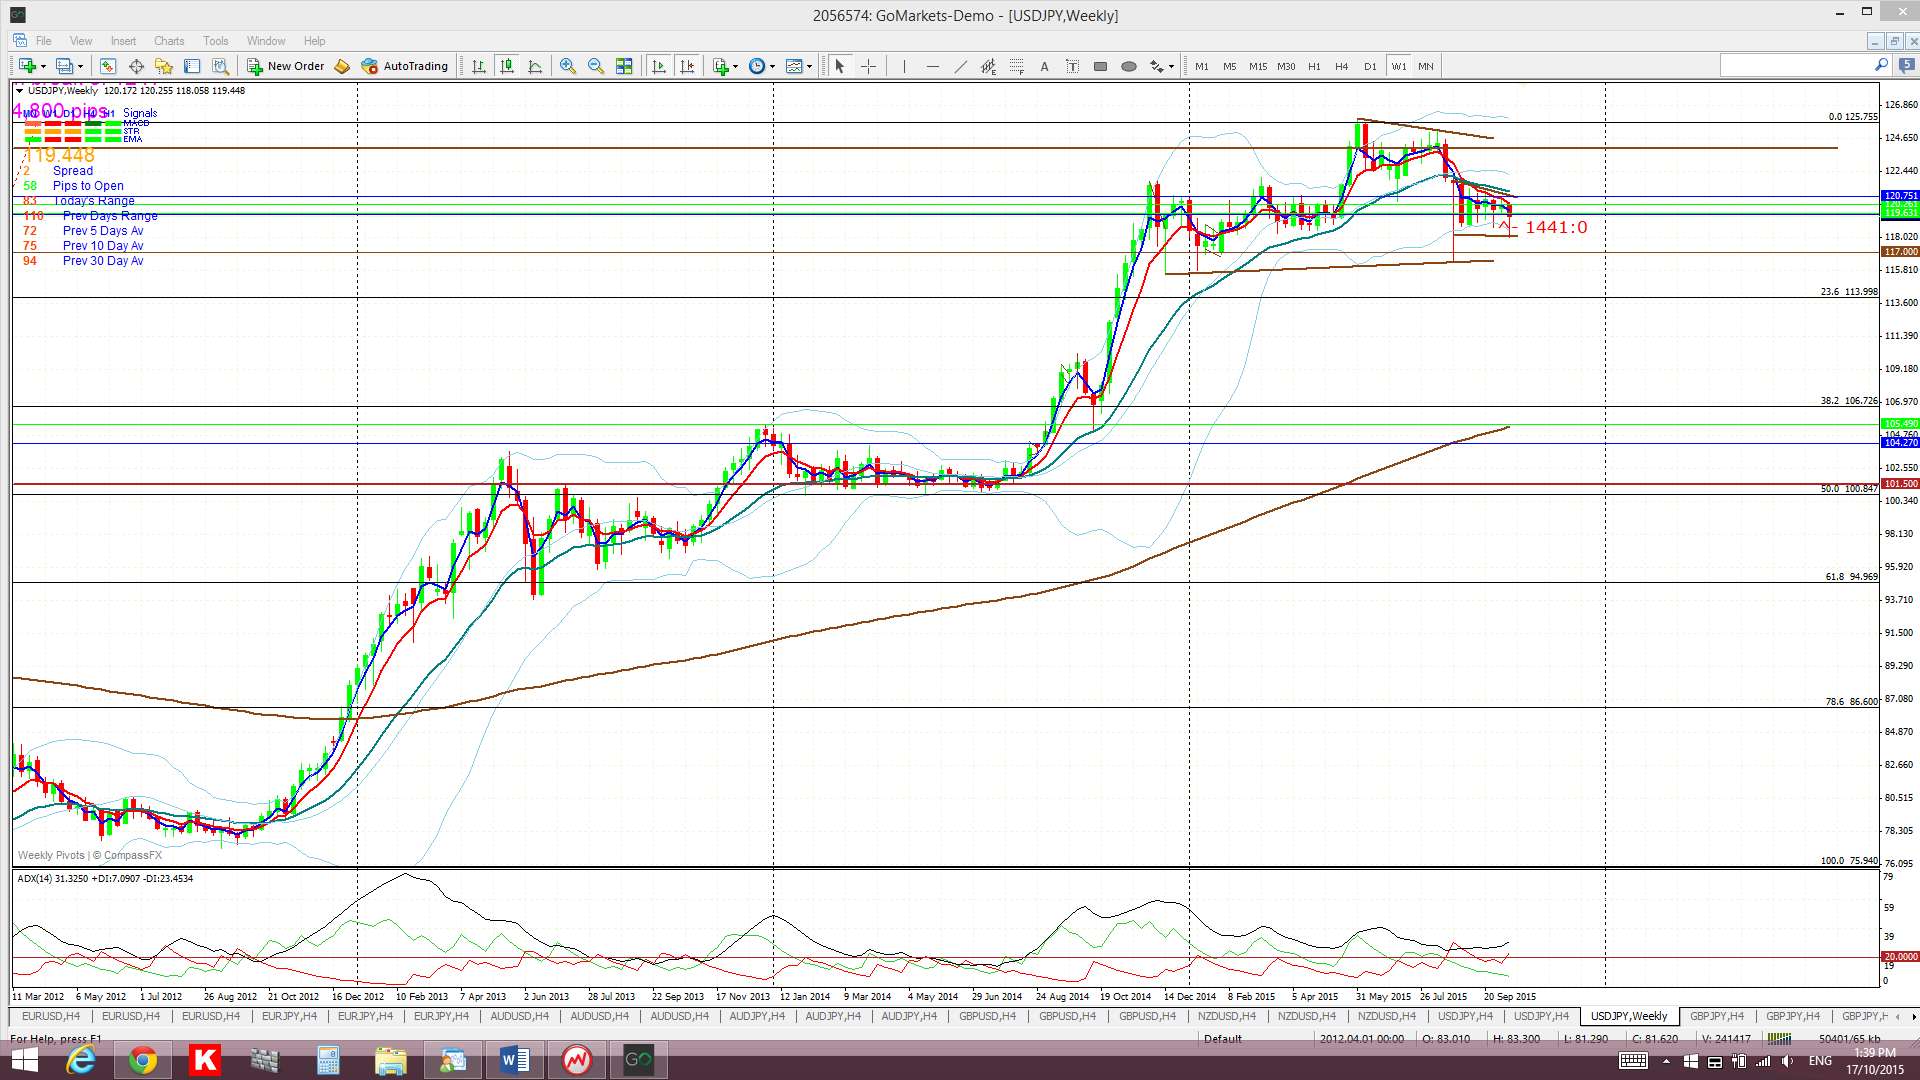
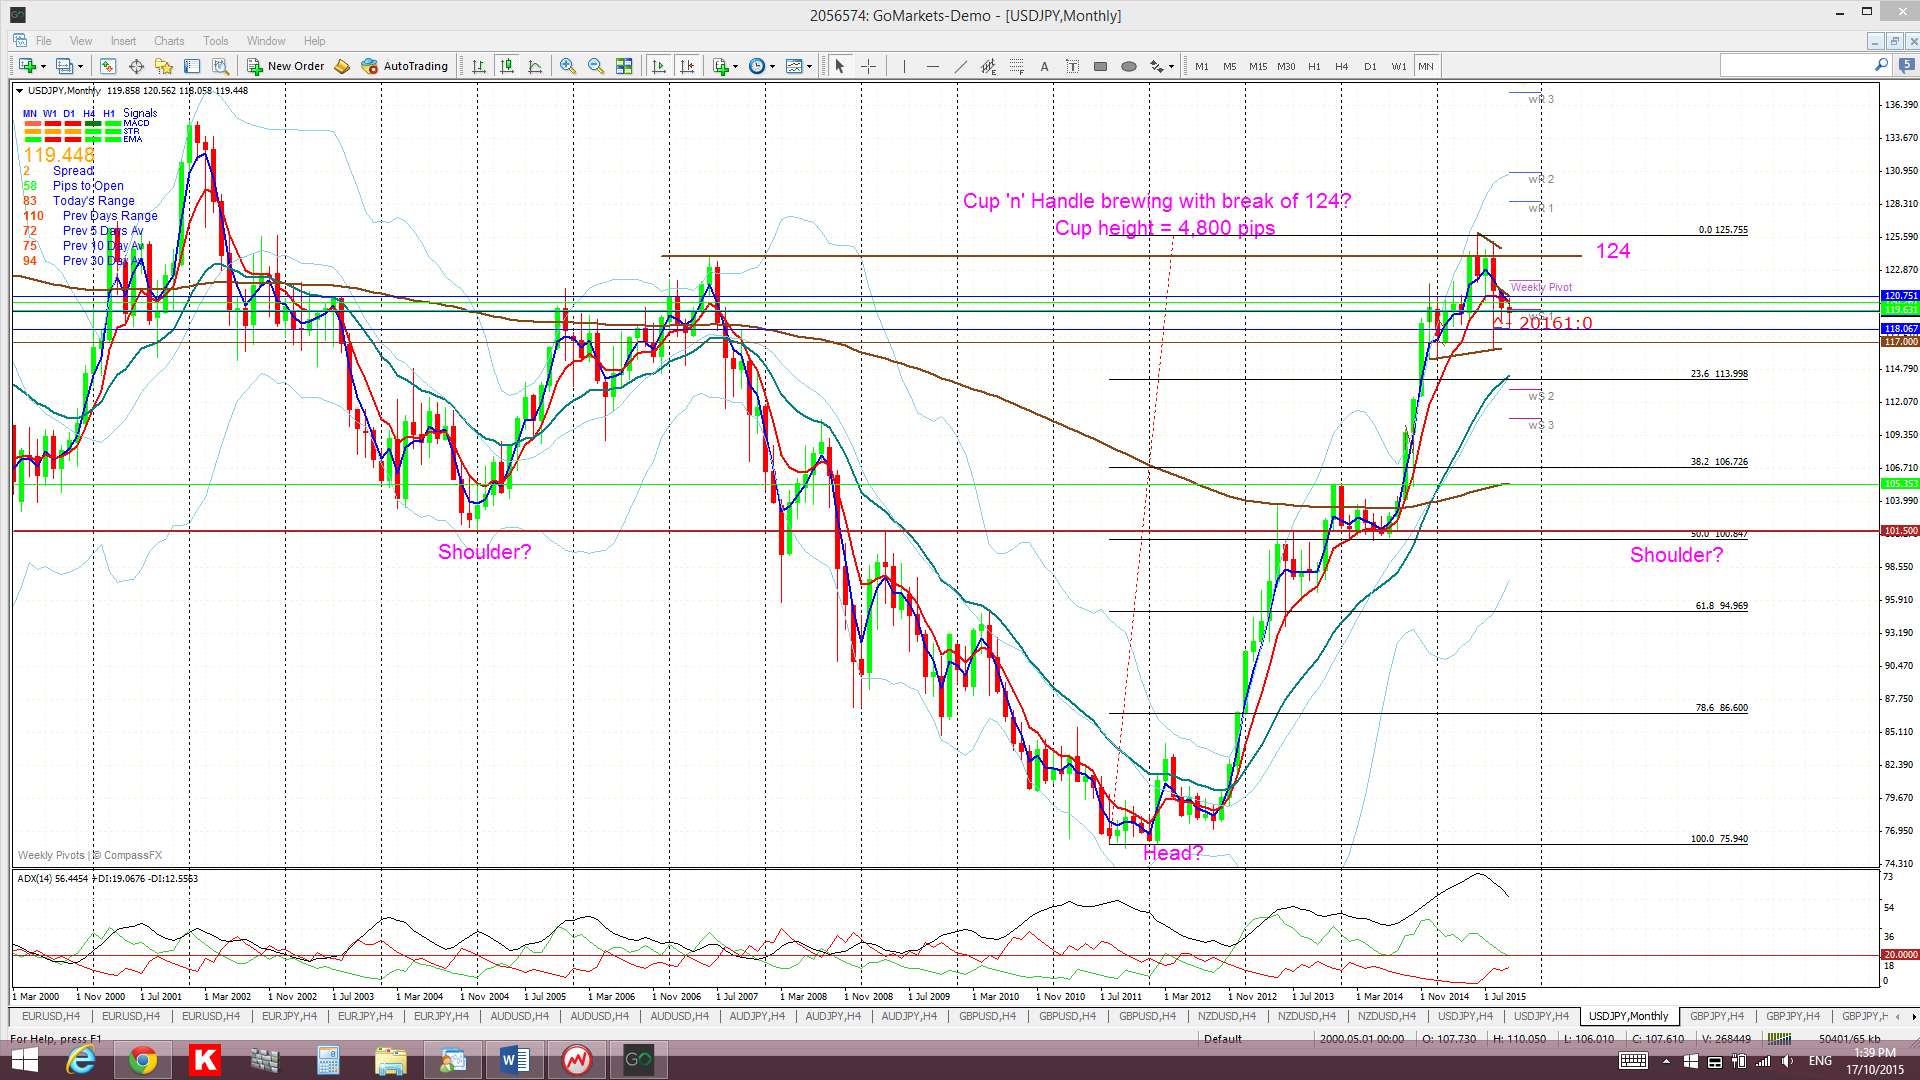
The Yen: U/J: The U/J remains chopping sideways as it has for the last eight weeks. It looked like it might have made a bearish breakdown last week BUT, with little follow through and no new daily TC signal, I’ve adjusted the trend lines here, yet again.
Price is trading below the Cloud on the 4hr and daily charts but above the Cloud on the weekly and monthly charts.
The weekly candle closed as a bearish candle.
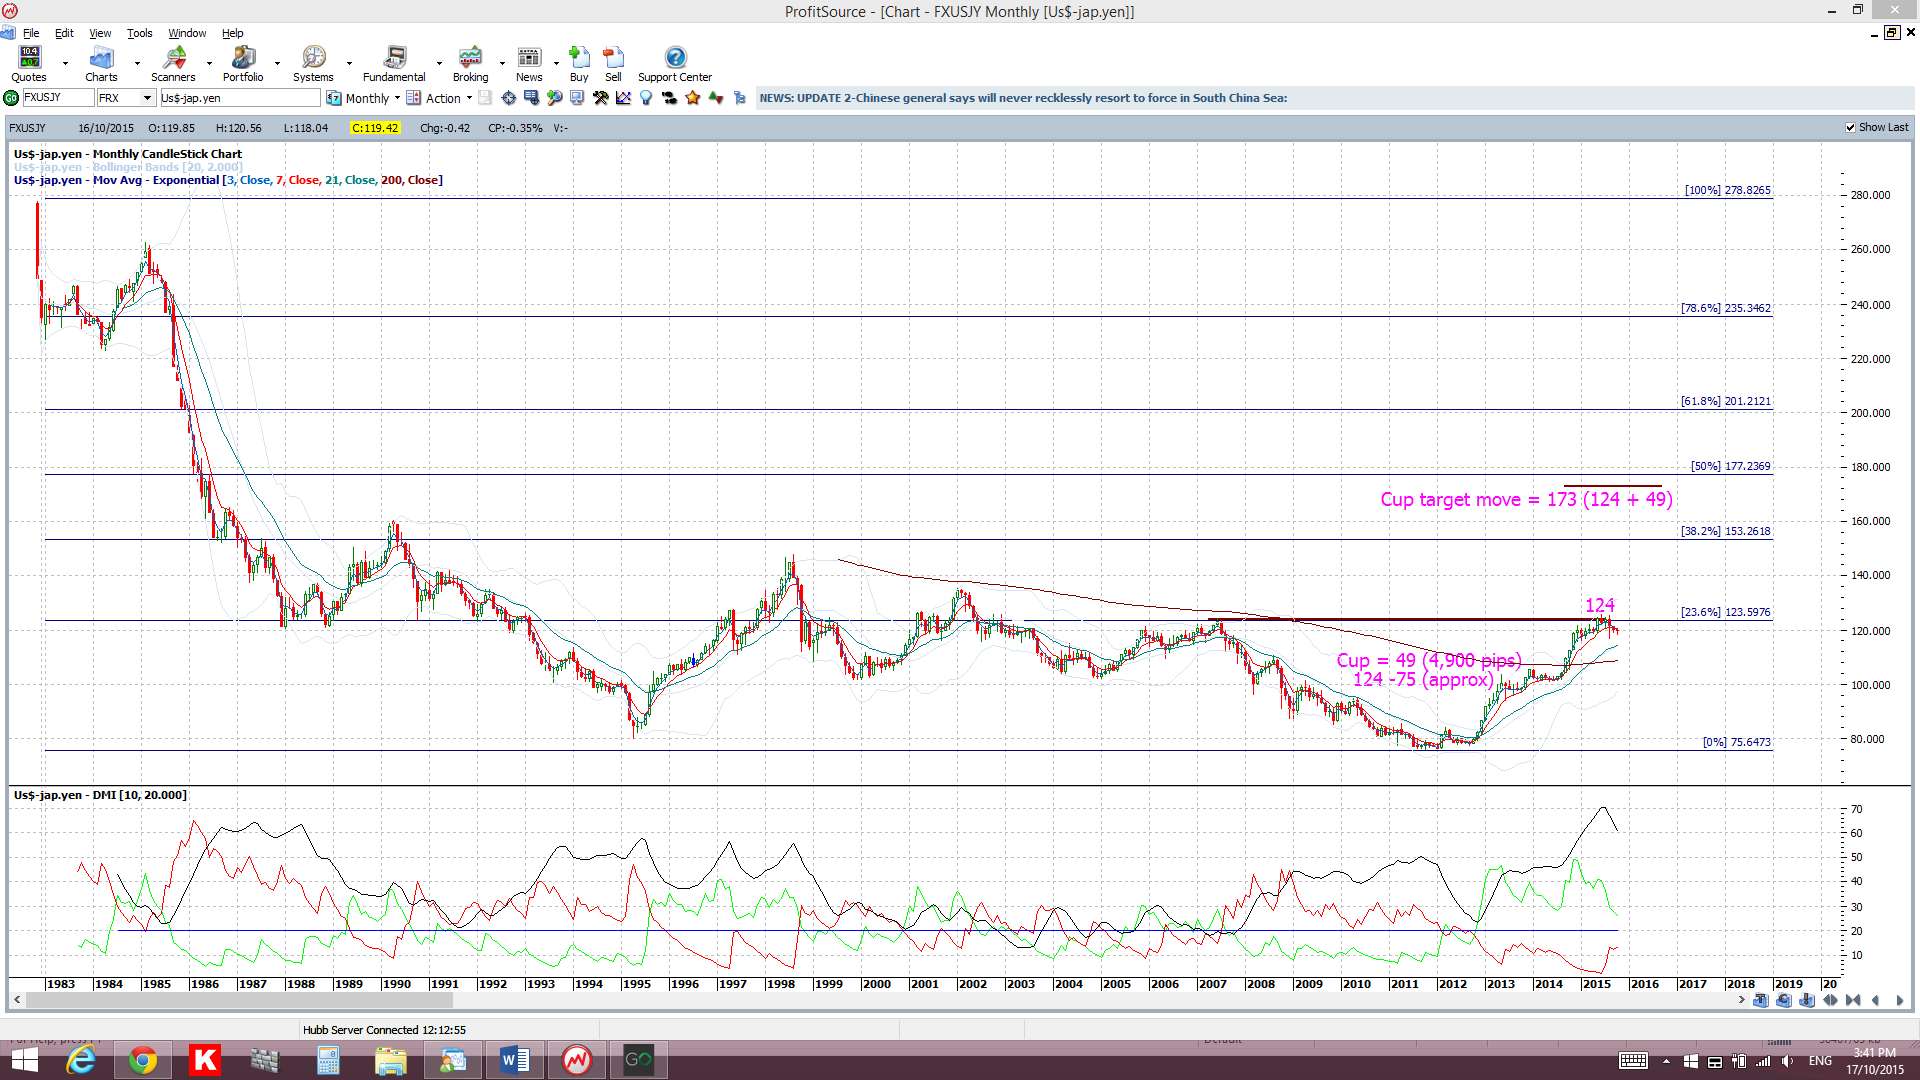
Monthly Chart Bullish Cup’ n’ Handle pattern: There looks to be a new bullish Cup ‘n’ Handle forming up on the monthly chart. The theory behind these patterns is that the height of the ‘Cup’ pattern is equivalent to the expected bullish move from the ‘handle’ breakout. The height of the Cup for the U/J weekly chart is around 4,800 ~ 4,900 pips. This may seem like a massive move but the longer term chart below shows this move to be reasonable as it would take the U/J up near the 50% fib of the 1985-2012 swing low move. Note the 101.5 level on the other monthly MT4 chart though. Any pullback down to this level, apart from helping to form up a huge Handle for the Cup ‘n’ Handle, would also help to develop a bullish ‘inverse H&S’ pattern.
- I’m watching for any new TC signal on this pair and the trading channel trend lines.

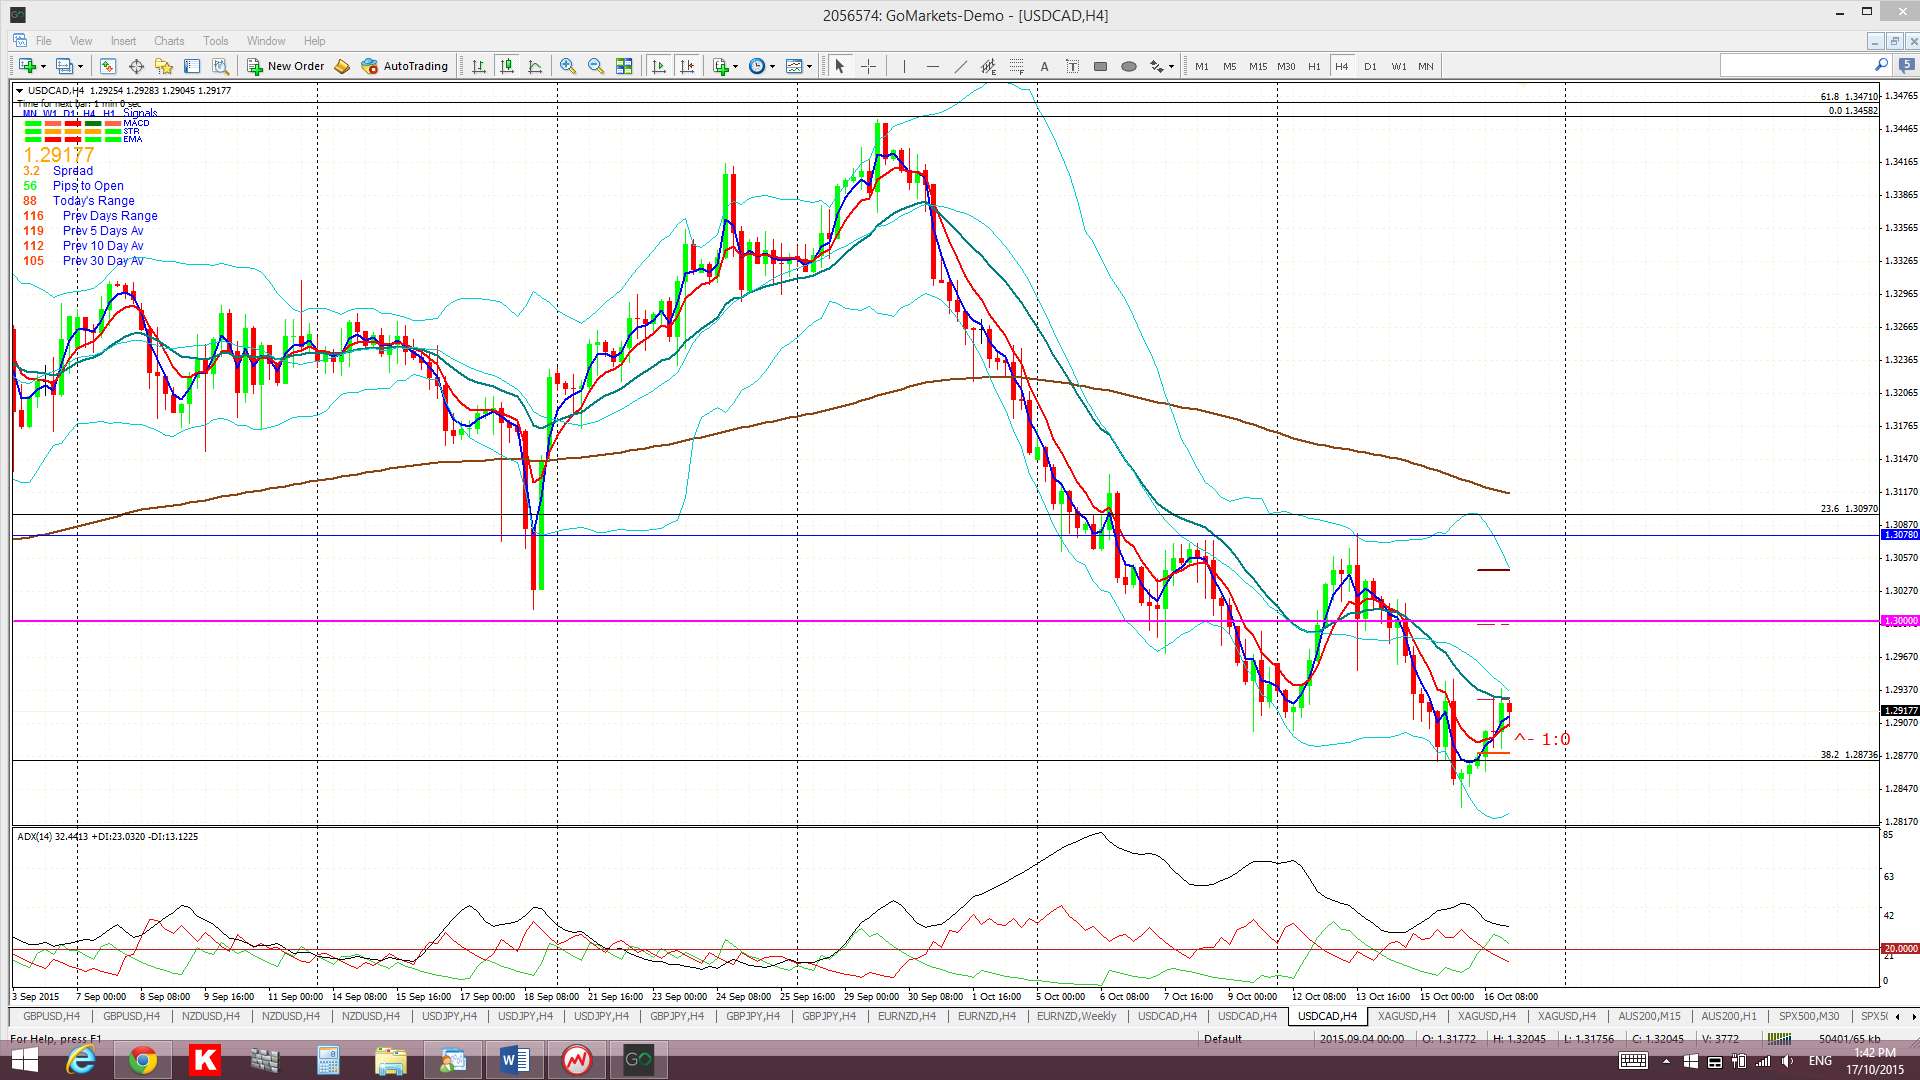
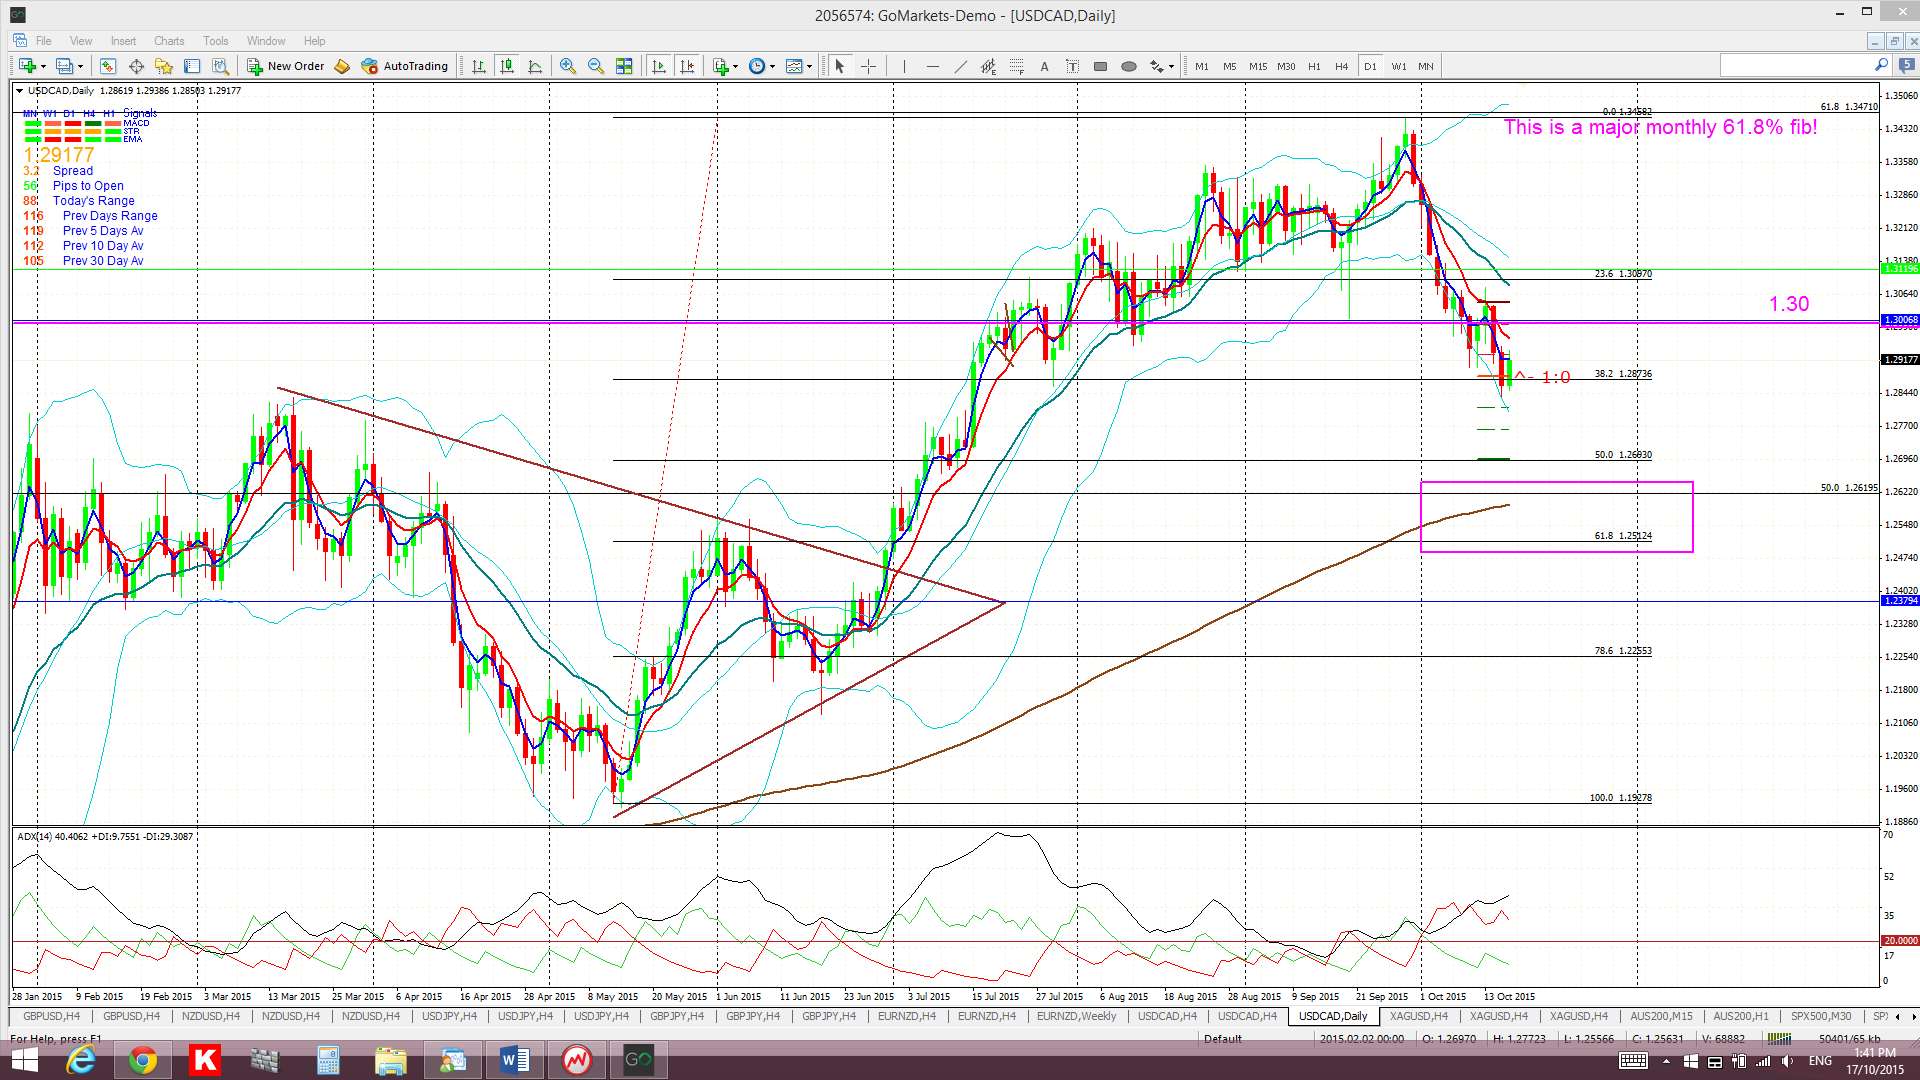
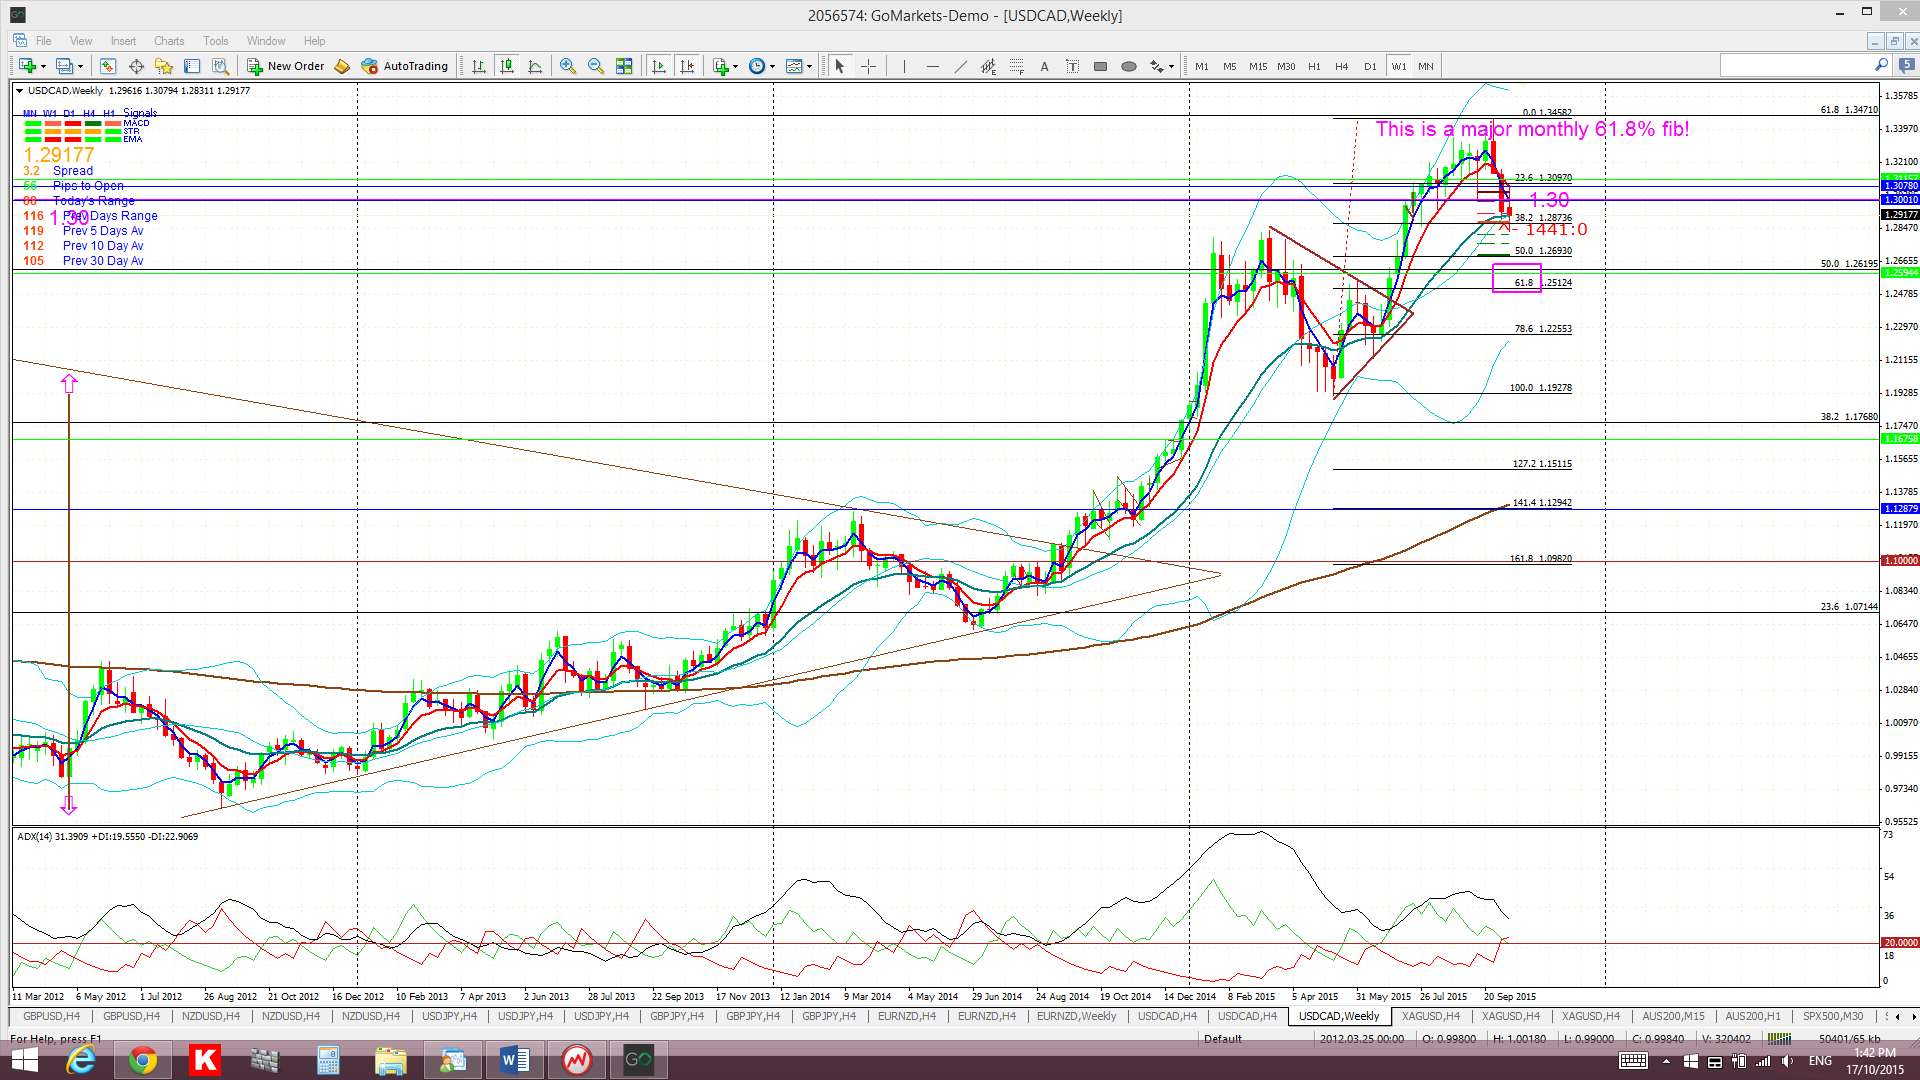
USD/CAD: USD/CAD price action continued to be choppy around the key 1.30 level last week. It closed below the key 1.30 level though and any further weakness might target the 1.25 level as this is near the daily 200 EMA and 61.8% fib of this recent swing high move. This area is shaded on the daily chart.
I’m still seeing a ‘Cup’ pattern forming up on the monthly chart and this warns of the potential of extended choppiness around this 1.30 region as price action creates the ‘Handle’.
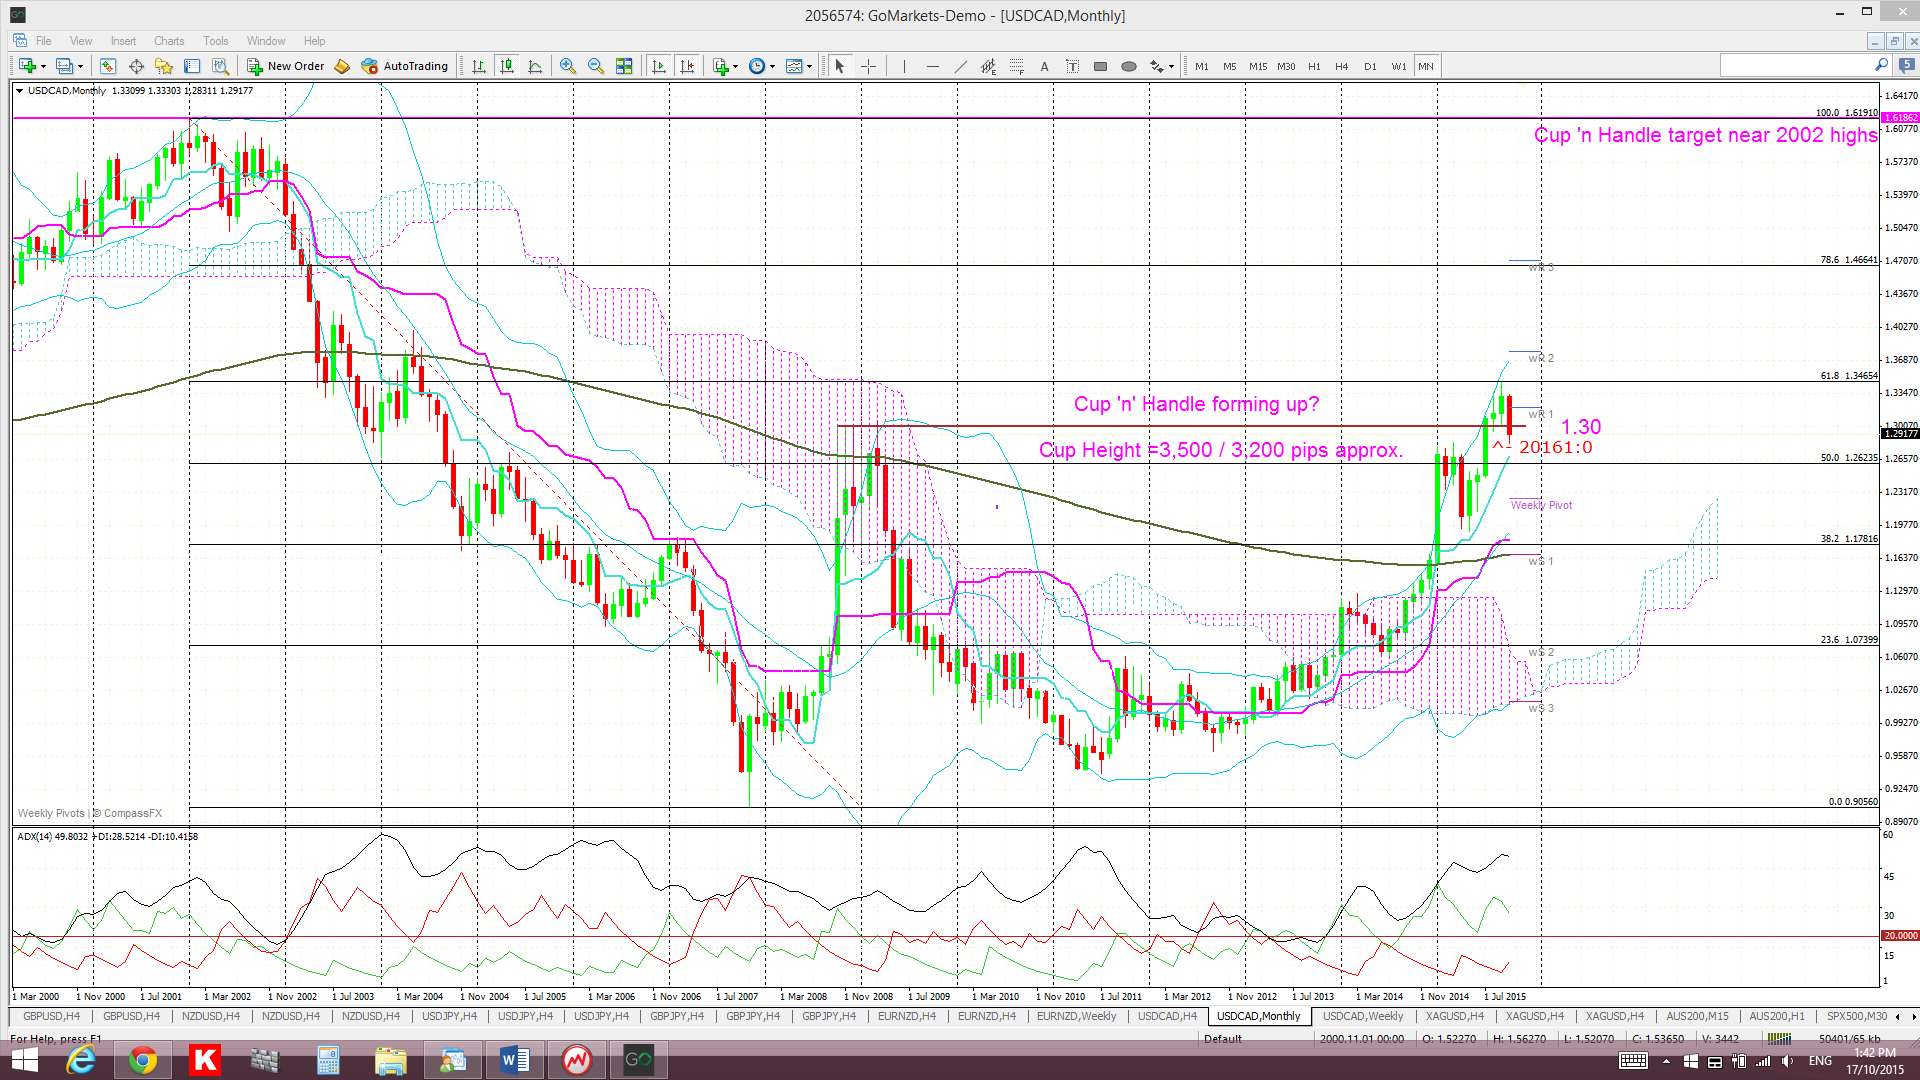
Monthly Chart Cup ‘n’ Handle? The monthly chart shows a possible bullish Cup ‘n’ Handle pattern forming up under the 1.30 level. This is worth keeping an eye on as the pattern would be worth up to 3,500 pips if it was to evolve as this is the height of the ‘Cup’. The interesting point is that the target for this pattern would put price up at the highs reached back in 2002 and this is equal to a 100% Fib retracement of the 2002-2007 bear move.
Price is trading below the Cloud on the 4hr chart, in the bottom edge of the Cloud on the daily chart but above the Cloud on the weekly and monthly charts.
The weekly candle closed as a bearish coloured ‘Spinning Top’ candle reflecting some indecision.
- I’m watching for any new TC signal on this pair and the 1.30 level.
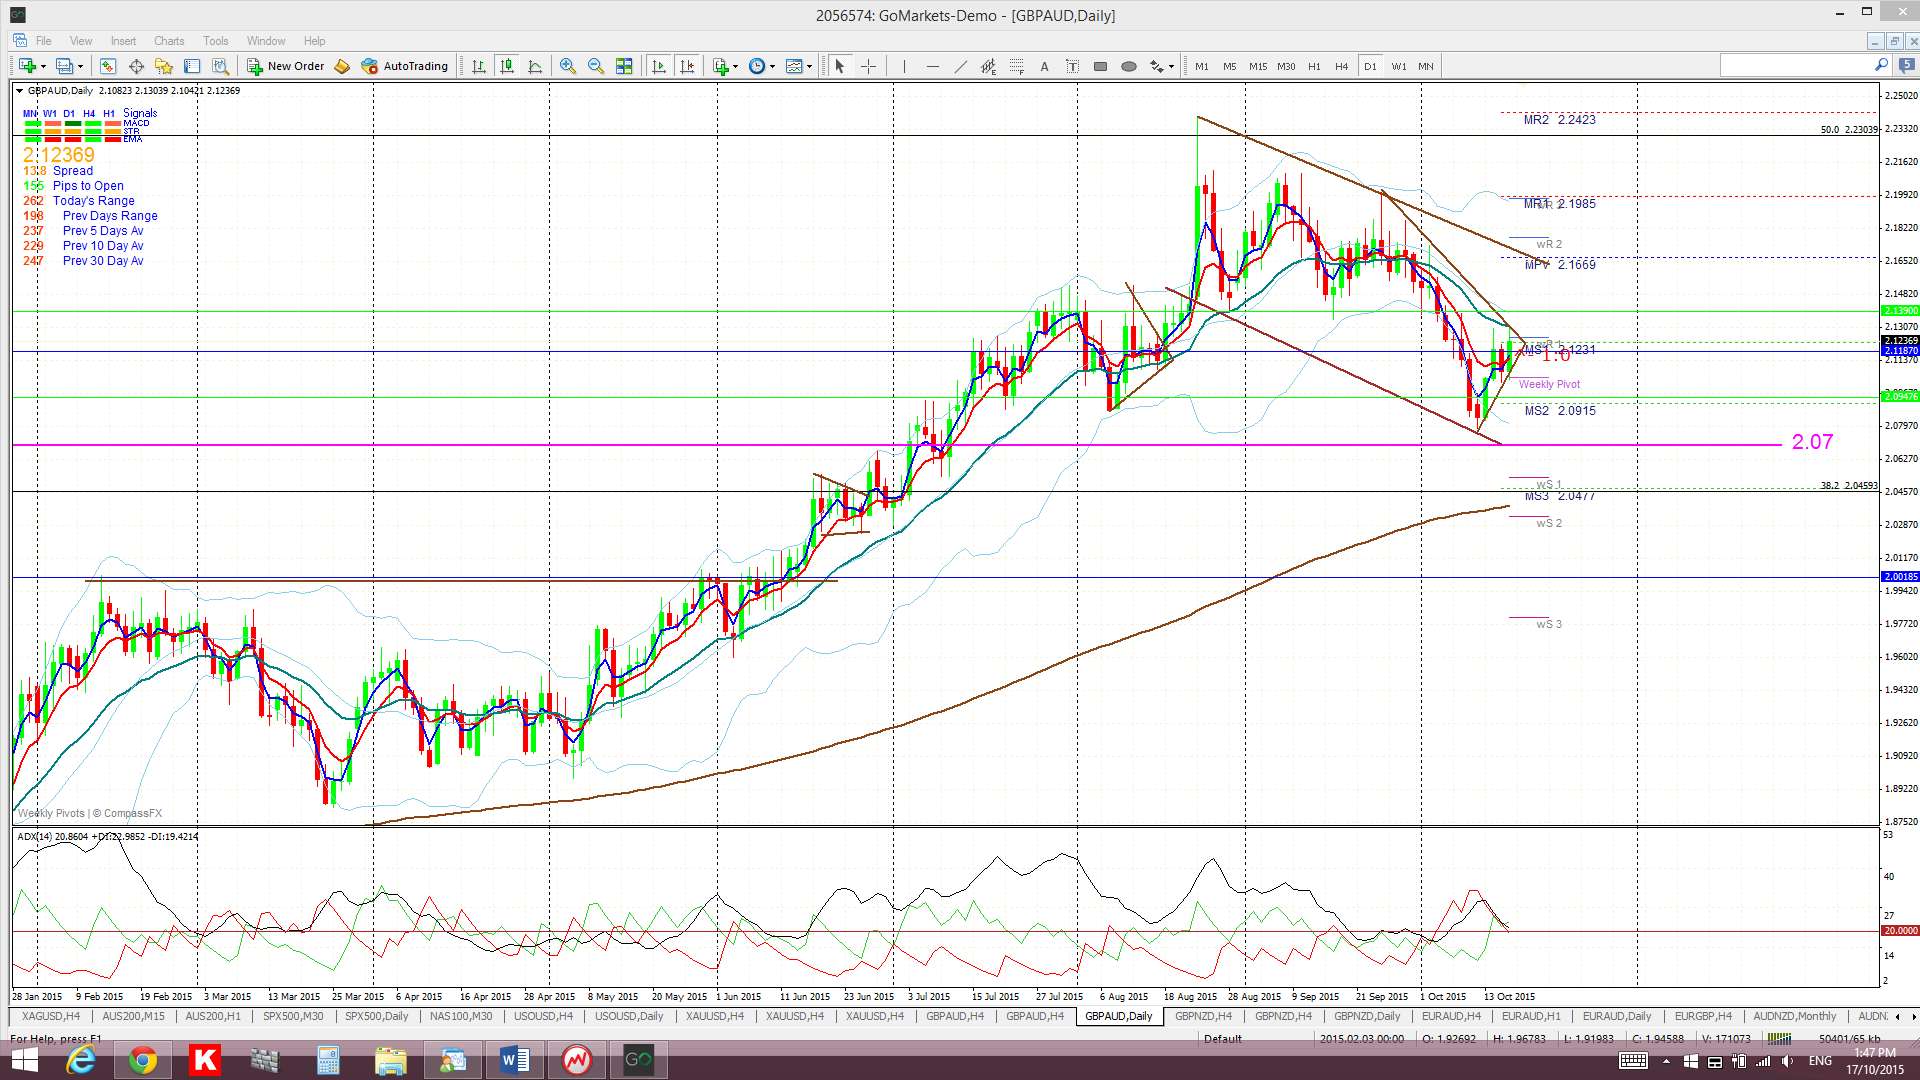
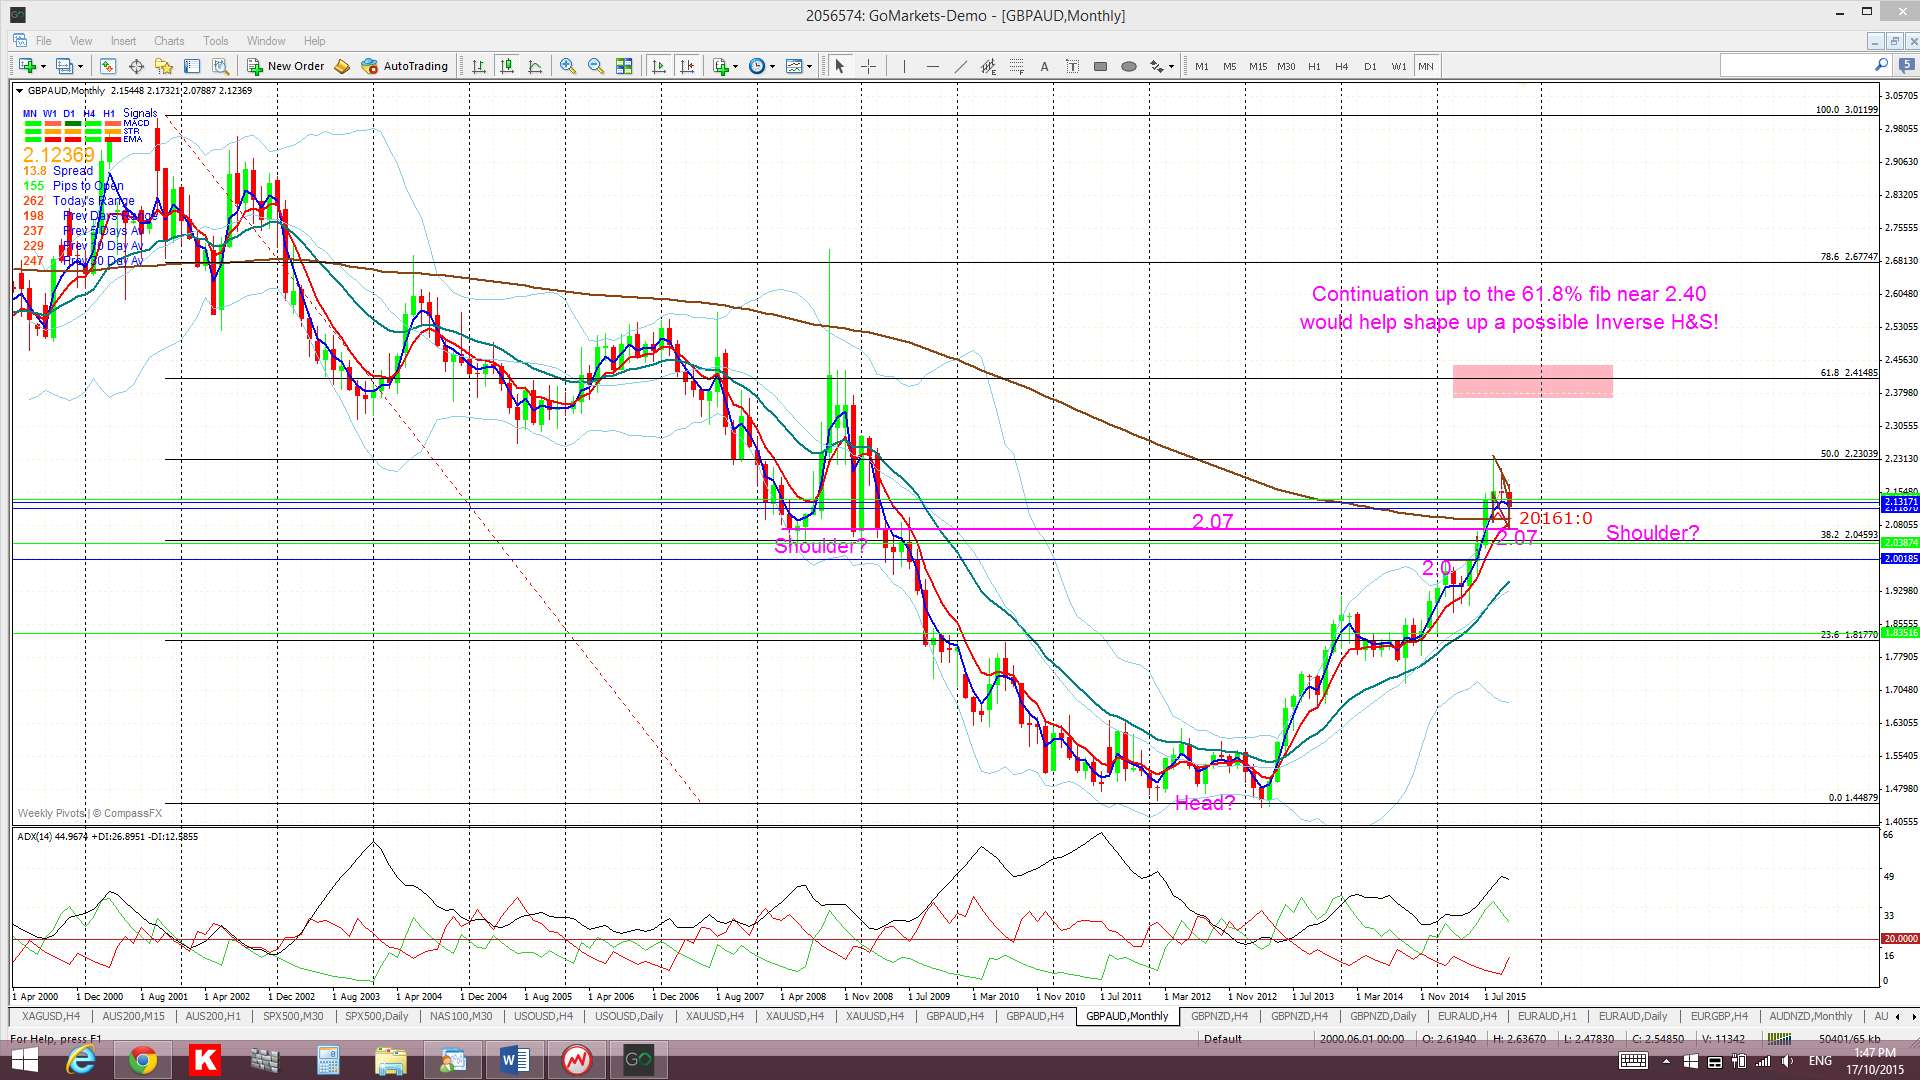
GBP/AUD: This pair remains choppy above the 2.07 level with price action pulling back to test this support during last week.
The 4hr chart shows price consolidating within a triangle and the daily shows a potential Bull Flag. So, watch for any TL breakout that evolve with momentum.
The 2.07 level is major S/R and near the 50% fib of the recent swing high move. Below this there is the 61.8% fib of this move which is down near the 2.03 level but is also near the daily 200 EMA and so this congested region could attract price as well.
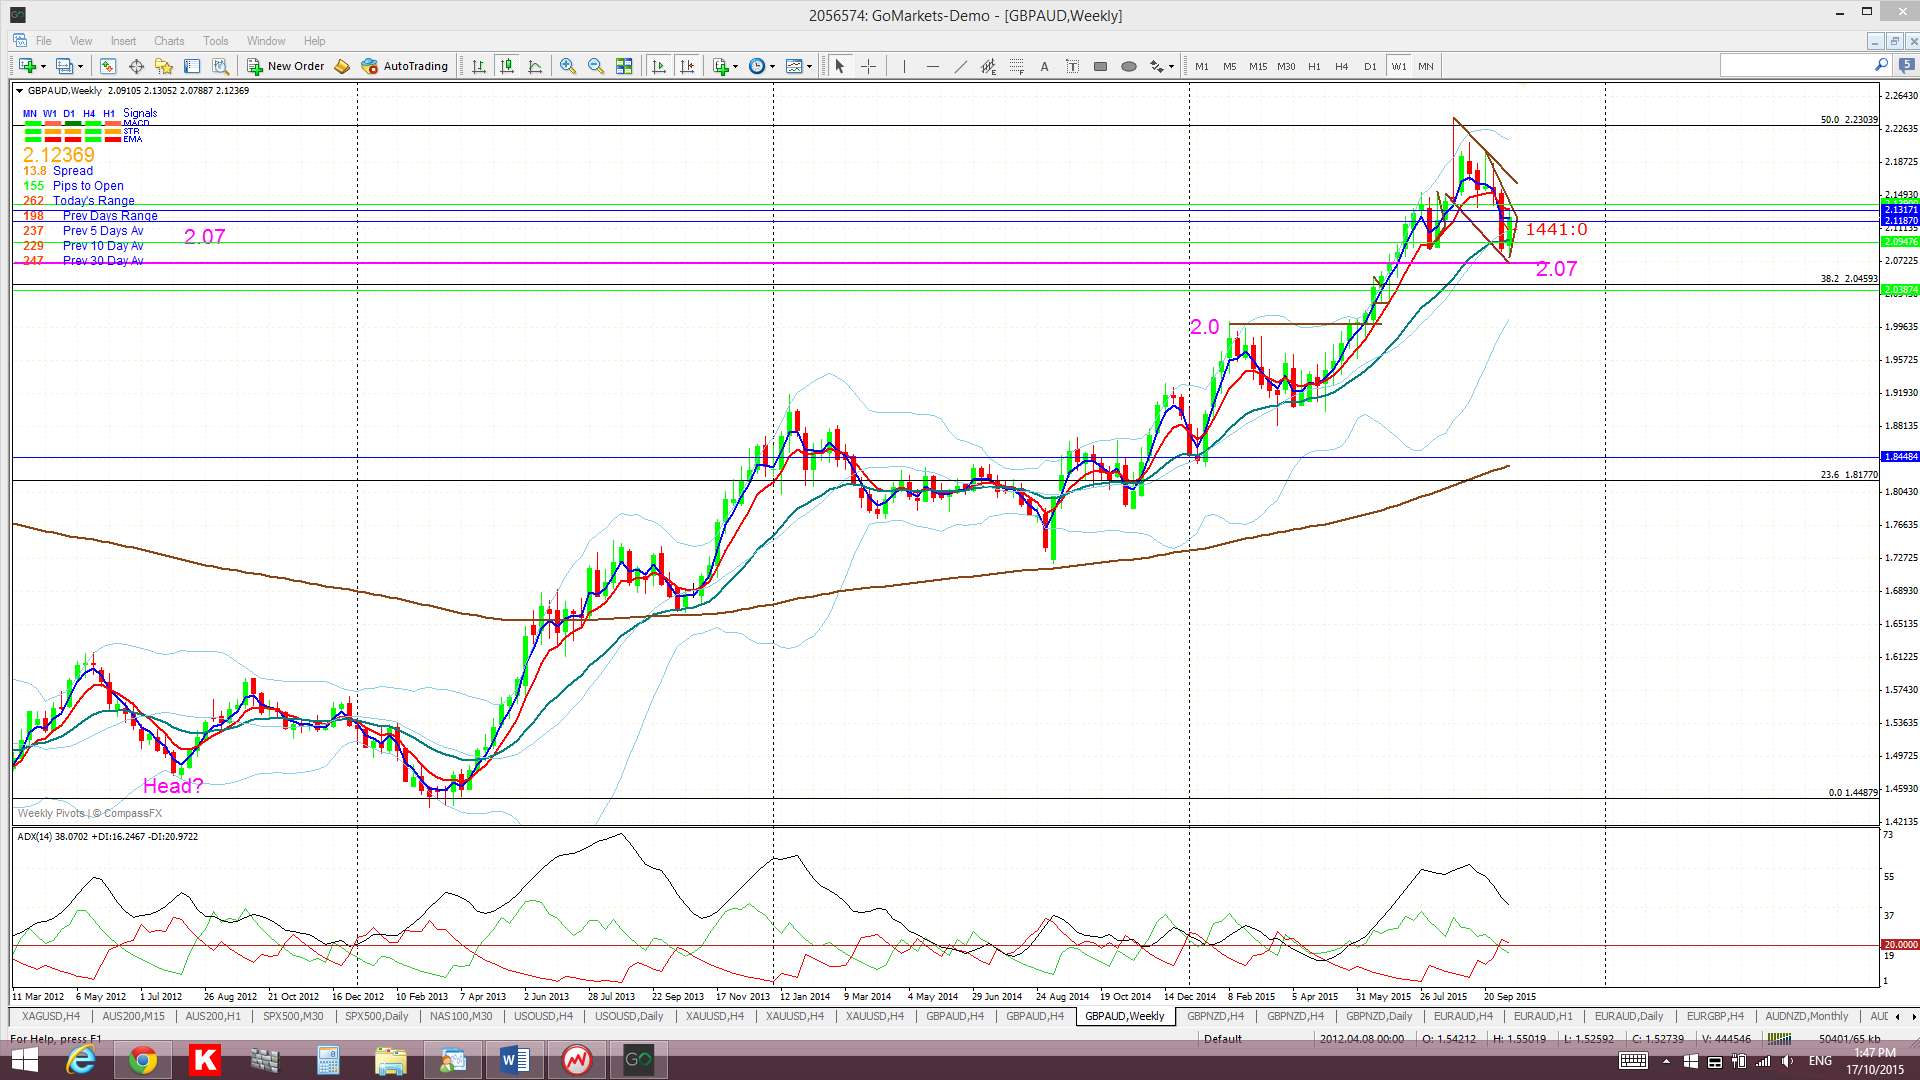
Two technical patterns? There is the look of a ‘Cup’ pattern on the monthly chart which could support continued choppiness around this 2.07 region as a potential ‘Handle’ forms up however, despite this, there could still be some decent moves though within any swings. Any continued bullish momentum may bring an alternative monthly chart pattern into focus though. A continued push up to the 2.40 region near the 61.8% fib would help to form up a possible bullish ‘Inverse H&S’ pattern. I would then be looking for any pullback back down to the ‘Shoulder’ region of 2.07.
Price is trading near the top of the Cloud on the 4hr chart, below the Cloud on the daily chart but above the Ichimoku Cloud on the weekly and monthly charts.
The weekly candle closed as a bullish coloured ‘Inside’ candle reflecting some indecision here.
- I’m watching for any new TC signal on this pair, the 4hr triangle pattern and the 2.07 level.

EUR/NZD: I’m still watching for this to pull back to test the congested region noted on the weekly chart.

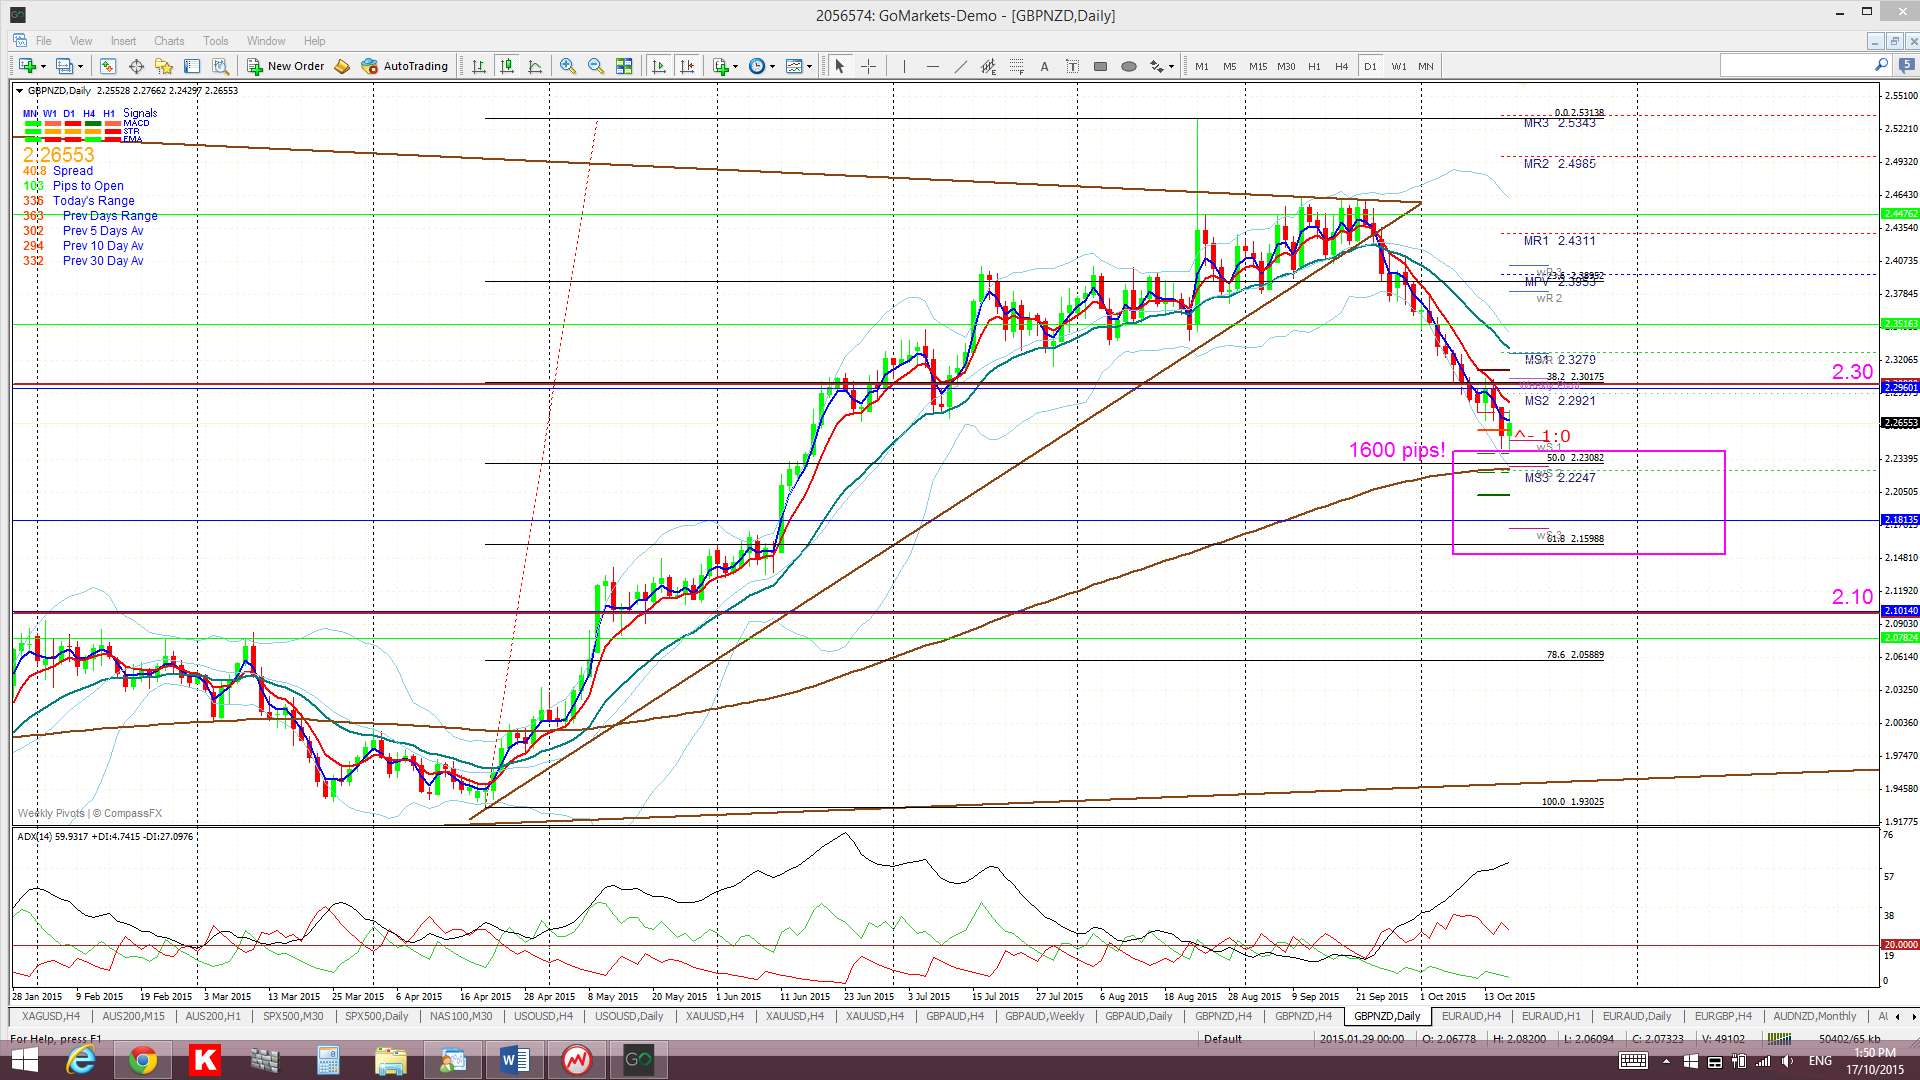
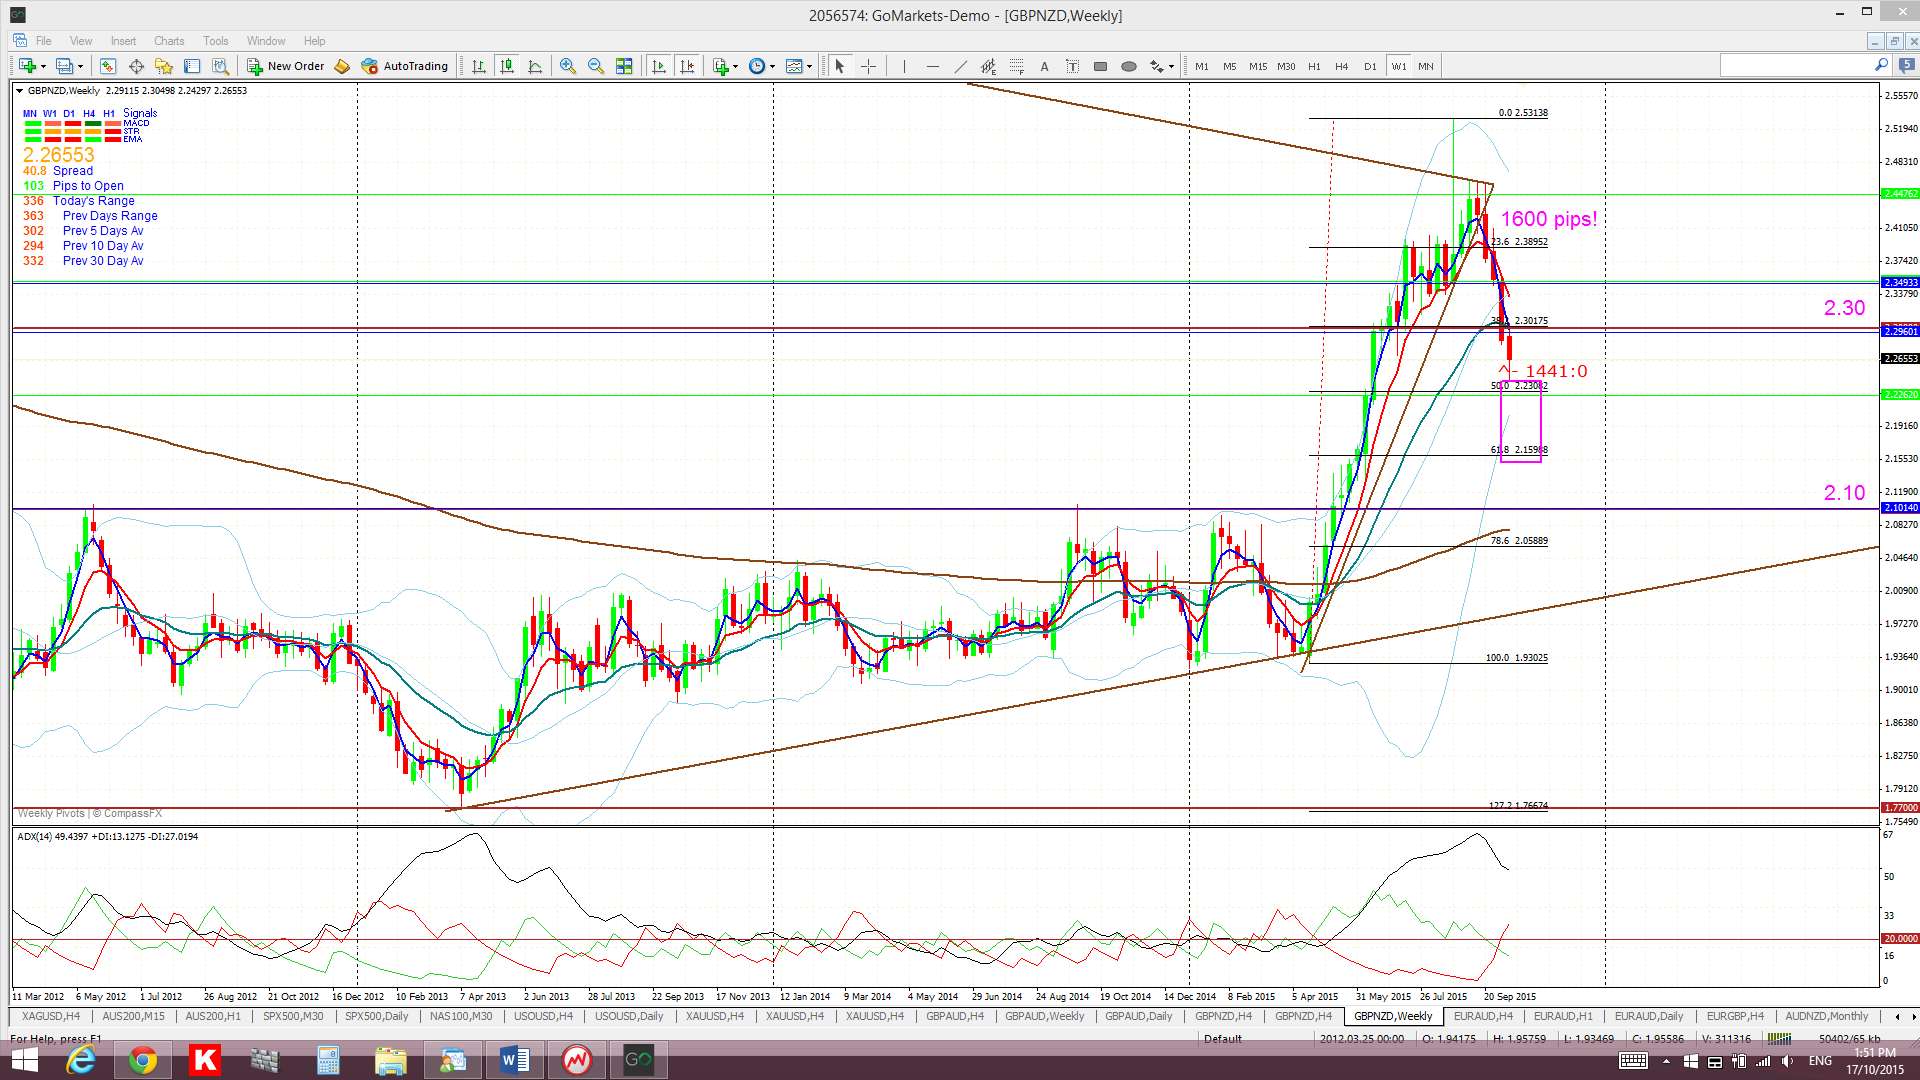
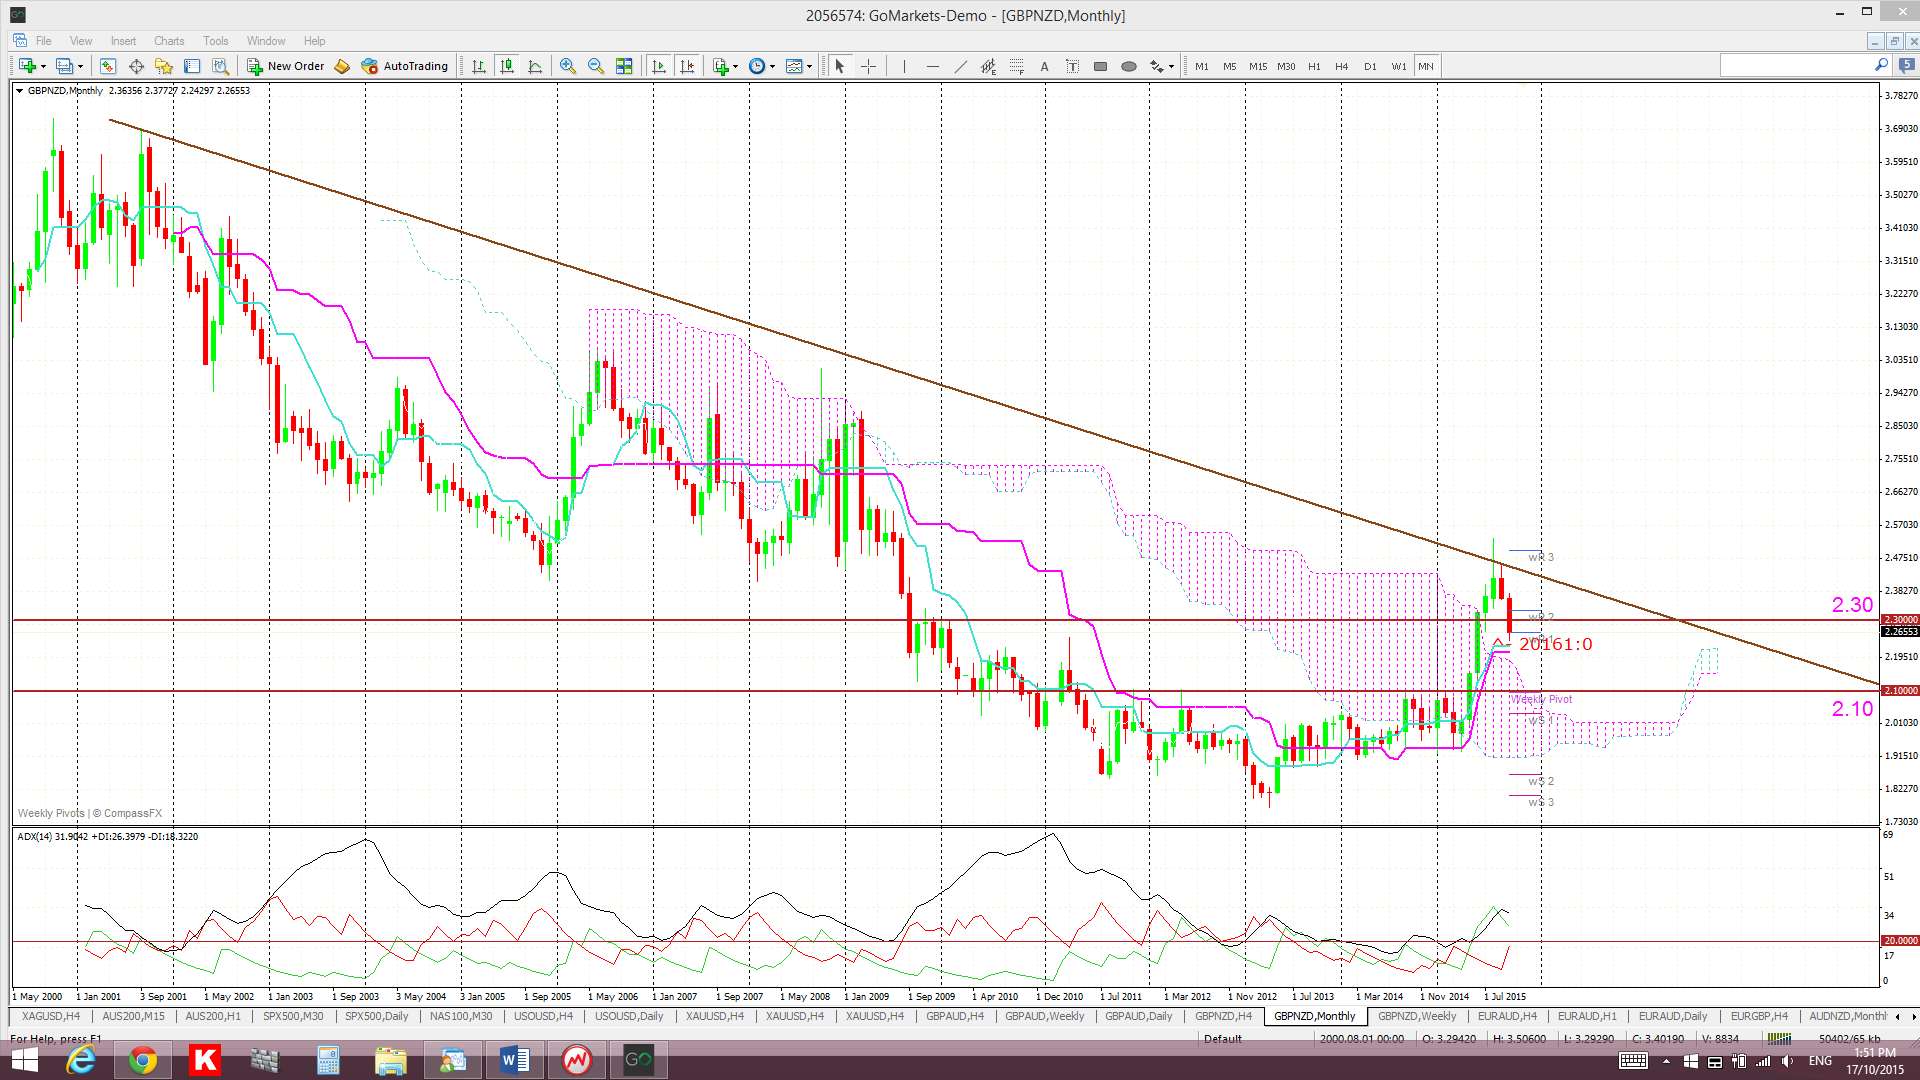
GBP/NZD: The GBP/NZD daily-chart’s trend line breakdown has now given over 1,600 pips. Recall that whilst this break did not trigger a clean TC signal on the 4hr chart time frame it did on the daily chart time frame.
Price action seems to be continuing to consolidate under a major monthly chart bear trend line and has moved below the 2.30 support level but there are two other regions that this pair might still target in any bearish continuation:
- The region between the 50% and 61.8% fib that holds the daily 200 EMA (highlighted on daily chart).
- The previous breakout and S/R region of 2.10.
The GBP/NZD is trading below the Cloud on the 4hr and daily charts but above the Cloud on the weekly and monthly charts.
The weekly candle closed as a bearish candle.
- I’m watching for any new TC signal on this pair.

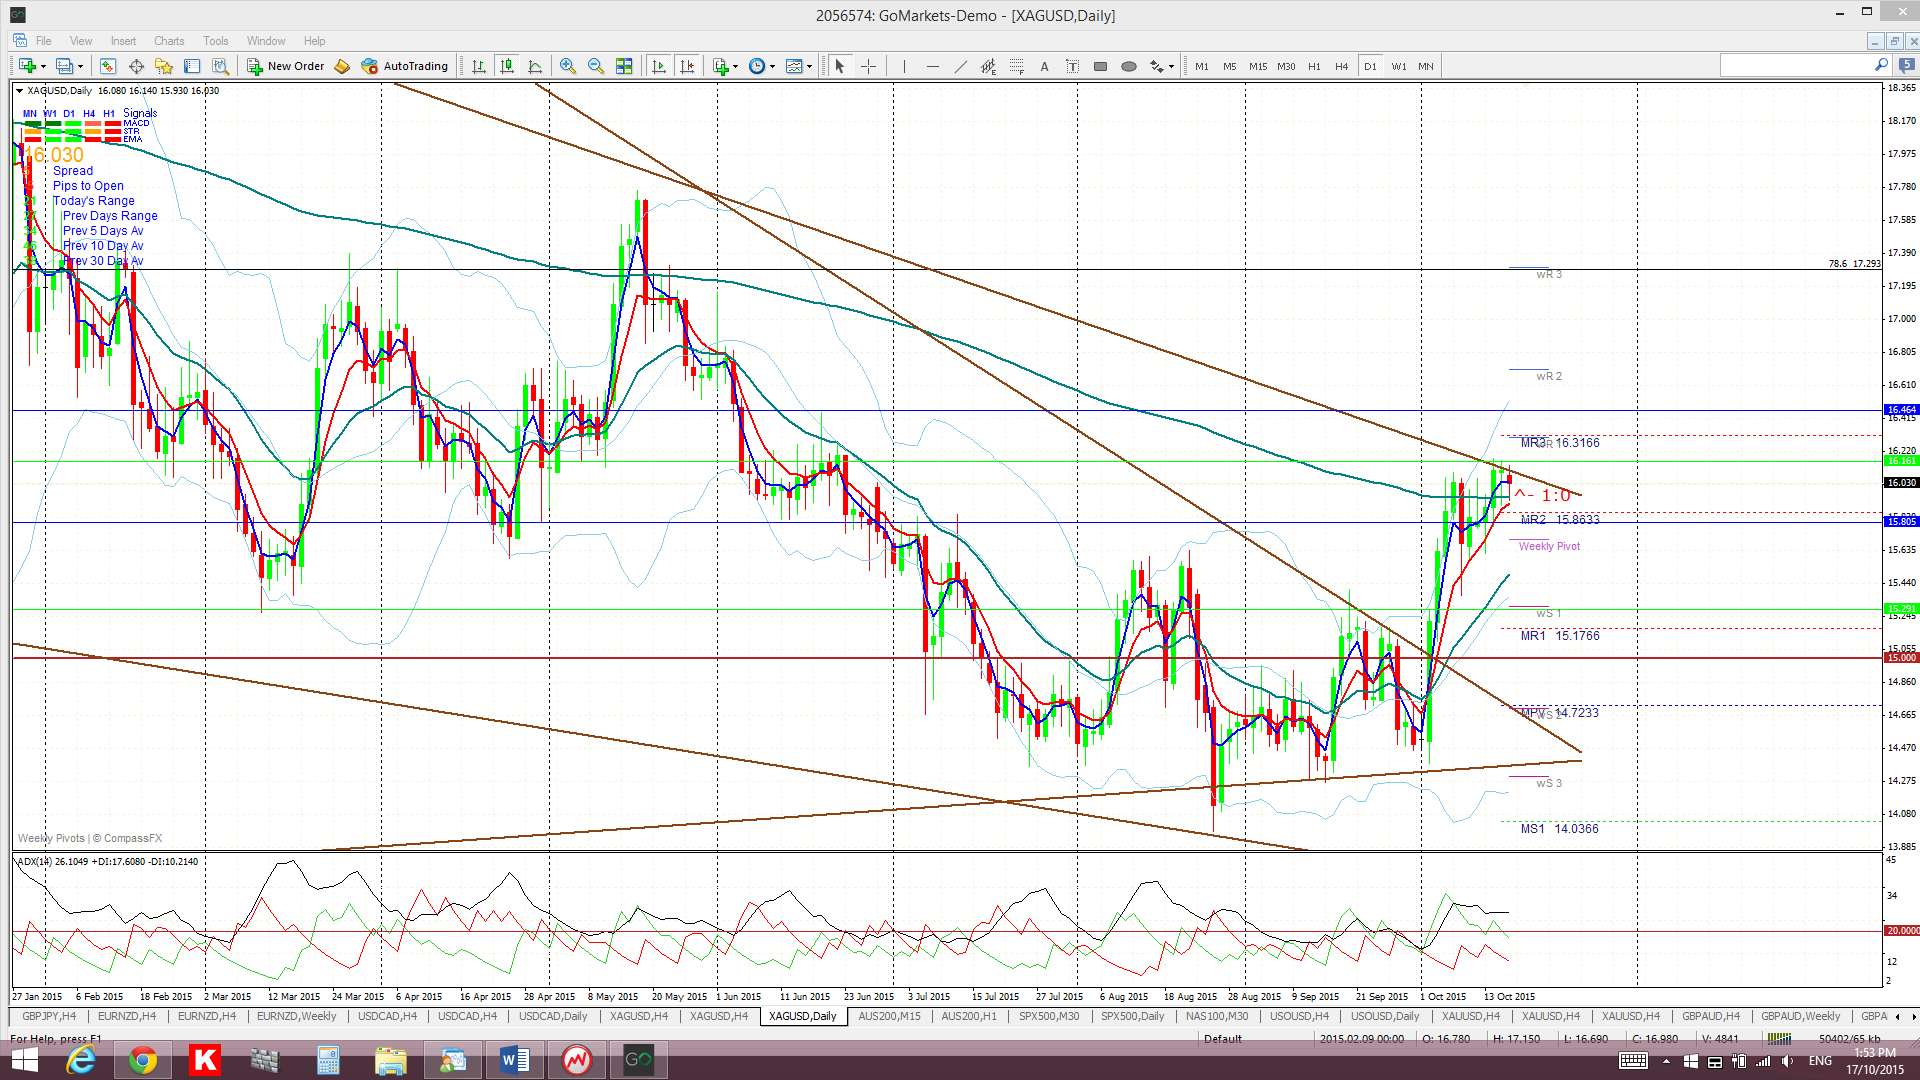
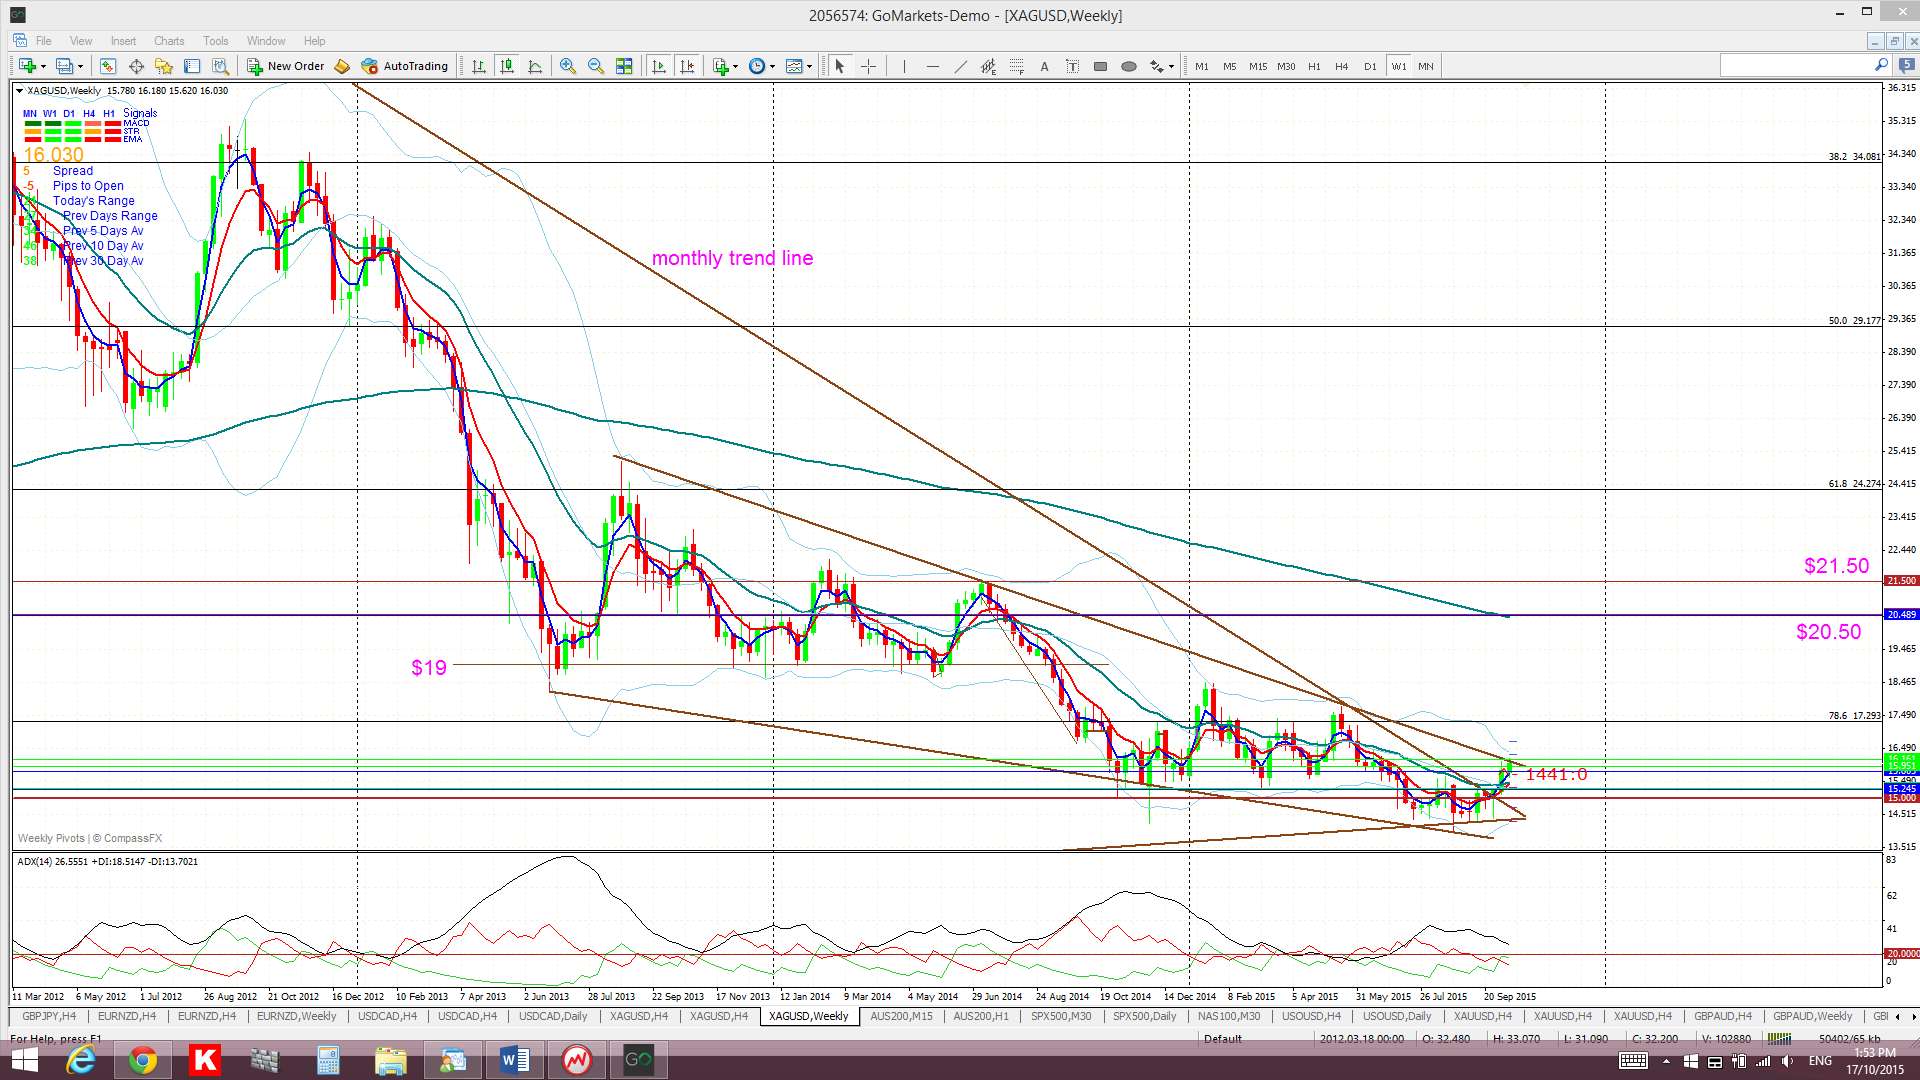
Silver: Silver chopped a bit higher last week and whilst it is holding just above the $16 level it remains just below the weekly chart’s wedge trend line. Any upside breakout here would be quite bullish though.
Silver is trading above the Cloud on the 4hr and daily charts but below the weekly and monthly Clouds.
The weekly candle closed as a bullish candle.
Any new and sustained hold back below $15 would be bearish though and would bring the $11 and $9 levels into focus. $11 is previous S/R and the $9 area is the 100% fib level.
- I’m watching for any new TC signal, the $16 level and the weekly chart’s descending-wedge trend lines.


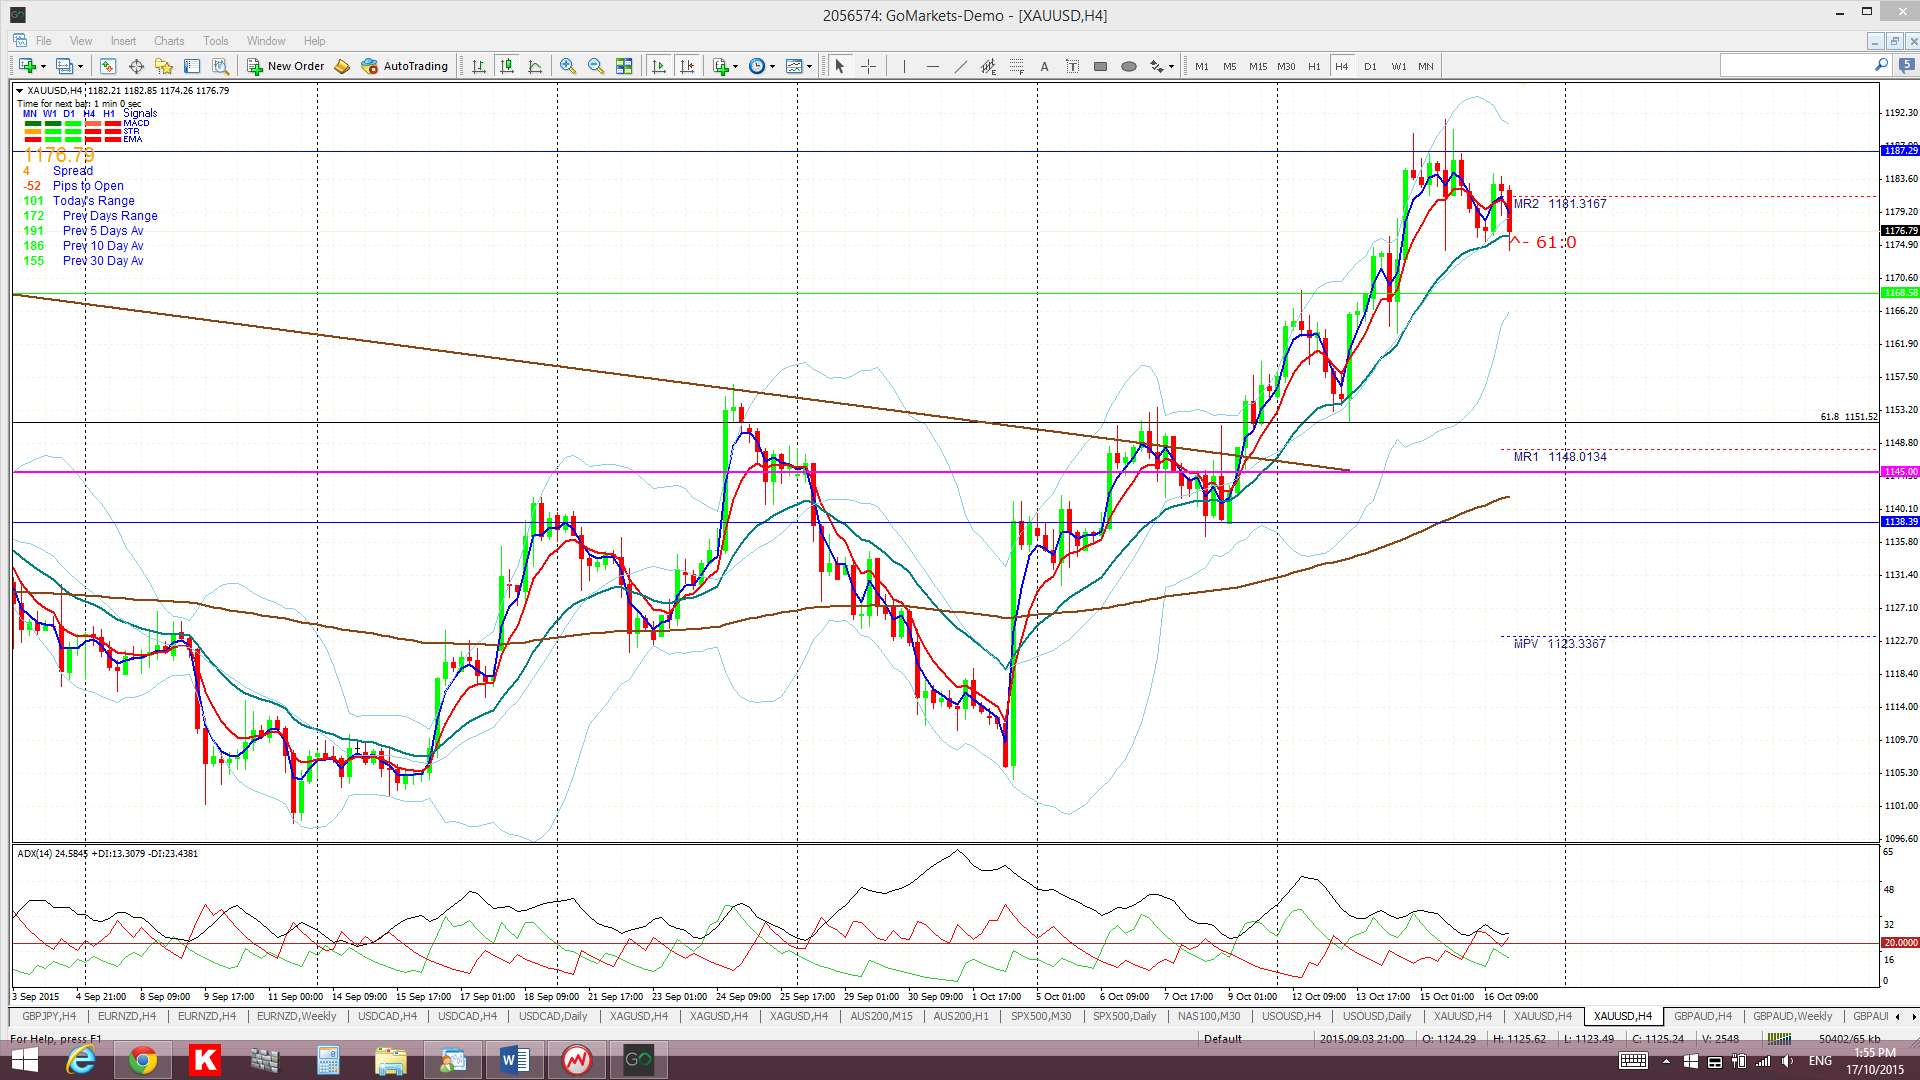
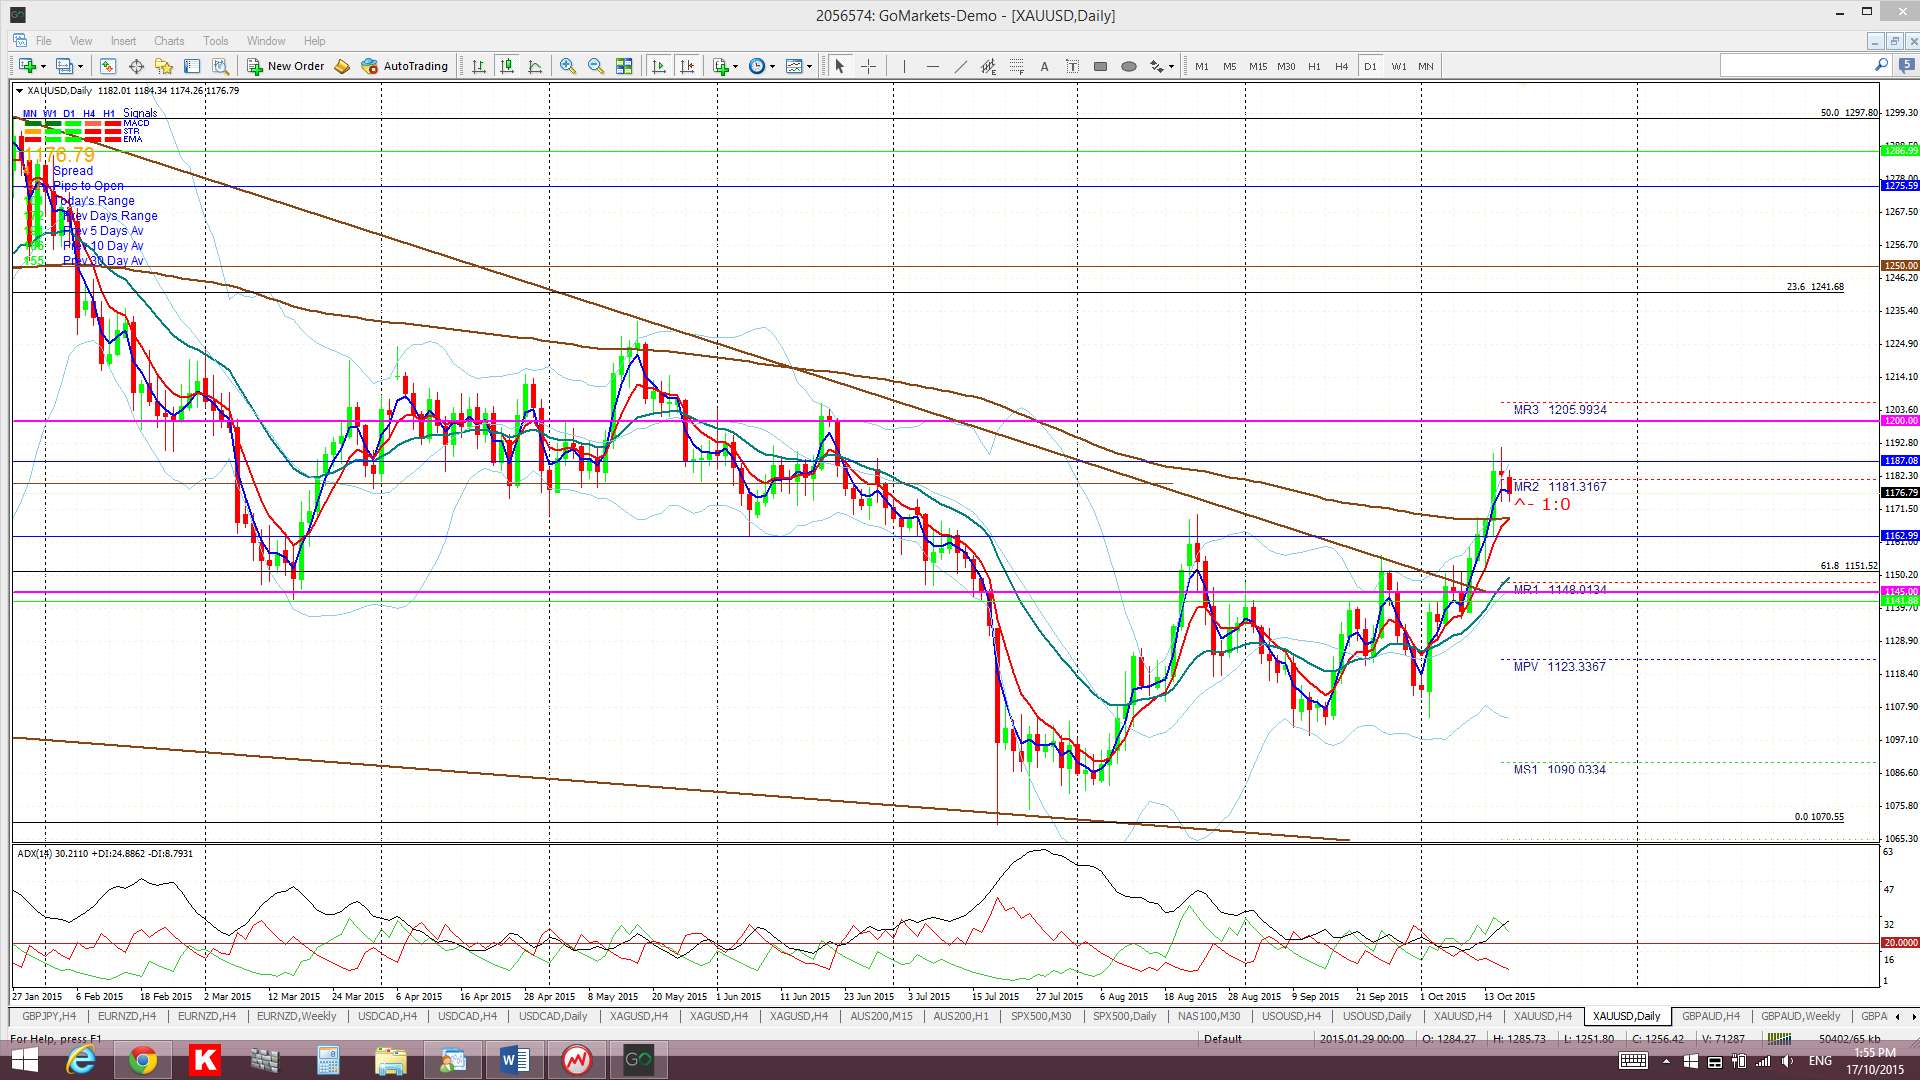
Gold: Gold continues trading higher following the bullish descending wedge breakout noted here last week. I am wary though that price action could still pull back to test the trend line breakout region near $1,150 / $1,145 again.
I wrote an article on Gold during last week where I noted potential bullish targets and this can be found through this link.
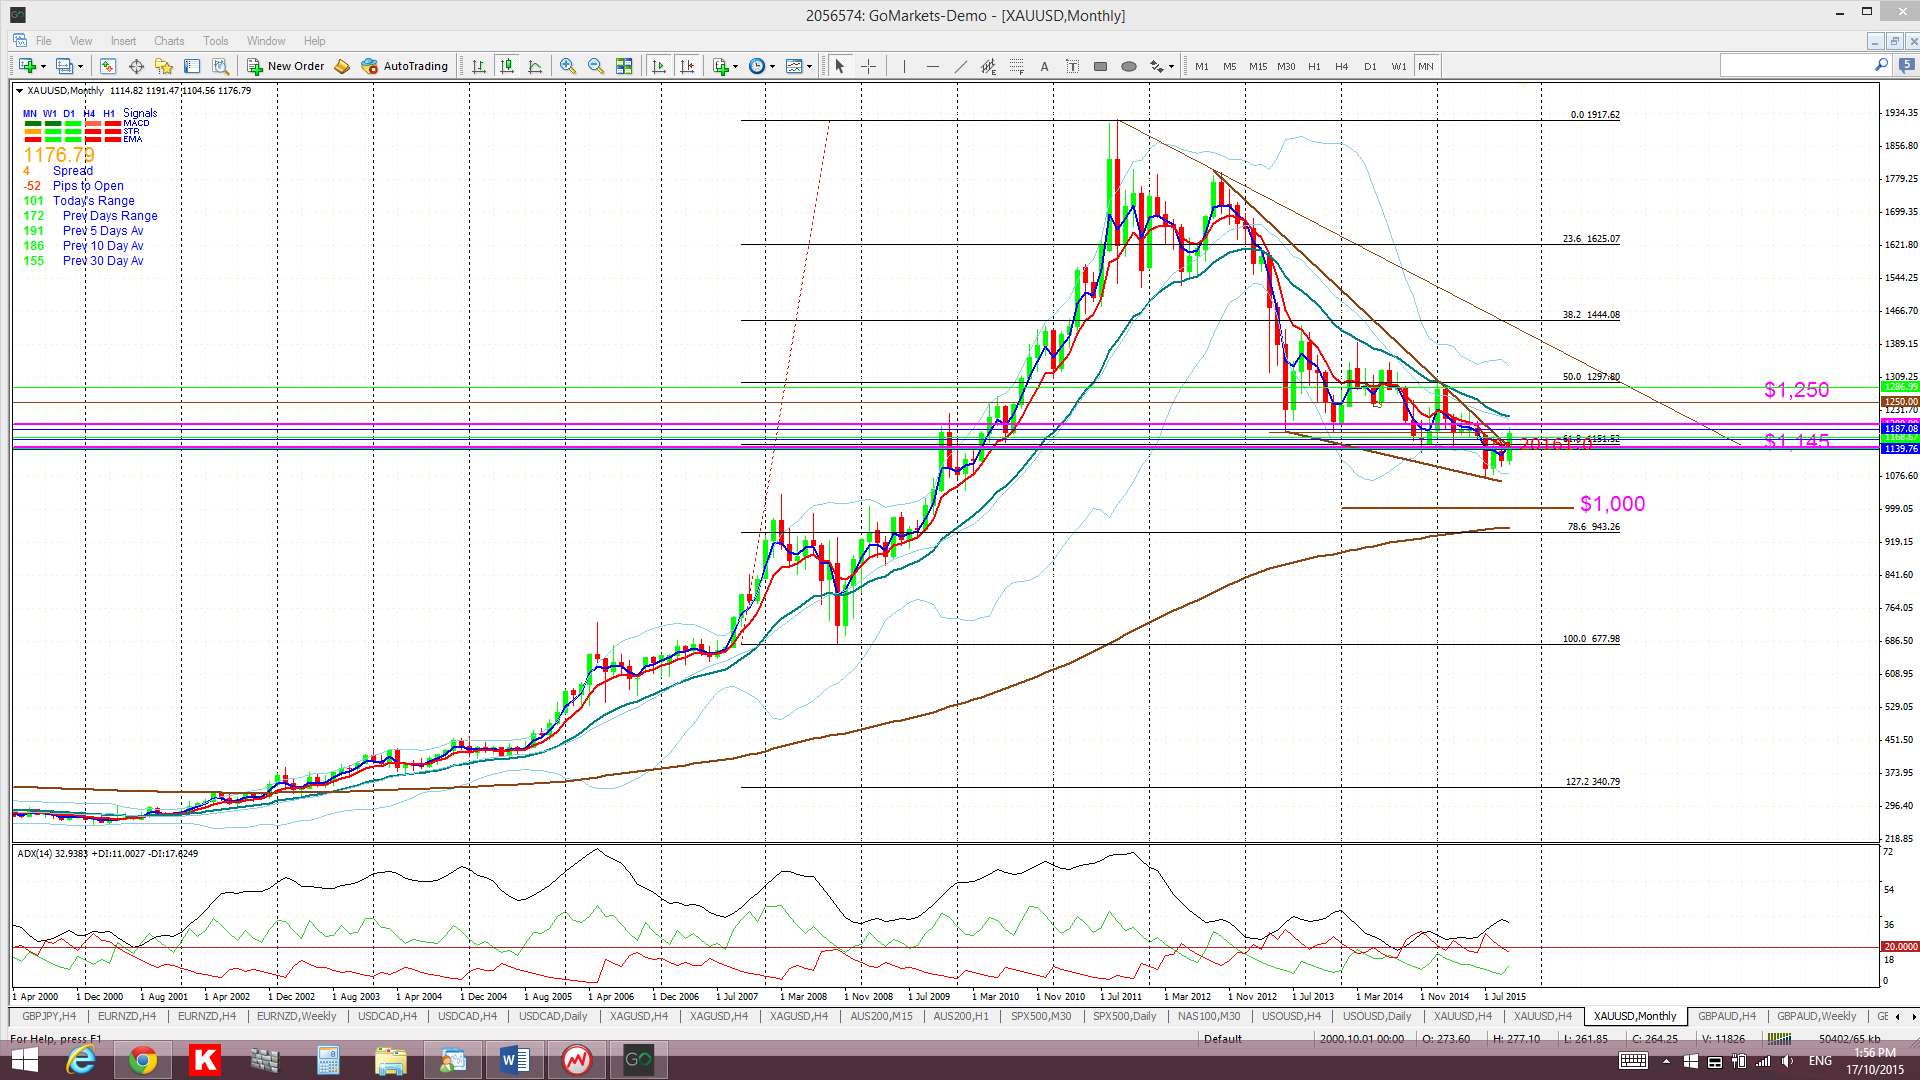
Bullish targets above current levels include the previous S/R levels of $1,200 and $1,250. After that there are the obvious whole-number psychological levels and the $1,400 level is also near the intersection of a monthly trend line and 50% fib and might offer some resistance as well. The next major resistance level would be the 61.8% fib of the weekly swing low move that is near the whole number $1,500 level. Finally, the previous all time high area near $2,000 would be the next target.
Gold is trading above the Cloud on the 4hr & daily charts but below the Cloud on the weekly and monthly charts.
The weekly candle closed as a bullish candle.
- I’m watching for any new TC signal.
The post Markets: a bit of indecision evident. appeared first on www.forextell.com.