Last week: It’s been a great couple of weeks for trend trading and my TC signals. An E/J signal from 2 weeks ago eventually closed off after giving 280 pips and a more recent E/J signal gave 250 pips. Signals on the Kiwi and U/J from the previous week closed off after 290 and 140 pips respectively and a signal on the USD/CAD closed after 180 pips.
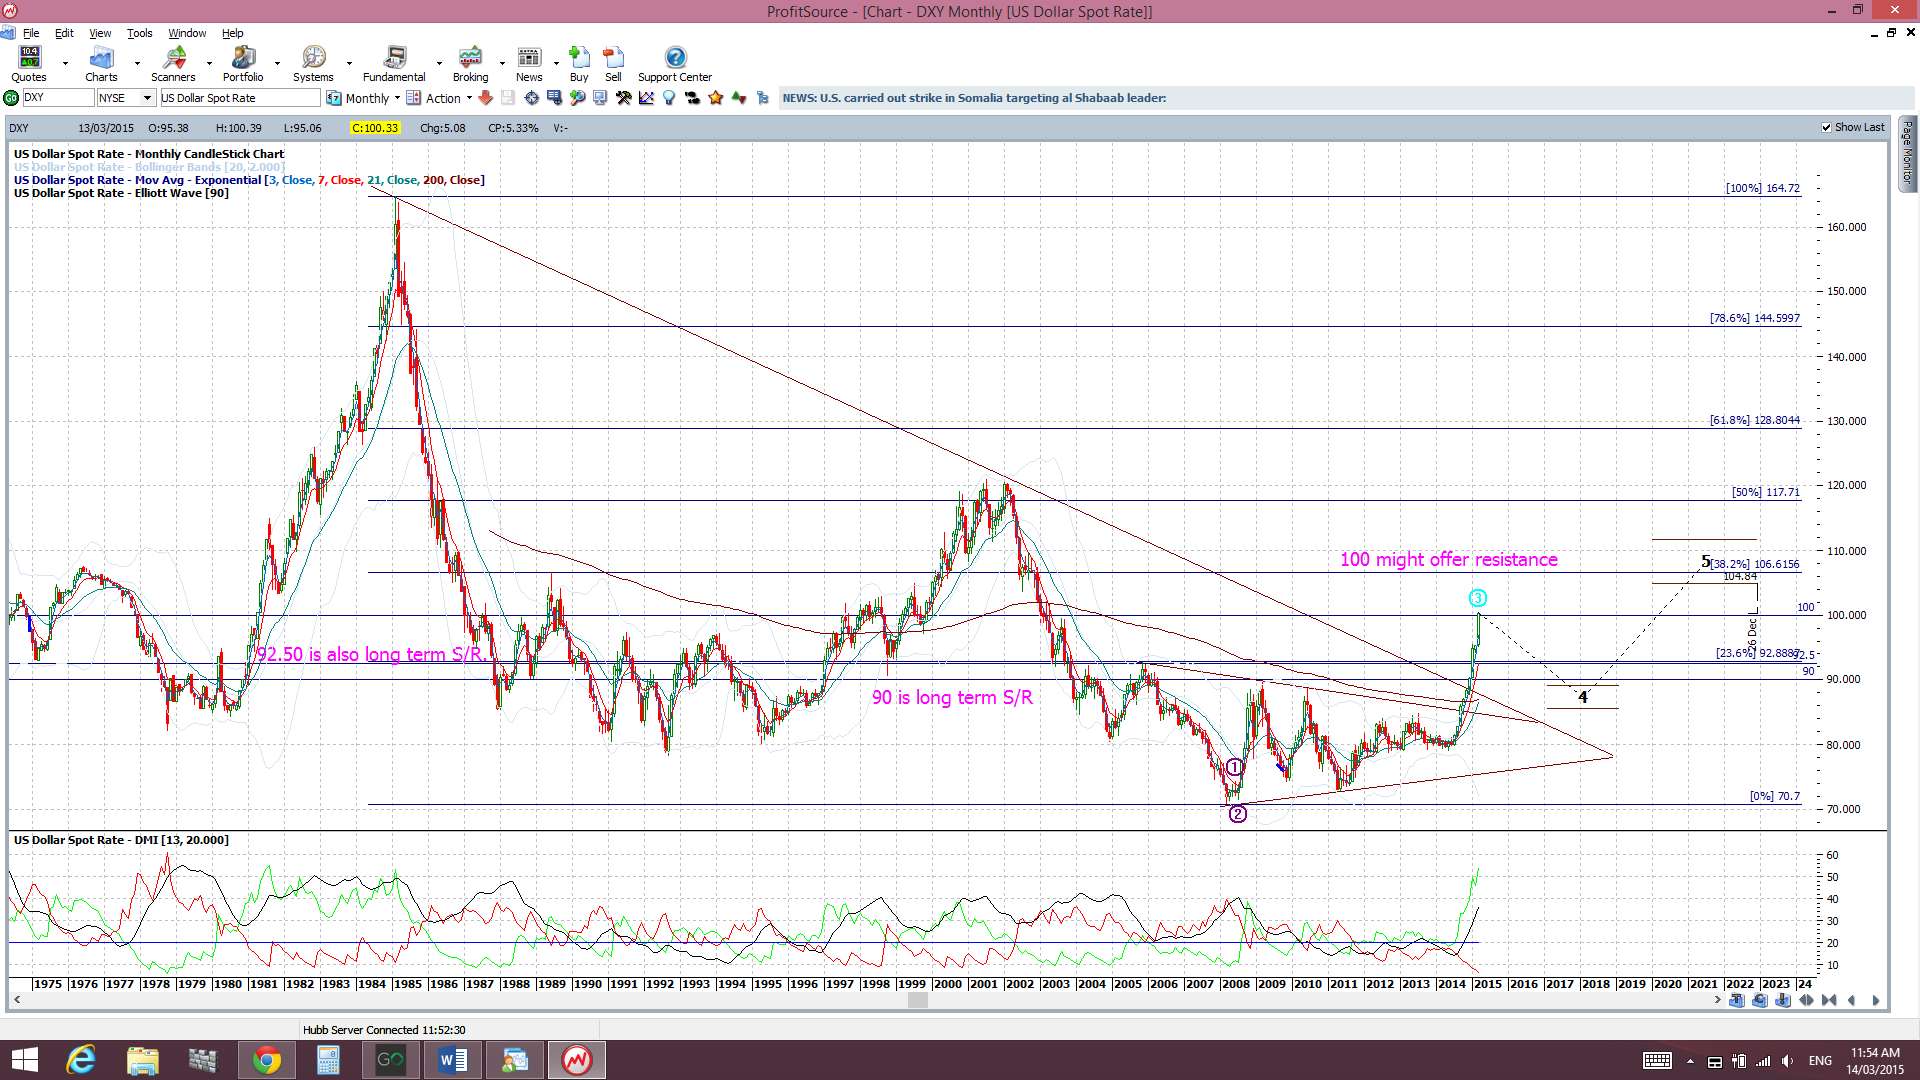
The USD and EUR indices have both continued on following their previous triangle breakouts. The US$ index has now rallied up through the psychological 100 resistance level, despite recent weaker US data. A review of the FX Indices can be found through the following link.
USD index monthly chart:
This week:
Wednesday’s FOMC is the main risk event in the coming week and the focus will be on whether the word ‘Patient’ is omitted from this announcement. If so, expect the US$ rally to continue but if not, and there is any dovish tone, then this rally could exhaust itself and the index may experience a pull back, even if only temporarily. I would not be surprised if all markets are rather choppy in the lead up to FOMC but this news event has the potential to set up the next big wave of directional trends on many instruments; FX, stocks and commodities. I will be more interested in new trend TC signals AFTER FOMC.
Keep an eye on the BoJ Monetary Policy release this week as this will likely impact Yen pairs.
GBP/USD: any hold below 1.50 supports a major Bear Flag on the weekly chart.
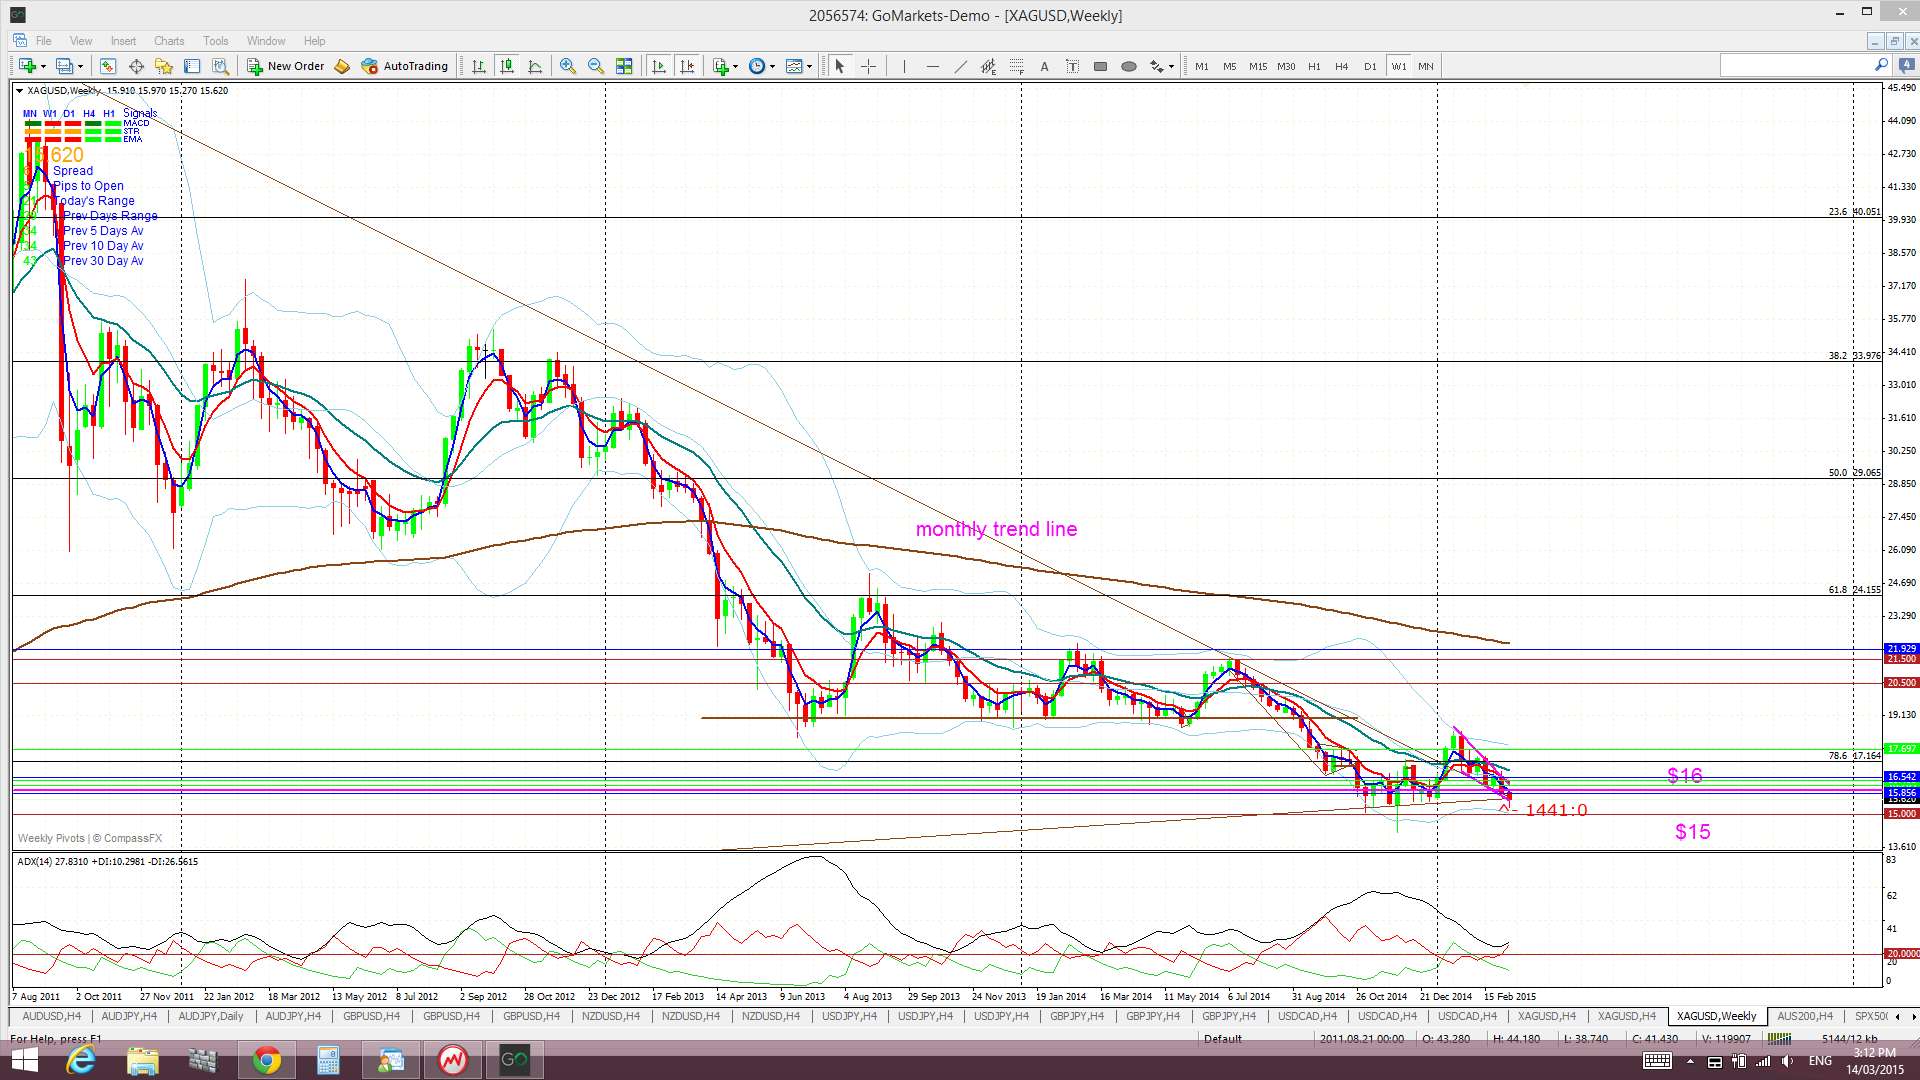
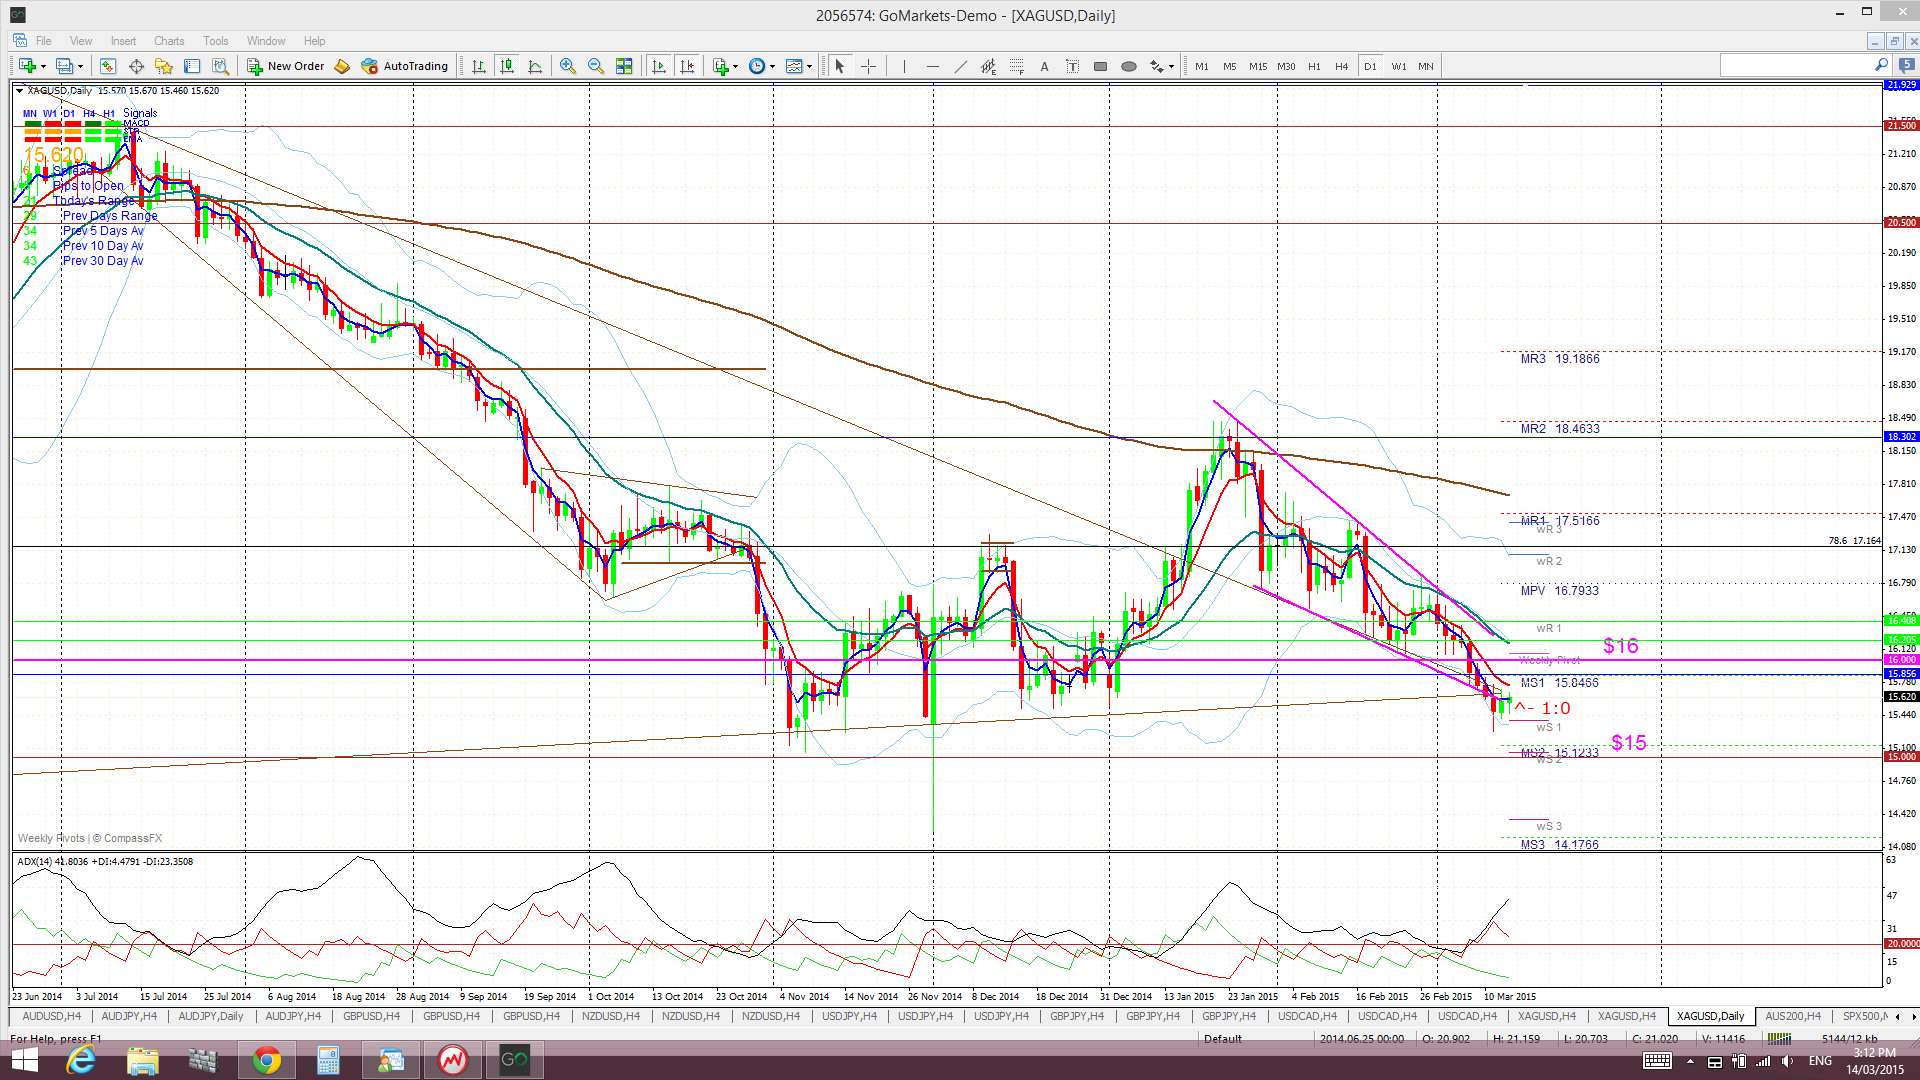
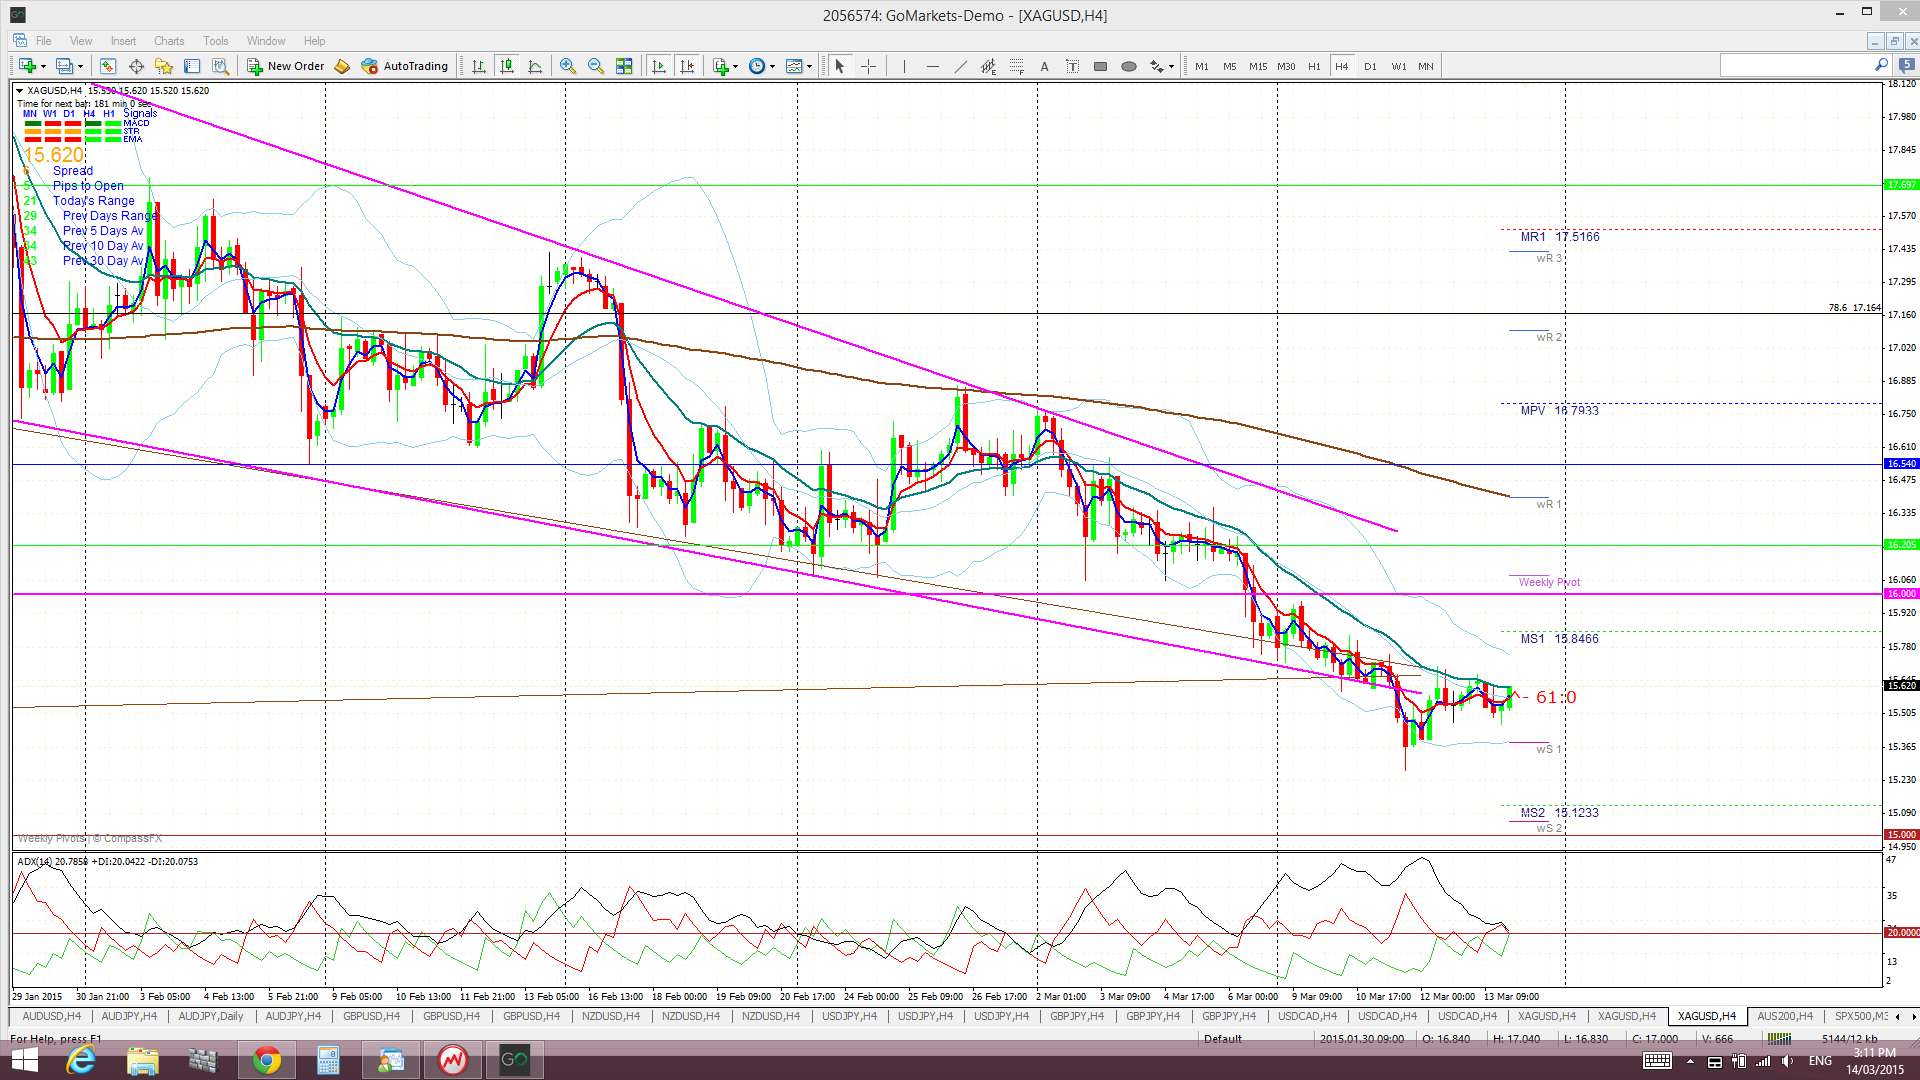
Silver and Gold: both metals are back down trading near major support levels and this week’s FOMC might determine whether these levels hold. A strengthening US$ will put pressure on these two but any new US$ weakness could allow them to bounce up off this support.
Events in the Ukraine and the Middle East, as well as with Greek Debt talks, continue to have the potential to undermine any developing ‘risk’ appetite and need to be monitored.
Stocks and broader market sentiment:
The major US indices, S&P500, DJIA and NASDAQ, all printed bearish weekly candles but it is worth noting that the small-caps, ‘Canary in the Coal mine’, Russell 2000 index printed a bullish weekly candle, albeit a small one. However, this small bullish candle actually carries a fair bit of psychological clout!
I have stated on a number of occasions that I am looking for the NASDAQ to pullback to test its triangle breakout region of 4,800 before any possible bullish continuation and price is still above this level:

Any break and hold on the NASDAQ back below 4,800 could be a short-term game changer though and, if that evolves, I’ll be watching for the S&P500 to pullback to test its daily and monthly support trend lines and then the triangle breakout region of 1,600. The S&P500 did pullback to 61.8% Fib support during the week but ‘Technicals’ may give way this week as the focus shifts to watching ‘Fundamentals’ and the impact of FOMC.
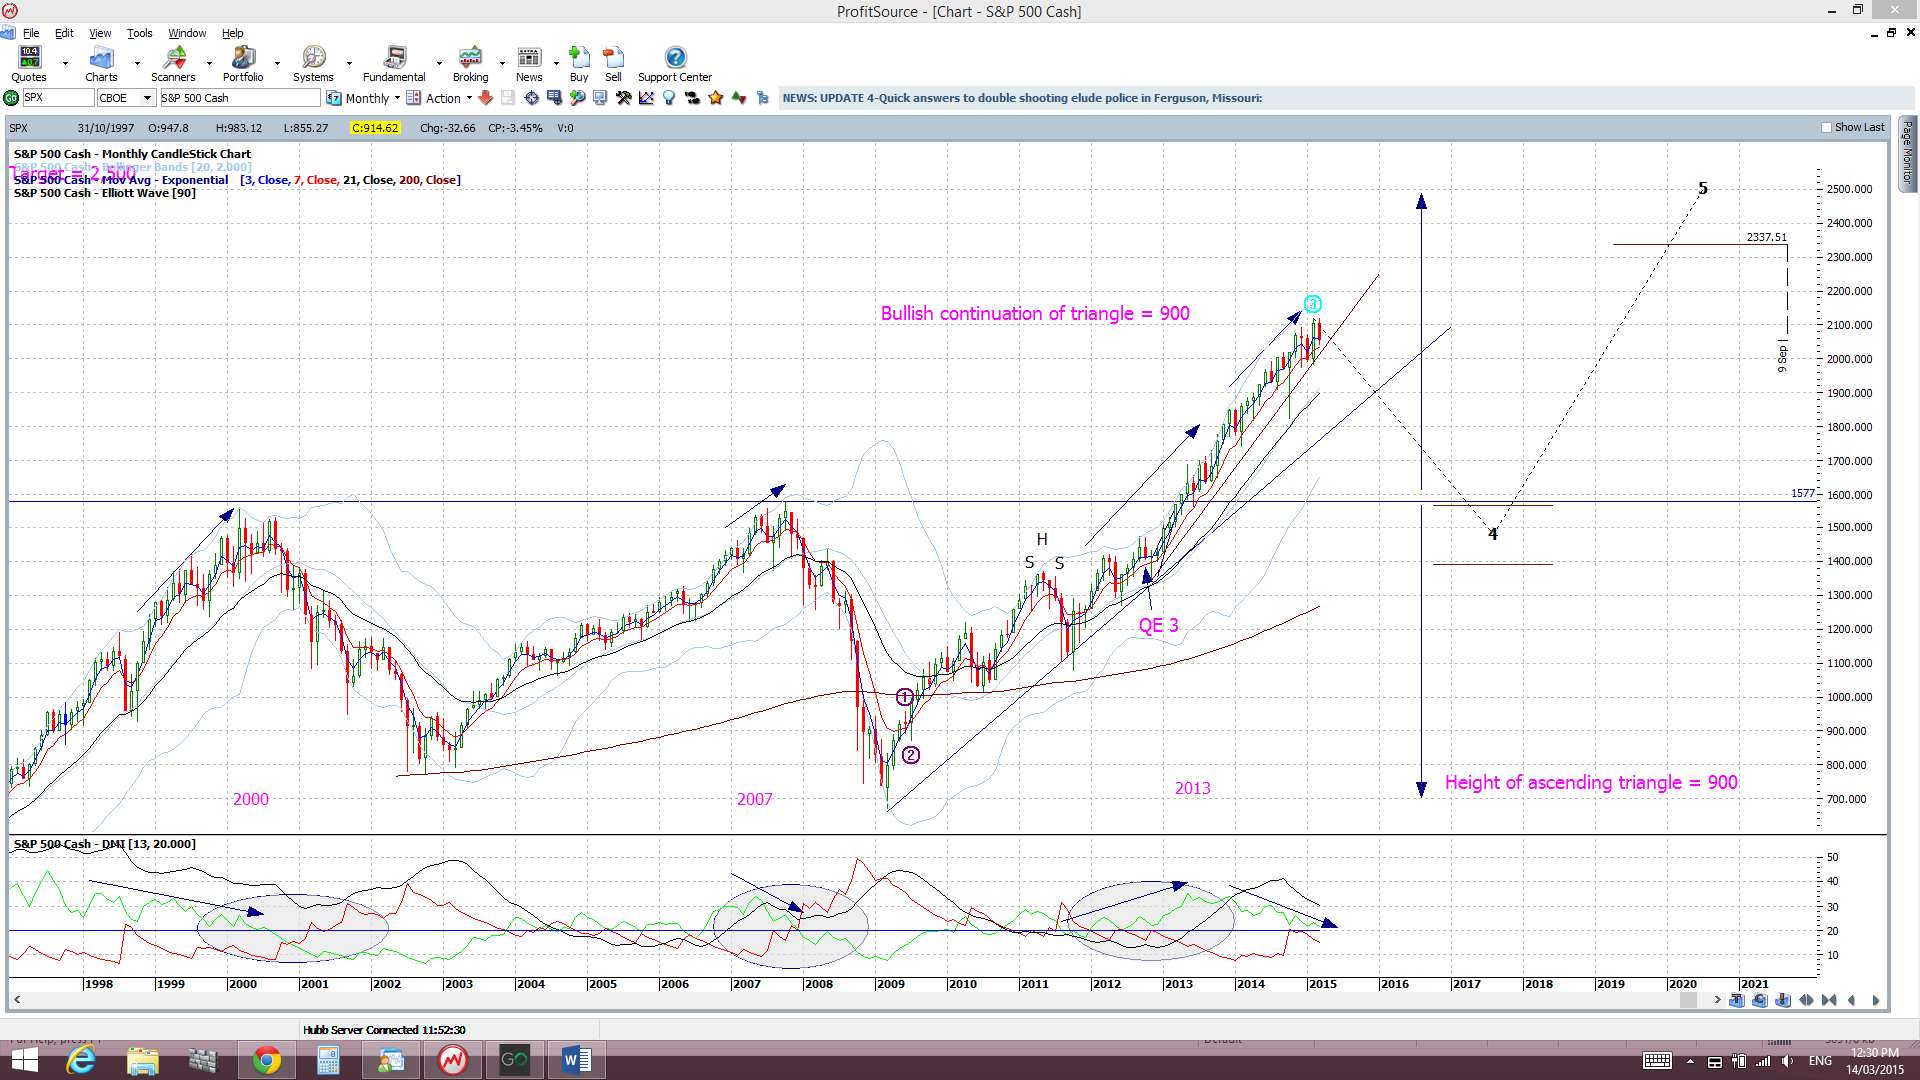
The S&P500 is still navigating new highs above 2000 but the chance of a deeper pullback cannot be ruled out. There has not been any real deep pull back since the break up through the 1,577, 1,600, 1,700 and 1,800 levels and the major break of the 1,577 level was only tested once.
Thus, with all of this, I continue to watch out for further clues as to any new momentum move, long or short though! In particular I’m looking out for:
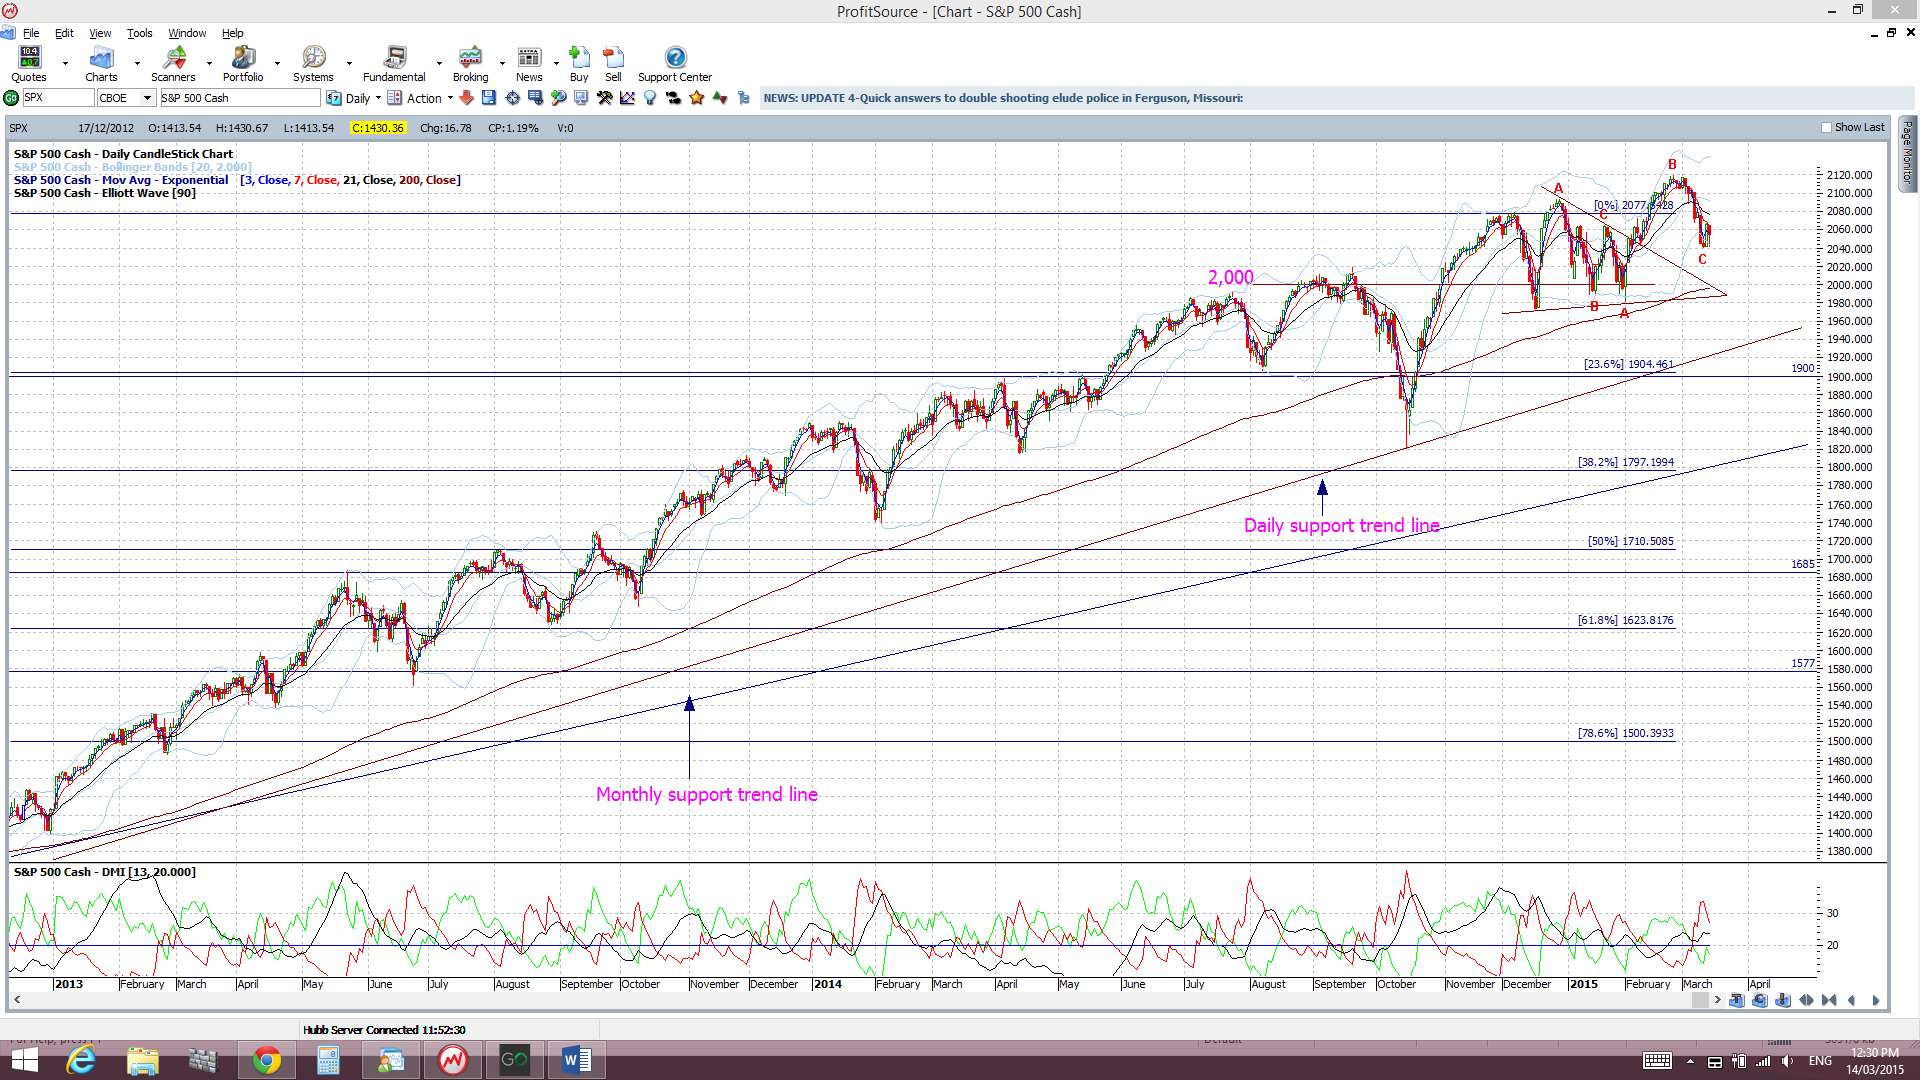
S&P500 daily chart: The index is still trading above the psychological 2,000 level and above the daily trend line. The close above 2,050 is noteworthy too:
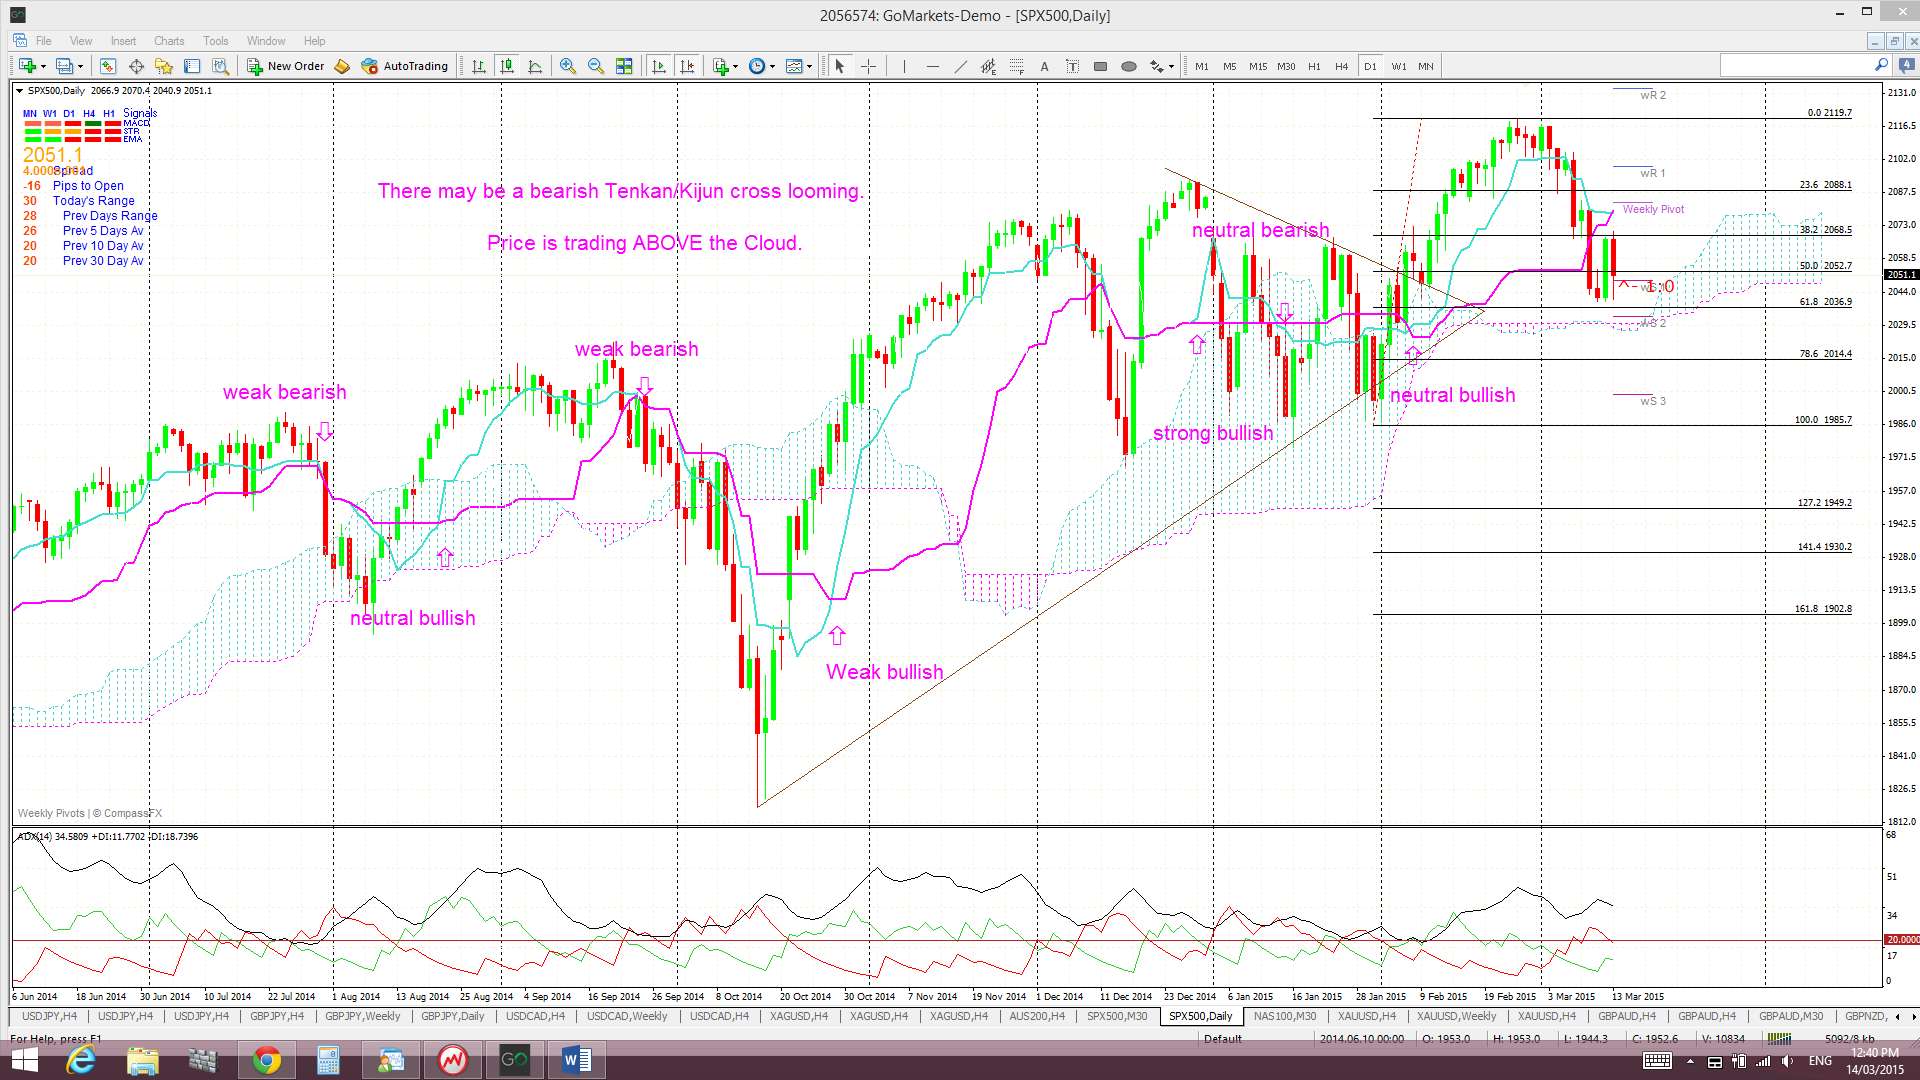
Ichimoku S&P500 chart: a clear cross of the blue Tenkan-sen line below the pink Kijun-sen line. There may be a bearish Tenkan/Kijun crossover signal building here but, for now, the index is still trading above the Cloud.
S&P500 monthly chart: a break of the monthly support trend line. The monthly trend line remains intact. A break of this support level would suggest to me of a more severe pull back or correction.
Russell 2000 Index: this small caps index is a bit of a US market ‘bellwether’ and has closed back above the key 1,220 level and printed a bullish weekly candle, albeit a smallish one.

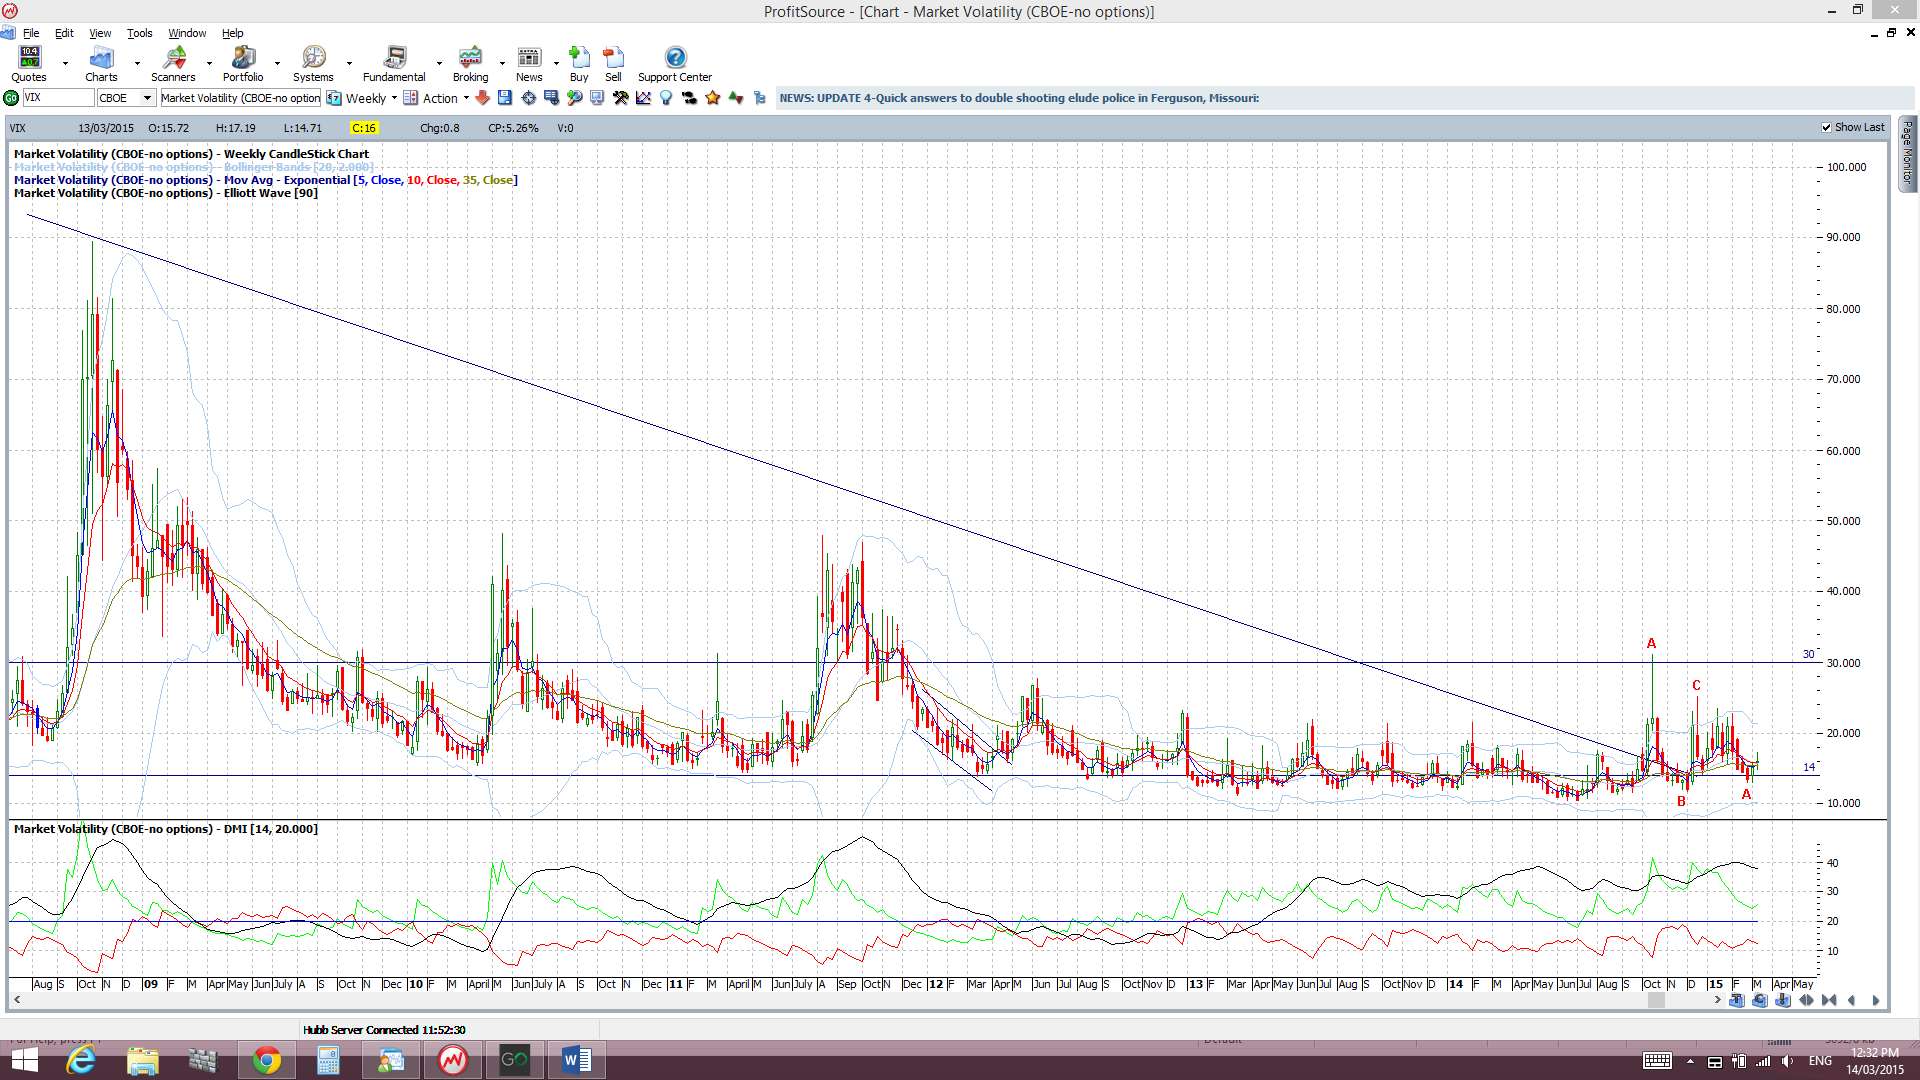
VIX Index: The ‘Fear’ index printed a small bullish ‘Spinning Top’ candle and is still trading below 20, despite the bearish week for stocks.
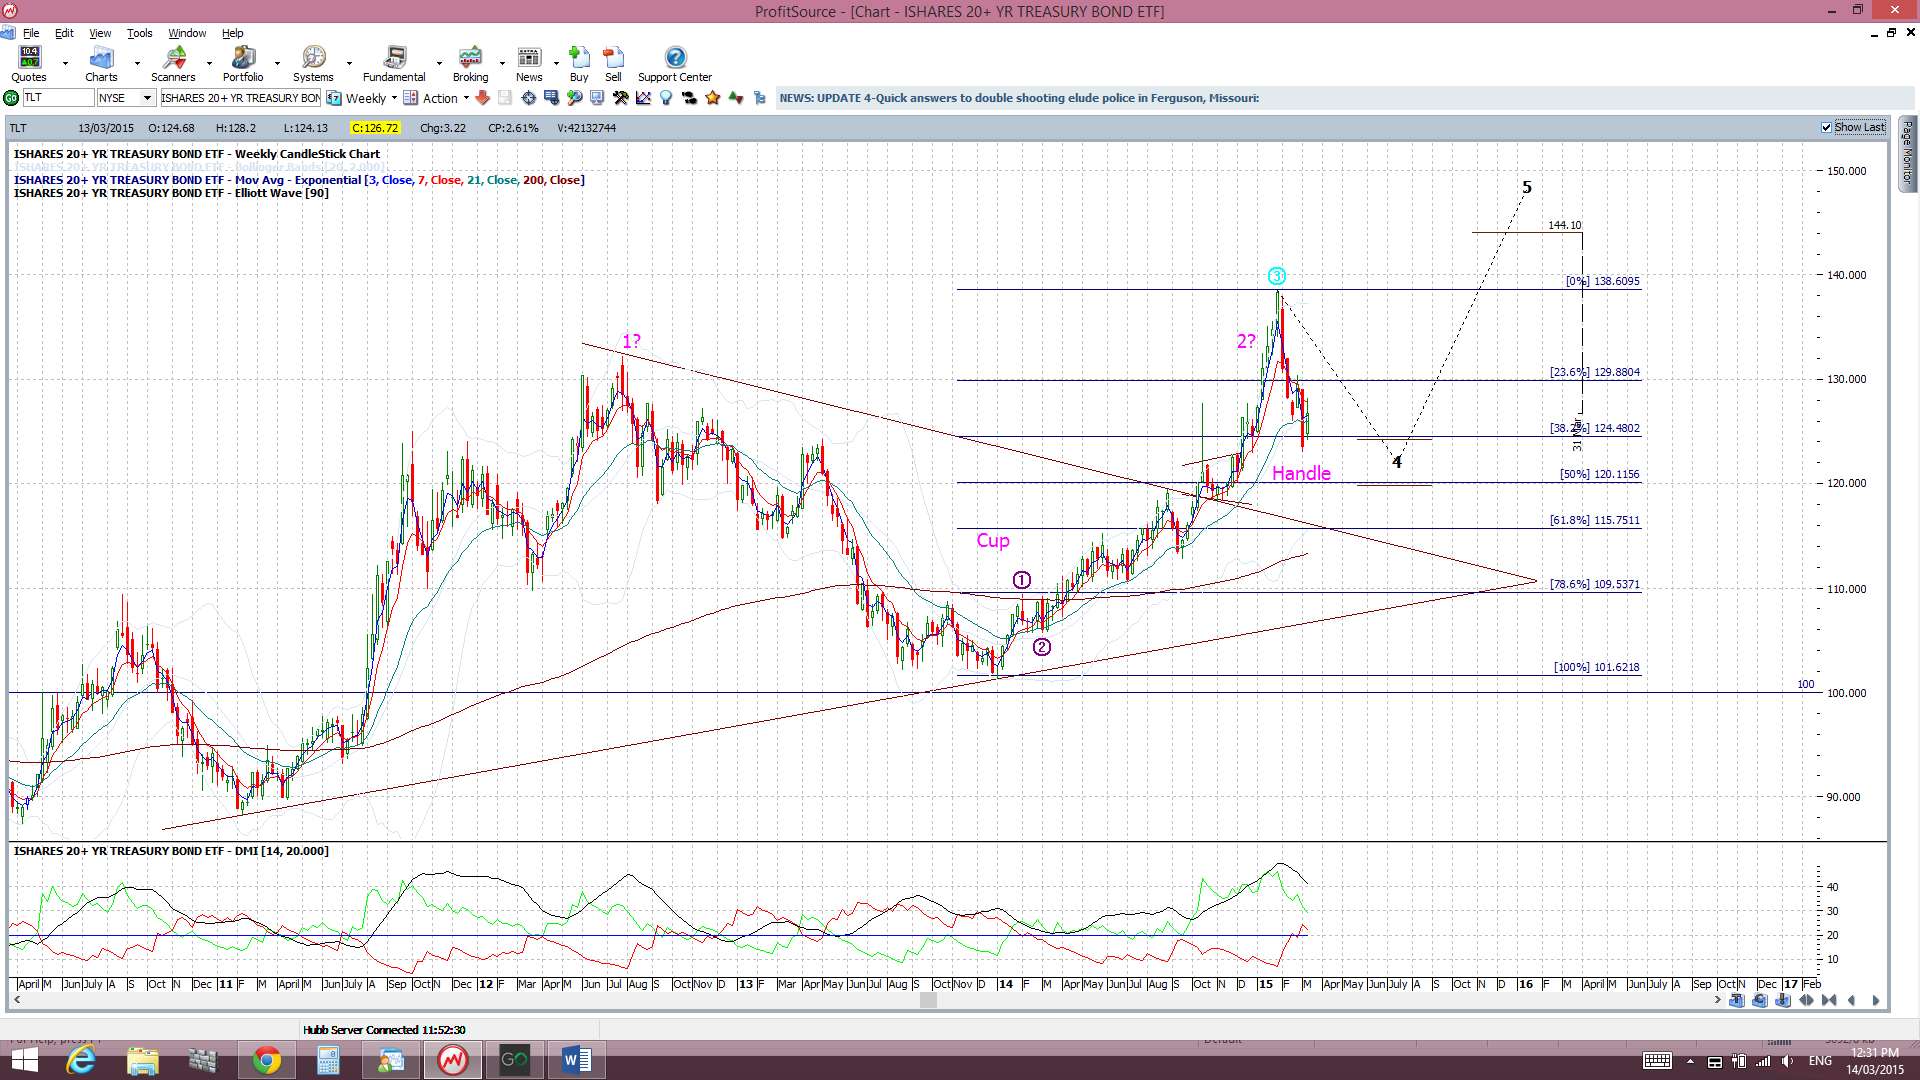
Bonds: The bond ETF has printed an indecision-style ‘Inside’ candle ahead of next week’s FOMC announcement.
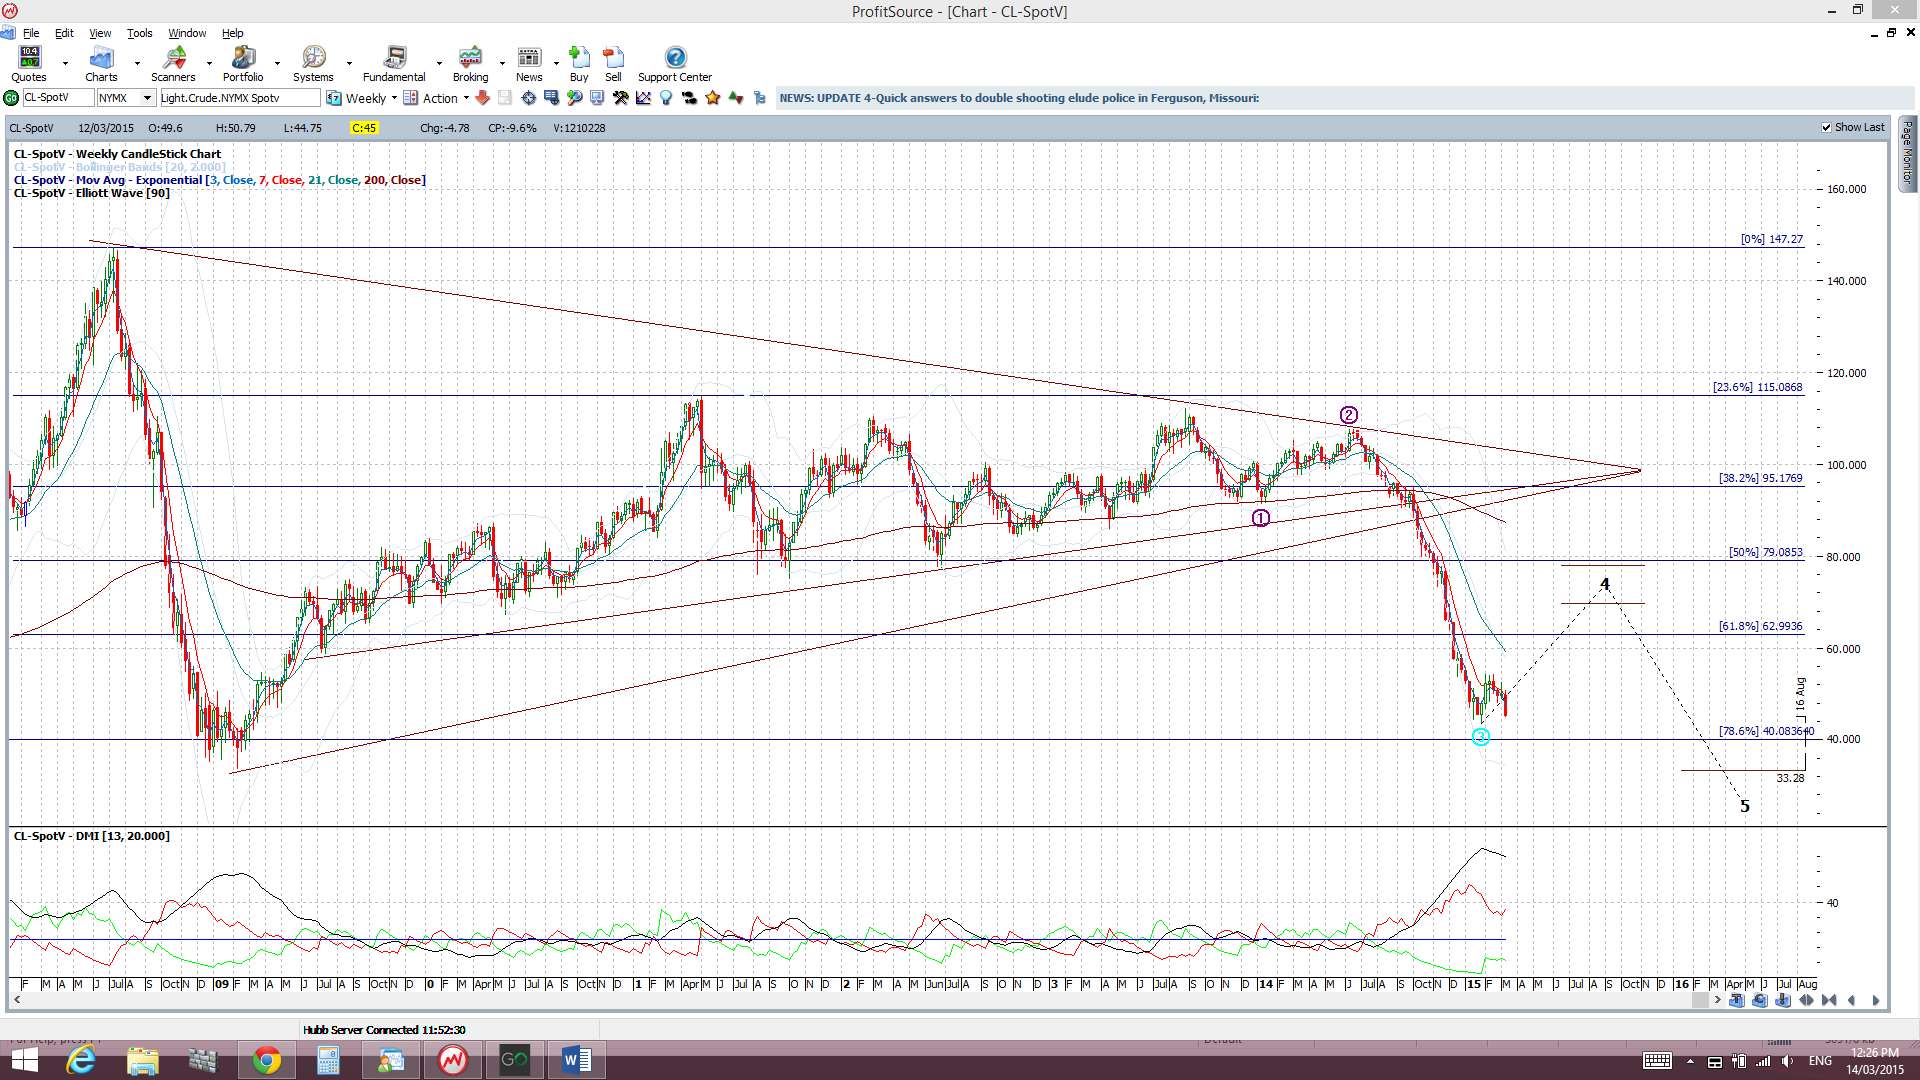
Oil: Oil suffered a bearish week and it still seems destined to head to test the $40 level.
Trading Calendar Items to watch out for:
- Mon 16th: EUR ECB President Draghi speaks.
- Tue 17th: AUD RBA Monetary Policy Minutes. JPY Monetary Policy Statement & Press Conference. EUR German ZEW Economic Sentiment. CAD Manufacturing Sales. USD Building Permits. NZD GDT Price Index.
- Wed 18th: GBP Employment data, Bank Rate Votes & Annual Budget. CAD Wholesale Sales. USD FOMC & Press Conference.
- Thurs 19th: NZD GDP. CHF Libor Rate, SNB Monetary Policy Assessment and SNB Chairman Jordan speaks. EUR Targeted LTRO. USD Unemployment Claims and Philly Fed Manufacturing Index. EUR Day 1: EU Economic Summit.
- Fri 20th: AUD RBA Gov Stevens speaks. CAD Core CPI & Retail Sales. EUR Day 2: EU Economic Summit.
Forex:
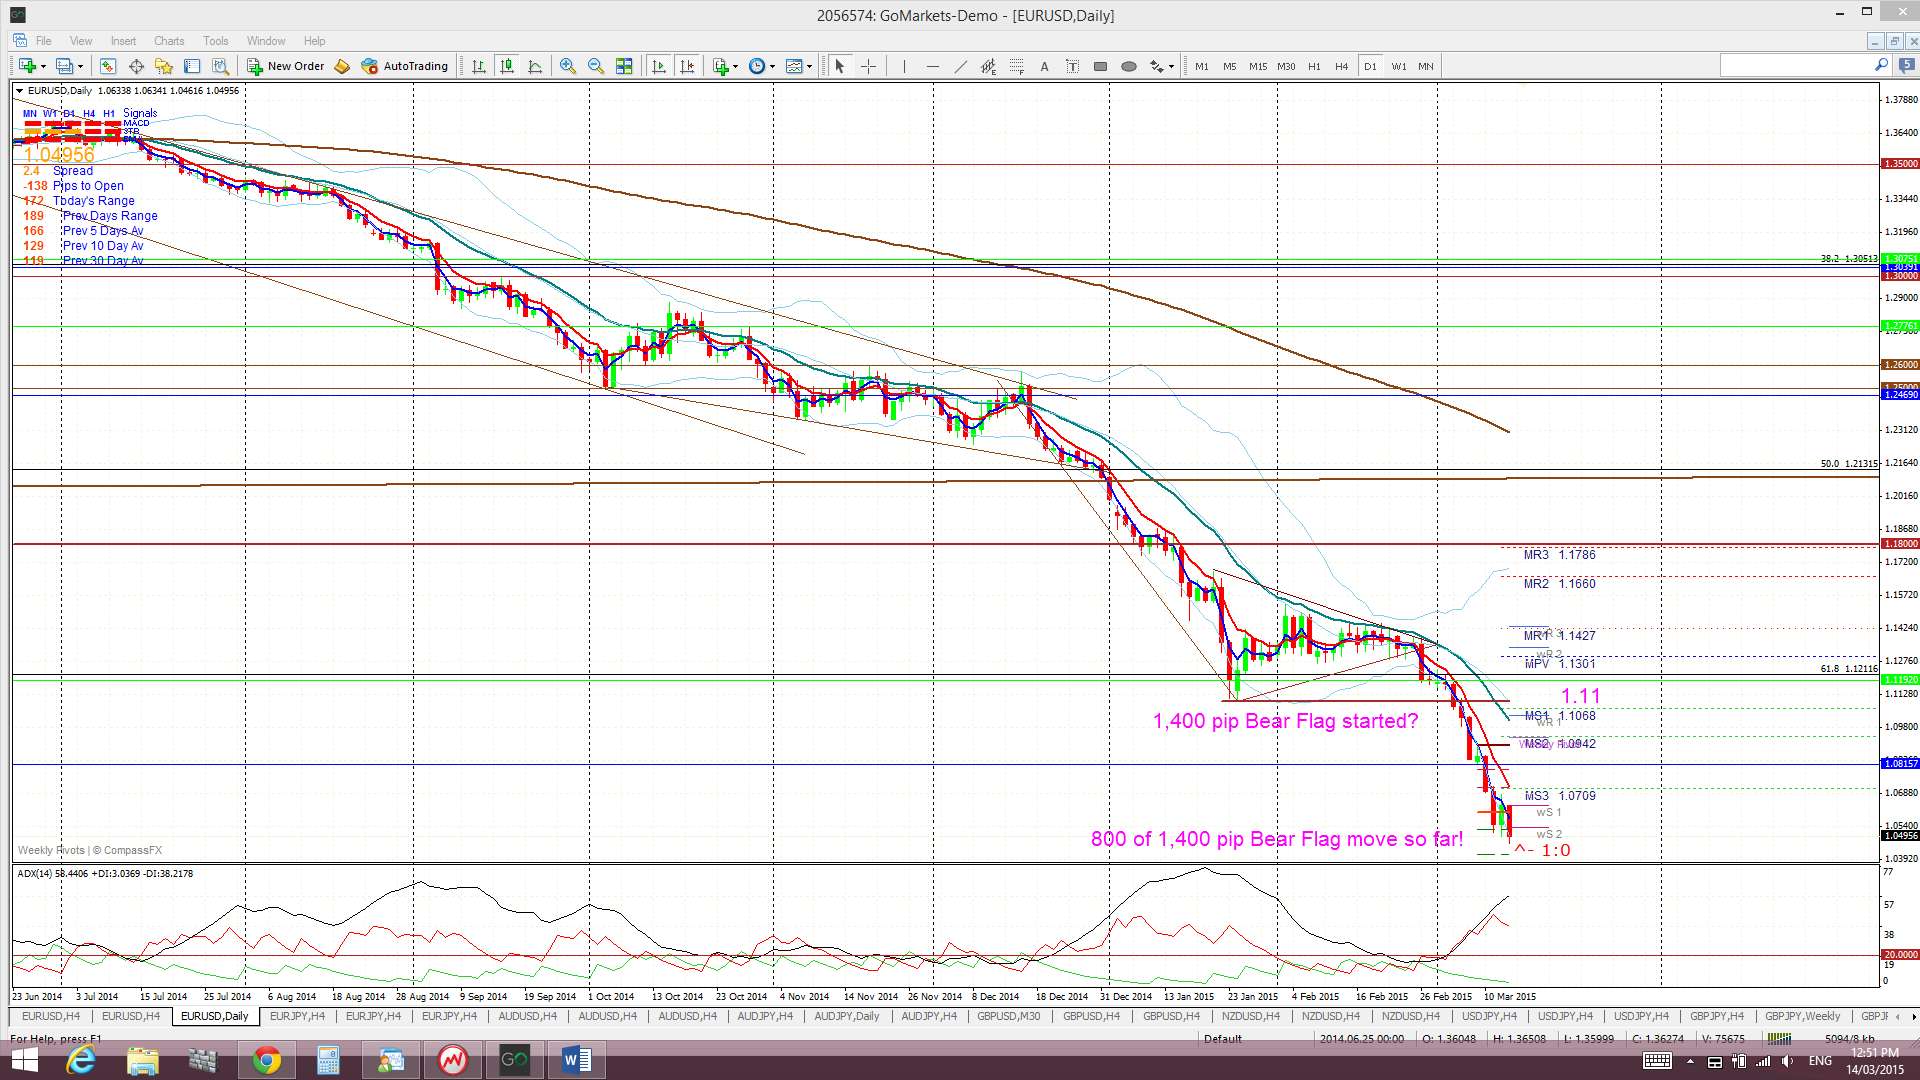
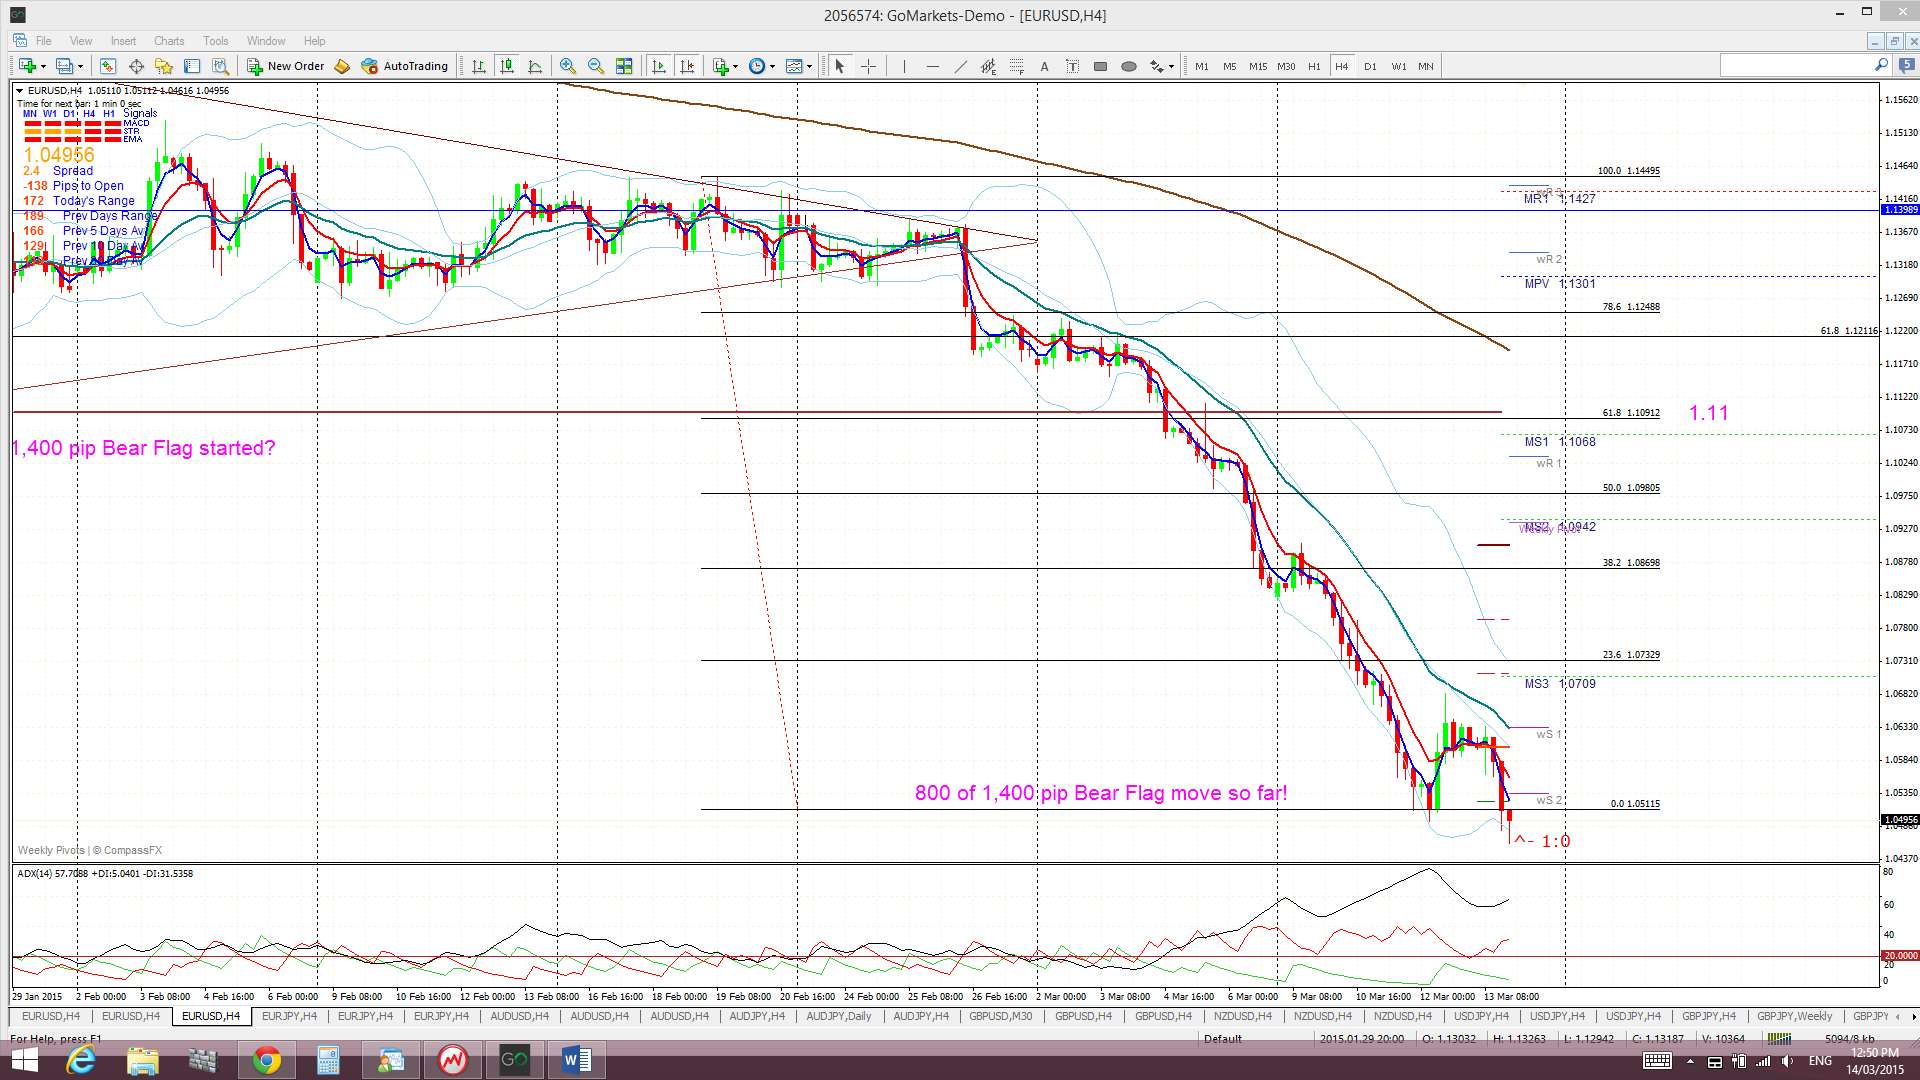
E/U: The E/U continued lower following last week’s break below 1.11 potential ‘Double Bottom’ support. There was a brief reprieve on Thursday but this evaporated with renewed US$ strength on Friday. This latest dip resulted in a weekly close below 1.05 and may trigger a new TC signal BUT I’m wary ahead of Wednesday’s FOMC.
There are two bearish patterns currently in play on the E/U:
- a 1,400 pip Bear Flag on the daily chart and
- a 4,000 pip bearish descending triangle breakdown on the monthly chart.
Both of these patterns are outlined below.
Bear Flag on the daily chart: This ‘Bear Flag’ has already given 800 pips of a potential 1,400 pip move. The Flagpole of this Bear Flag is about 1,400 pips. This bearish move is a sub-set within the larger, monthly-chart descending triangle breakdown.
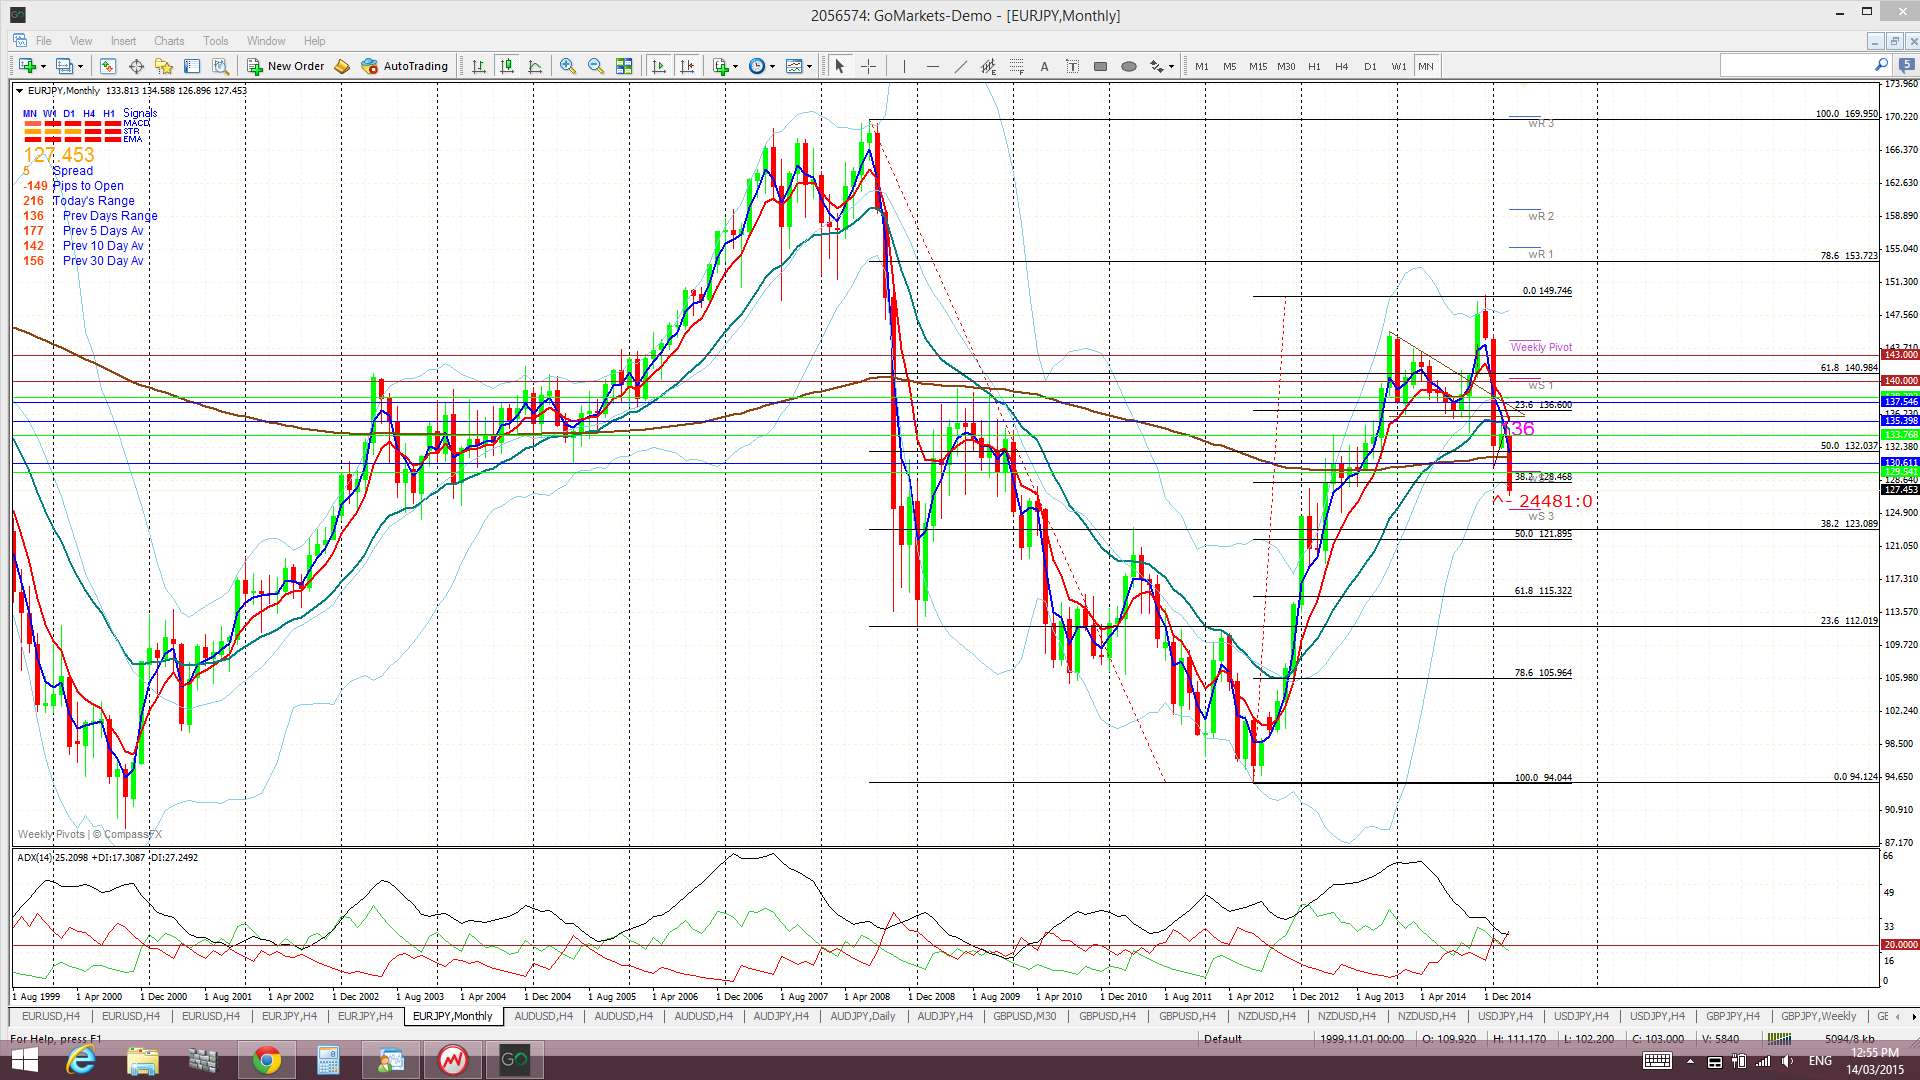
Descending triangle on the monthly chart: the descending triangle pattern is a bearish continuation pattern and has a base at around the 1.18 level. The height of this triangle is about 4,000 pips. Technical theory would suggest that any bearish breakdown of this triangle below 1.18 might see a similar move. It is worth noting that this would bring the E/U down near 0.80 and to levels not seen since 2000/2001! The monthly chart shows how critical this 1.18 level is for the E/U. The January and February monthly candles closed below this key level but another test of 1.18 is looking less likely but, with this week’s FOMC, expect the unexpected!
Price is still trading below the Ichimoku Cloud on the 4hr, daily, weekly and monthly charts which is bearish.
The weekly candle closed as another large bearish candle.
The main risk event for this pair is next Wednesday’s FOMC. Continued US$ strength would put more pressure on this pair.
When you look at the monthly chart it seems that the parity level, near the next Fib at 78.6%, seems like an obvious next stop.
- I’m watching for any new TC signal.


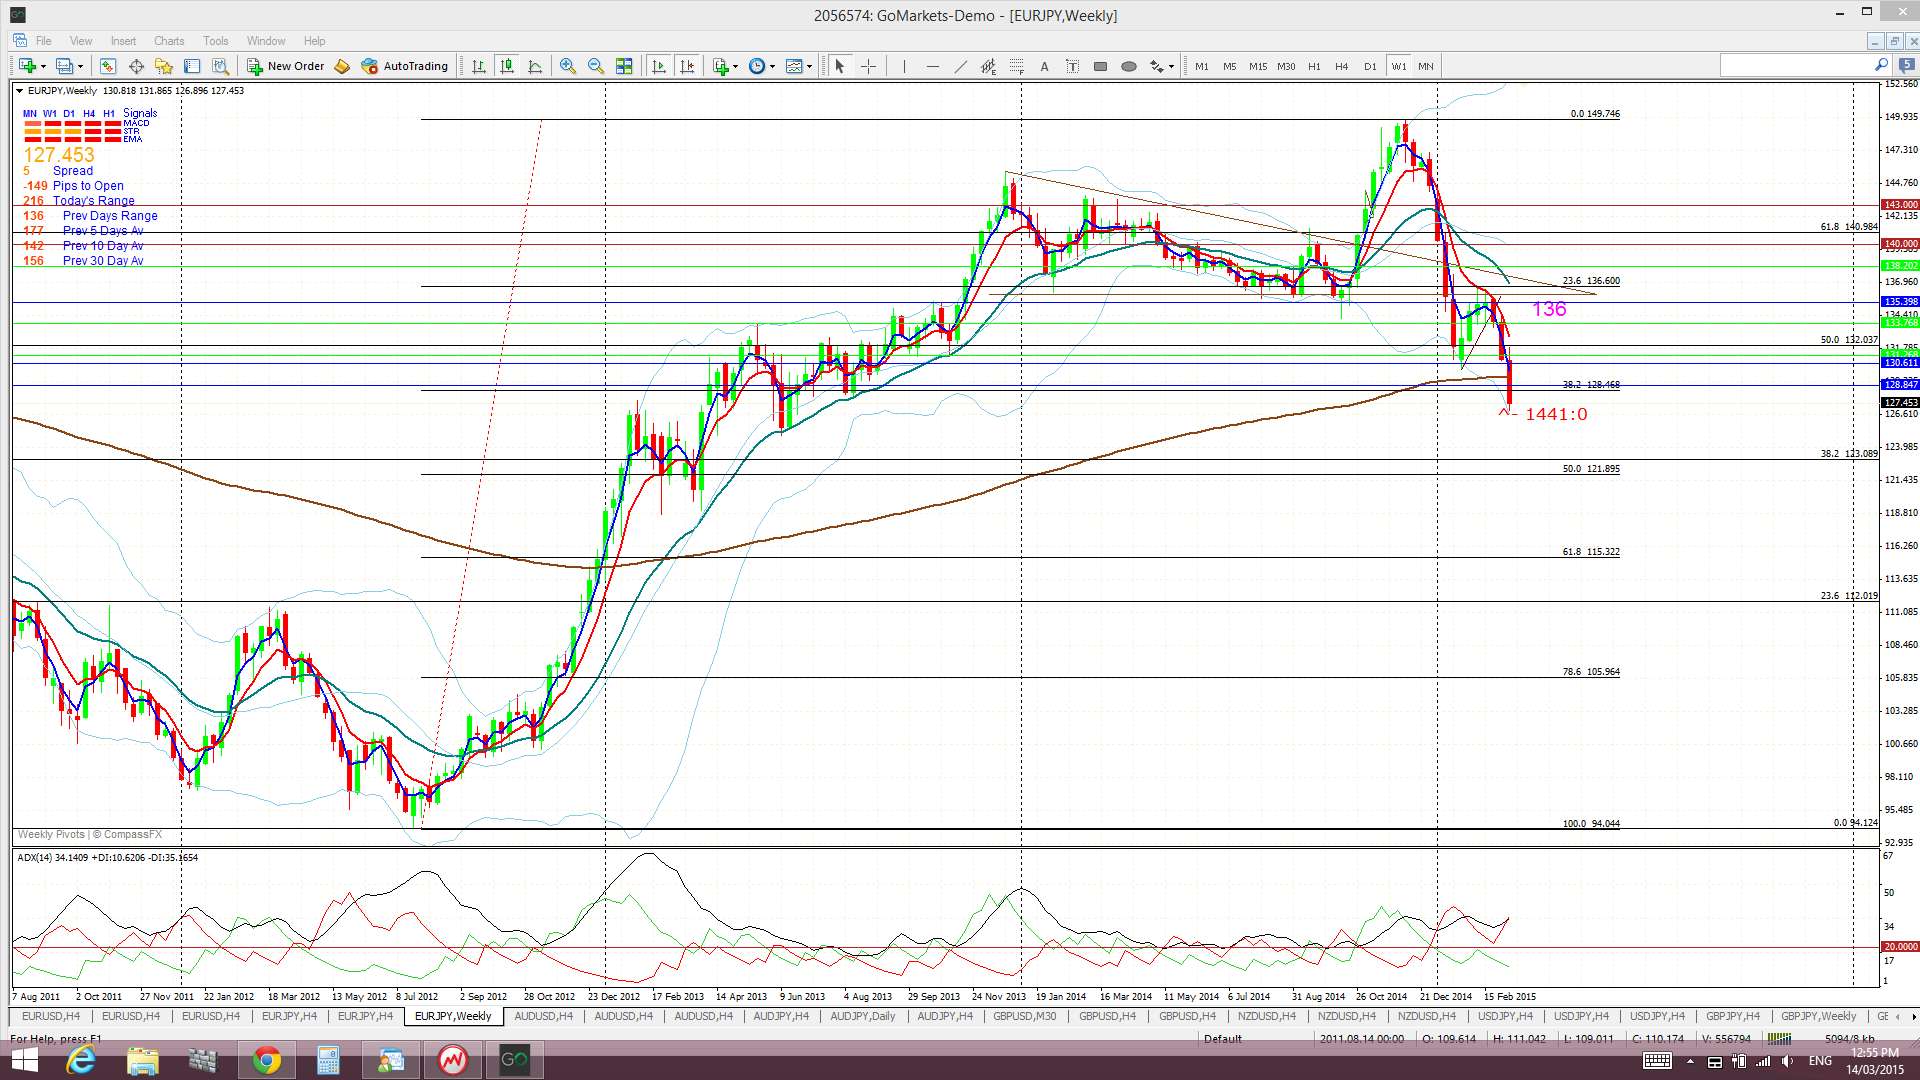
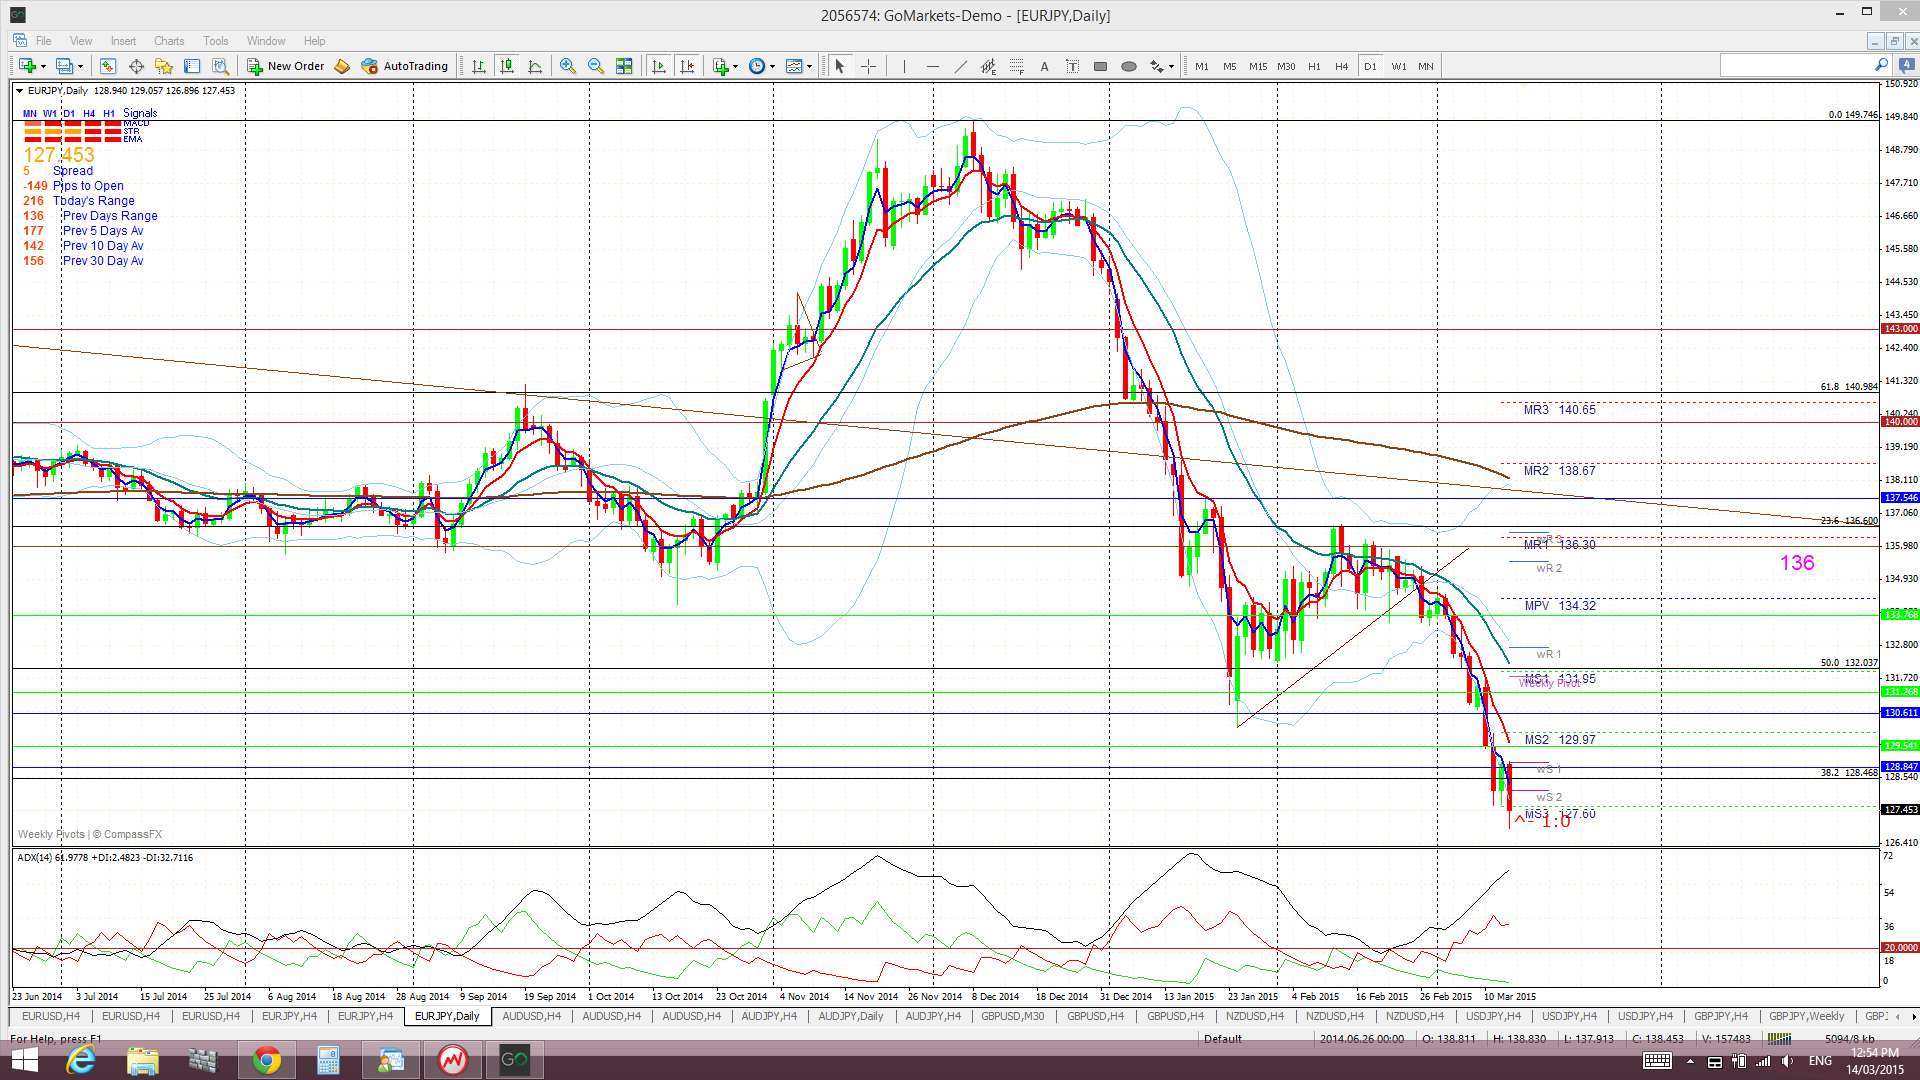
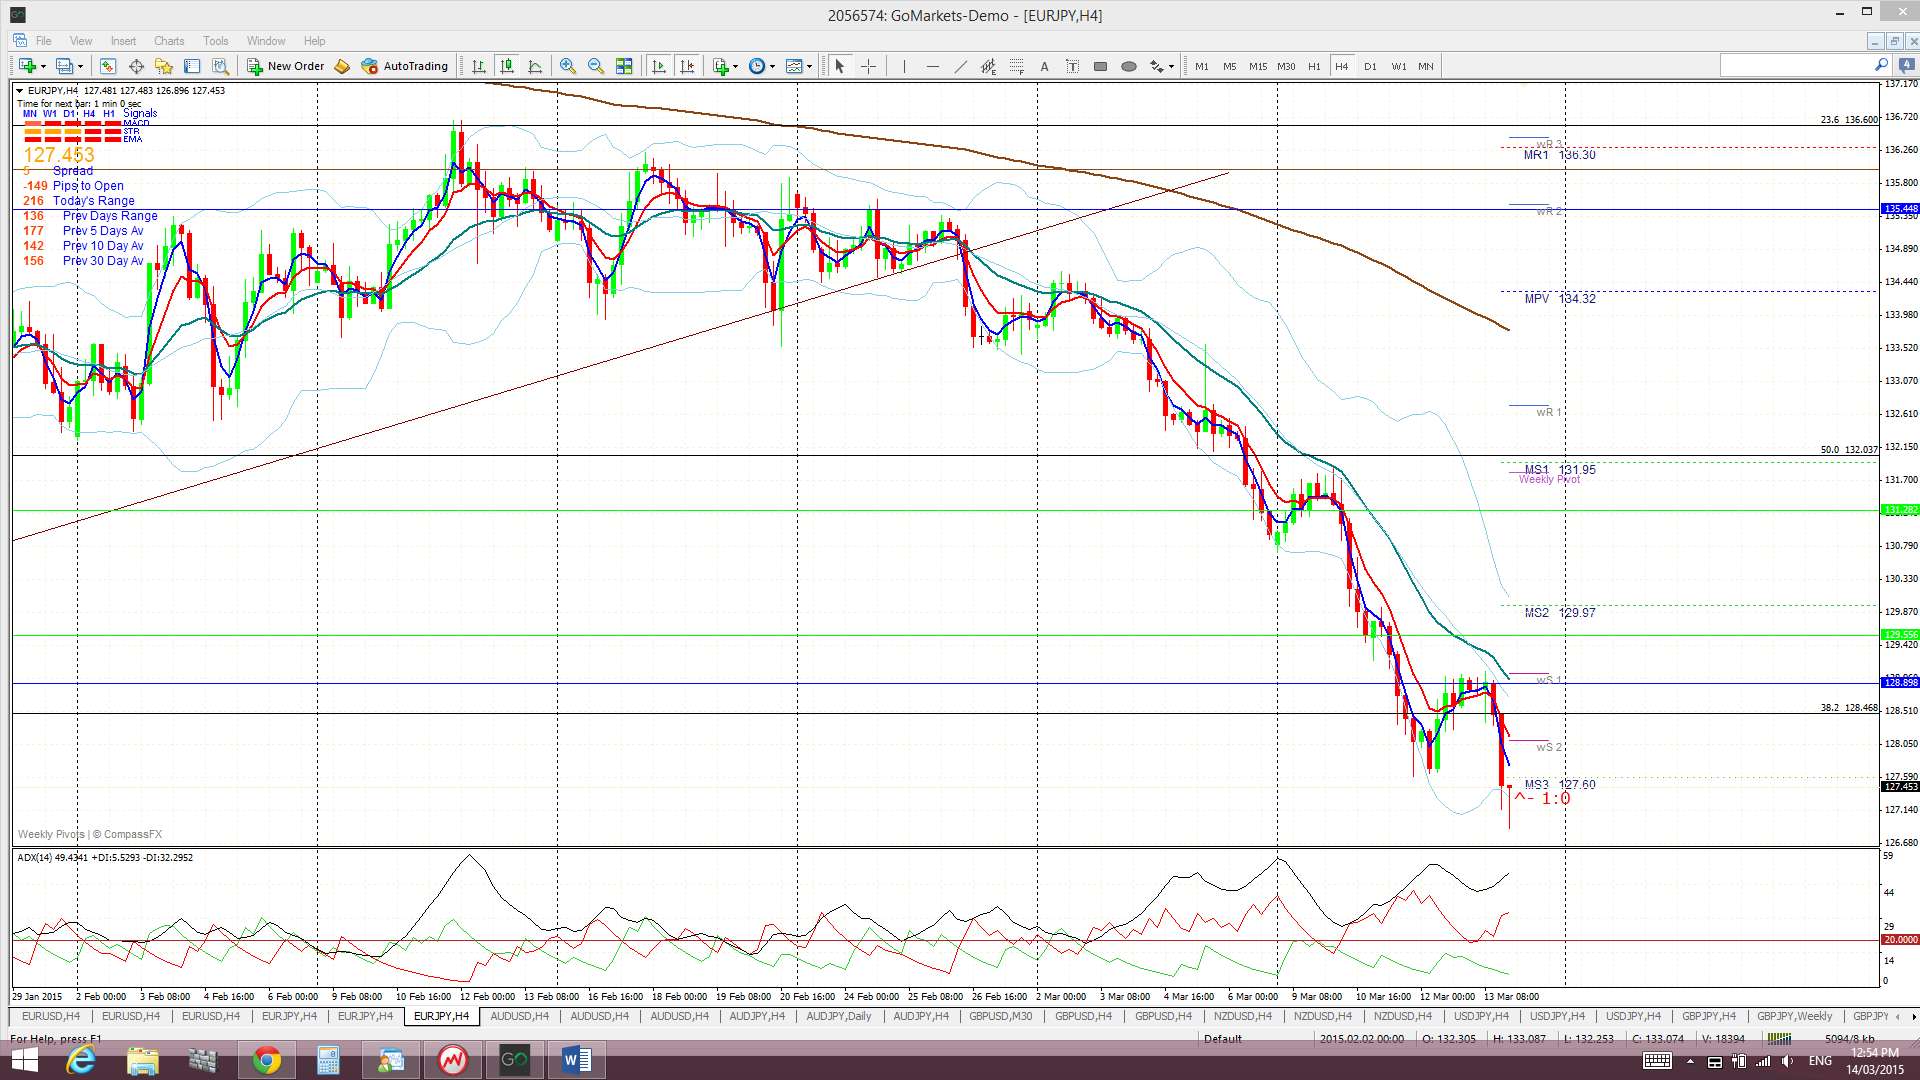
E/J: The E/J continued lower following the previous trend line break. As for the E/U, there was a brief reprieve on Thursday but this evaporated with renewed US$ strength on Friday. This latest dip may trigger a new TC signal here too BUT I’m wary ahead of Wednesday’s FOMC.
Price is still trading below the Cloud on the 4hr, daily and weekly charts but above on the monthly chart.
The weekly candle closed as another large bearish candle.
Risk events here include the BoJ monetary policy statement as well as any flows from FOMC.
- I’m watching for any new TC signal on this pair and Fib levels on the weekly and monthly charts.
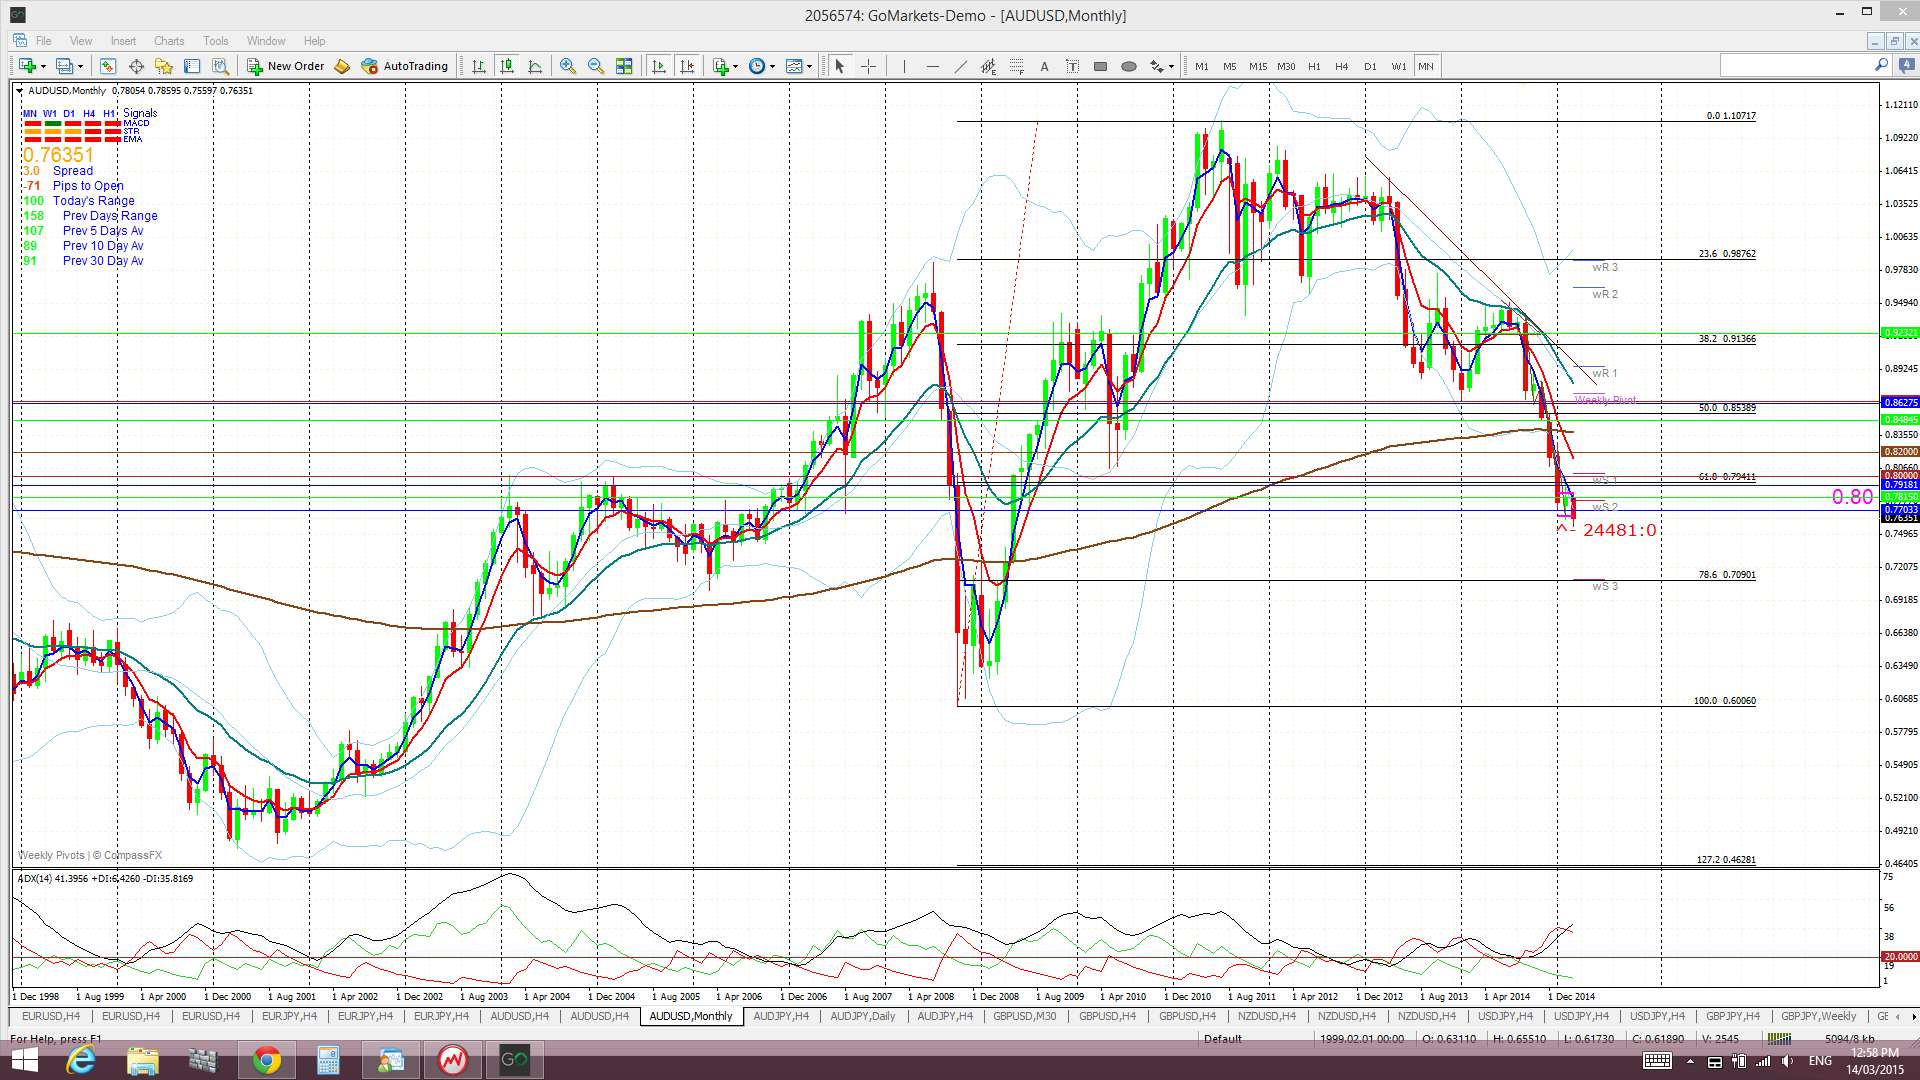
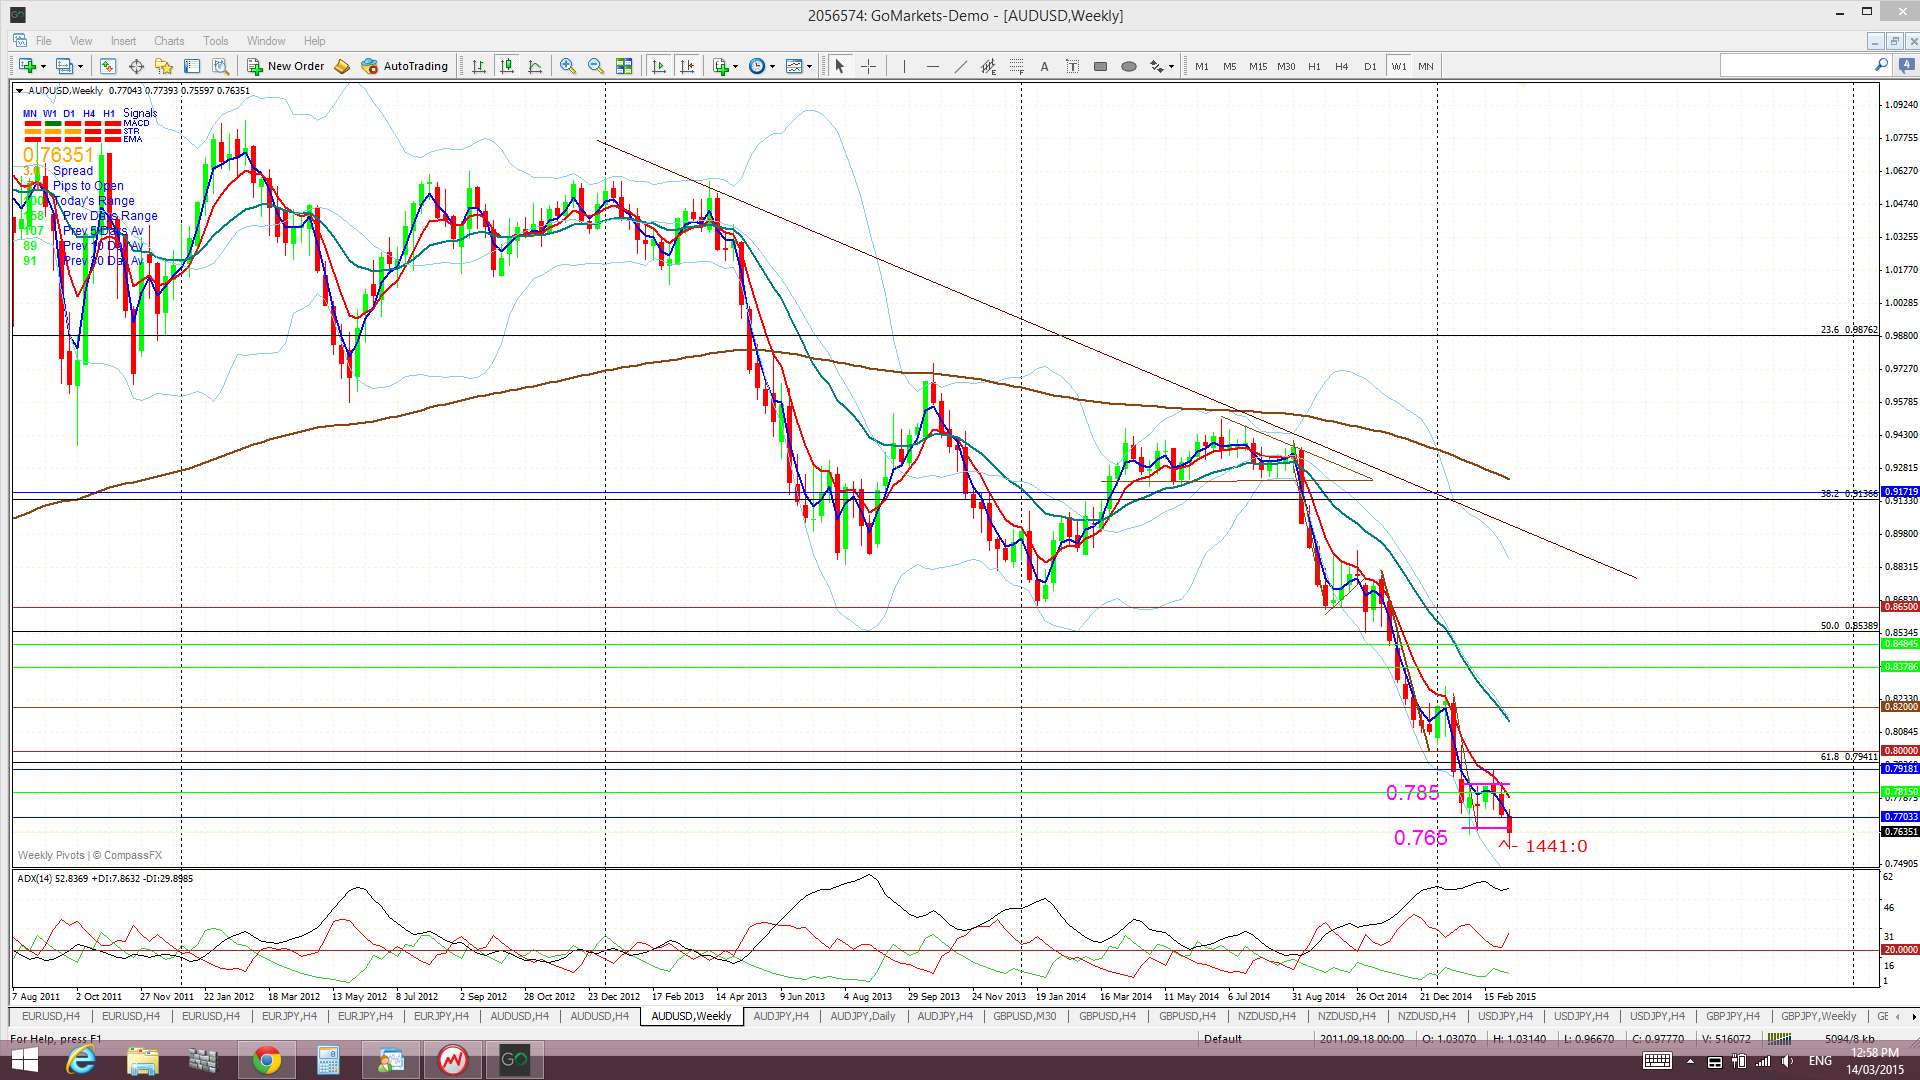
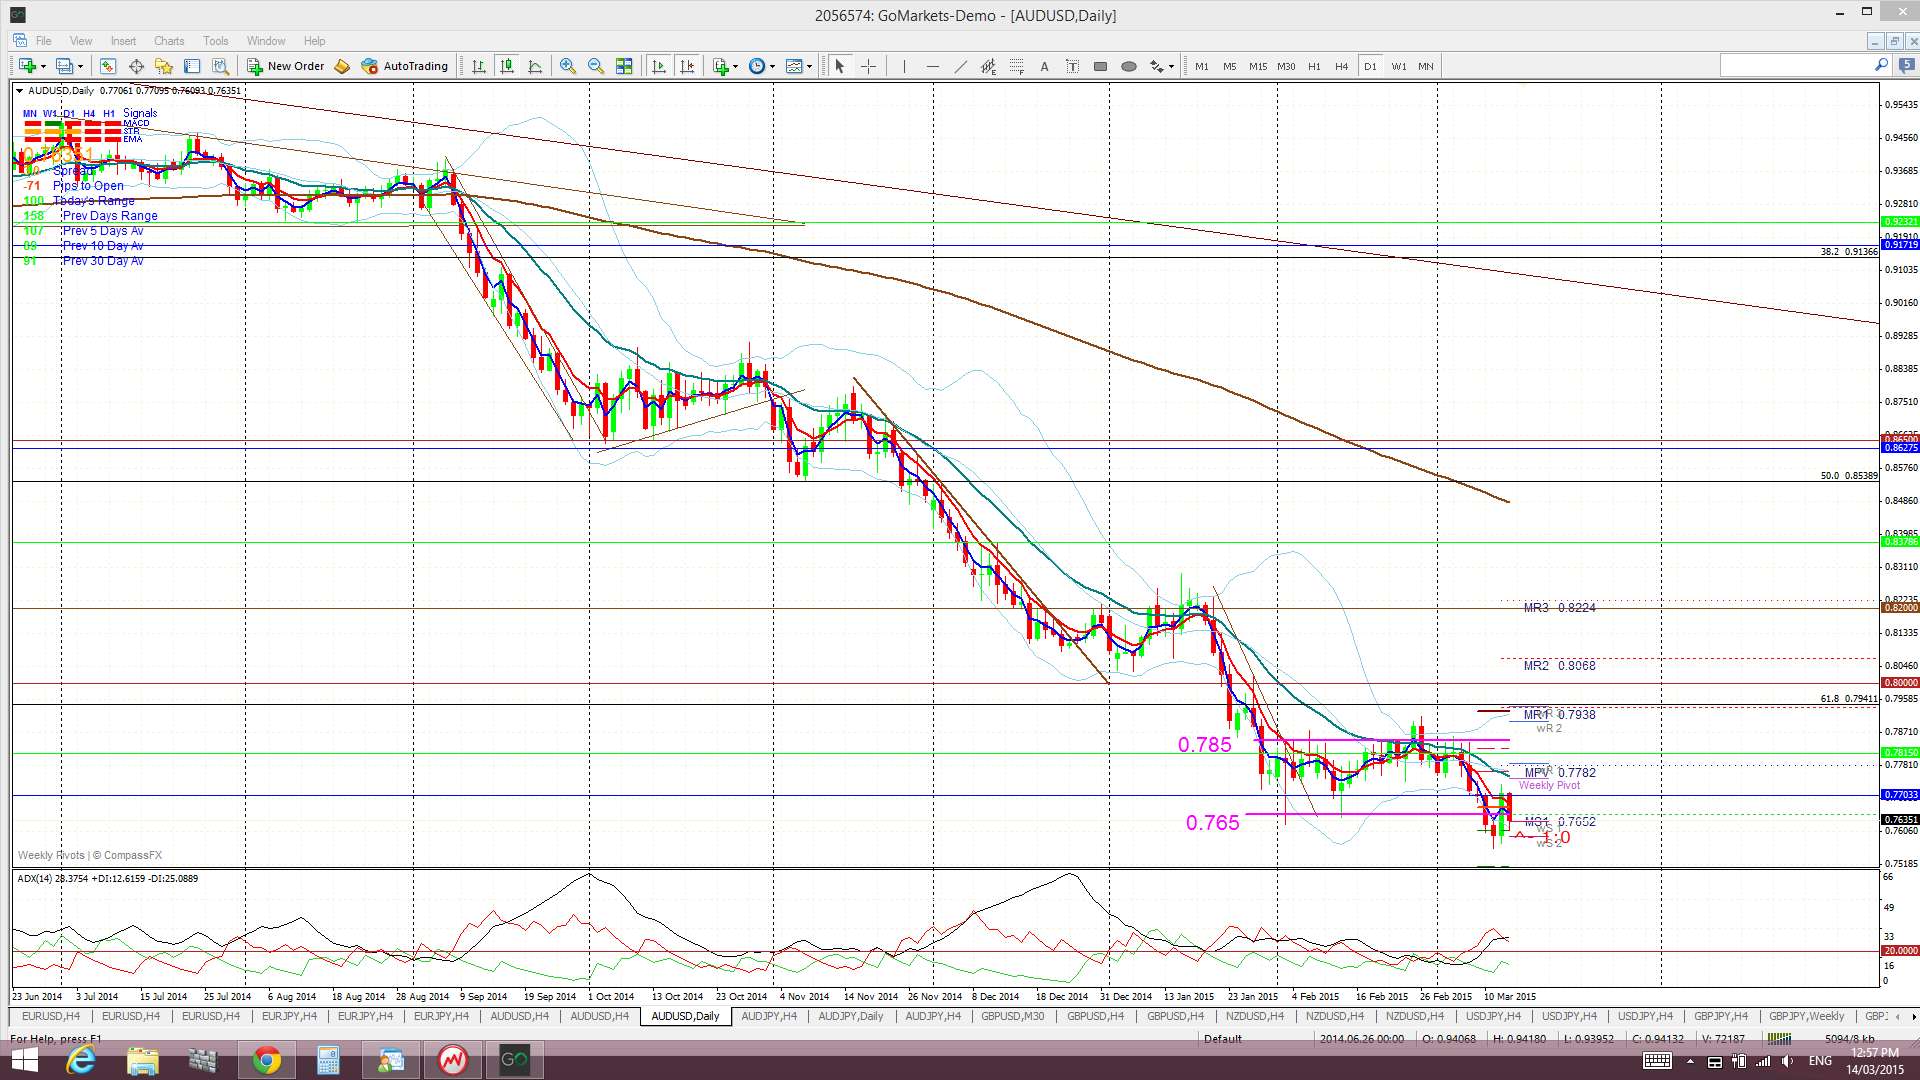
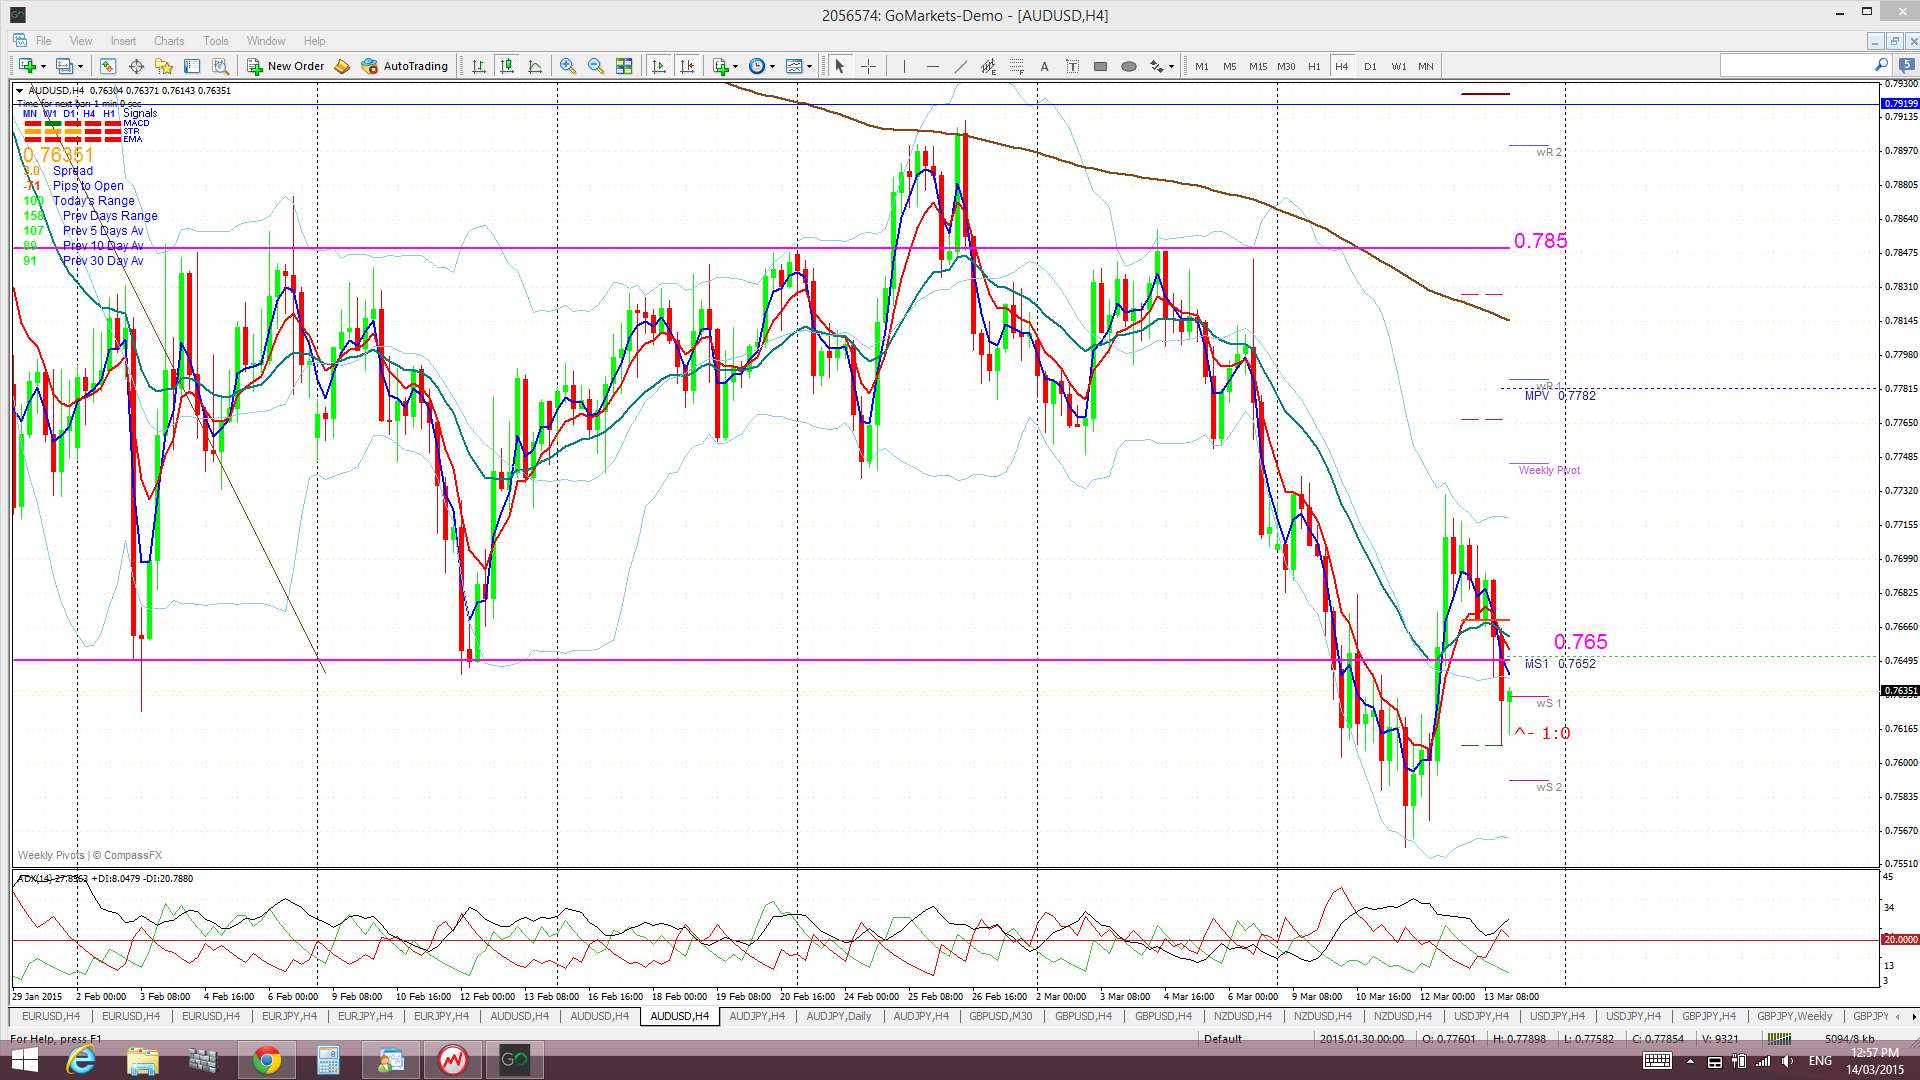
A/U: The A/U weakened last week and fell below 0.765 trading channel support. It continues to hold up fairly well though considering the recent USD strength.
Price is still trading below the Cloud on the 4hr, daily, weekly and monthly charts which is bearish.
The weekly candle closed as a bearish candle.
I am still looking for a move to major Fib support down near 0.72. This is the region of the 61.8% Fib from the 2000-2010 bull move and also the 78.6% Fib of the 2008-2010 bull run:
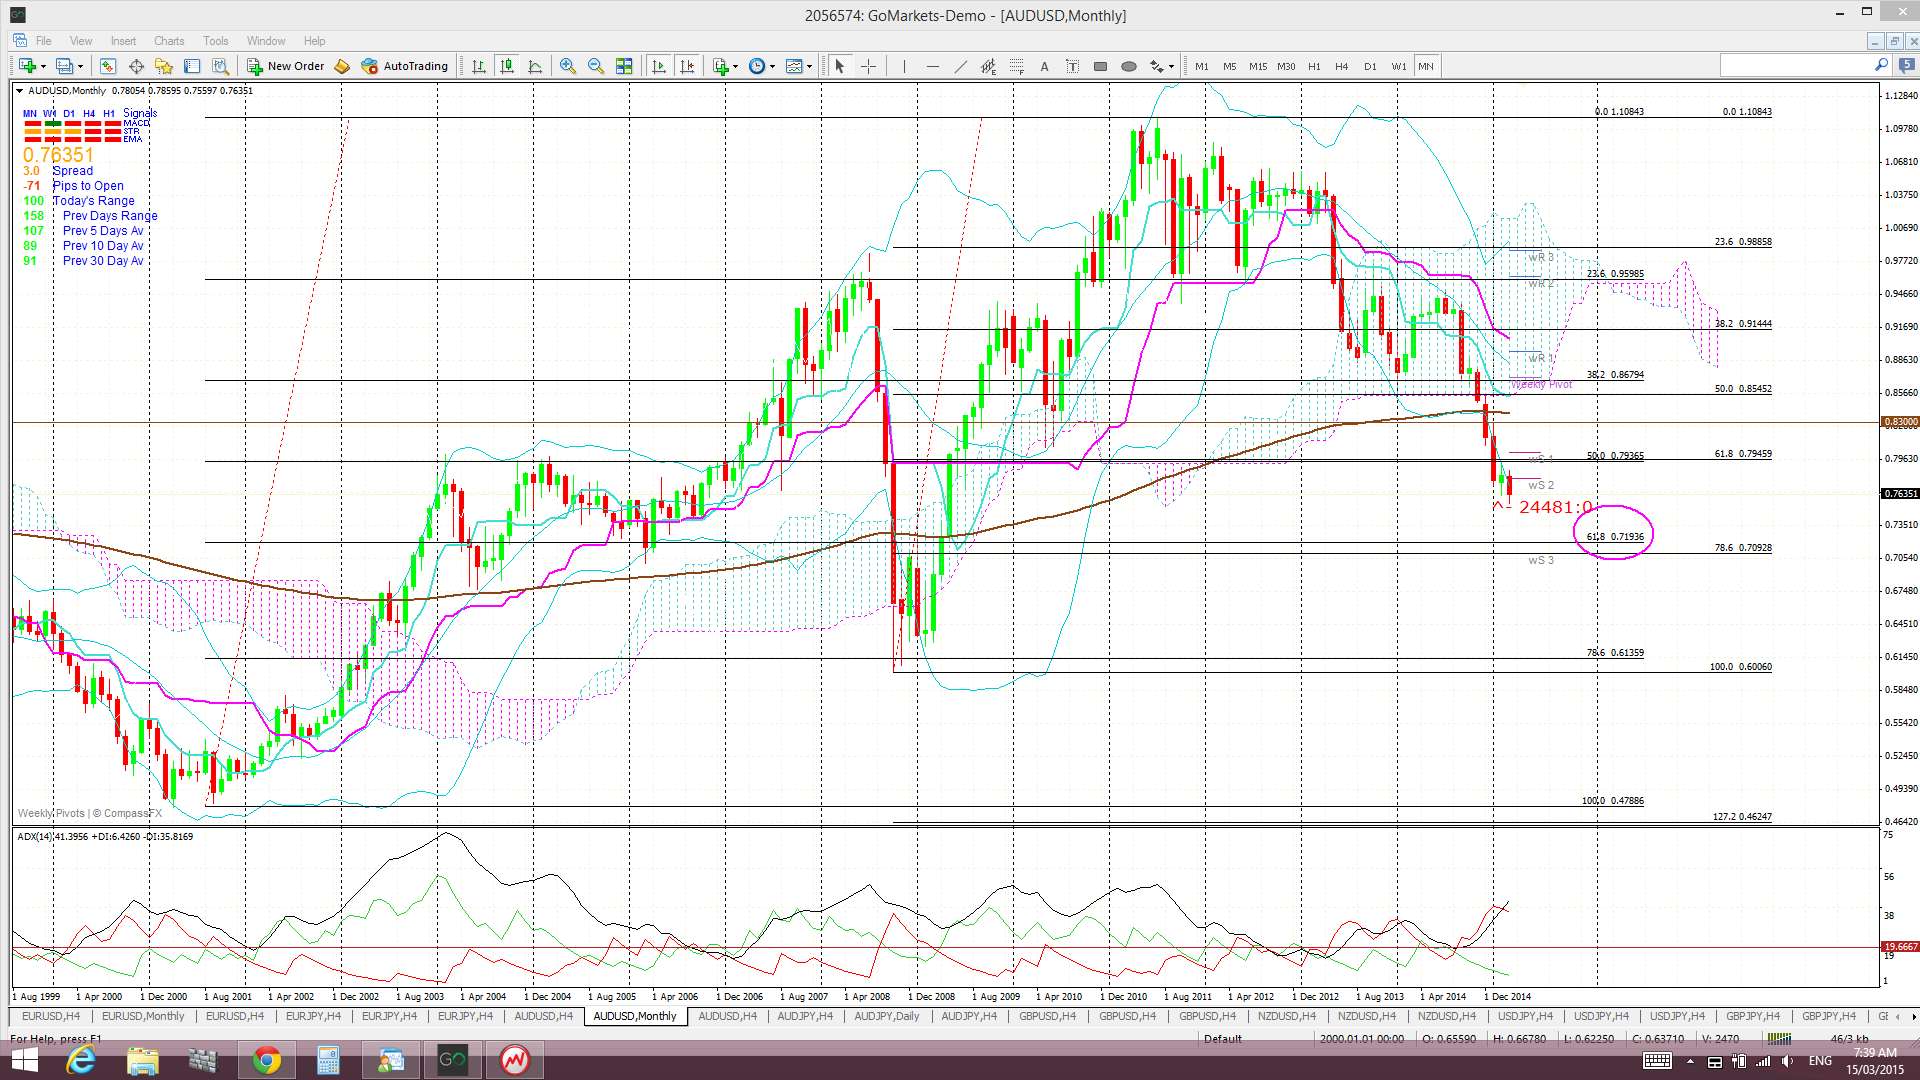
FOMC is the main risk event here for this pair and will most likely determine the next directional move here. RBA minutes, prior to FOMC, may also impact here though as well.
- I’m watching for any new TC signal on this pair and the 0.785 & 0.765 levels.
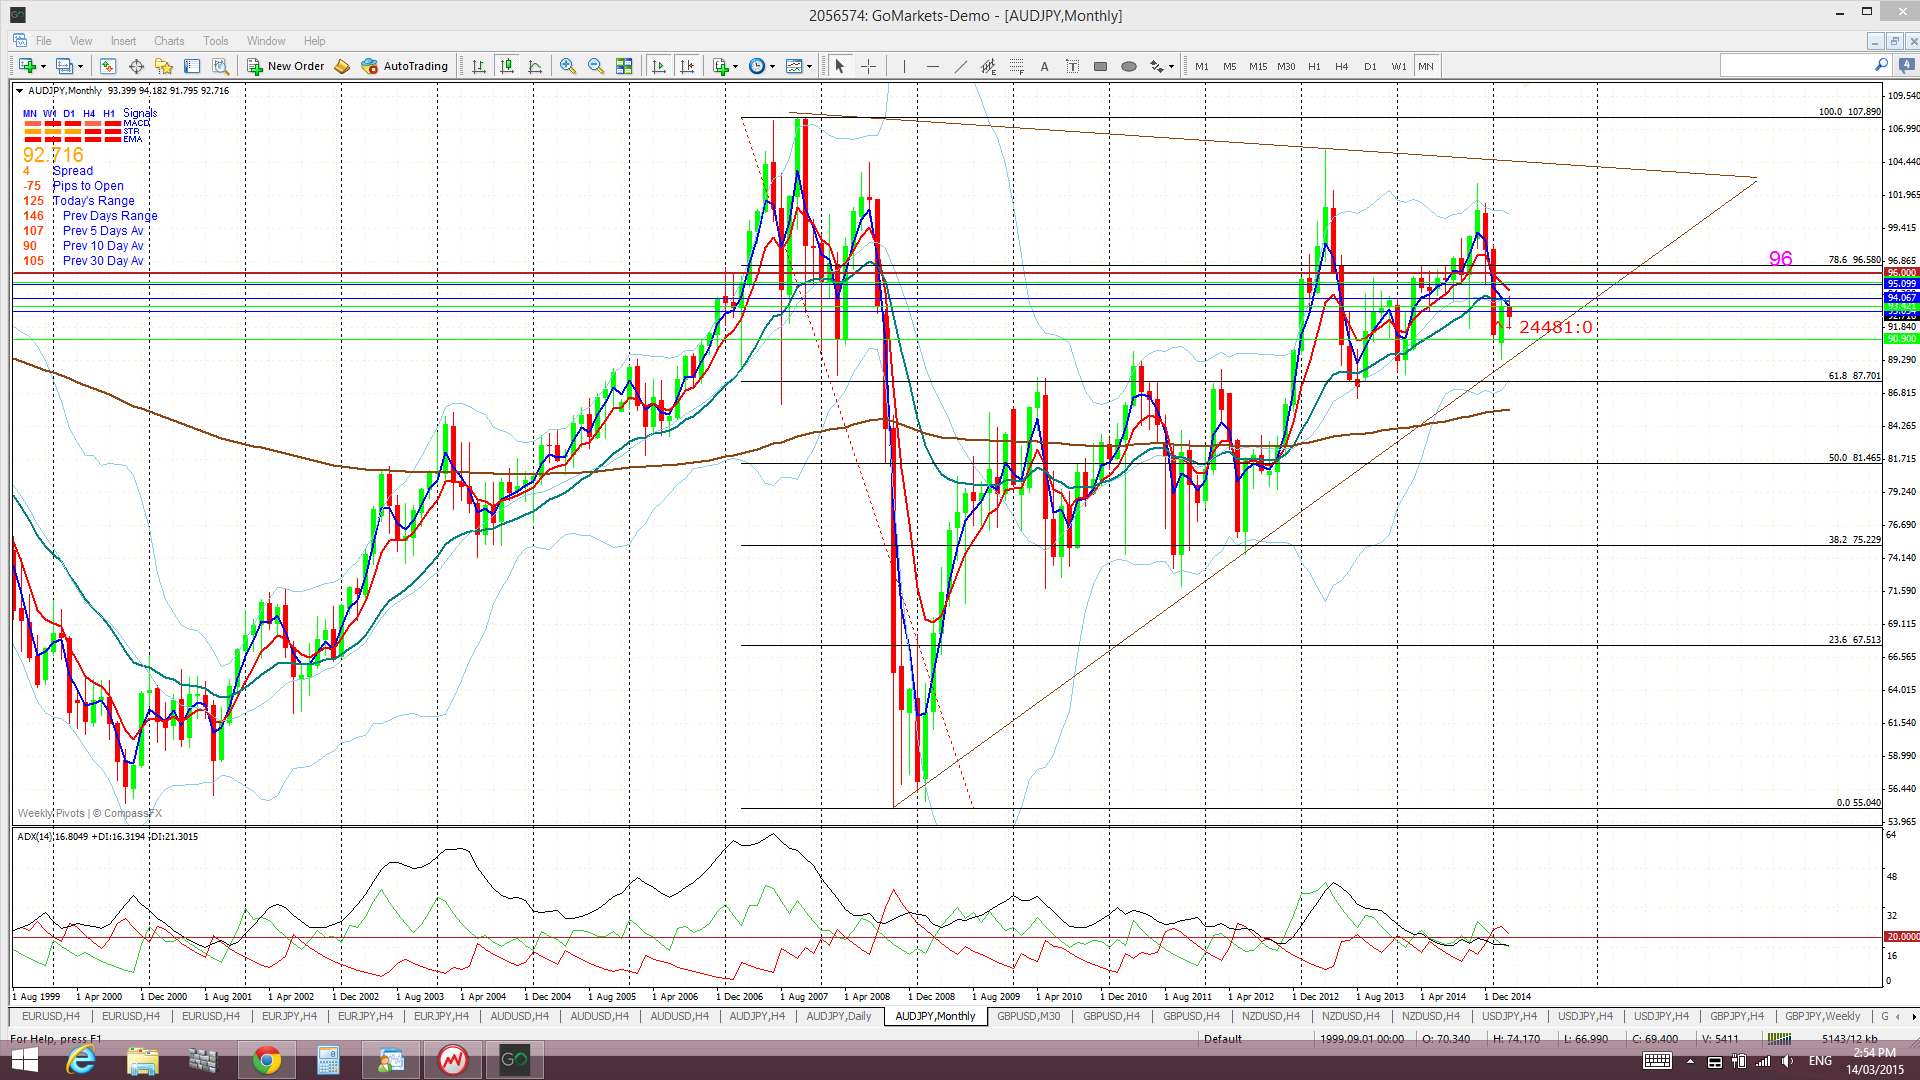
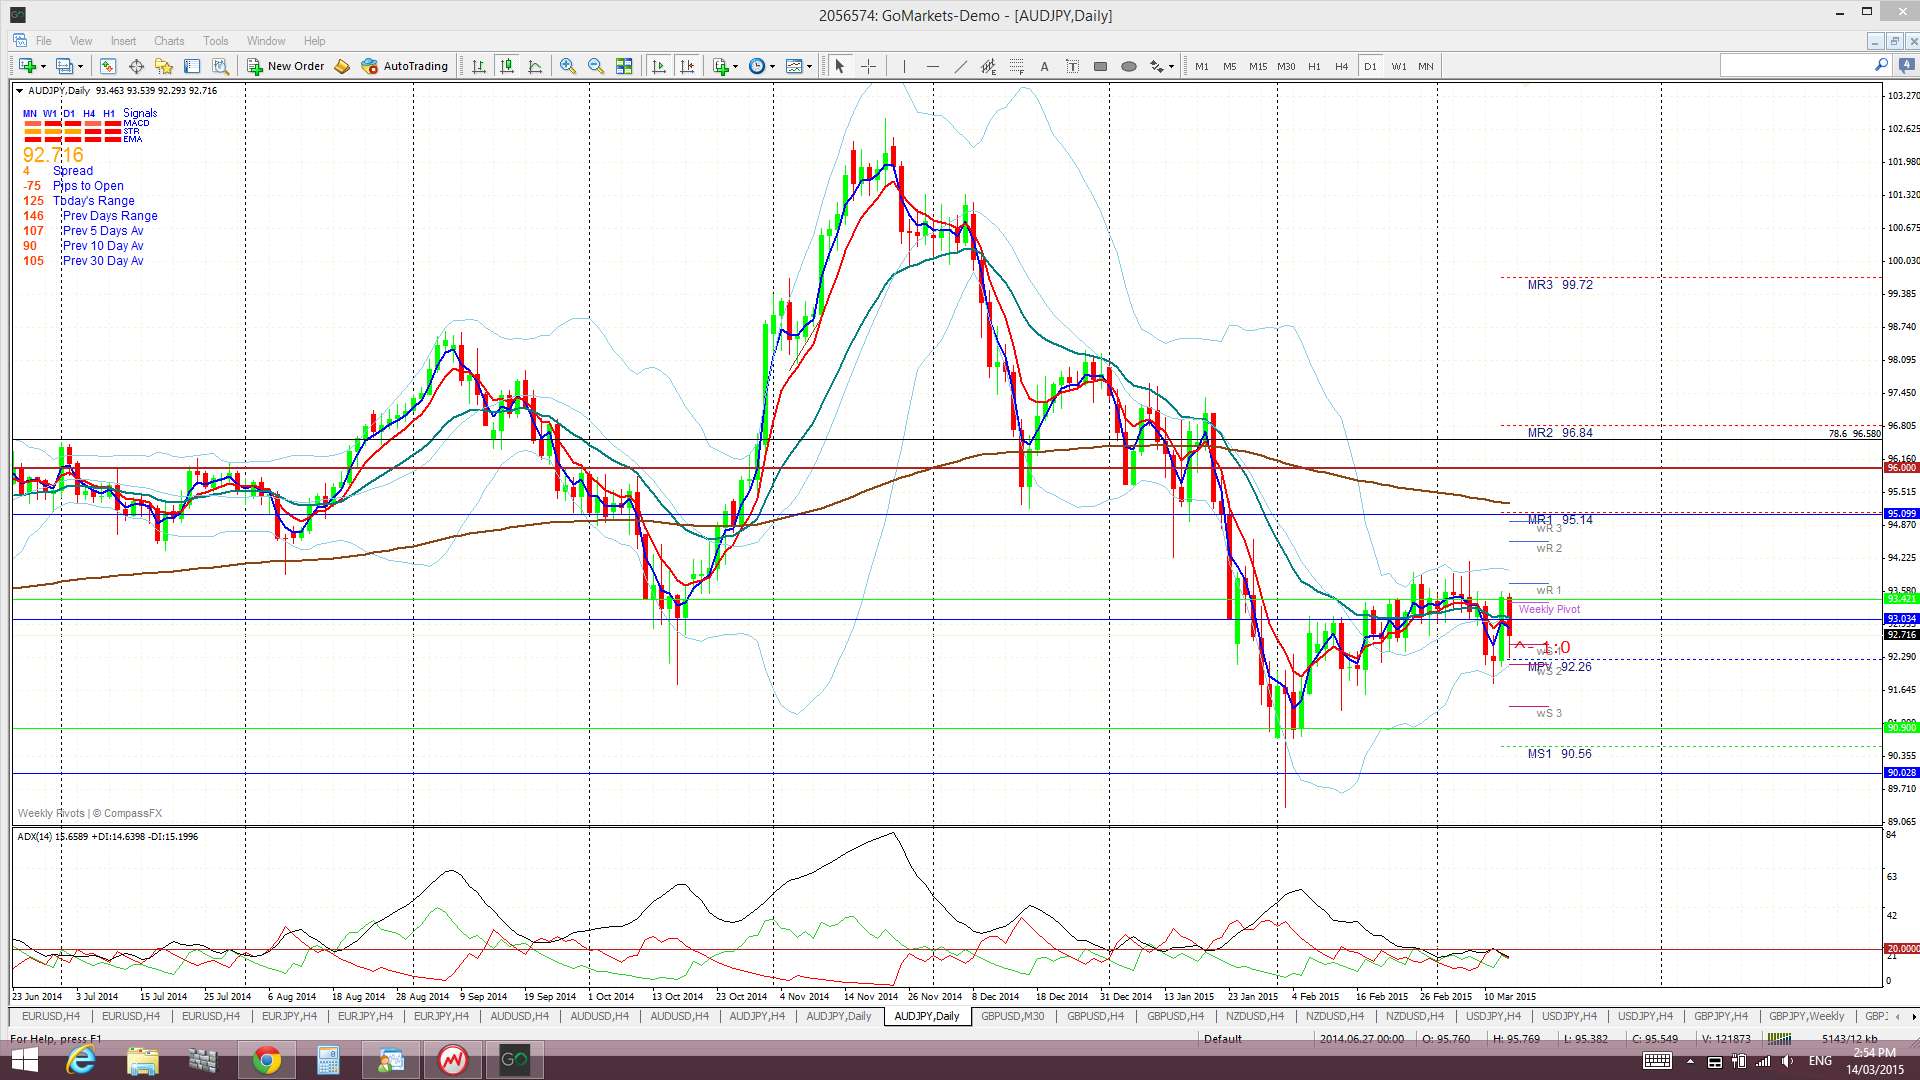
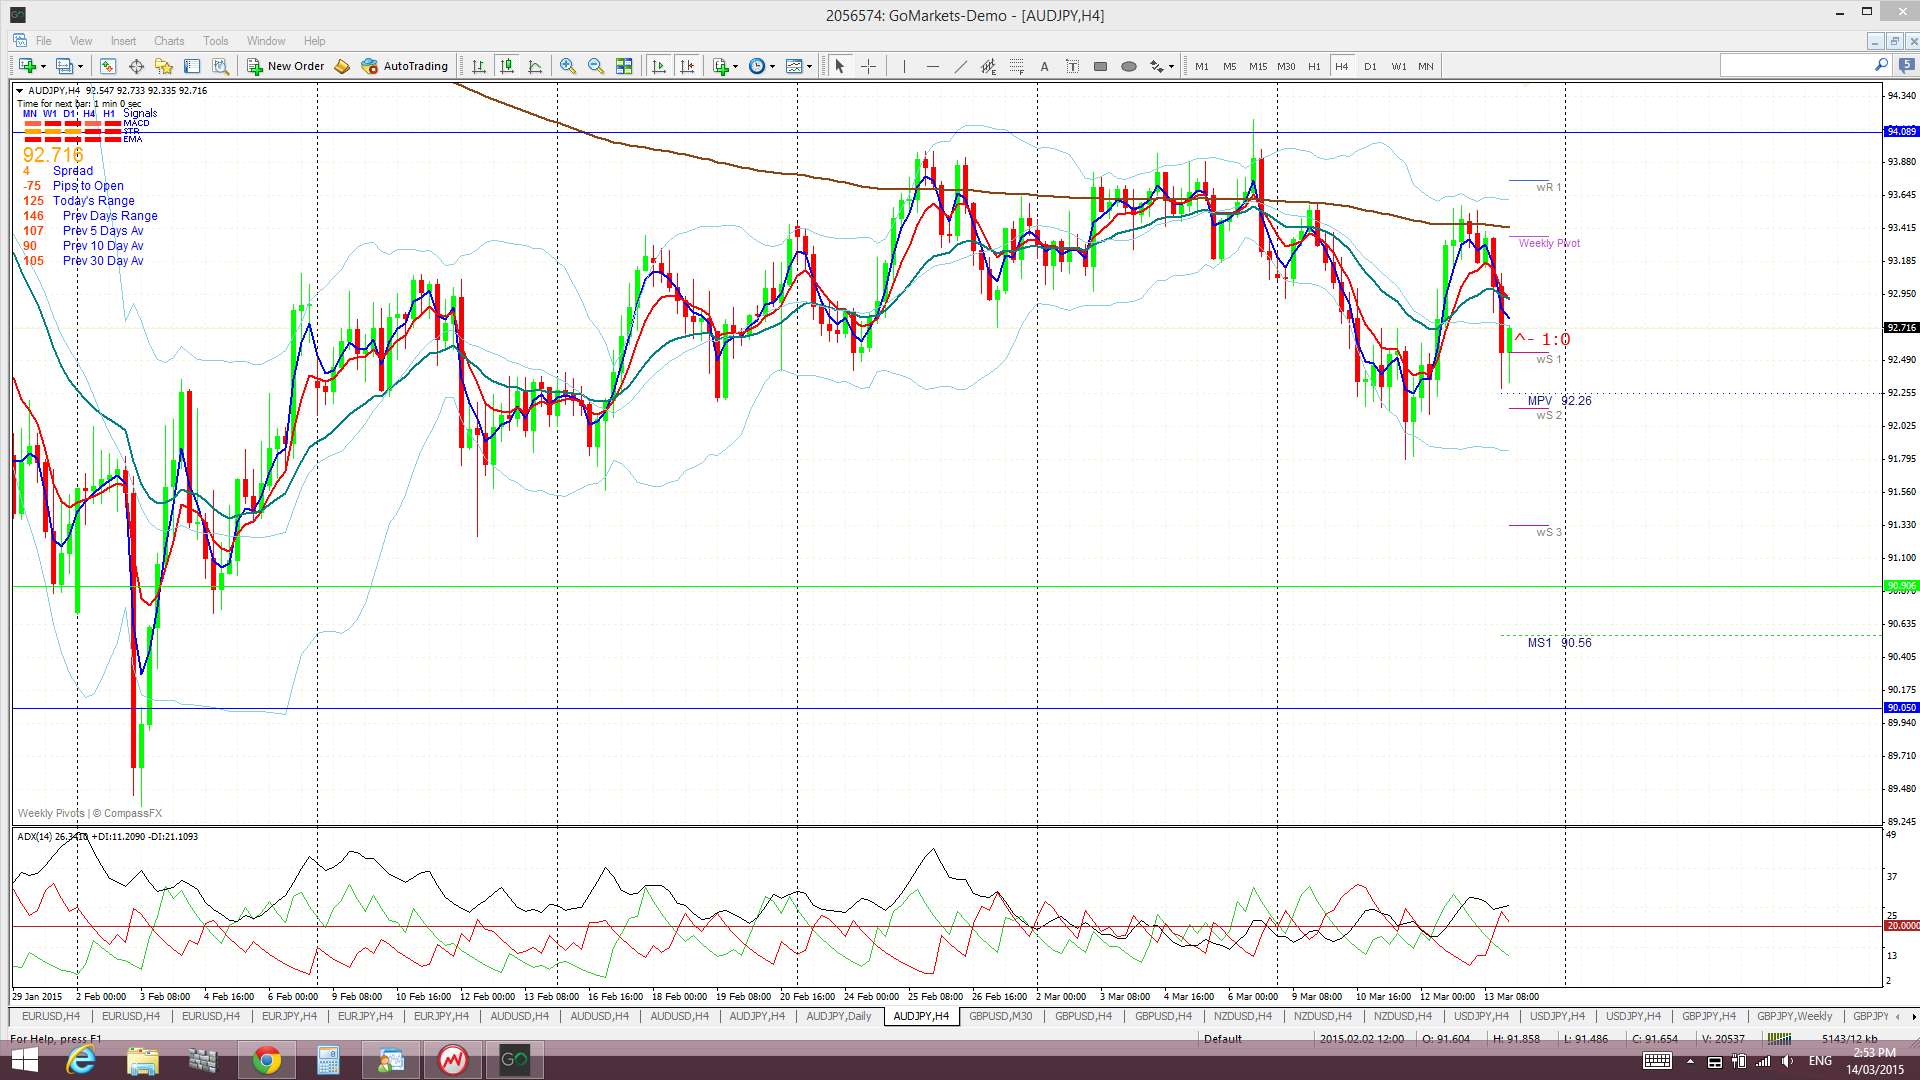
A/J: The A/J has continued to chop along under the 96 level as it has done for the last six weeks now and it has ranged between 91 and 94 for five of those weeks.
Price is trading below the Cloud on the 4hr, daily and weekly charts but above the Cloud on the monthly chart.
The weekly candle closed as a bearish candle with a long upper shadow.
Risk events here include BoJ Monetary statement and RBA minutes as well as any flows from FOMC.
- I’m watching for any new TC signal on this pair and the support trend line.

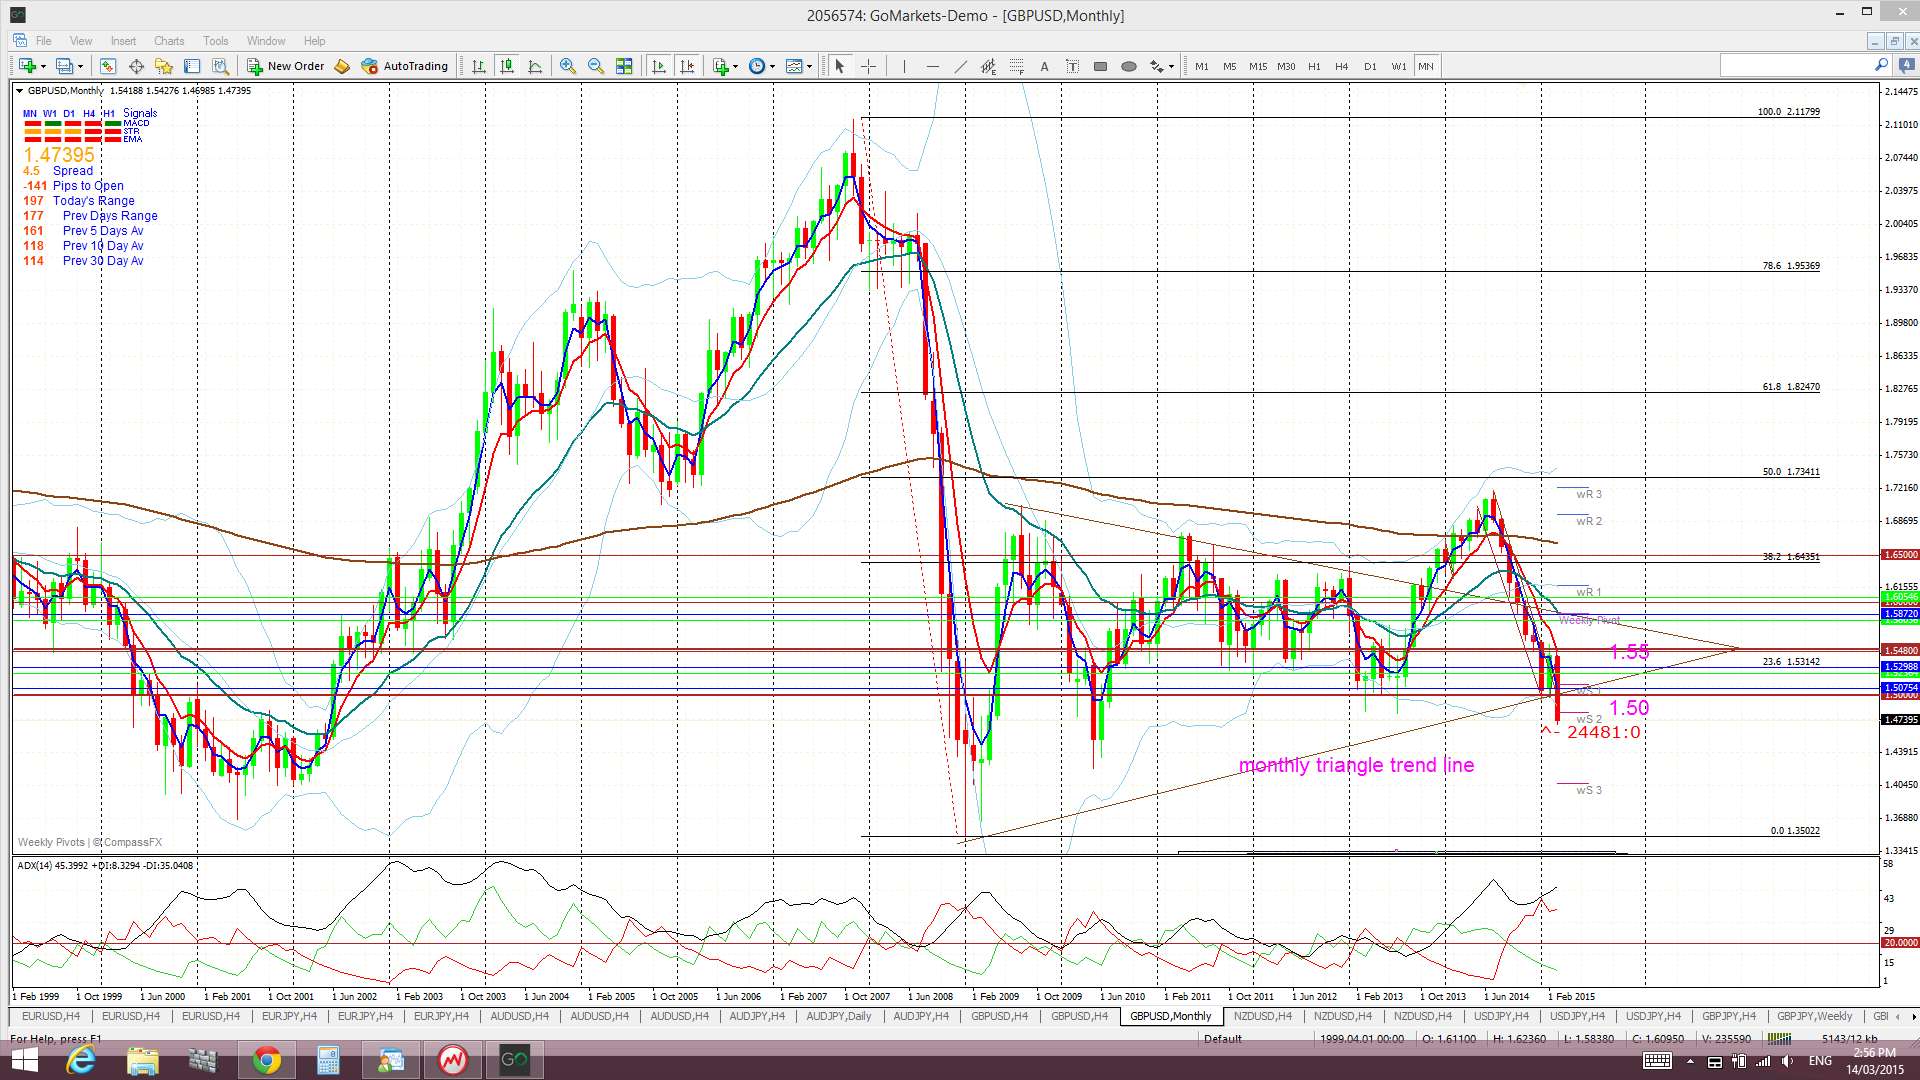
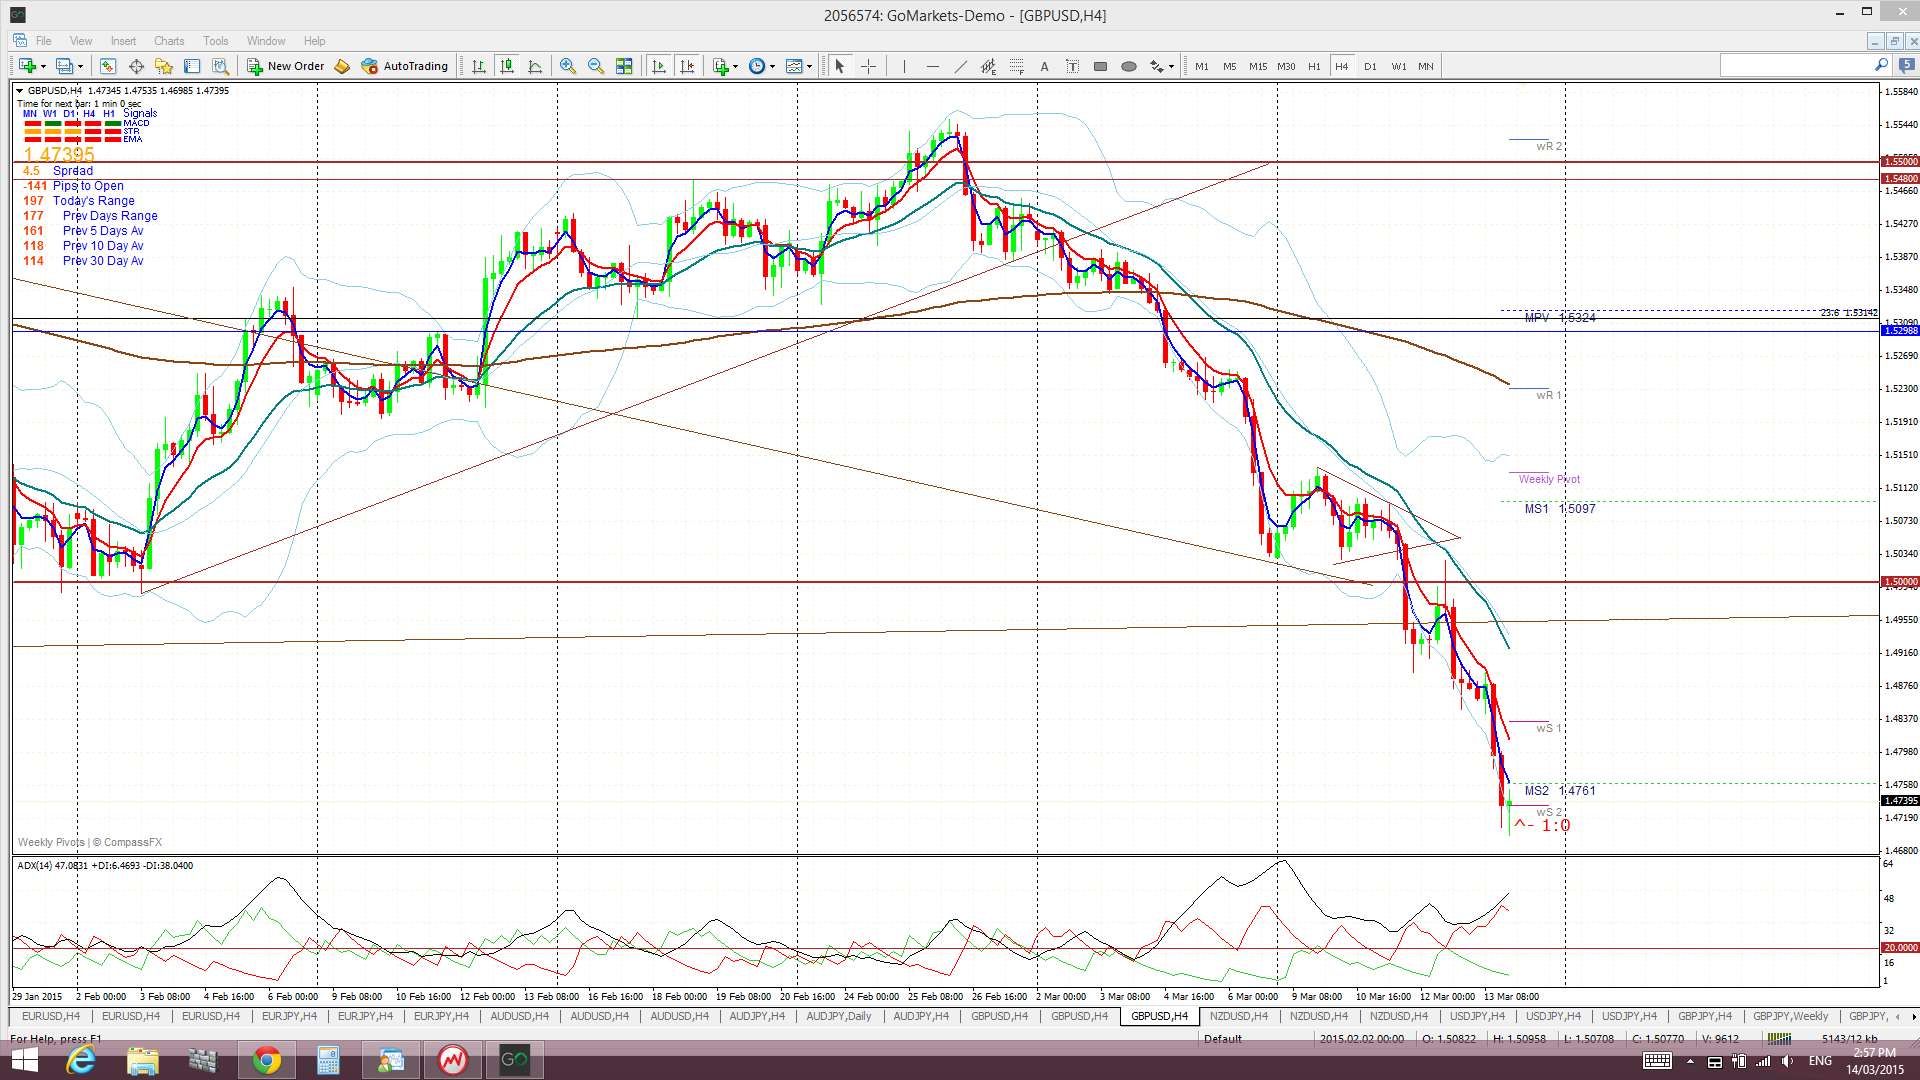
G/U: The Cable chopped lower last week and broke down below major 1.50 support and the monthly triangle trend line.
This break of 1.50 gave a classic technical trade opportunity by way of a trend line break and test of the broken tend line before bearish follow through that was worth 300 pips.
Bear Flag: This break and hold below 1.50 on the weekly chart has brought the ‘Bear Flag’ into focus. The Flag Pole is worth around 2,000 pips and this would suggest a move down to the lows seen back in early 2009 near 1.35.
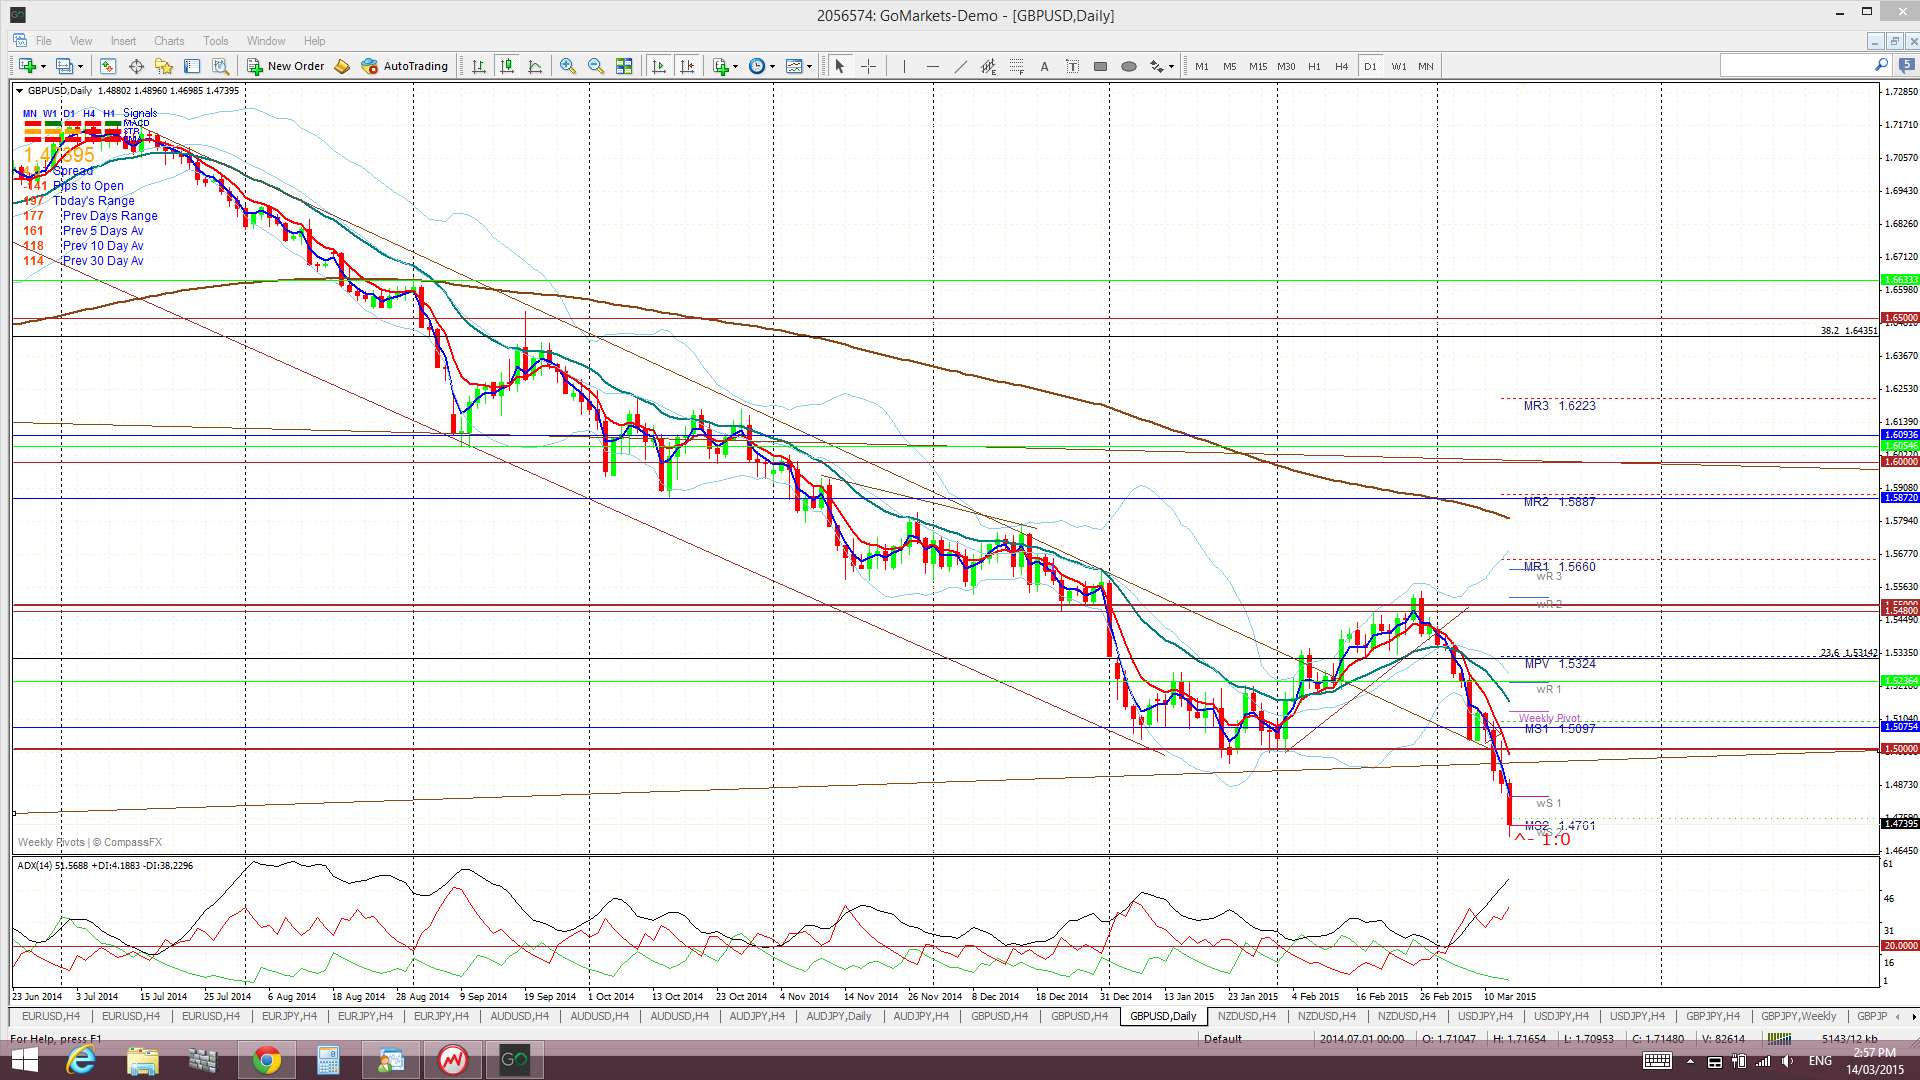
Price is still trading below the Cloud on the 4hr, daily, weekly and monthly charts.
The weekly candle closed as a large bearish candle.
FOMC is a key risk event for this pair next week and any continued US$ strength would support the Bear Flag pattern. GBP Unemployment and Bank Rate Votes will also be data releases to monitor for their potential impact.
- I’m watching for any new TC signal on this pair and the 1.50 level.

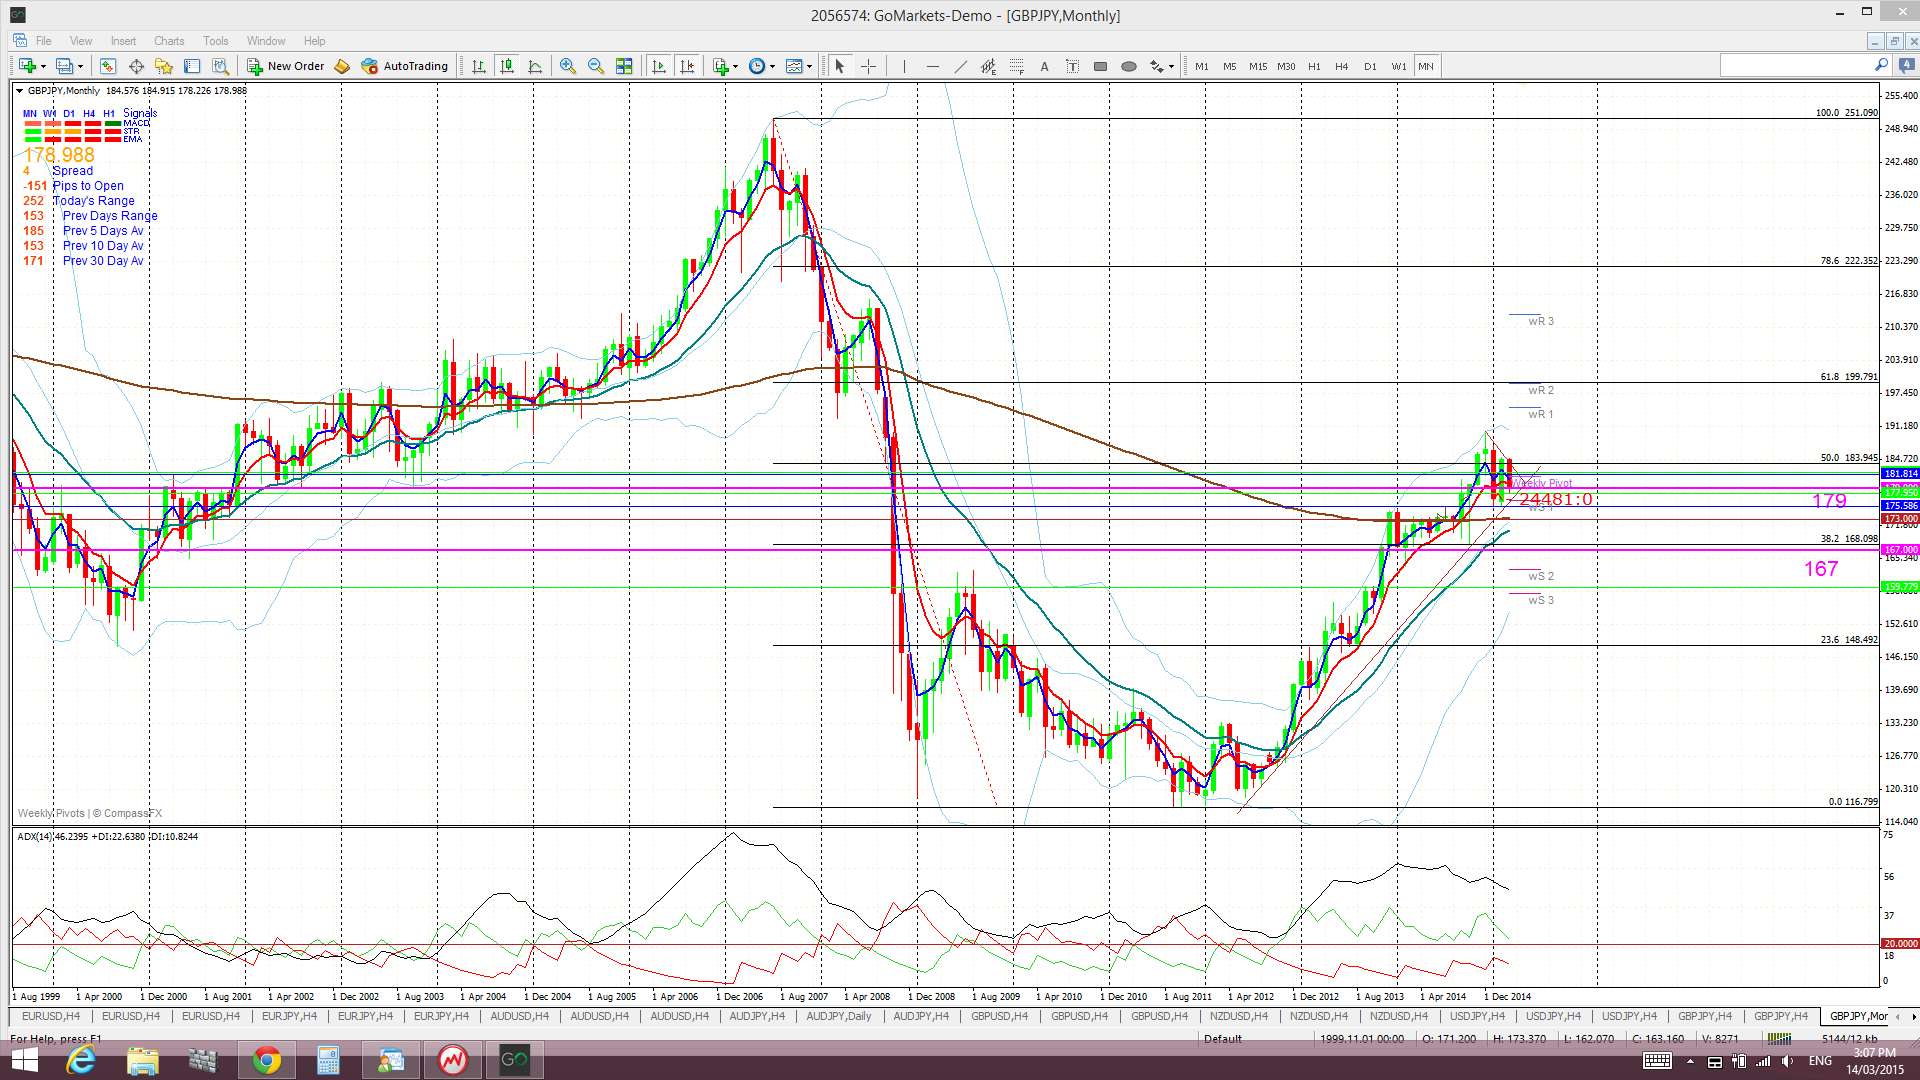
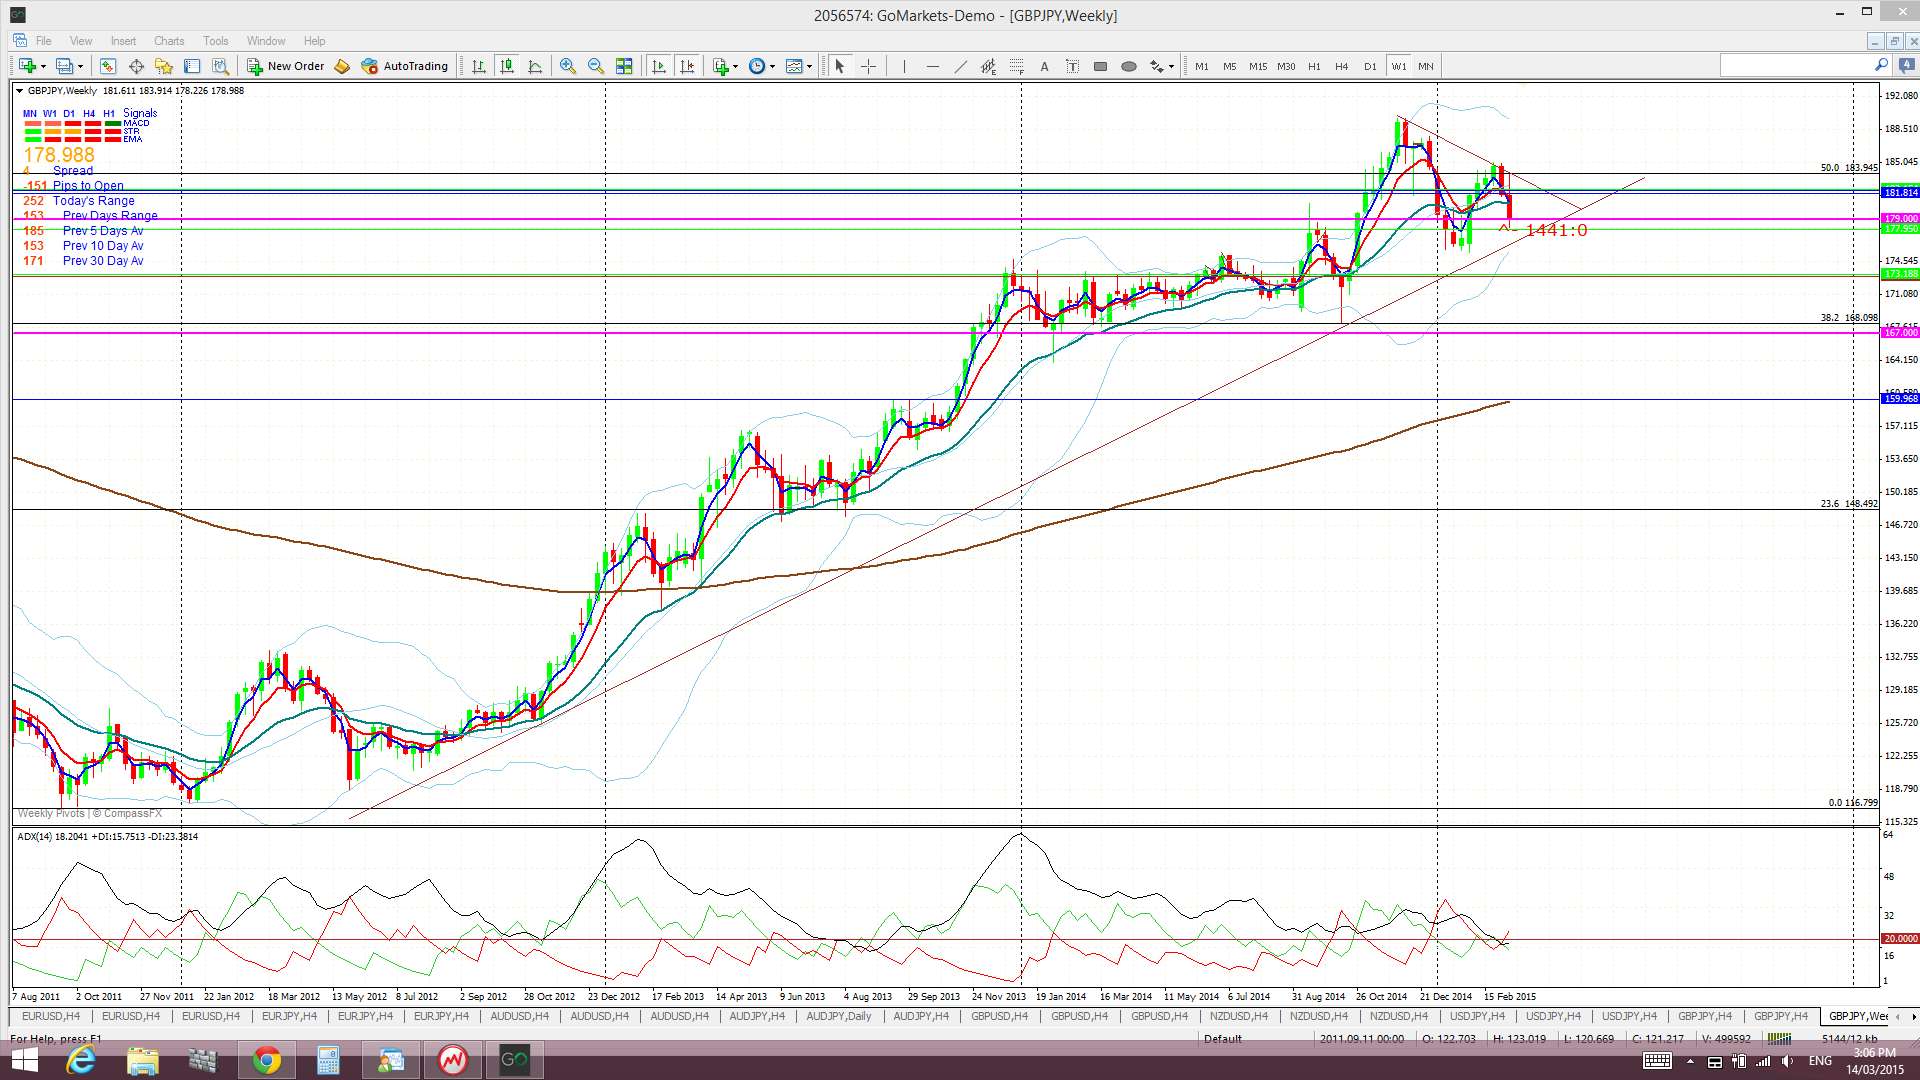
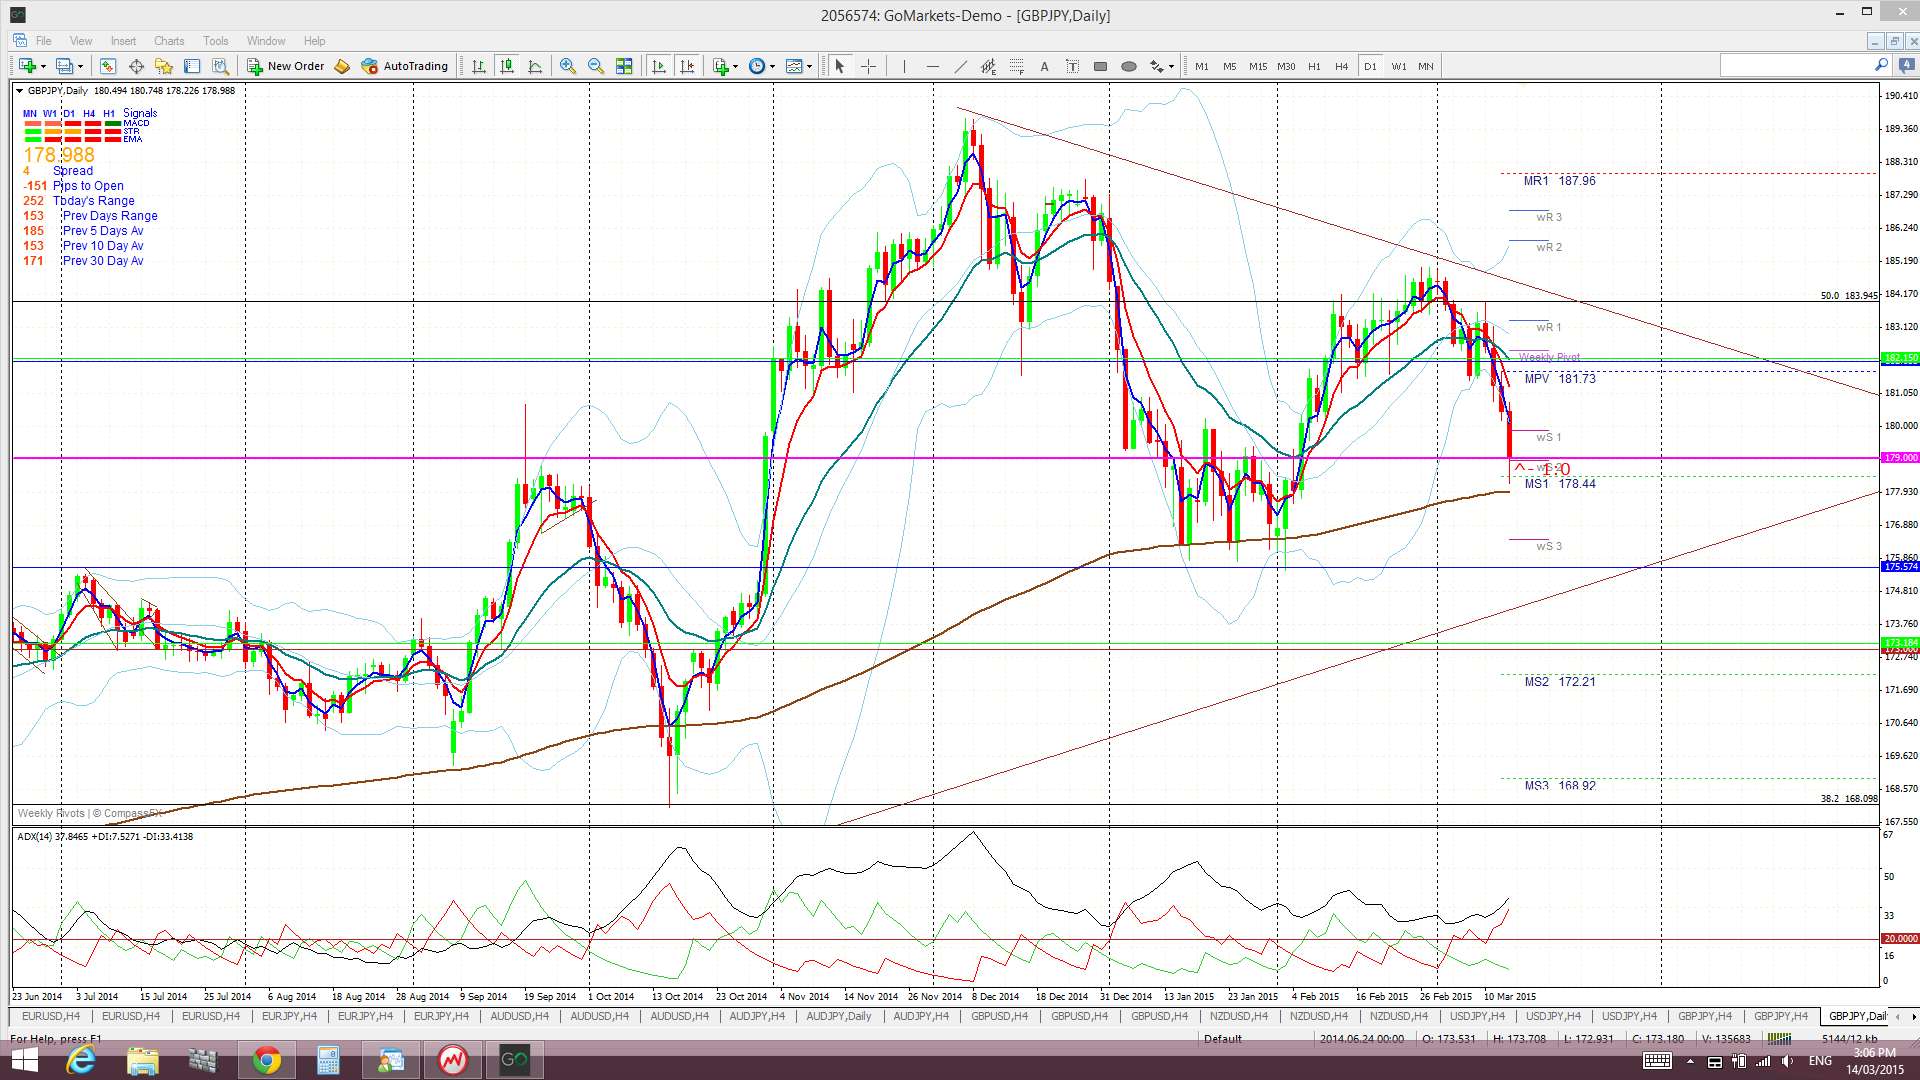
GBP/JPY: The GBP/JPY remains choppy as it consolidates within a daily chart triangle around the 50% Fib level from the 2007-2012 bear move. I note that price closed the week right on top of the 179 level.
Two key S/R levels on the G/J chart: The monthly chart shows a band of choppy congested activity across the chart. This band is defined by rather strong S/R levels at 179 and 167. The 179 level seems to be a key demarcation level and a close and hold above this would suggest bullish continuation. The key 173 level lies midway between these two S/R levels. Targets for any bullish continuation include the 61.8% fib near 200 and the 78.6% fib near 222.
Price is trading below the Ichimoku Cloud on the 4hr and daily chart but above the Cloud on the weekly and monthly charts.
The weekly candle closed as a bearish candle following last week’s bearish, almost ‘engulfing’ candle.
Risk events here include the BoJ Monetary Policy Statement, GBP Unemployment and Bank Rate Votes as well as any flows from FOMC.
- I’m watching for any new TC signal on this pair and the weekly chart’s triangle trend lines.

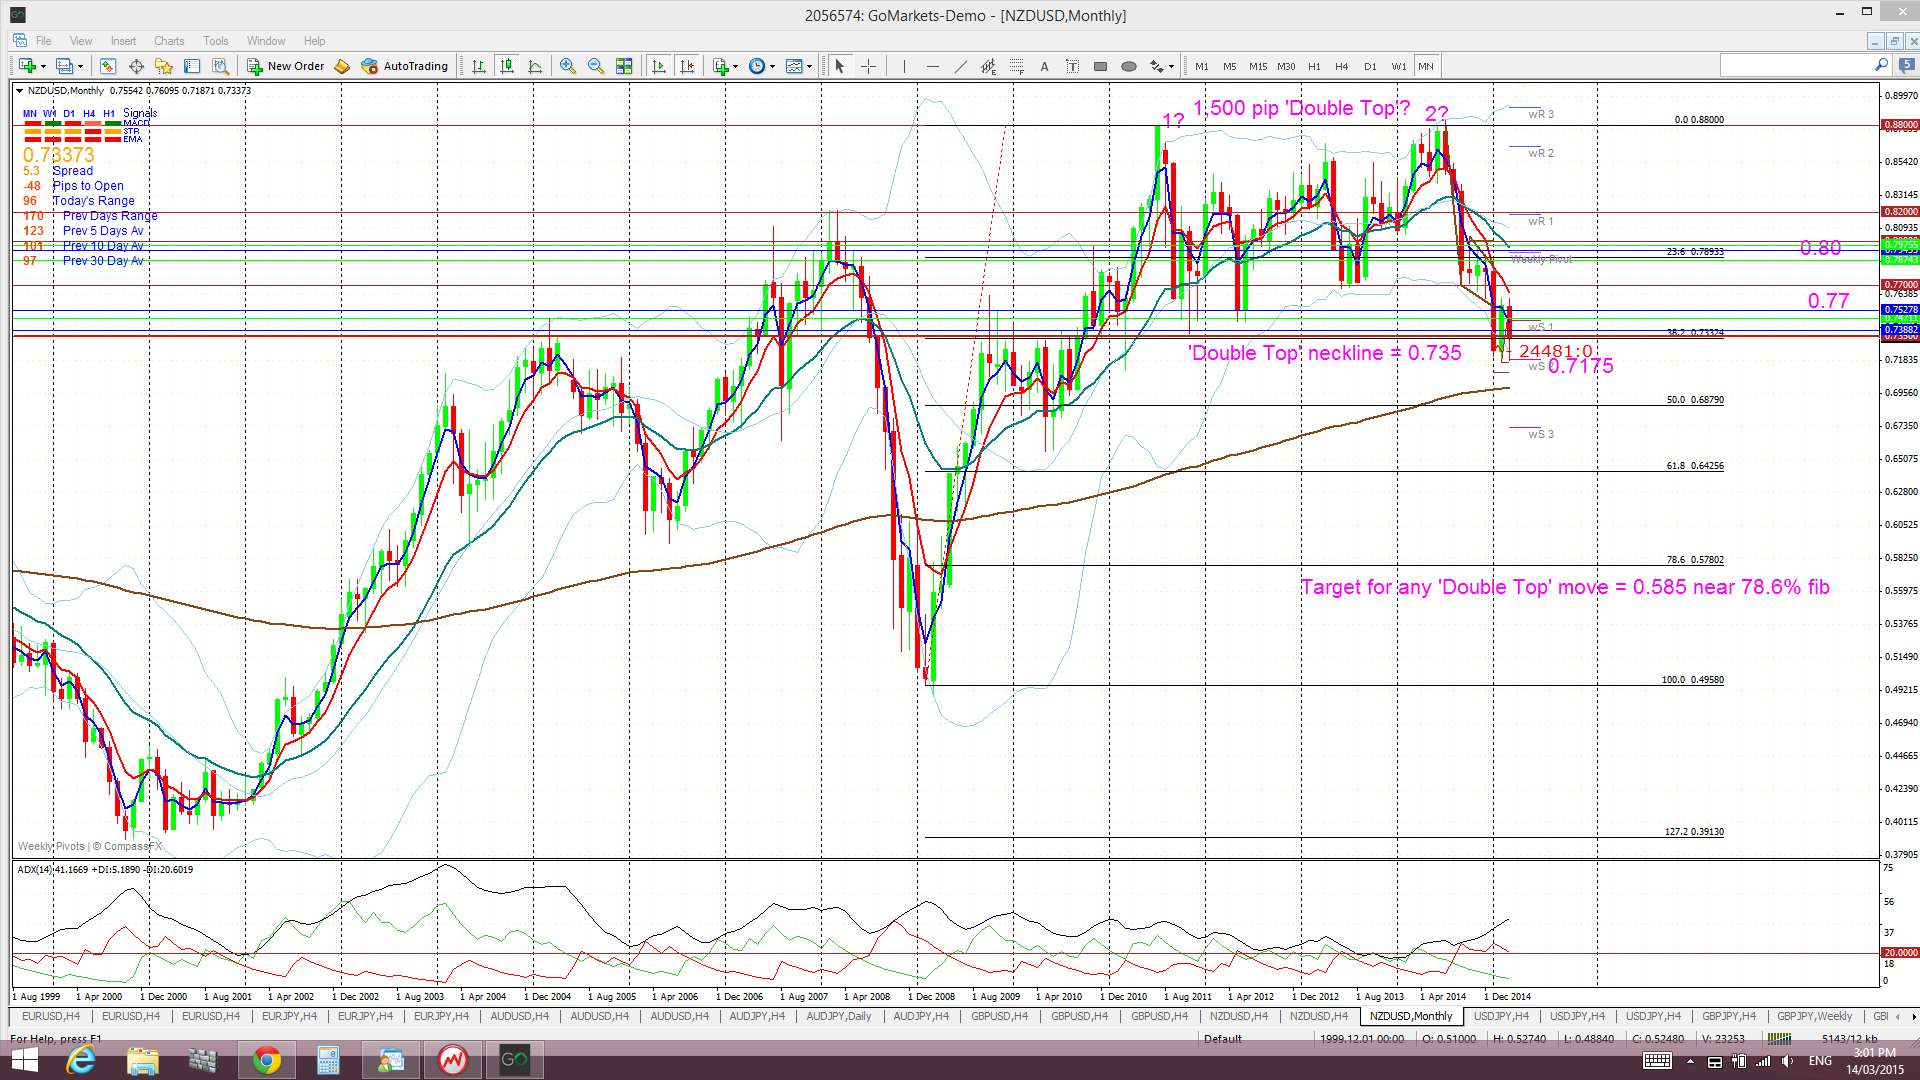
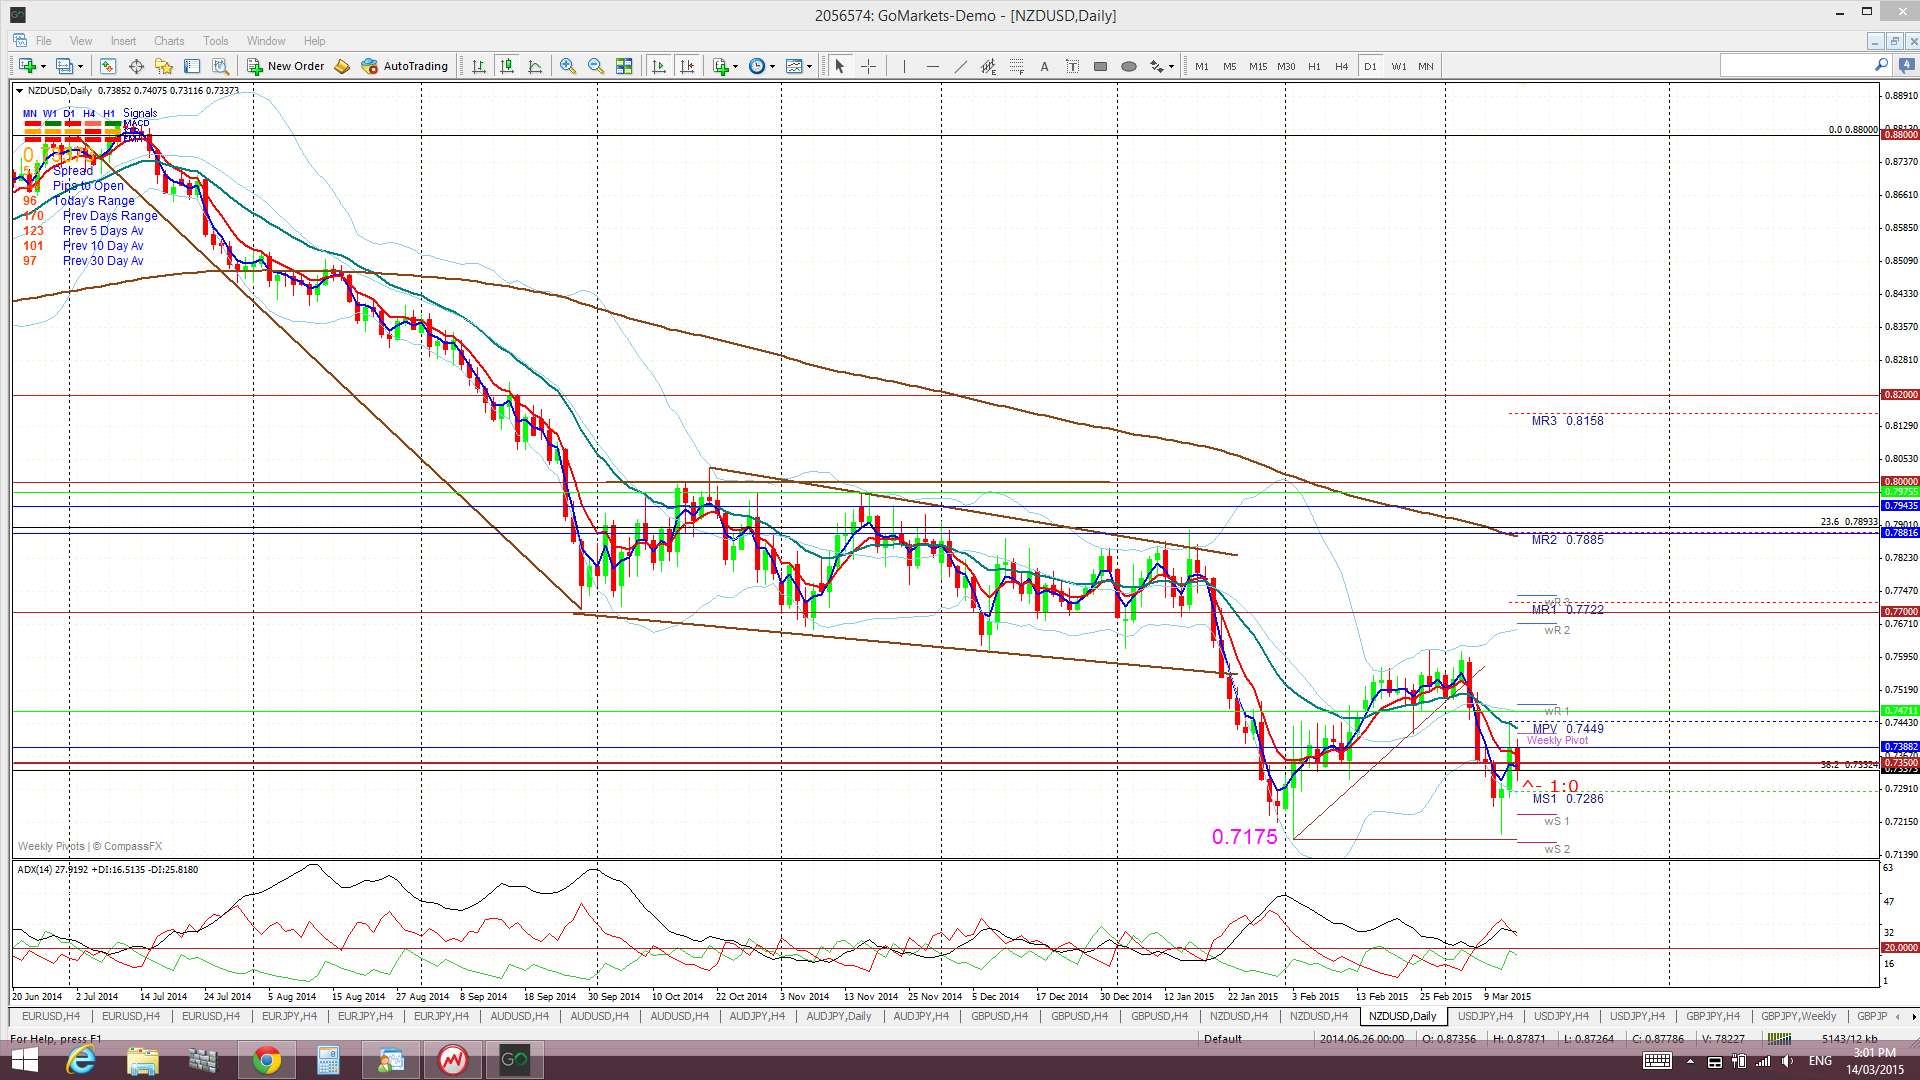
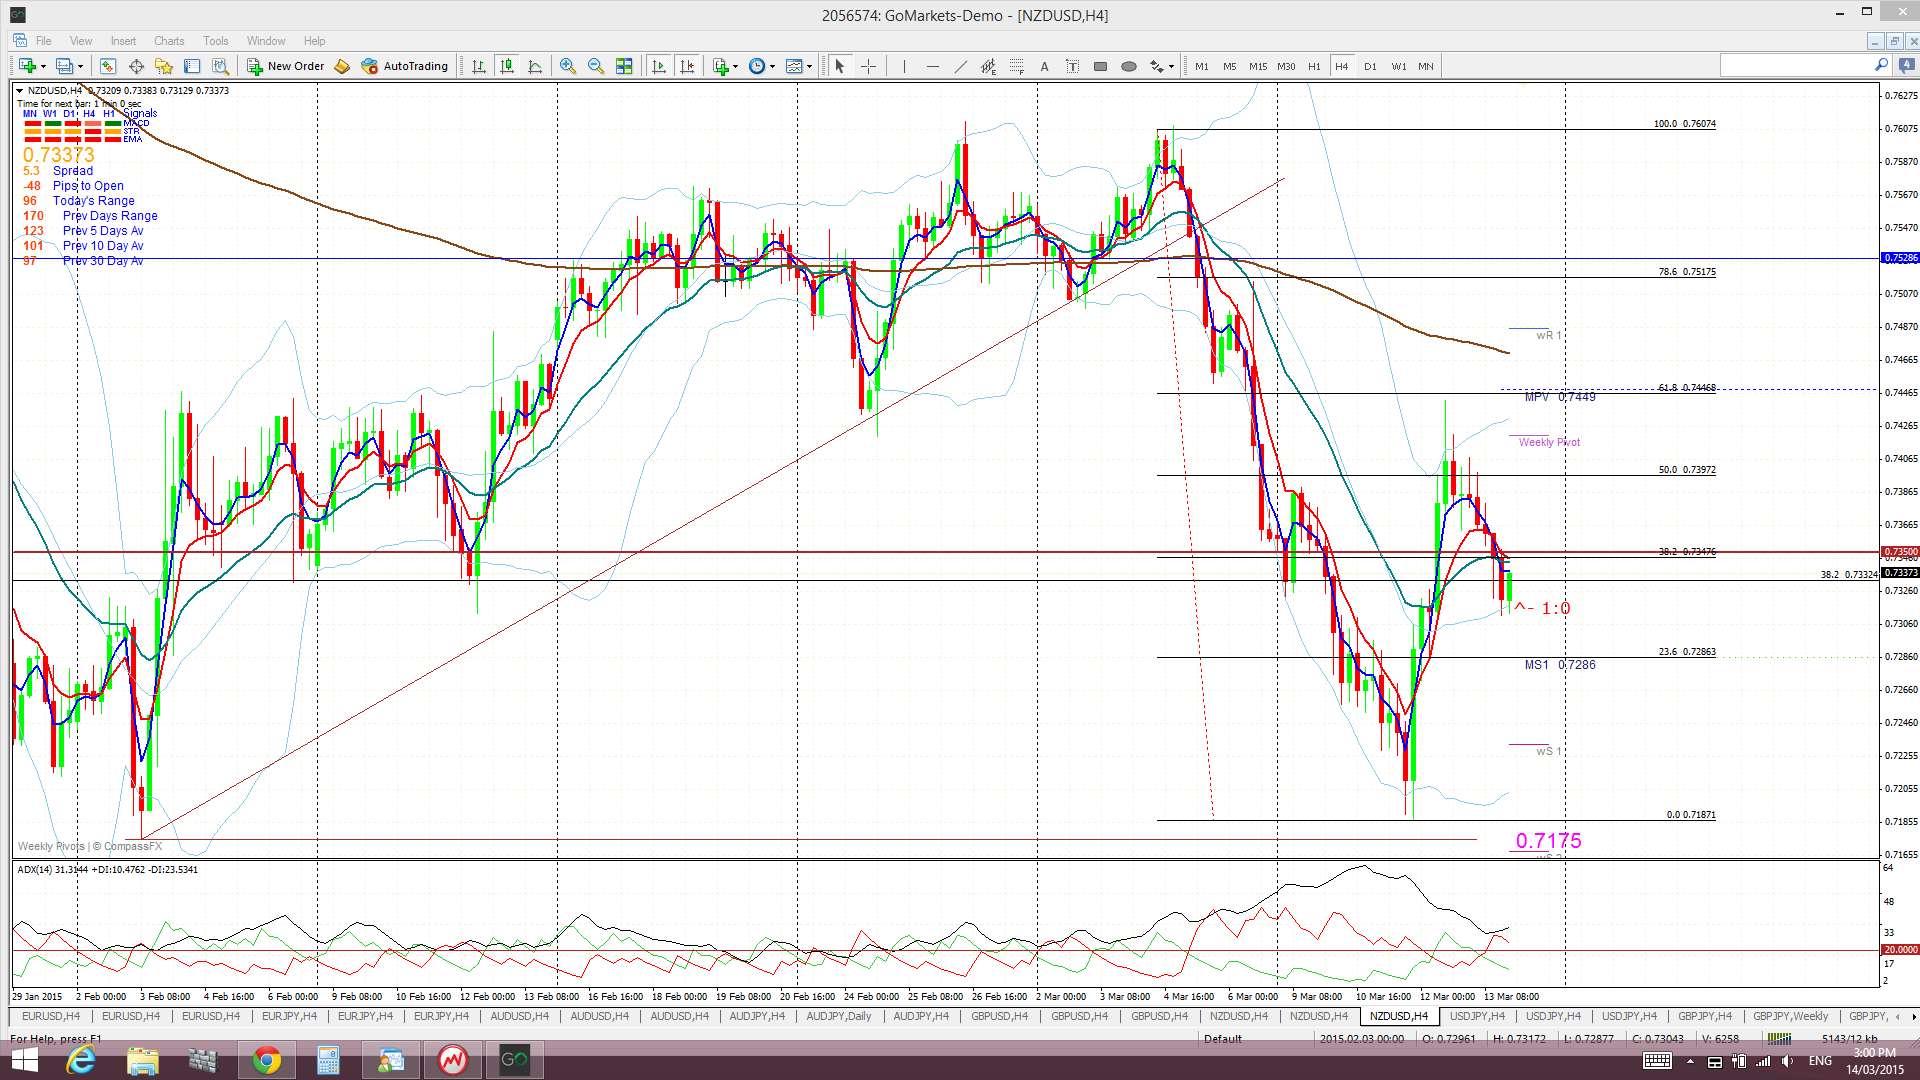
Kiwi: NZD/USD: The Kiwi chopped lower to start last week, fell through 0.735 support and only paused when it reached recent ‘Double Bottom support at 0.7175. The RBNZ interest rate hold buoyed sentiment though and the Kiwi rallied from there. I had suggested price action might head up to test the 61.8% fib of this recent bear move as this was also near the monthly pivot. This is exactly what evolved before US$ strength kicked in again on Friday and dragged the pair back lower giving a nice 120 pip move off the noted resistance level.
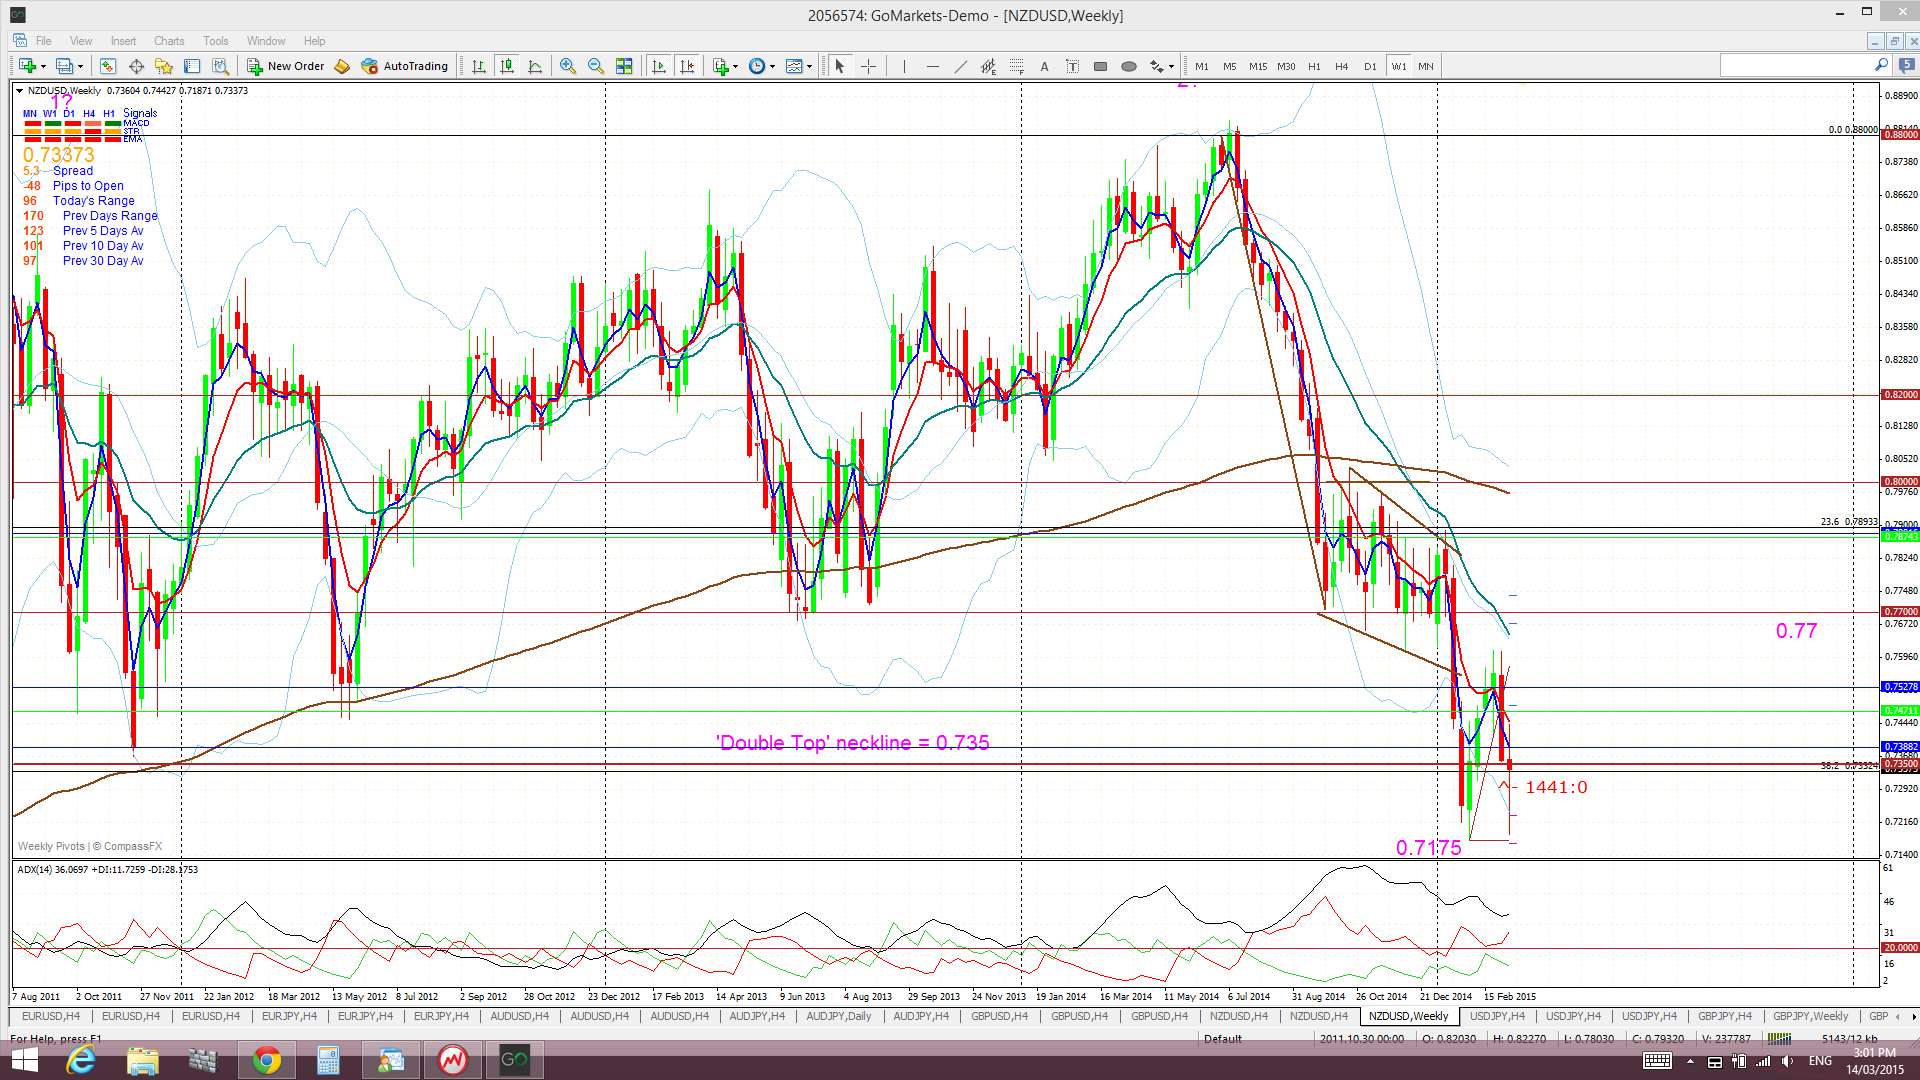
‘Double Top’ breakdown on Monthly chart? The monthly chart reveals a possible ‘Double Top’ pattern with a neck line at 0.735. The monthly candle close below this level for January suggested a possible 2,000 pip bearish follow through move as this is the height of the ‘Double Top’ BUT there does not seem to be a hold below this key level JUST YET. This may still well evolve, especially if the USD index maintains its bullish mojo but any reversal on the USD index could see Kiwi continue to bounce up off this major support.
Price is still trading below the Ichimoku Cloud on the 4hr, daily and weekly charts but in the middle of the Cloud on the monthly chart.
The weekly candle closed as a bearish coloured ‘Spinning Top’ candle with long upper and lower shadows reflecting indecision here.
FOMC is the main risk event for the Kiwi too but NZD GDP and GDT data will also be worth keeping tabs on.
- I’m watching for any new TC signal on this pair.
The Yen: U/J: The U/J chopped around last week and formed up into another triangle pattern as the USD index hit a wall at 100 resistance. Continued US$ strength didn’t help this pair as much last week though as stock weakness helped to keep this pair in check.
Price is still trading above the Cloud on the 4hr, daily, weekly and monthly charts though which is bullish. November 2013 was the first monthly candle close above the Ichimoku Cloud since mid-2007 and the bullish hold above the monthly Cloud continues to be noteworthy.
The weekly candle closed as a small bullish candle.
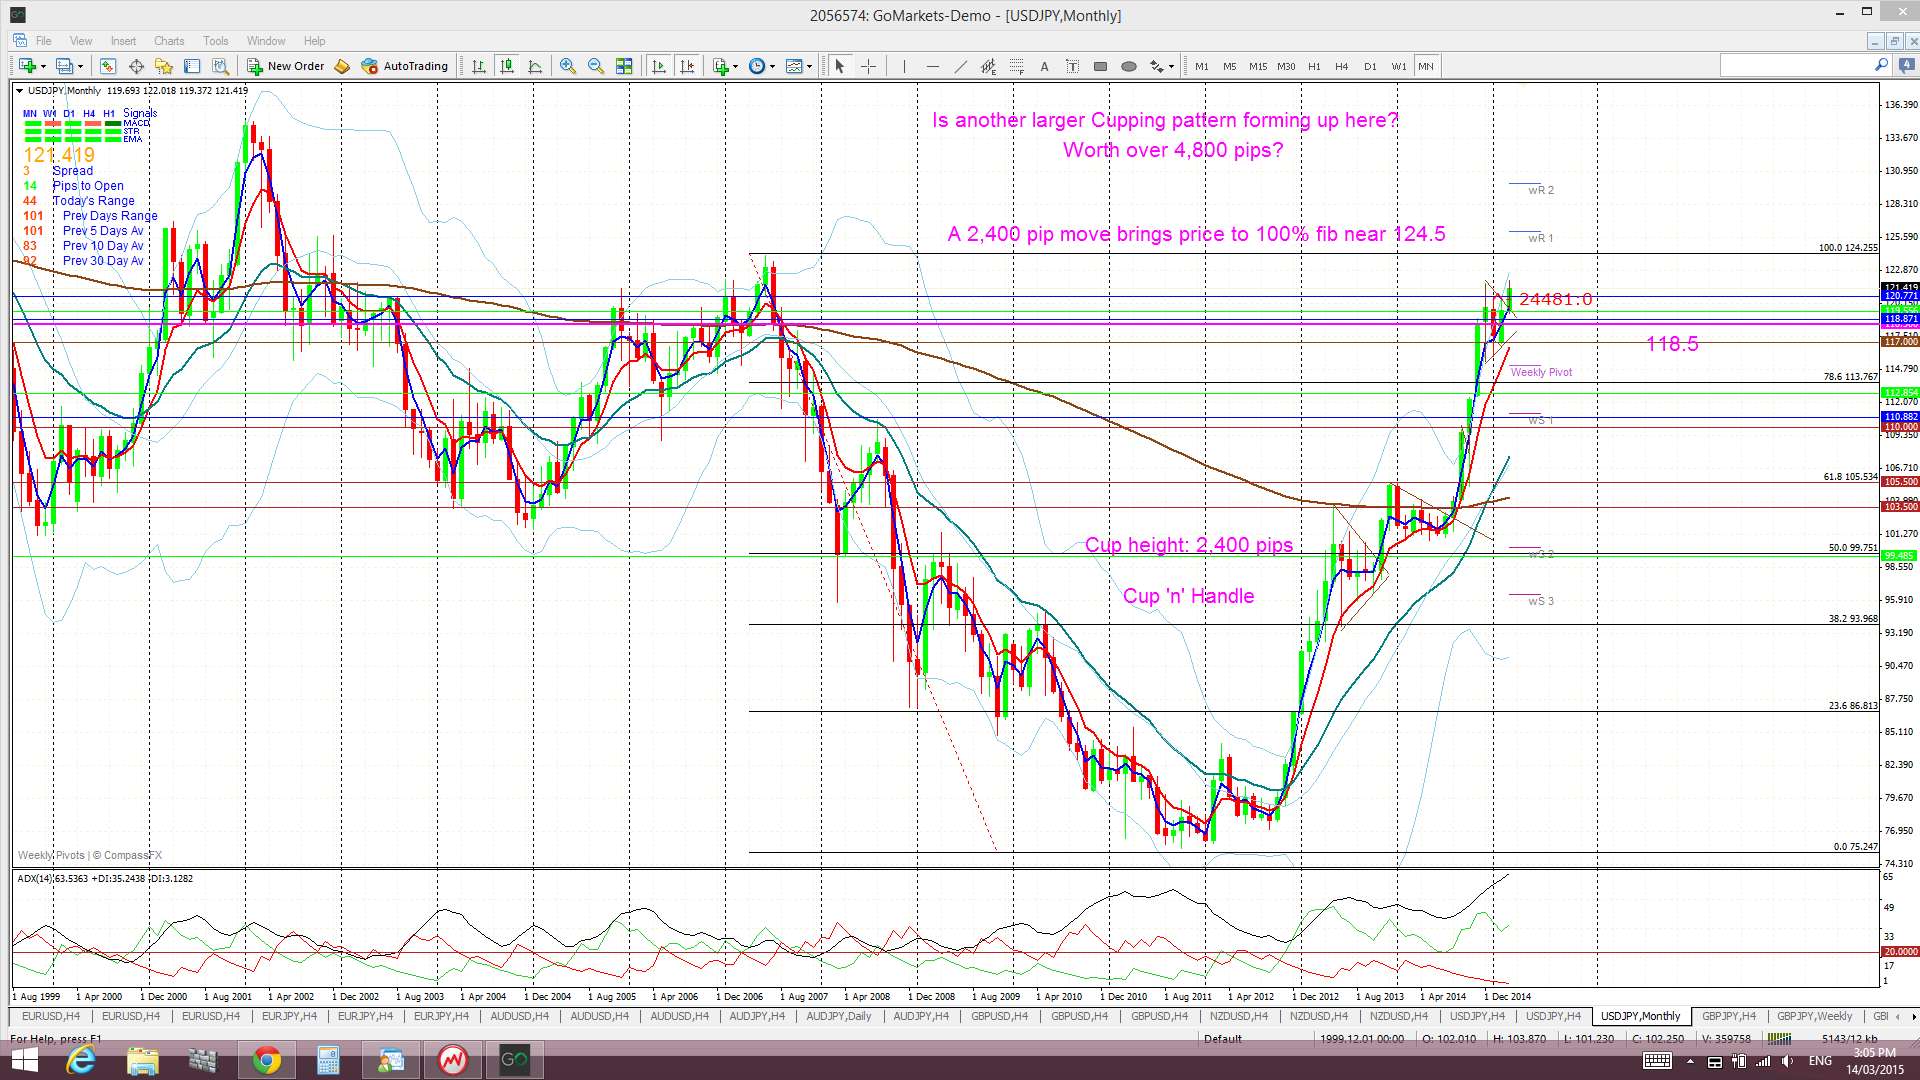
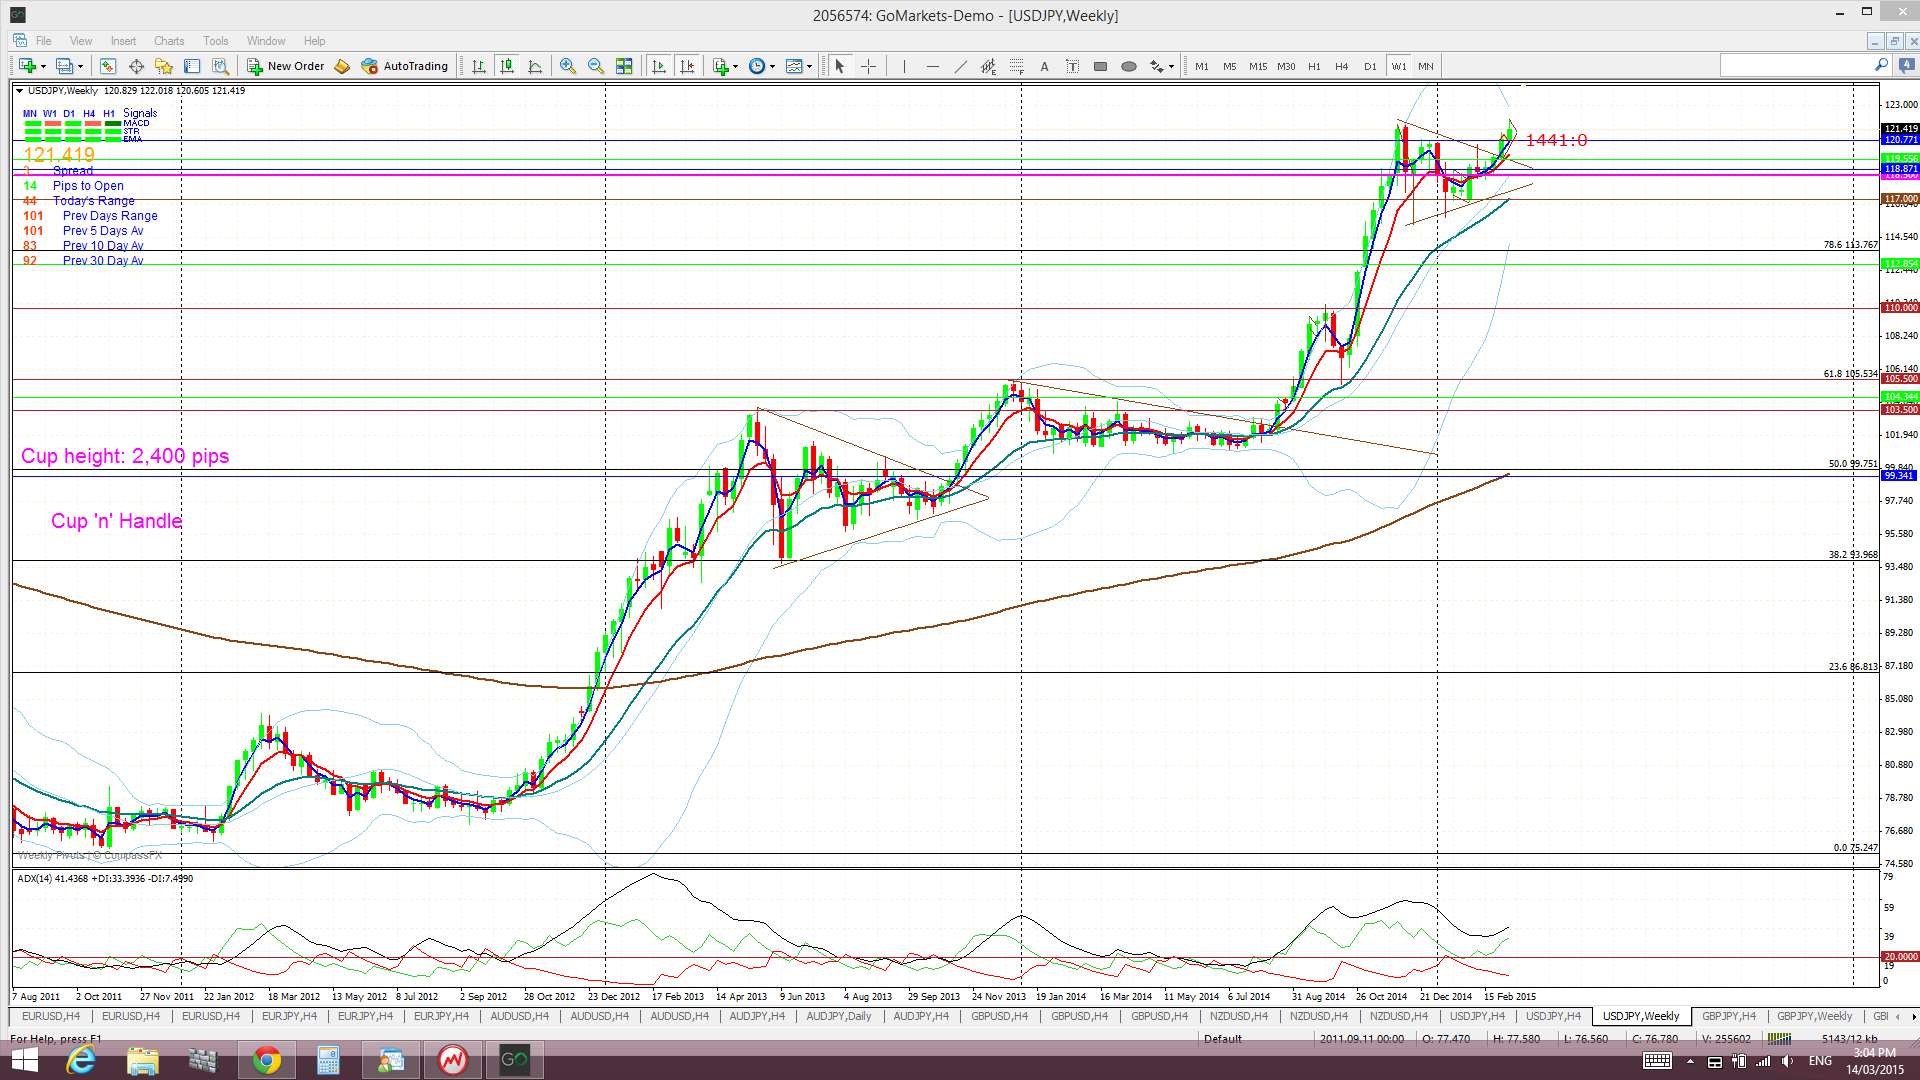
Weekly Chart Bullish Cup’ n’ Handle pattern: This pattern seems to have completed now just 200 pips short of the 2,400 pip target. The theory behind these patterns is that the height of the ‘Cup’ pattern is equivalent to the expected bullish move from the ‘handle’ breakout. The height of the Cup for the U/J weekly chart is around 2,400 pips. The interesting point here is that a 2,400 pip bullish move up from the ‘Handle’ would put price up near the 124 level. This level is the last major swing high for the U/J from back in 2007 and represents the 100% fib pullback for the move down in 2007 to the lows of 2012. This pattern has given up to 2,200 pips of the 2,400 pip target! Watch for another, larger Cup ‘n Handle forming up on the monthly chart worth a possible 4,800 pips though!
There are two key risk events here this week with BoJ Monetary Policy and FOMC.
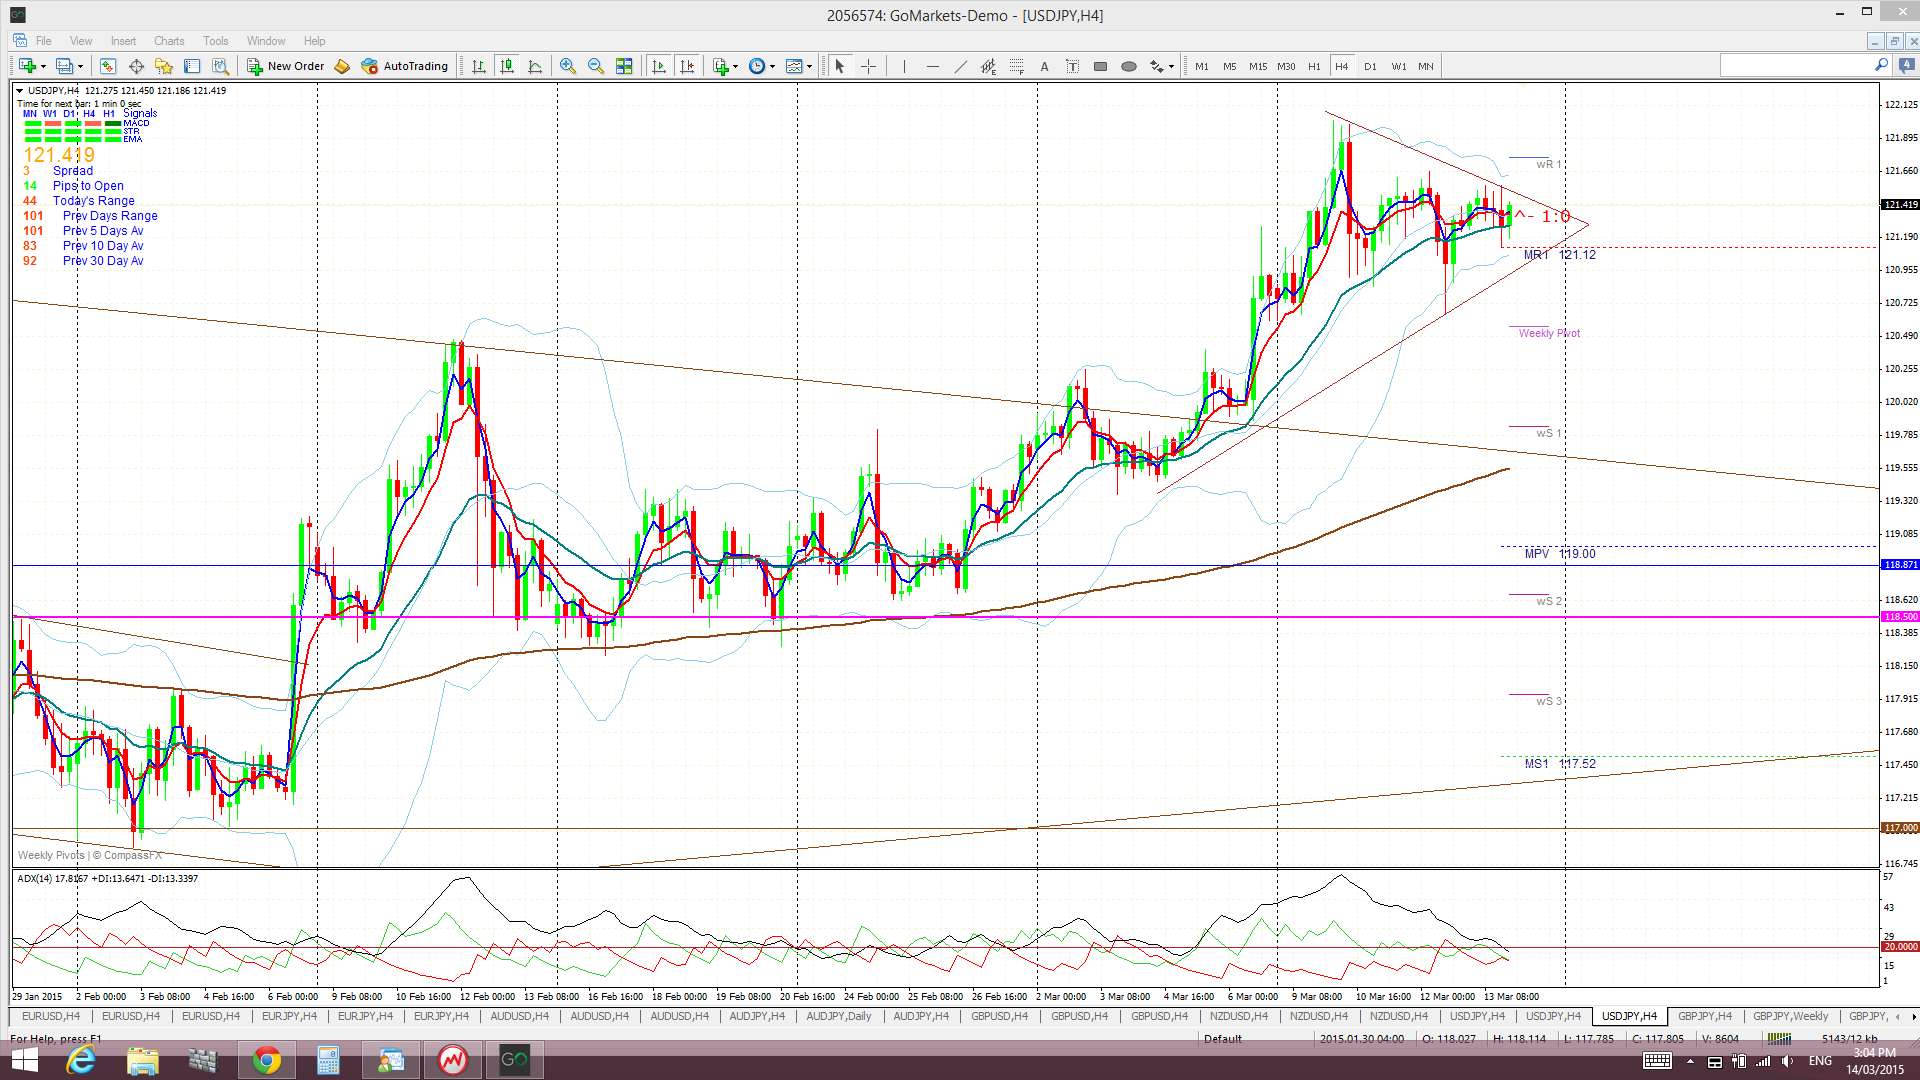
- I’m watching for any new TC signal on this pair and the 4hr chart triangle trend lines.
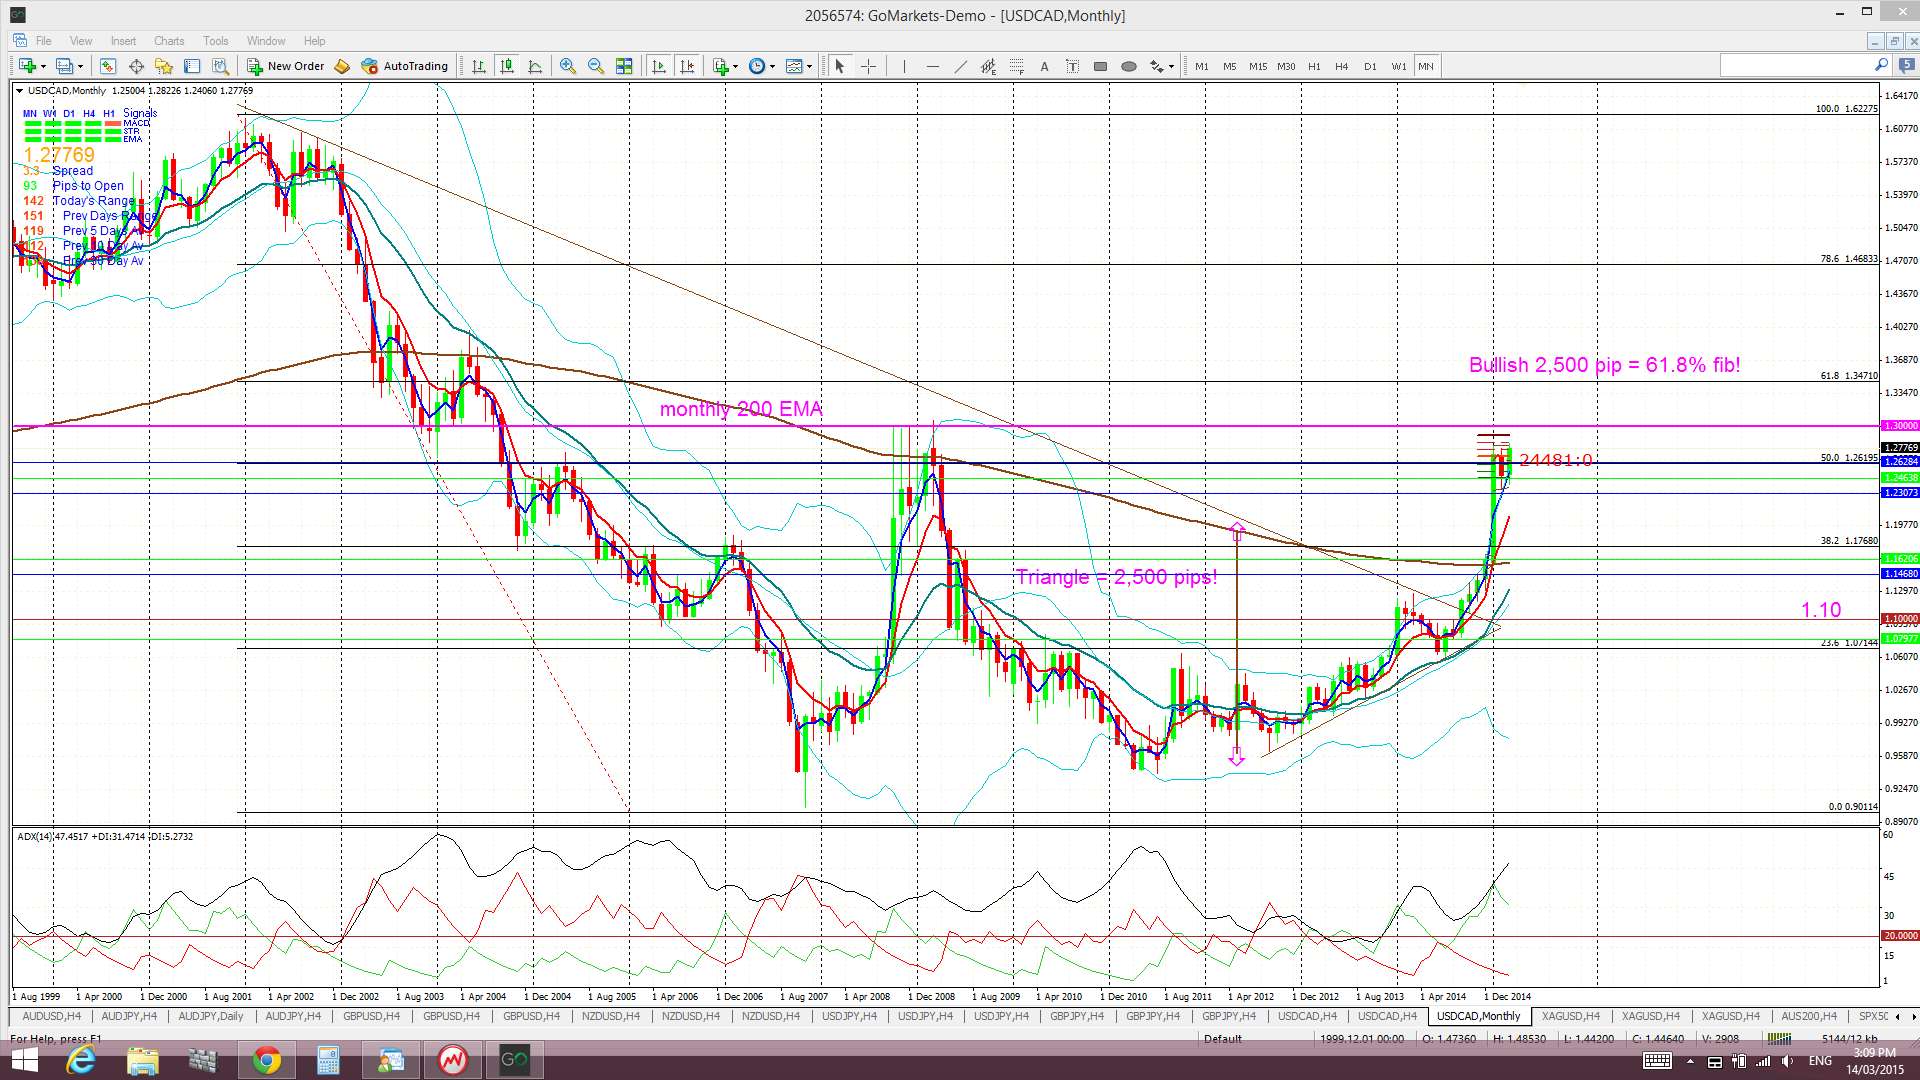
USD/CAD: The USD/CAD rallied up from a triangle breakout with new TC signal last week to give 180 pips. Price stalled at a recent ‘Double Top’ though but this may be helping to form up the ‘Handle of the monthly chart’s potential Cup ‘n’ Handle pattern.
Price continues holding above the monthly 200 EMA however and it is worth remembering that the last bullish monthly candle close above this level was back in February 2009, almost 6 years ago. This recent period marks the longest bullish hold by the Loonie above the monthly Cloud since 2002! Note the possible bullish Cup ‘n’ Handle forming up on the monthly chart though that is in addition to the bullish triangle breakout already in play.
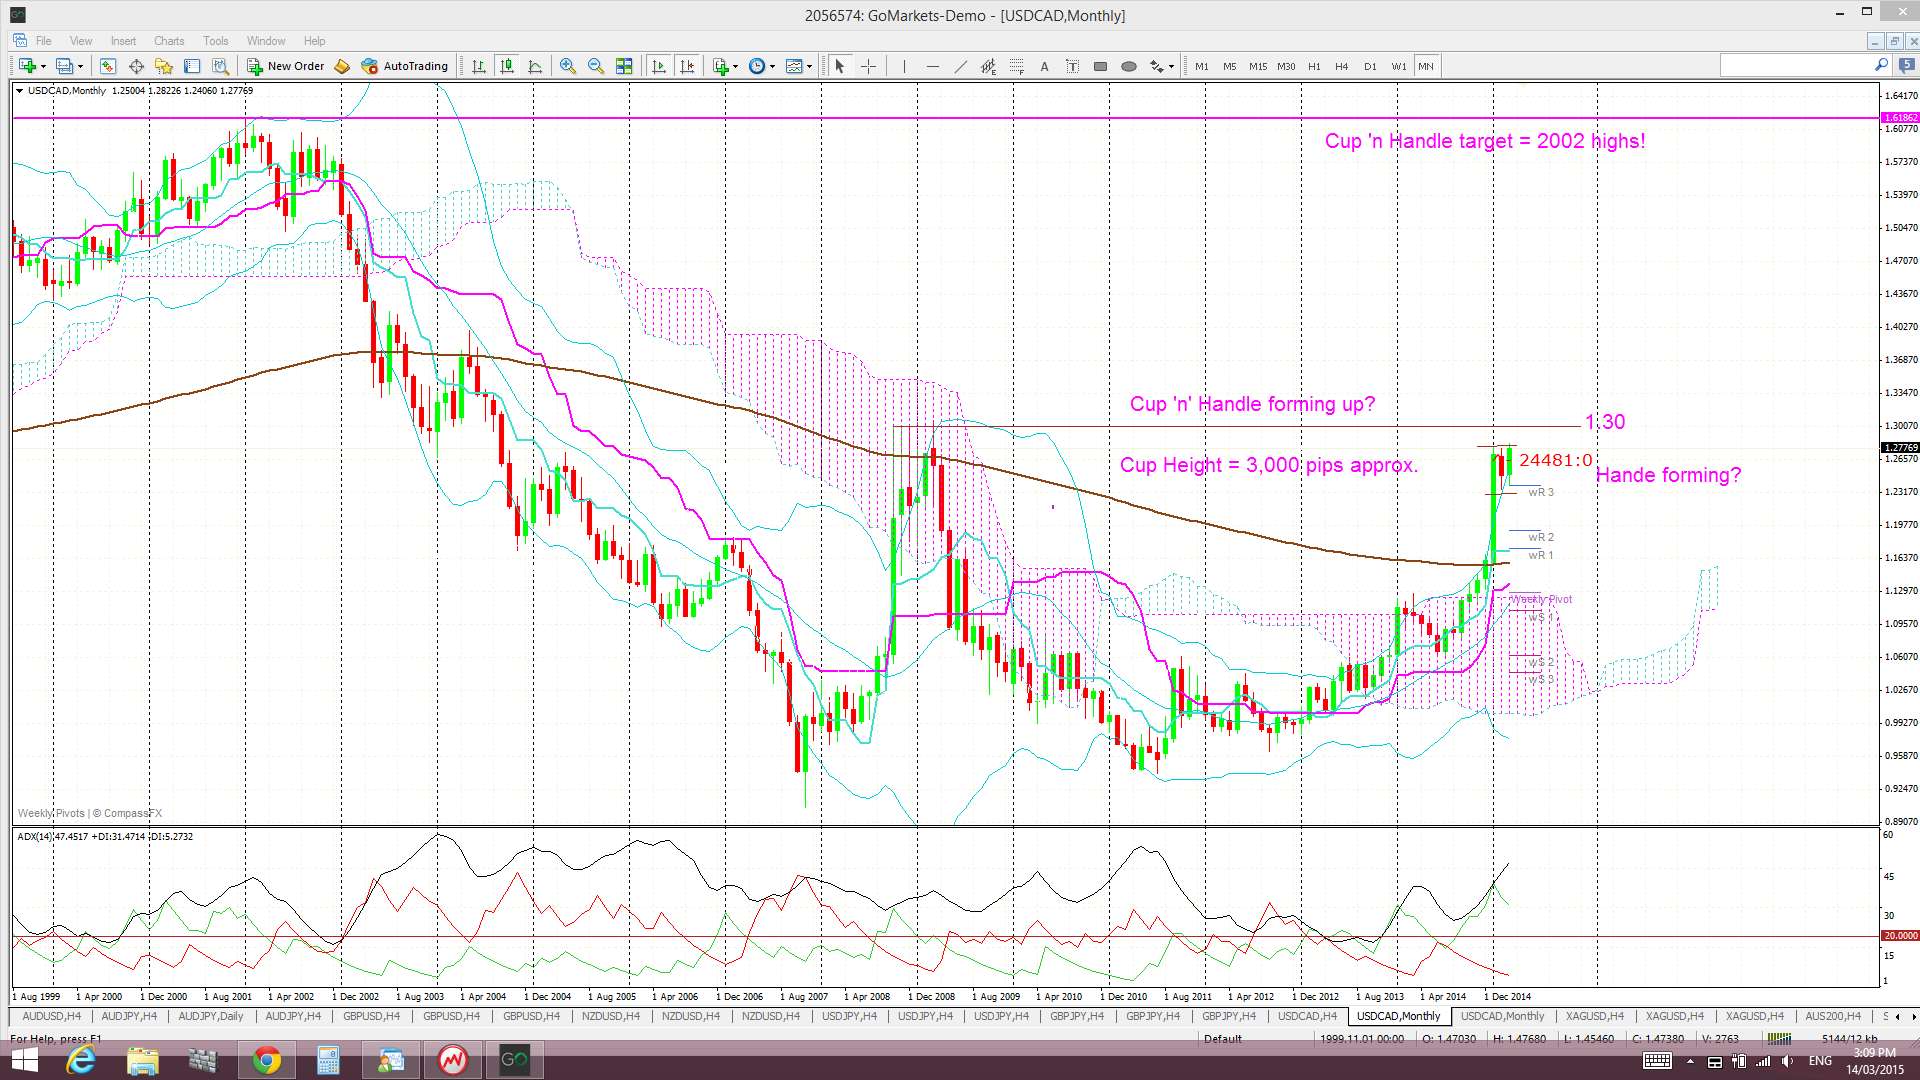
Triangle breakout target: The Loonie has already broken up and out from a major monthly chart triangle pattern that could deliver up to 2,500 pips. This 2,500 pip figure is evaluated from the height of the triangle. I have used the triangle height from the beginning of the bull trend line, as shown in the monthly chart below. The height of the triangle is around 2,500 pips and, thus, this would be the expected move from any breakout action. Extrapolating a bullish move from this triangle places price up at the 61.8% fib level. These fibs levels are popular targets in retracement moves and so this adds some confluence to this as a possible target. The bullish move has given up to 1,700 pips thus far.
Monthly Chart Cup ‘n’ Handle? The monthly chart now also shows a possible bullish Cup ‘n’ Handle pattern forming up. Price may yet rally up to the 1.30 level before any ‘Handle’ formation but the recent choppy action might be helping form a ‘Handle’. This is worth keeping an eye on as the pattern would be worth about 3,000 pips if it was to evolve as this is the height of the ‘Cup’. The interesting point is that the target for this pattern would put price up at the highs reached back in 2002 and this is equal to a 100% Fib retracement of the 2002-2007 bear move. Confluence!
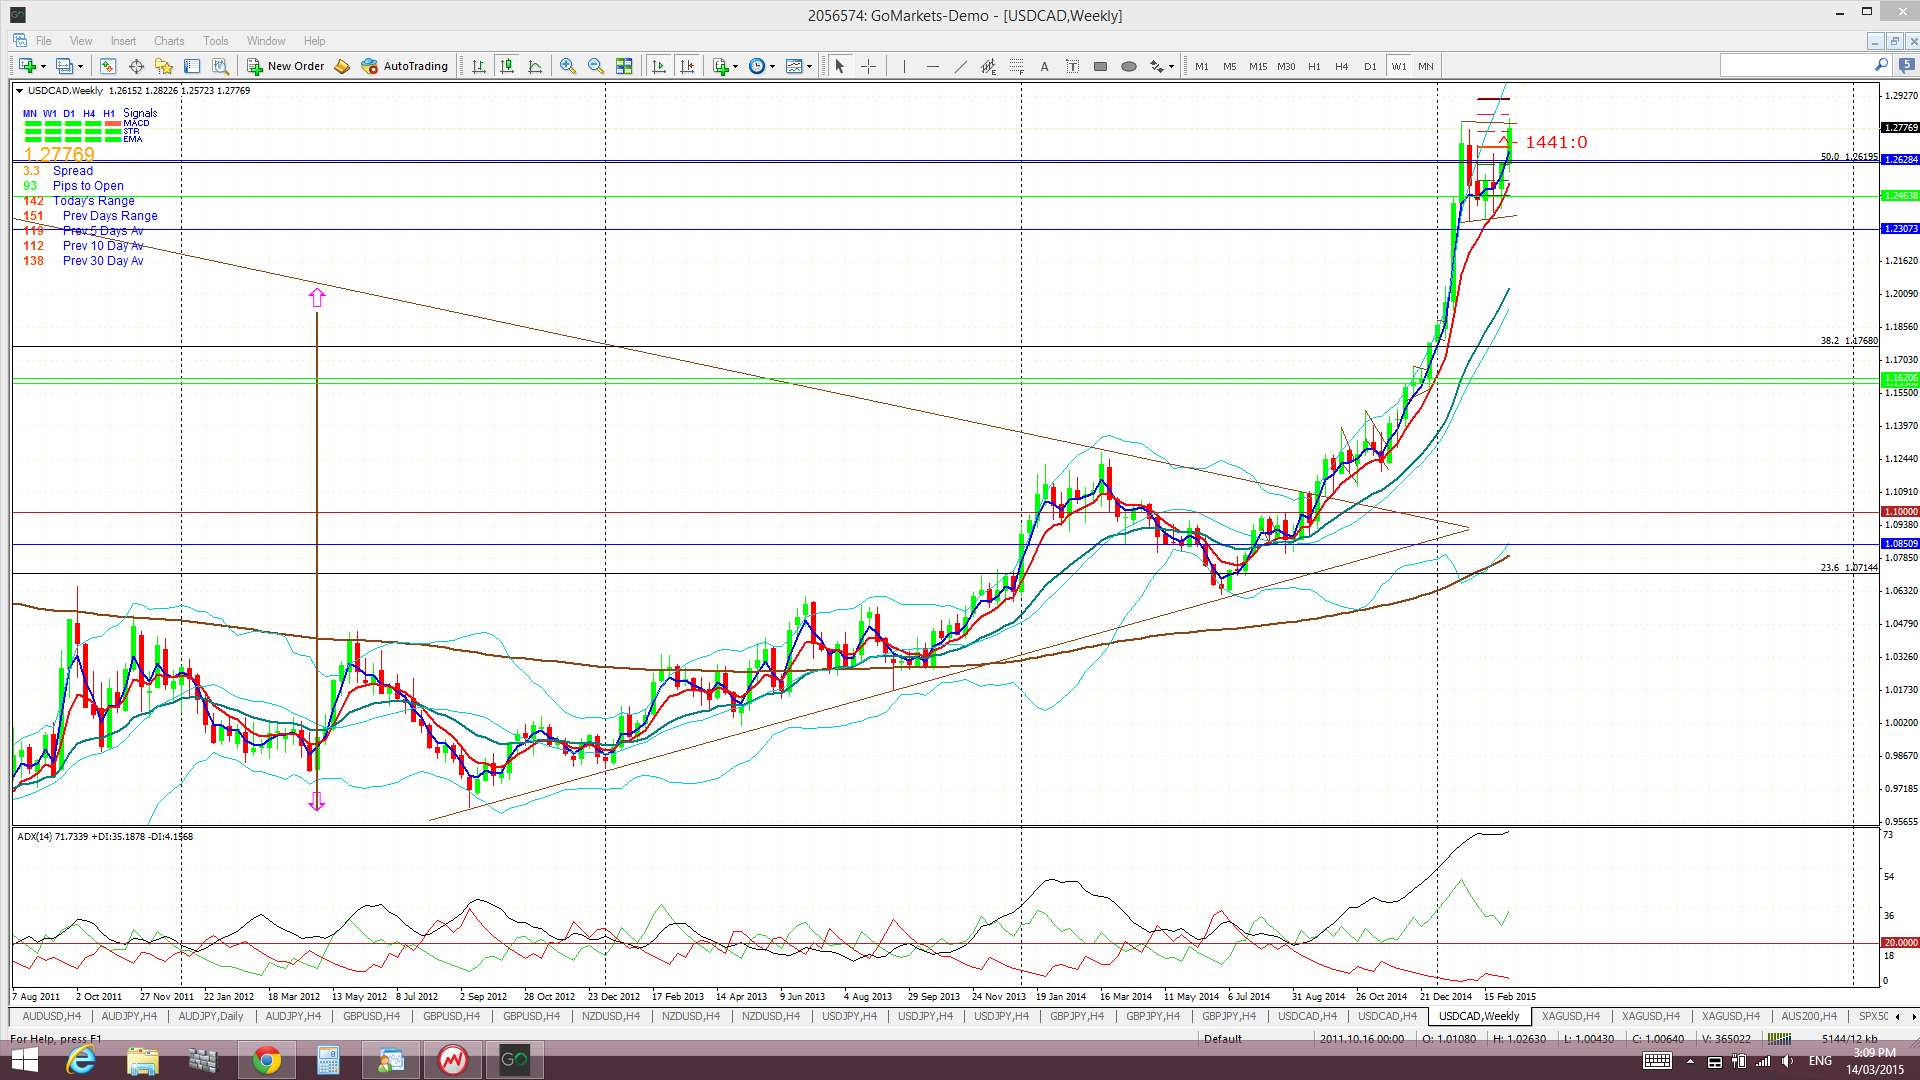
Price is still trading above the Cloud on the 4hr, daily, weekly and monthly charts.
The weekly candle closed as a bullish candle following last week’s bullish, almost ‘engulfing’, candle.
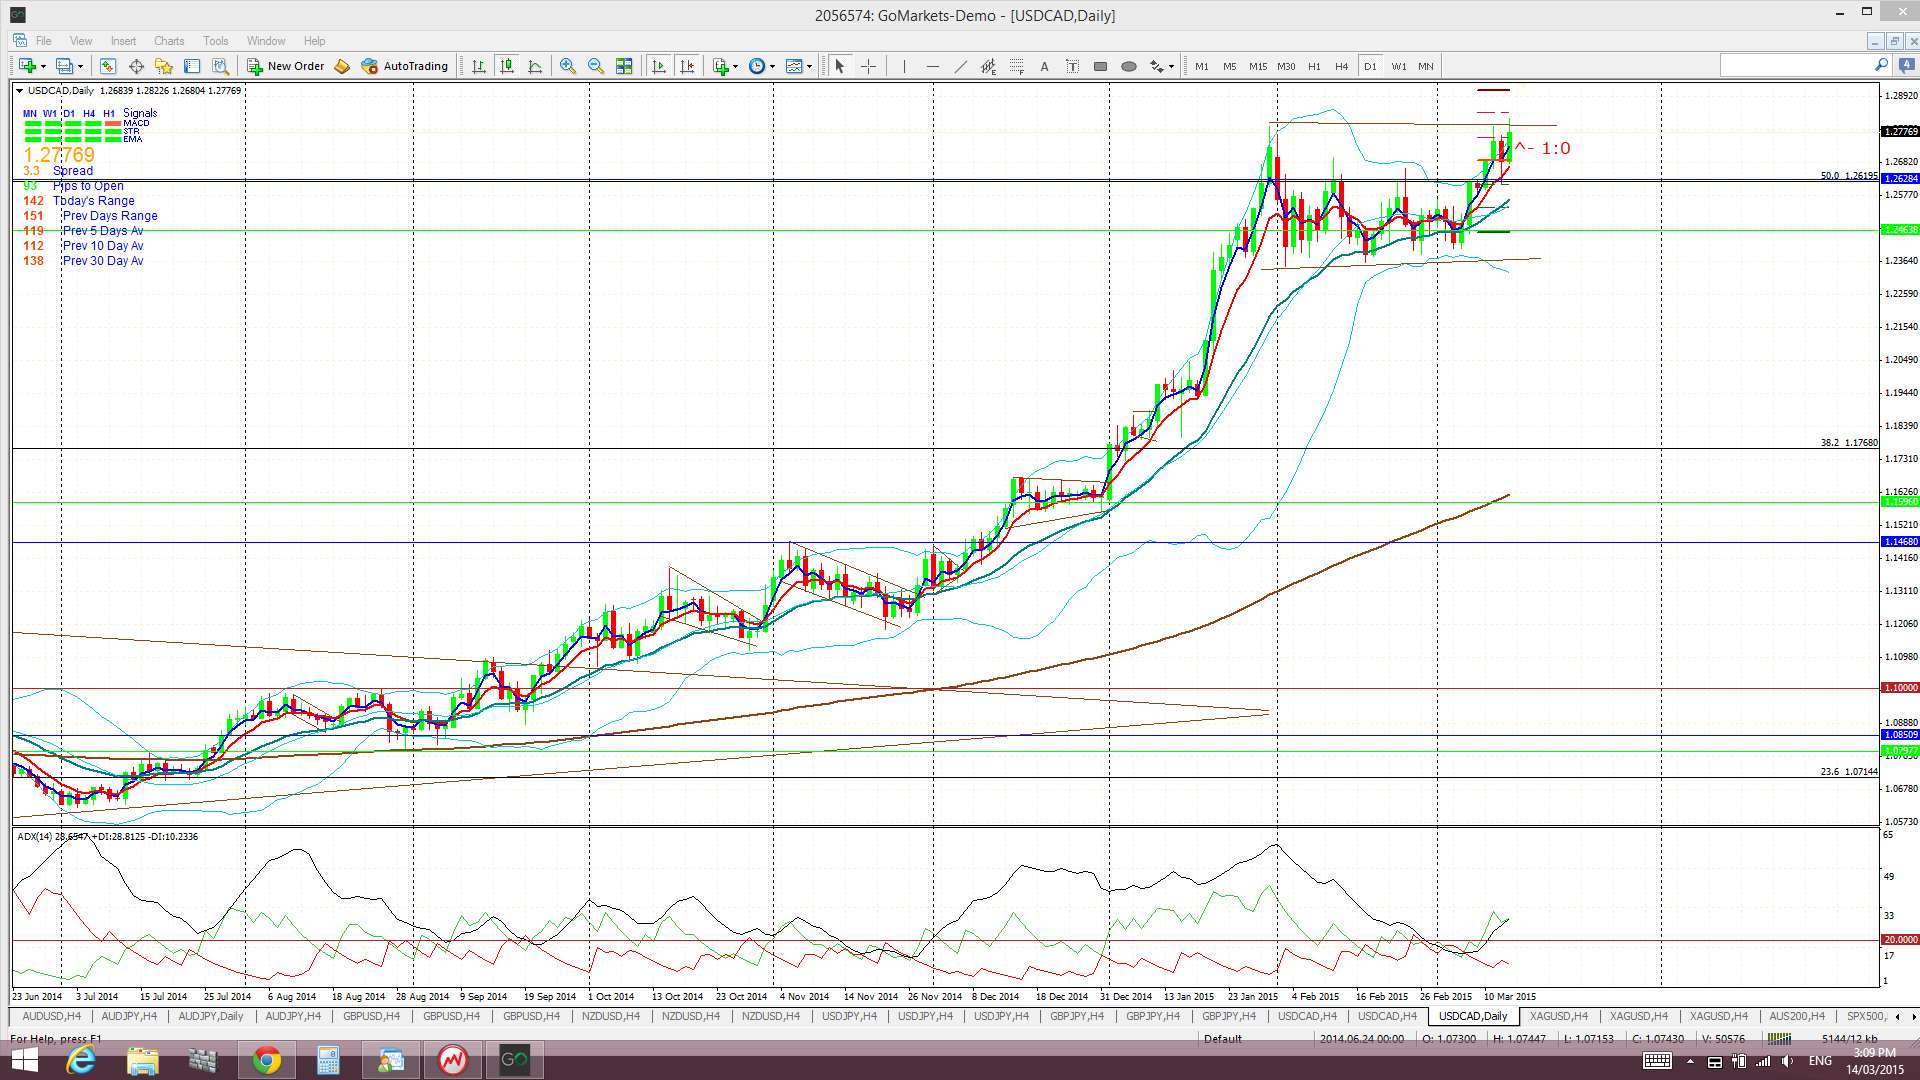
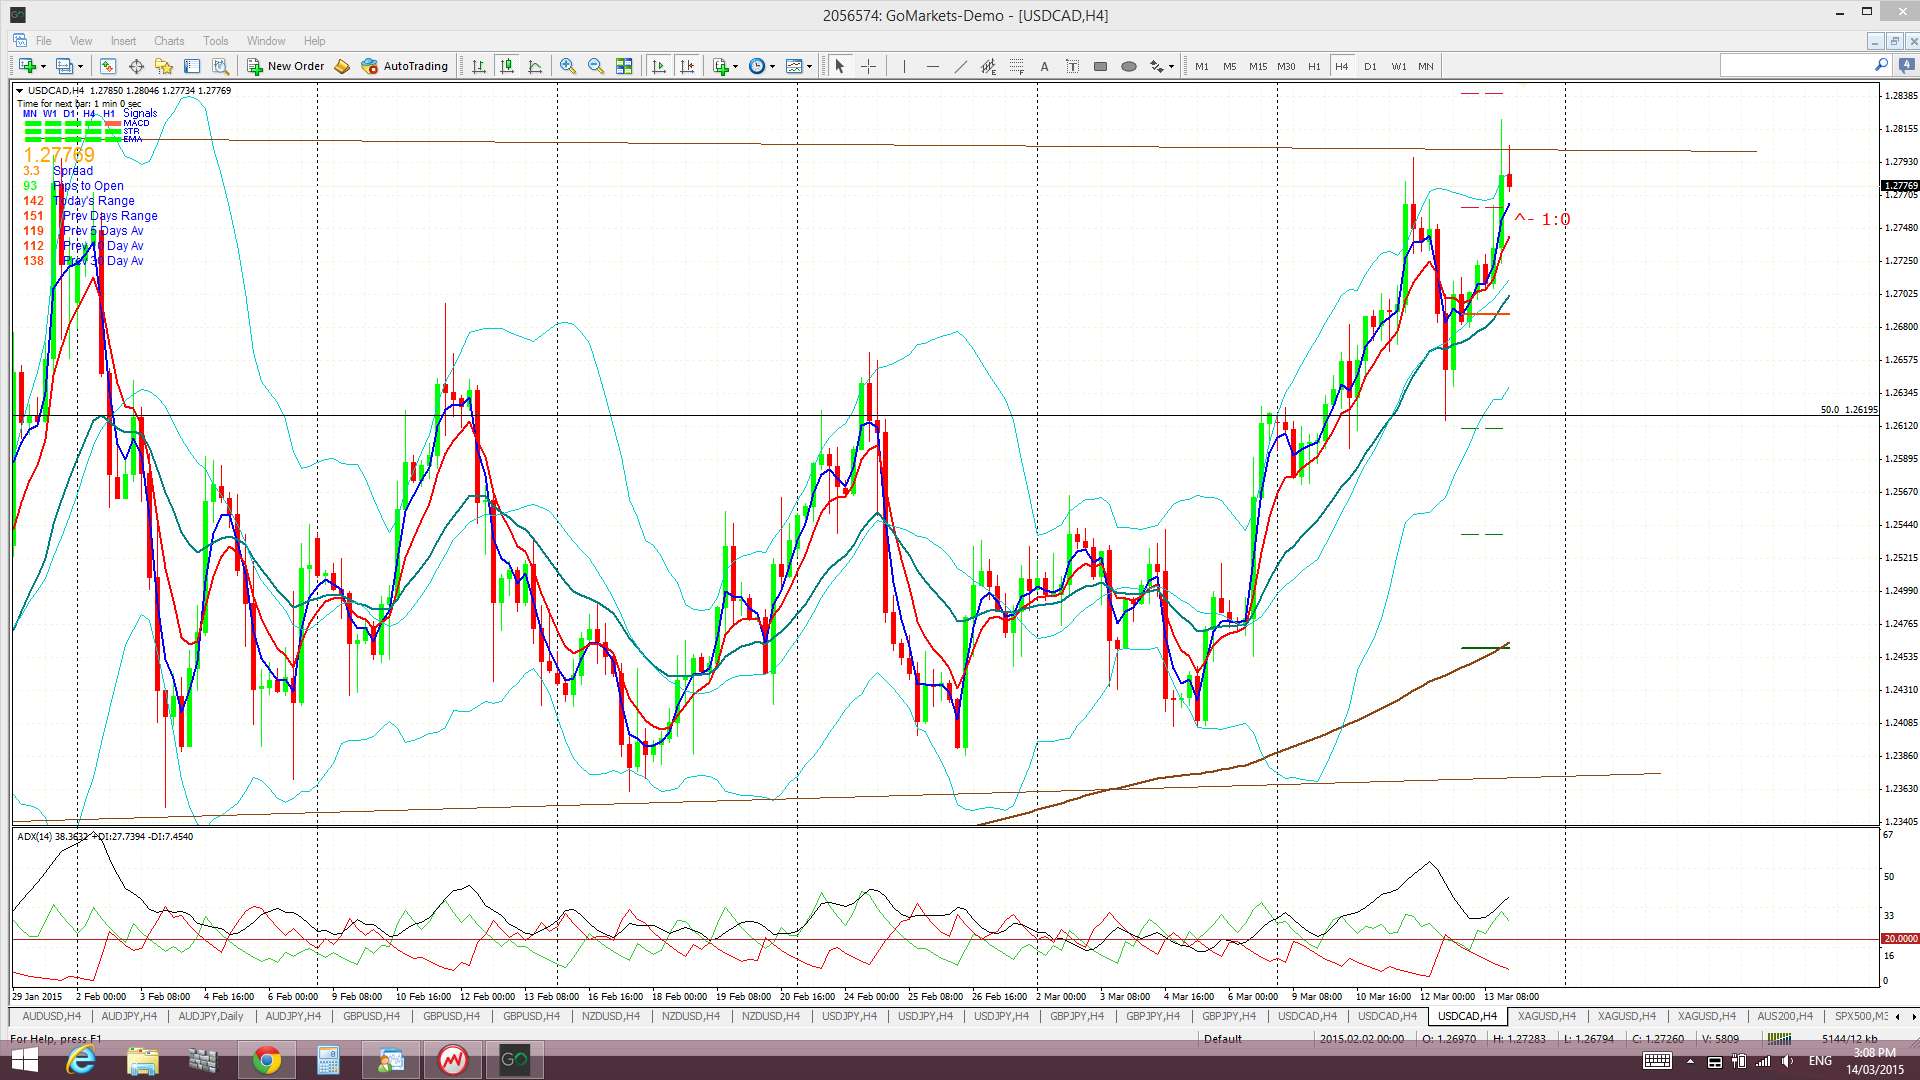
- I’m watching for any new TC signal on this pair and the wedge trend lines (daily/4hr chart).
Silver: Silver chopped lower to start last week as the USD rallied. It then found support just above the $15 level as the USD stalled near the 100 level. It managed to close the week above this $15 support despite Friday’s US$ rally.
Silver is still trading below the Ichimoku Cloud on the 4hr, daily weekly and monthly charts.
The weekly candle closed as a bearish candle following on from last week’s bearish, almost ‘engulfing’, candle.
FOMC is the main risk event for Silver this week. A strengthening US$ will most likely put pressure on the metal.
- I’m watching for any new TC signal and the $15 level.

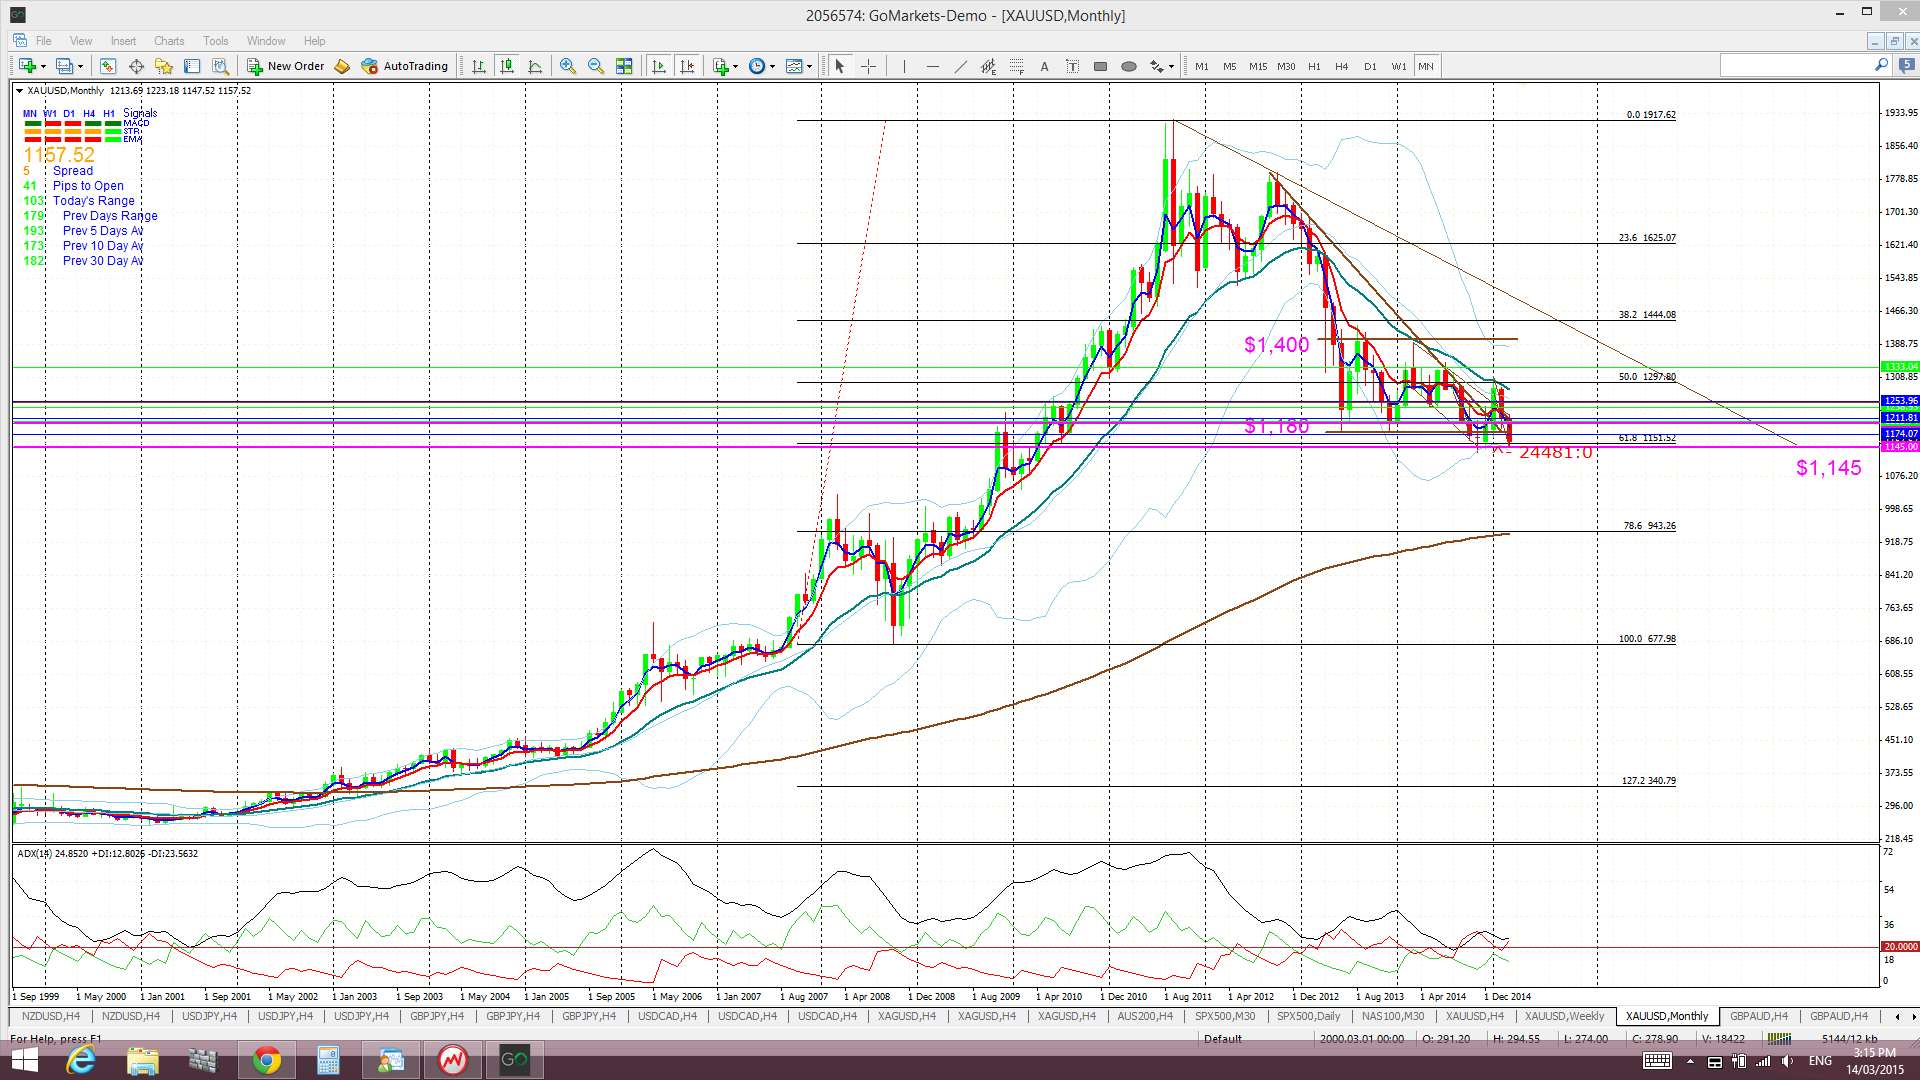
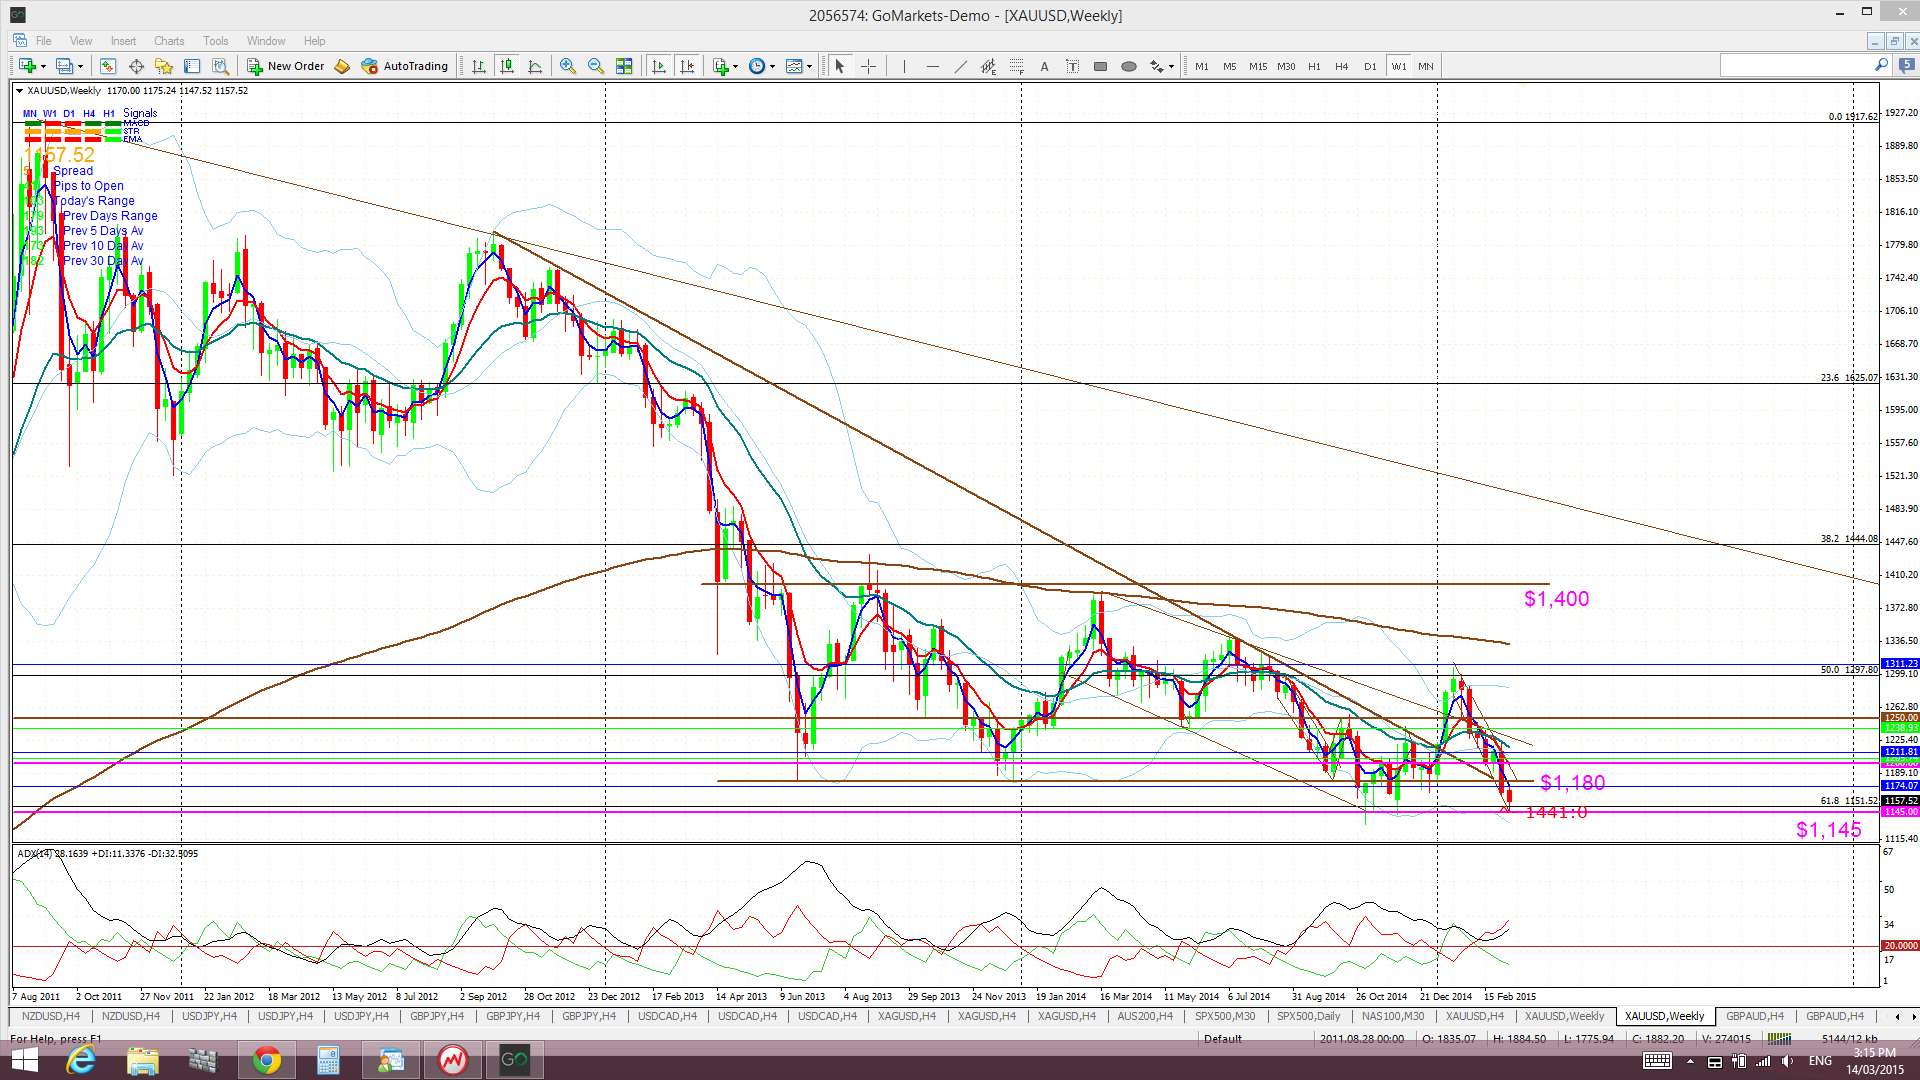
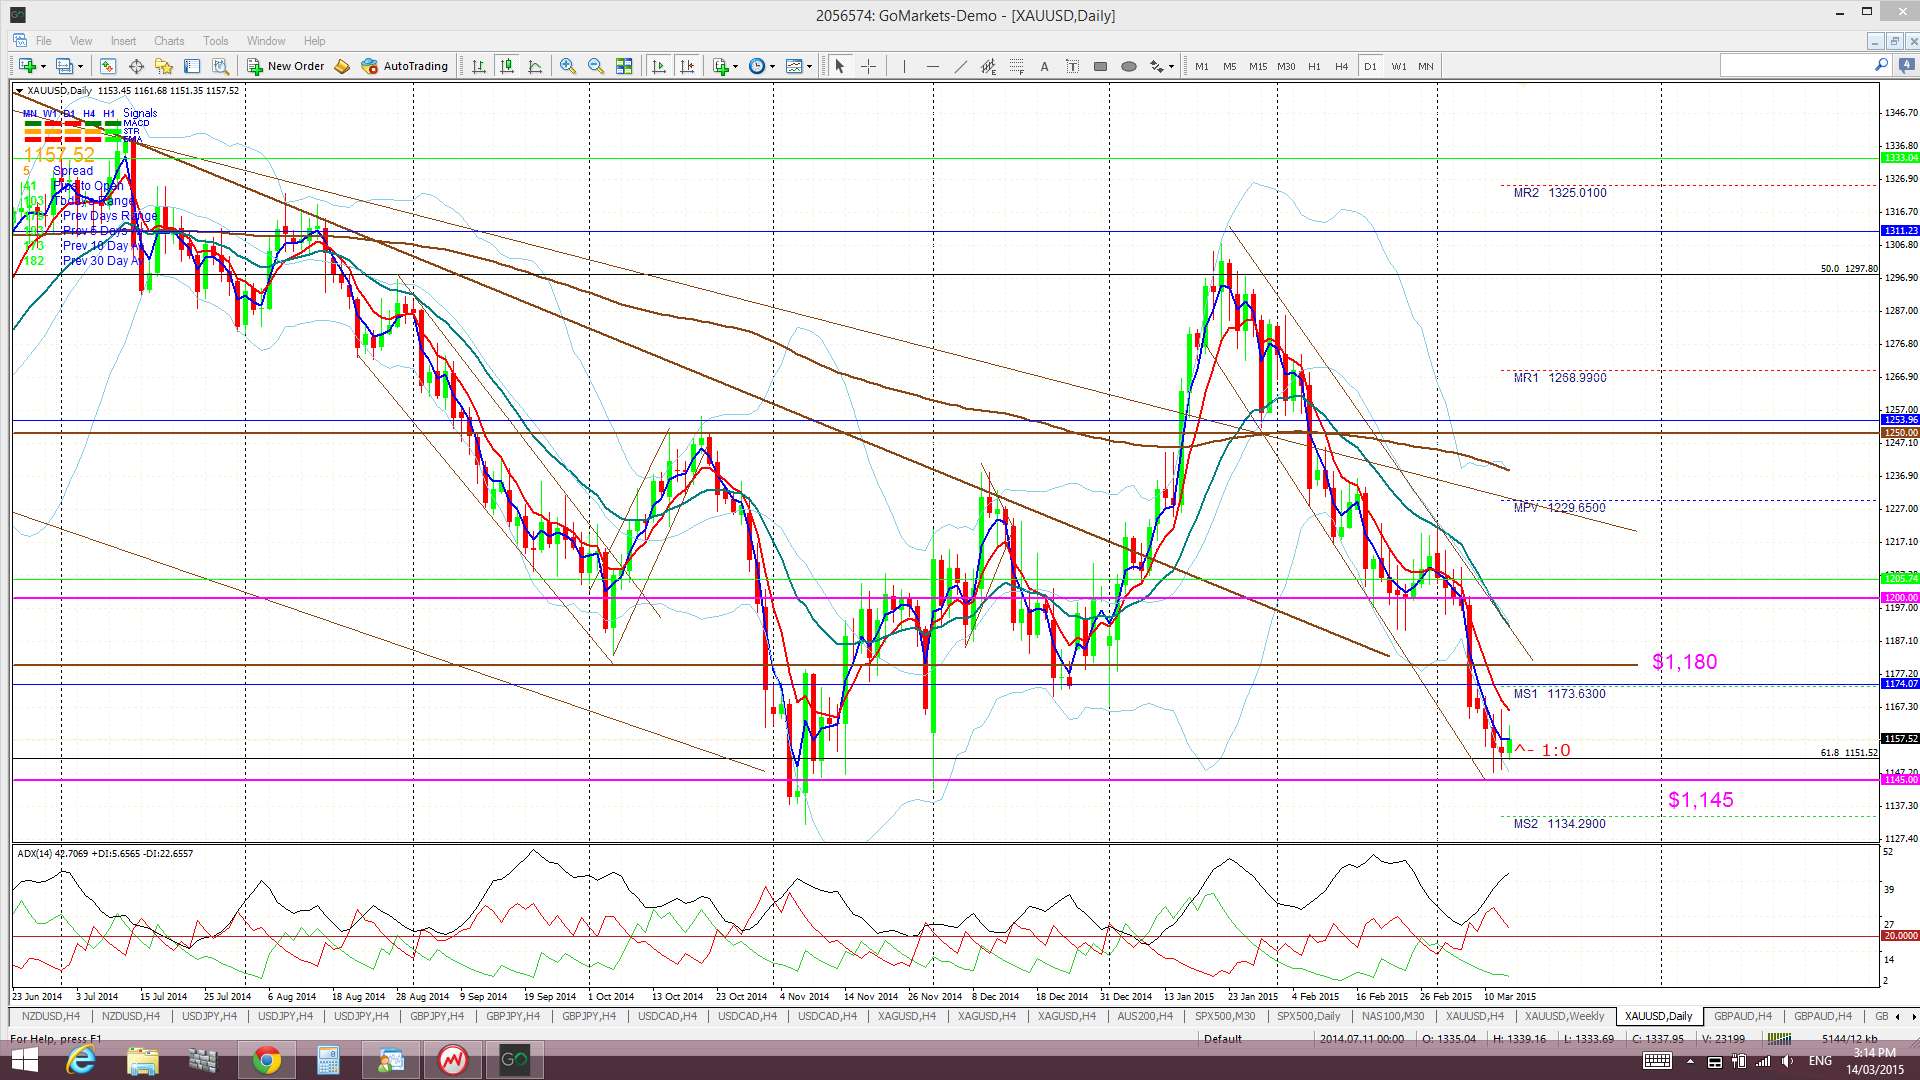
Gold: Gold also chopped lower to start last week but, as with Silver, found some support as the USD rally stalled. This support came from the key $1,150/45 level. This is a major S/R level as it is the 61.8% Fib retracement of the 2008-2011 bull run. Any new break and hold below $1,145 would suggest a deeper pull back. Bearish targets below $1,145 include the $1,000 psychological level and, then, the 78.6% fib near $950.
Gold is still trading below the Ichimoku Cloud on the 4hr, daily, weekly and monthly charts.
The weekly candle closed as a bearish candle following on from last week’s large bearish, almost ‘engulfing’ candle.
As for Silver, FOMC is the main risk event for Gold this week. A strengthening US$ will most likely put pressure on this metal too.
- I’m watching for any new TC signal and the $1,145 level.

The post Markets focused on US$ and FOMC. appeared first on www.forextell.com.