Last week: There were only 4 trend-line breakout trades on FX pairs and one on each of Oil and the FTSE but the pip tally from just these was over 4,000! However, three were aligned due to the big moves on the GBP and one was due to the exotic ‘bolter’, the USD/MXN. Price action slowed towards the end of last week in the lead up to this weekend’s French Elections and many stock and currency pairs seem to be marking time but this, at least, has resulted in the formation of more consolidation patterns giving traders further trend-lines to watch in the week ahead.
Successful breakout trades: were noted during the week on the following:
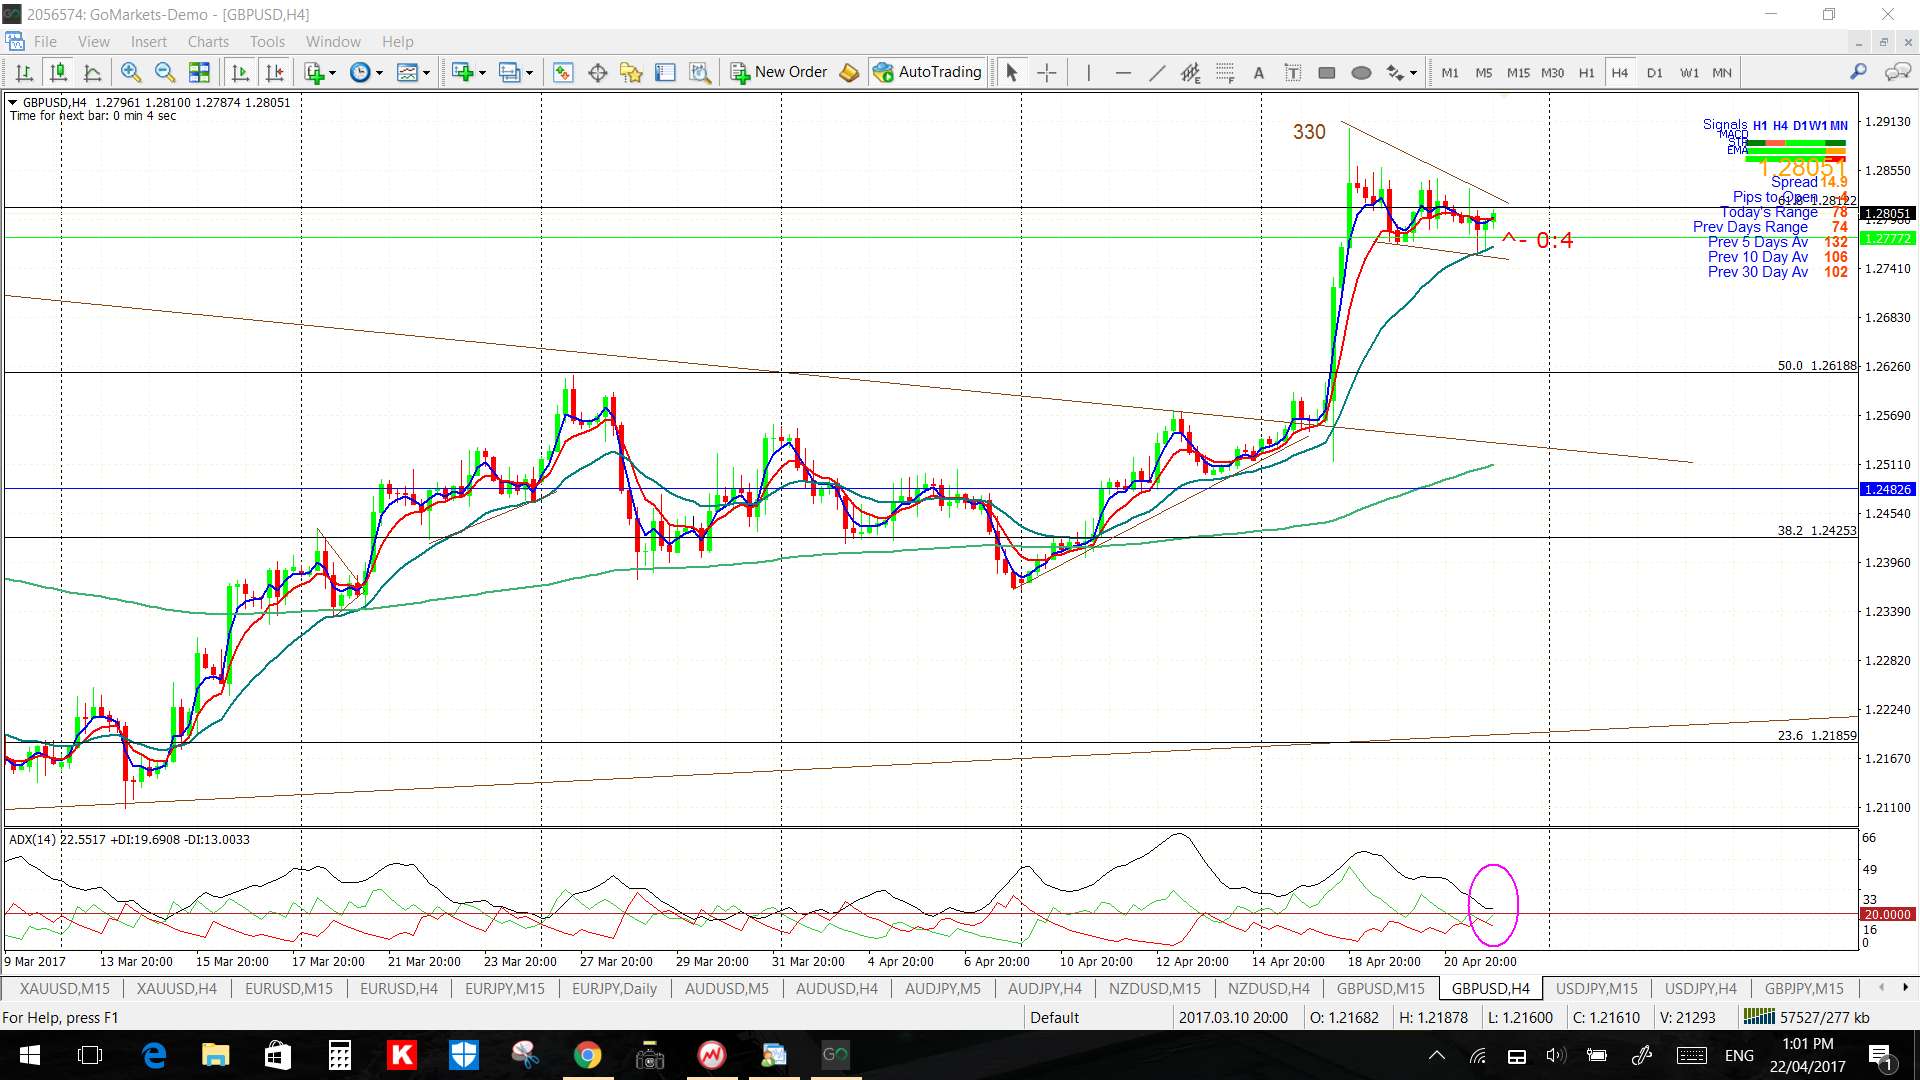
- GBP/USD: 330 pips.
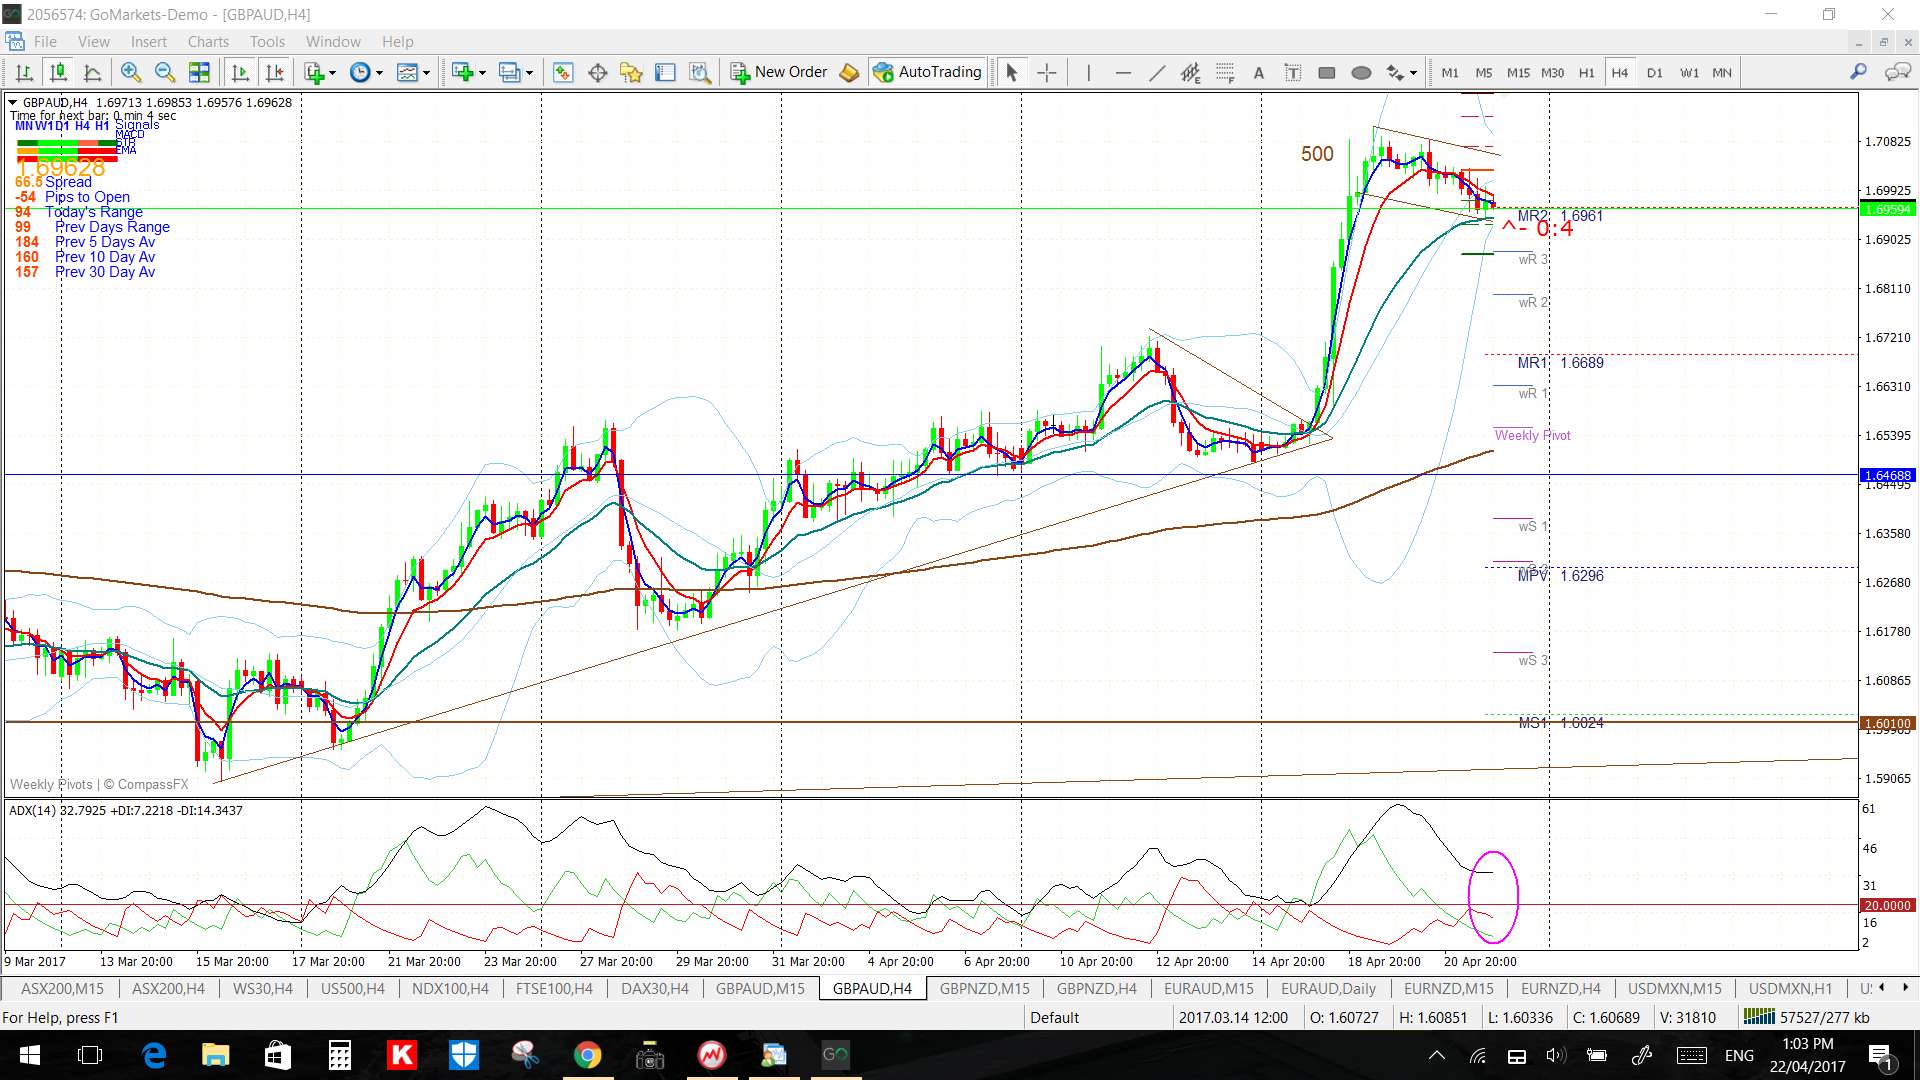
- GBP/AUD: 500 pips.
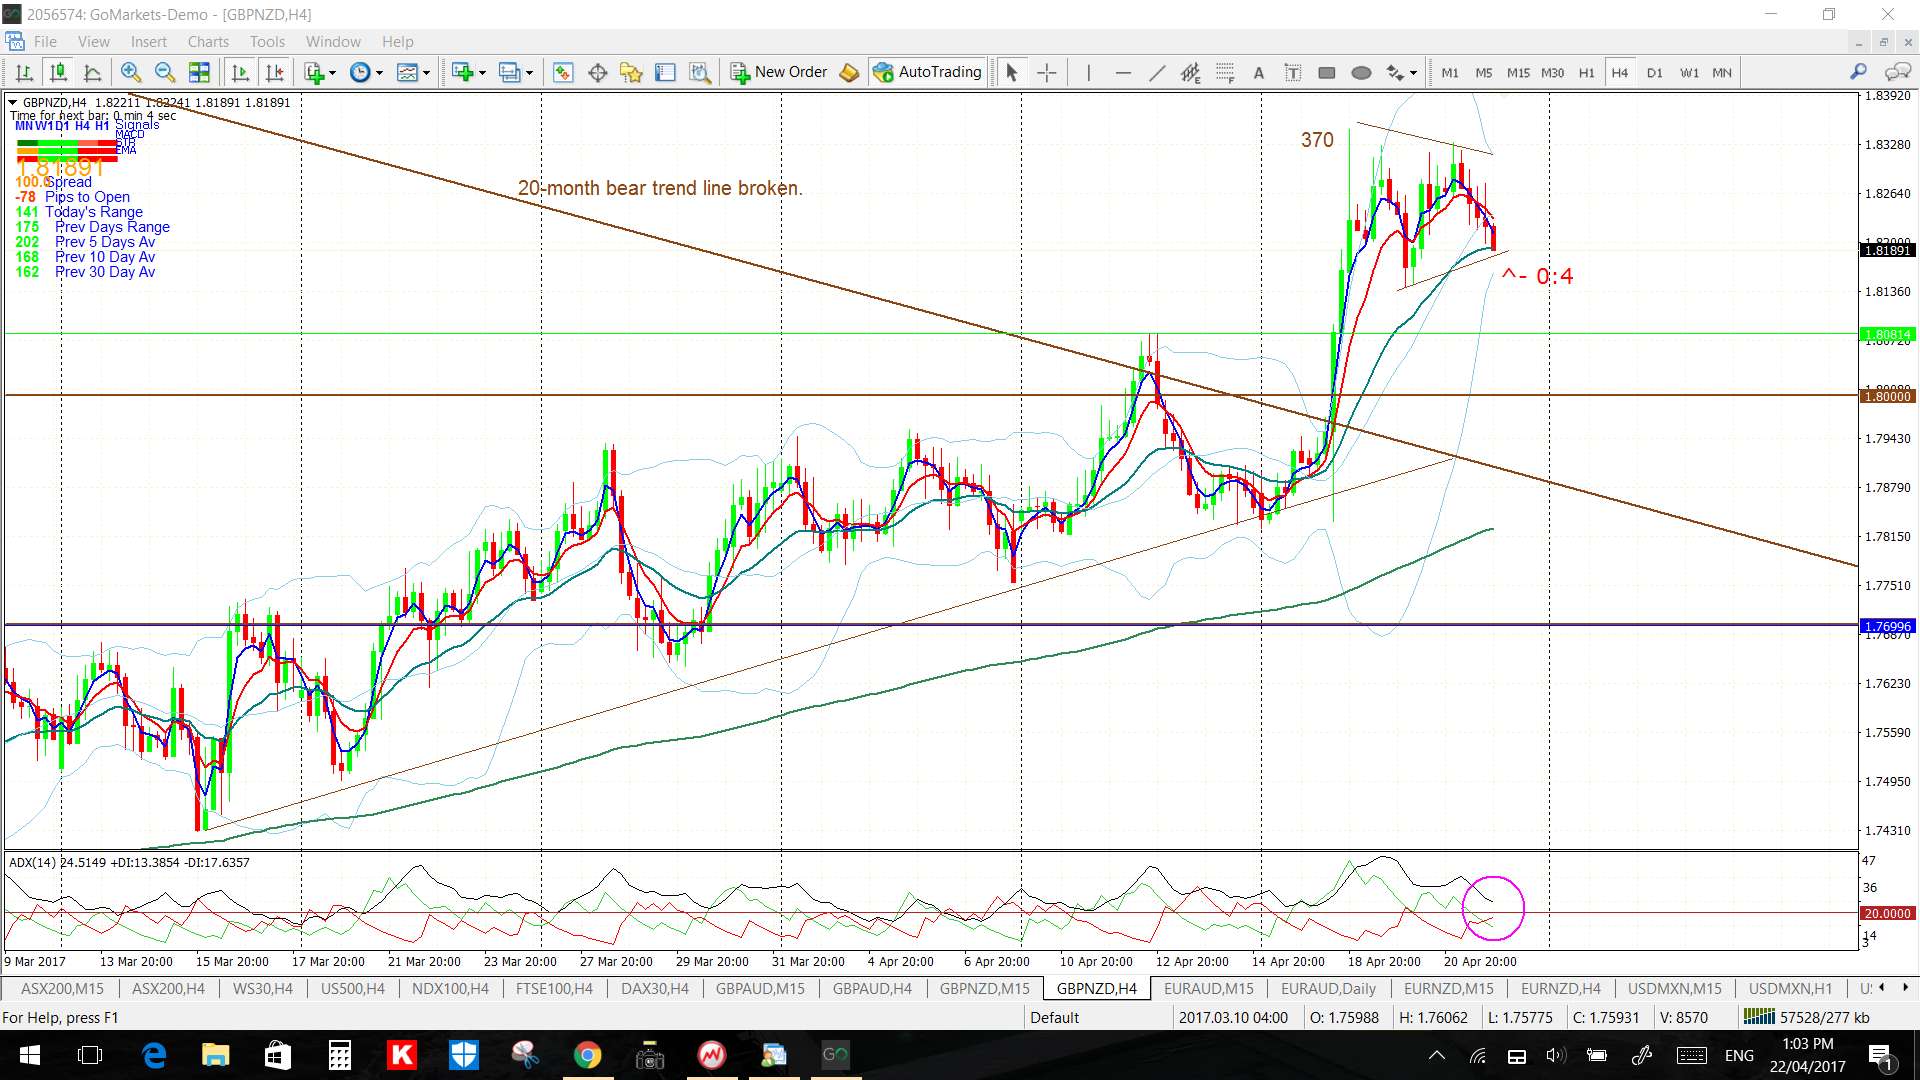
- GBP/NZD: 370 pips.
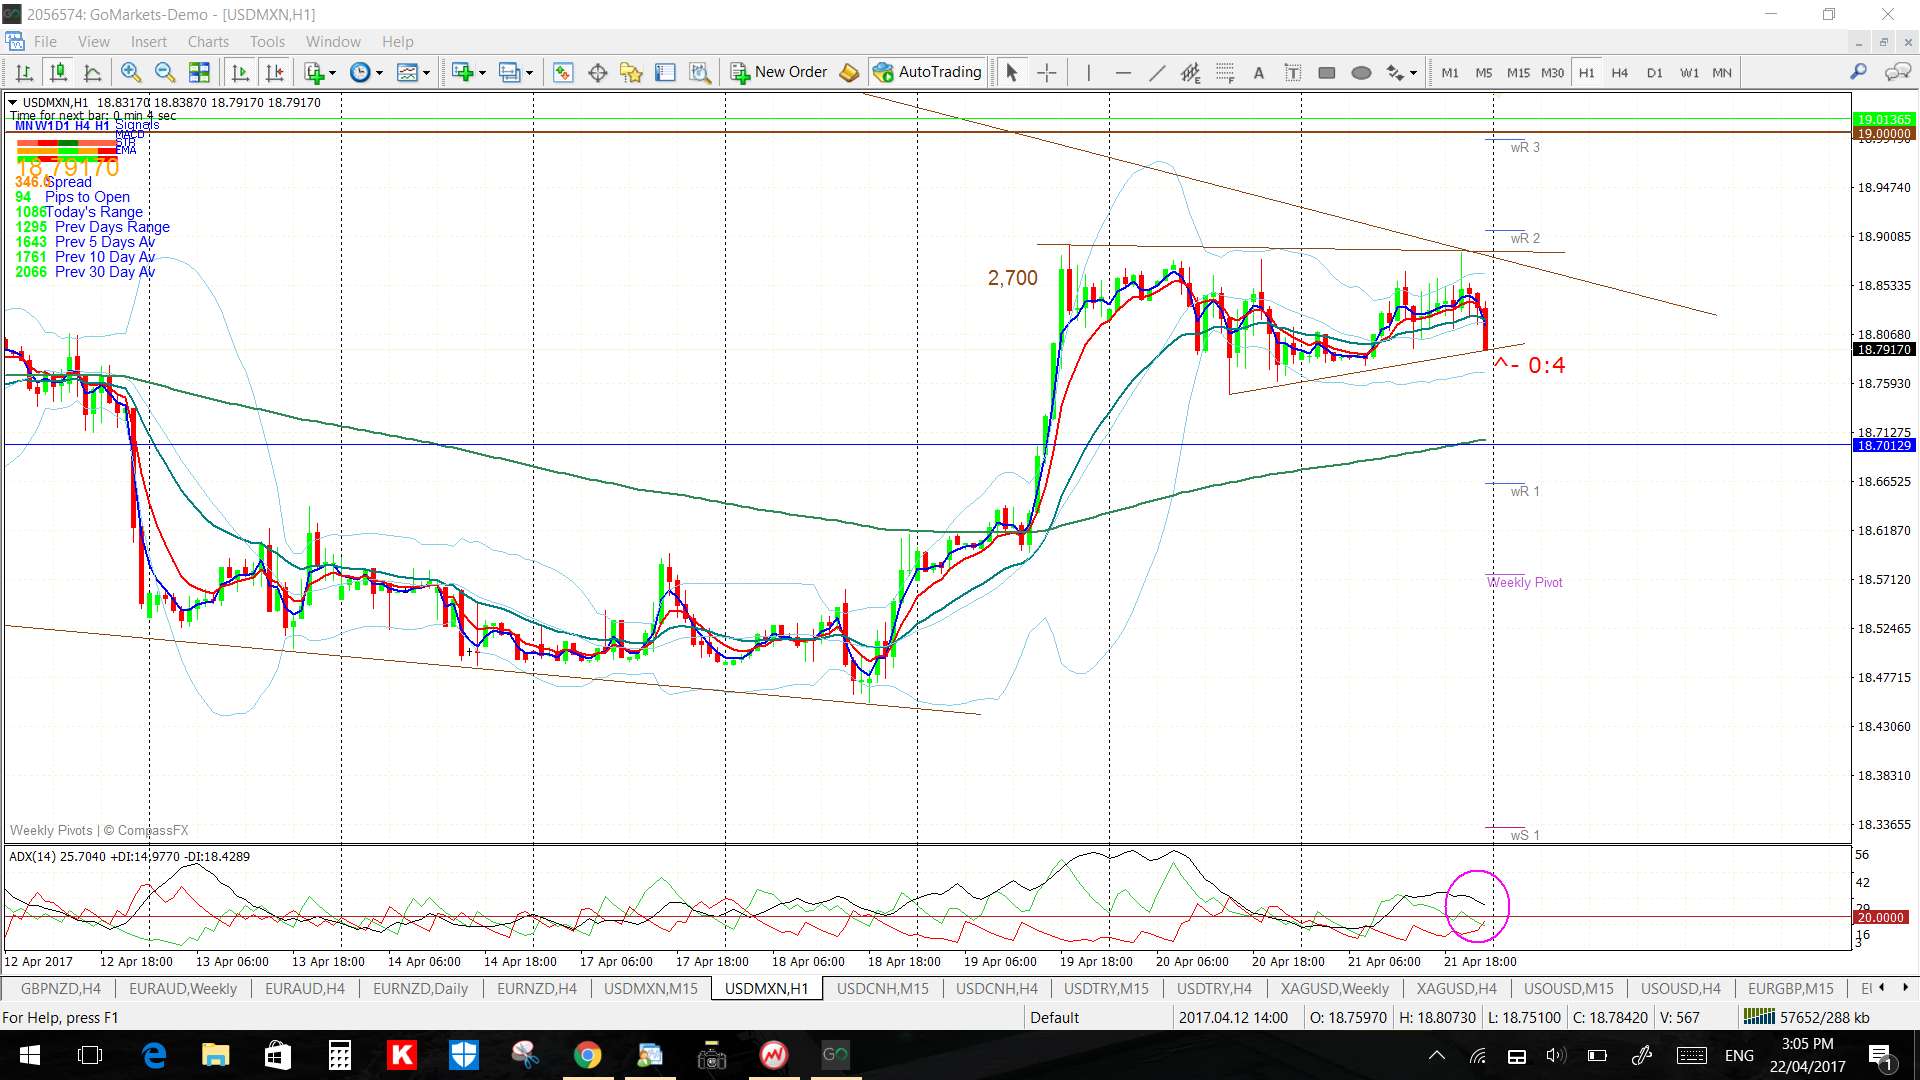
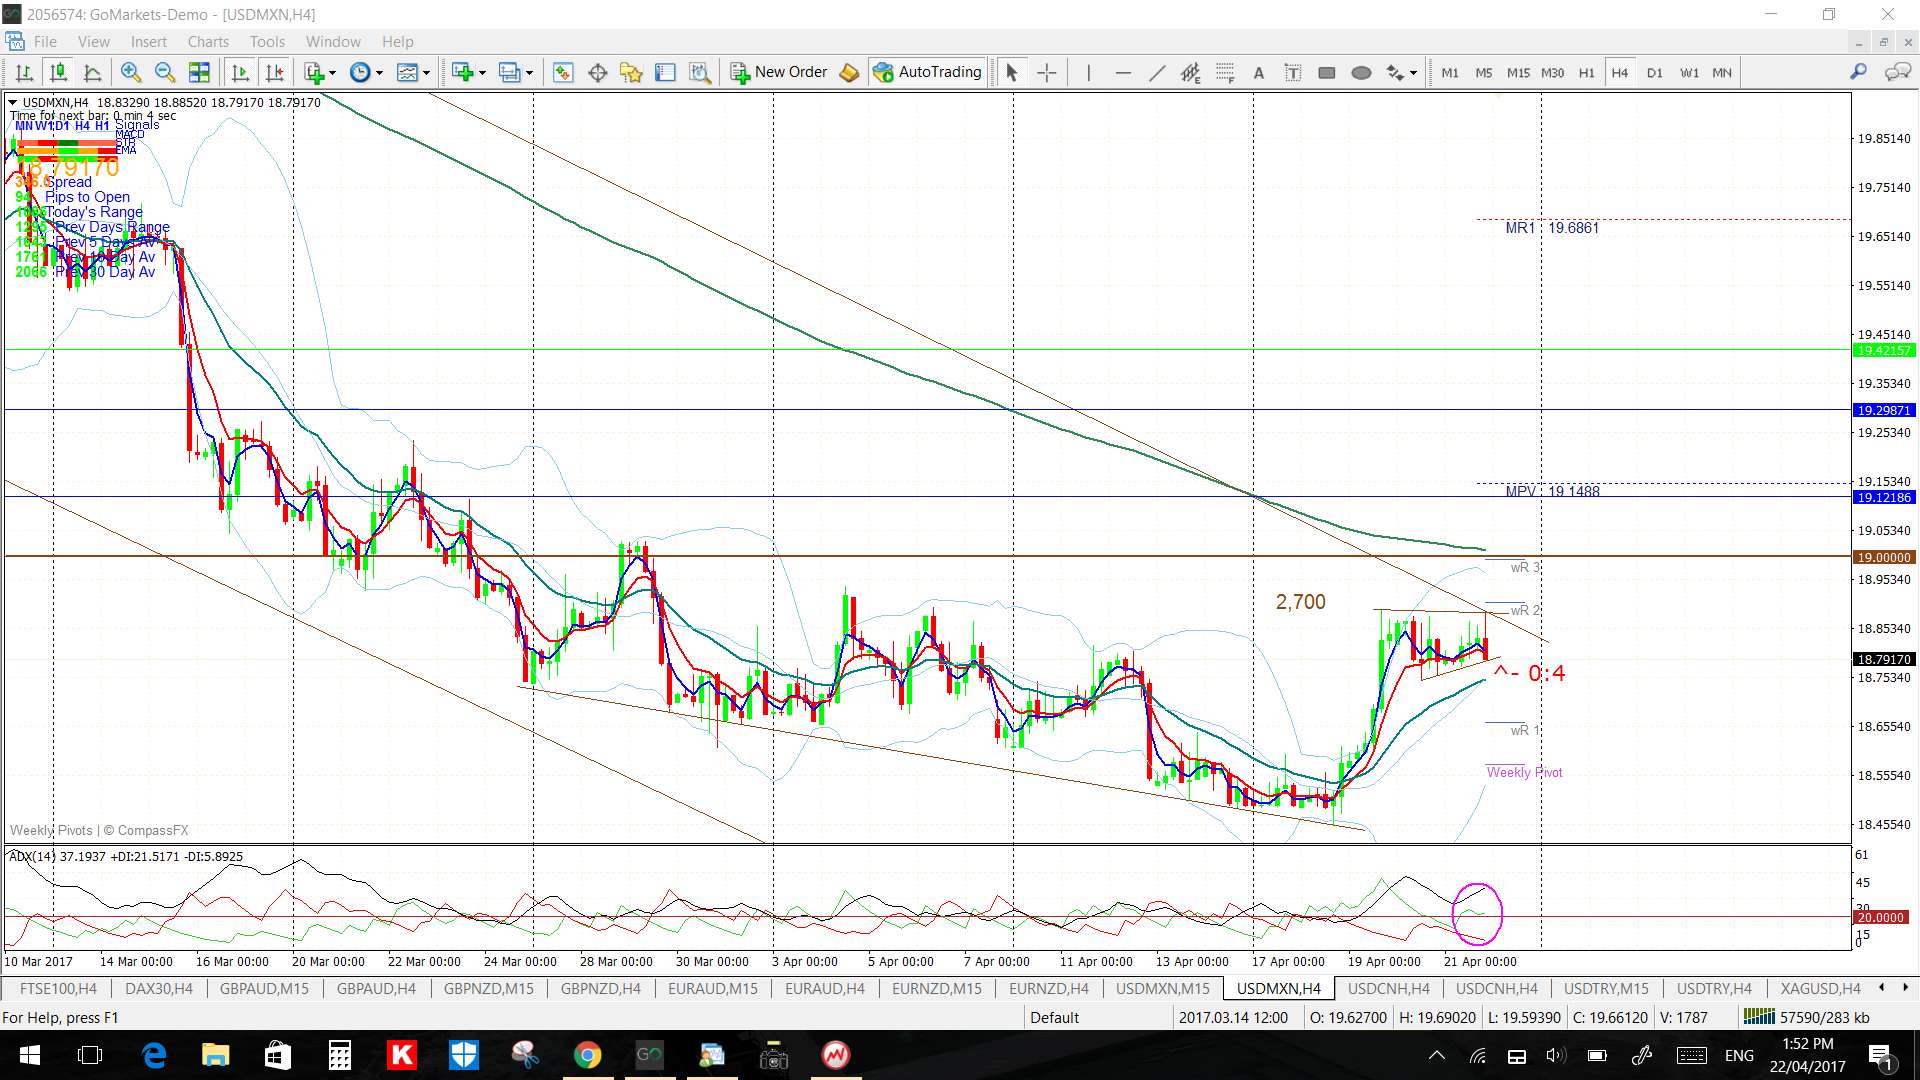
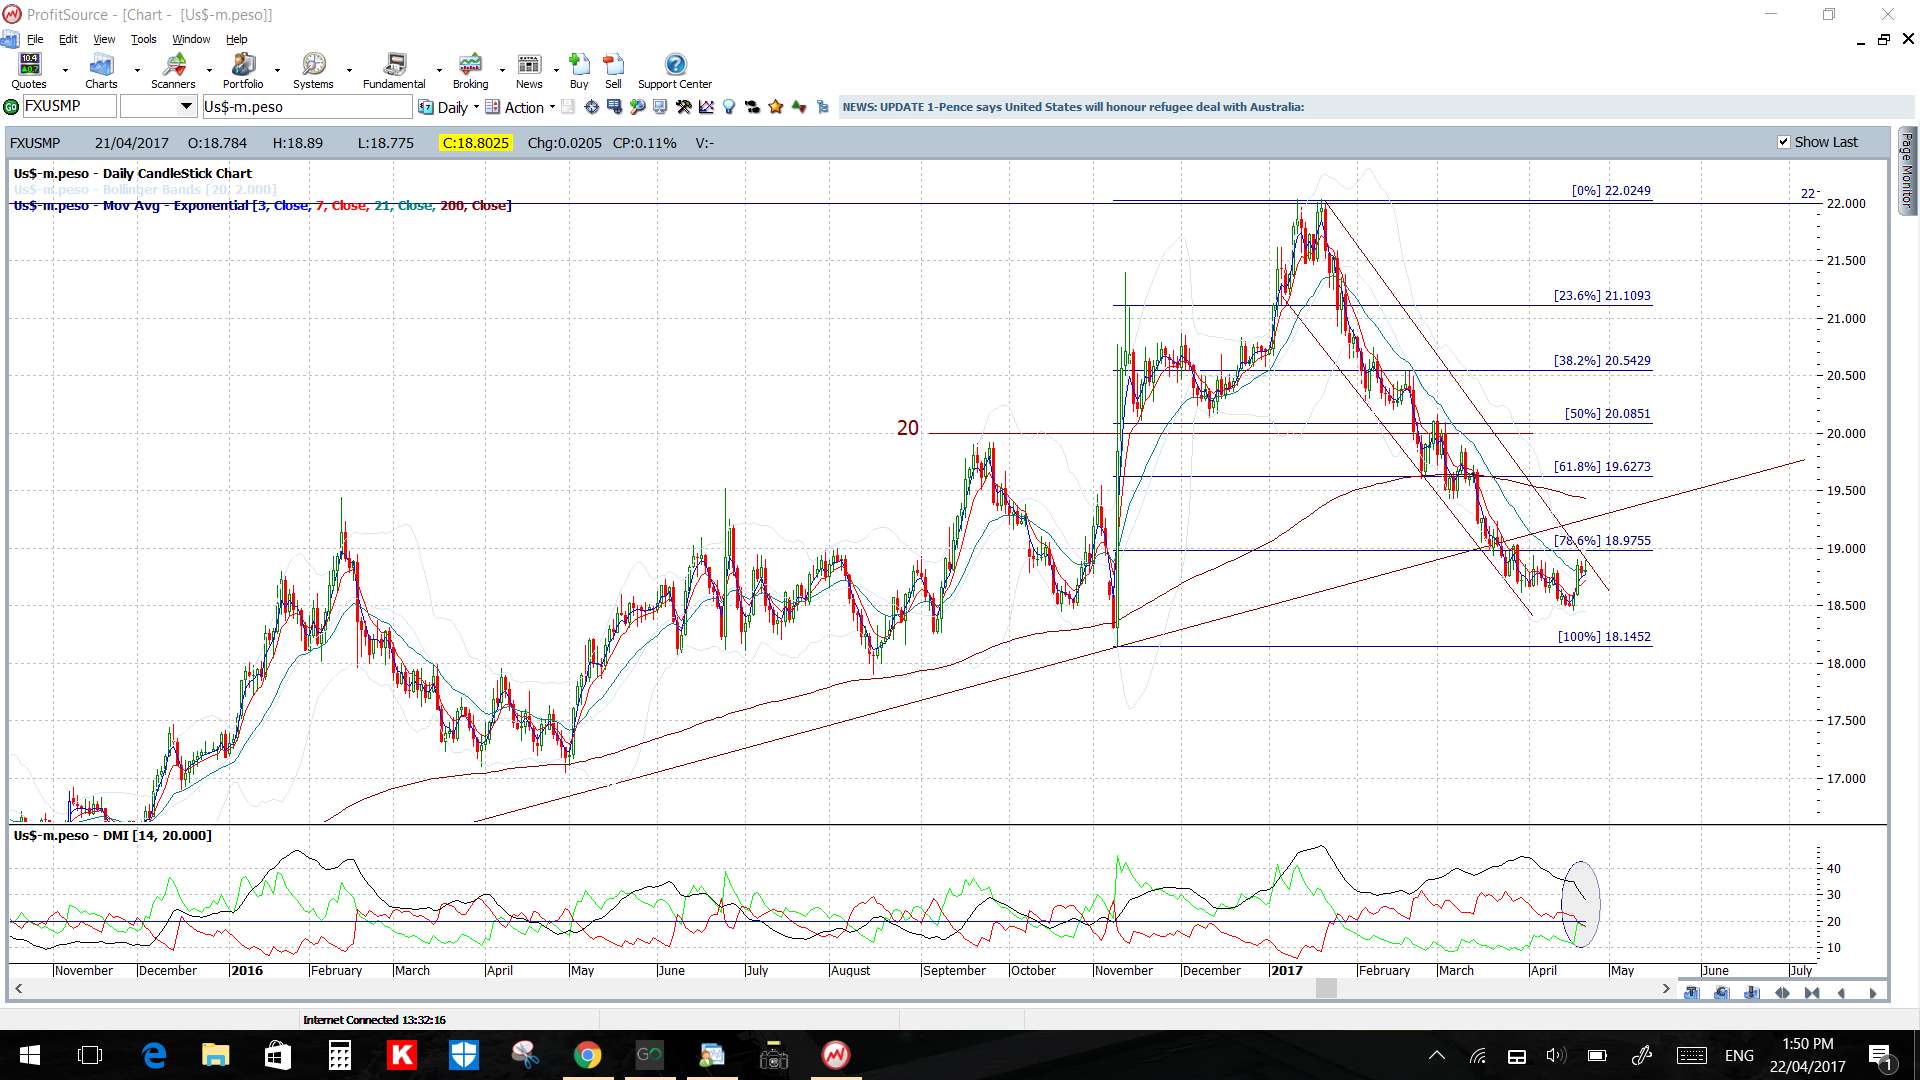
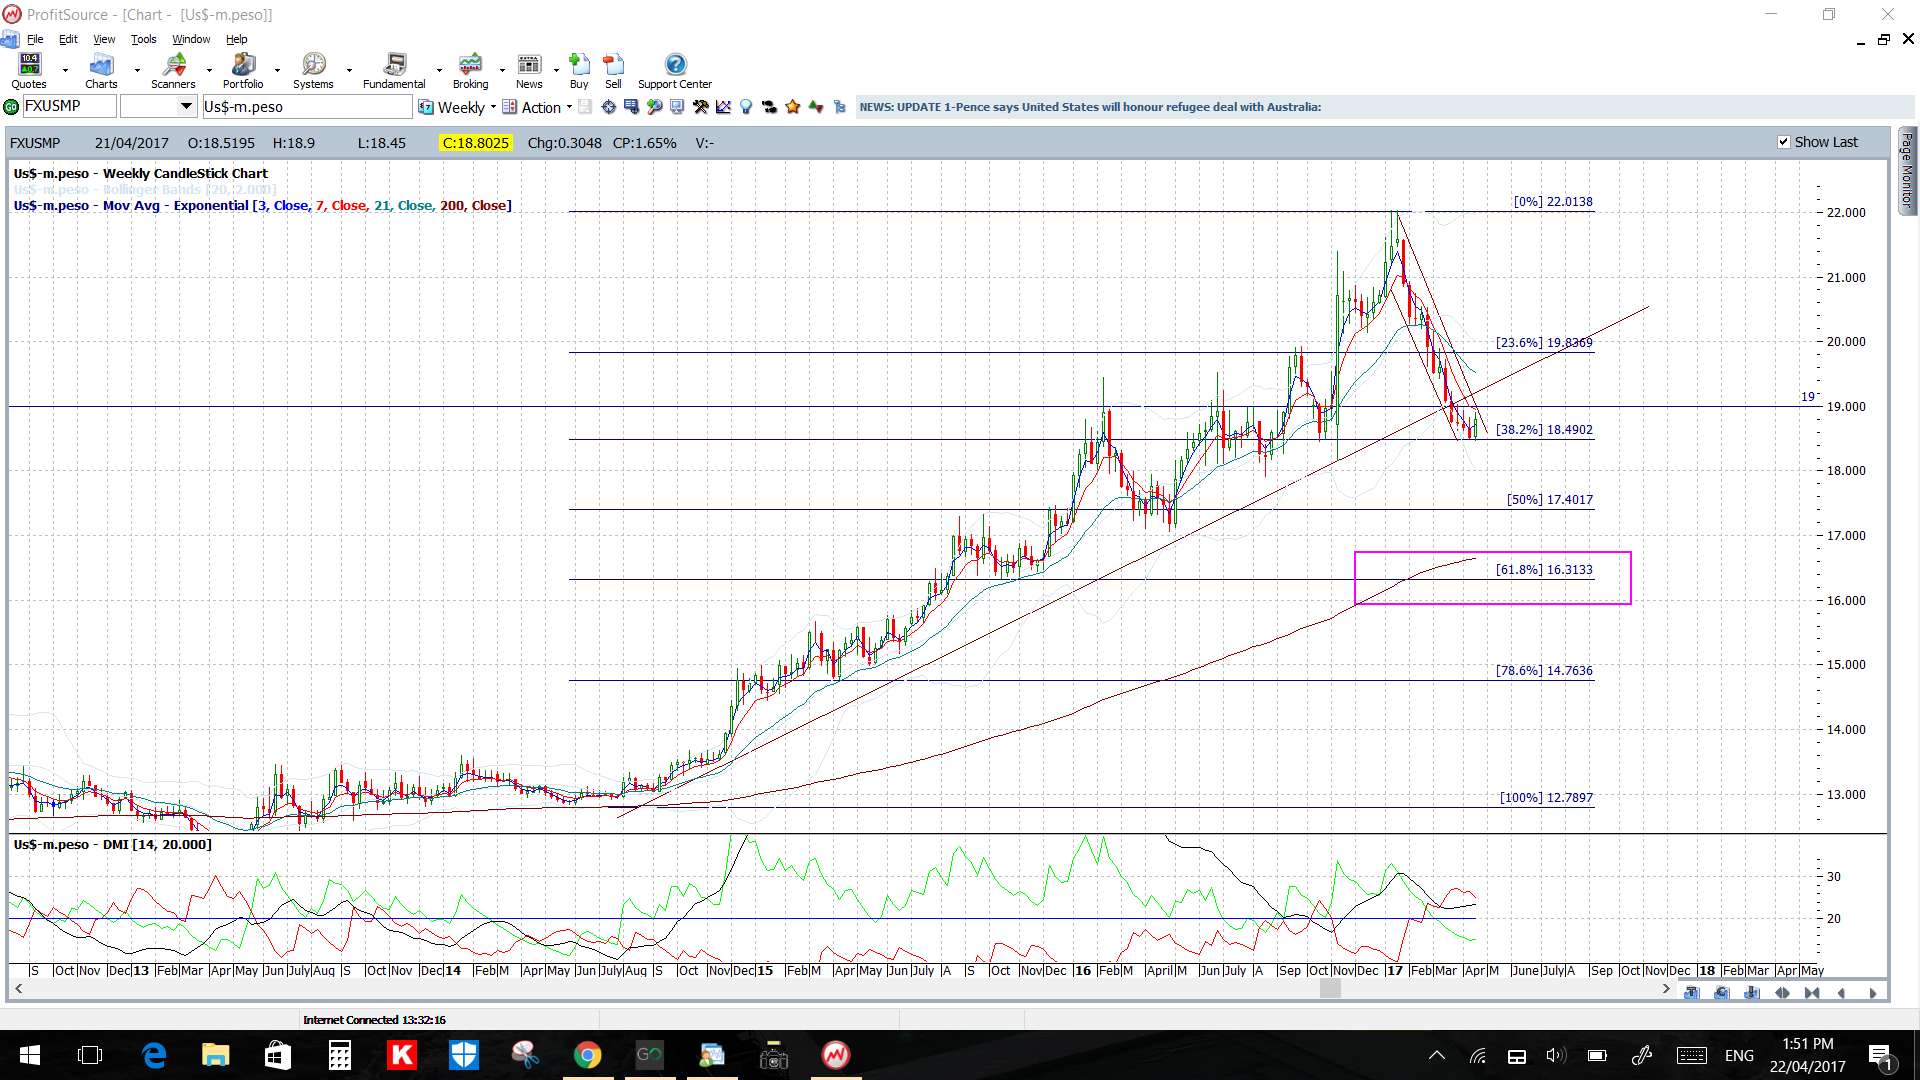
- USD/MXN: 2,700 pips.
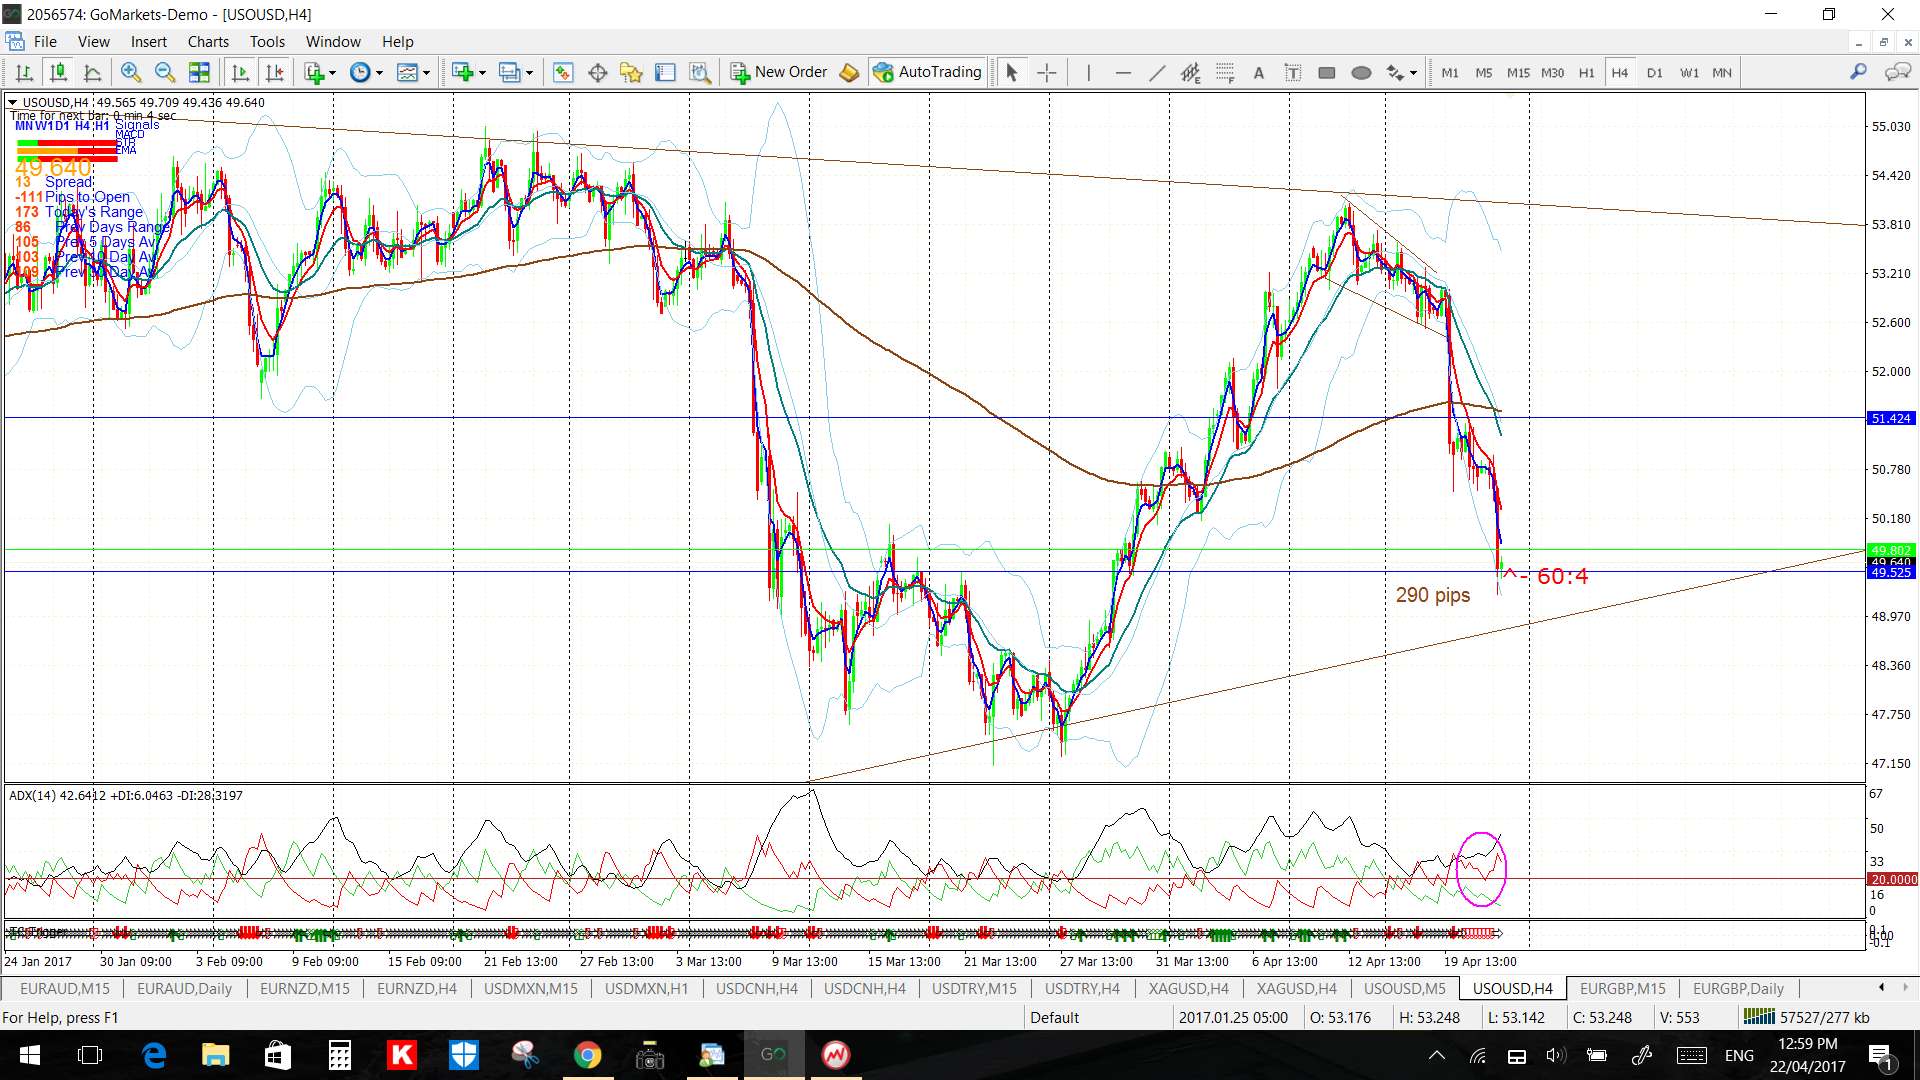
- Crude Oil: 200 pips but this went on further on Friday to 290 pips.
- FTSE: 140 points.
Next Week:
- US$: The US$ index has dipped below 100 support and a review of the indices can be found through this link.
- French Election: is on this Sunday so watch for impact at market open from this first round of voting.
- Two Central Banks: report interest rate updates next week: BoJ (JPY) and ECB (EUR).
- Tuesday 25th: Is a holiday for Australia and New Zealand.
- End of Month: this coming Friday is the last trading day of the month so watch how the monthly candle close and for new monthly pivots.
- Fibonacci: I have posted a page on my site about Fibonacci with some brief information and examples of charts showing price action respecting key Fibonacci levels. This page can be found through the following link.
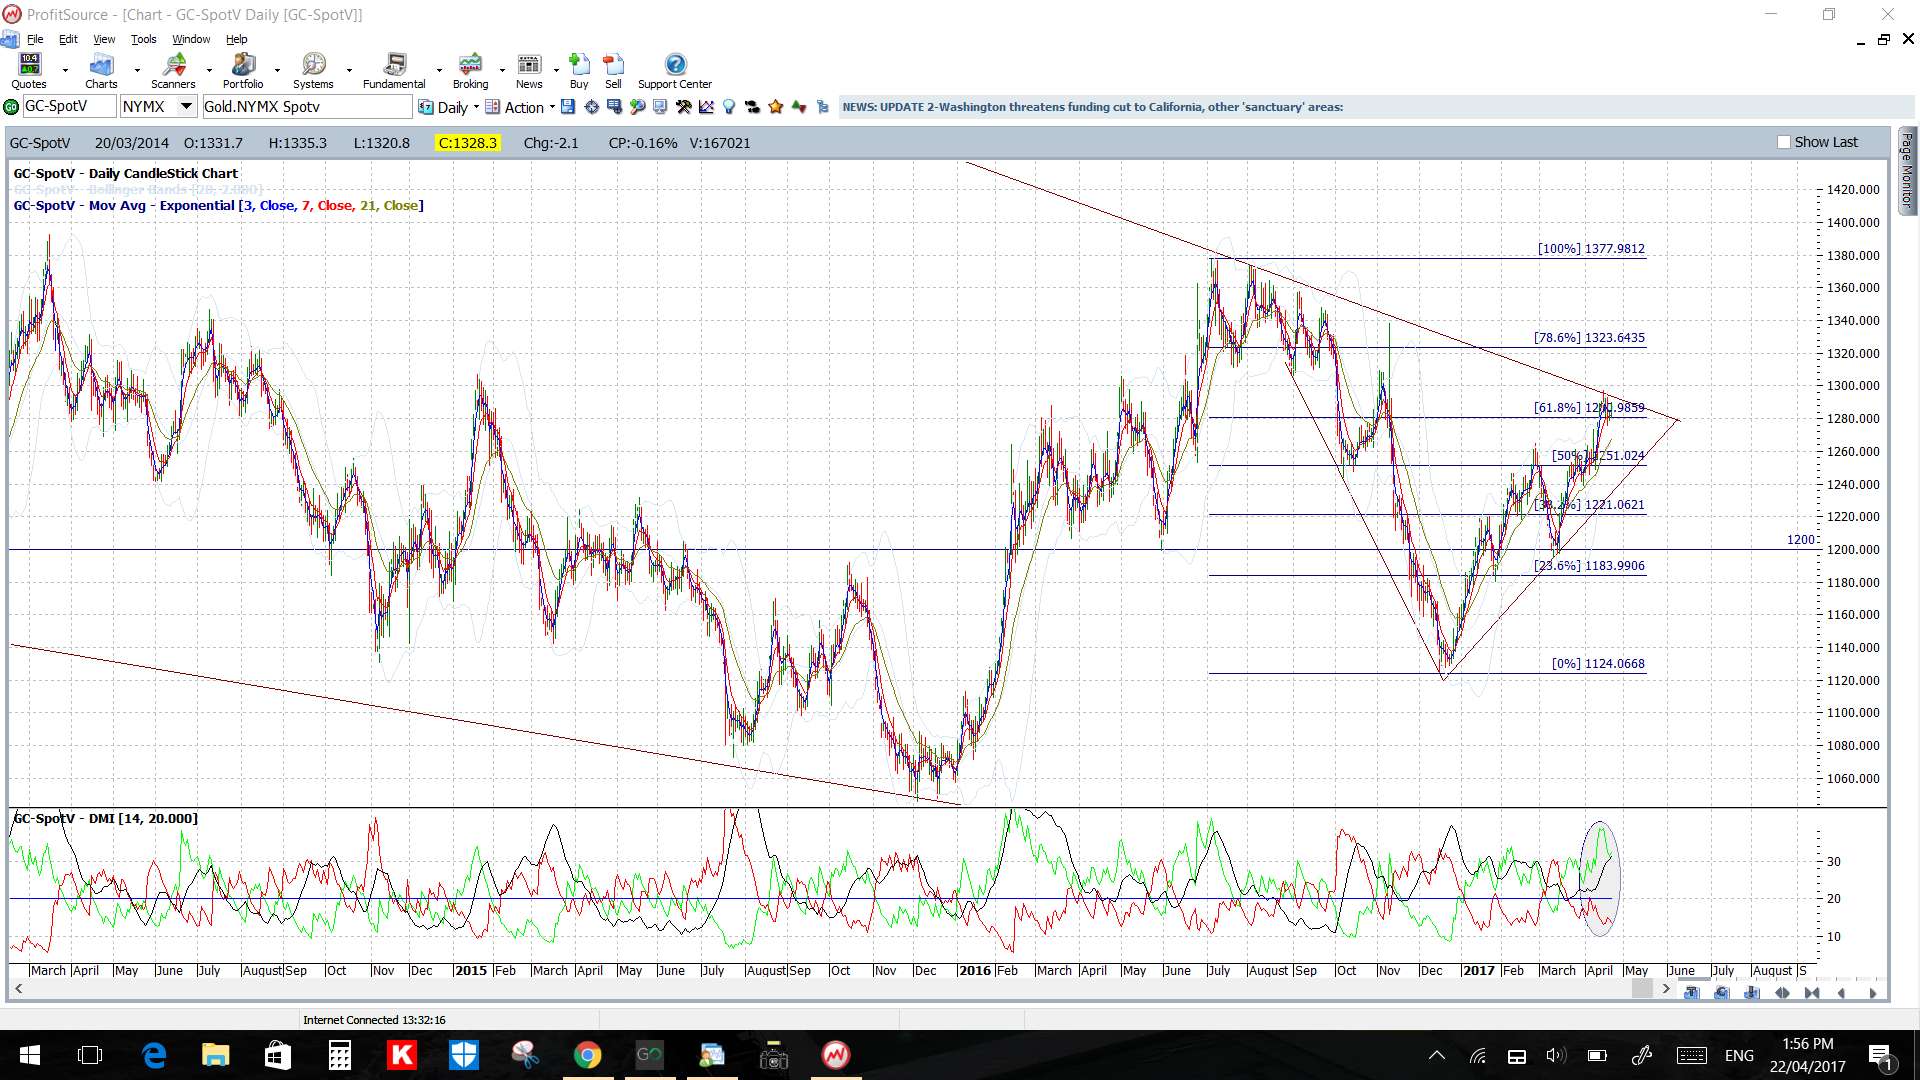
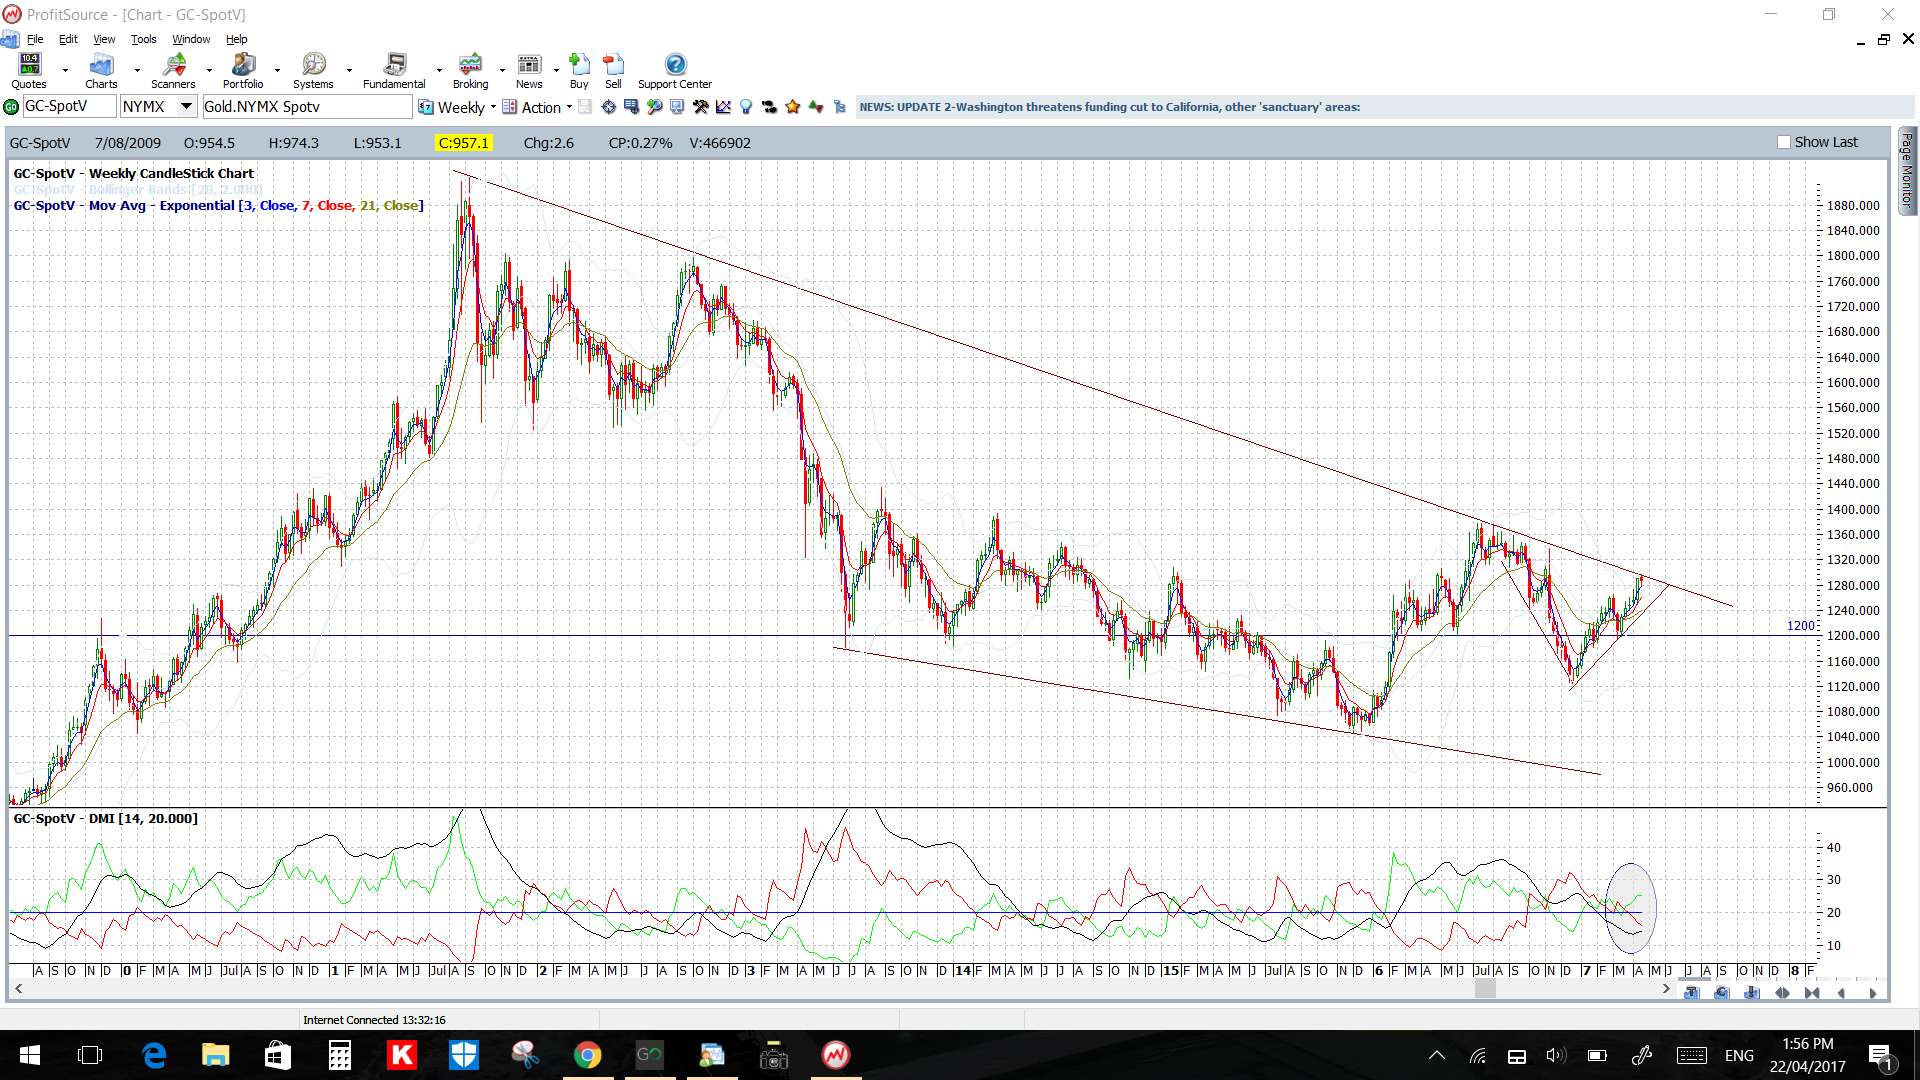
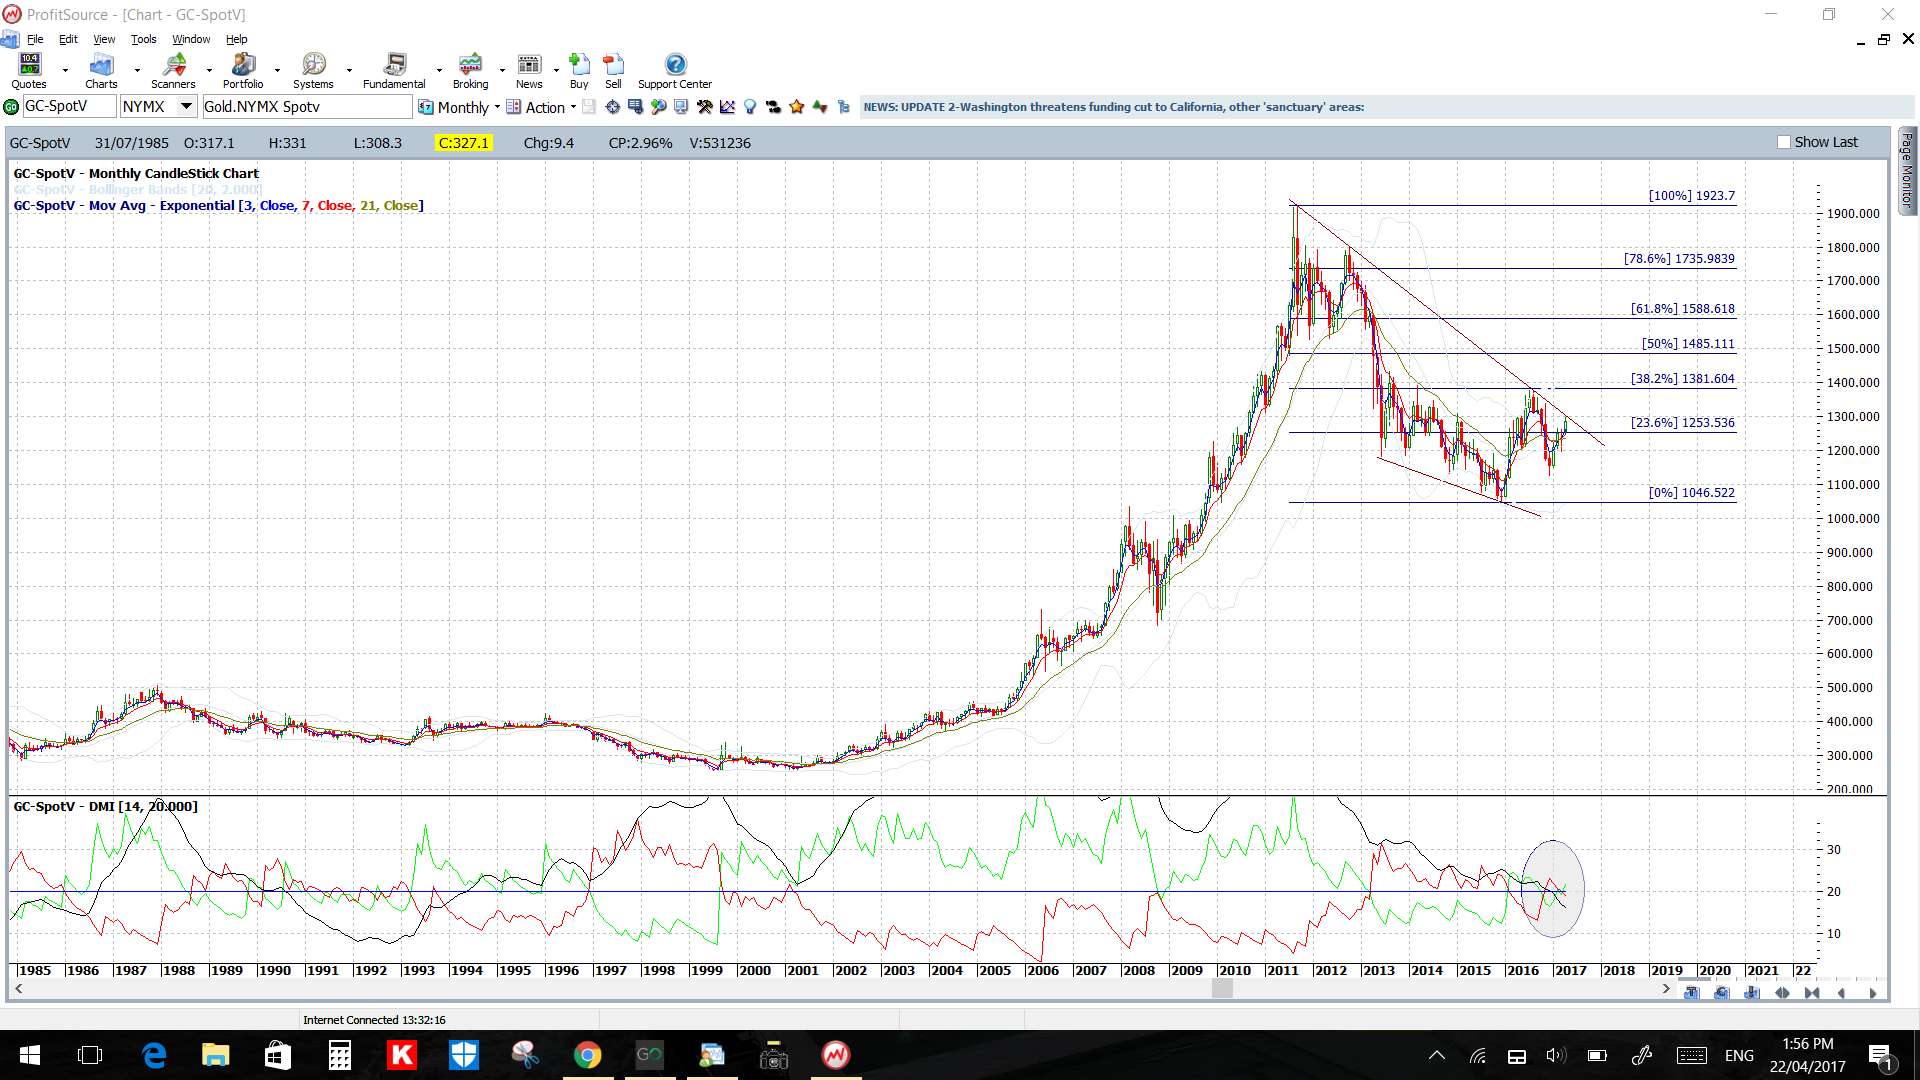
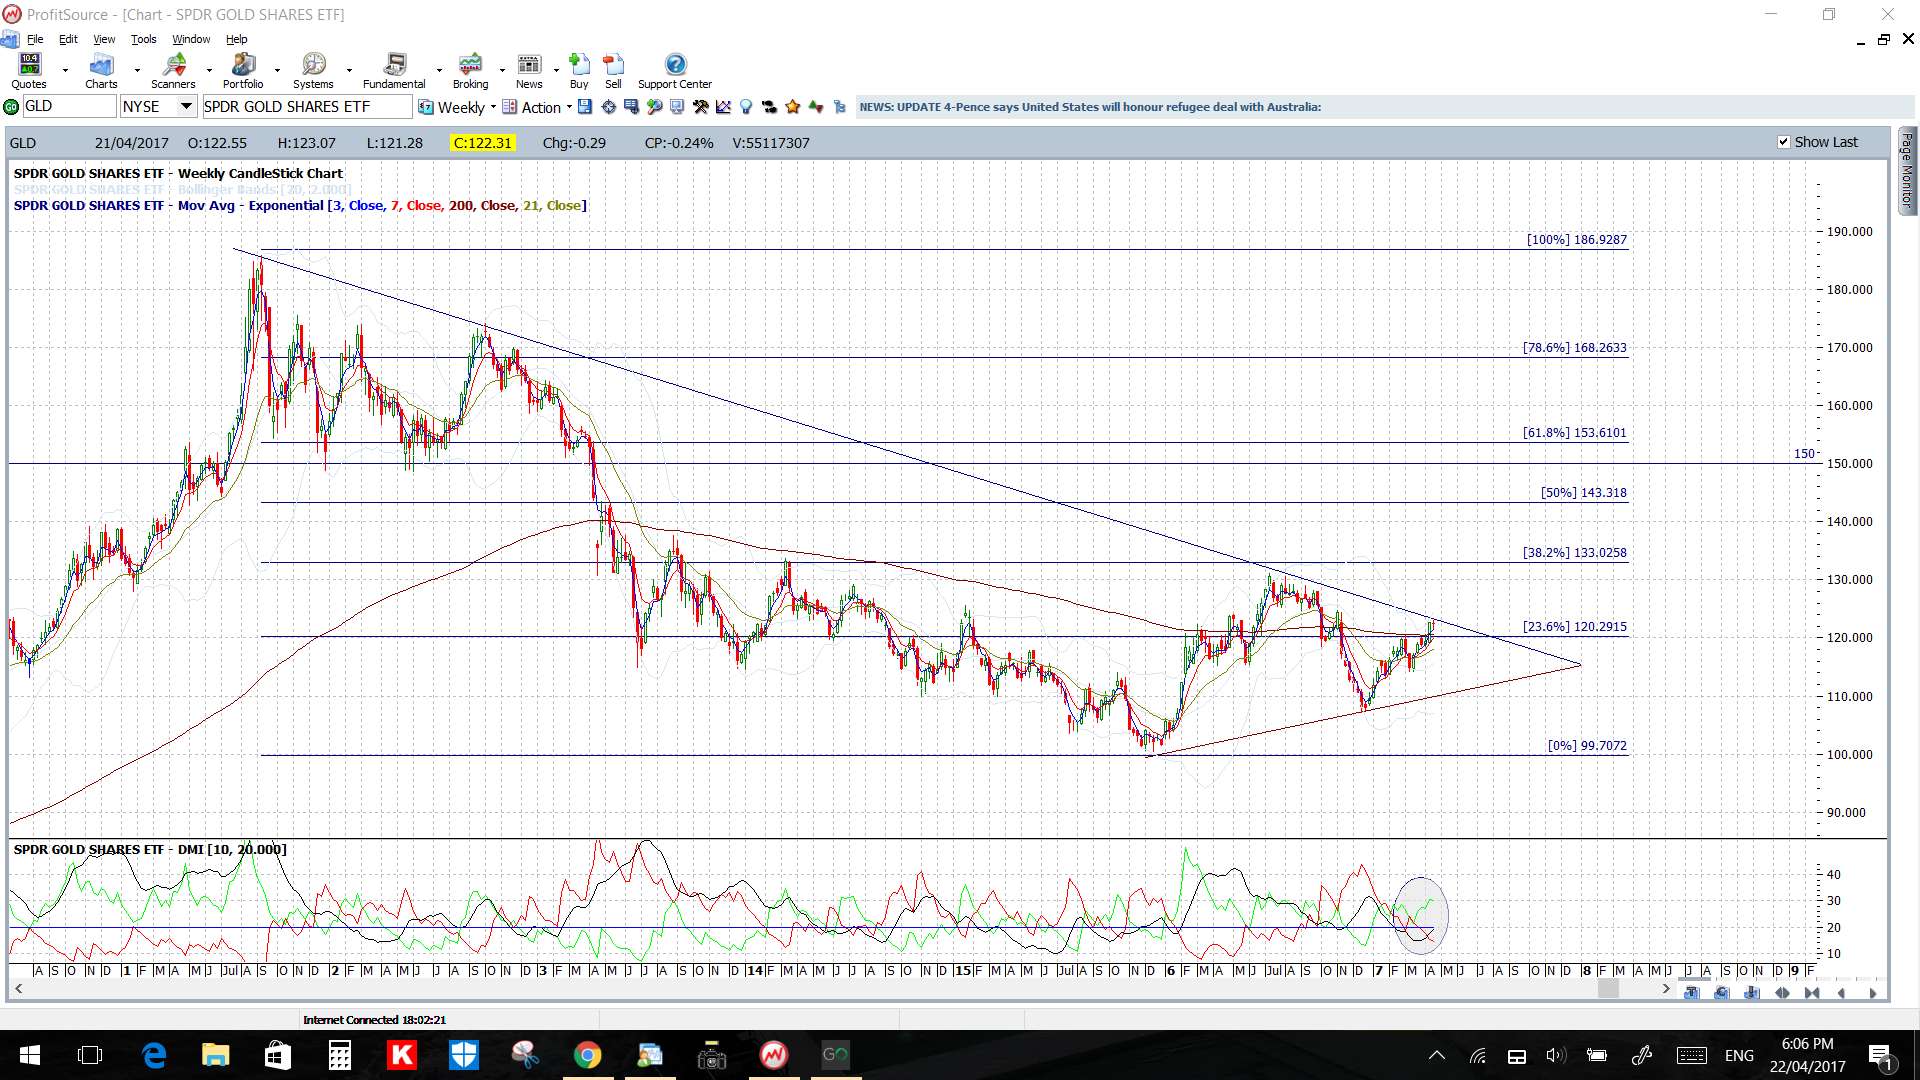
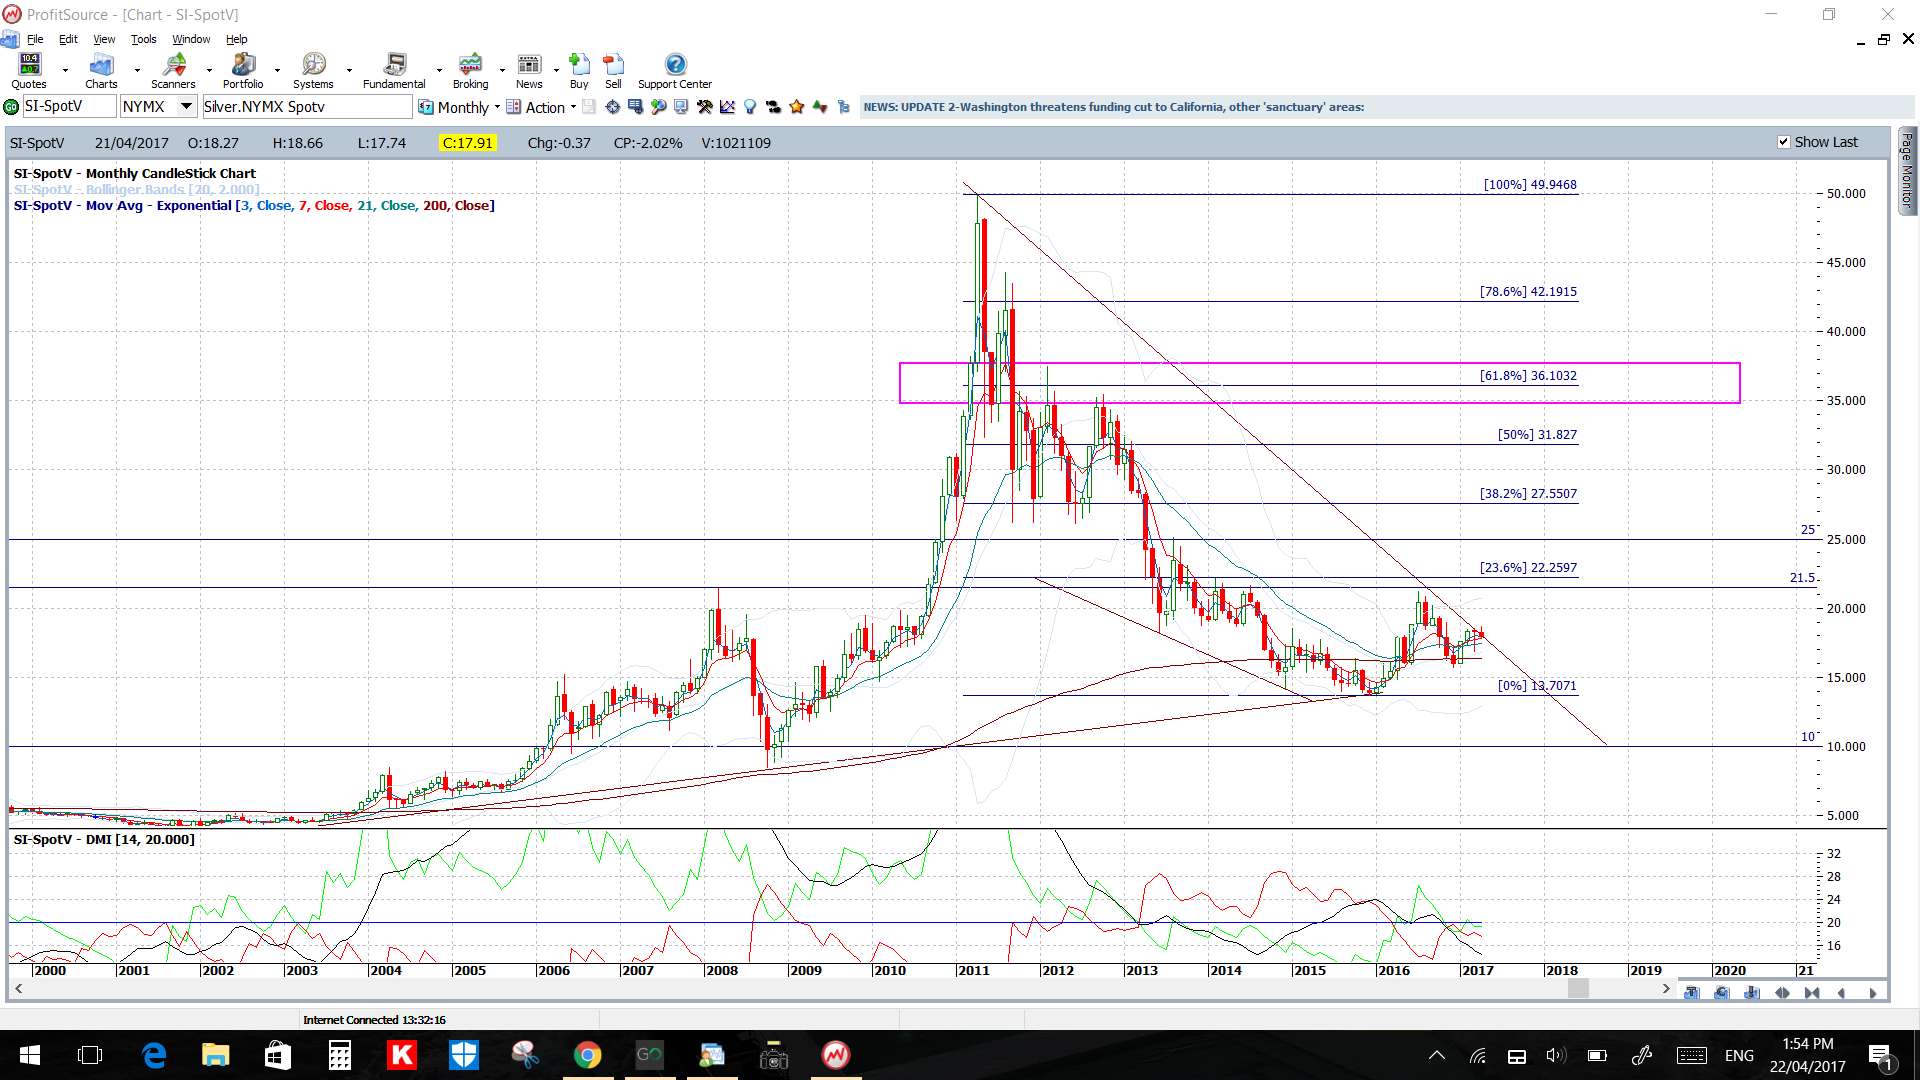
- Gold and Silver: Both metals have printed bearish-reversal style weekly candles but this is not surprising given their current levels. Both are trading at major 6-year bear trend lines and I would not expect these levels to be negotiated without some duress. I continue to keep an open mind about the next directional move on both Gold and Silver.
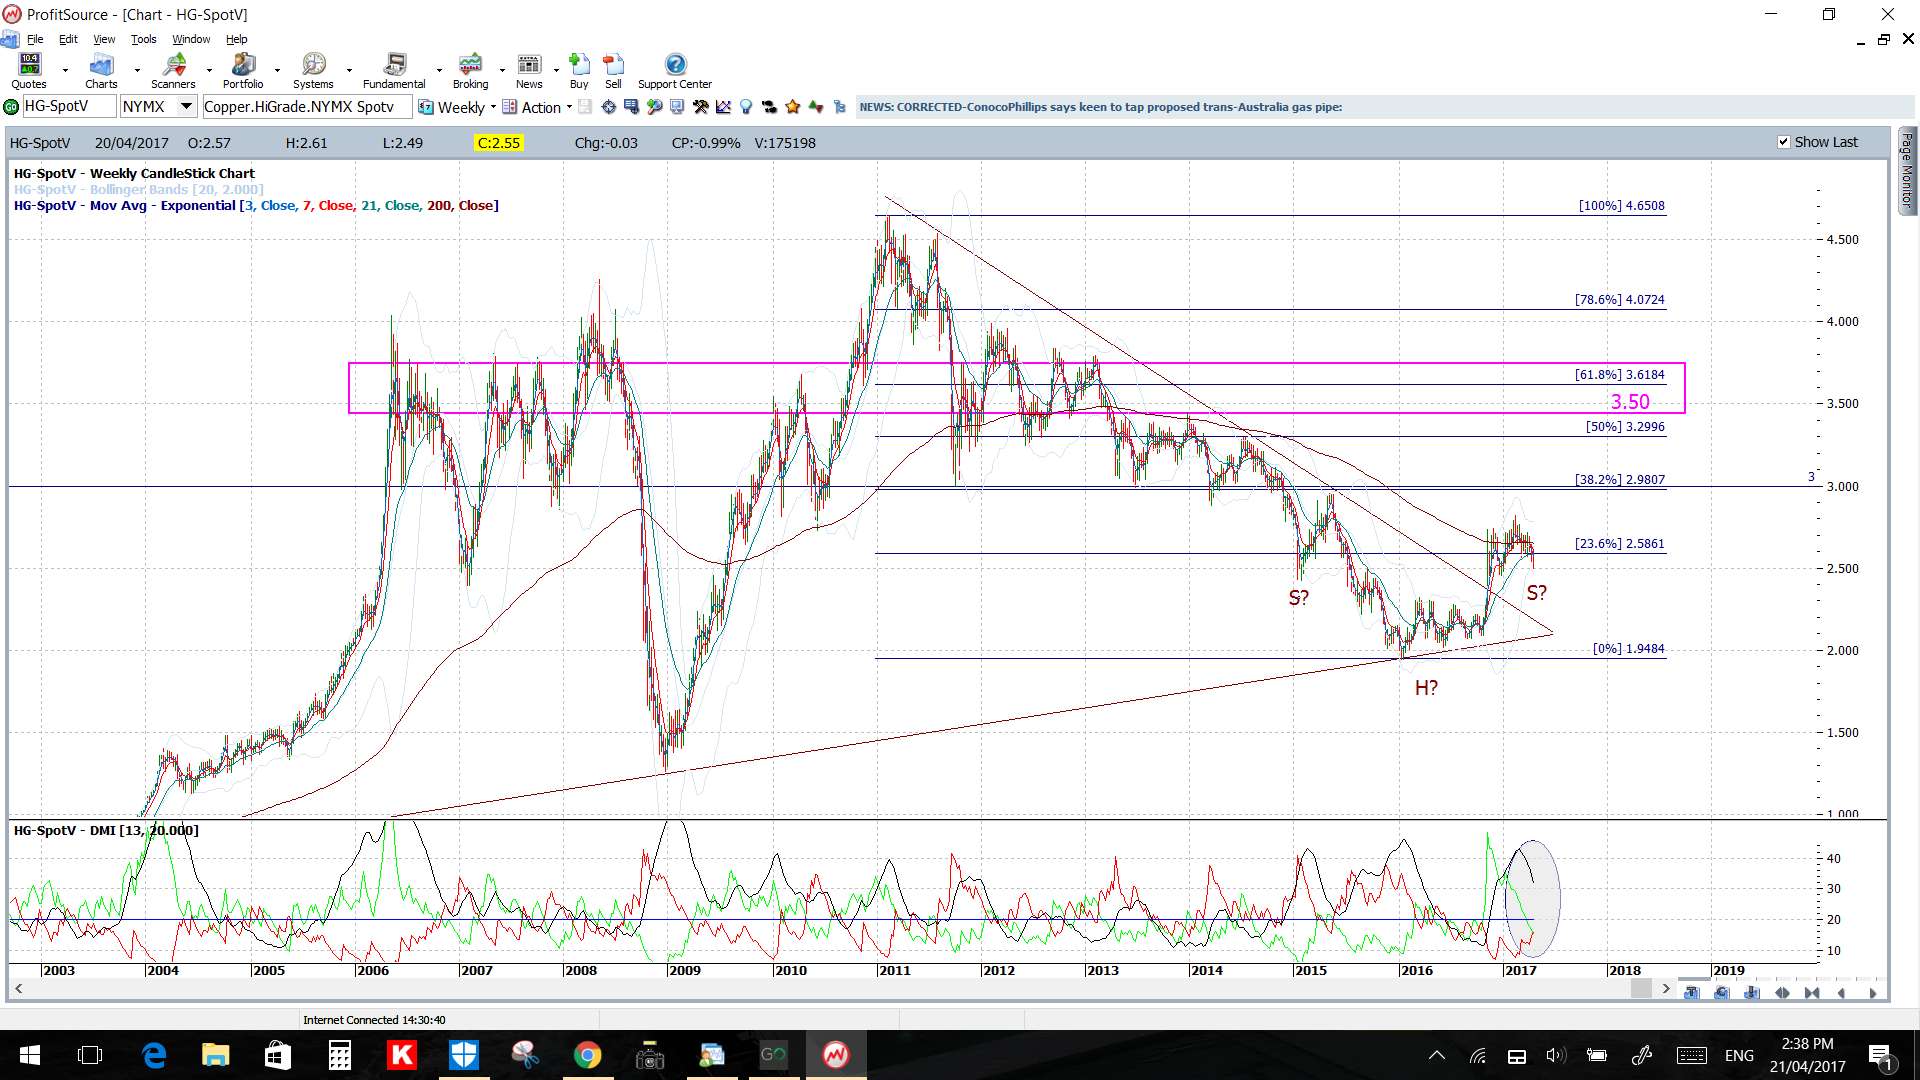
- Copper: anyone else seeing a bullish Inverse H&S building here?
Calendar:
- Sun 23rd: USD Treasury Secretary speaks. EUR French Presidential Elections.
- Mon 24th: Day 3: IMF Meetings. EUR German Ifo Business Climate.
- Tue 25th: AUD, NZD and Italian Bank Holiday. USD CB Consumer Confidence.
- Wed 26th: AUD CPI & RBA Gov Lowe speech. CAD Retail Sales. USD Crude Oil Inventories.
- Thurs 27th: JPY BoJ Monetary Policy Statement & Press Conference. EUR Min Bid Rate & Press Conference. USD Core Durable Goods Order & Weekly Unemployment Claims.
- Fri 28th: GBP GDP. CAD GDP. USD Advance GDP.
Commodities:
Gold: Gold is holding near a 6-year bear trend line and above the $1,280 S/R level but could go either way from this point. Thus, watch the 4hr chart’s Flag trend lines for any early clue.
A bearish breakdown would have me watching the following potential support levels:
- $1,265
- $1,250
- the daily support trend line (since Dec 2016)
The weekly candle closed as a bearish coloured ‘Hanging Man’ so watch for any reversal activity here.
Price is above the 4hr and daily Cloud.

GLD weekly: Keep an eye on this Gold ETF as it flirts with a major bear trend line too:
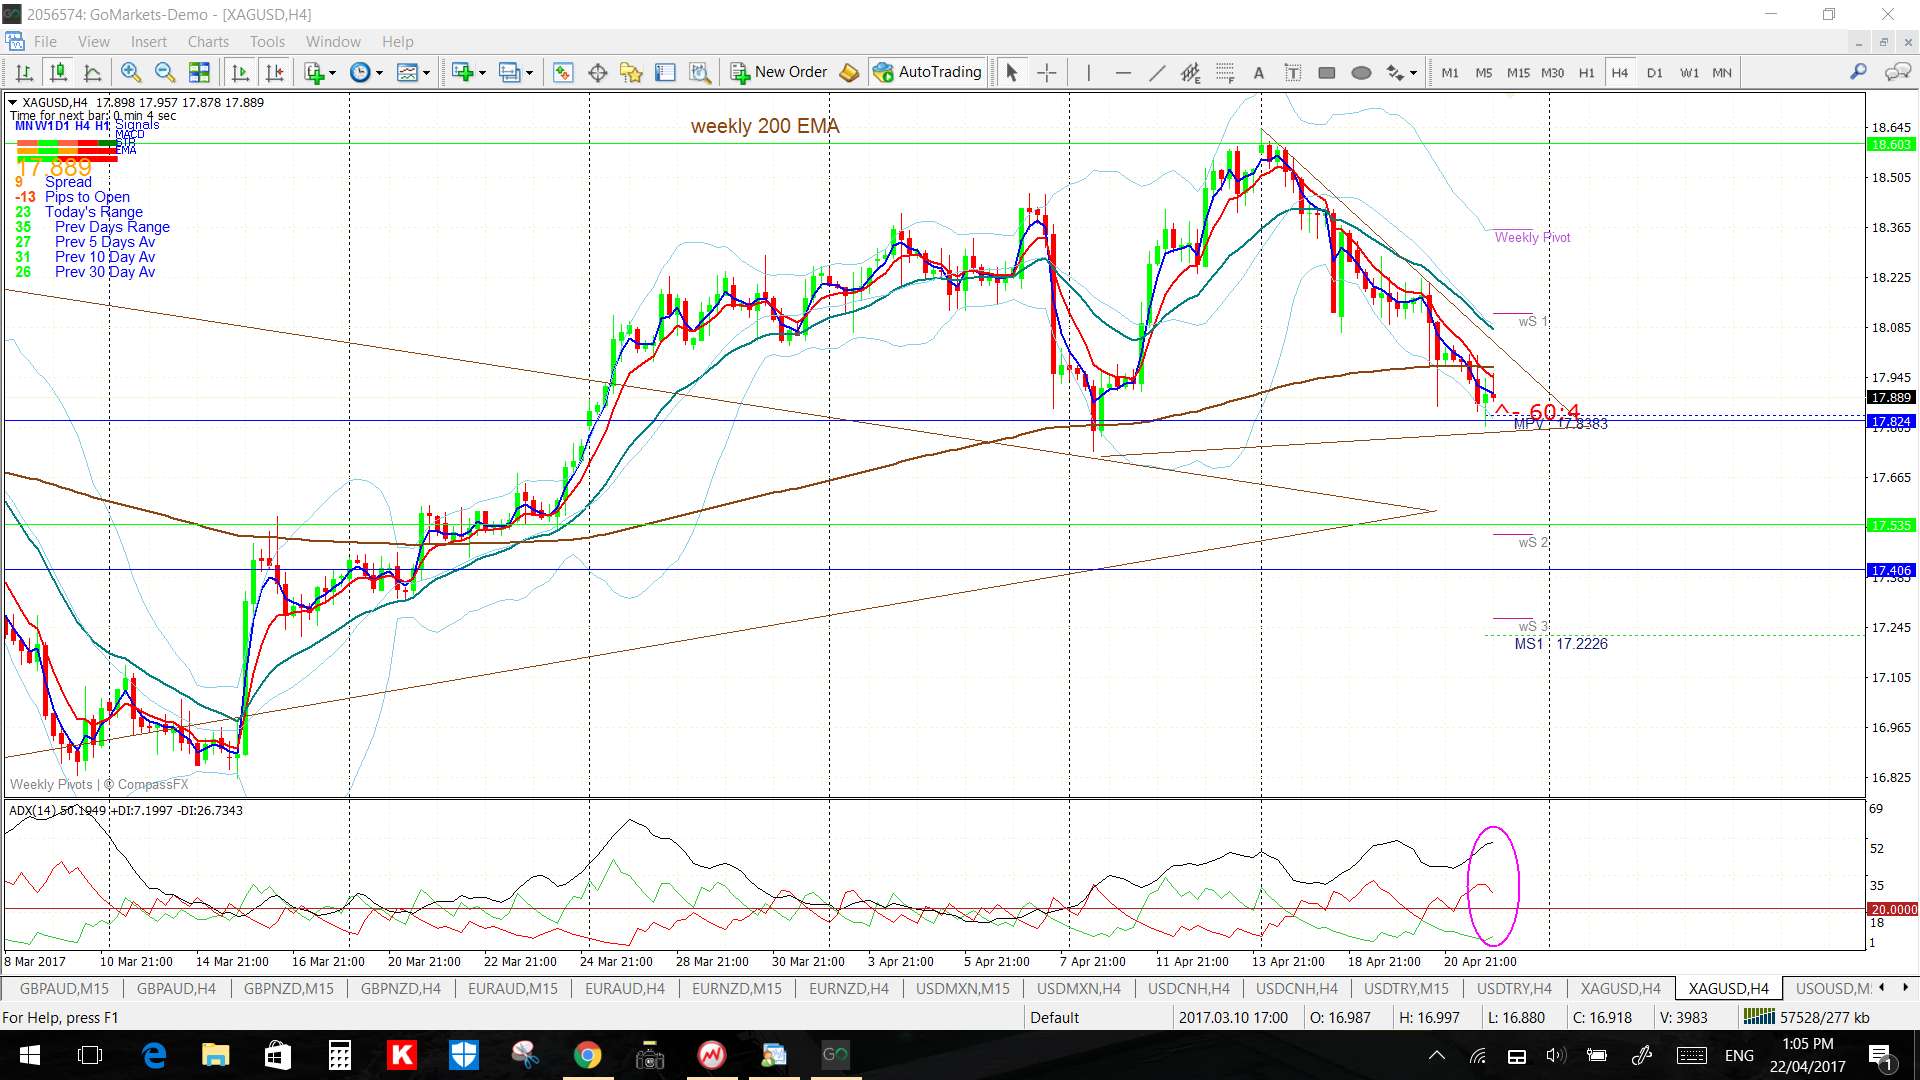
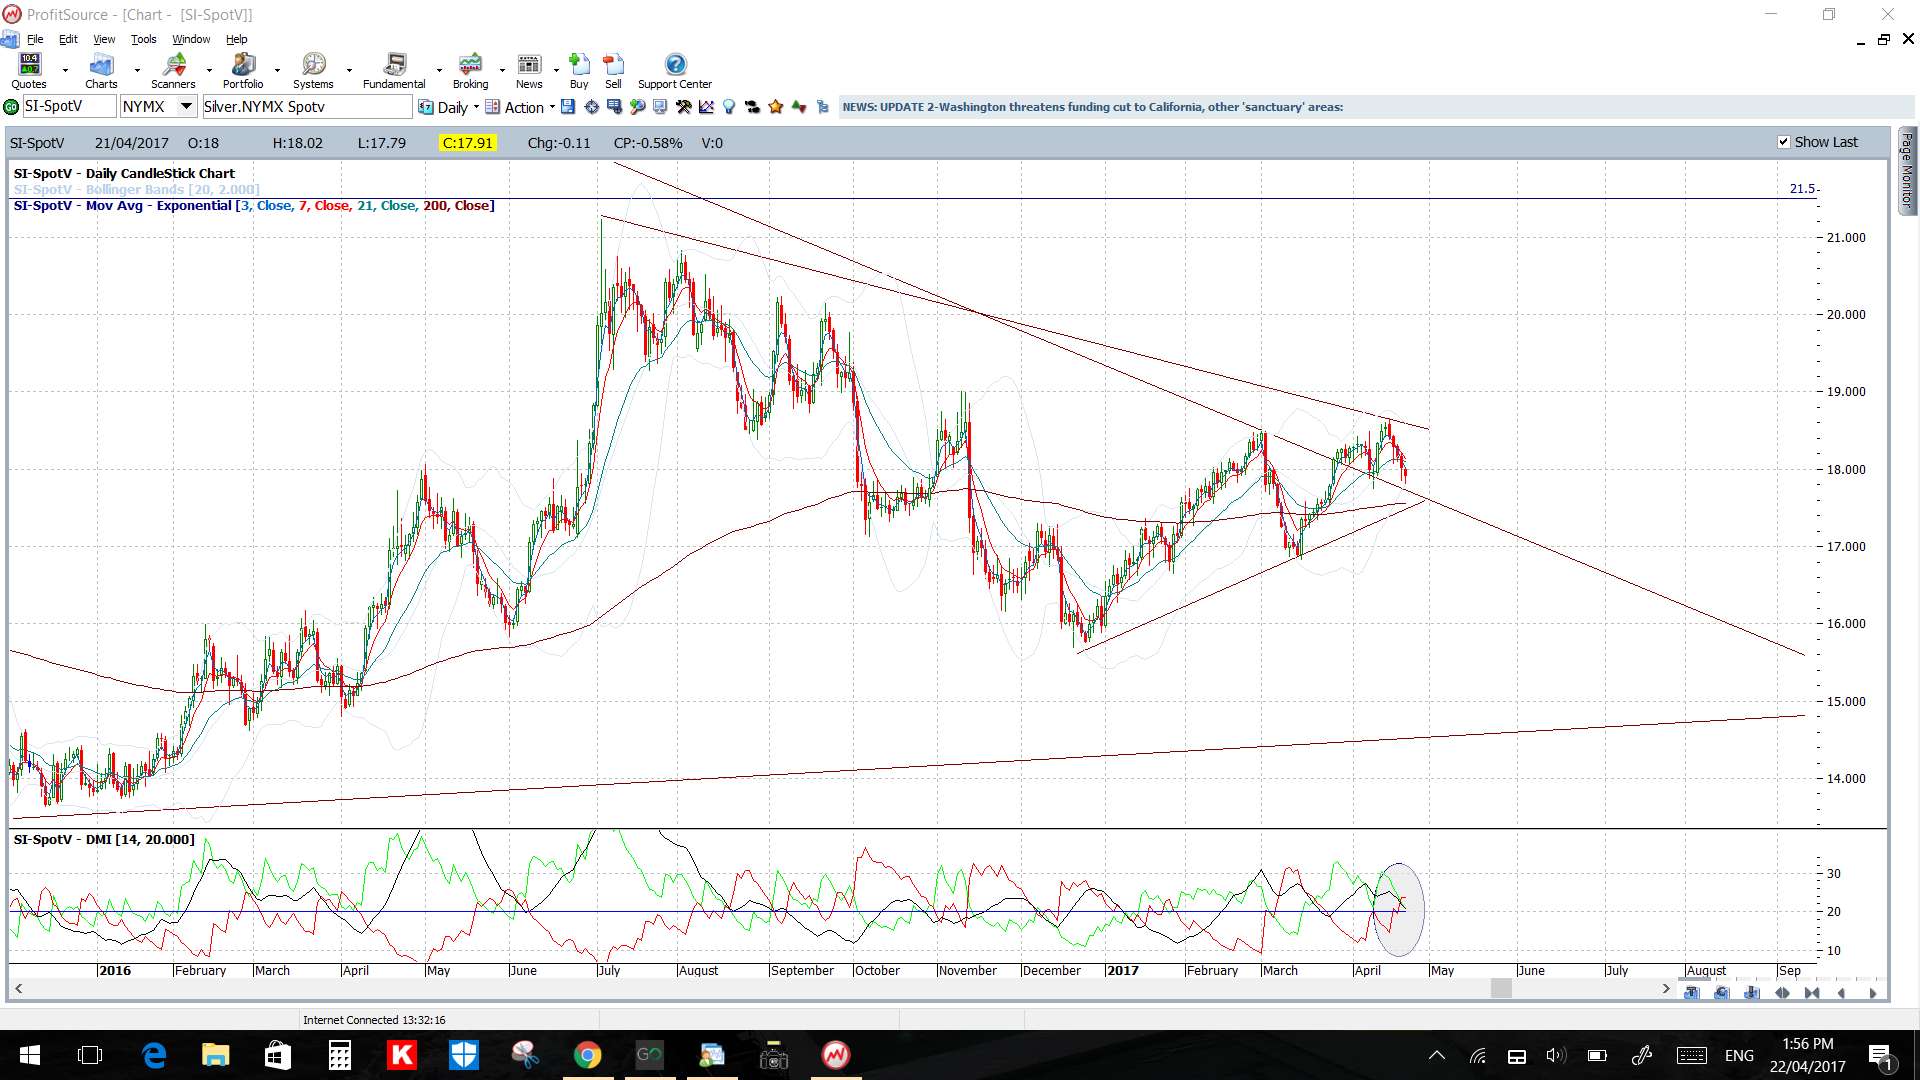
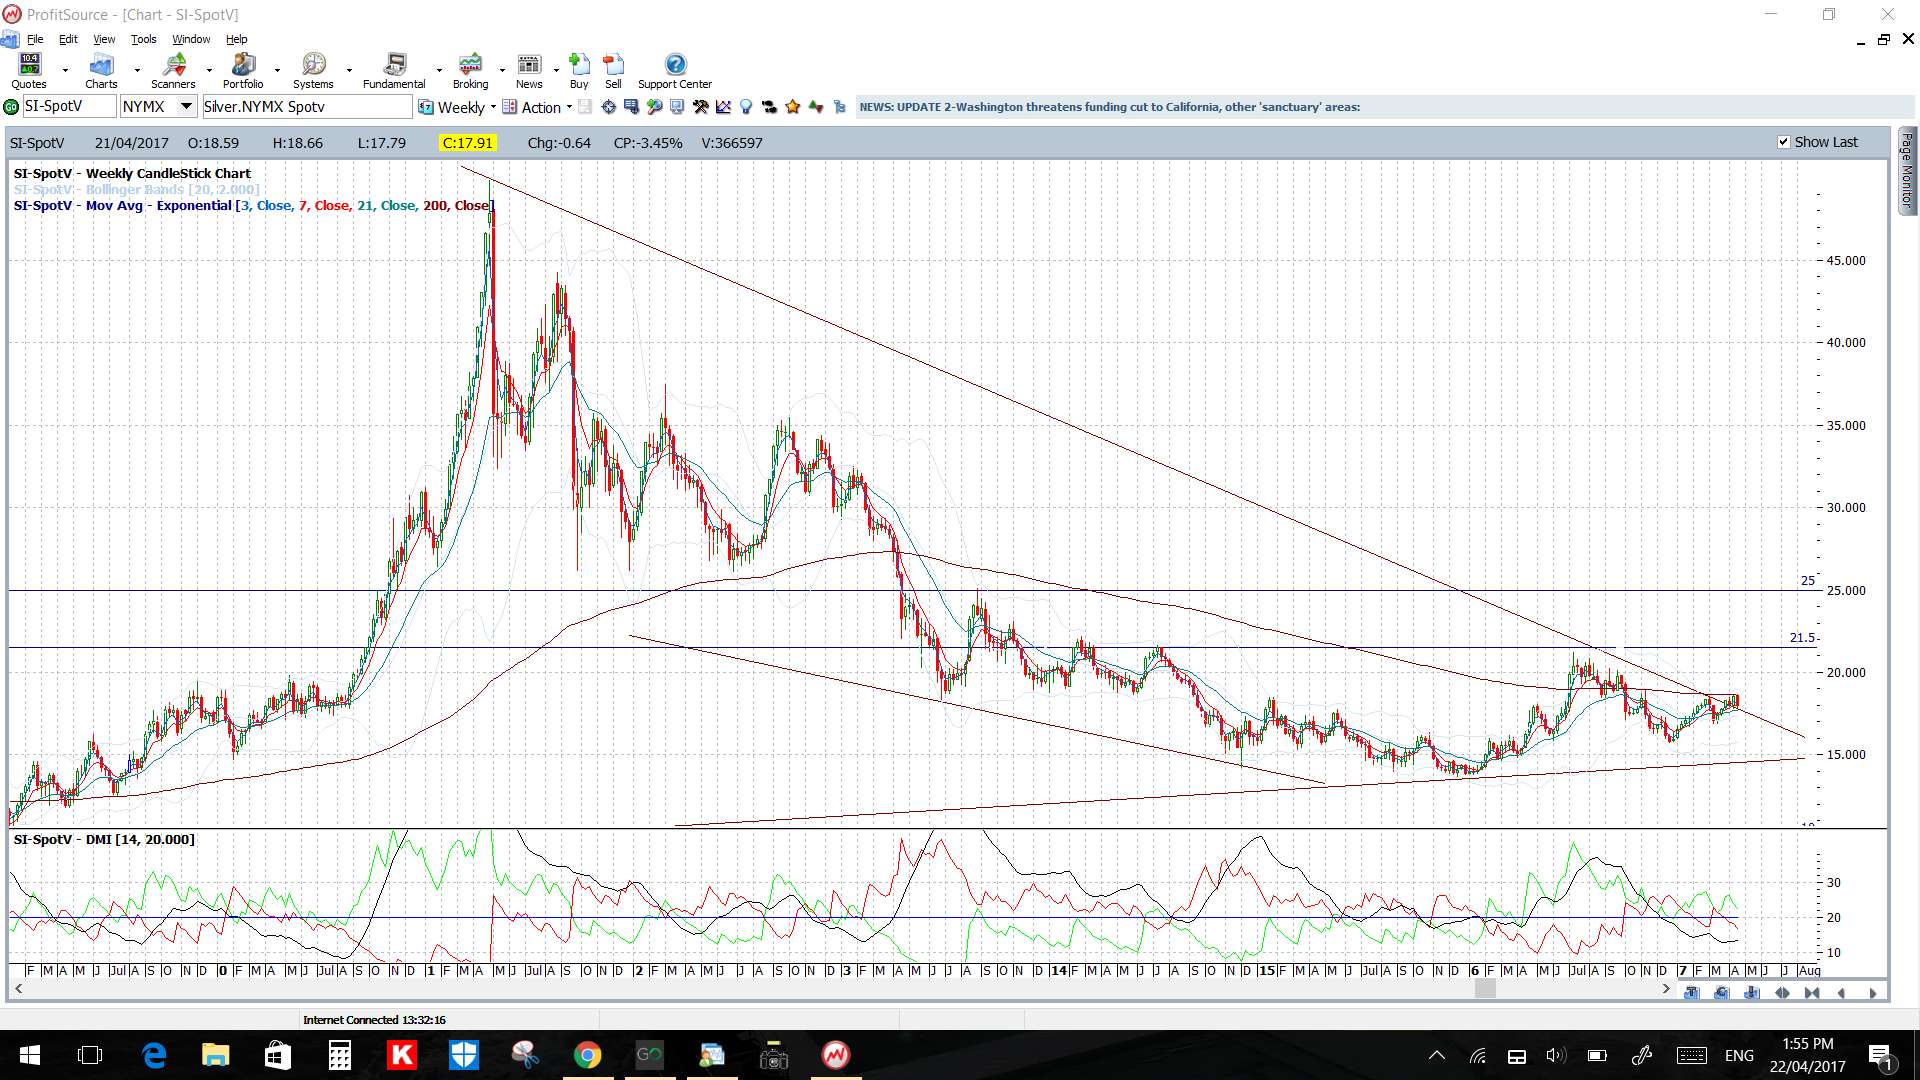
Silver: Silver is also holding near a 6-year bear trend line but, like with Gold, price could go either way from here. Thus, watch the 4hr chart’s triangle trend lines for any make or break activity.
Silver is below the 4hr Cloud but above the daily Cloud.
The weekly candle closed as a bearish engulfing candle so watch to see if there is any bearish continuation.
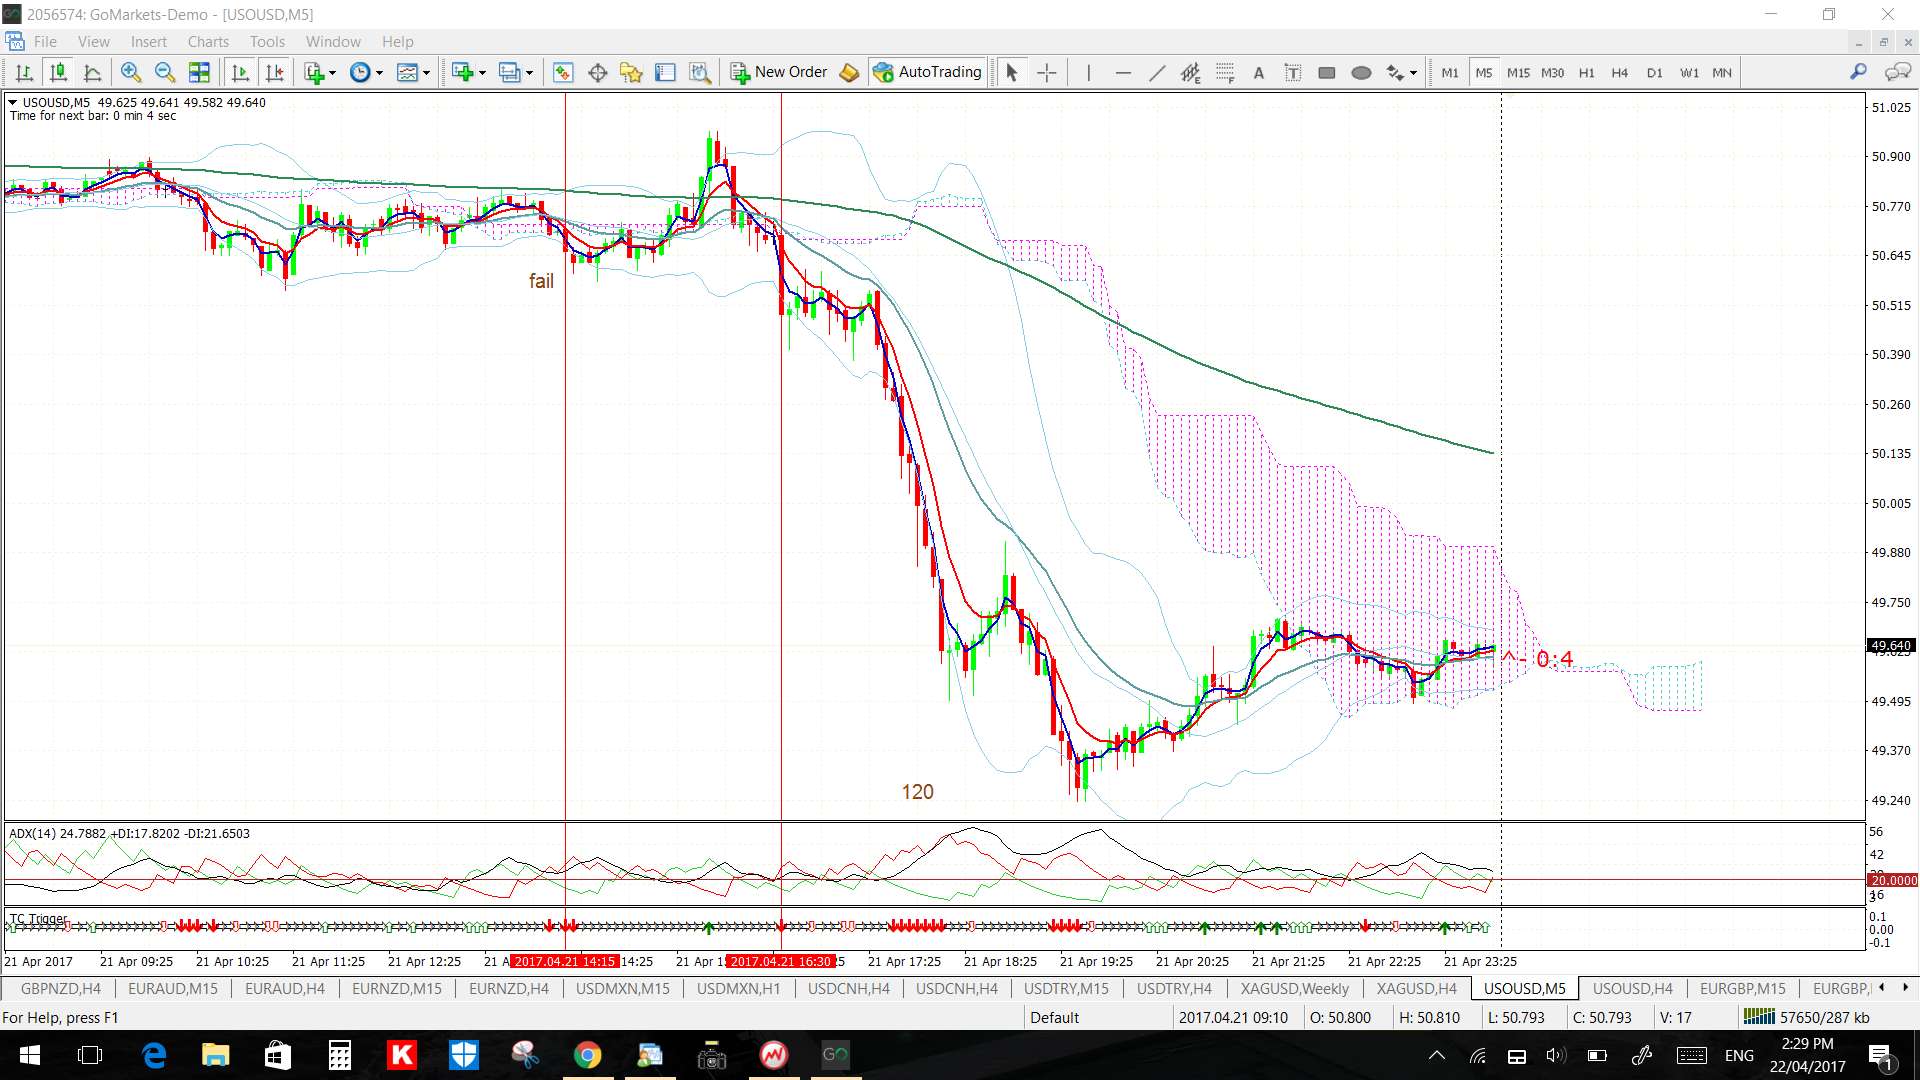
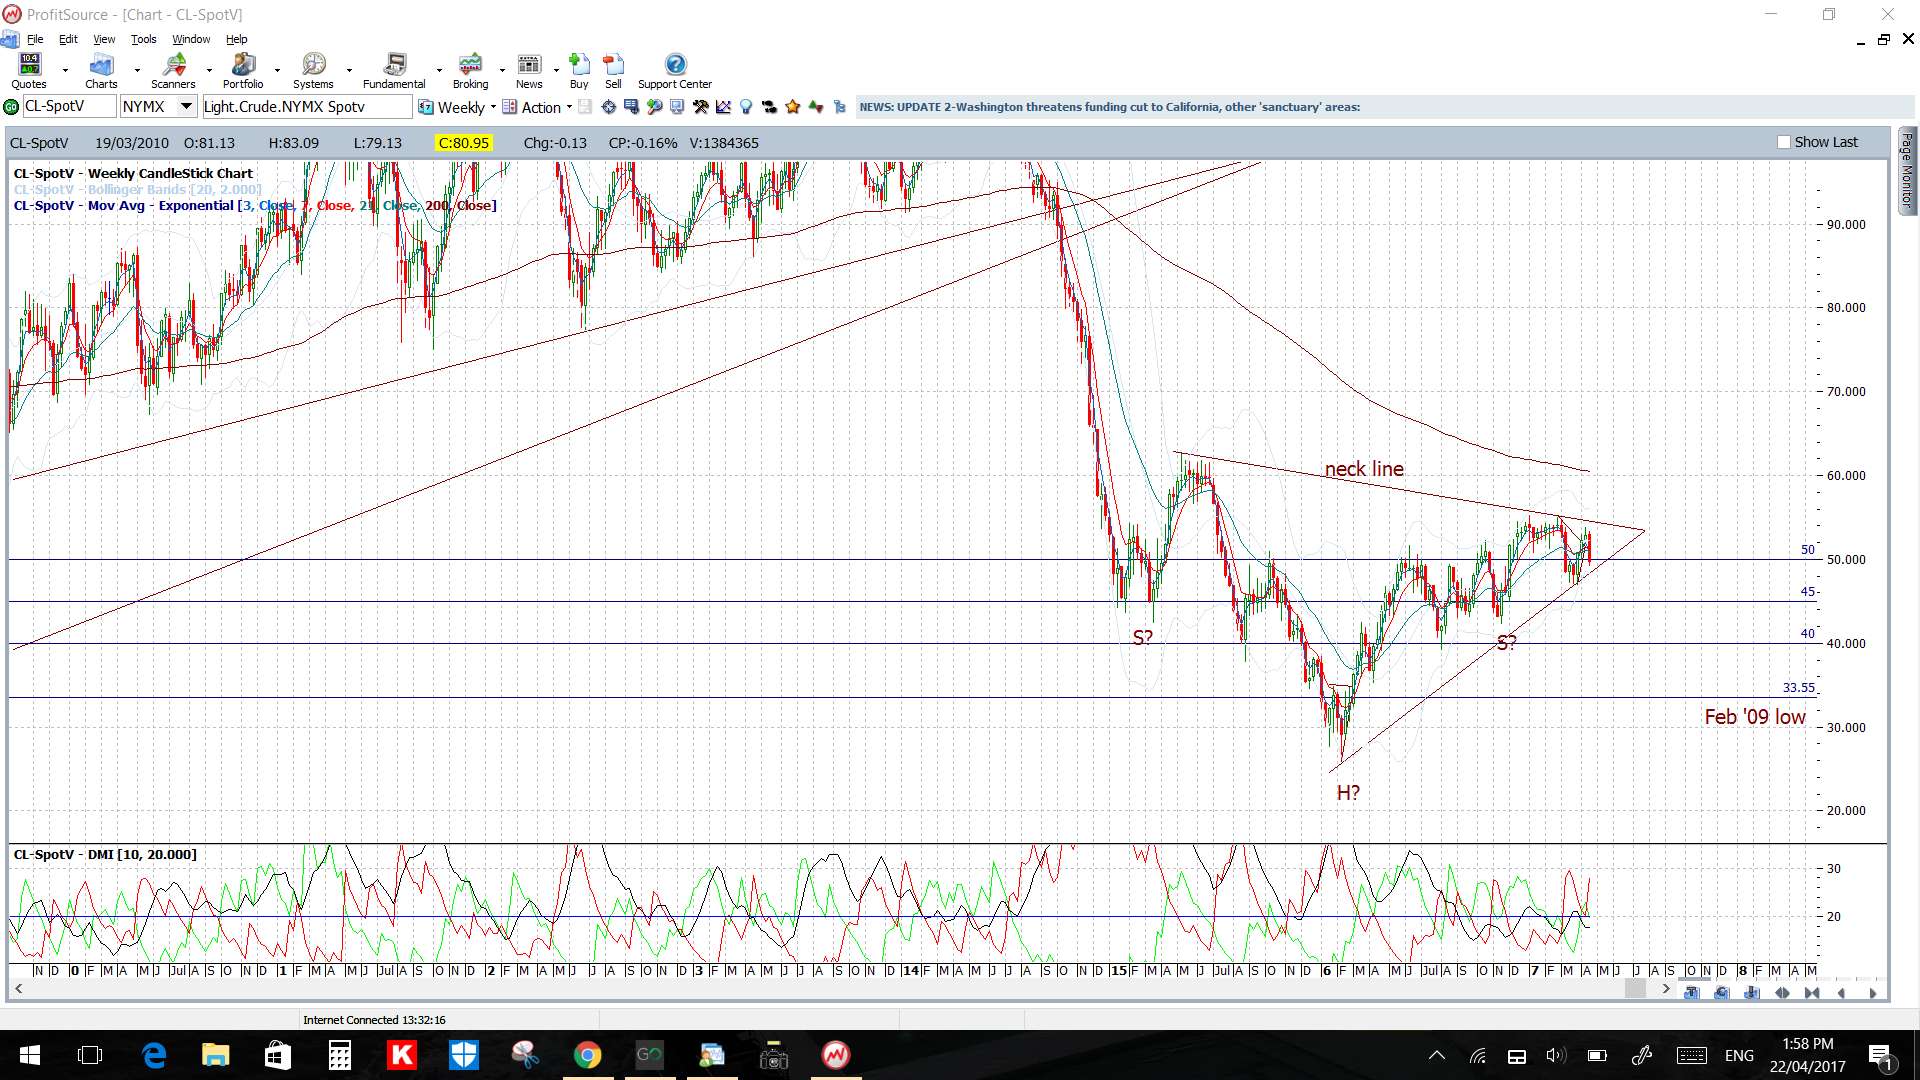
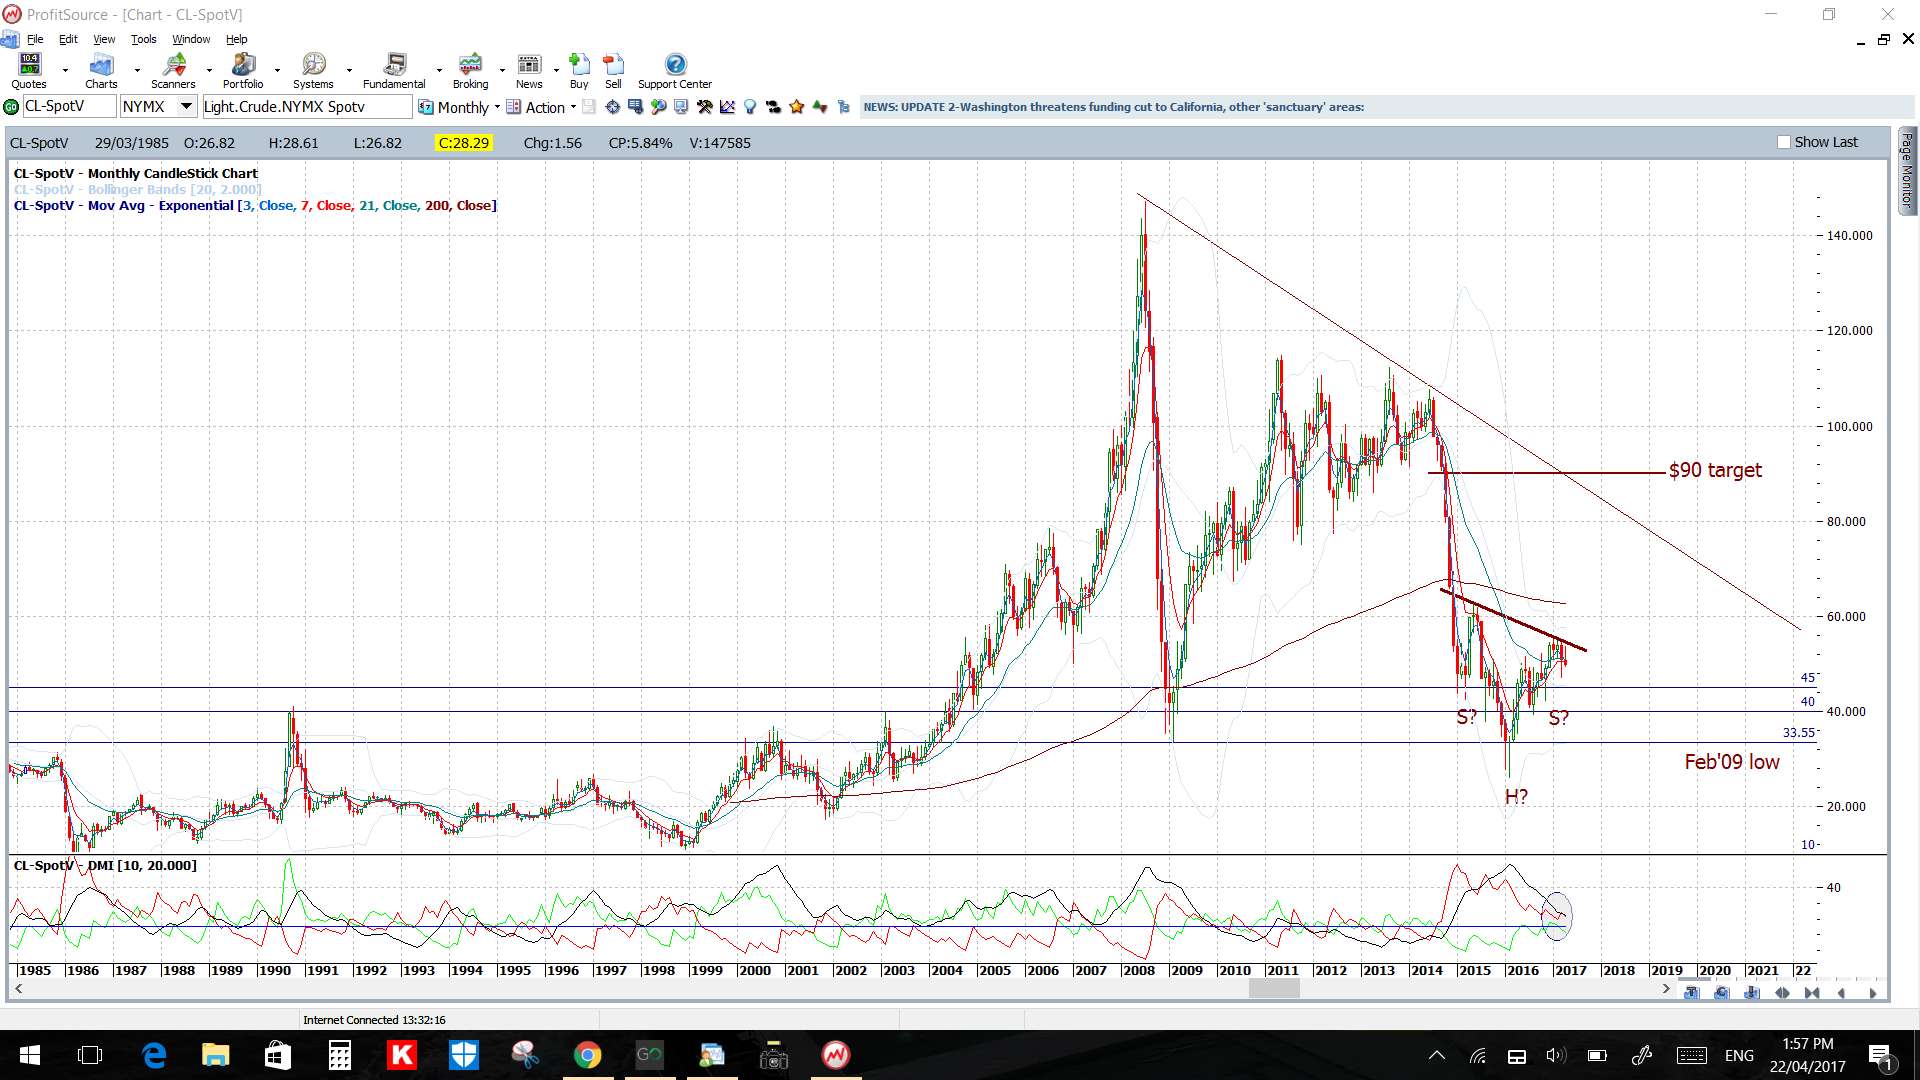
Oil: Oil gave a great trade during last week following the Flag breakdown: It gave a great 15 min chart TC SHORT signal during the week and then another great 5 min chart TC SHORT signal on Friday (see below).
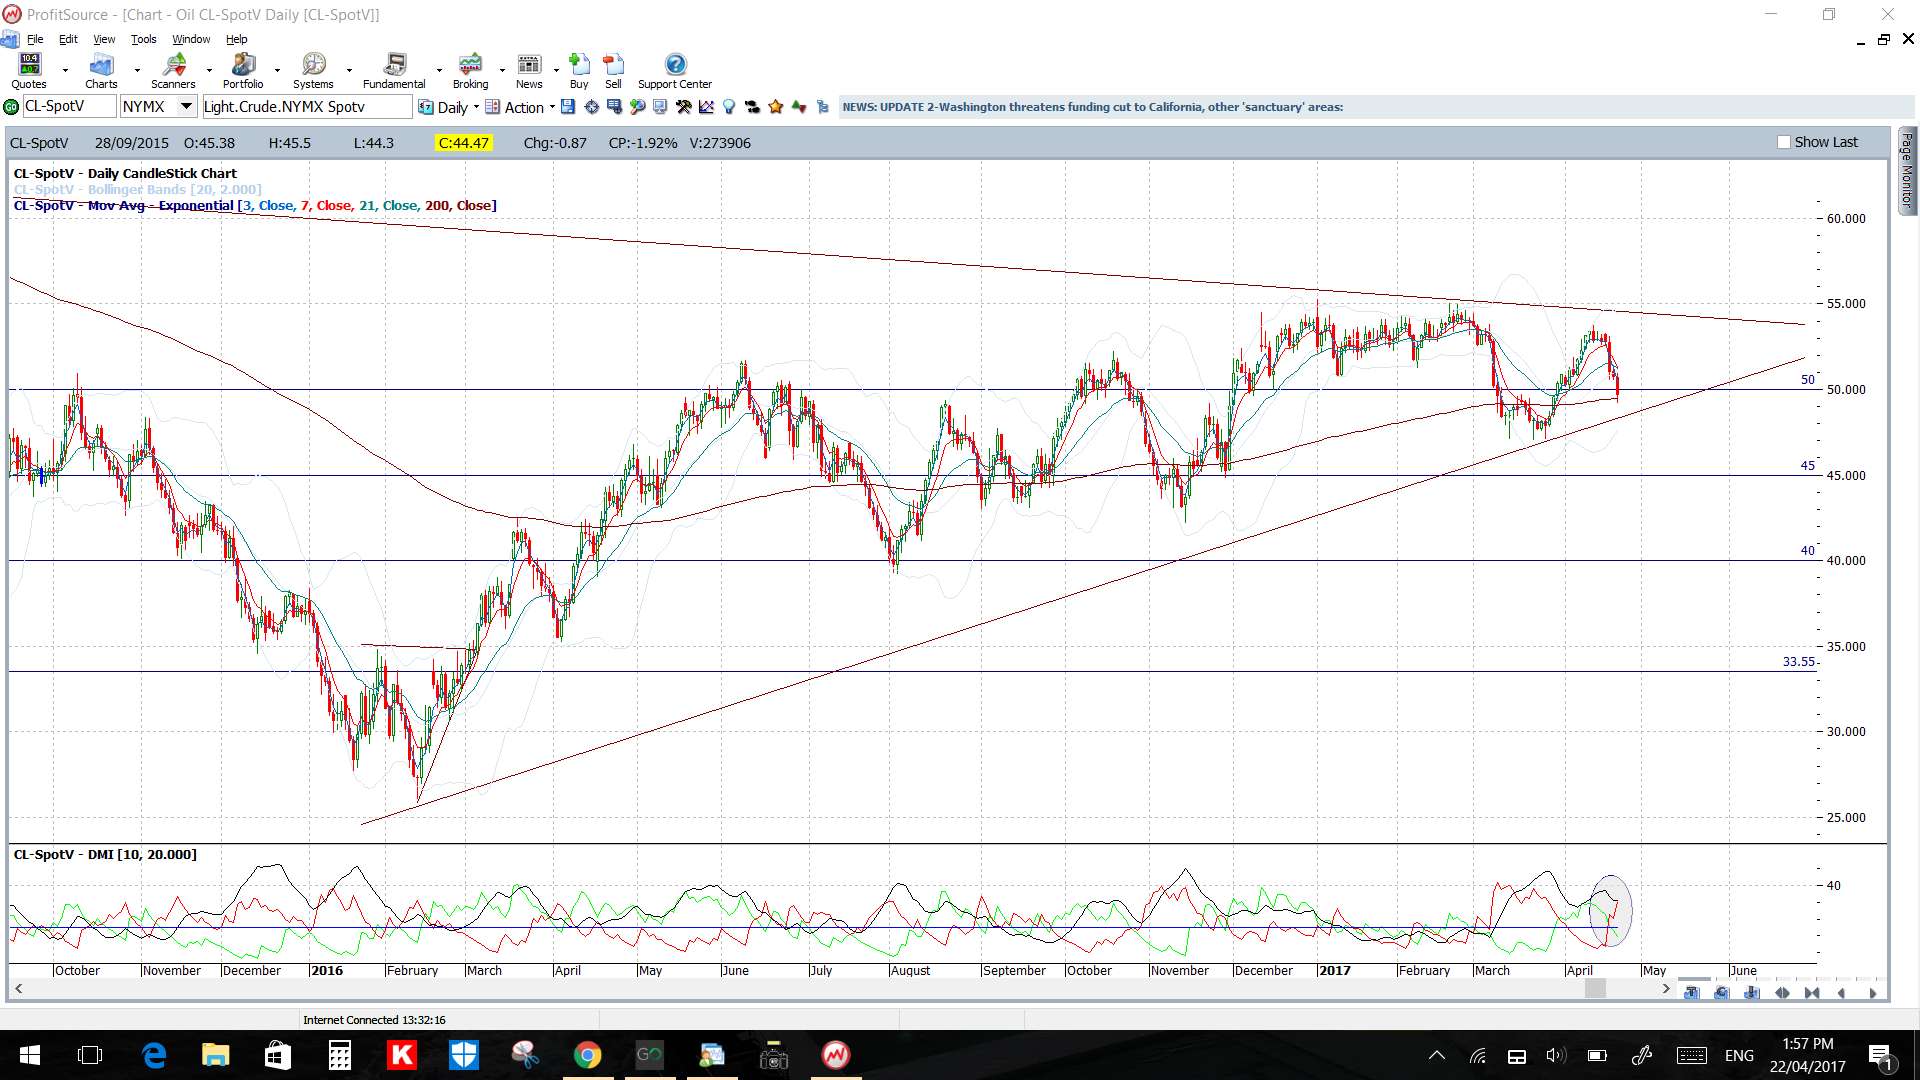
For the time being though, price action remains ranging within the daily chart’s triangle but watch trend lines here for any make or break activity.
Price is below the 4hr and daily Cloud.
The weekly candle was a large bearish engulfing candle.
Forex:
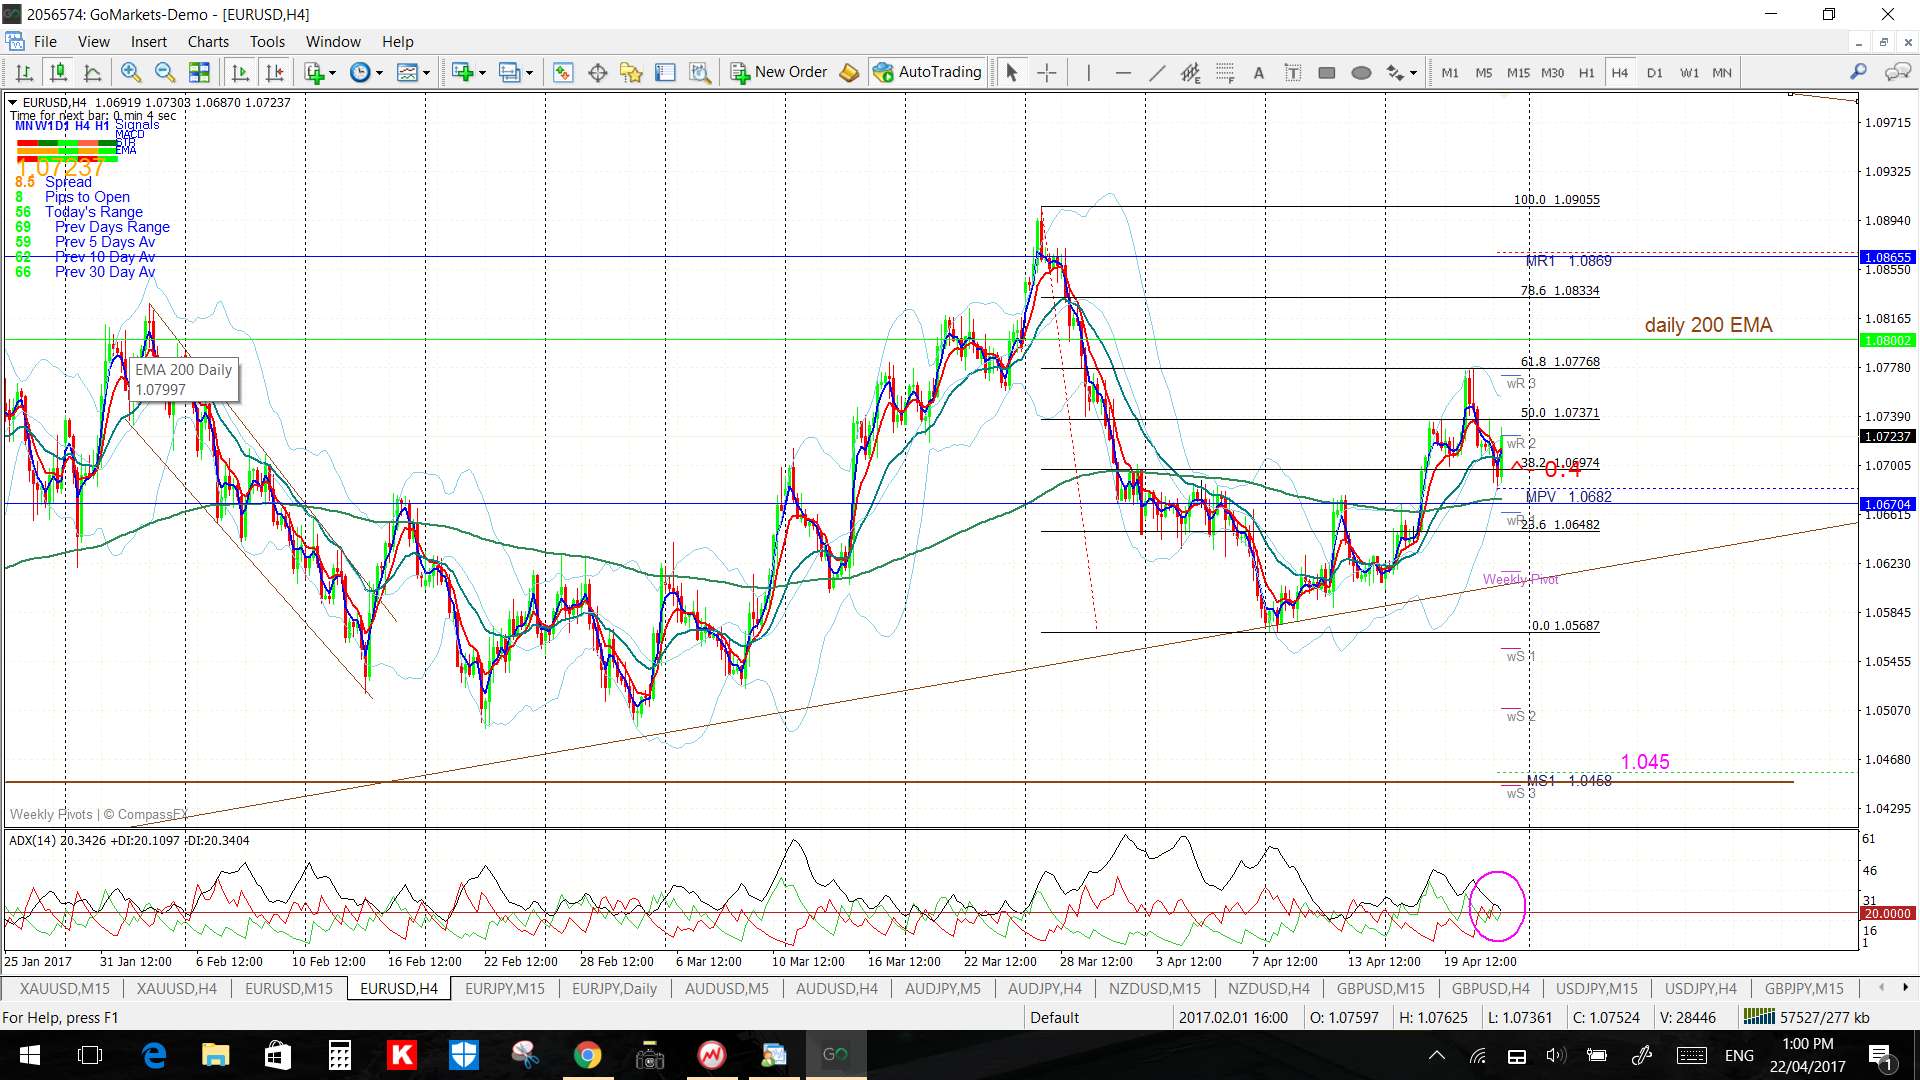
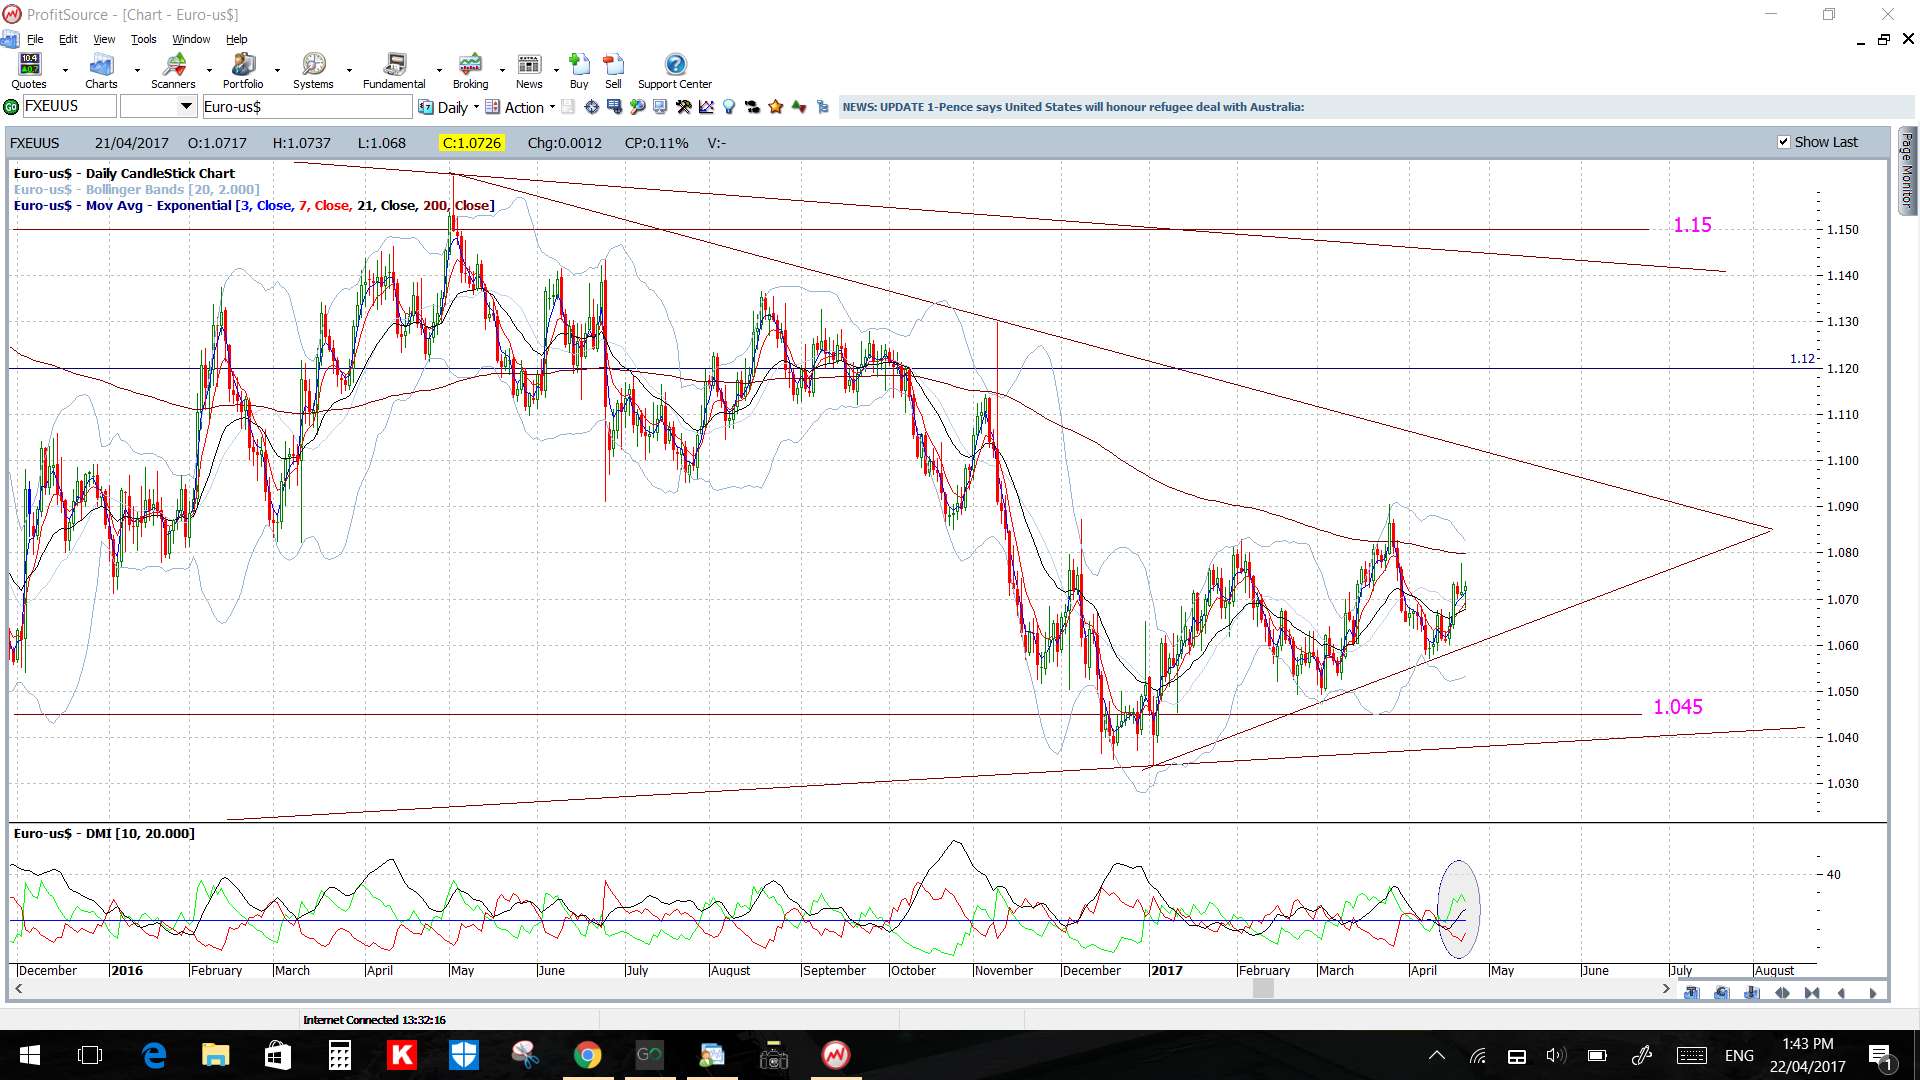
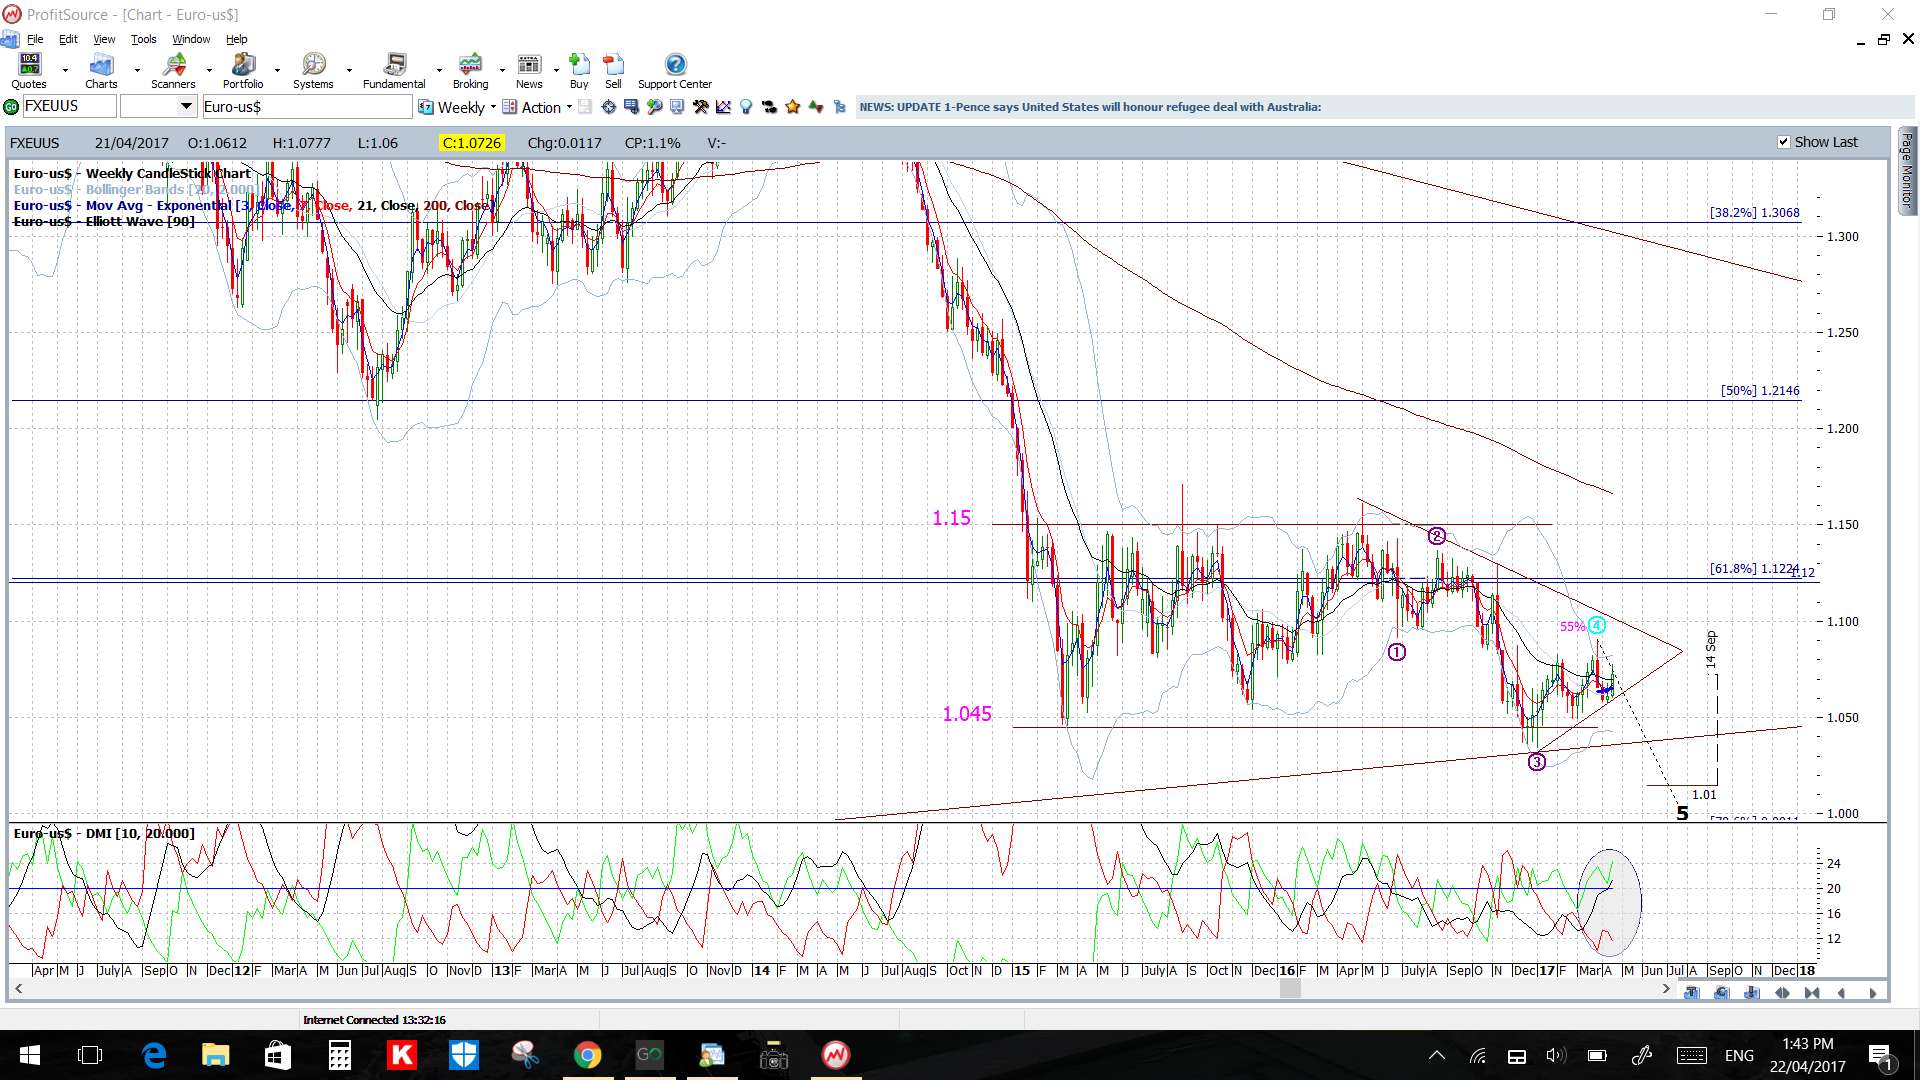
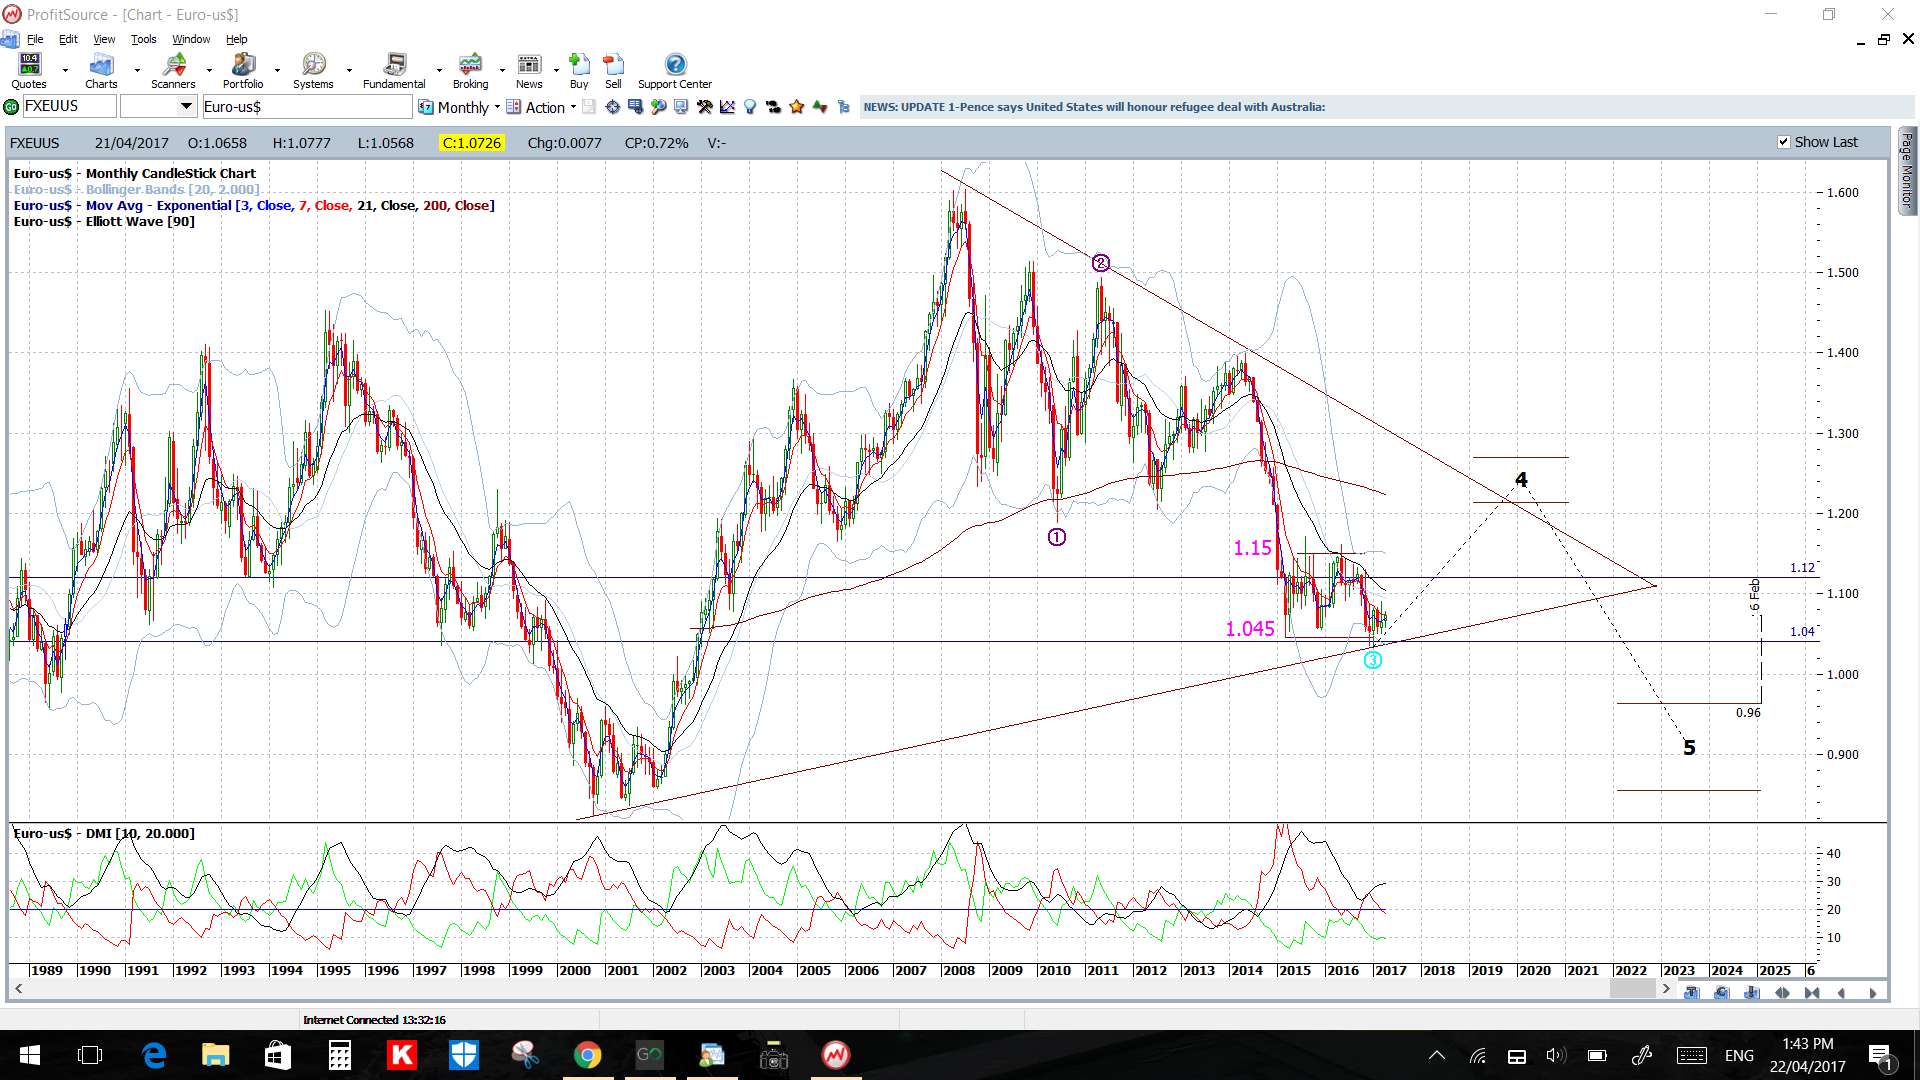
EUR/USD: Price action bounced up from the bottom of the daily chart’s triangle last week and retraced to the 4hr chart’s 61.8% fib in text book fashion.
There is a lot of data to impact this pair in the coming week though with the weekend French Elections and, then, the ECB rate update. So for this week, the EUR/USD might be more suited to trading any strong momentum moves off the shorter time frame charts.
Price is above the 4hr and daily Cloud.
The weekly candle was bullish.
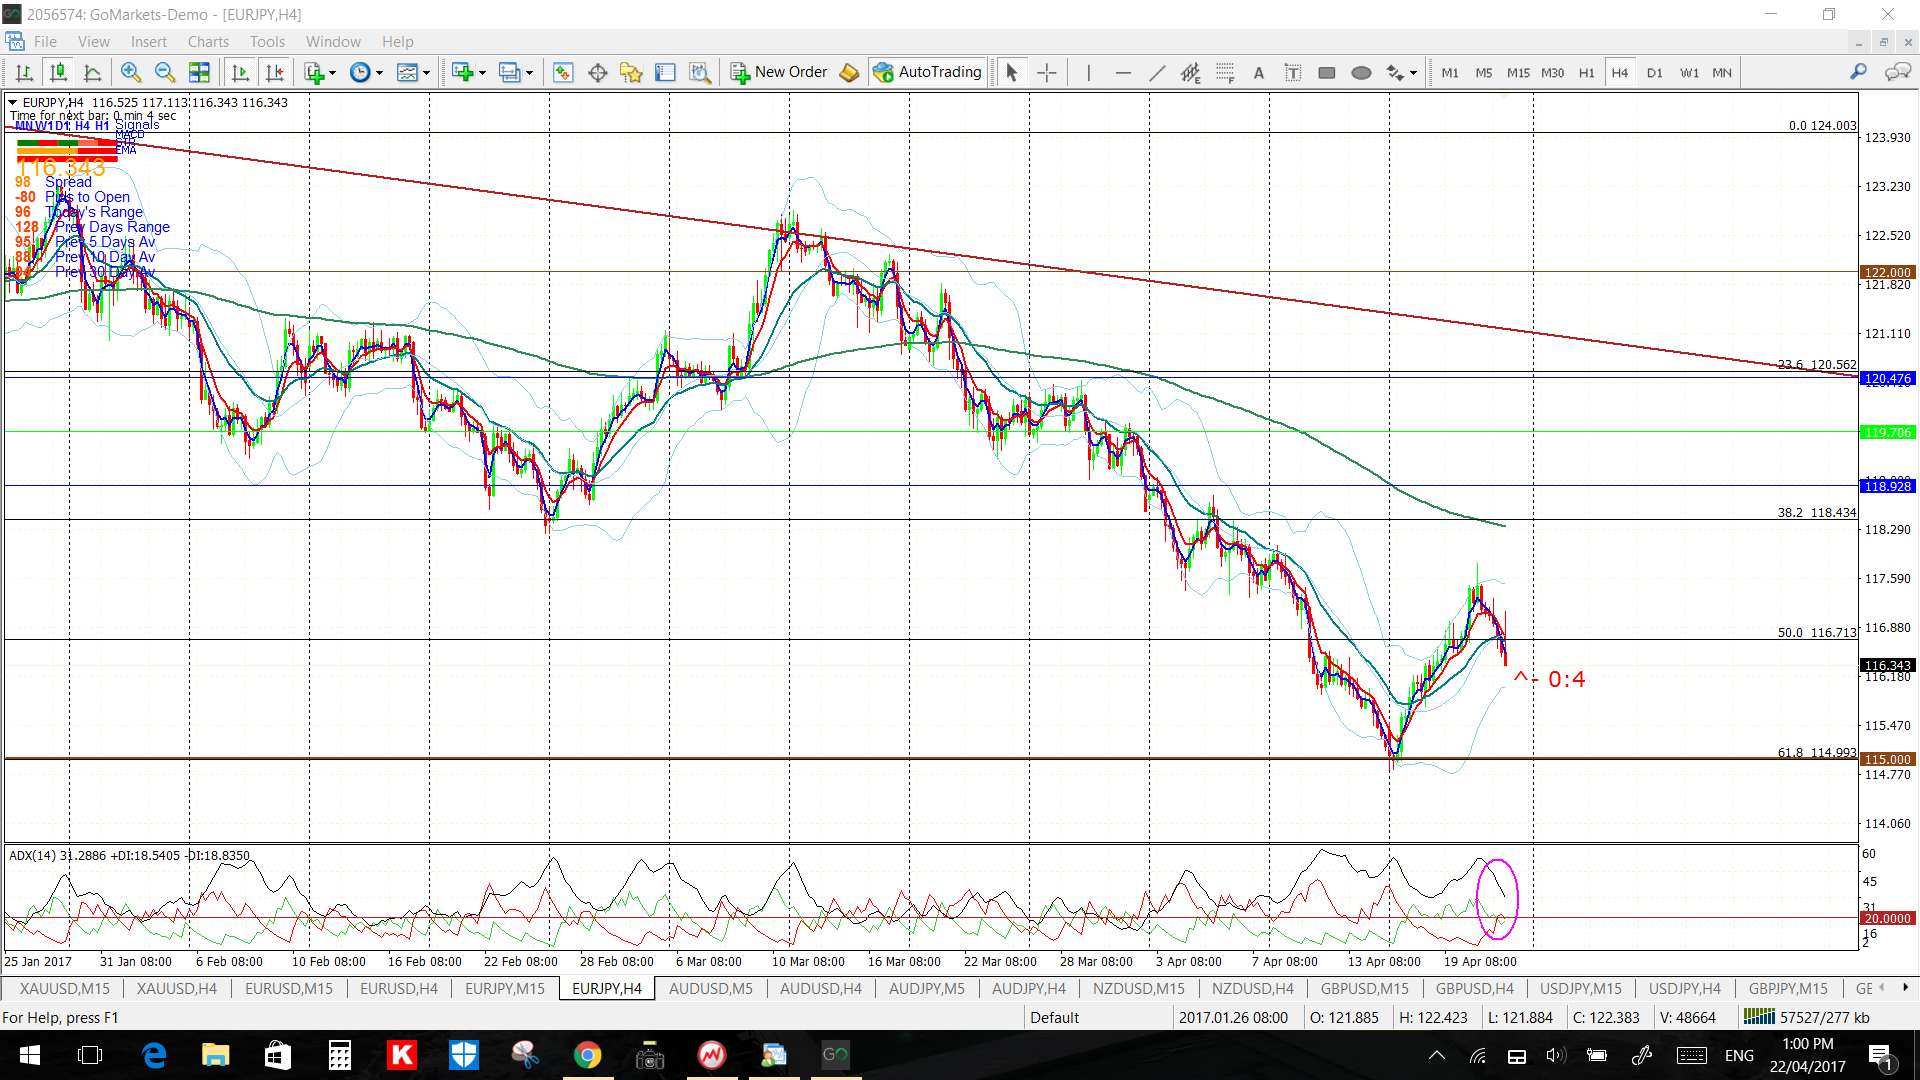
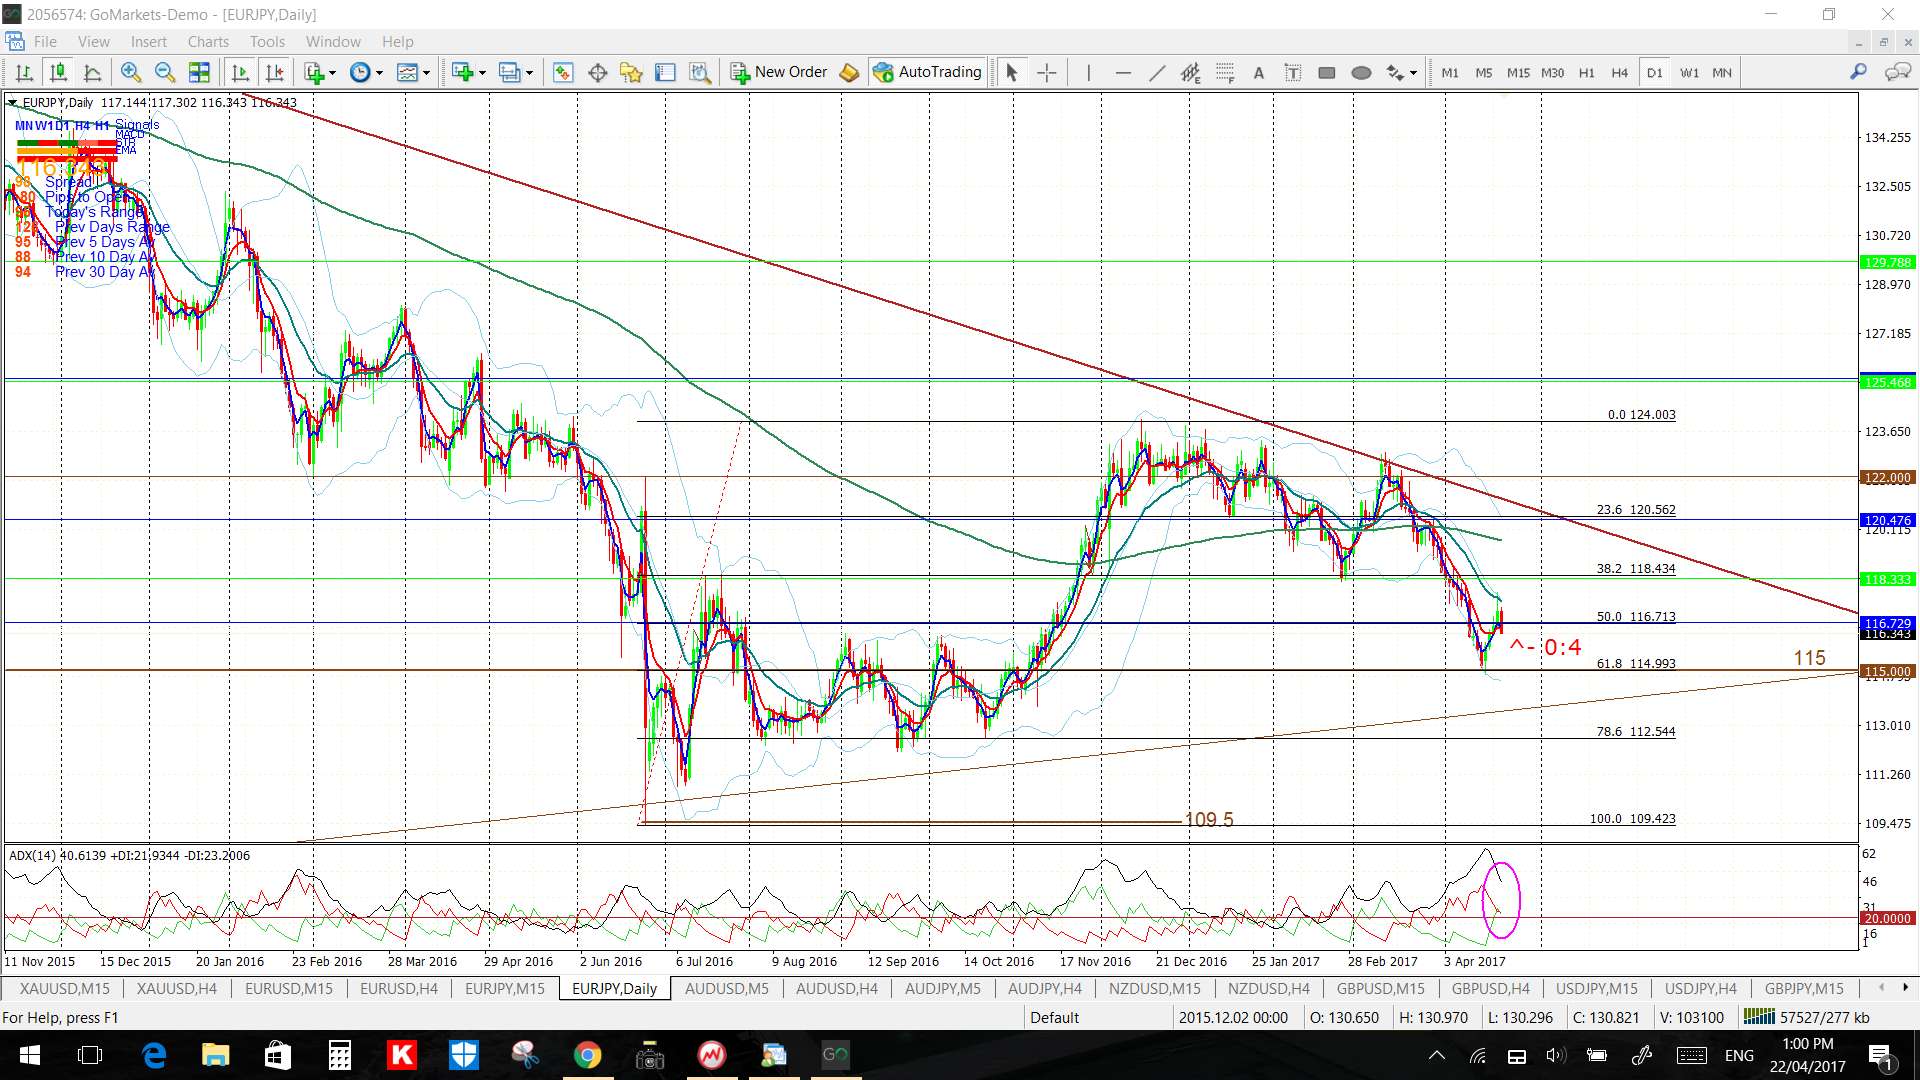
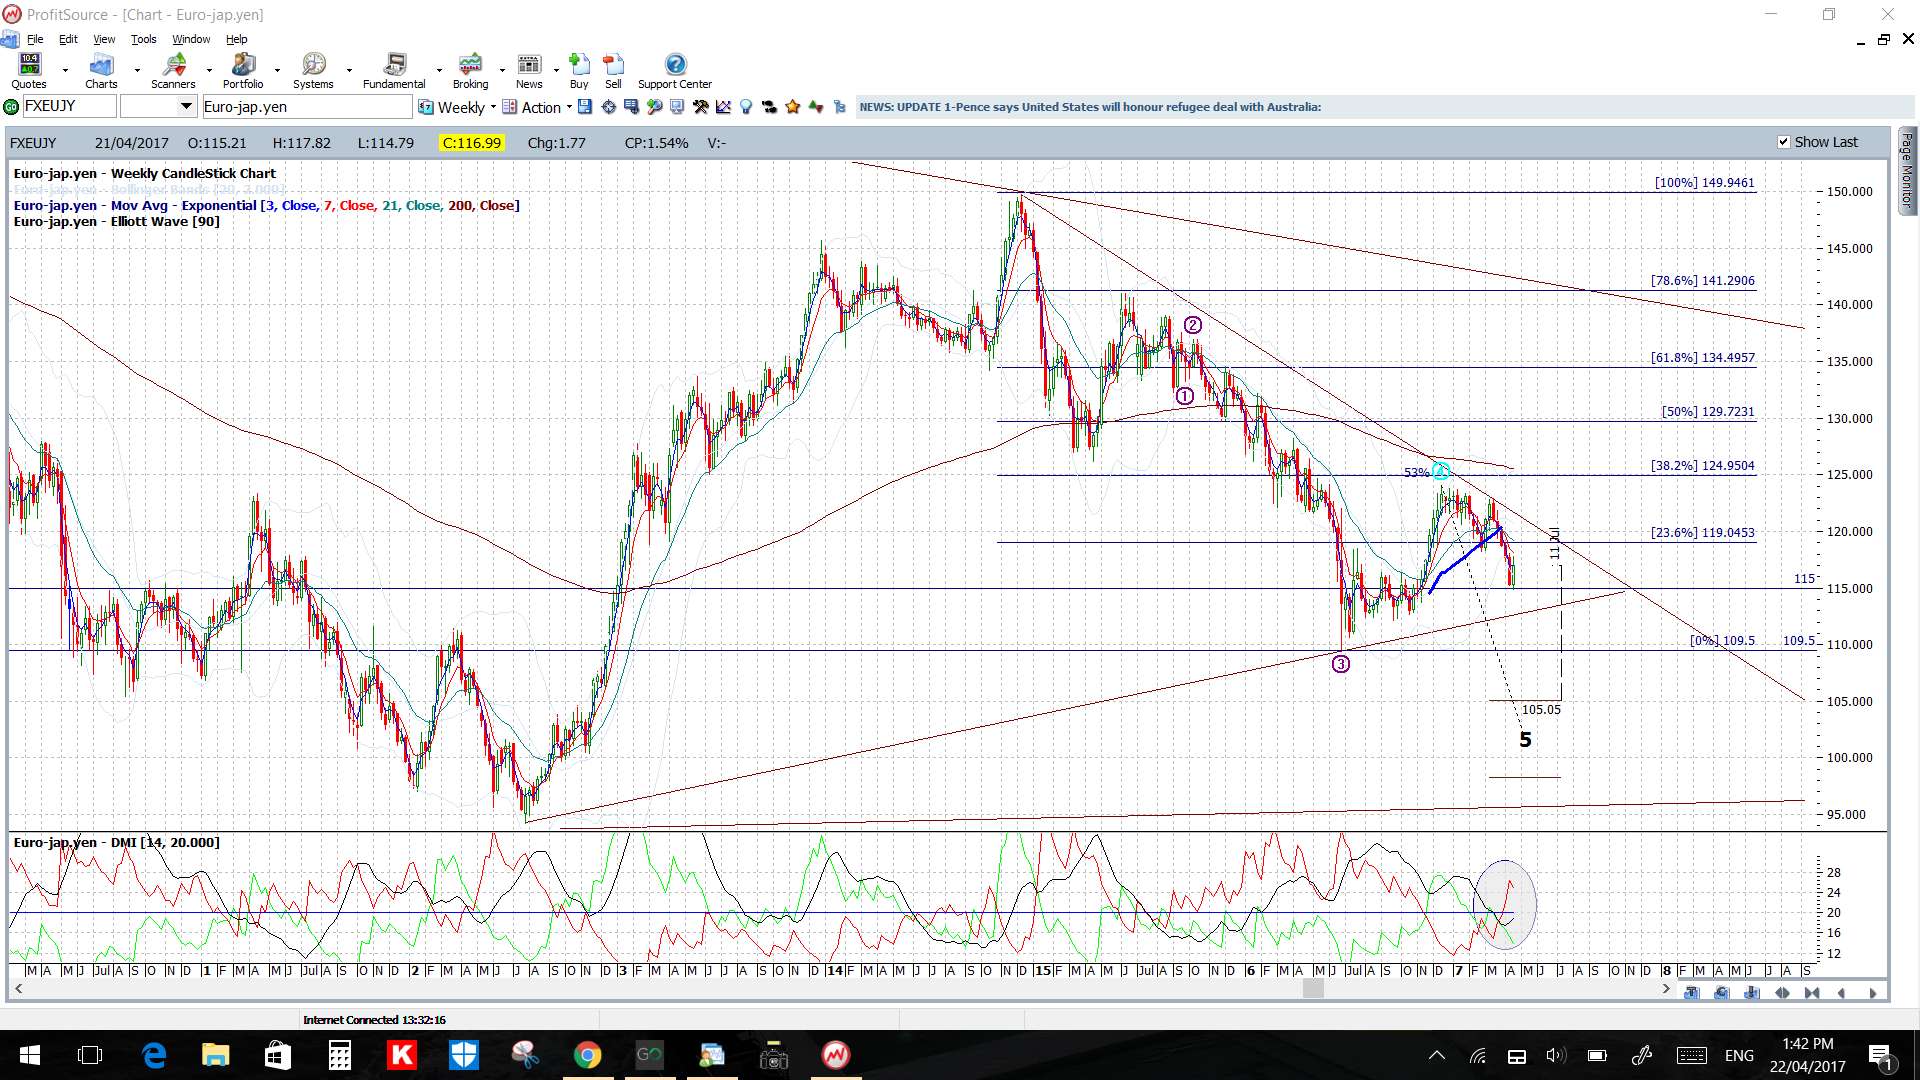
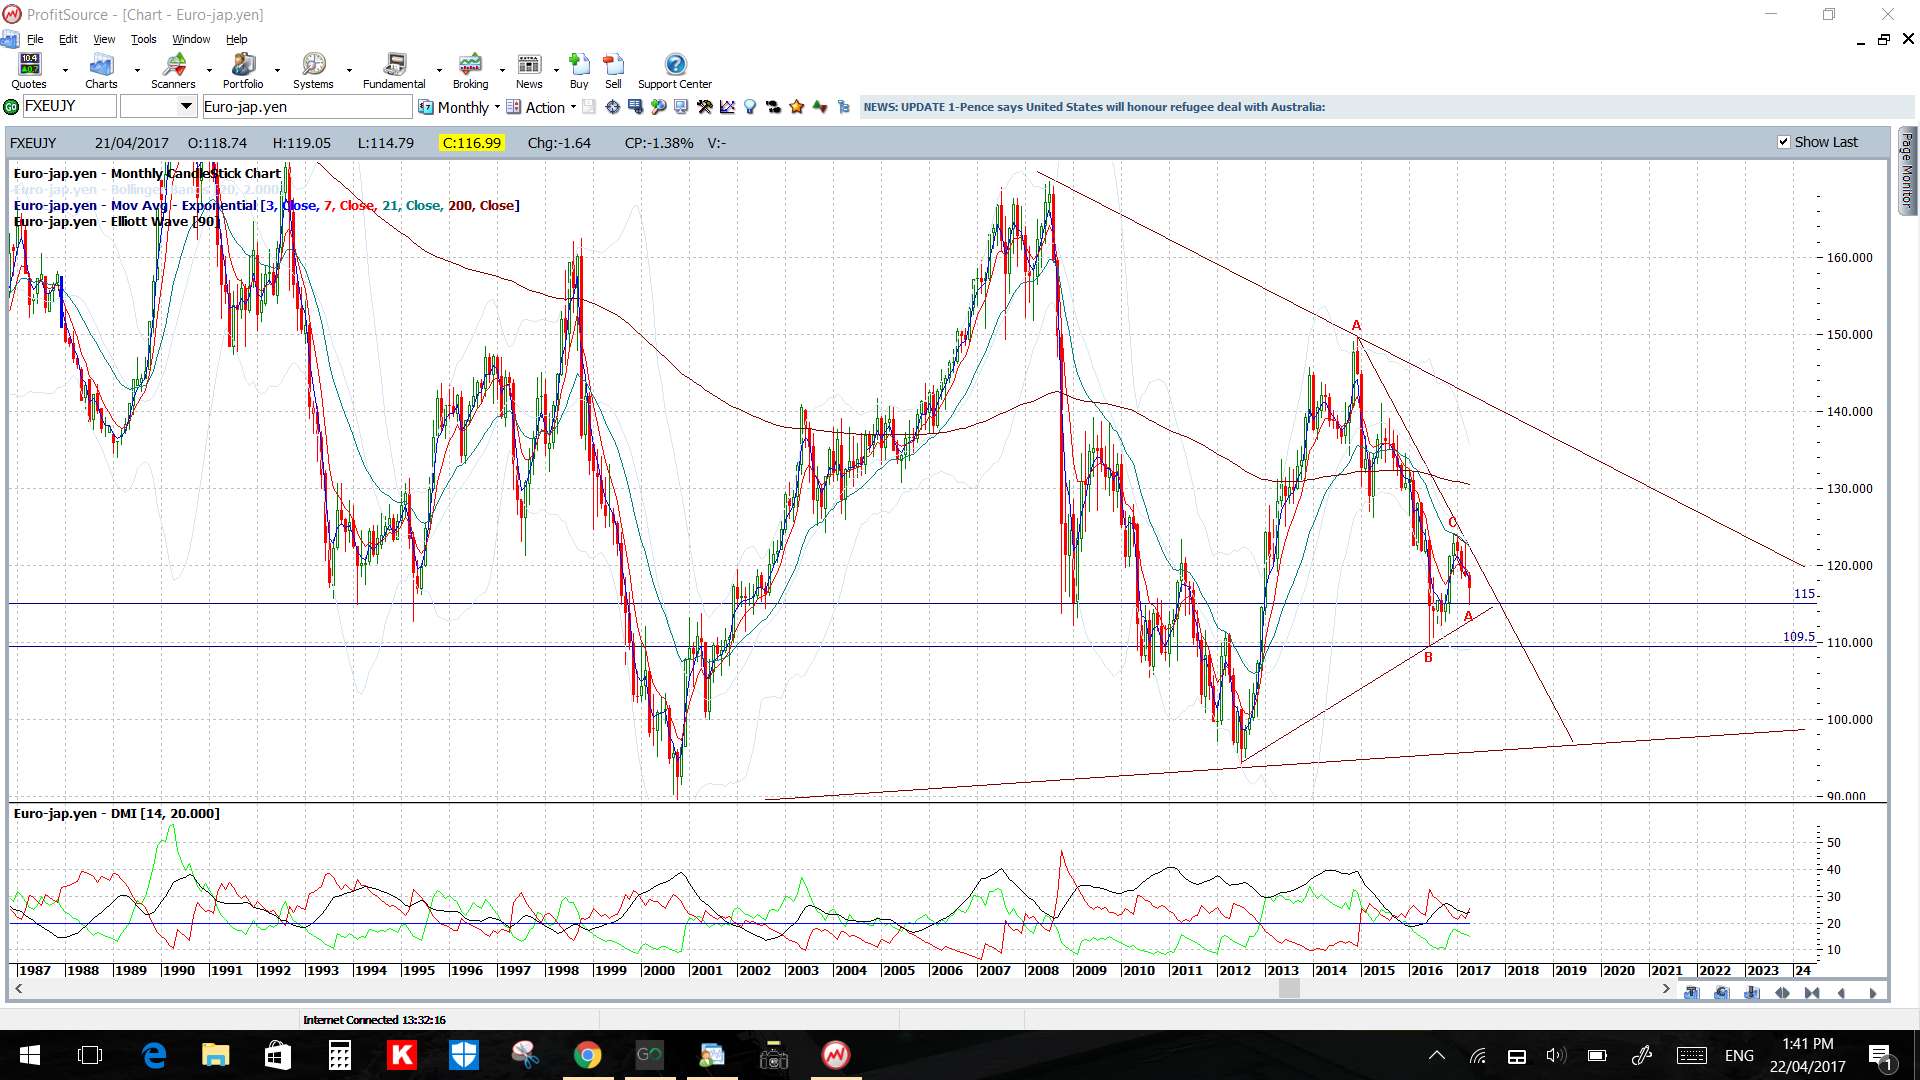
EUR/JPY: The E/J has held above 115 support and remains in a daily chart triangle so watch these trend lines for any make or break.
Price is in the 4hr Cloud but below the daily Cloud.
The weekly candle closed as a bullish coloured ‘Inside’ candle reflecting indecision.
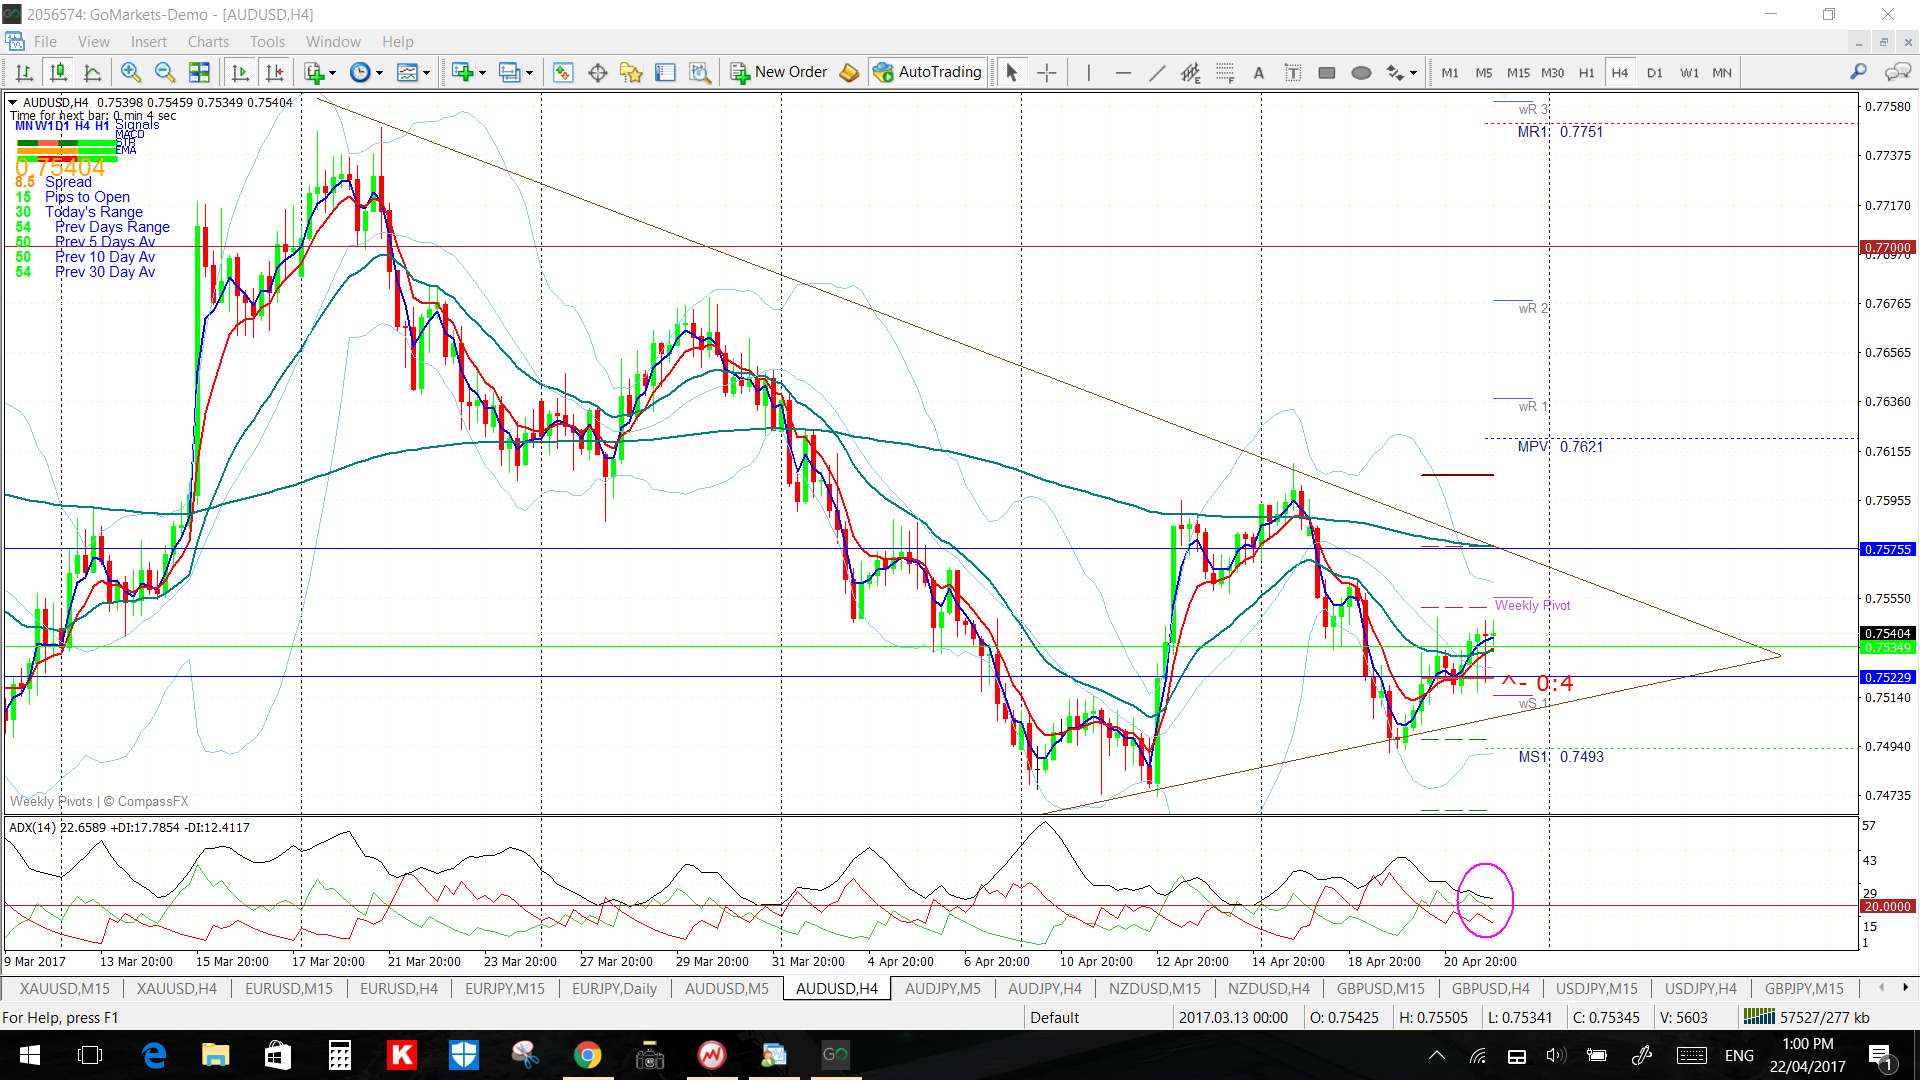
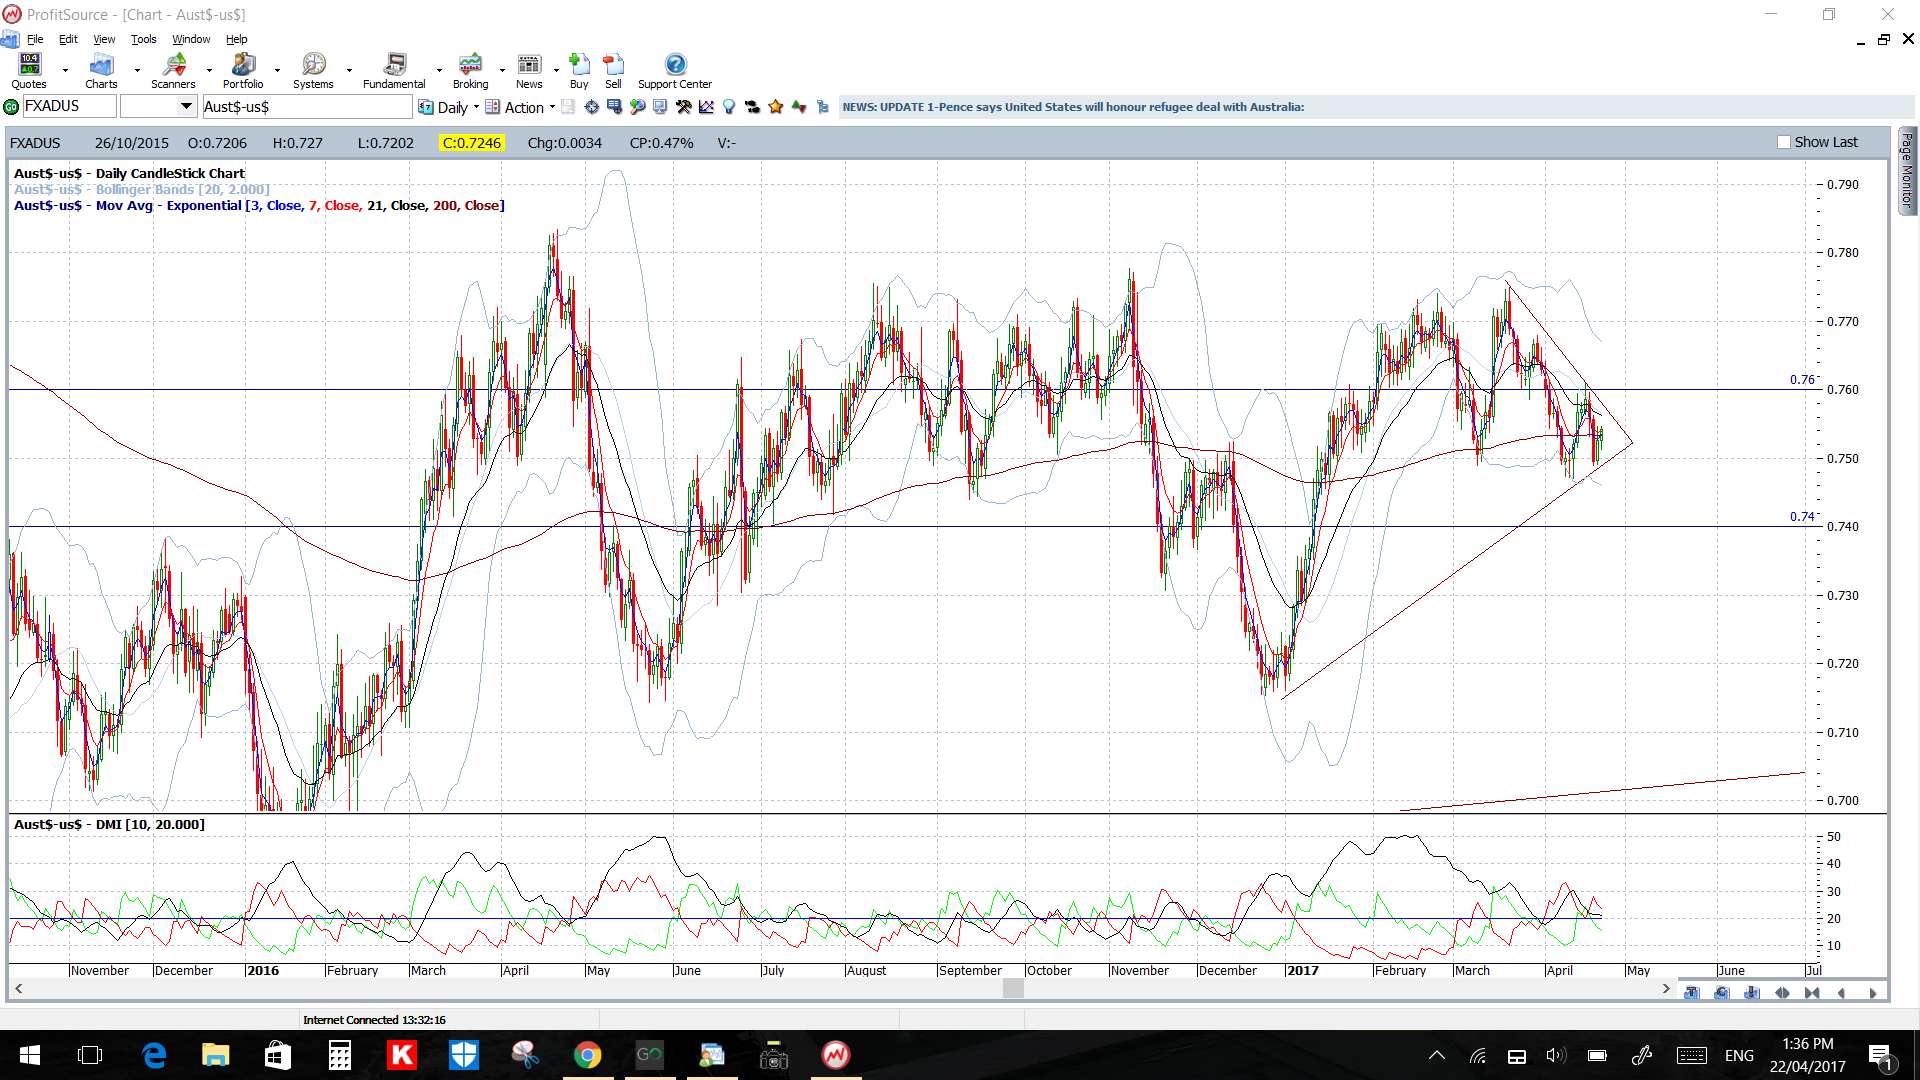
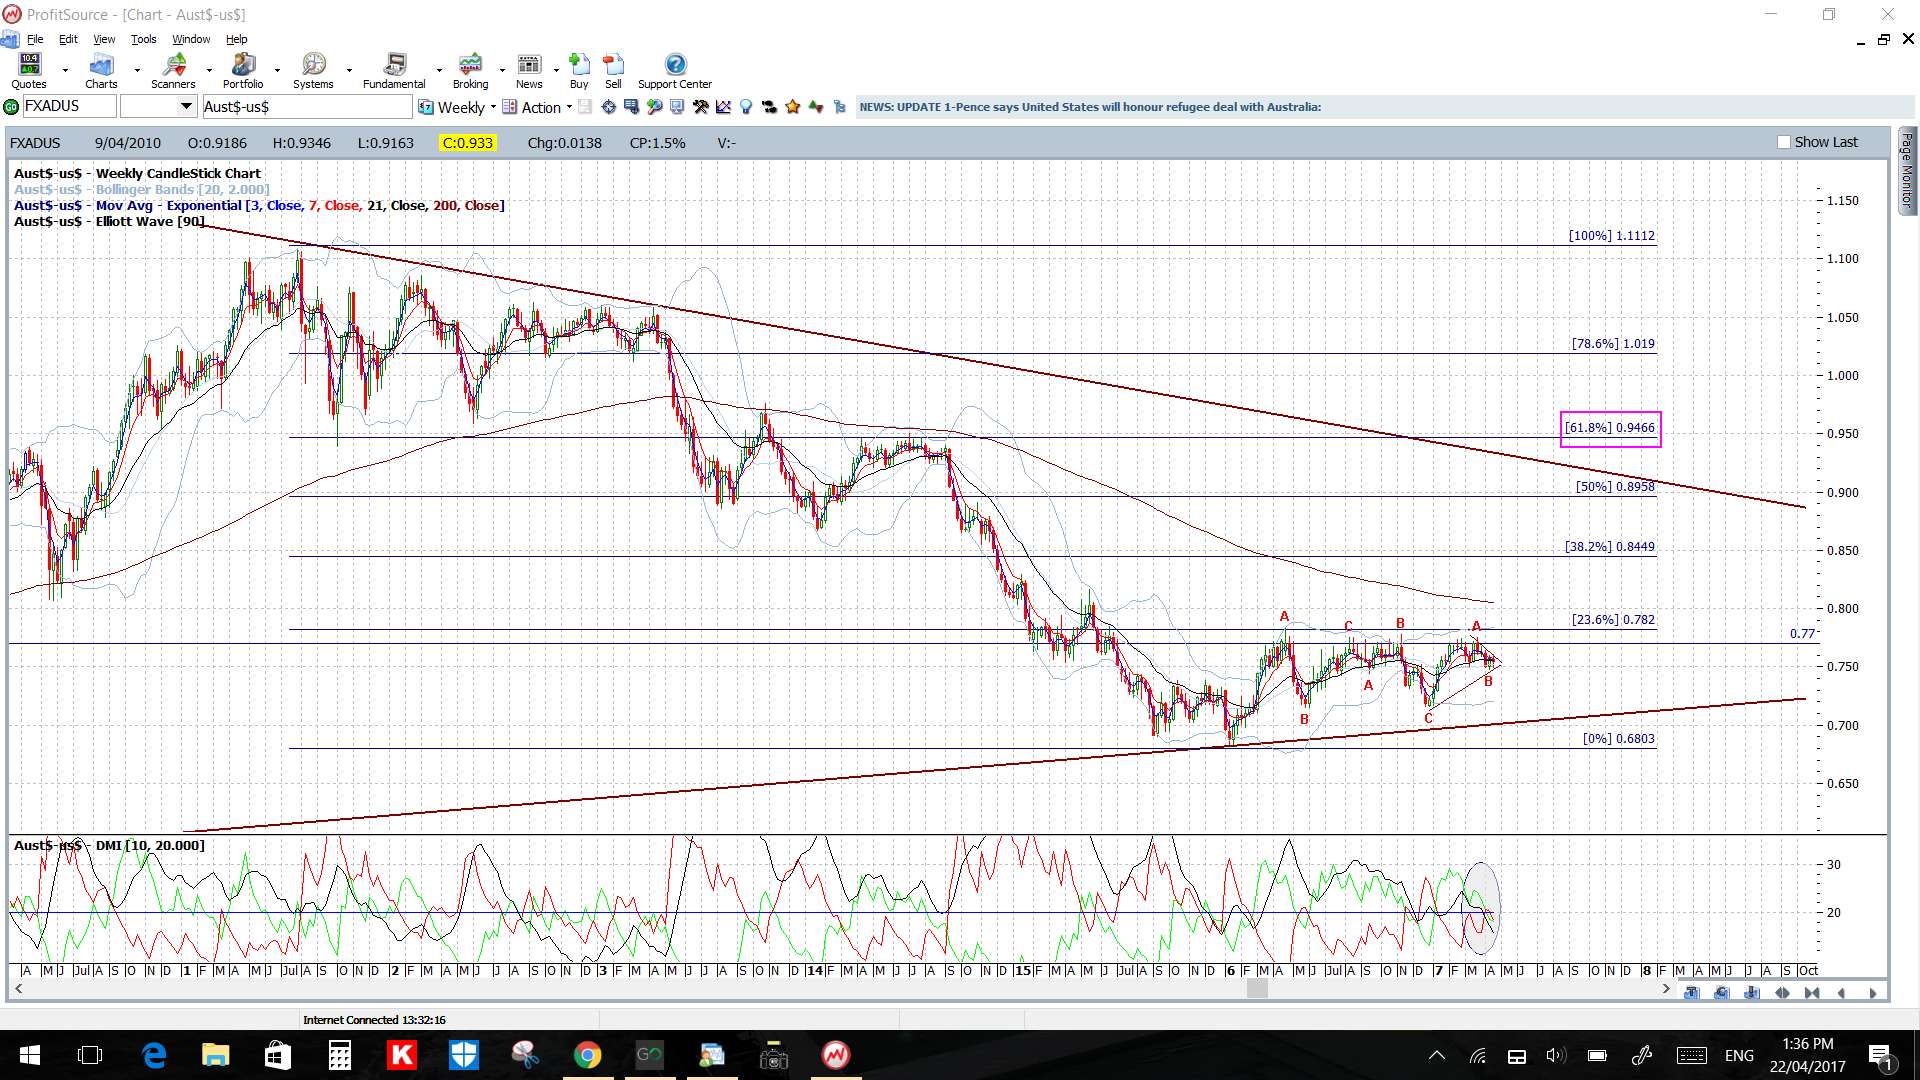
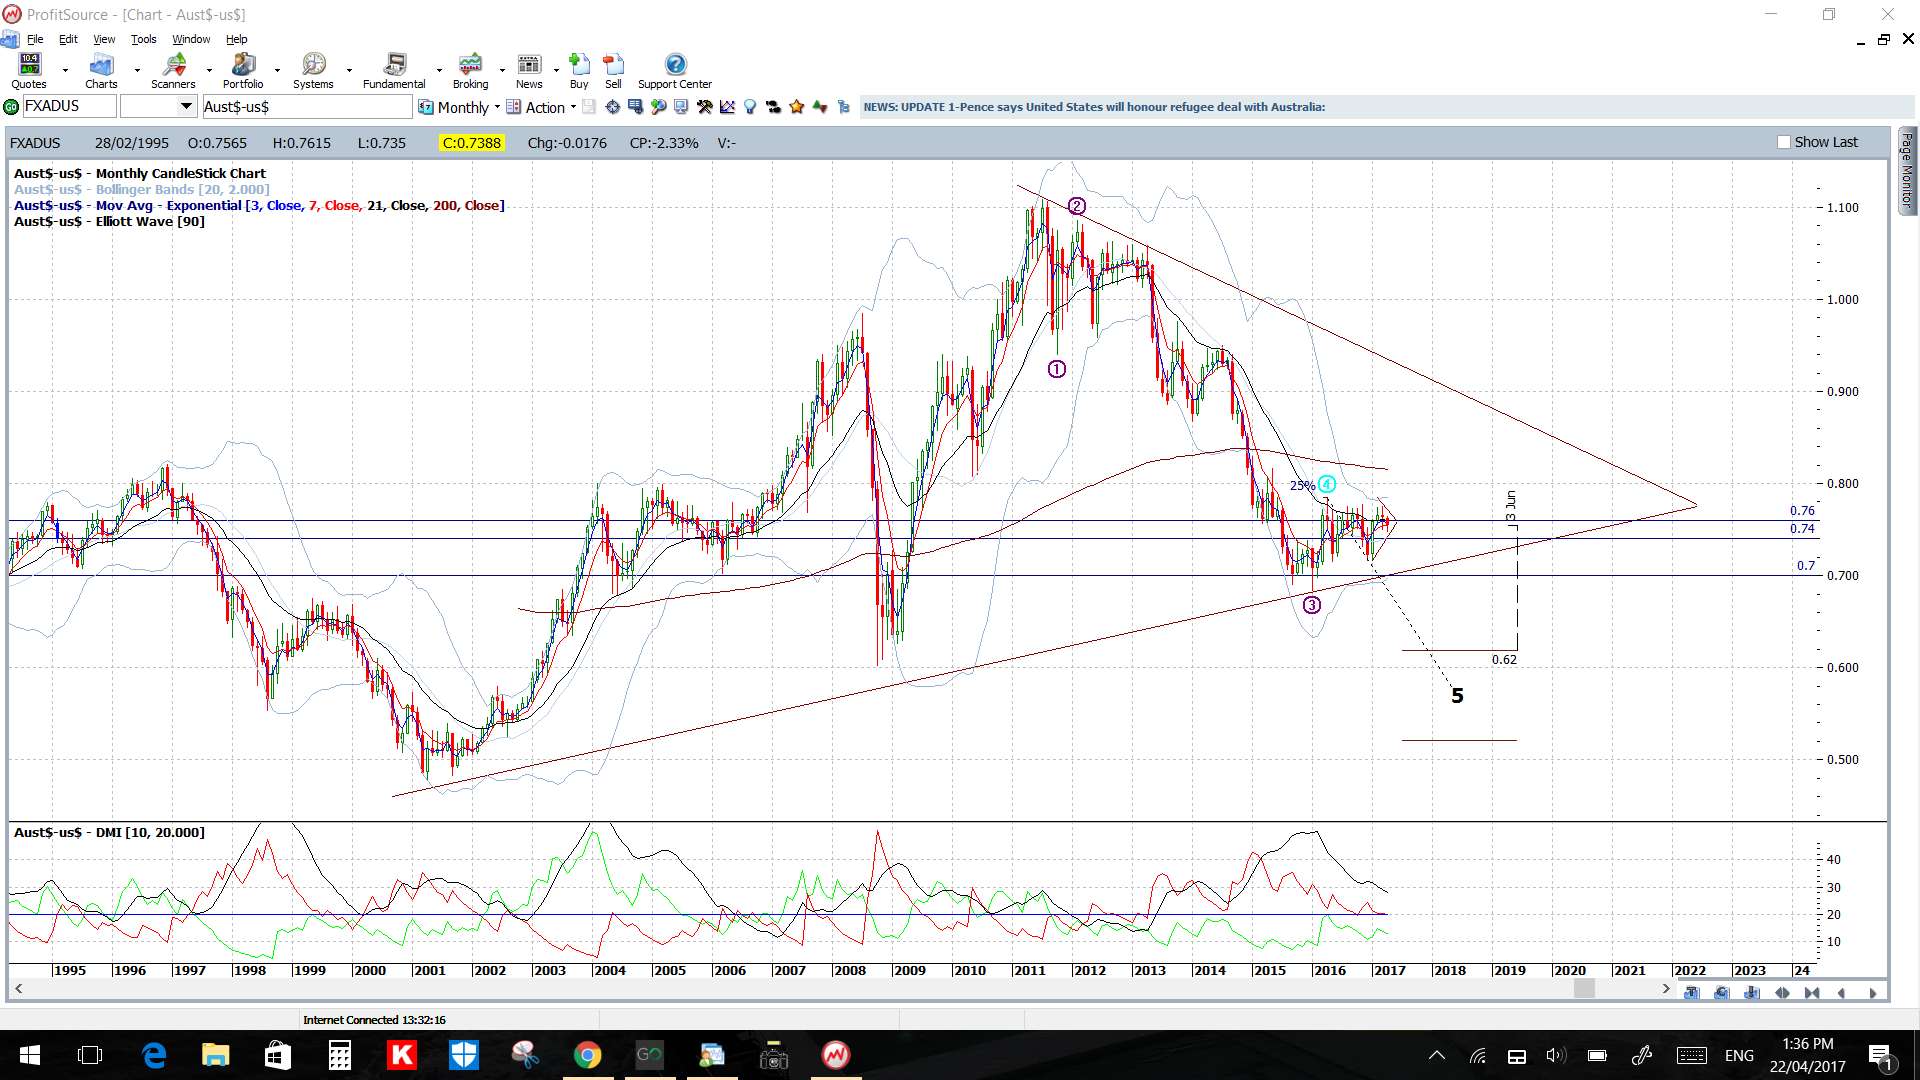
AUD/USD: The Aussie remains in a 4hr chart triangle so watch trend lines for any make or break activity.
Price is in the 4hr and daily Cloud.
The weekly candle closed as a bearish coloured ‘Inside’ candle reflecting indecision.
Watch for impact from AUD CPI this week.
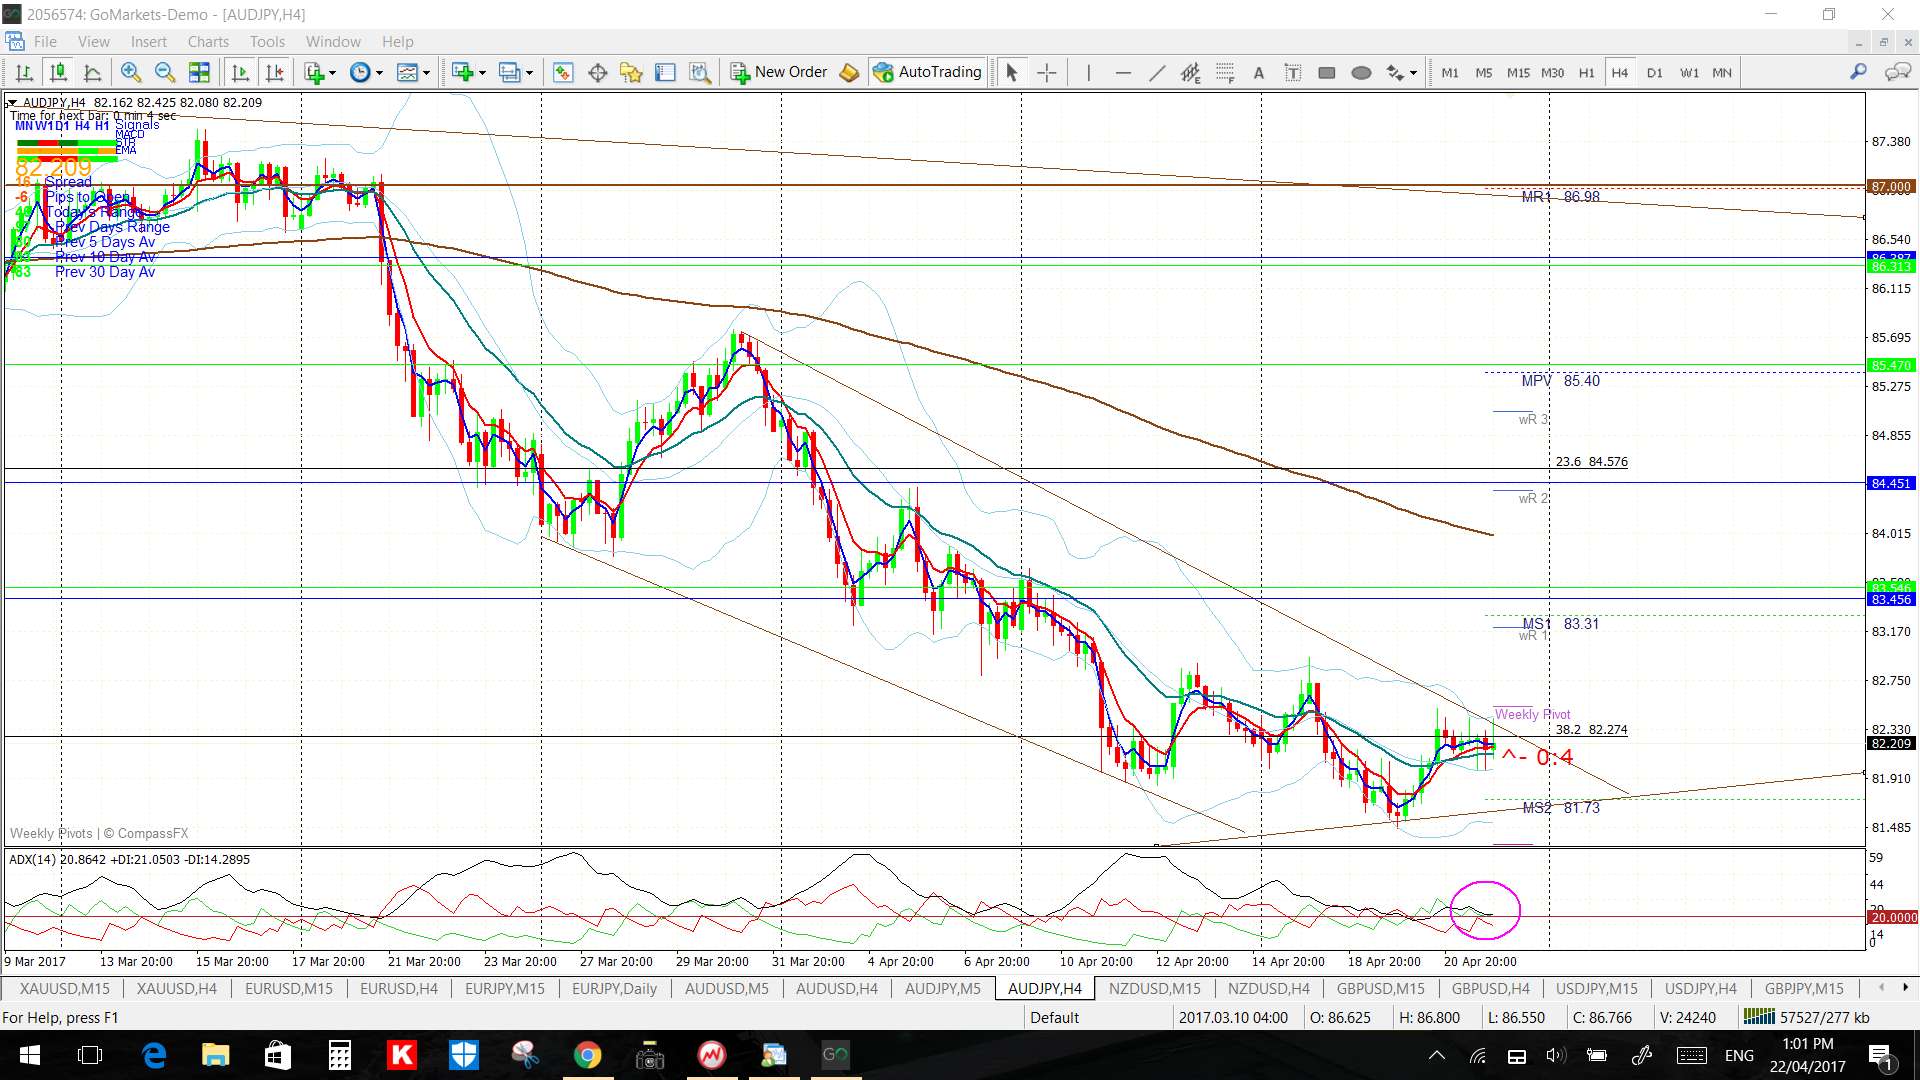
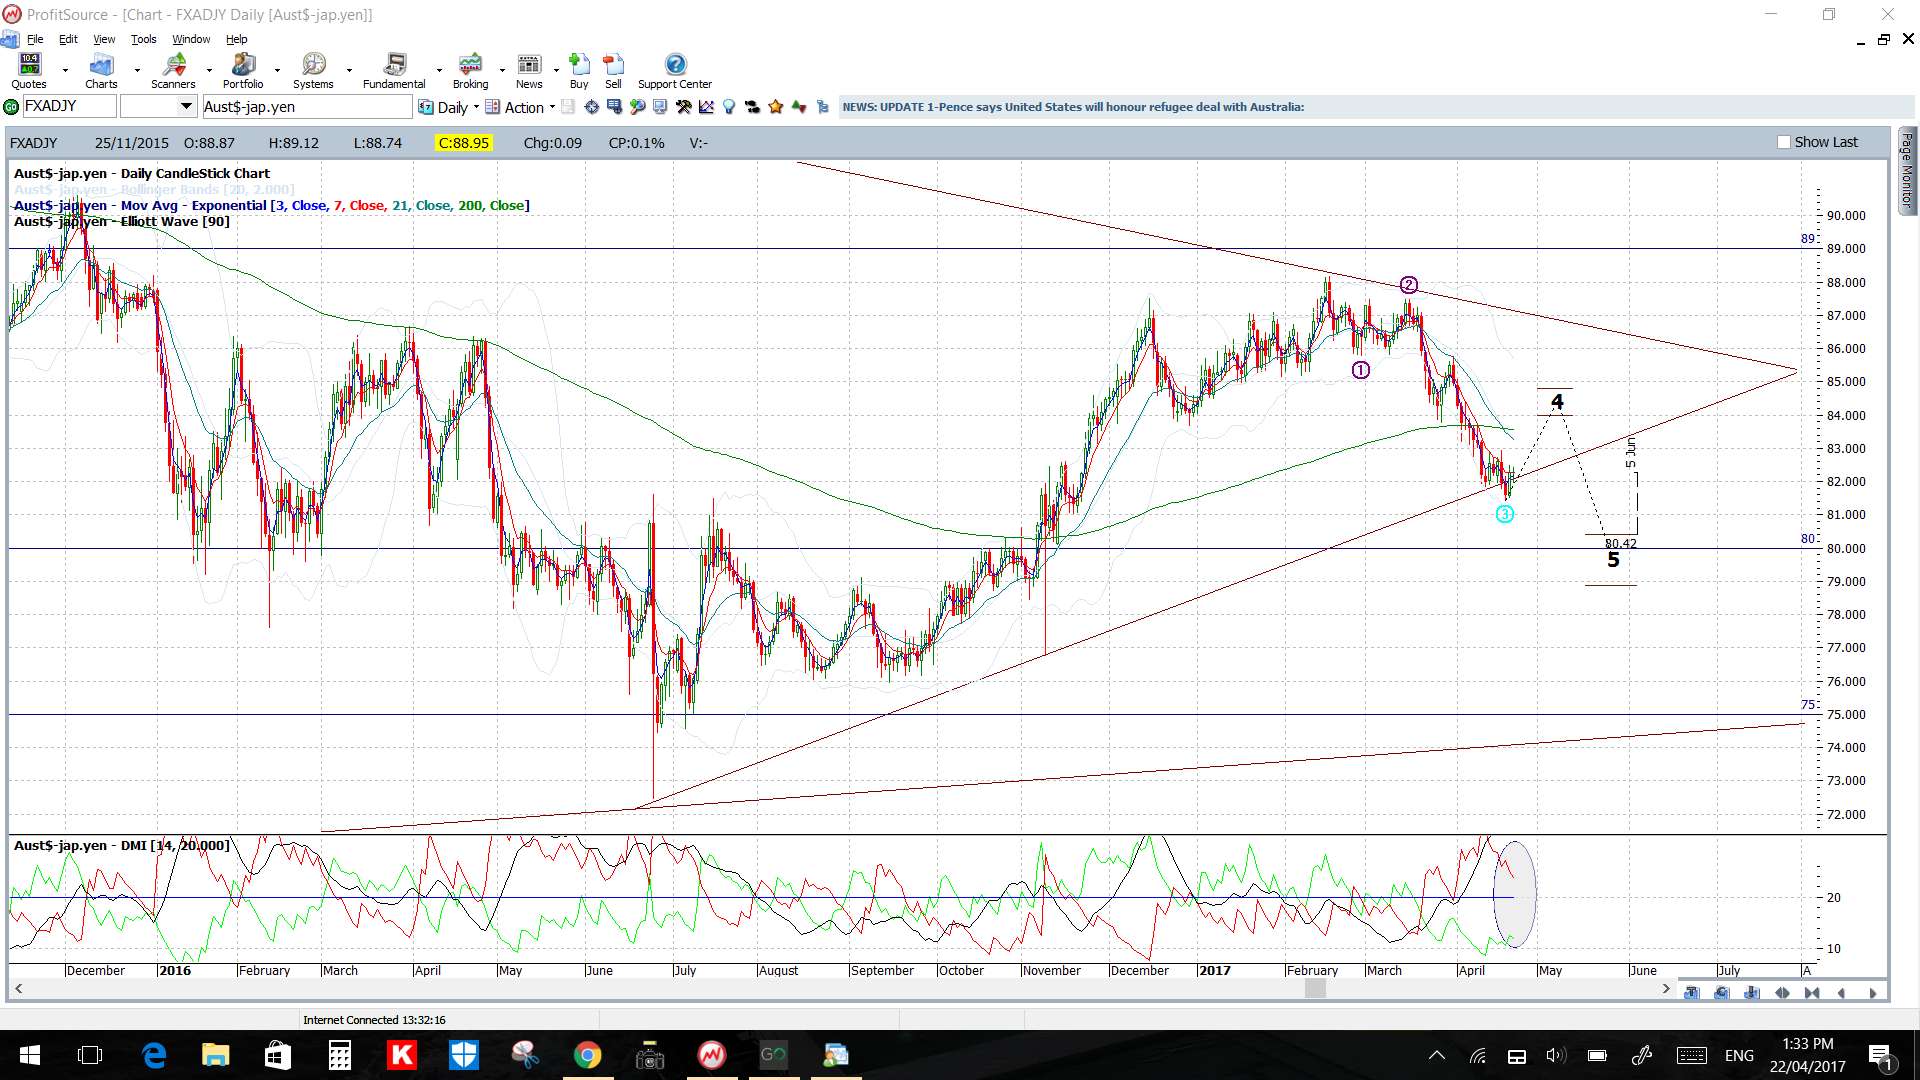
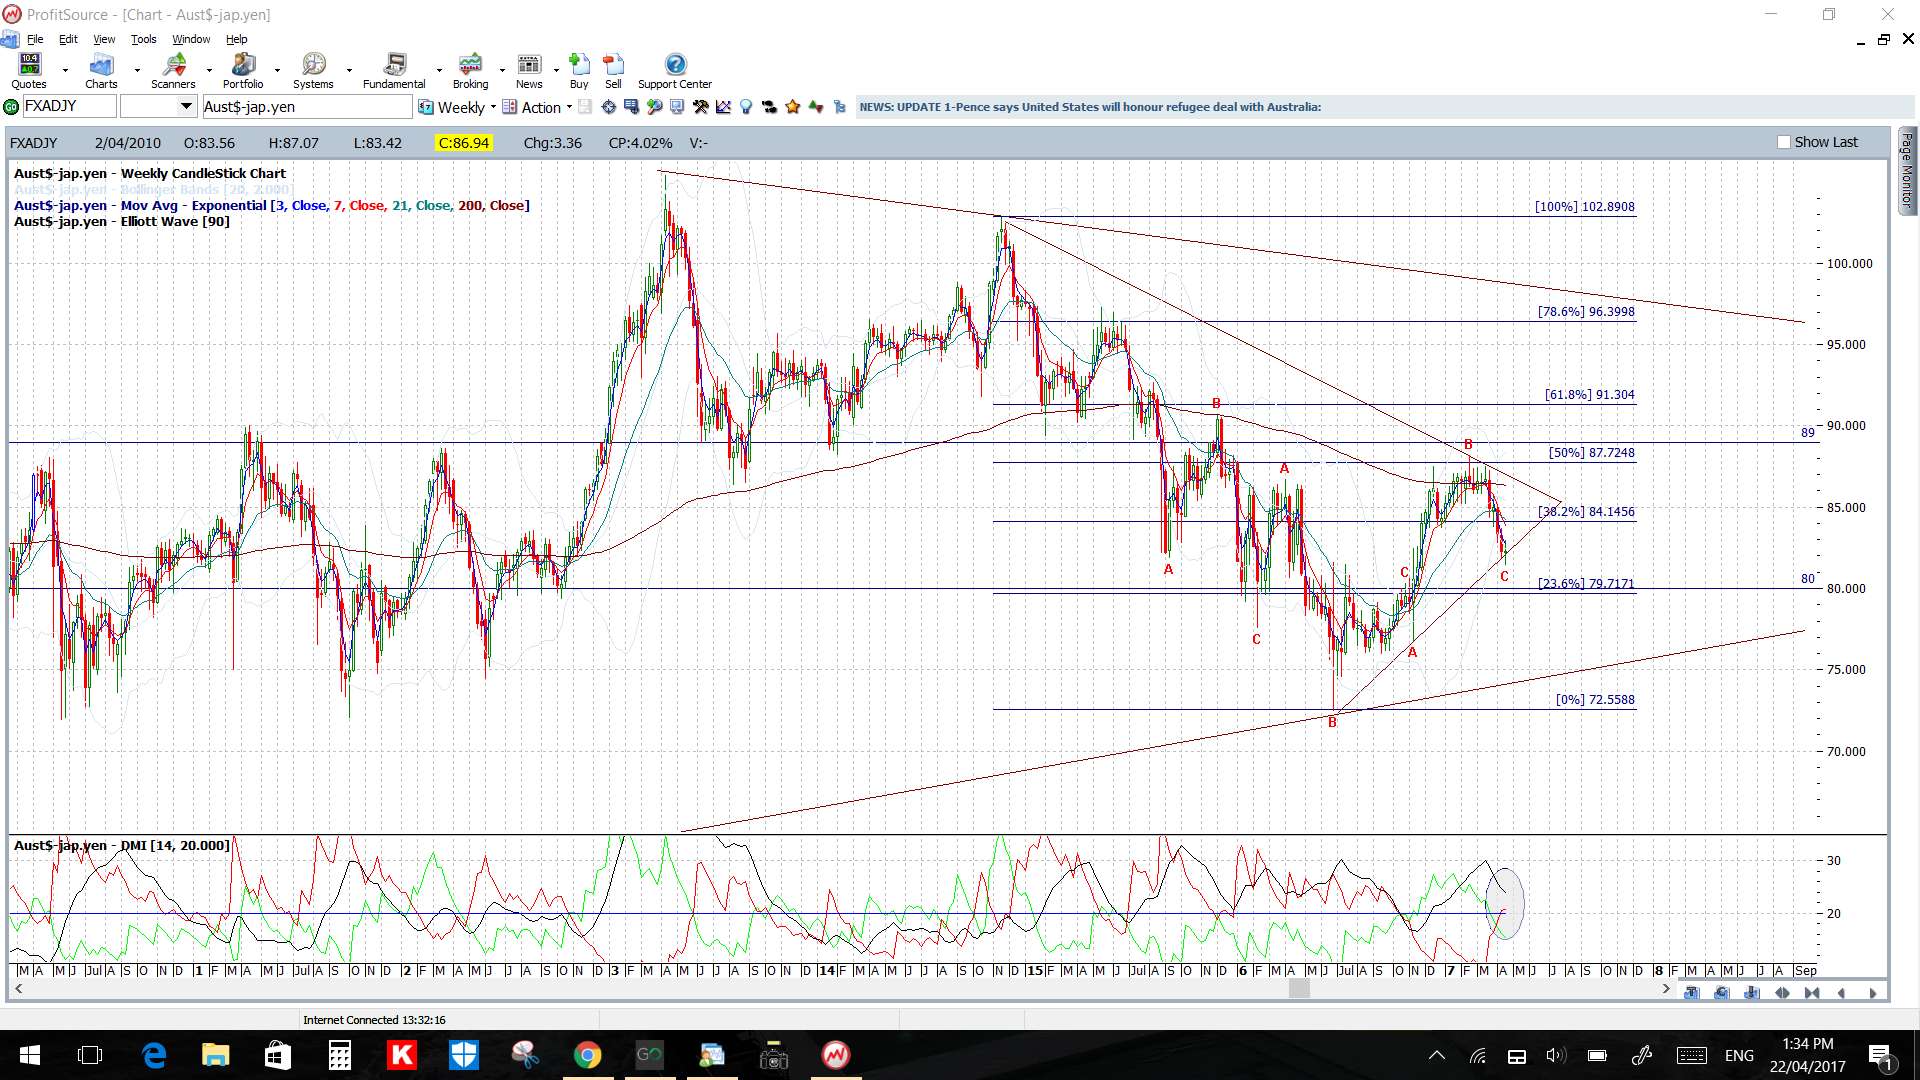
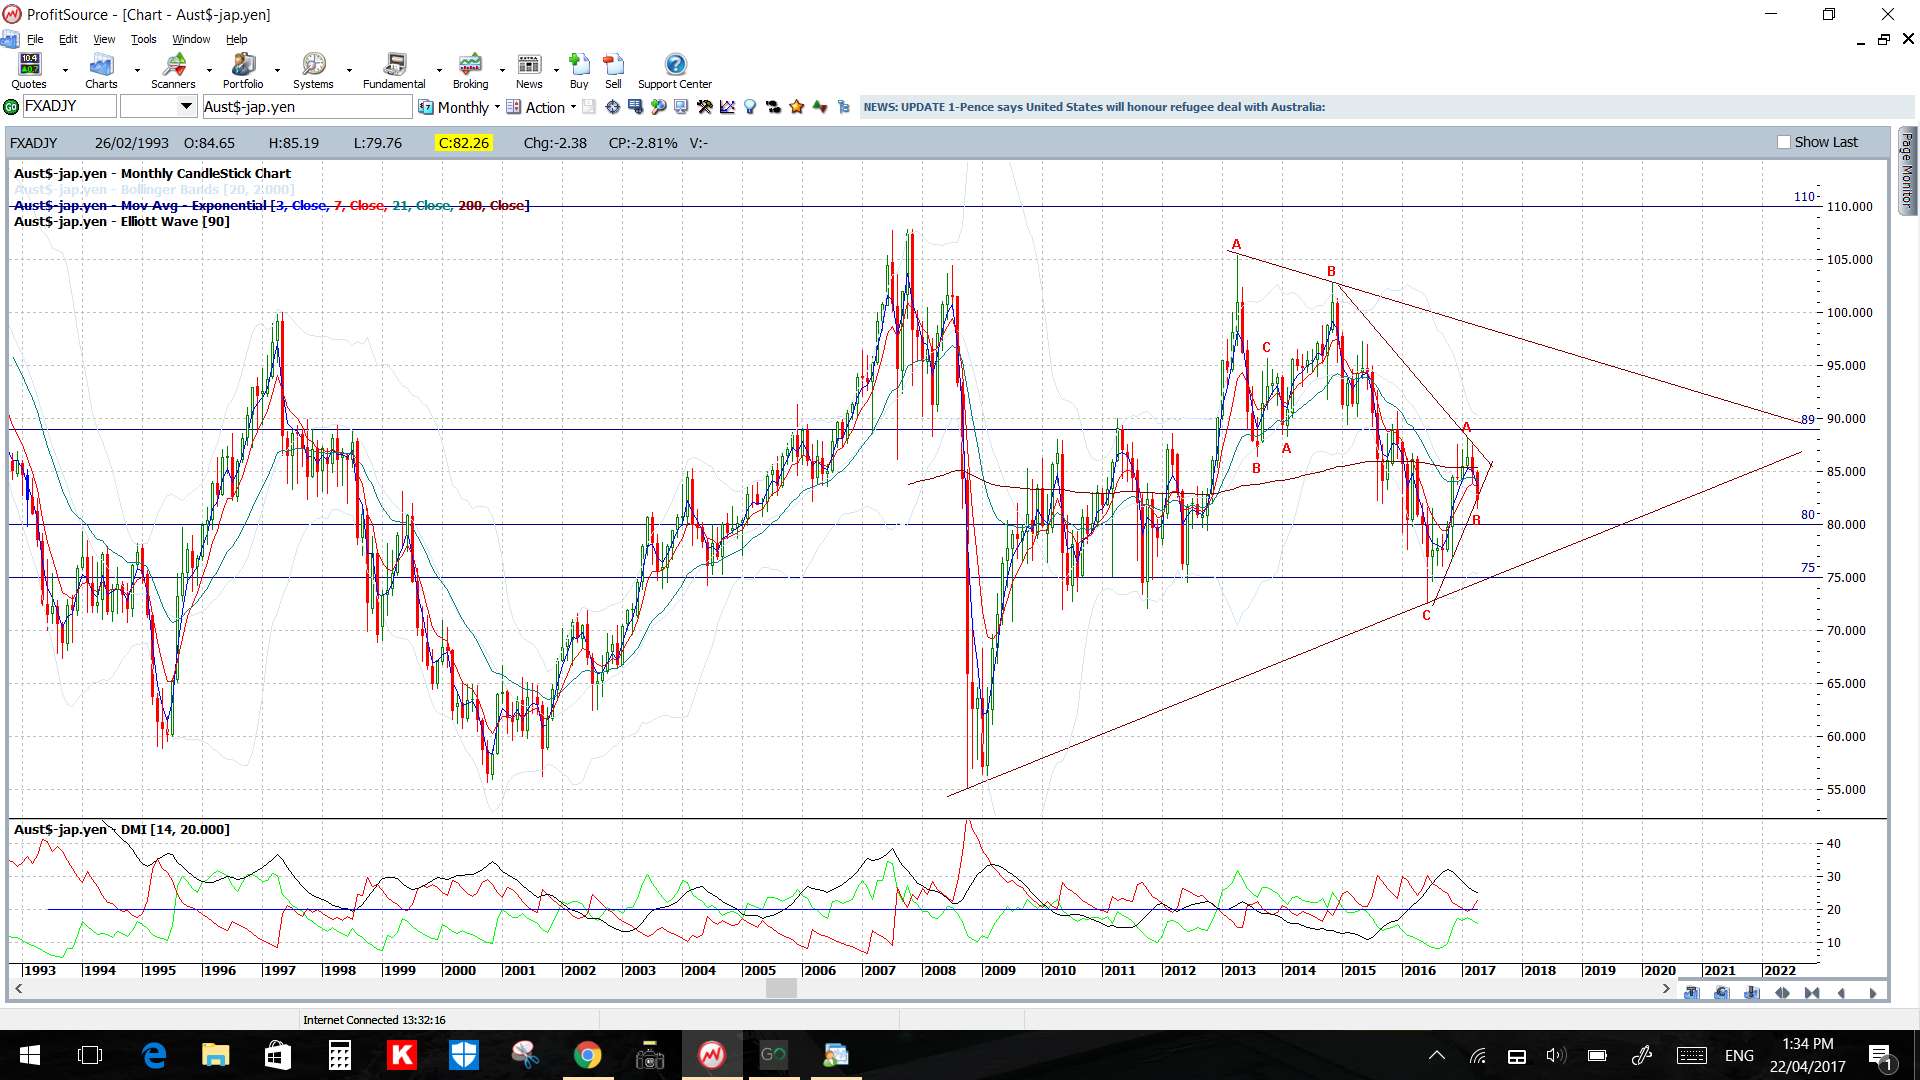
AUD/JPY: I’m watching for any make or break from the 4hr chart’s trading channel and, then, the daily chart’s triangle.
Price is below the 4hr and daily Cloud.
The weekly candle was a bearish coloured ‘Spinning Top’ suggesting indecision at this key support level.
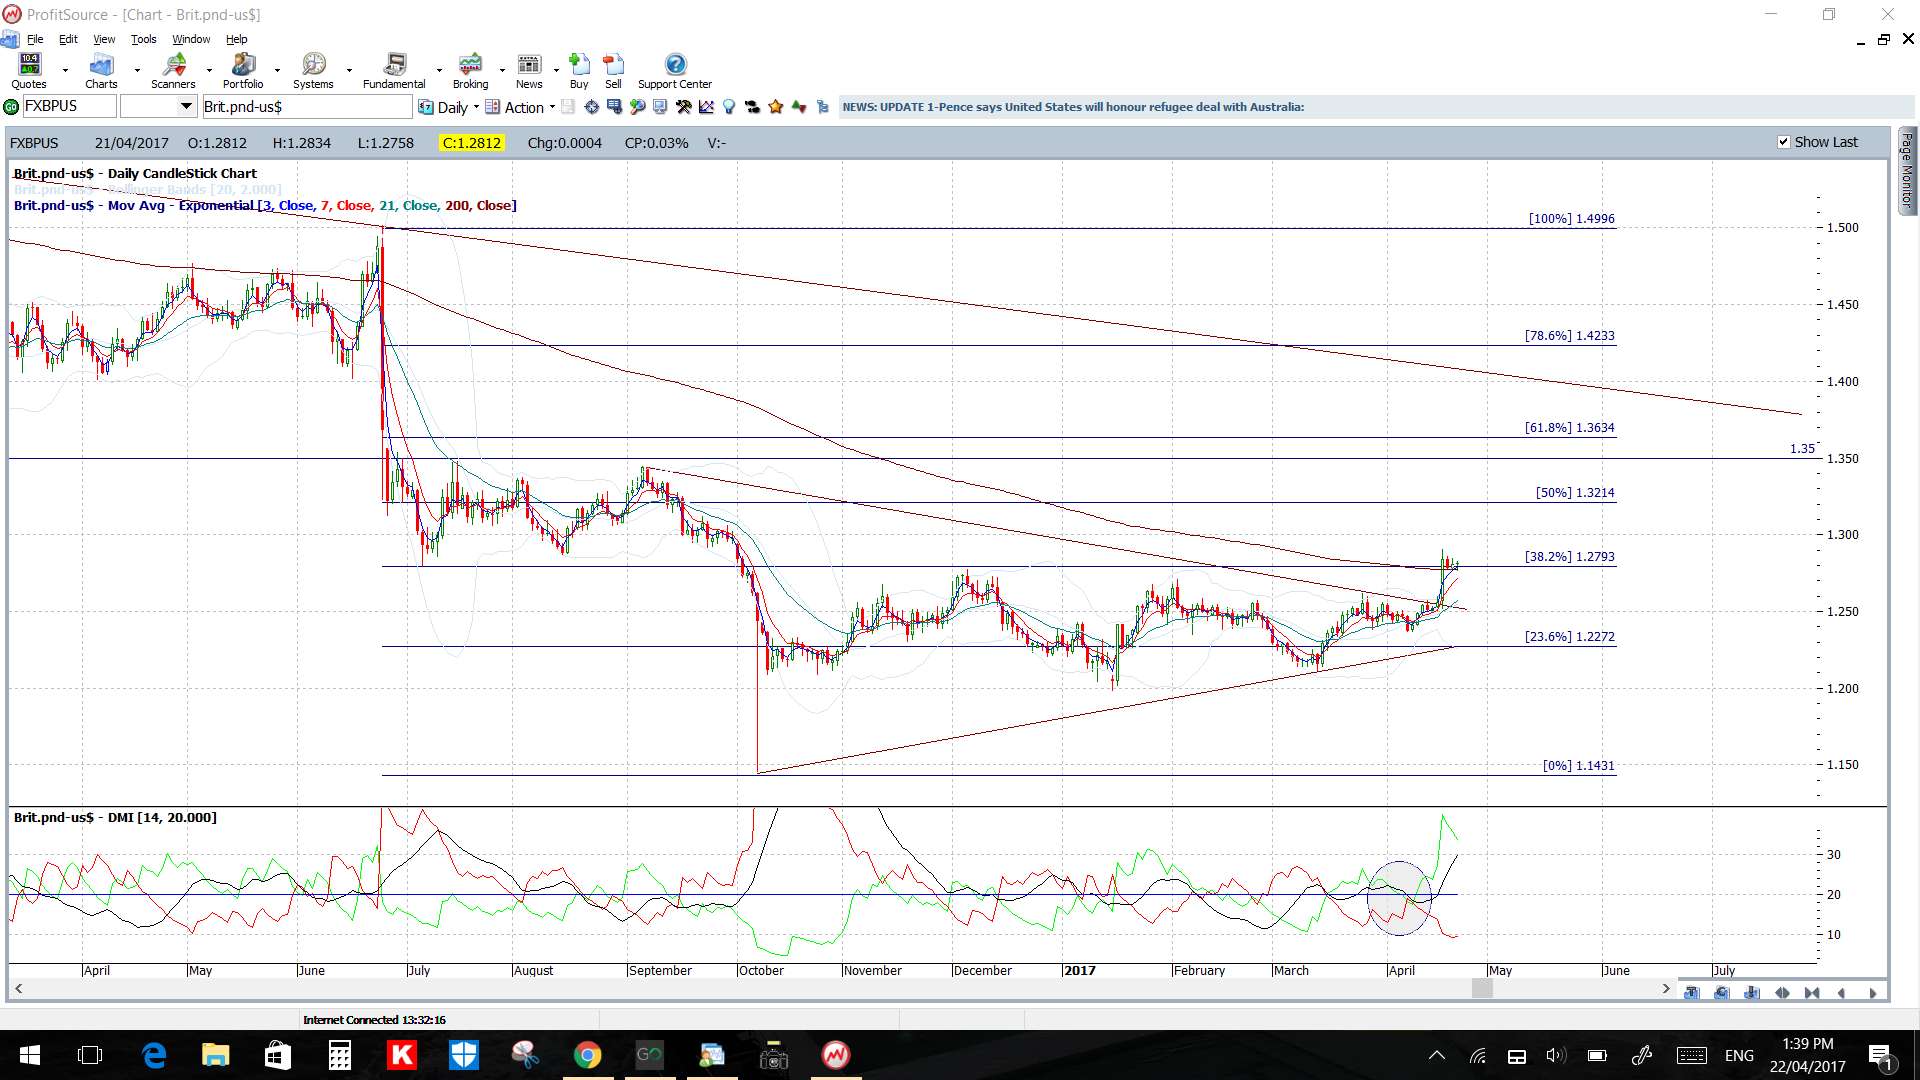
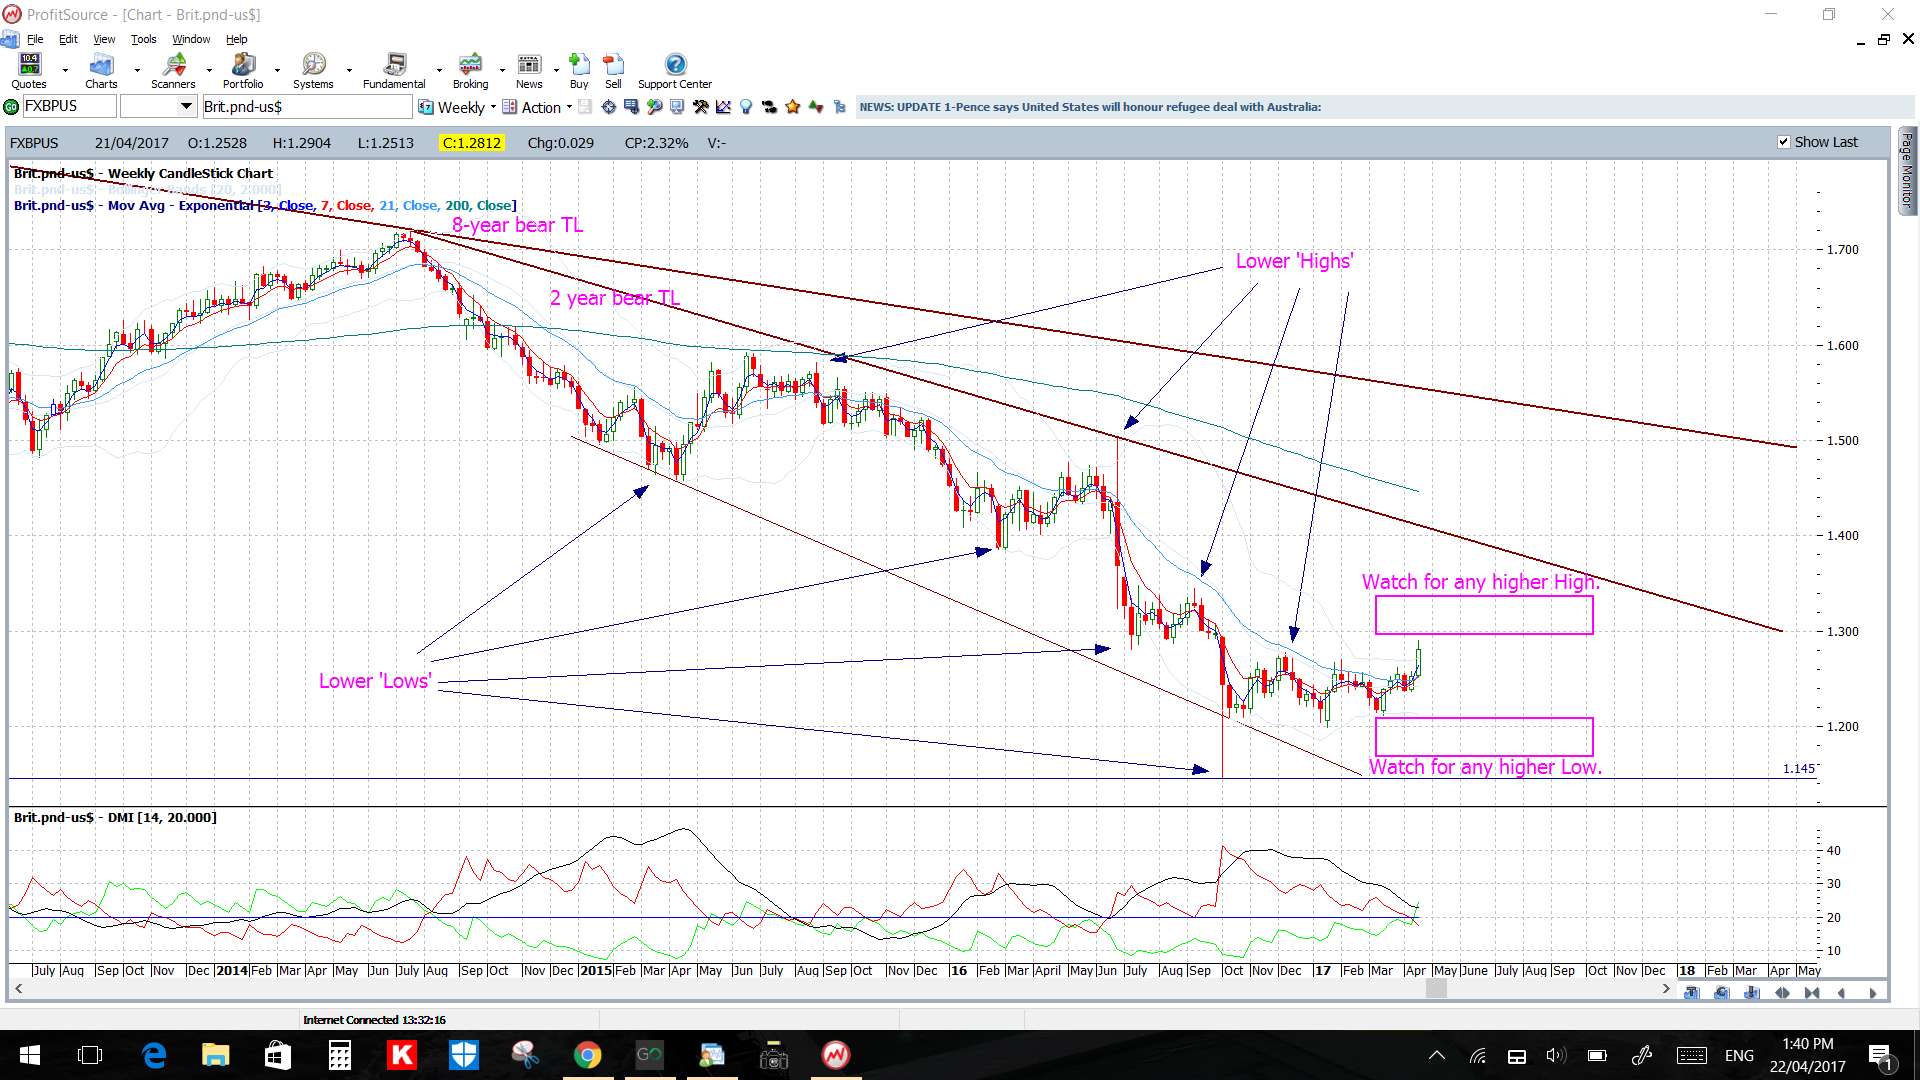
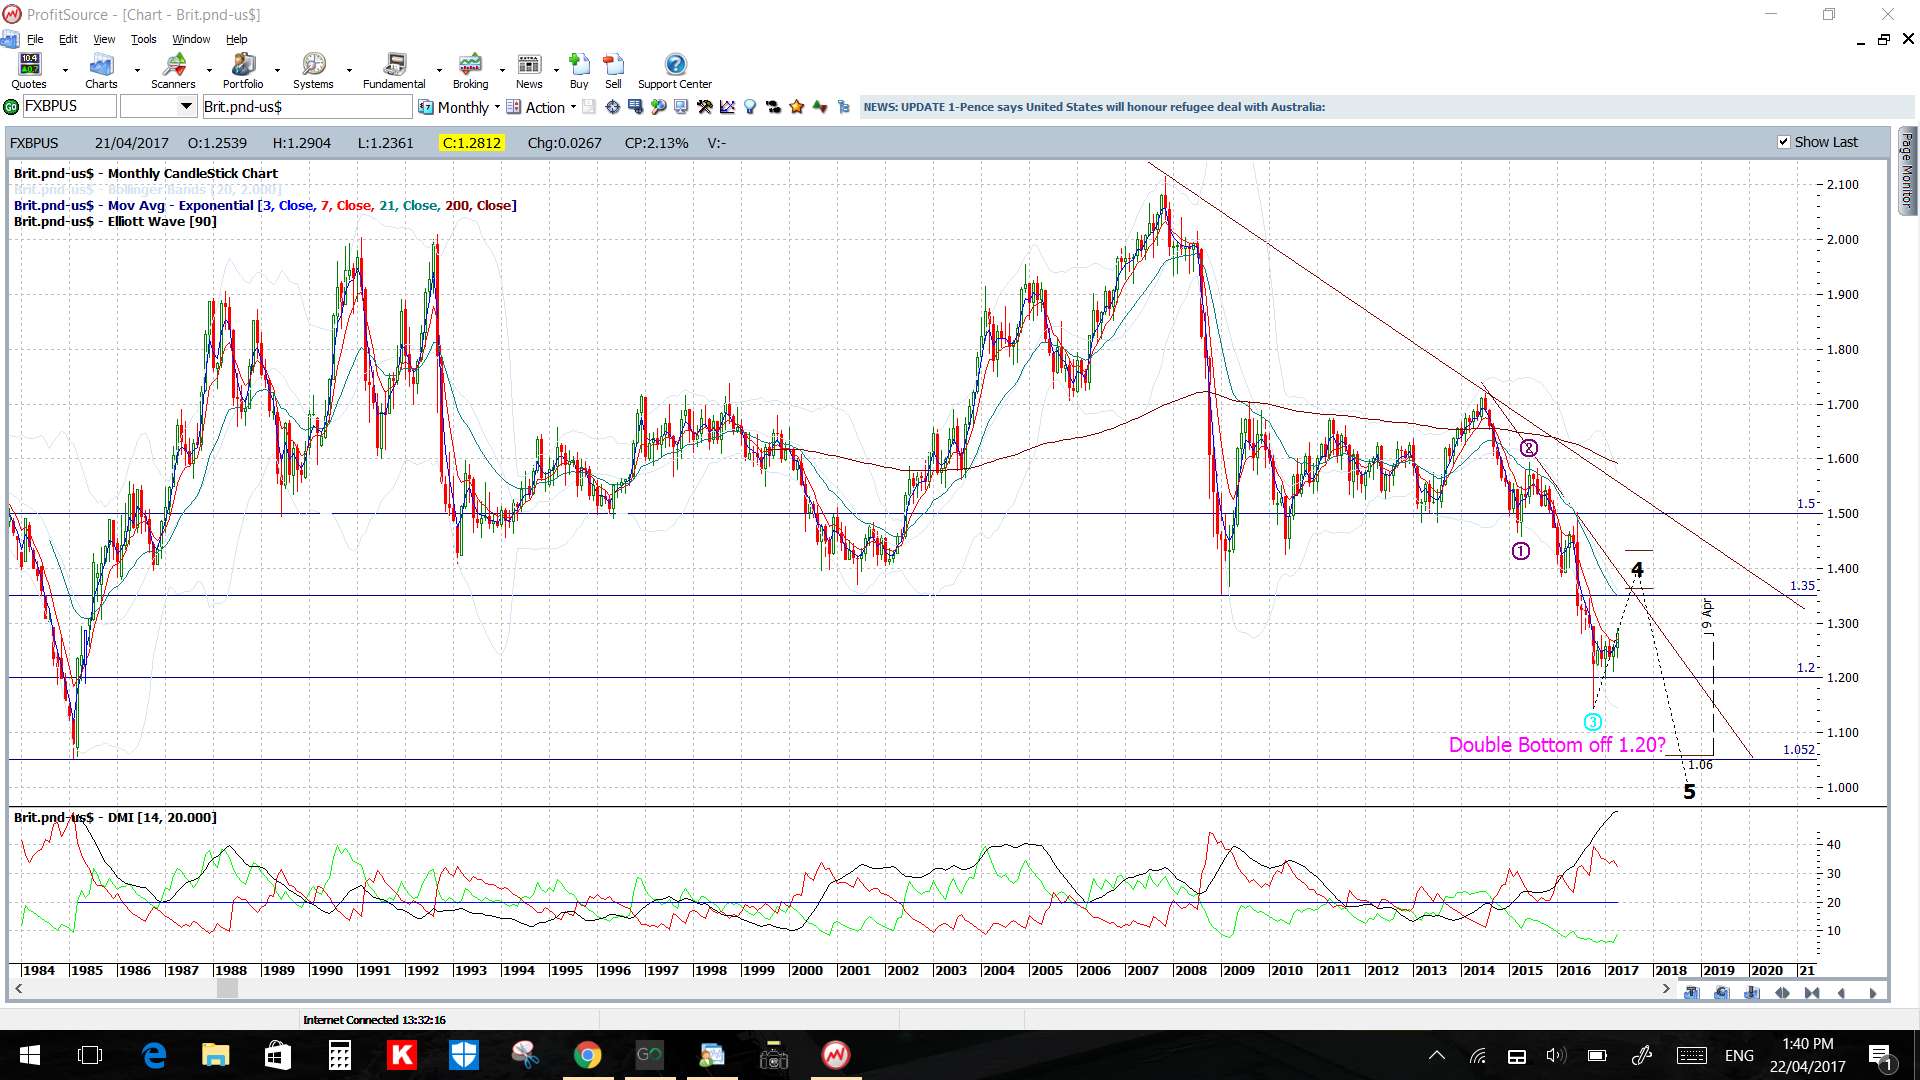
GBP/USD: The Cable broke up and out from a daily chart triangle last week and I’m on the lookout for any continuation here. The 4hr chart shows a recent Flag as a result of consolidation following this bullish breakout so watch these trend lines for any make or break.
I note the 61.8% fib of the daily chart’s swing low move is back near 1.30 and so this would be the target for any bullish continuation move.
Price is above the 4hr and daily Cloud.
The weekly candle was large and bullish.
The GBP may benefit from some ‘least worst’ sentiment depending on how the French Elections pan out.
Watch also for impact this week from GBP GDP.
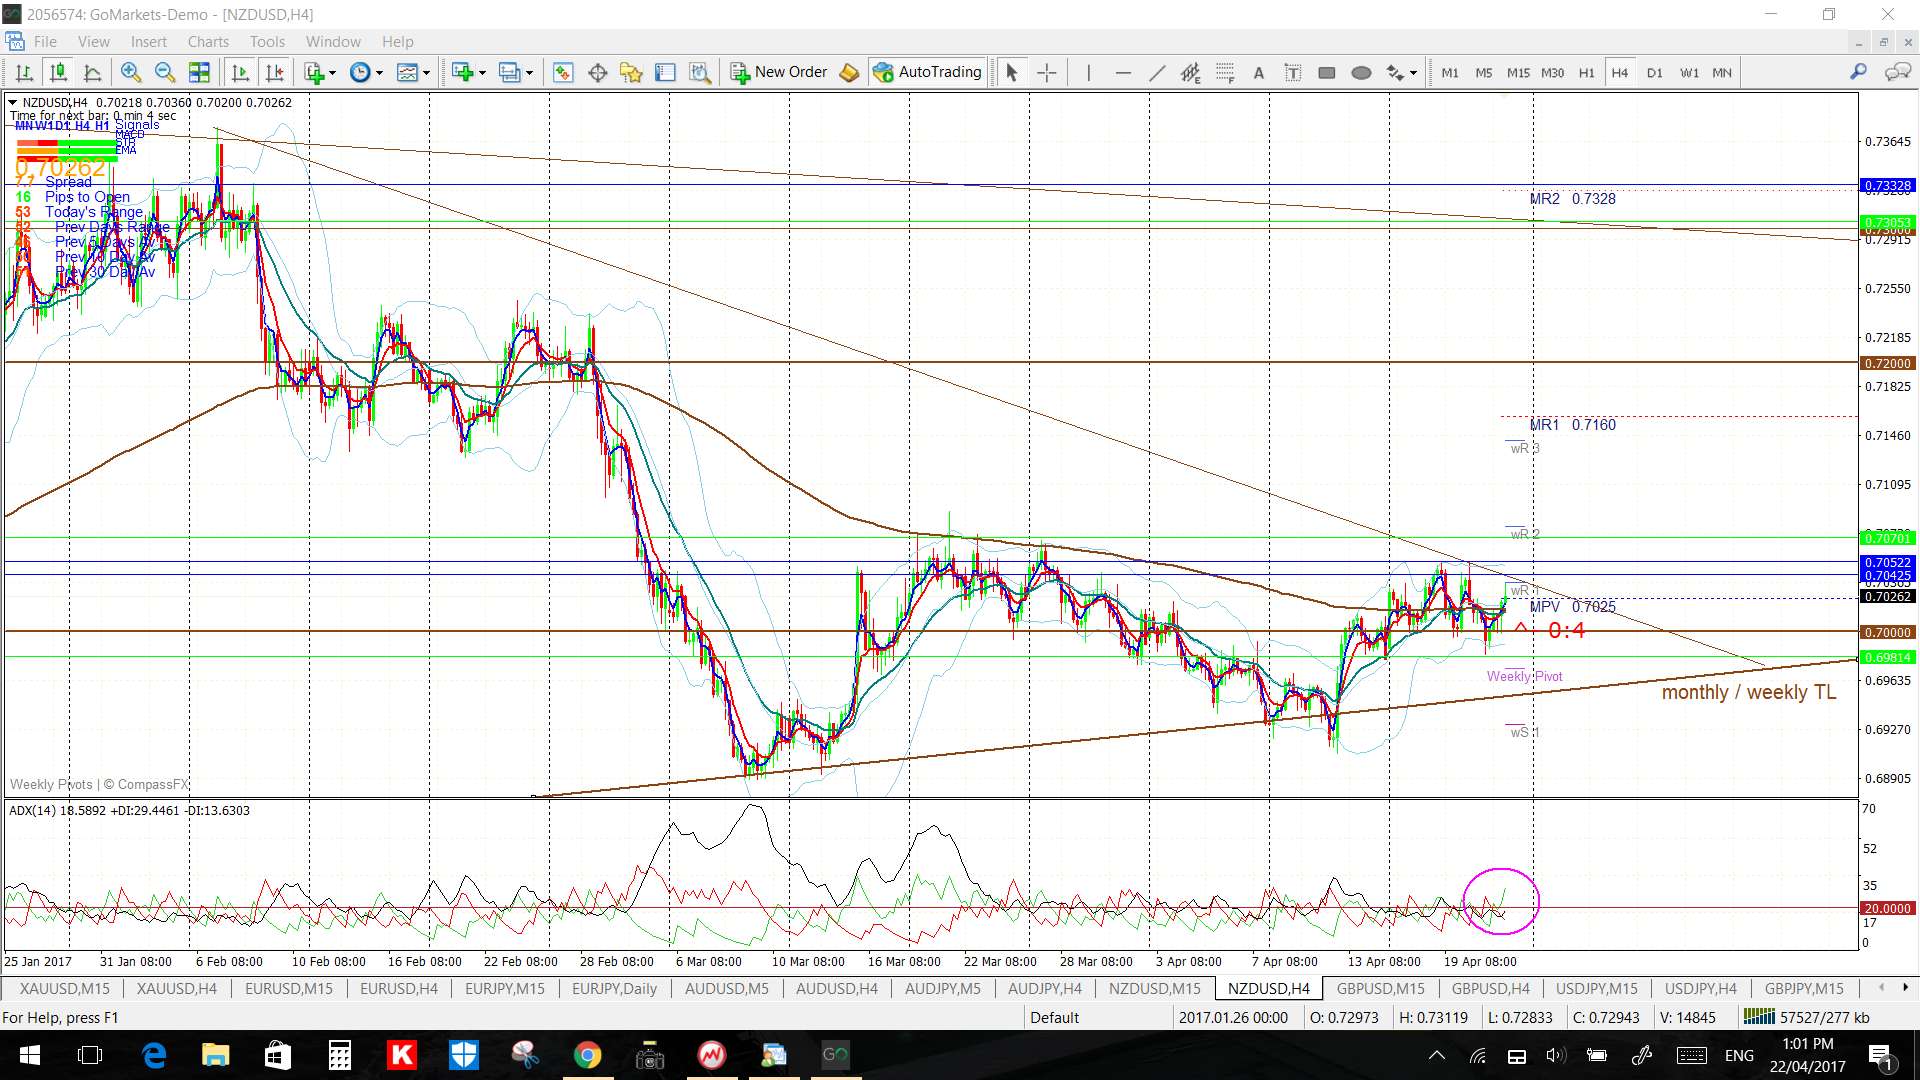
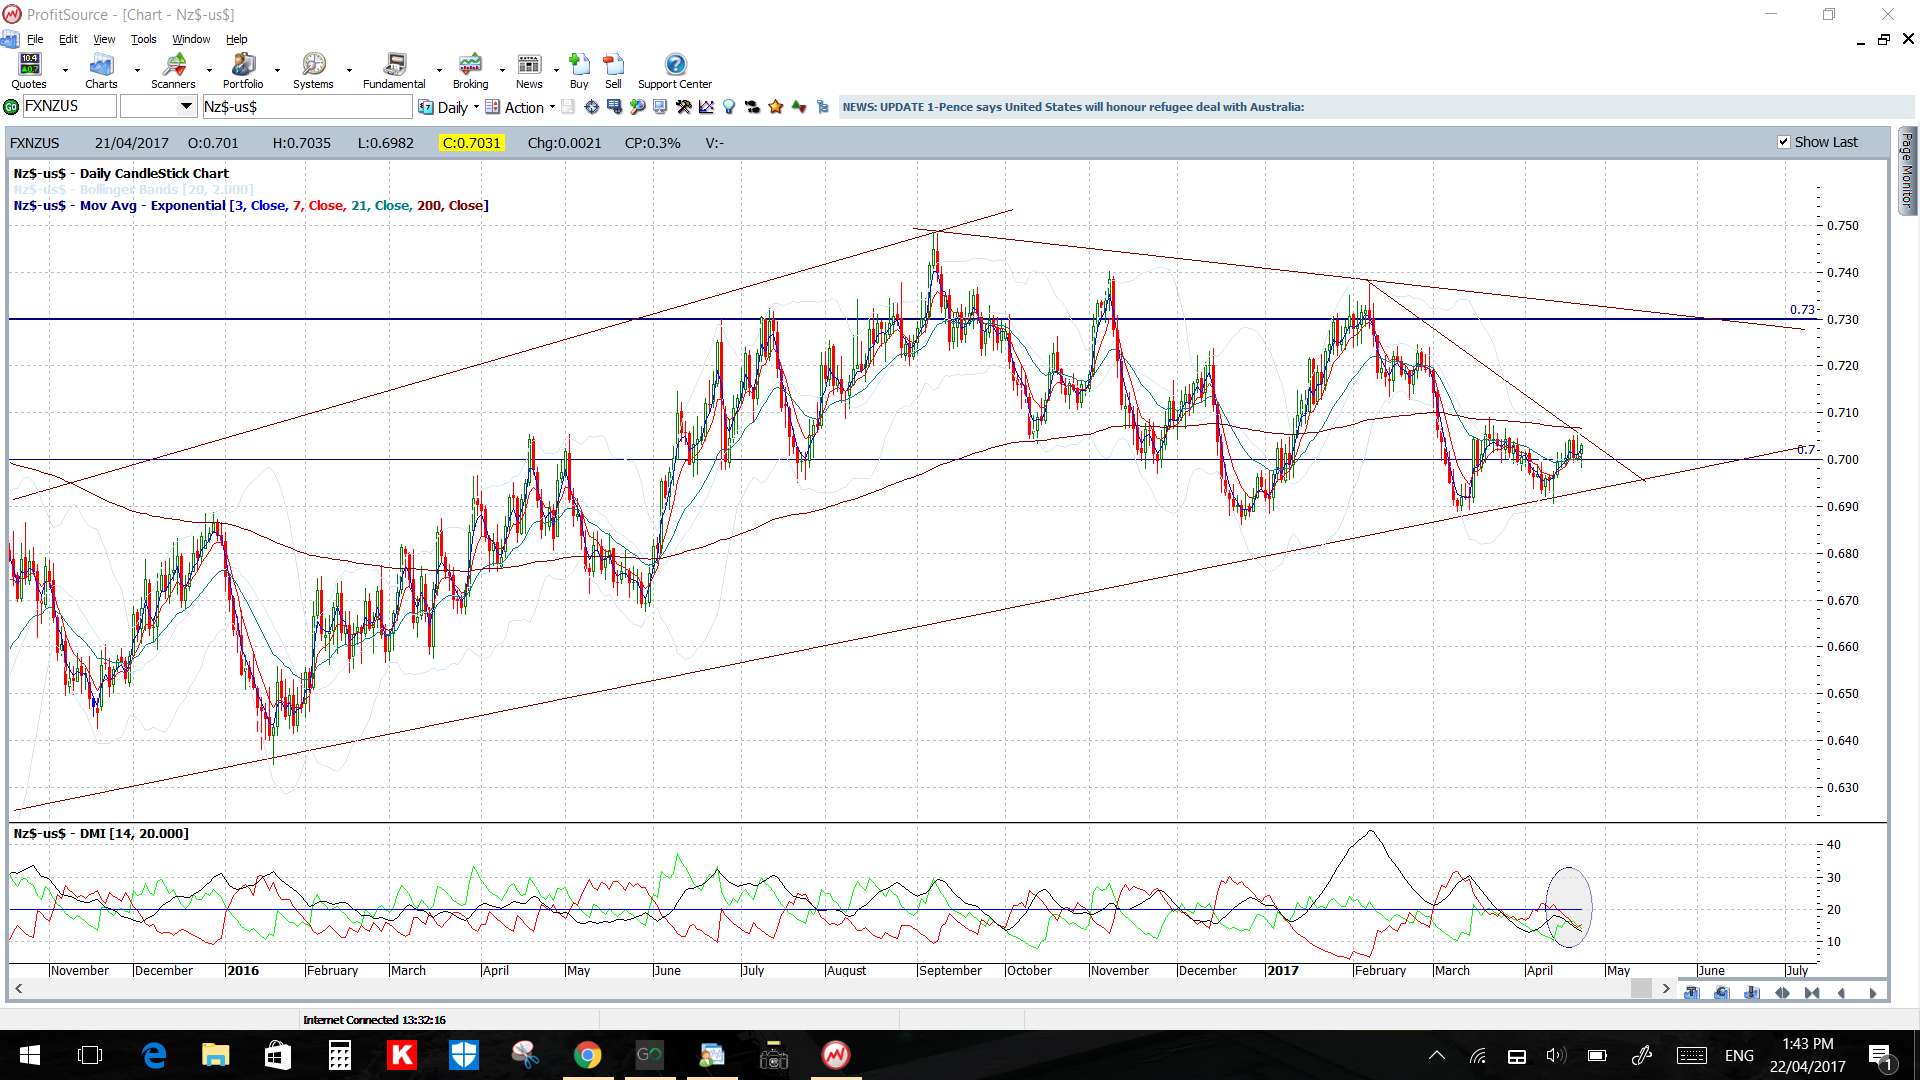
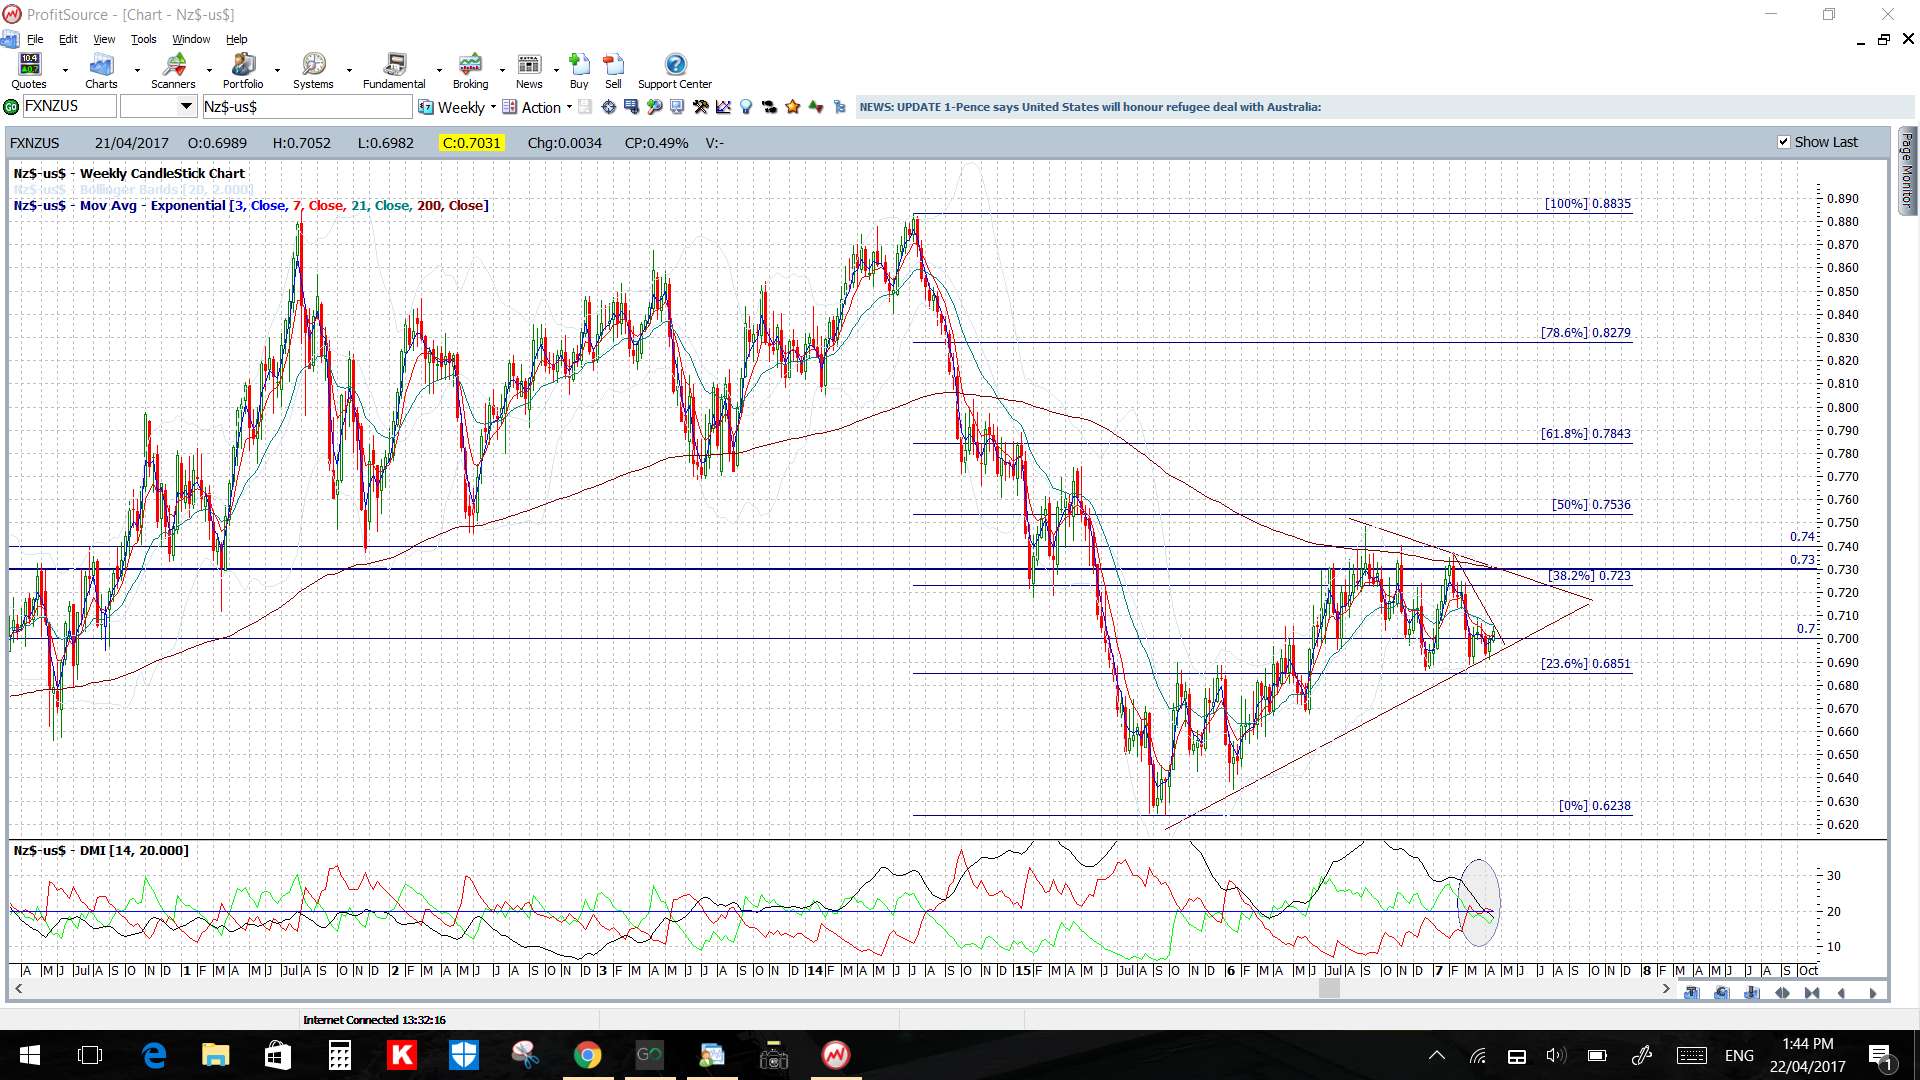
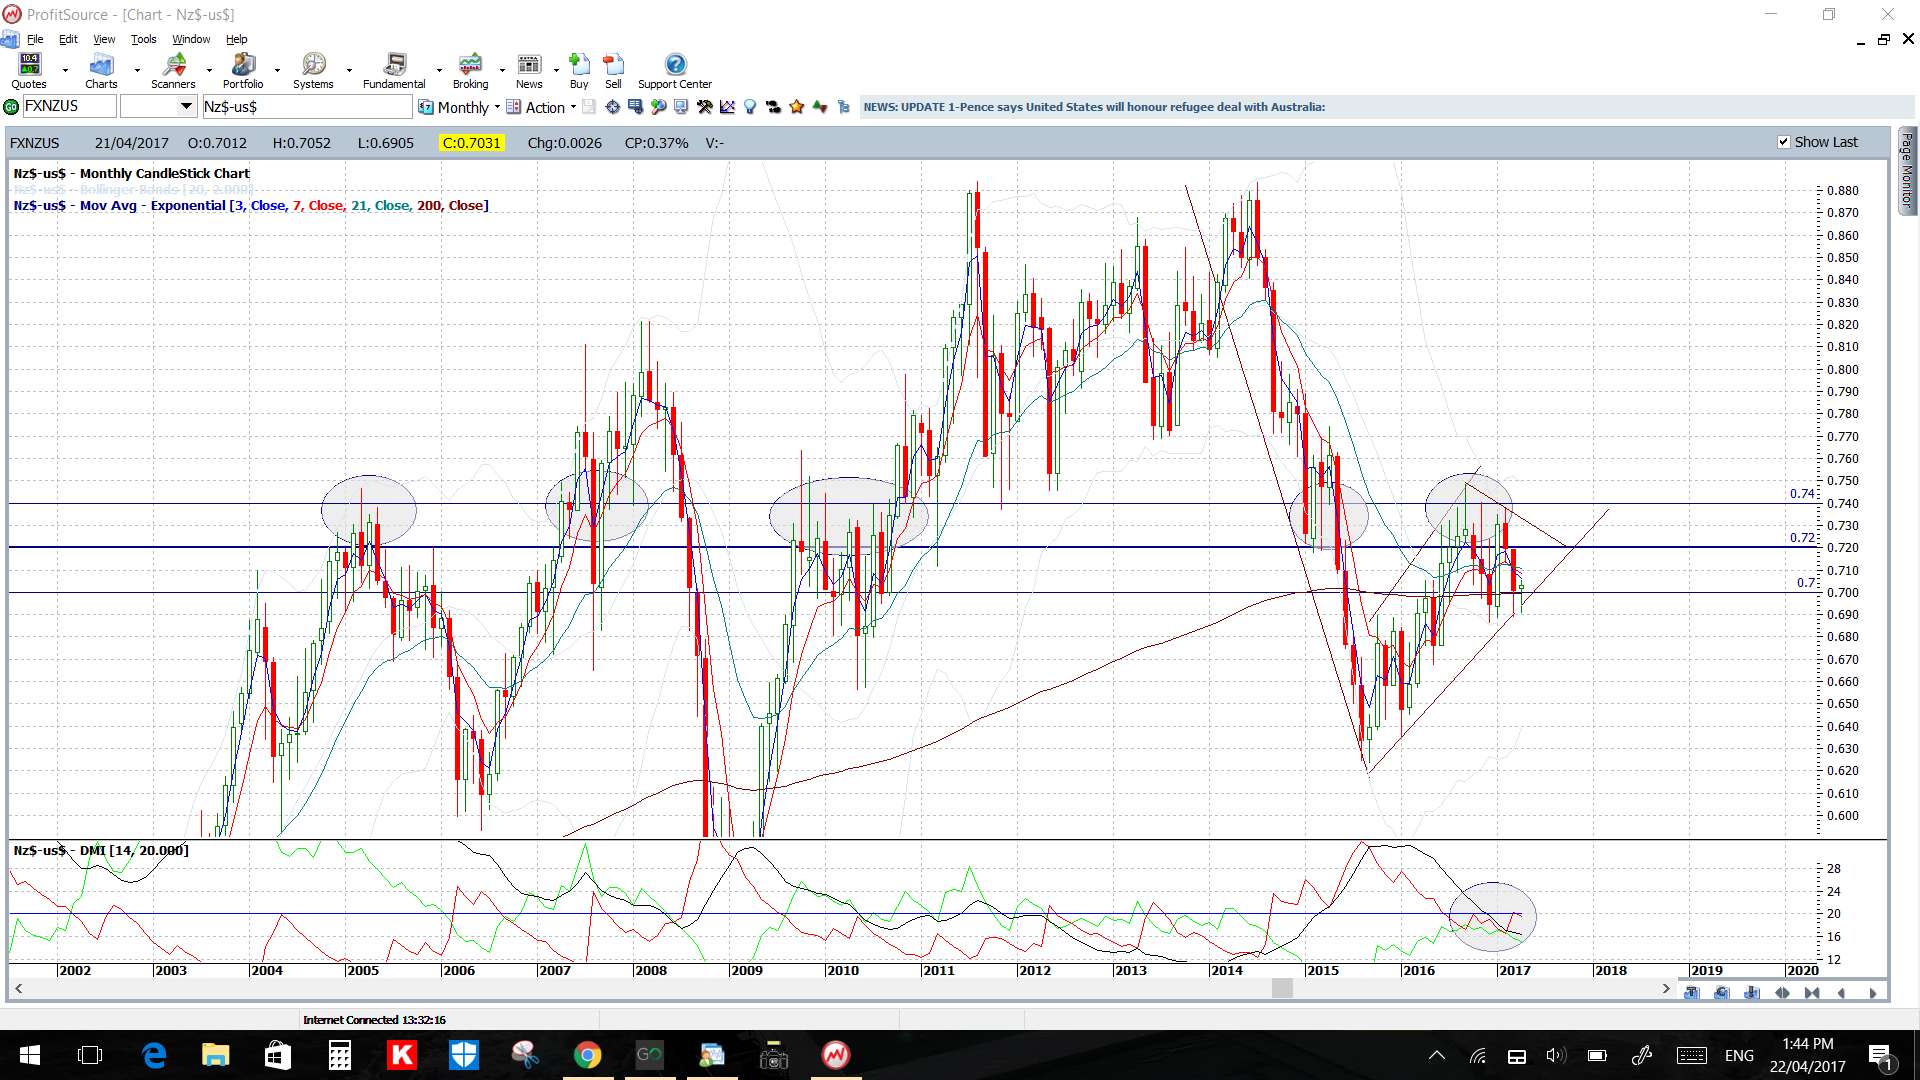
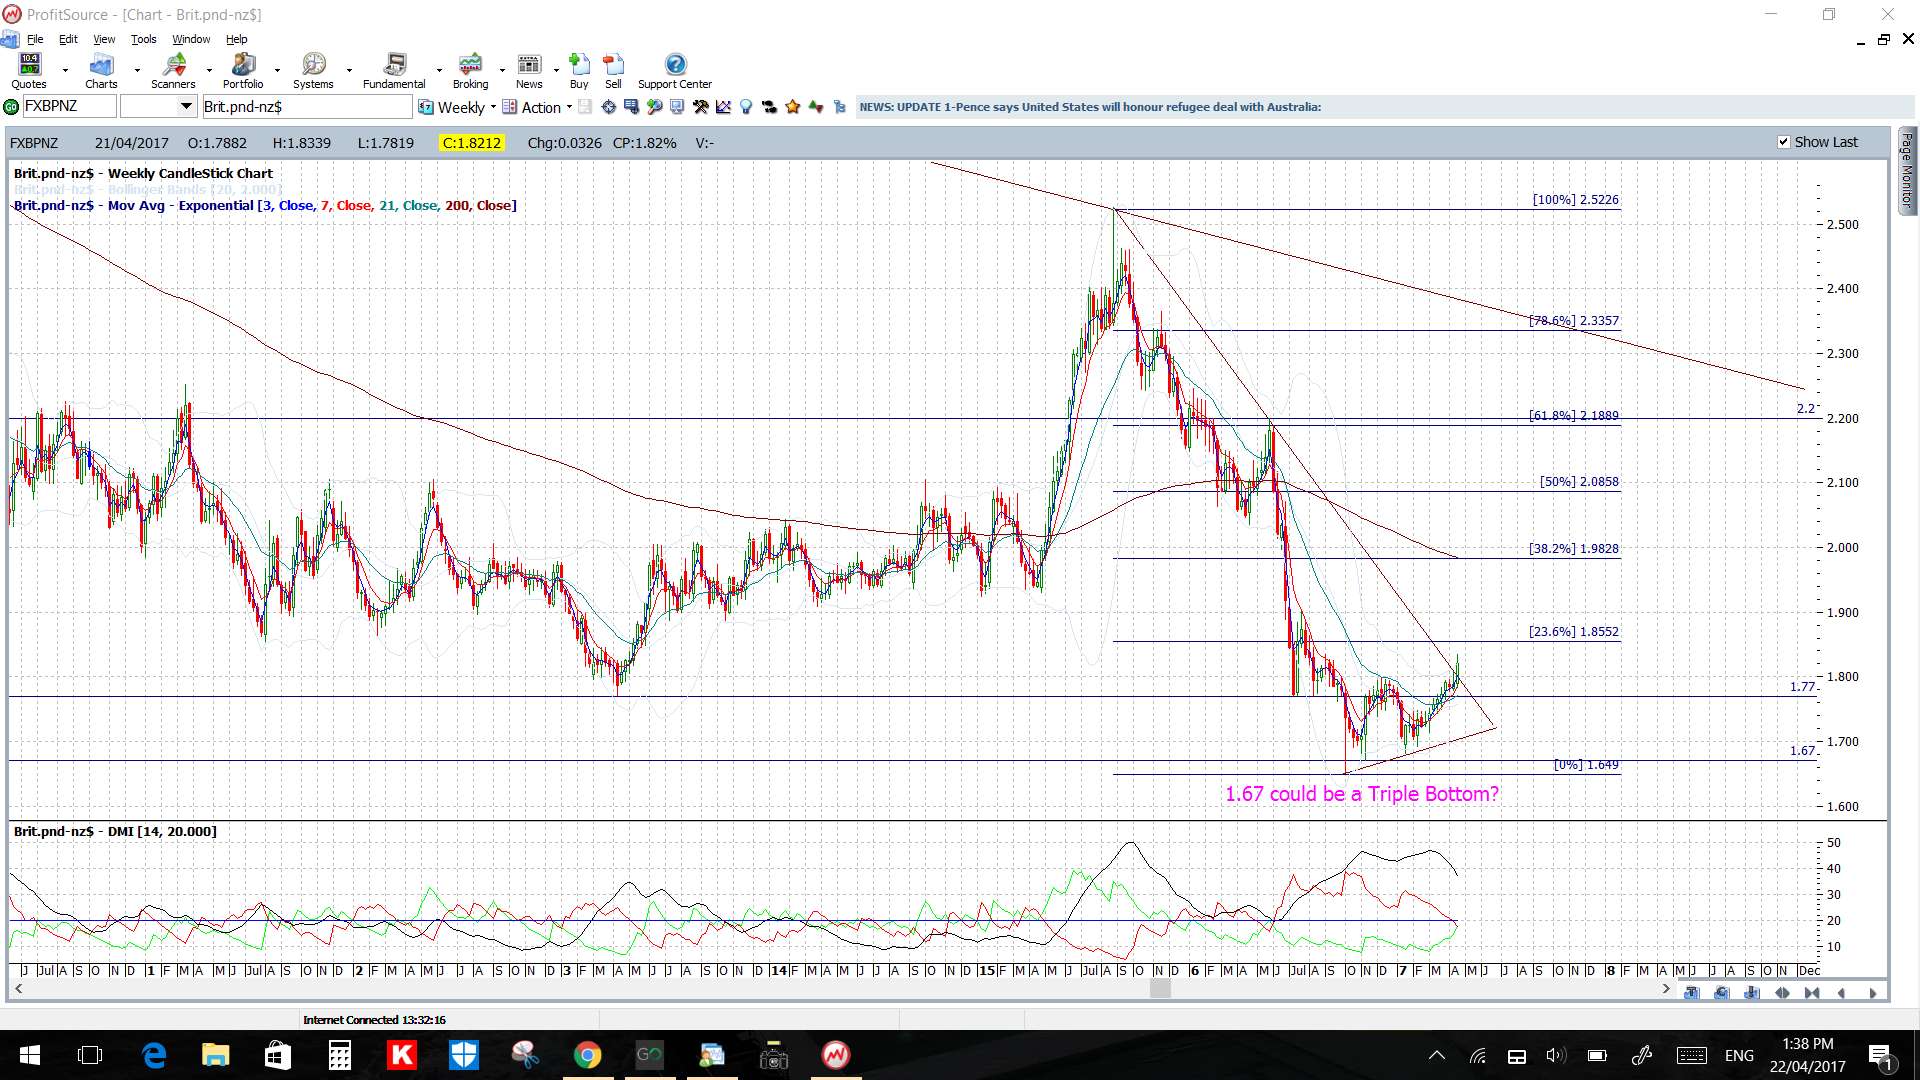
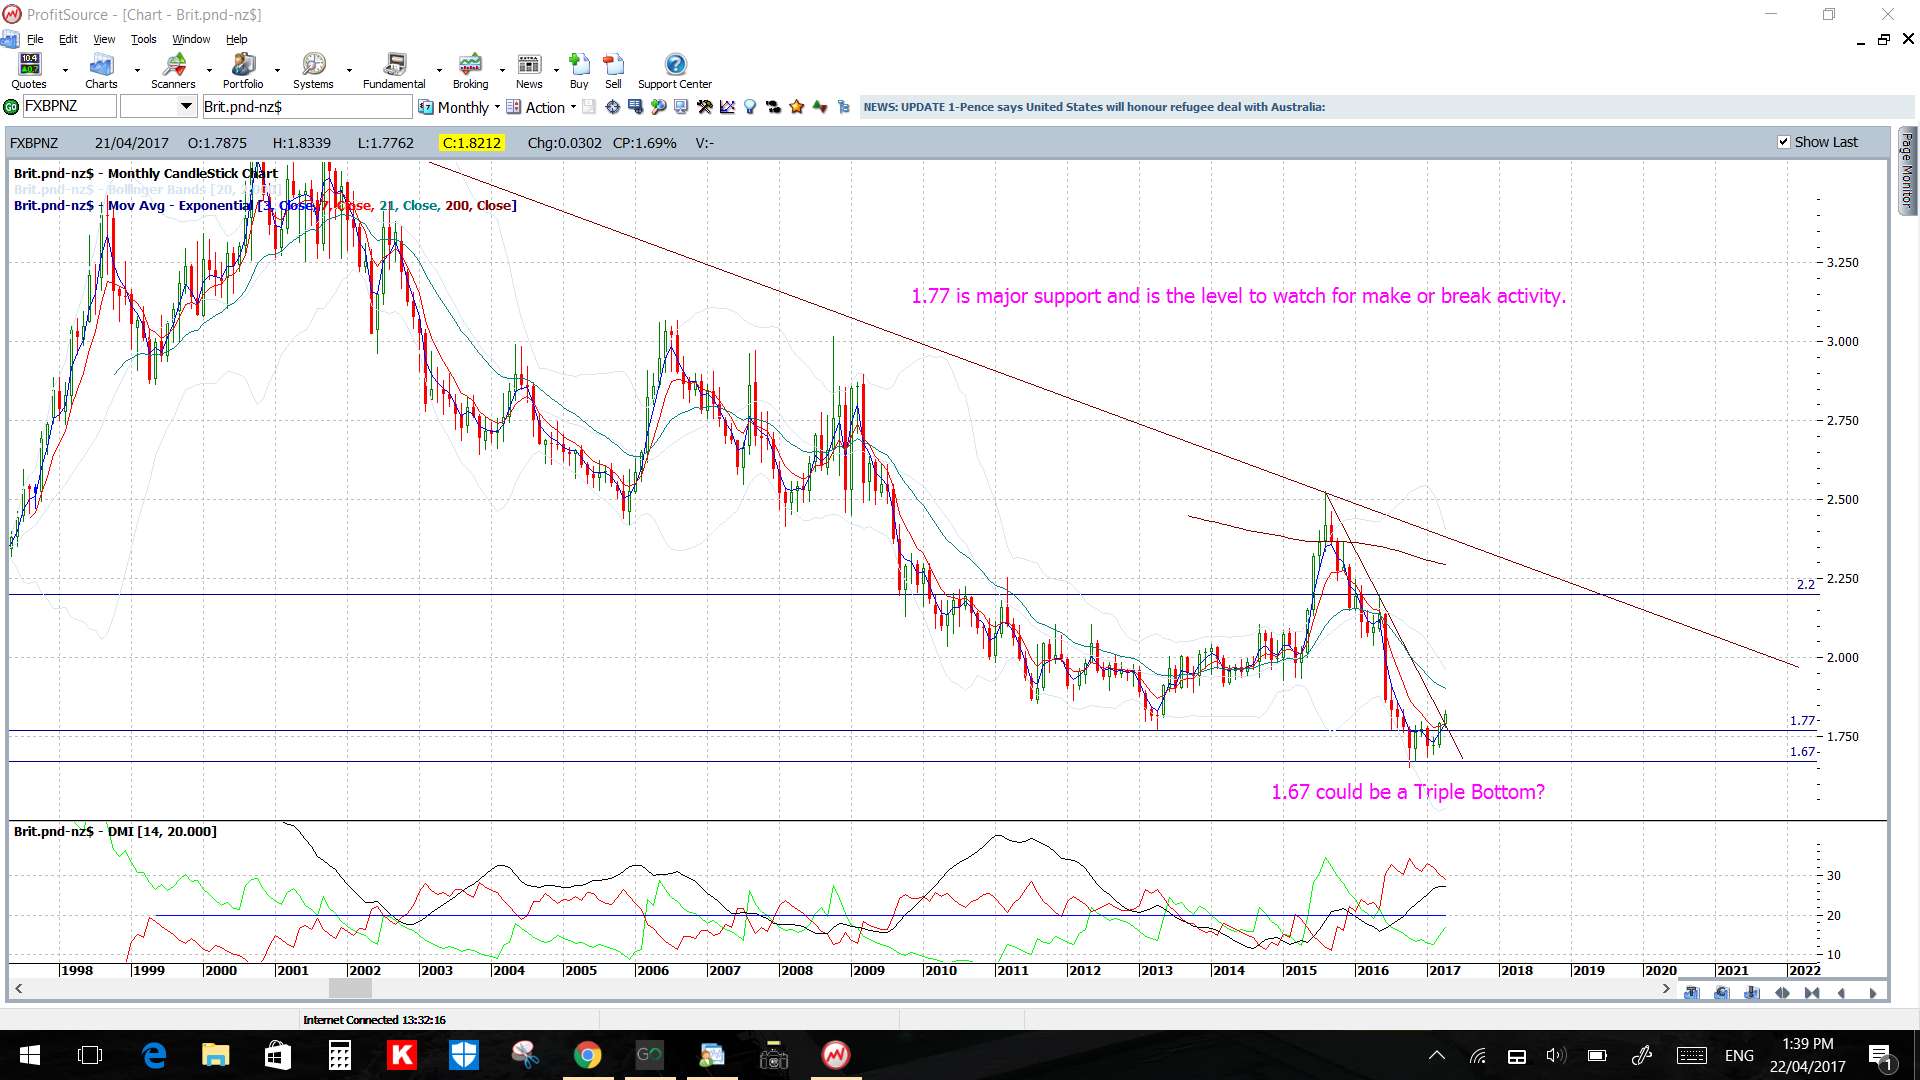
NZD/USD: This pair remains in a daily chart triangle but the main point to note here is the lack of momentum on the weekly chart. This will make it easier to pick up on any subsequent breakout activity though.
Price is above the 4hr Cloud but just below the daily Cloud.
The weekly candle was bullish.
There is no high impact NZD data this week.
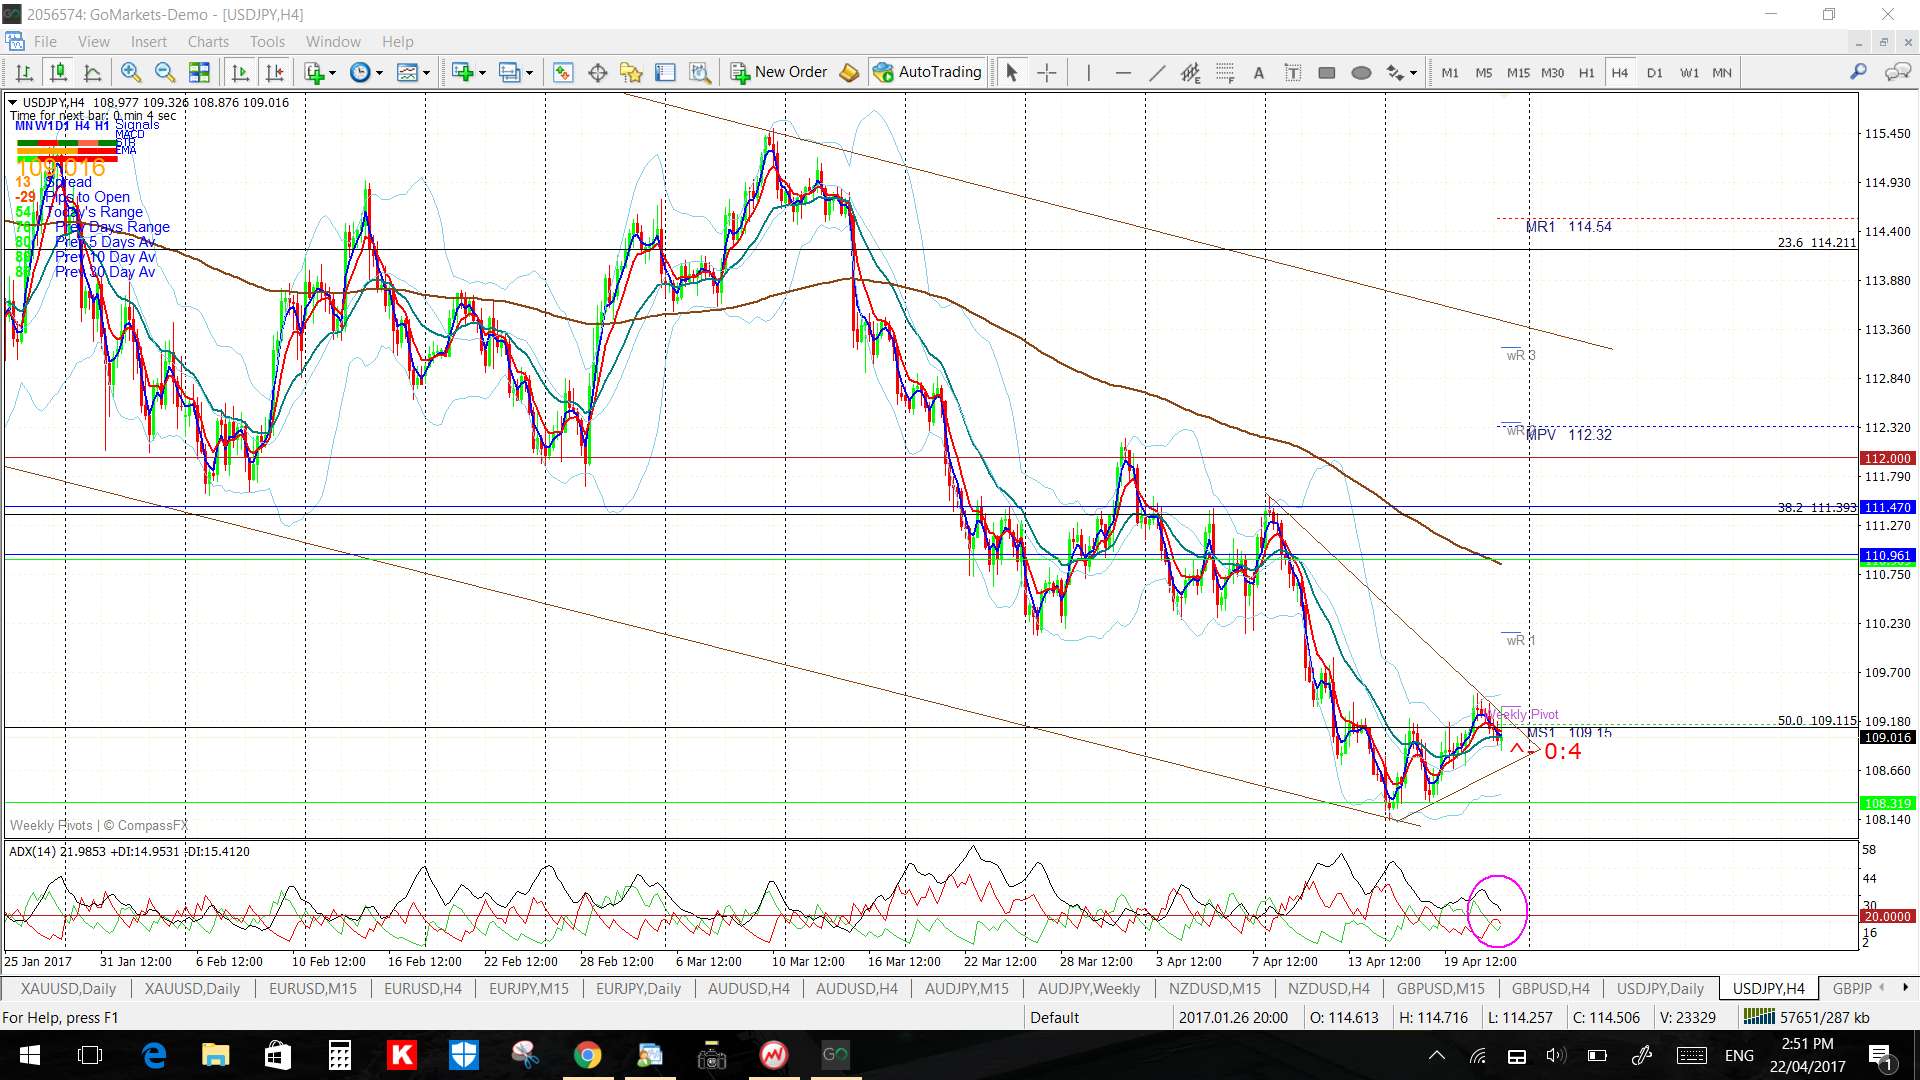
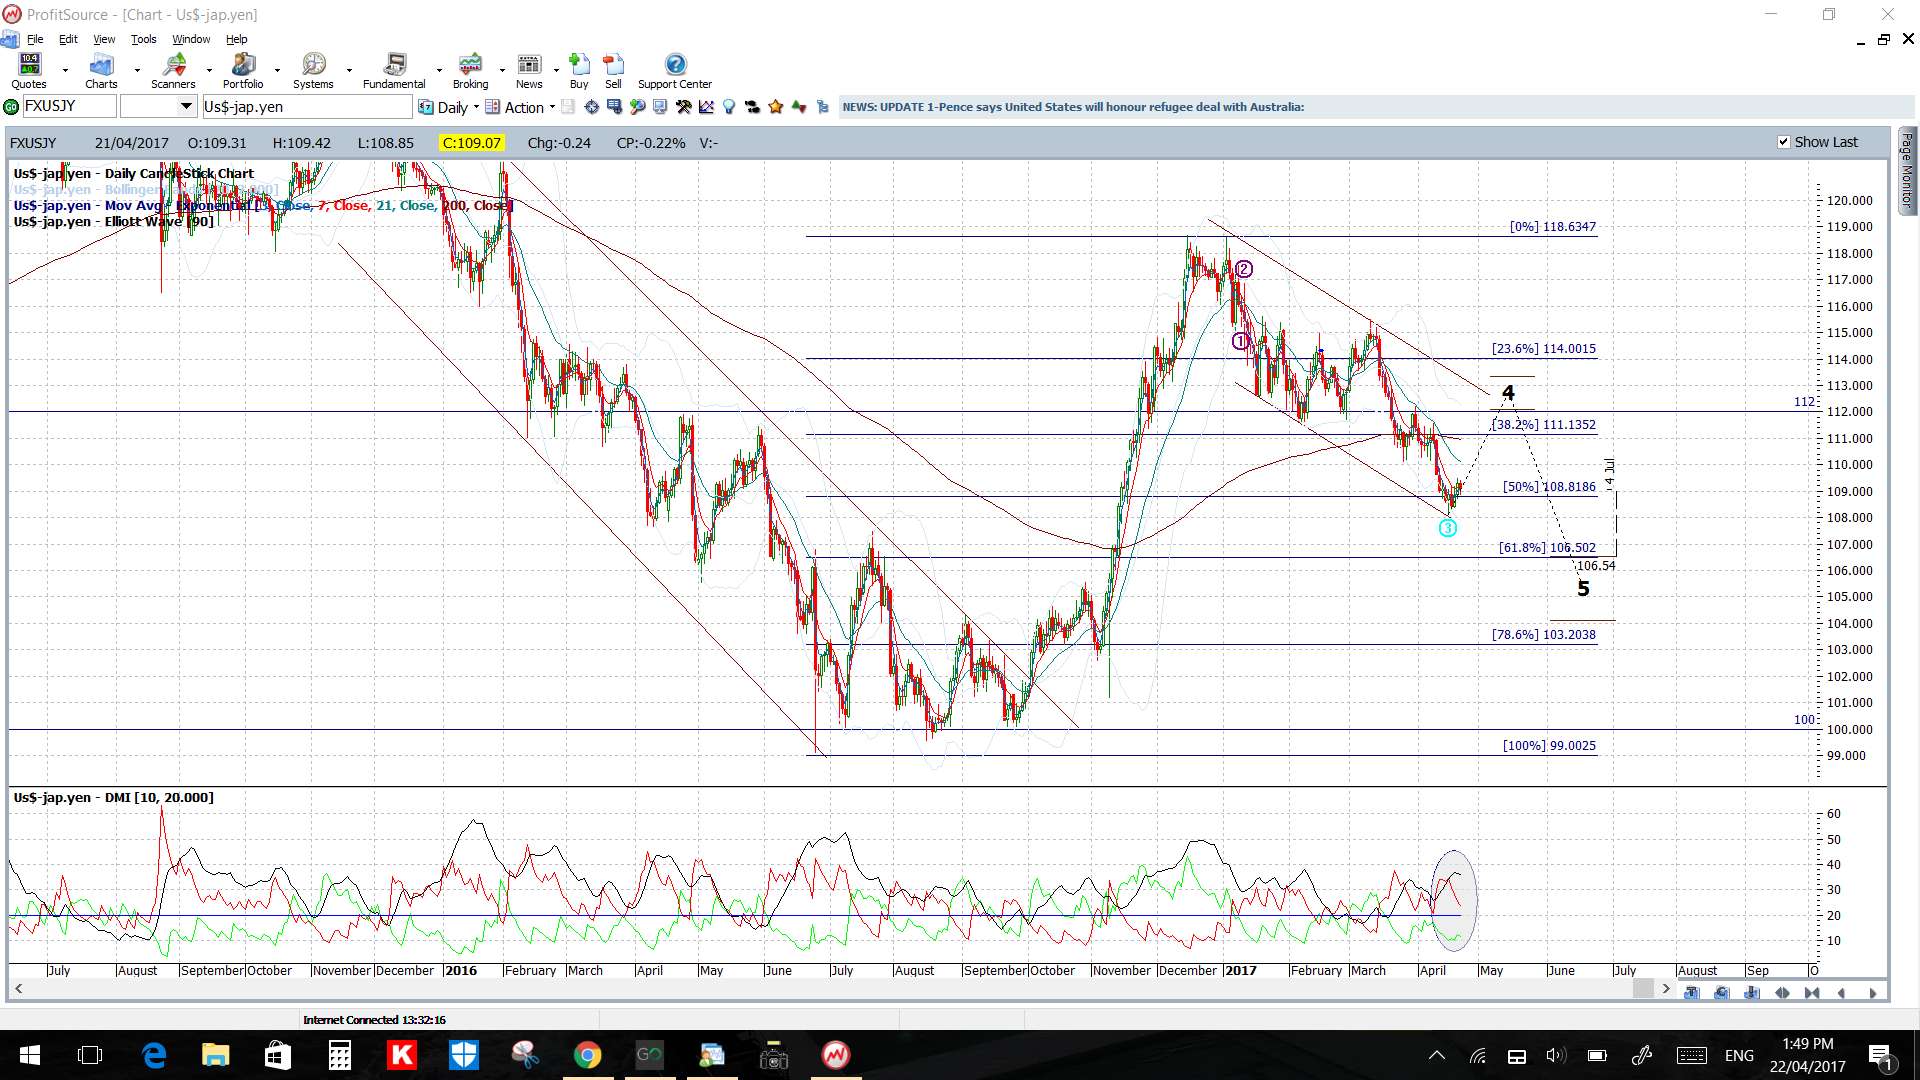
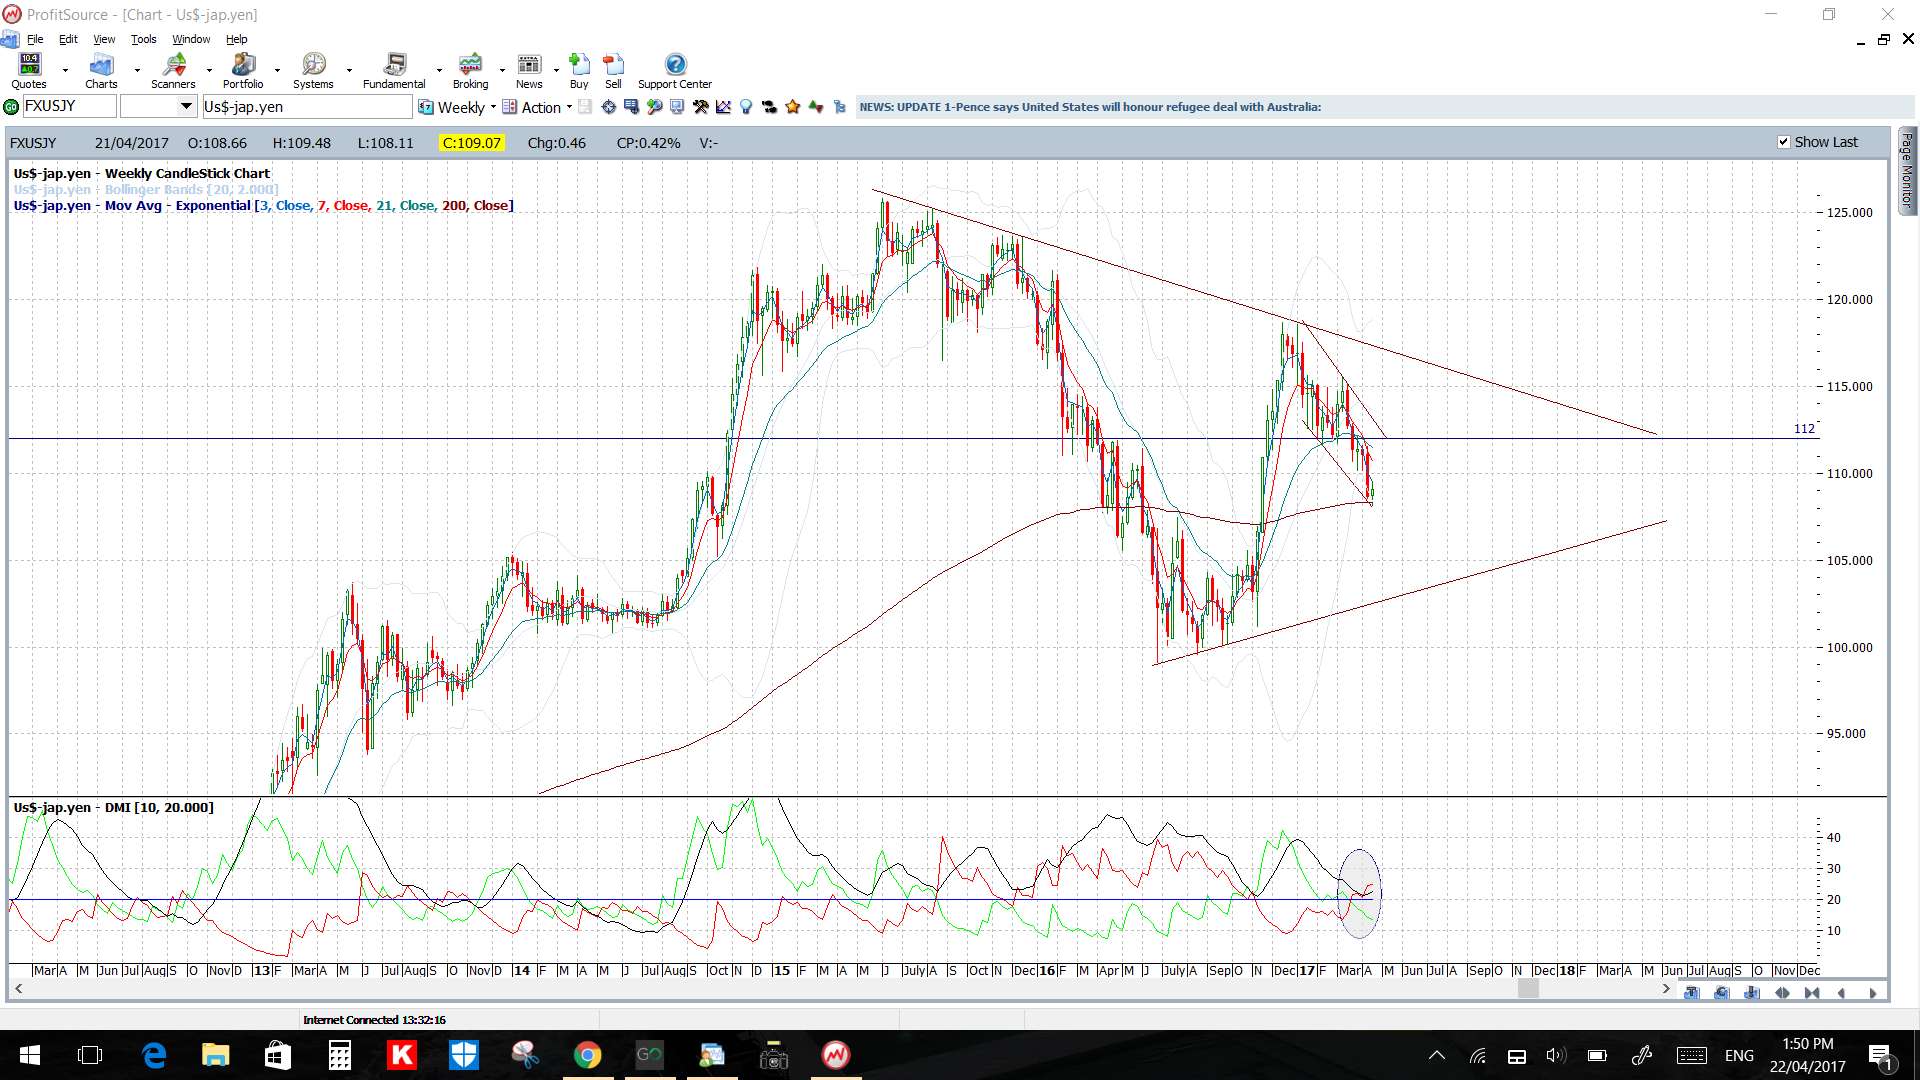
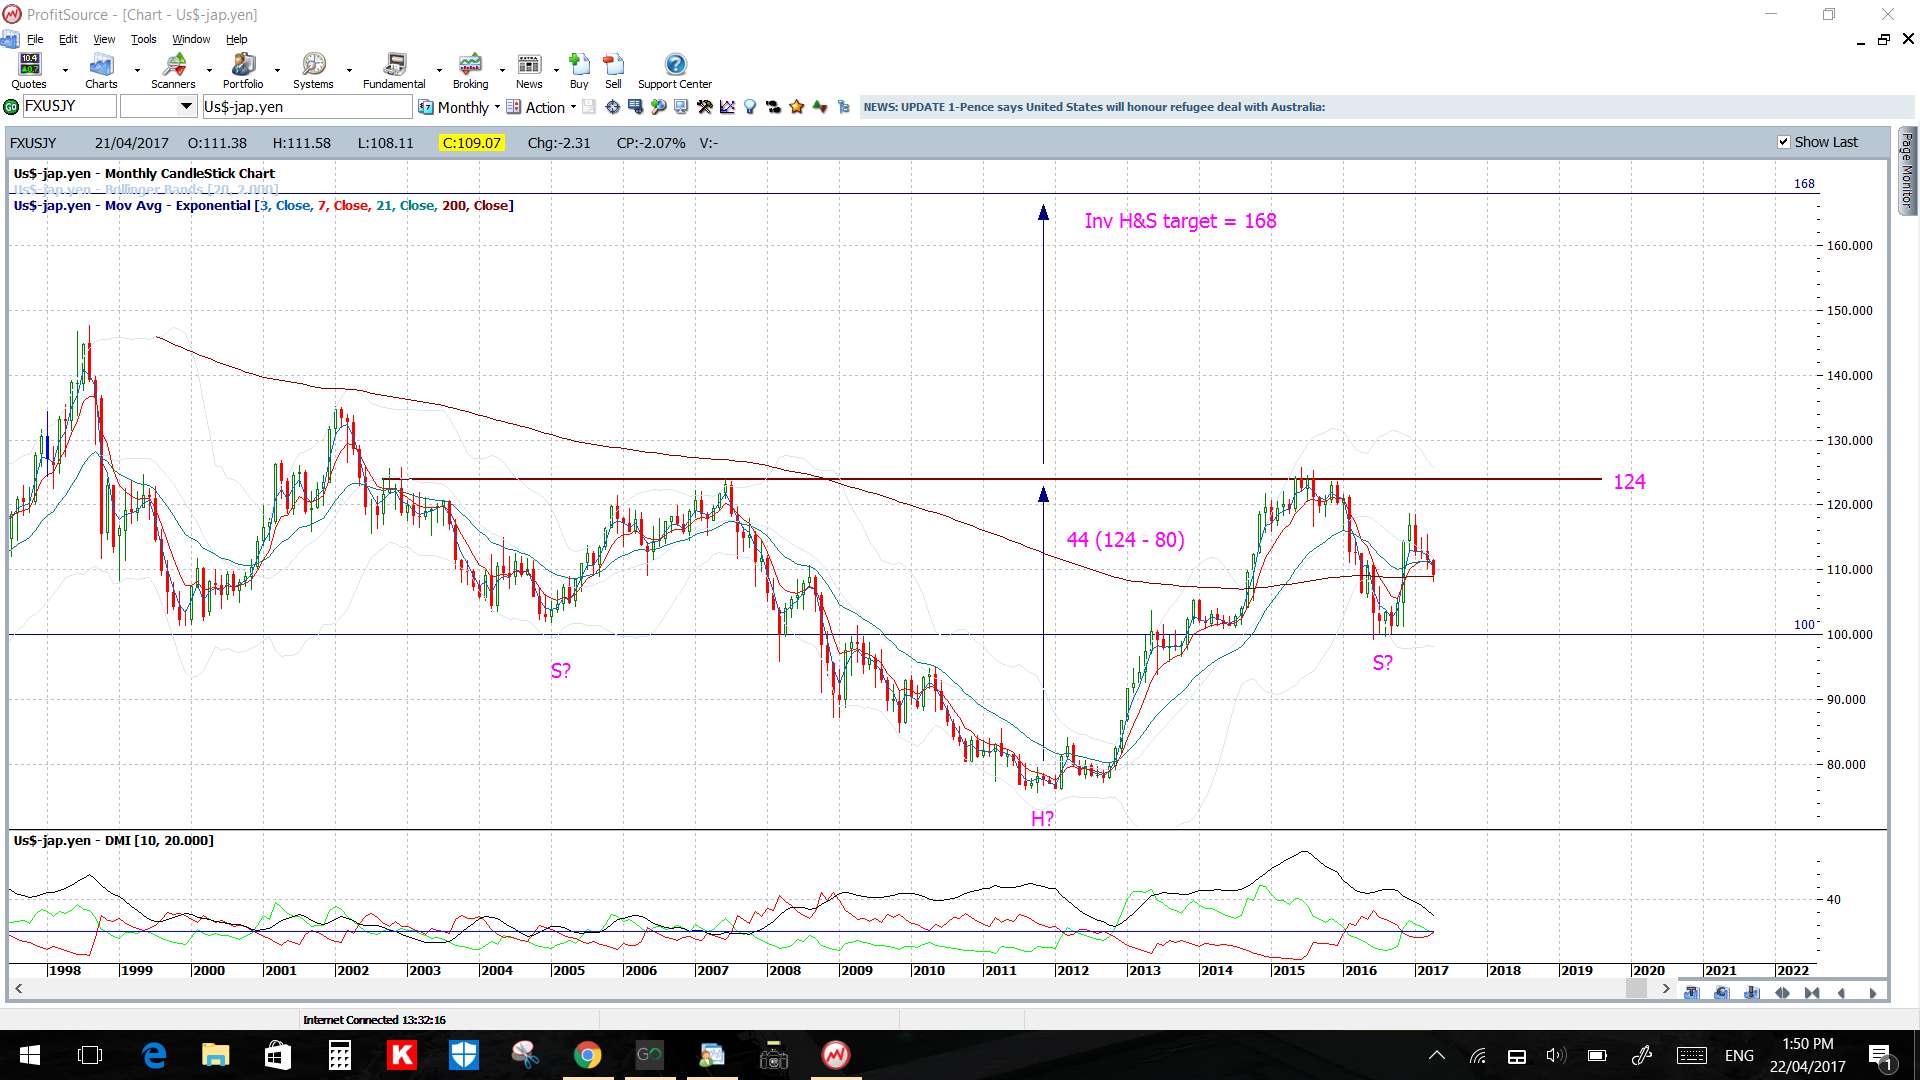
USD/JPY: The USD/JPY has been chopping sideways for the last two weeks but this week’s BoJ rate update might get things moving.
I’ve got a triangle on the 4hr chart to help guide with any breakout move.
Price is in the bottom of the 4hr Cloud but below the daily Cloud.
The weekly candle was a bullish coloured ‘Inside’ candle reflecting indecision.
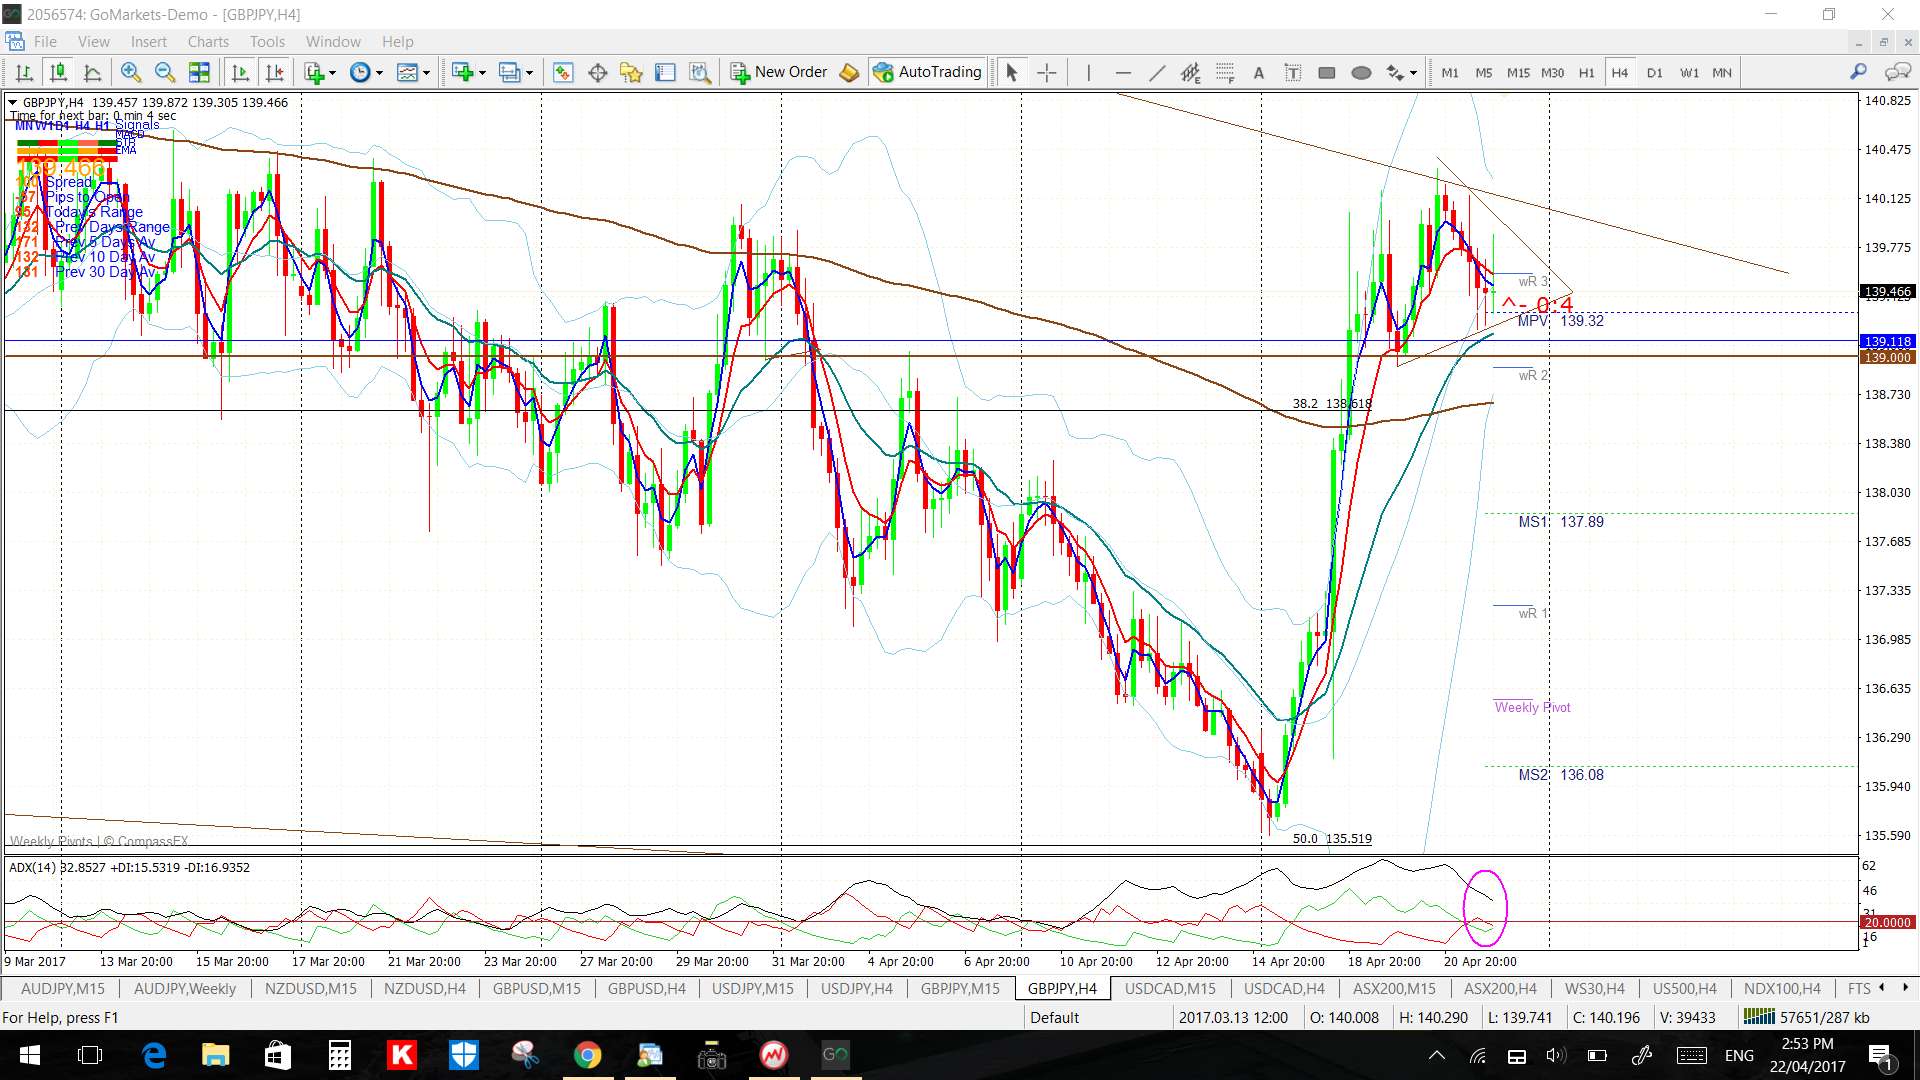
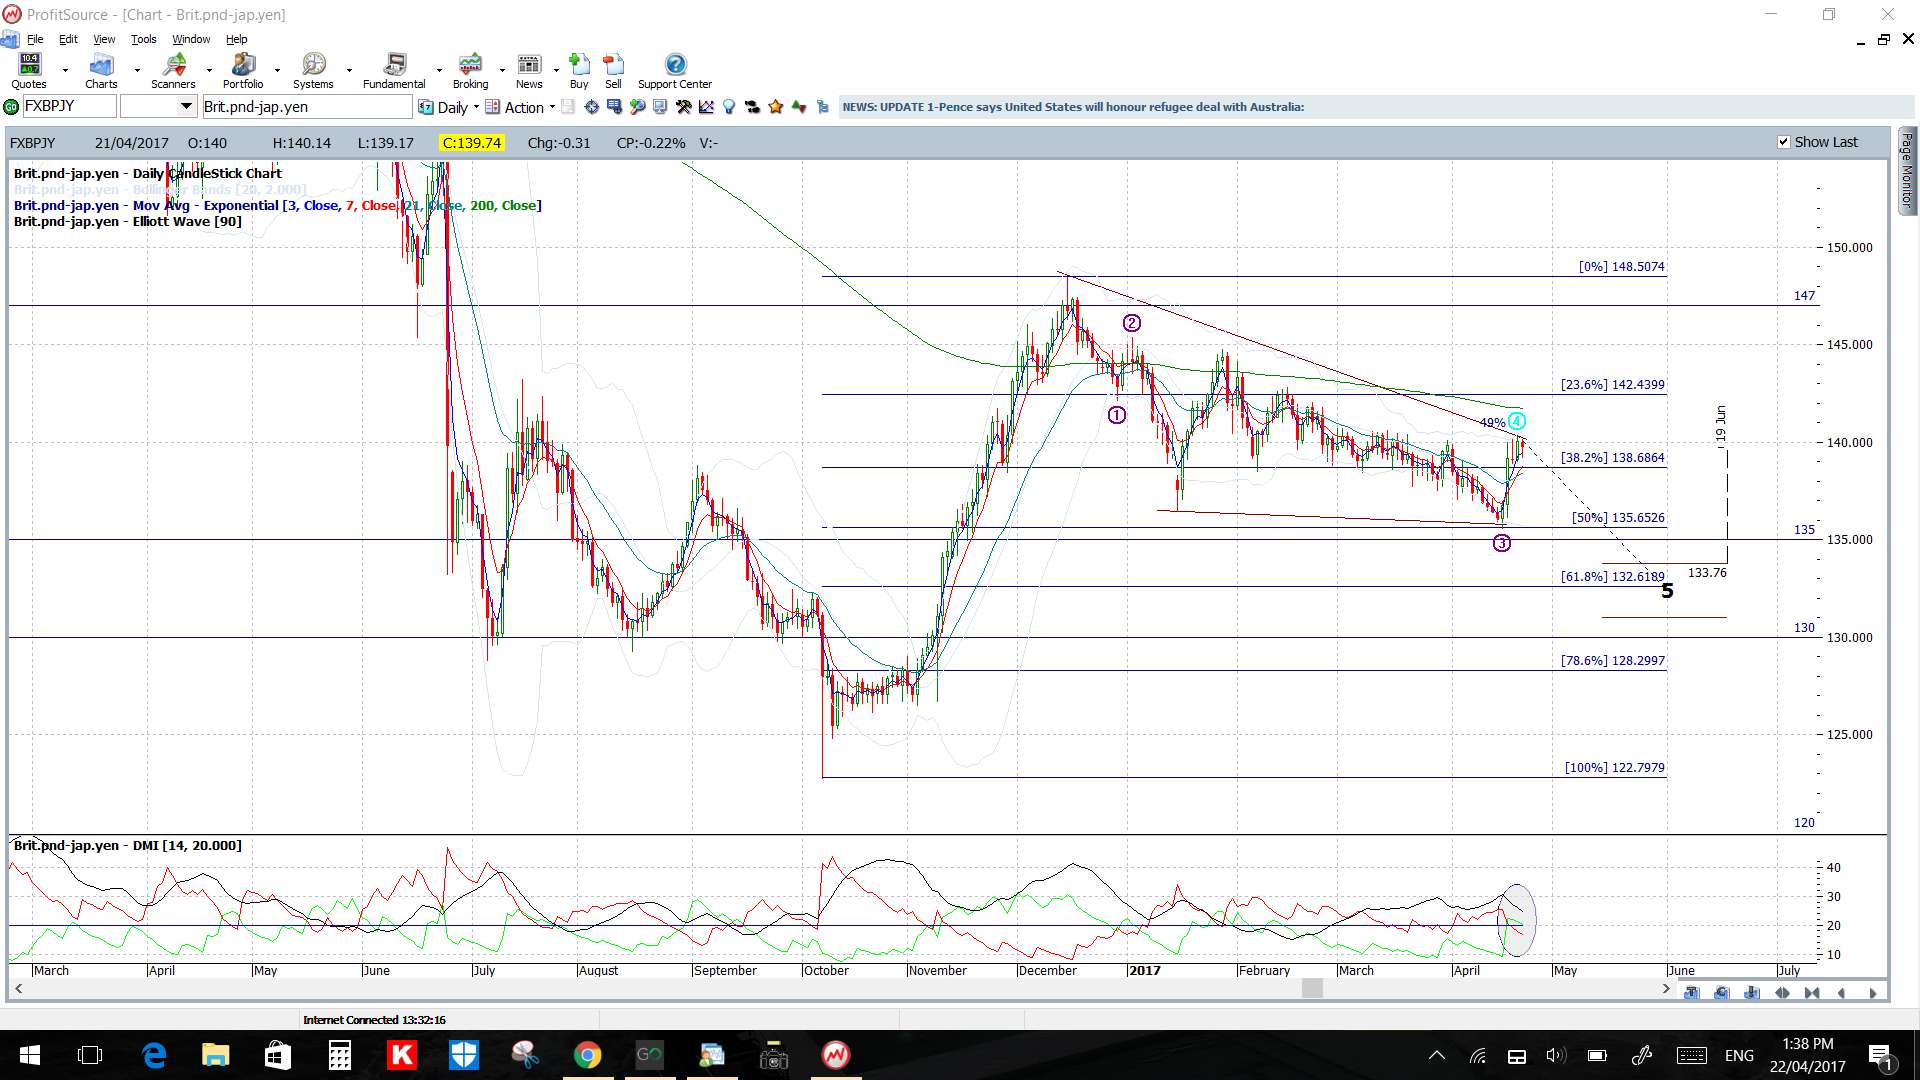
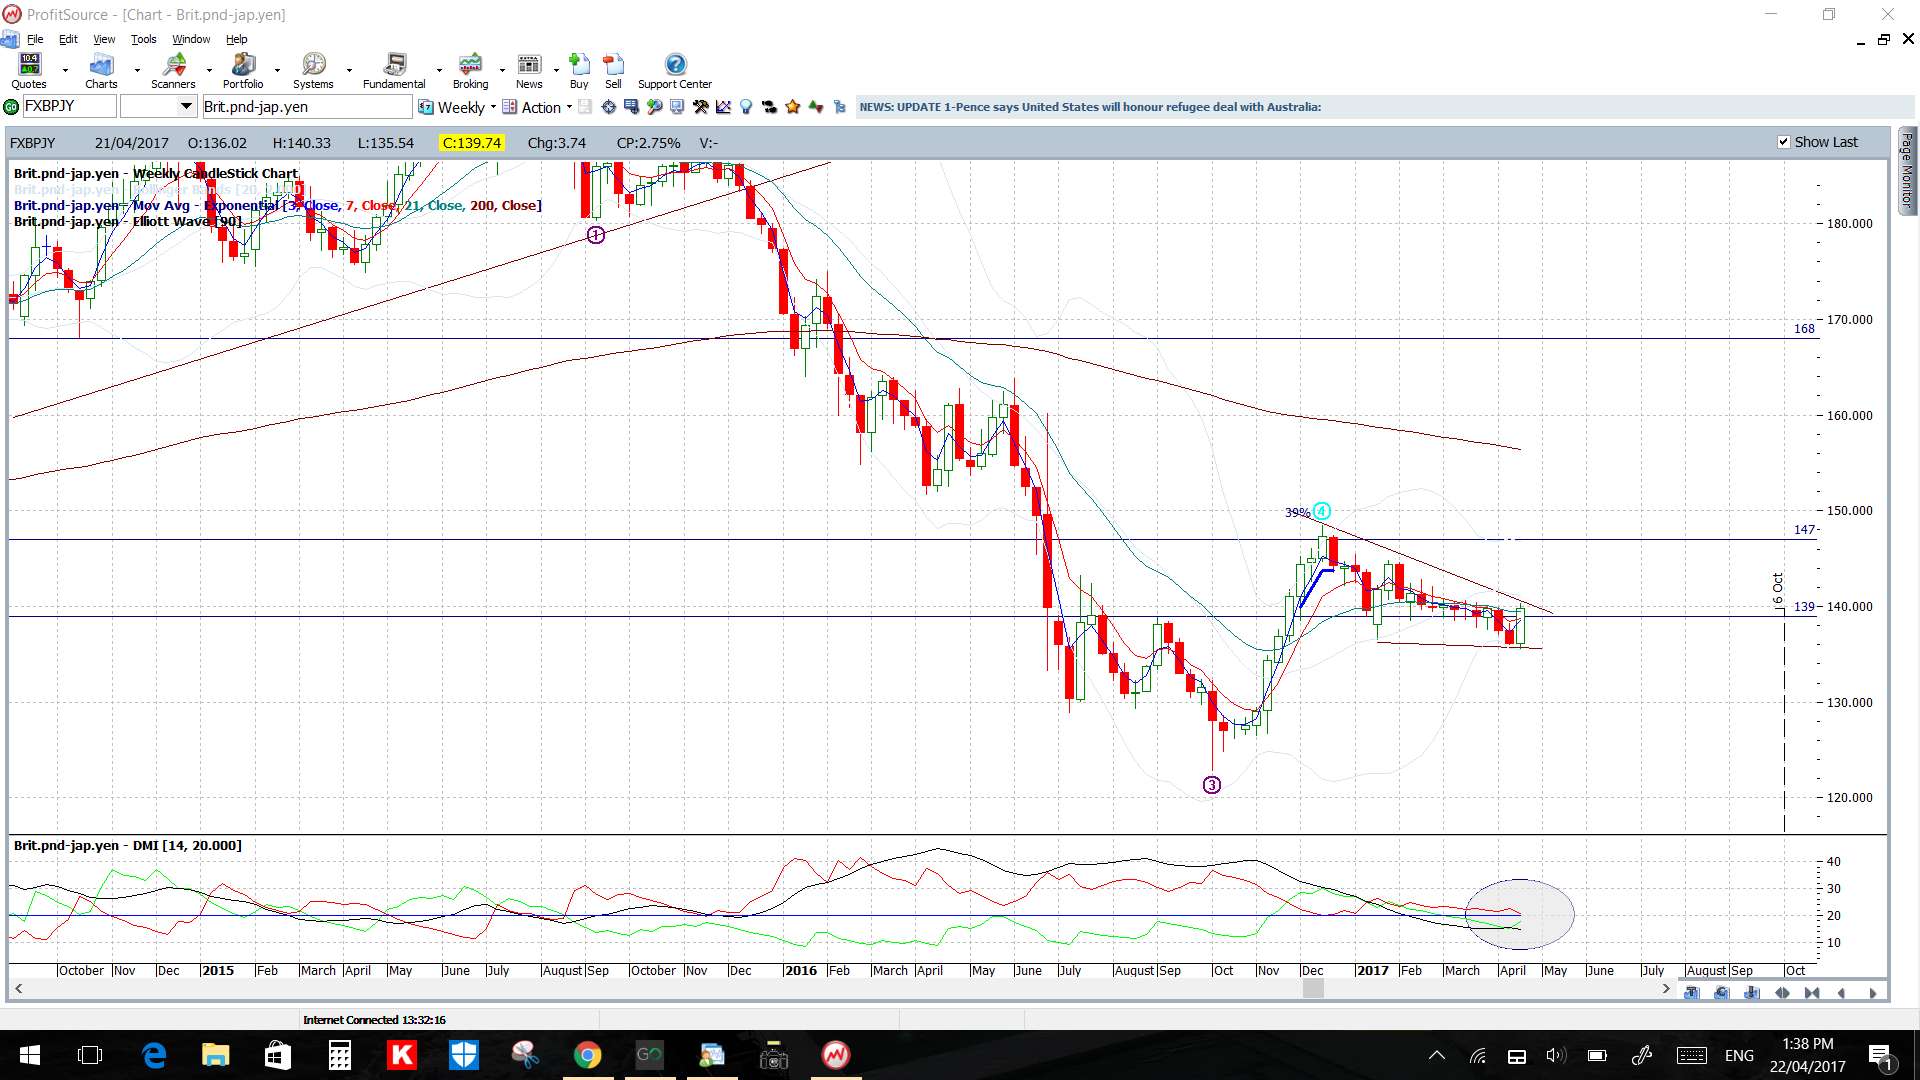
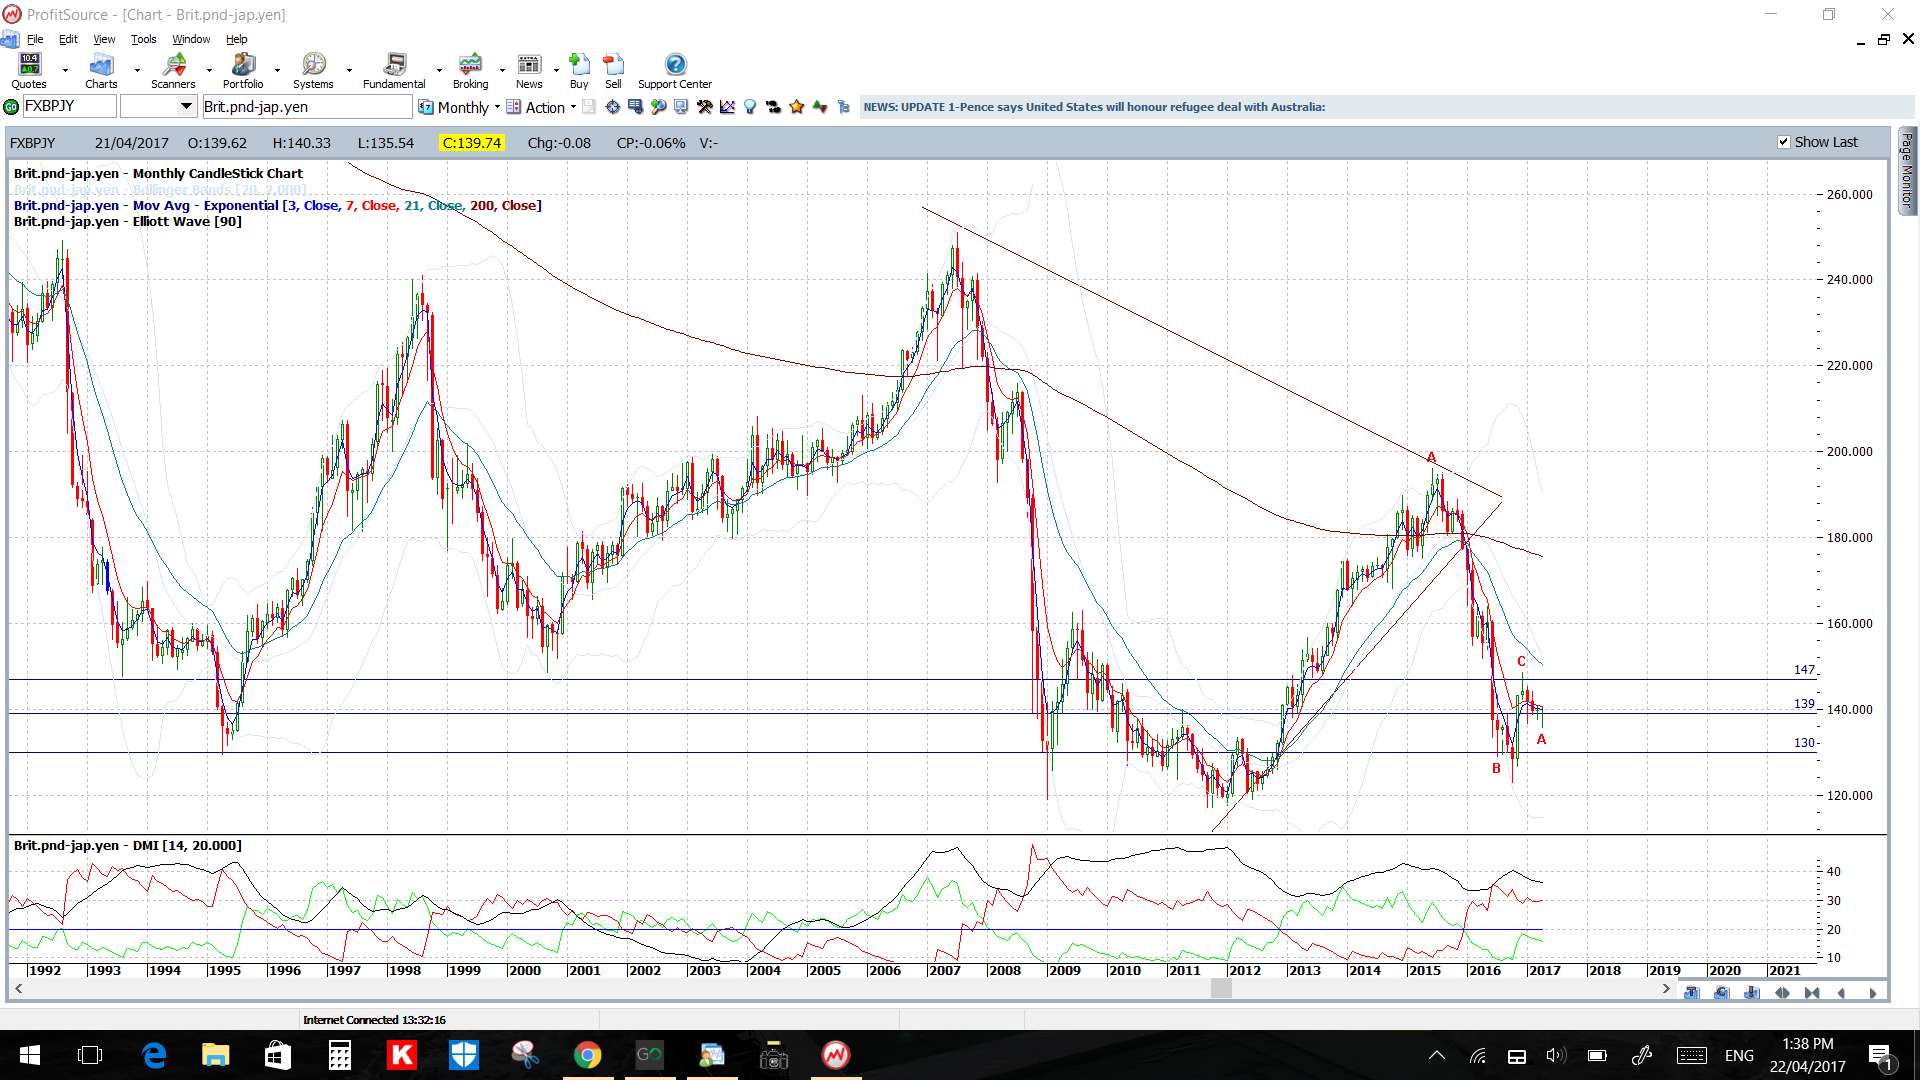
GBP/JPY: This pair made a big move early last week but then consolidated back within a new 4hr triangle. Thus, watch these trend lines for any breakout activity, especially with the BoJ this week.
Price is above the 4hr Cloud but below the daily Cloud.
The weekly candle was bullish.
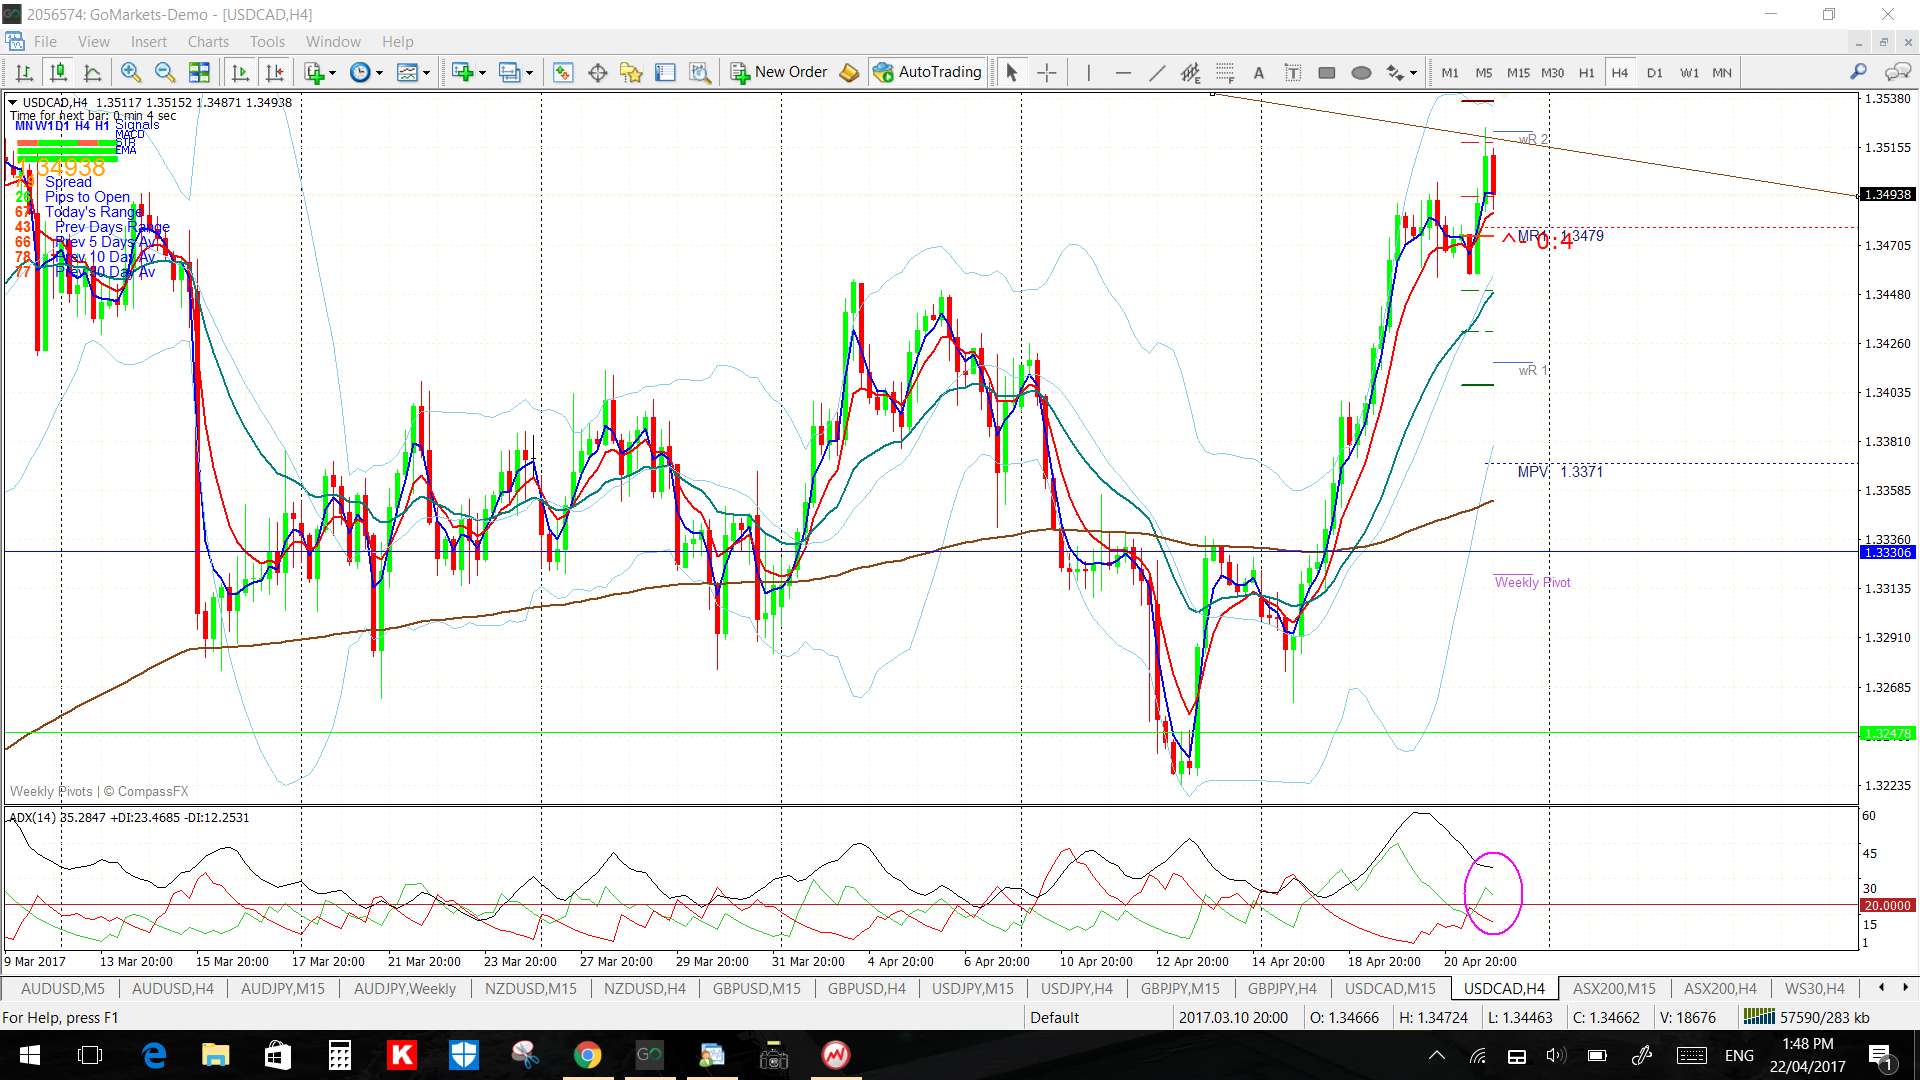
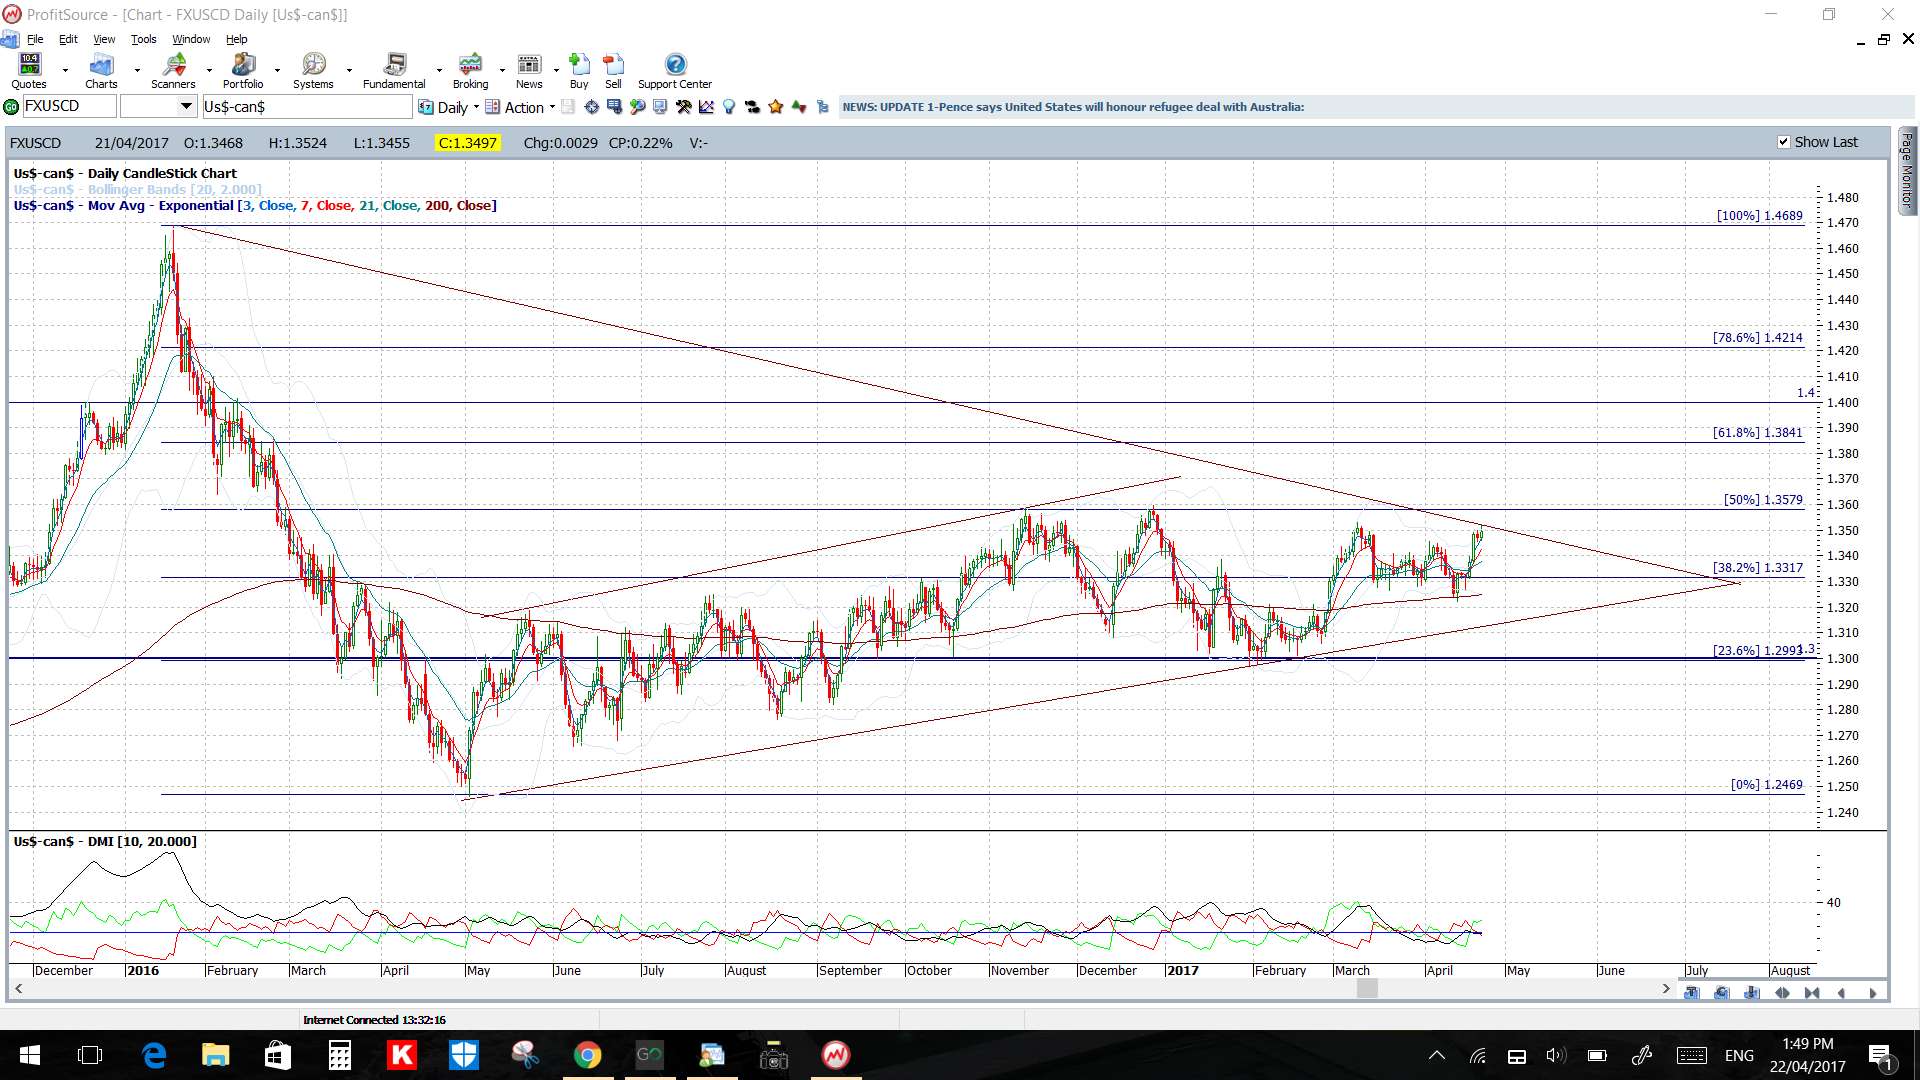
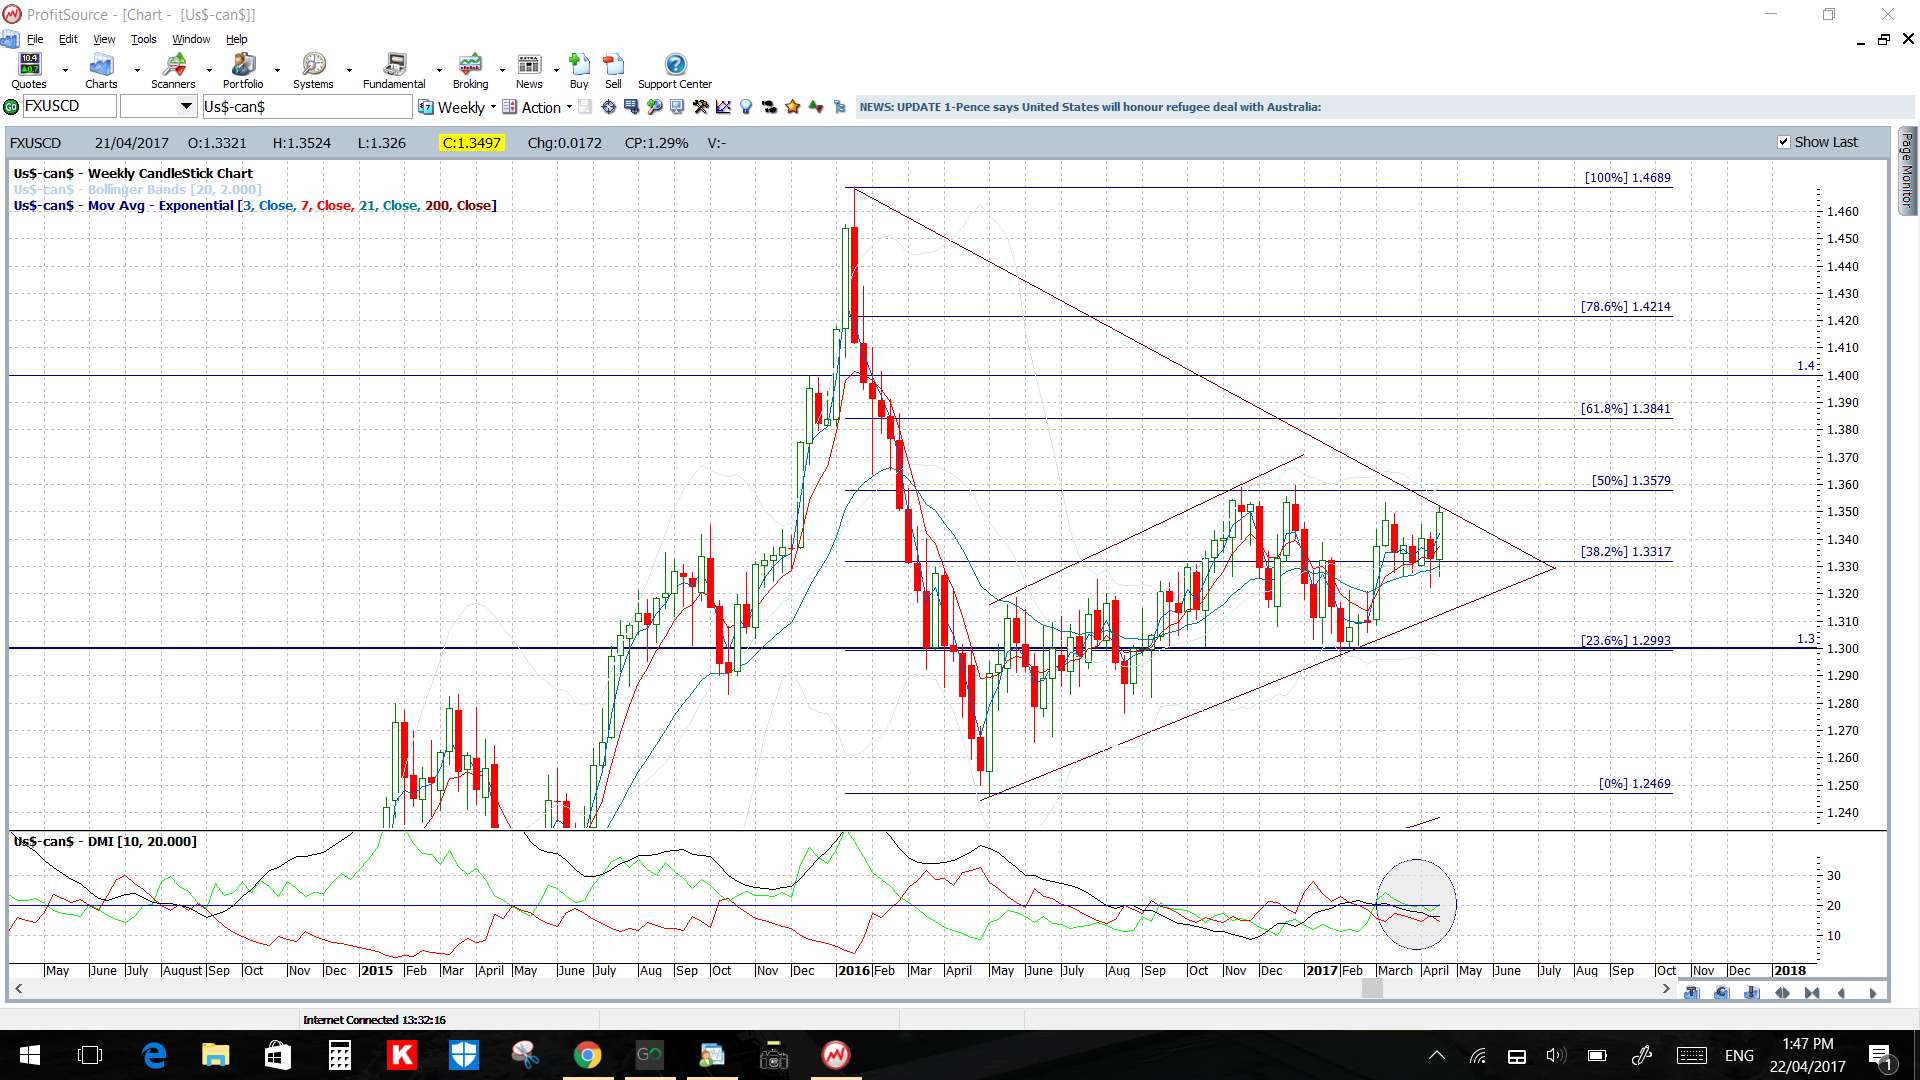
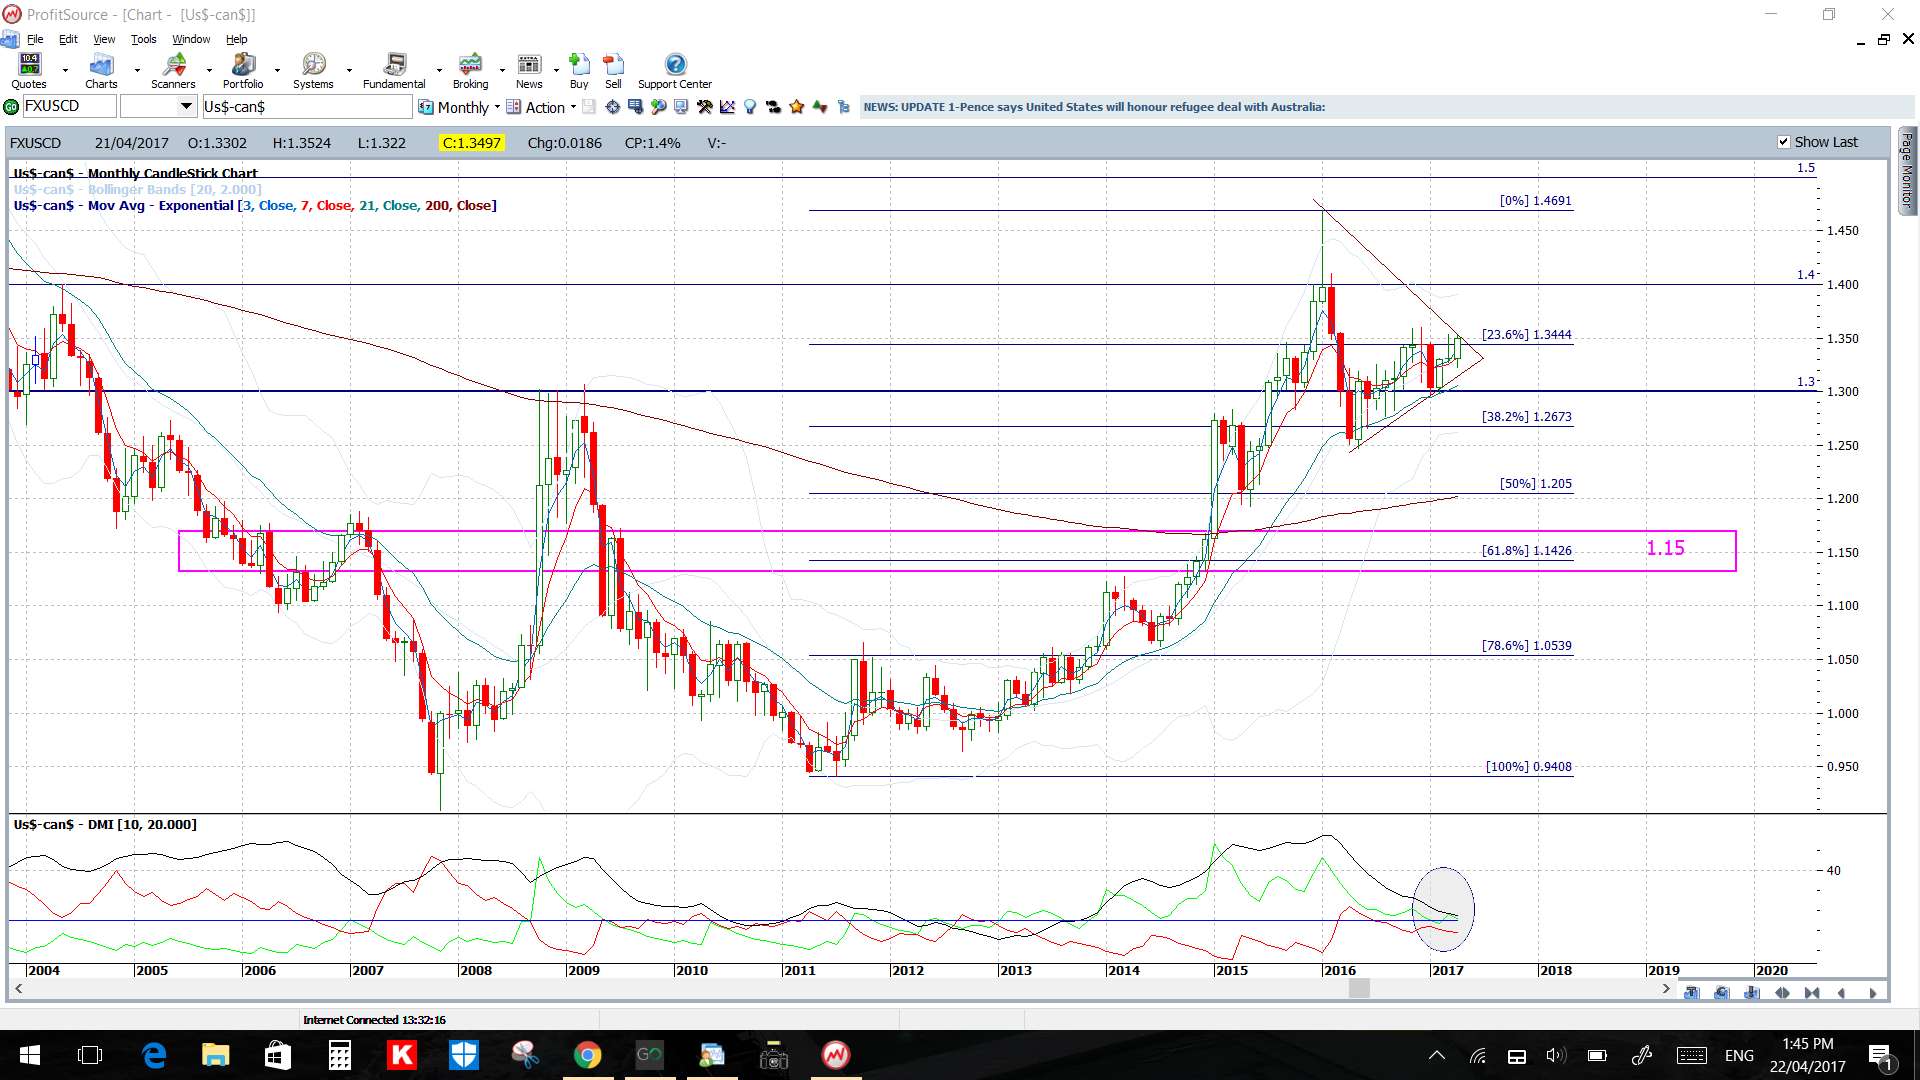
USD/CAD: This pair has been giving me a bit of charting grief. The lack of momentum on the weekly and monthly charts has had me adjusting the trend lines here.
Price is above the 4hr and daily Cloud.
The weekly candle was bullish and engulfing.
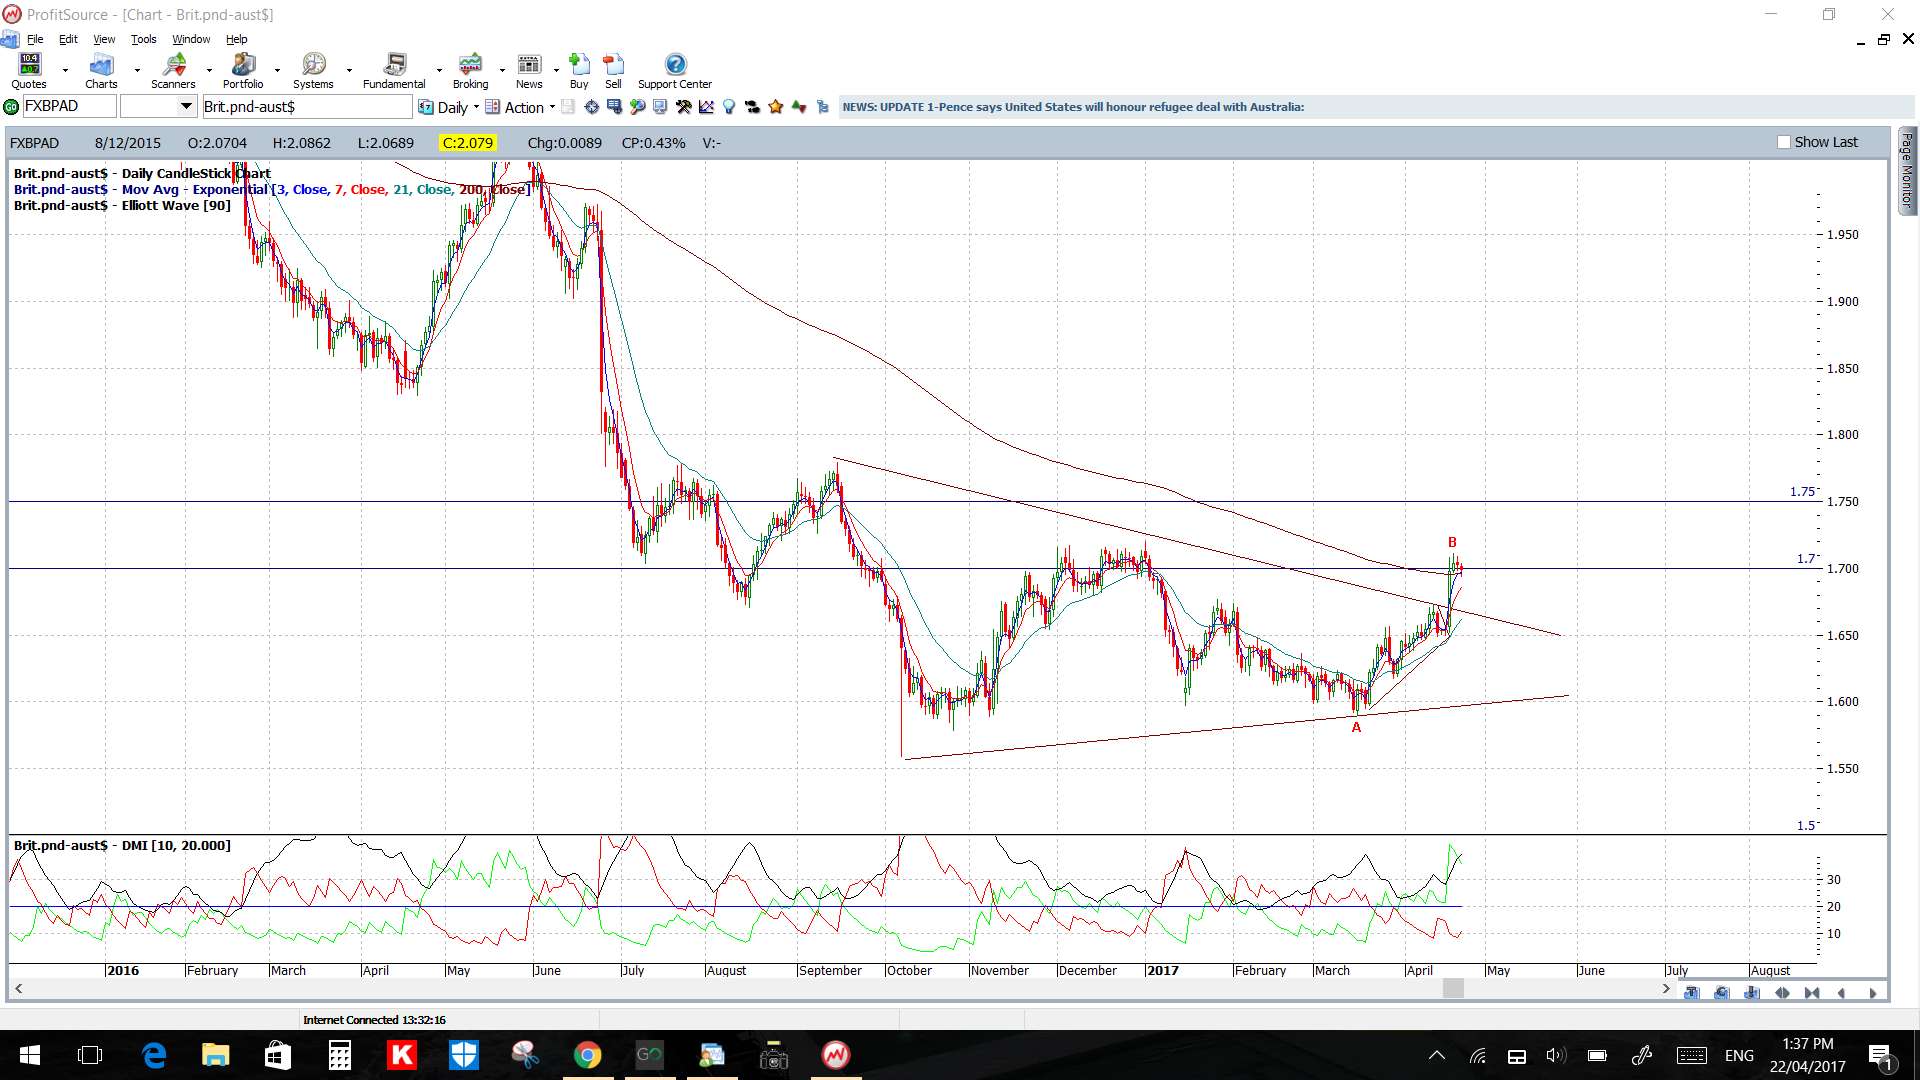
GBP/AUD: This pair also made a huge move early in the week but then spent time consolidating. Thus, watch the 4hr chart’s Flag watch trend lines next week for any make or break activity.
Price is above the 4hr and daily Cloud.
The weekly candle was bullish.
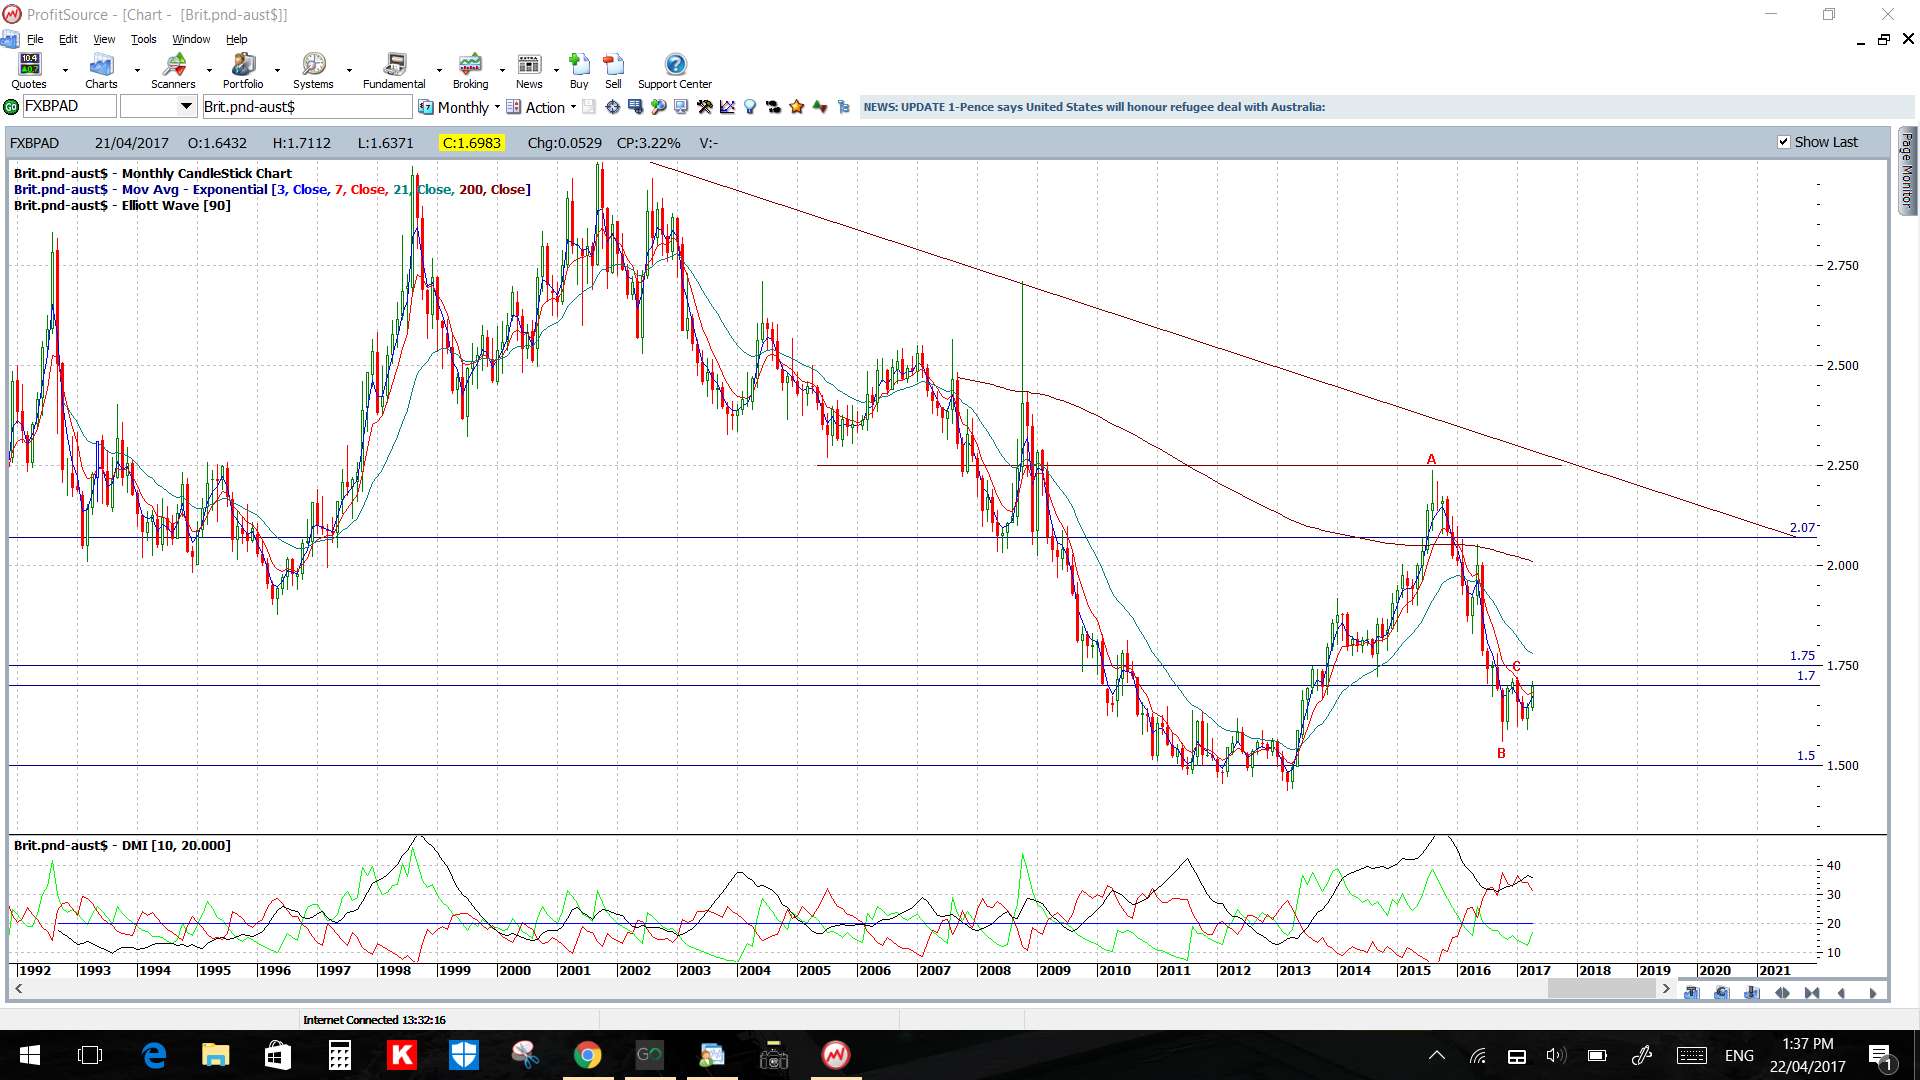
GBP/NZD: As with the GBP/AUD, this pair also made a huge move early in the week but then spent time consolidating. Thus, watch the 4hr chart’s Flag trend lines for any make or break activity.
Price is above the 4hr and daily Cloud.
The weekly candle was bullish.
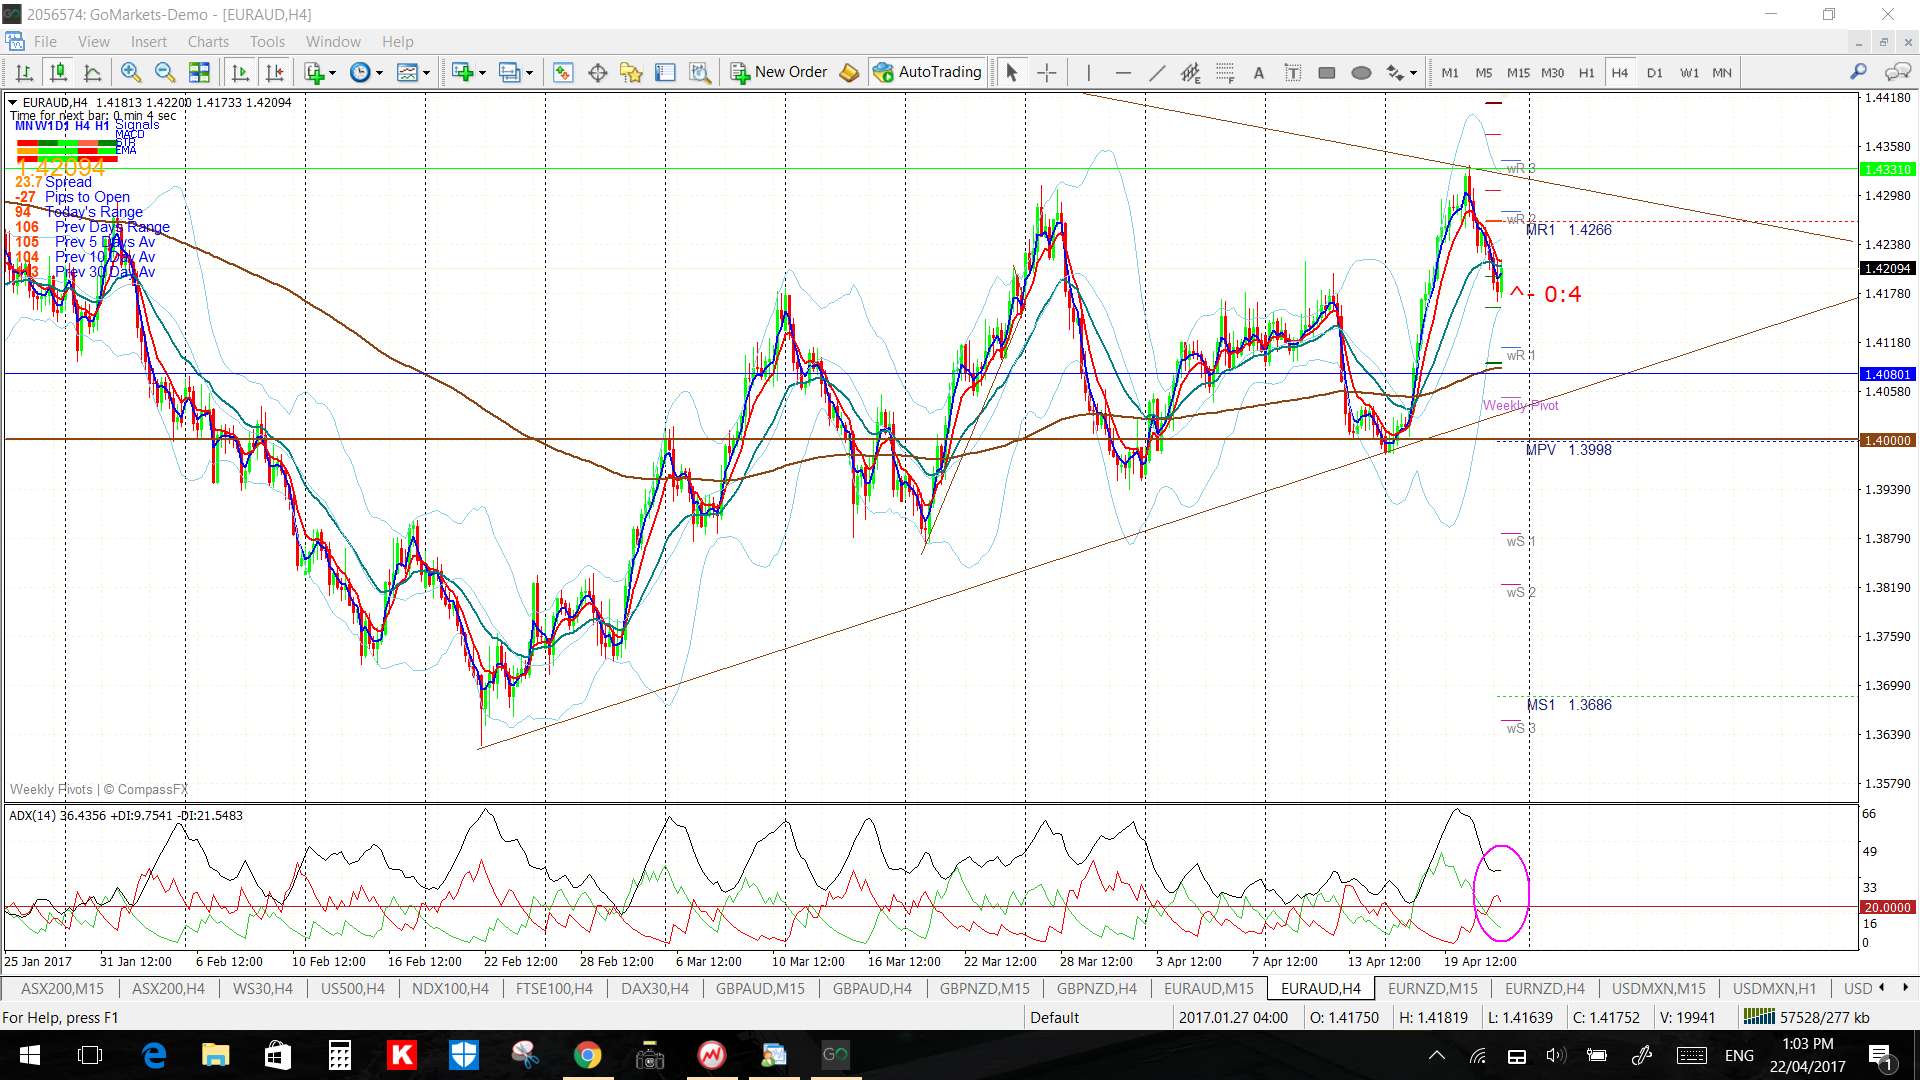
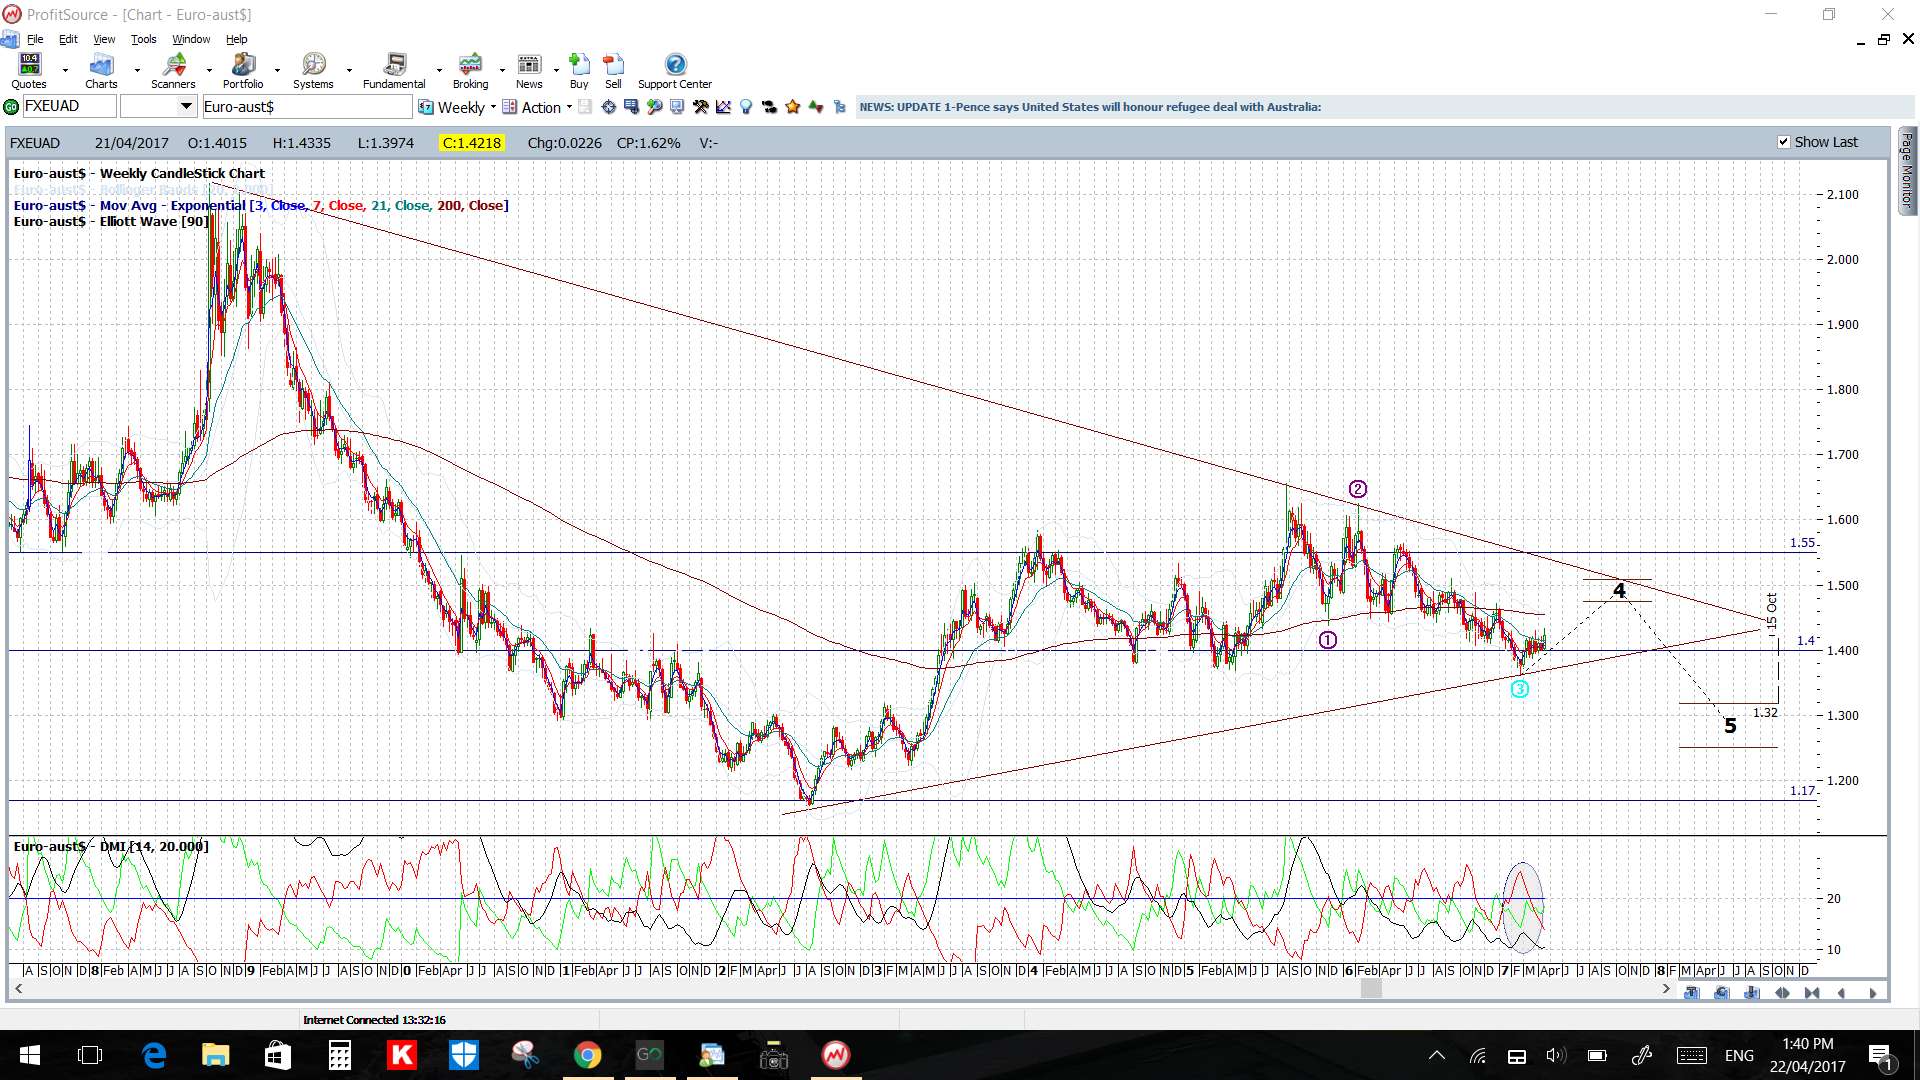
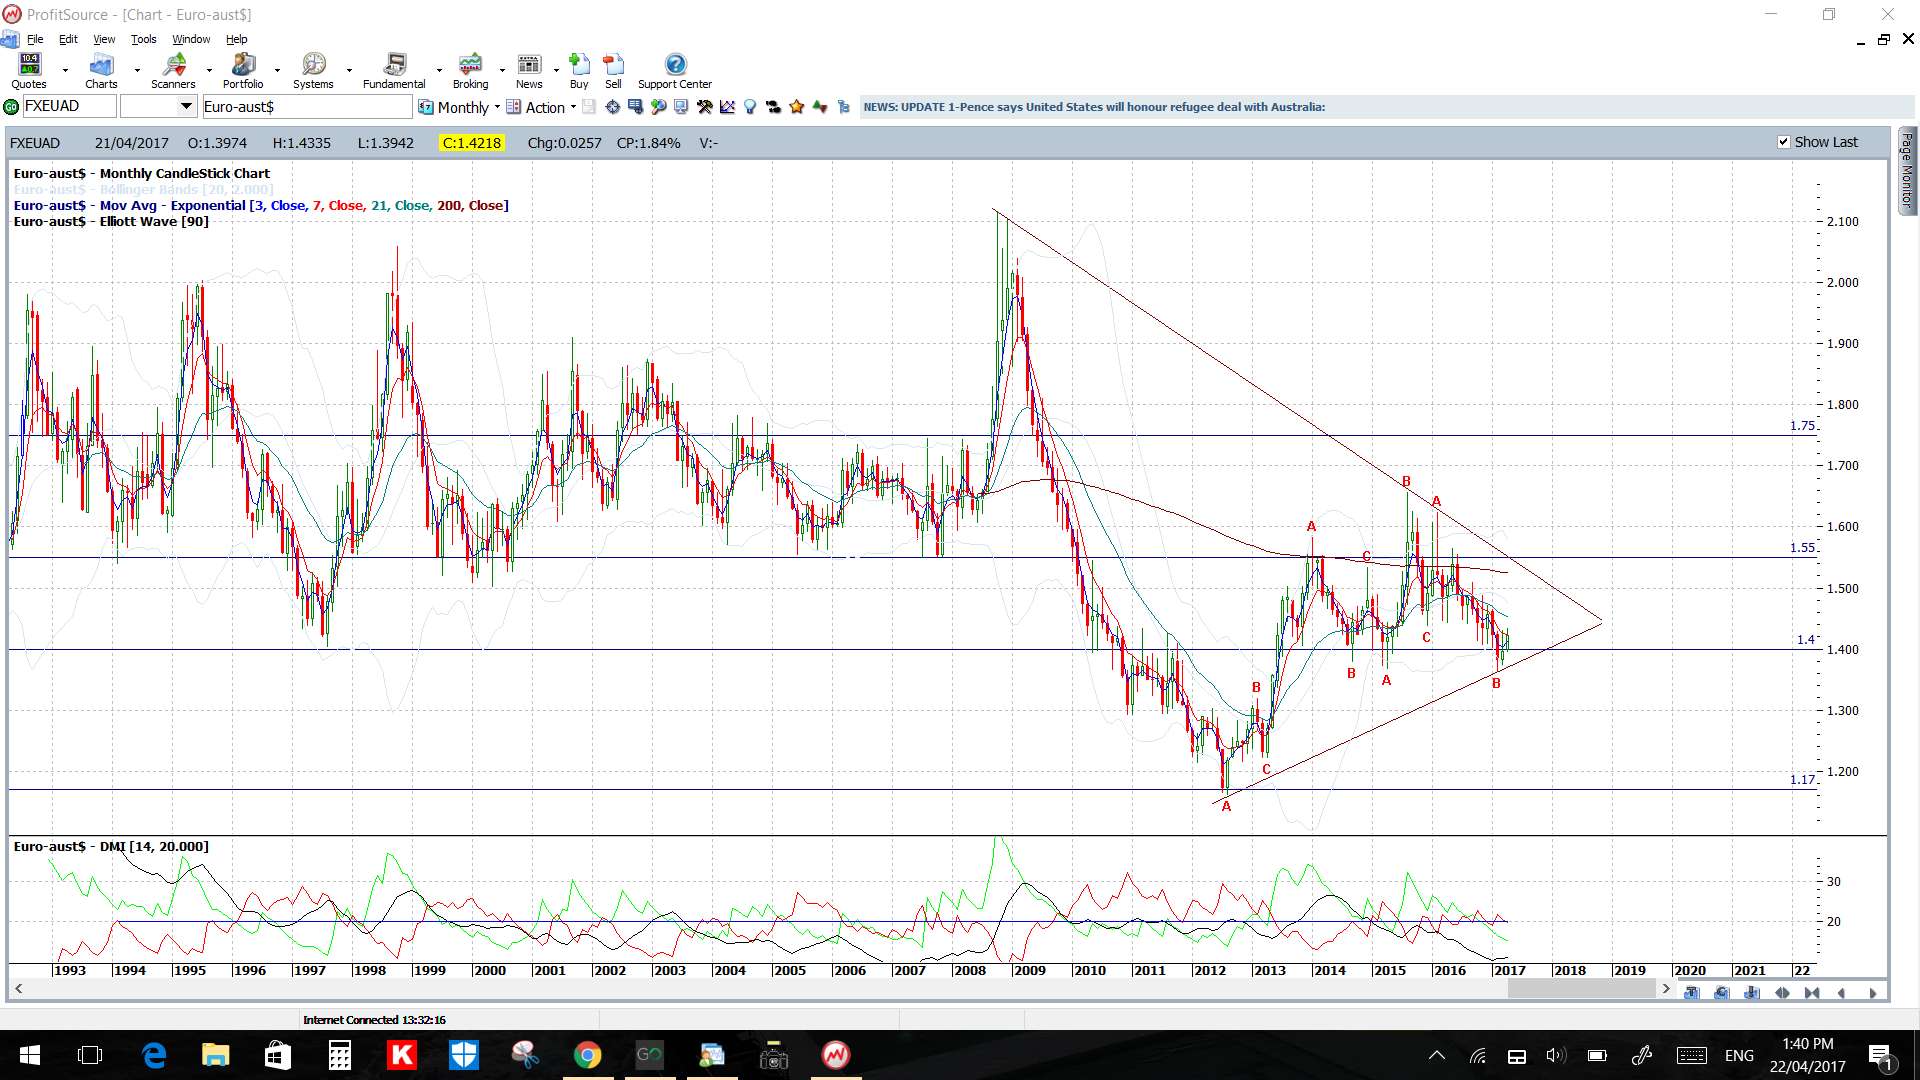
EUR/AUD: This pair remains in a daily chart triangle so watch the trend lines for any make or break activity.
Price is above the 4hr and daily Cloud.
The weekly candle was bullish.
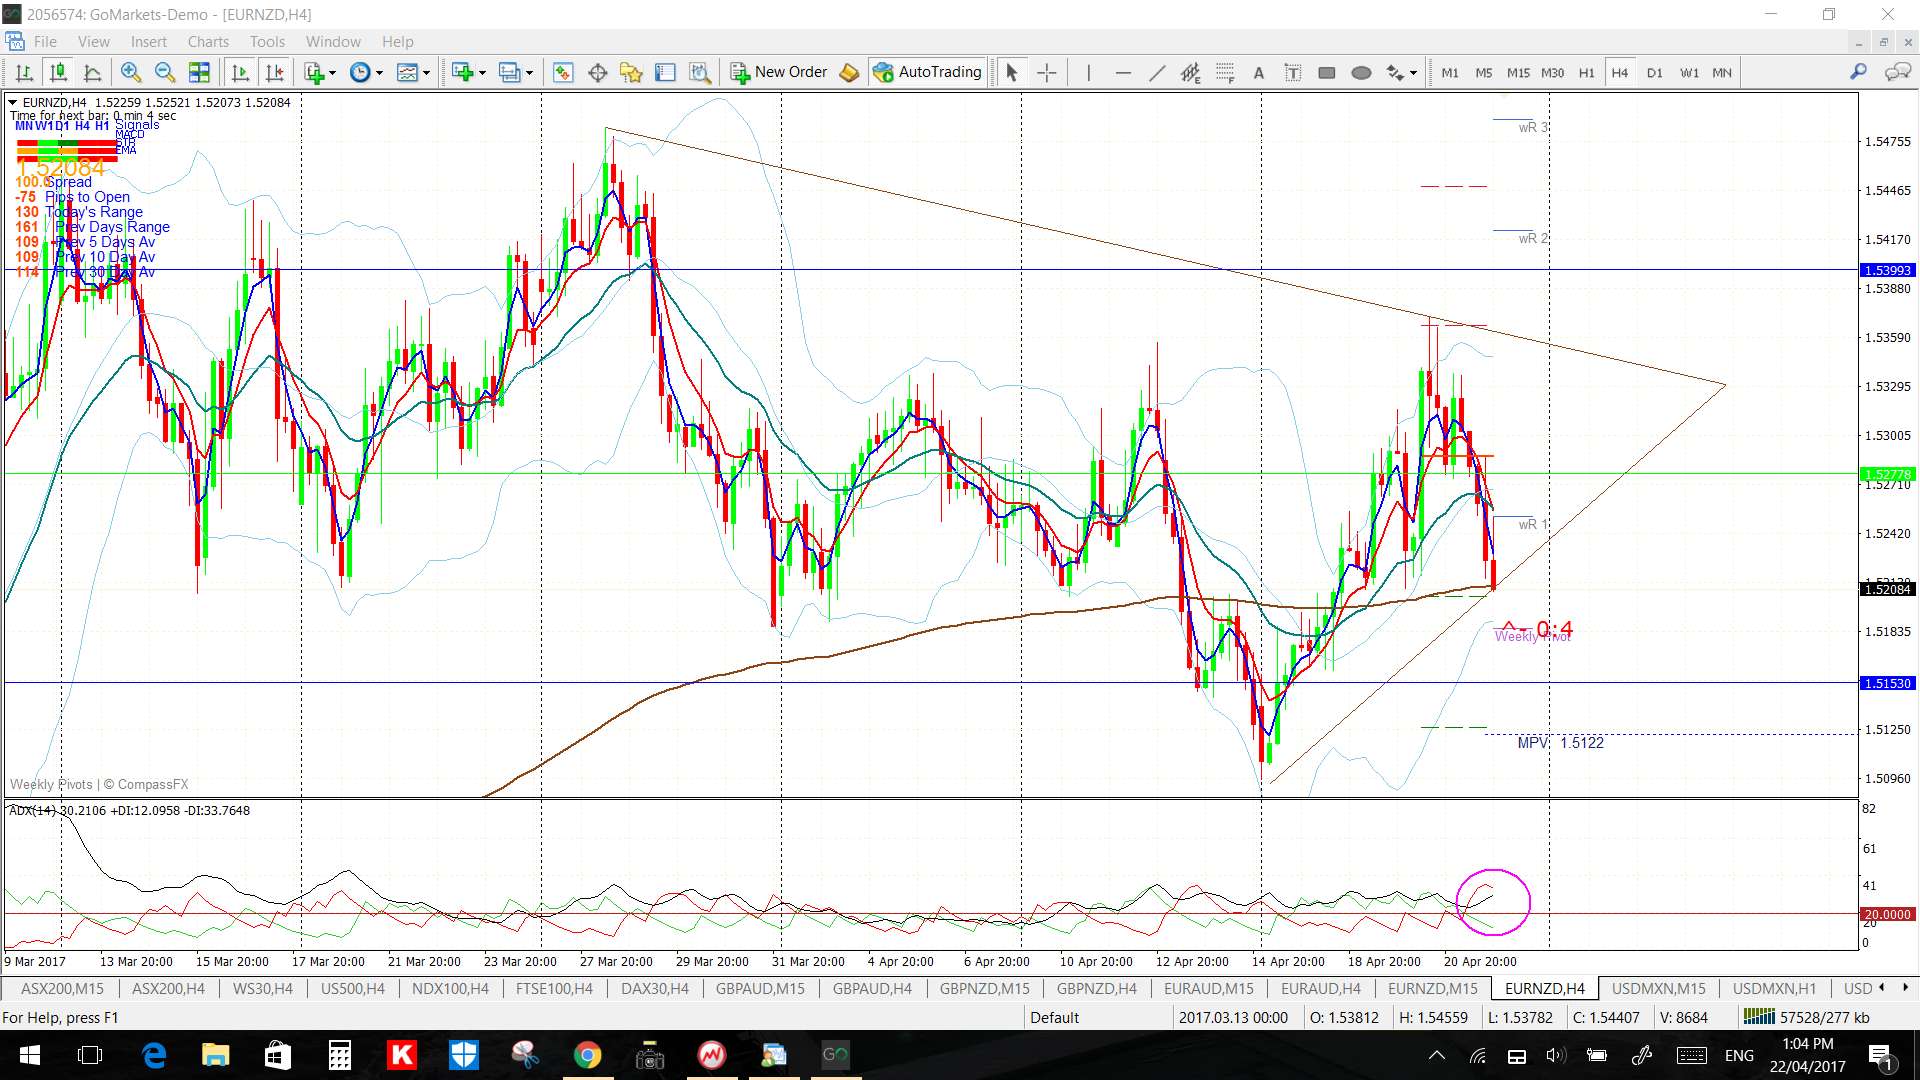
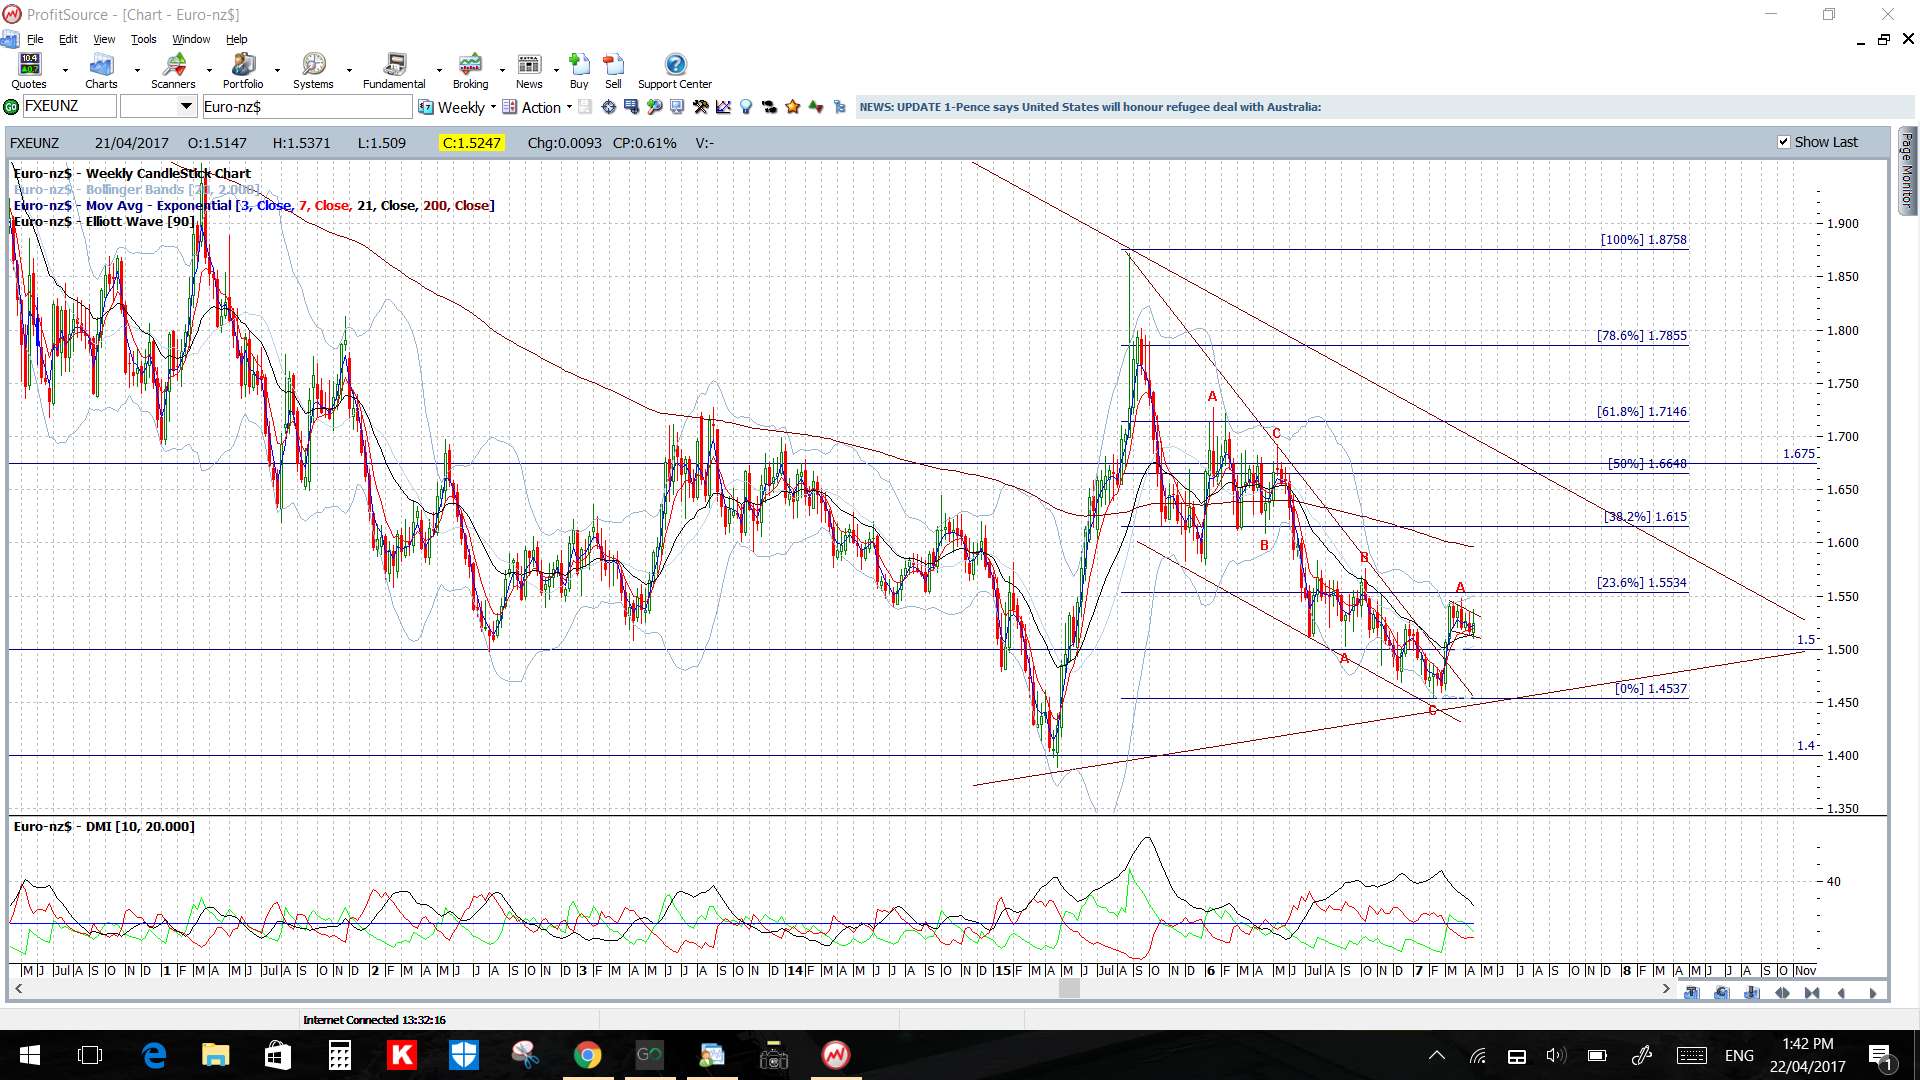
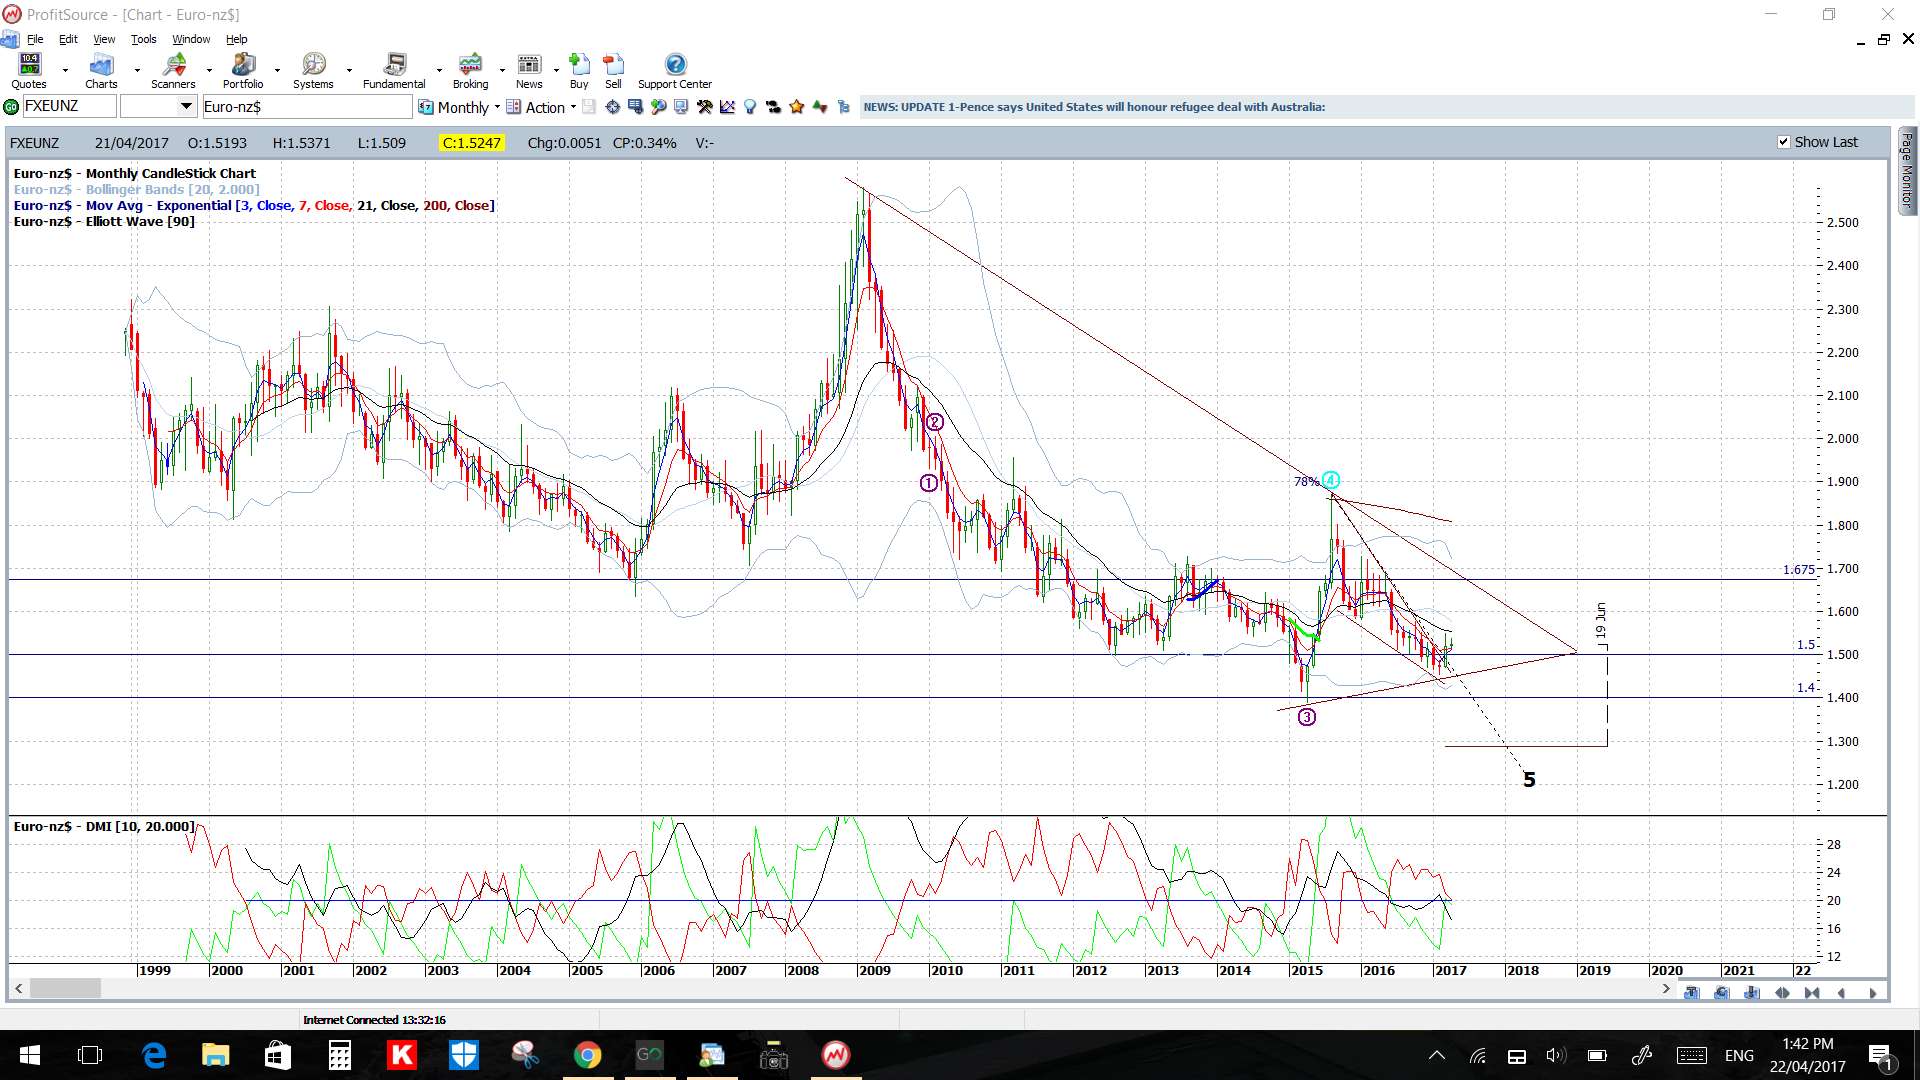
EUR/NZD: This pair is in a 4hr chart triangle so watch the trend lines for any make or break activity.
Price is in the 4hr Cloud but just above the daily Cloud.
The weekly candle was bullish but with a long upper shadow.
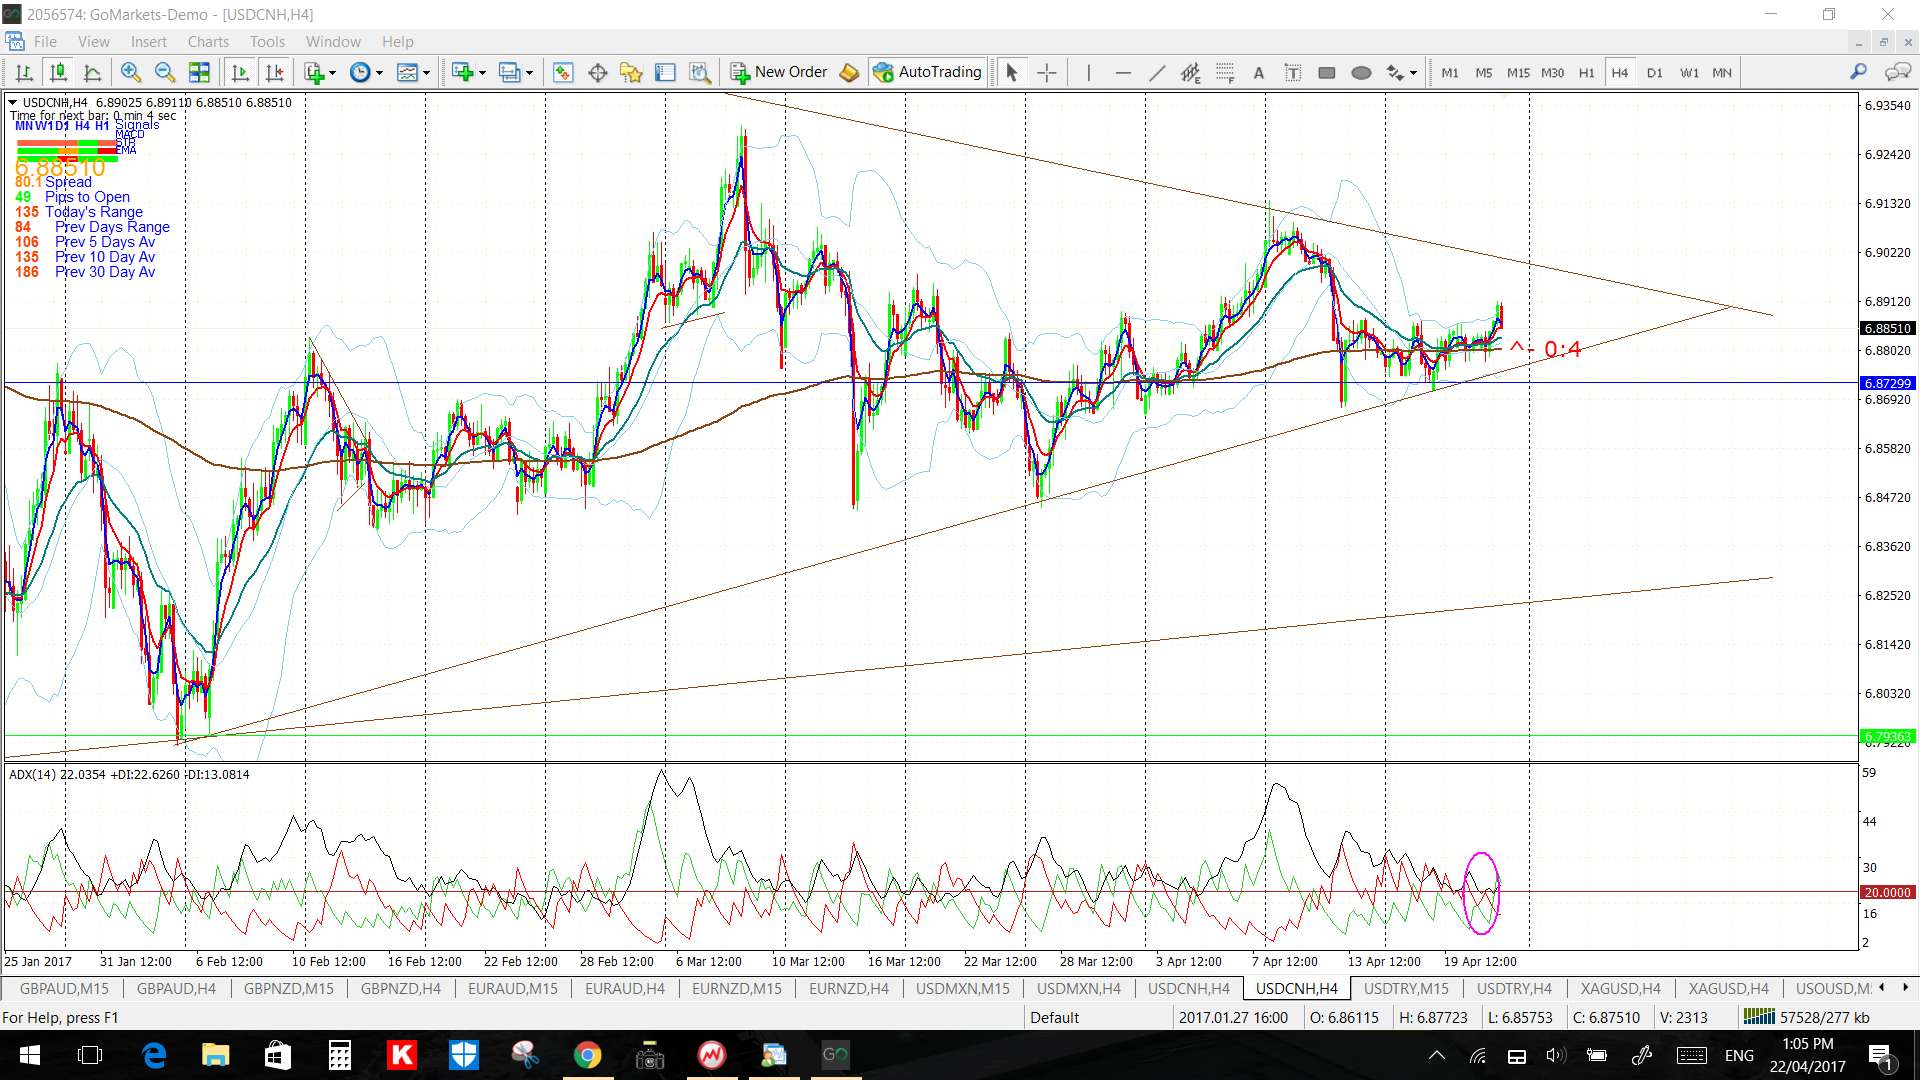
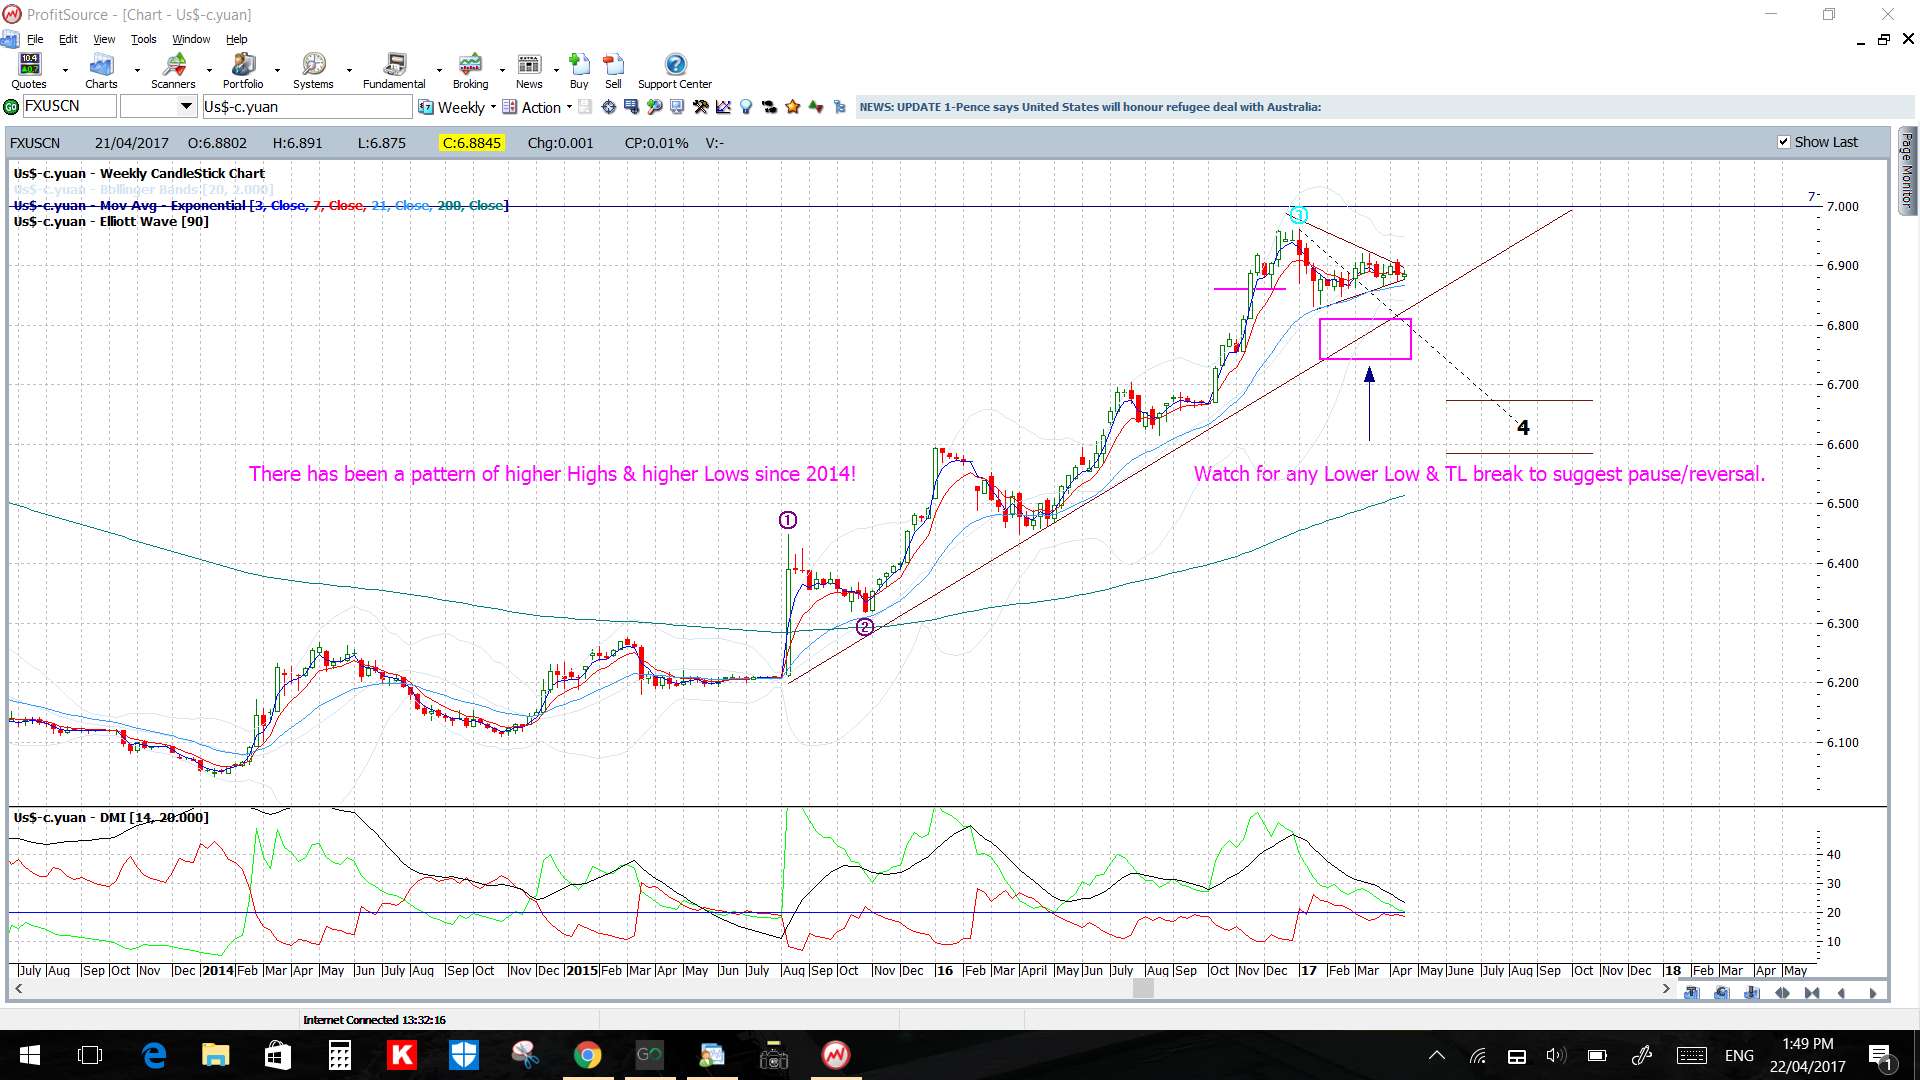
USD/CNH: This pair remains in a daily chart triangle so watch the trend lines for any make or break activity.
Price is in the 4hr and daily Cloud.
The weekly candle closed as a bullish coloured ‘Spinning Top’ and as an ‘Inside’ candle with both reflecting indecision.
USD/MXN: This pair gave a huge breakout trade earlier in the week but, then, spent the latter part of the week consolidating under the 19 S/R level.
I’ve got Flag trend lines on the 60 min / 4hr charts to watch for any make or break activity. Note also the revised descending channel trend lines here.
Price is above the 4hr Cloud but below the daily Cloud.
The weekly candle was bullish and engulfing.
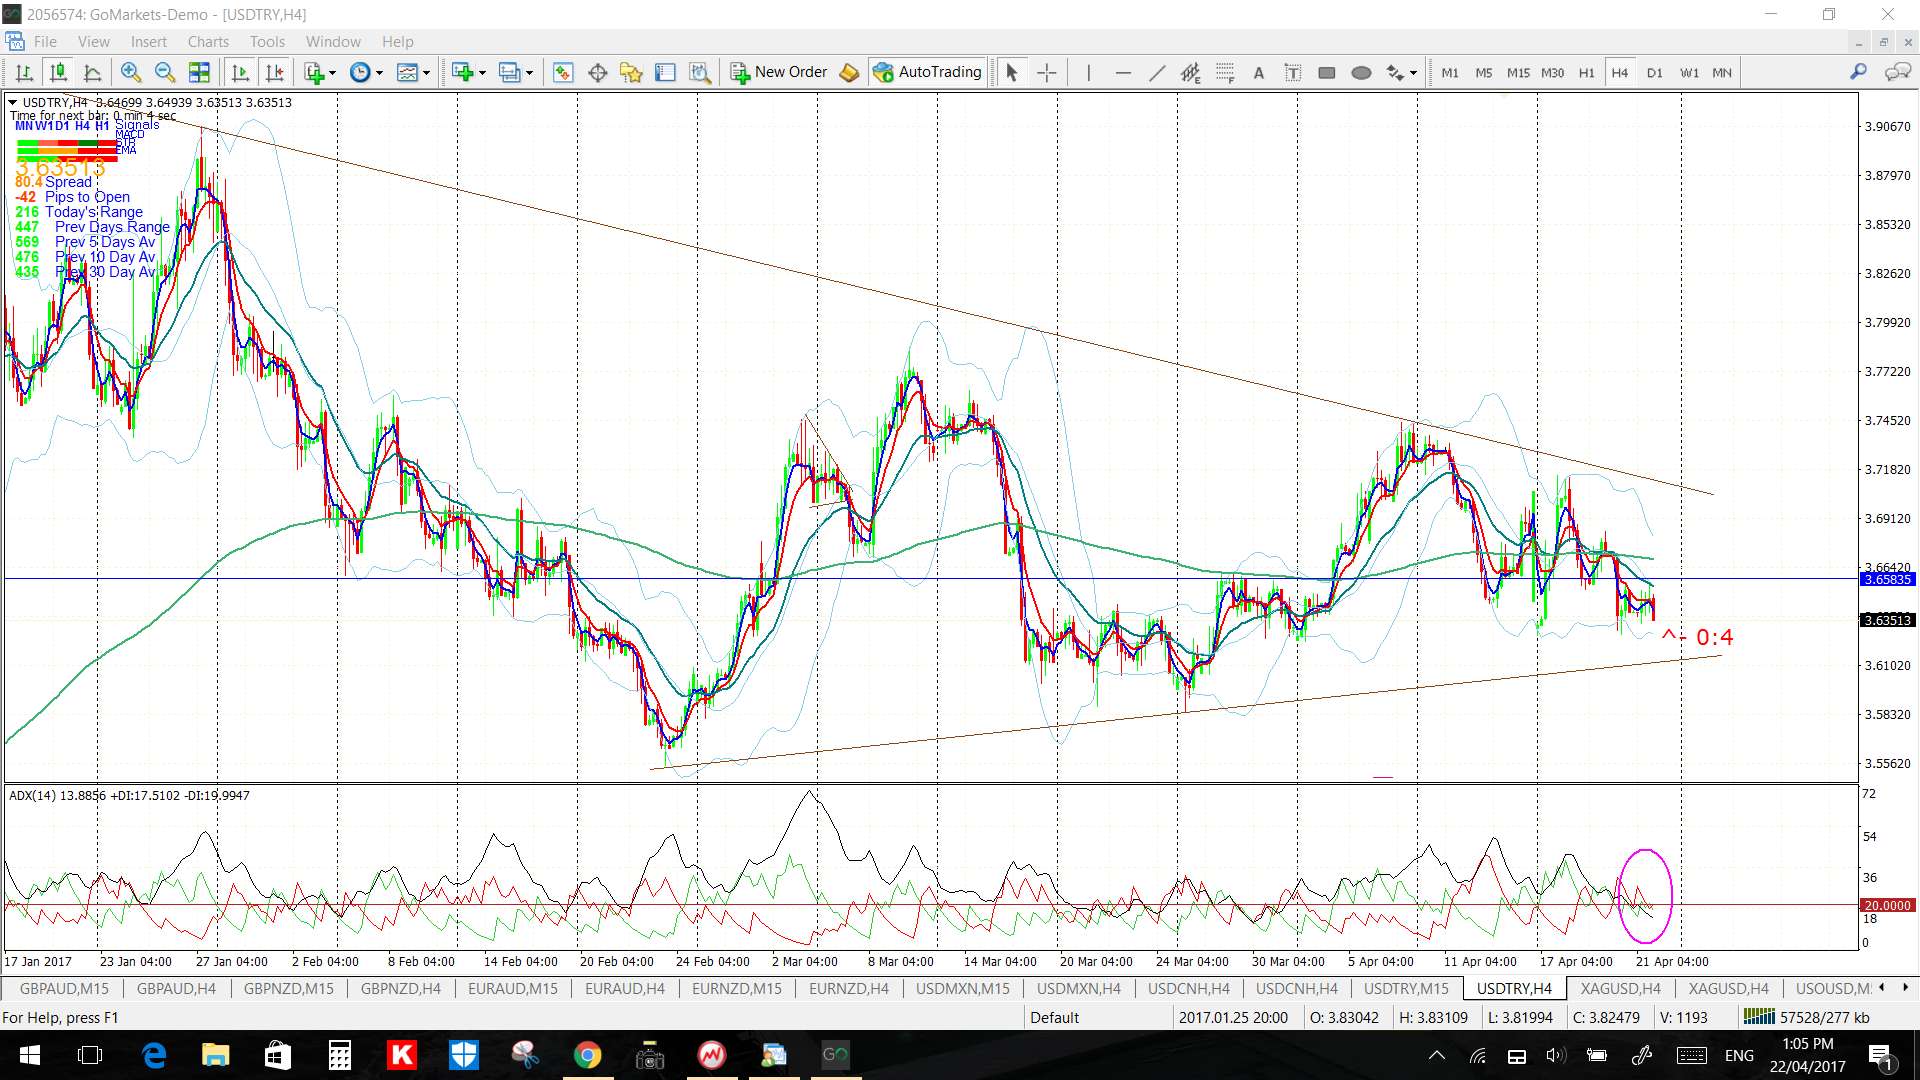
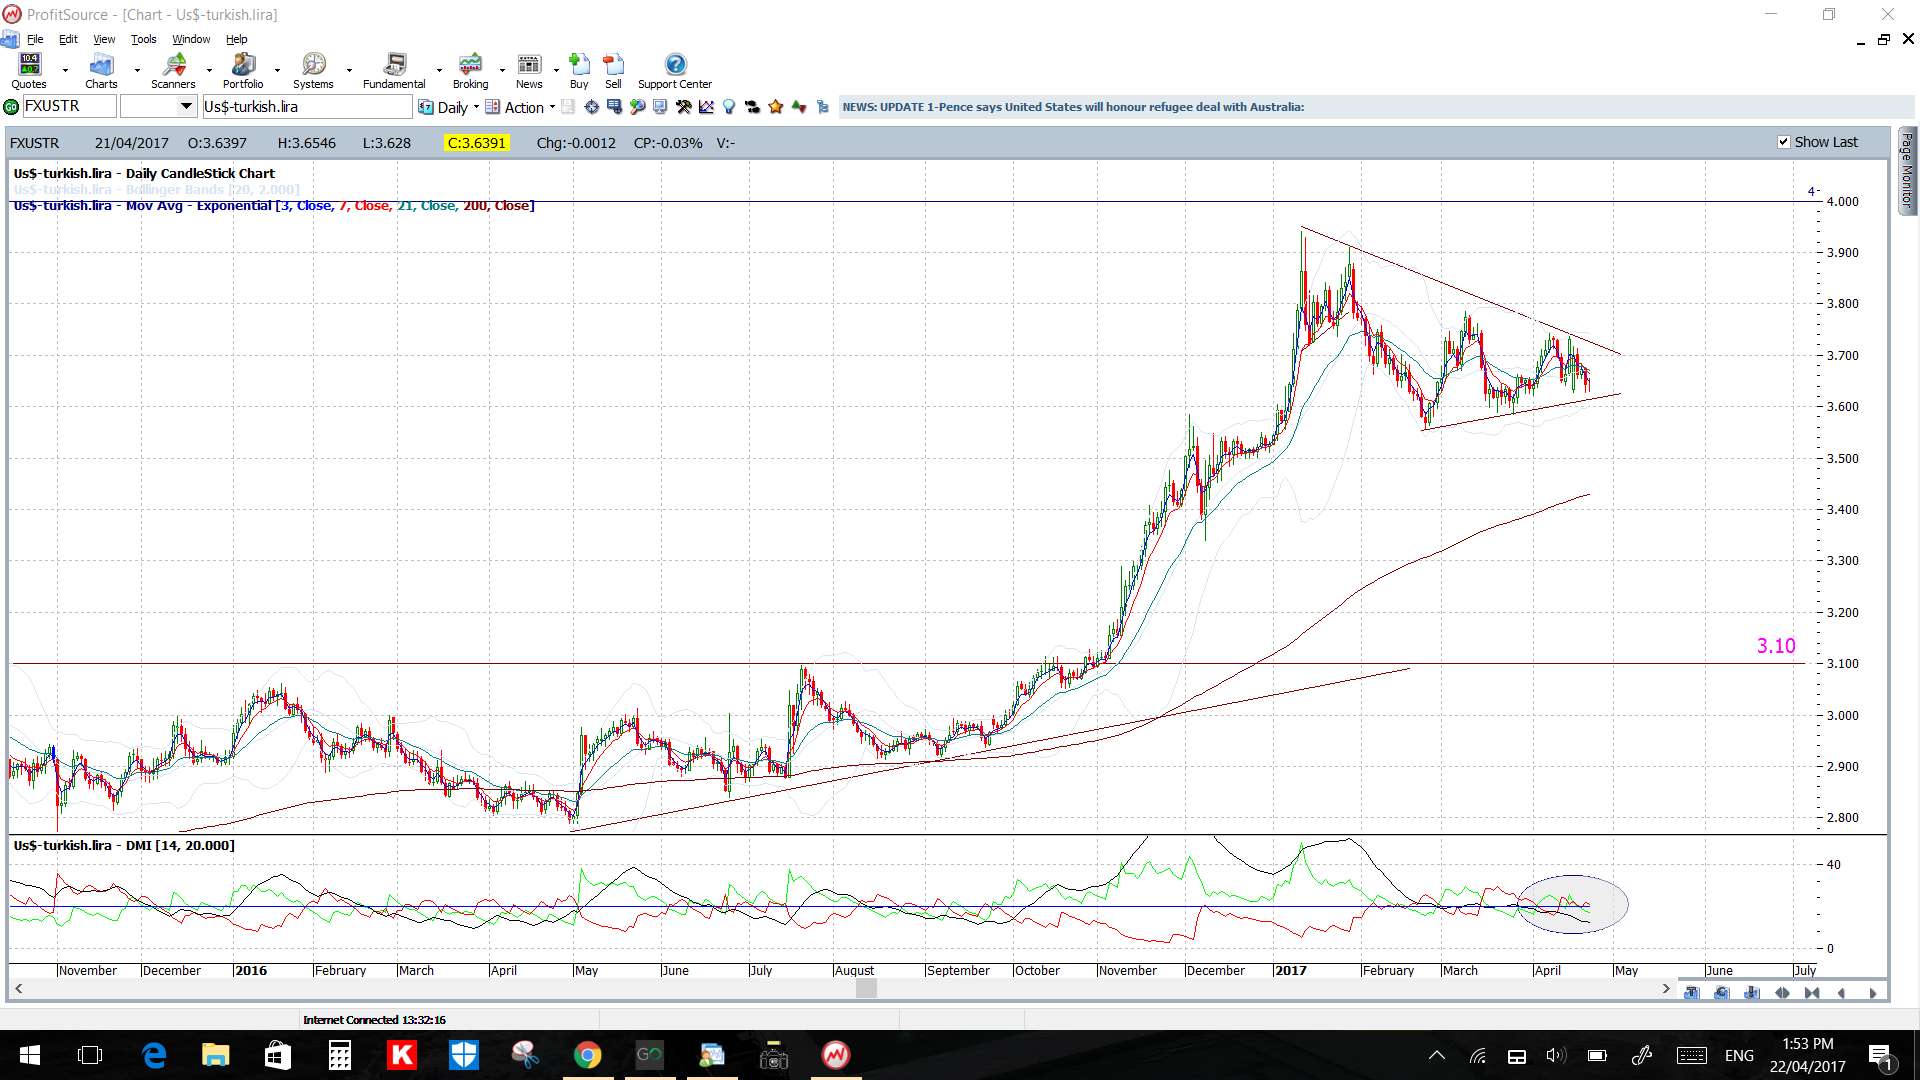
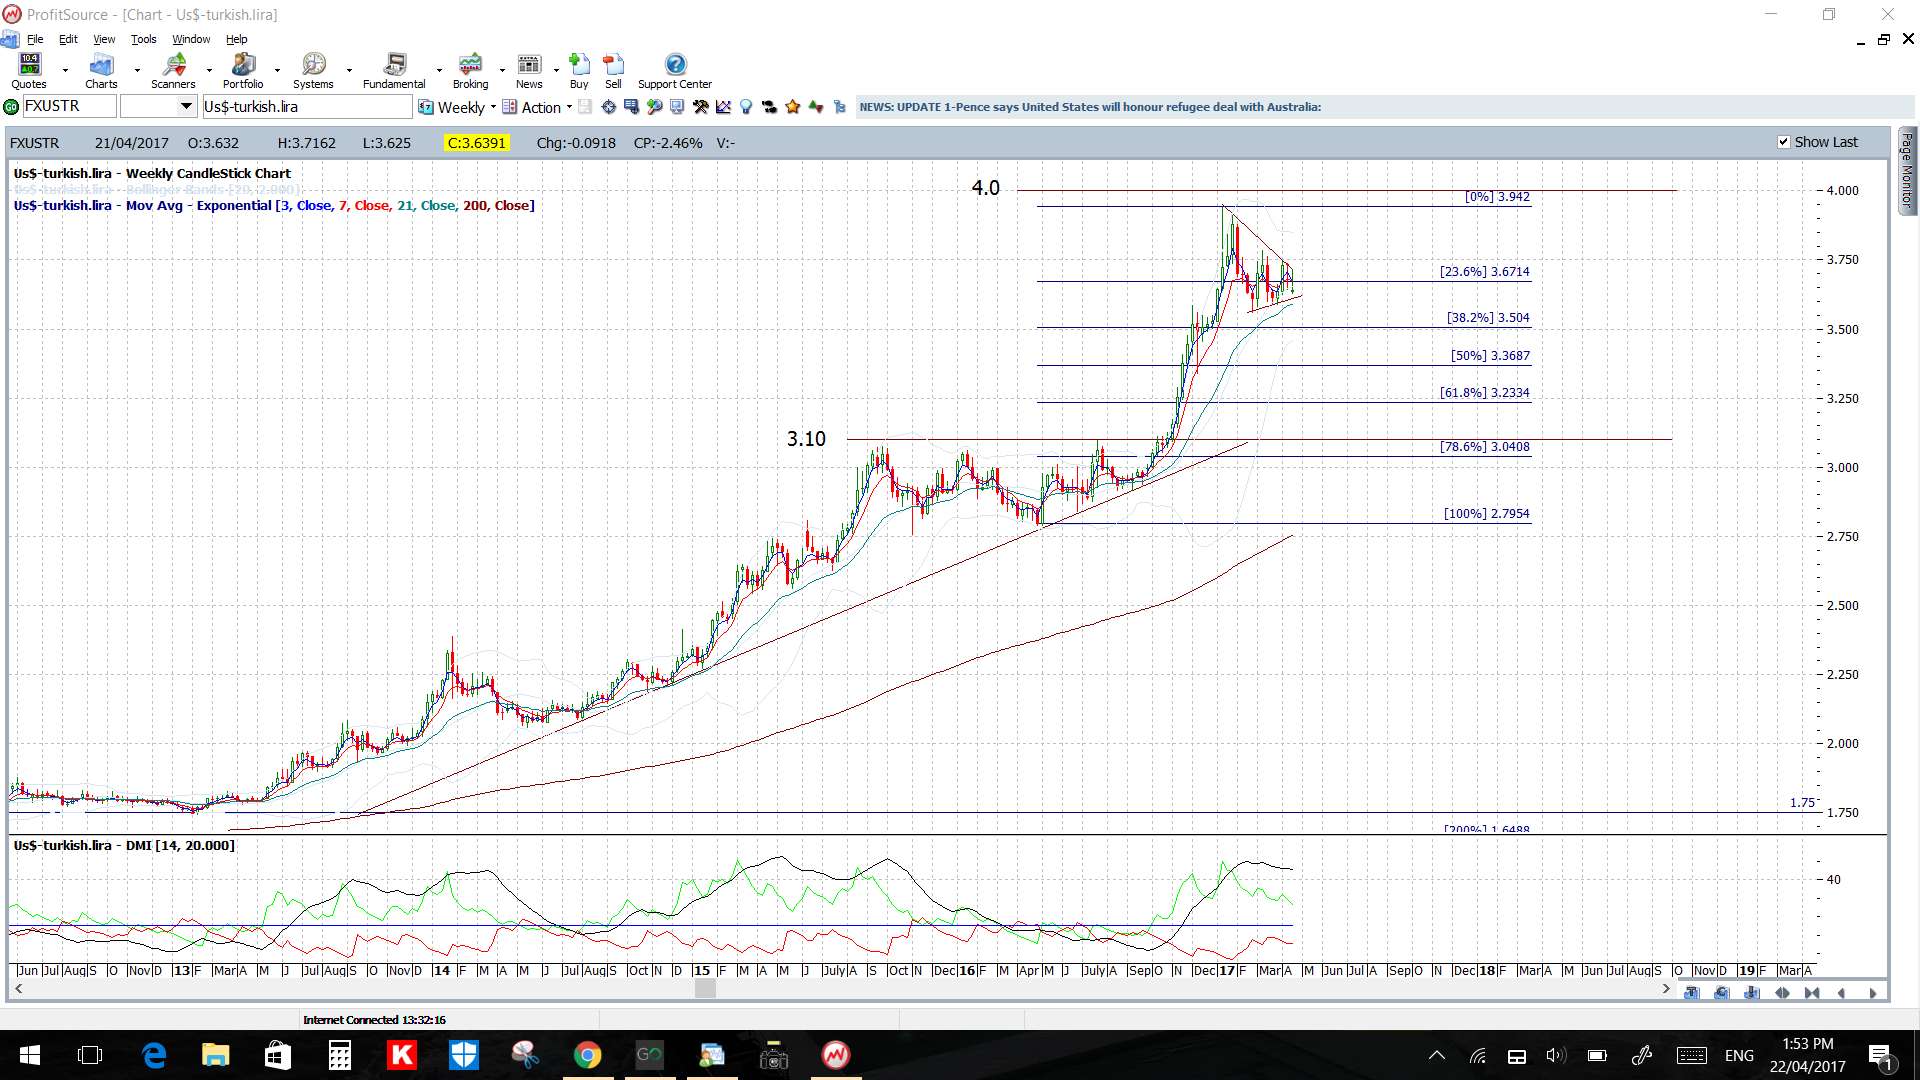
USD/TRY: This pair remains in a daily chart triangle, despite the completion of the Turkish Referendum, so watch the trend lines for any makeor break activity.
Price is below the 4hr and daily Cloud.
The weekly candle closed as a bullish coloured ‘Spinning Top’.
Whilst the Referendum might be over there might be some continued unrest here given the dispute about the legality of the result.
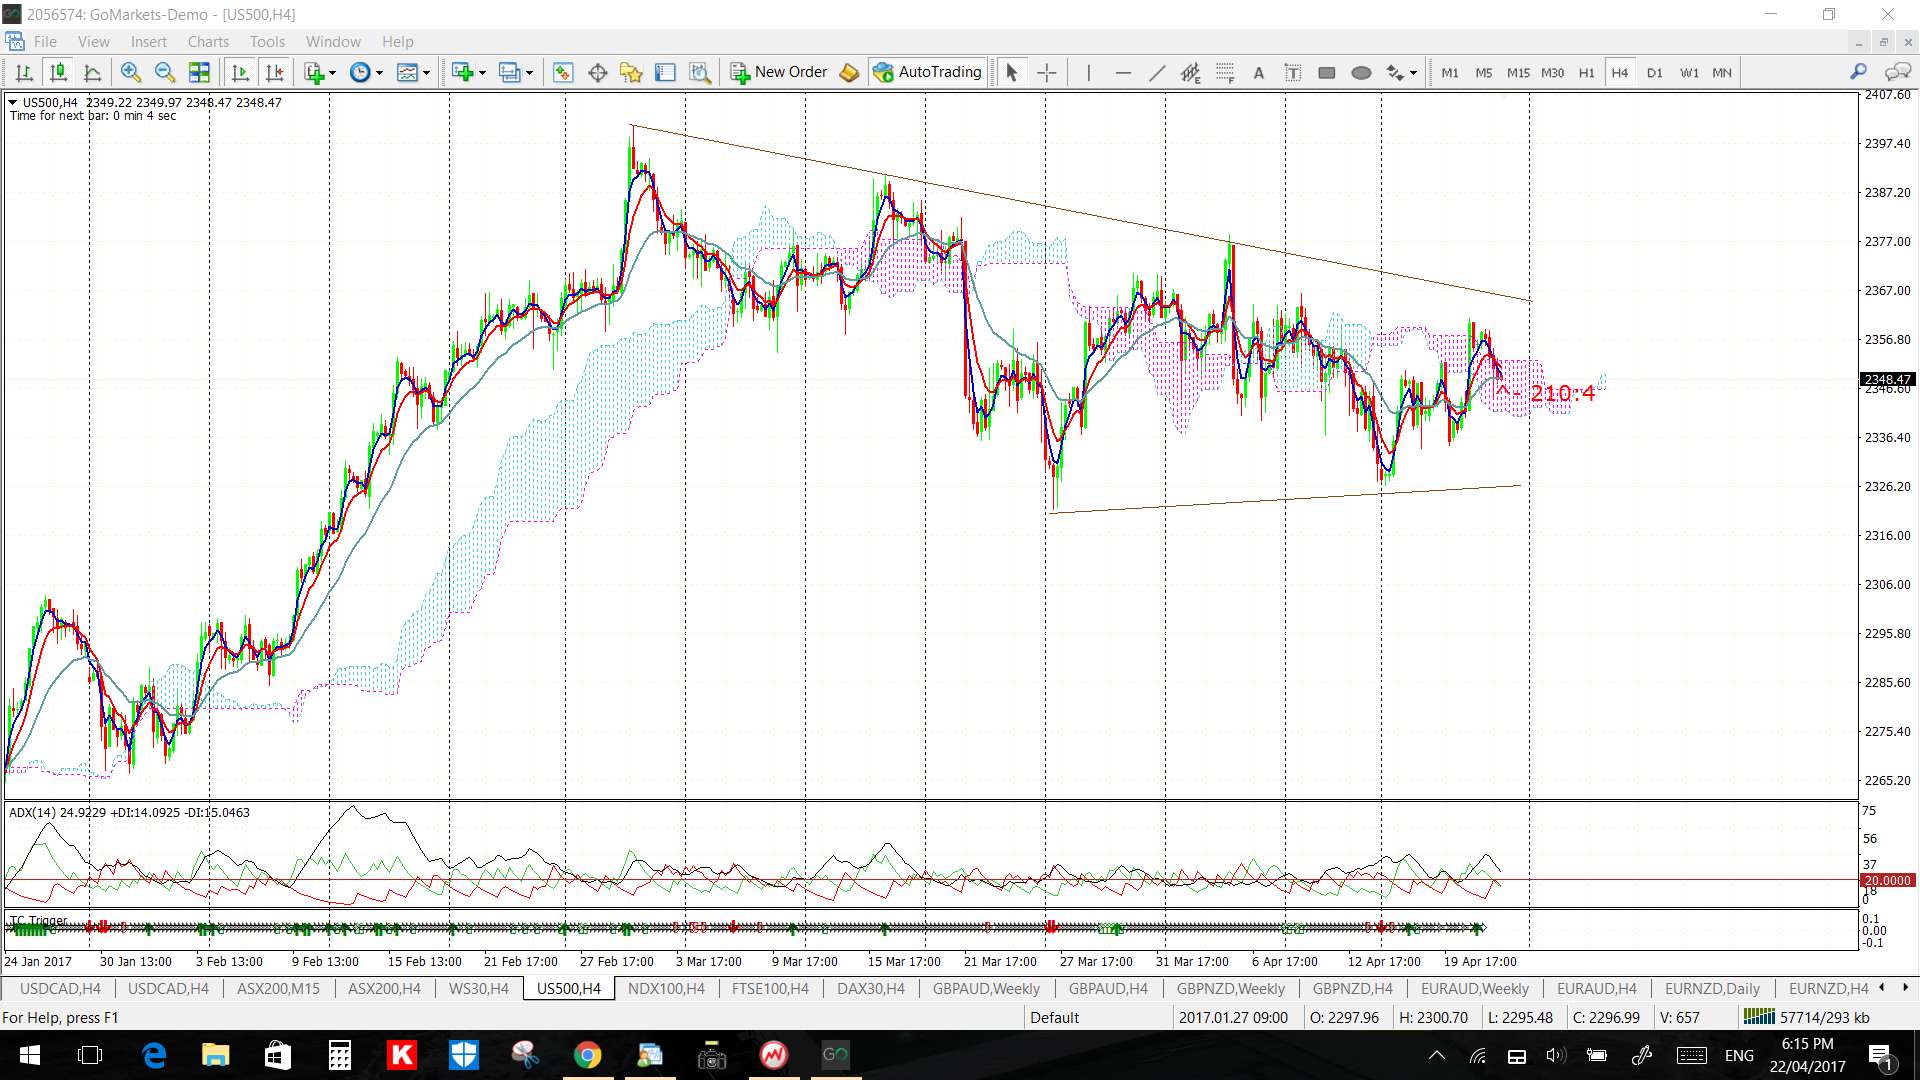
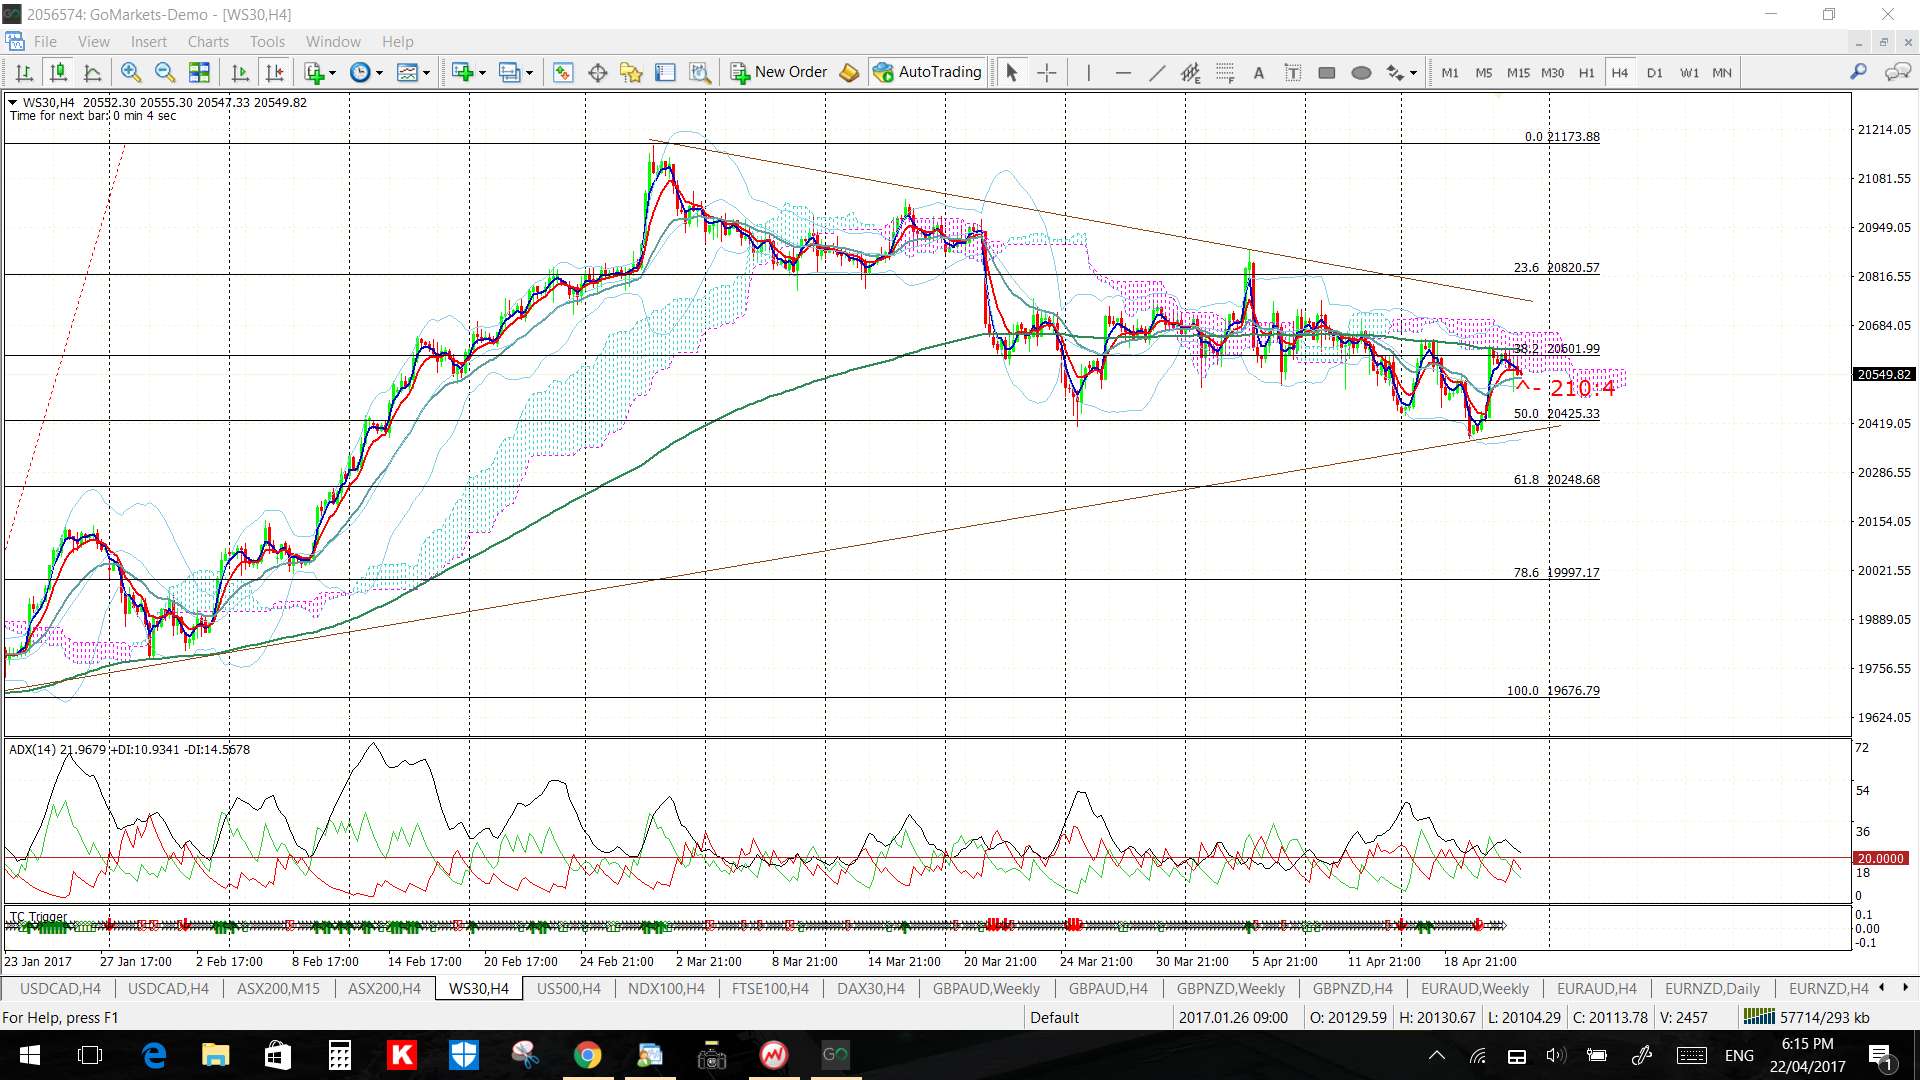
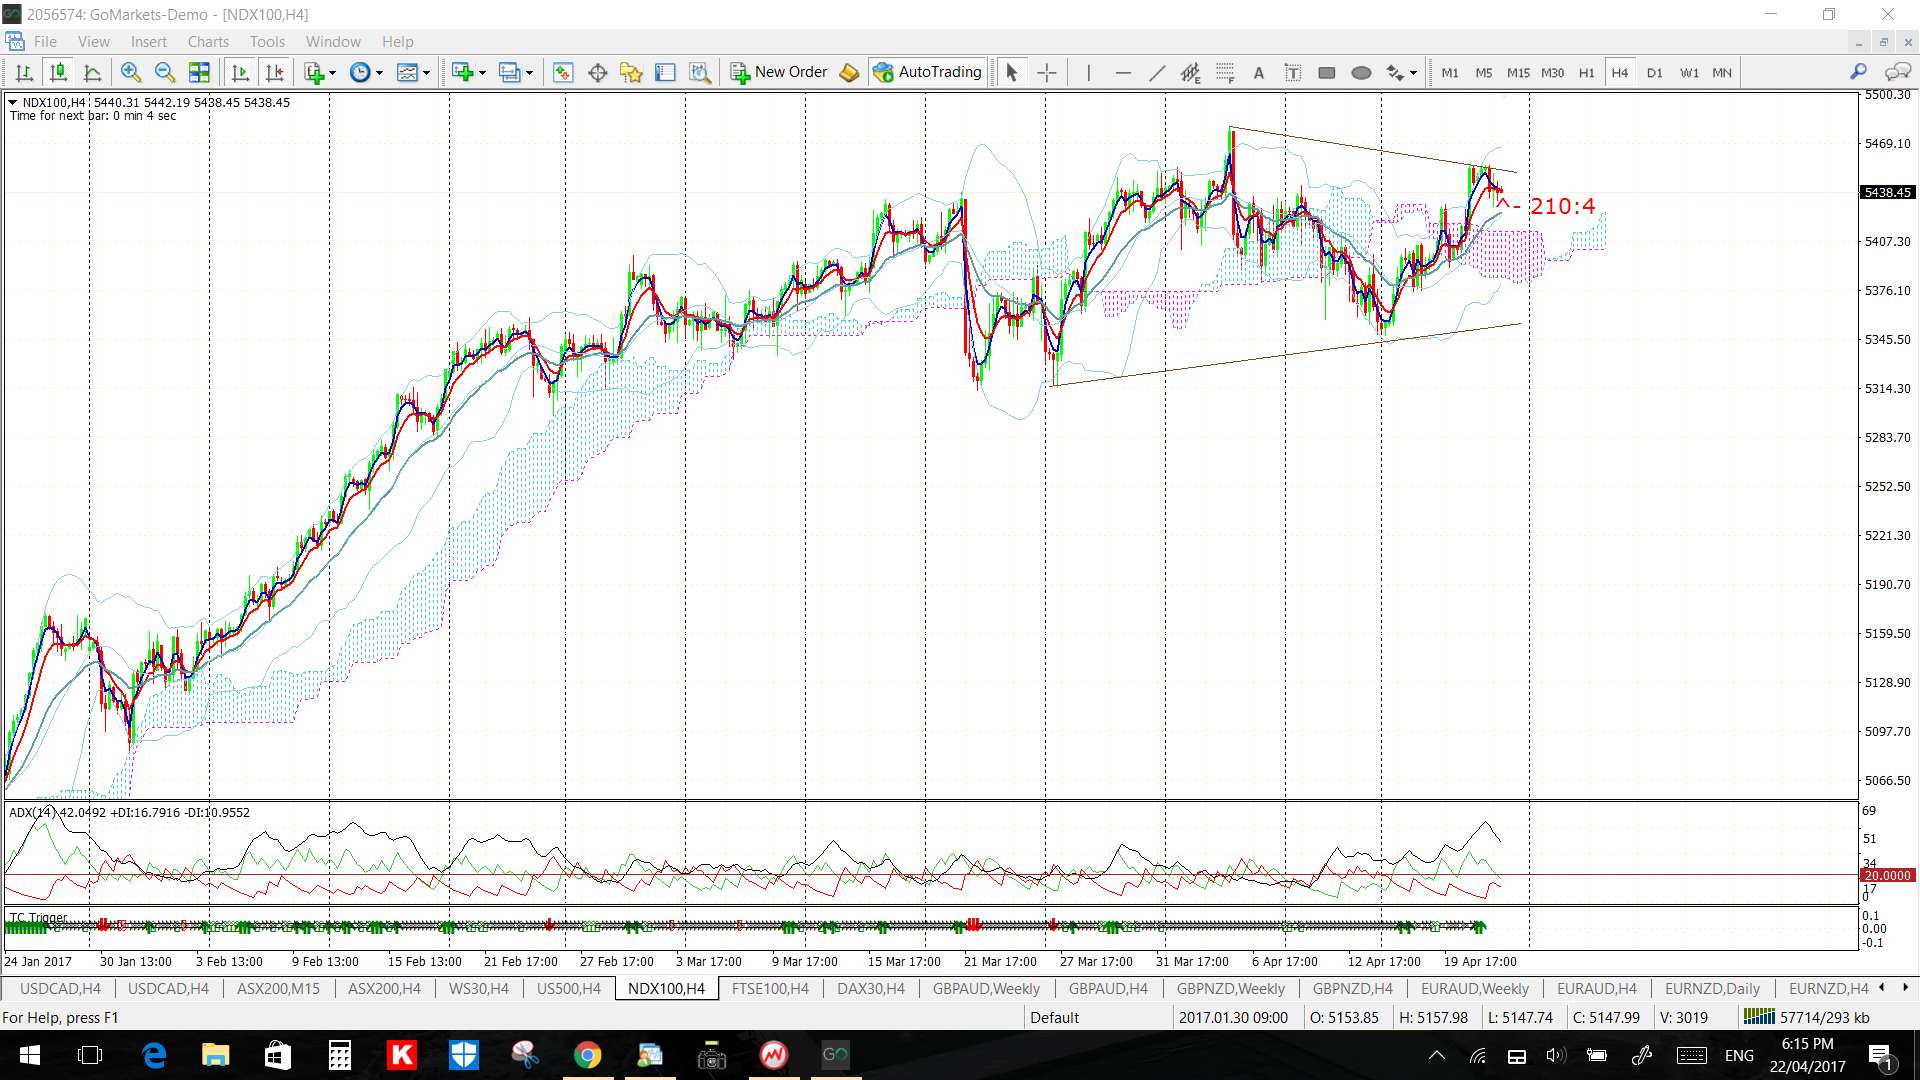
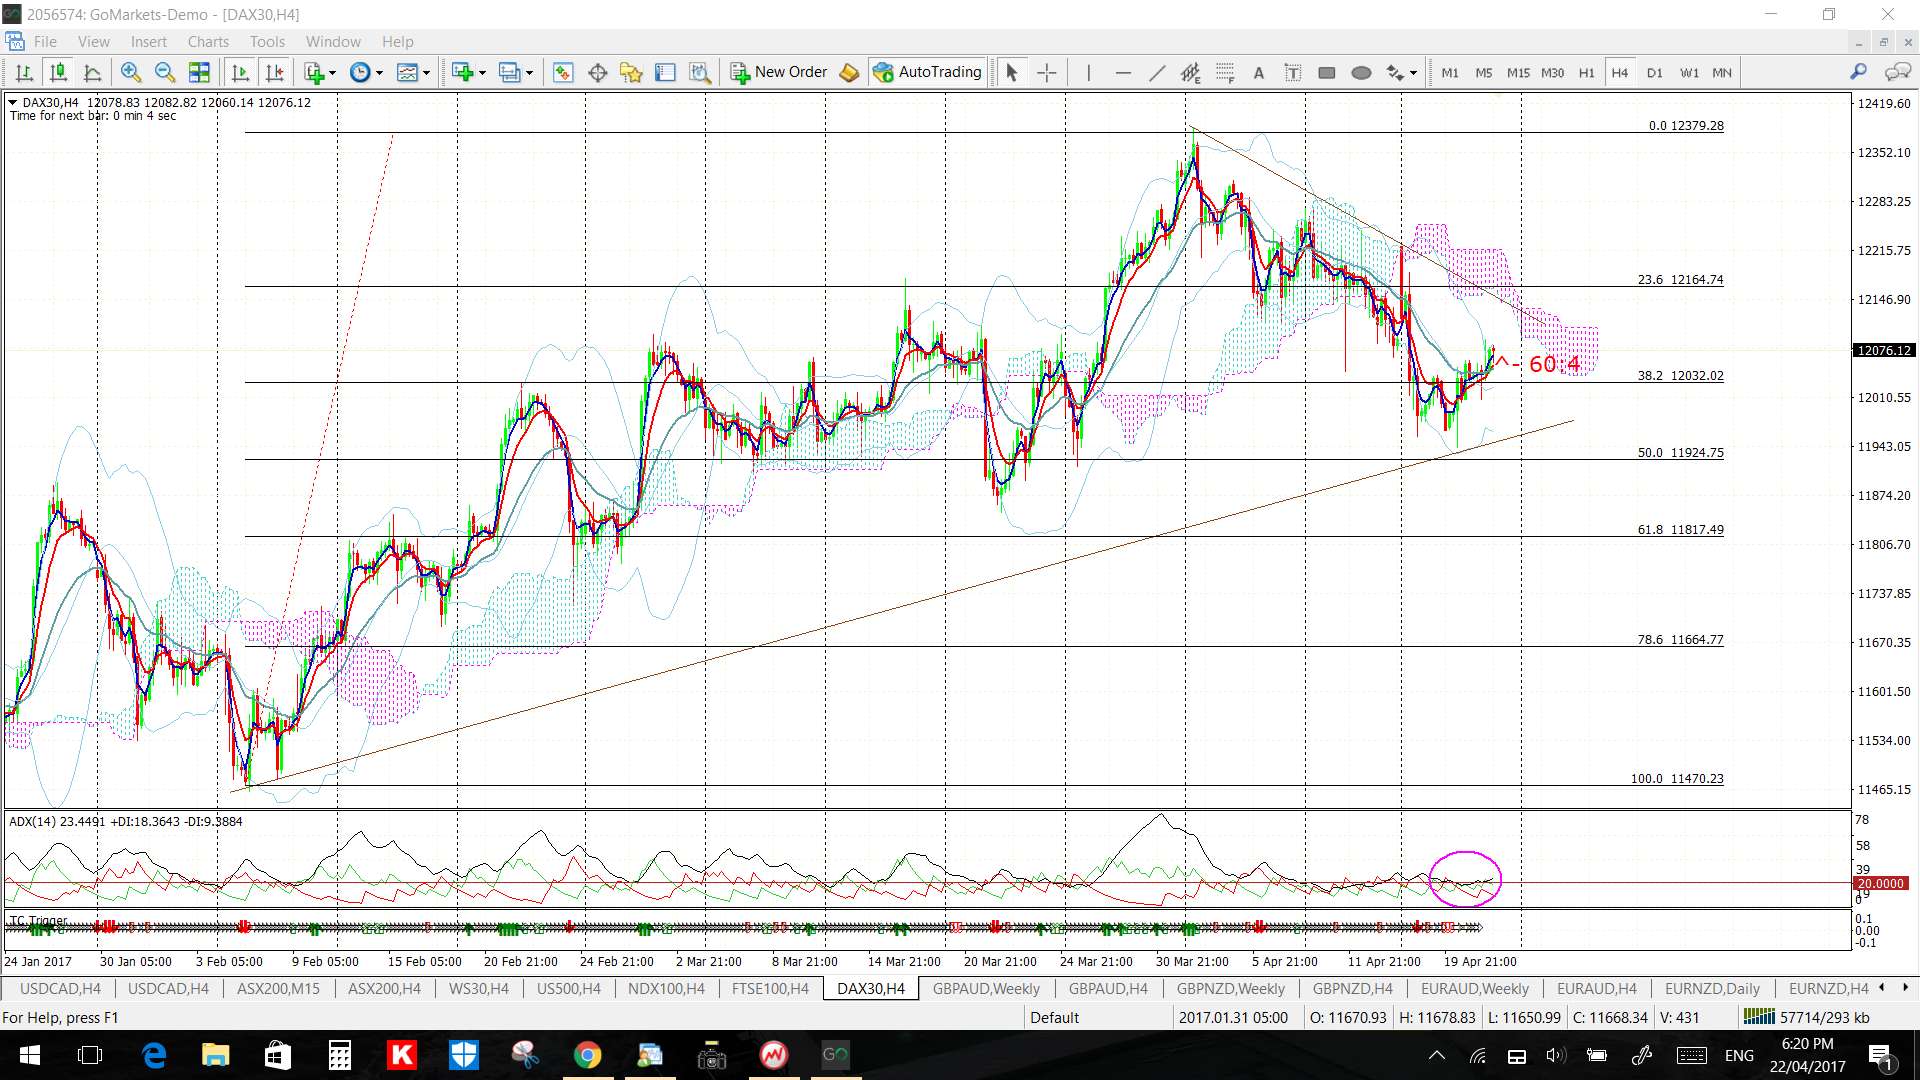
Stocks: watch for any momentum-based trend line breakout from these triangle patterns:
S&P500 4hr:
DJIA 4hr:
NASDAQ-100 4hr:
DAX-30 4hr:
ASX-200 4hr:
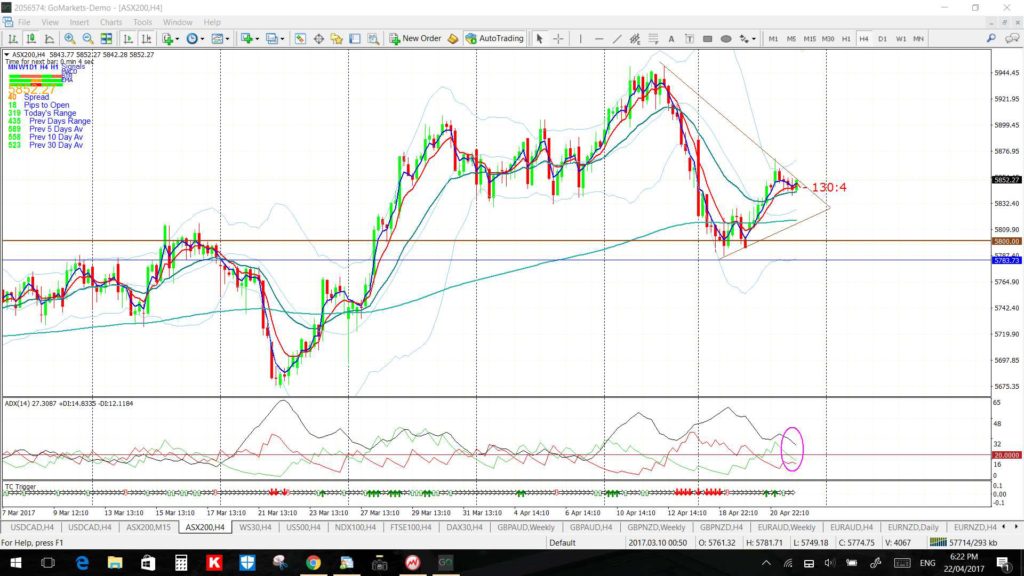

Source: tradecharting.com