Last week: Last week was one of the choppiest weeks for FX that I can recall. There were only a few trend line breakout trades before the Jackson Hole Symposium started on Friday but then five new breakouts triggered after ECB President Draghi’s speech. For me, the US$ still needs to make a decisive breakout from its current trading zone, either up or down, before decent trending FX markets will return.
Trend line breakout tally: these trades gave the following maximum pip movement and were profiled mid-week here, here and here :
- NZD/USD: 120 pips.
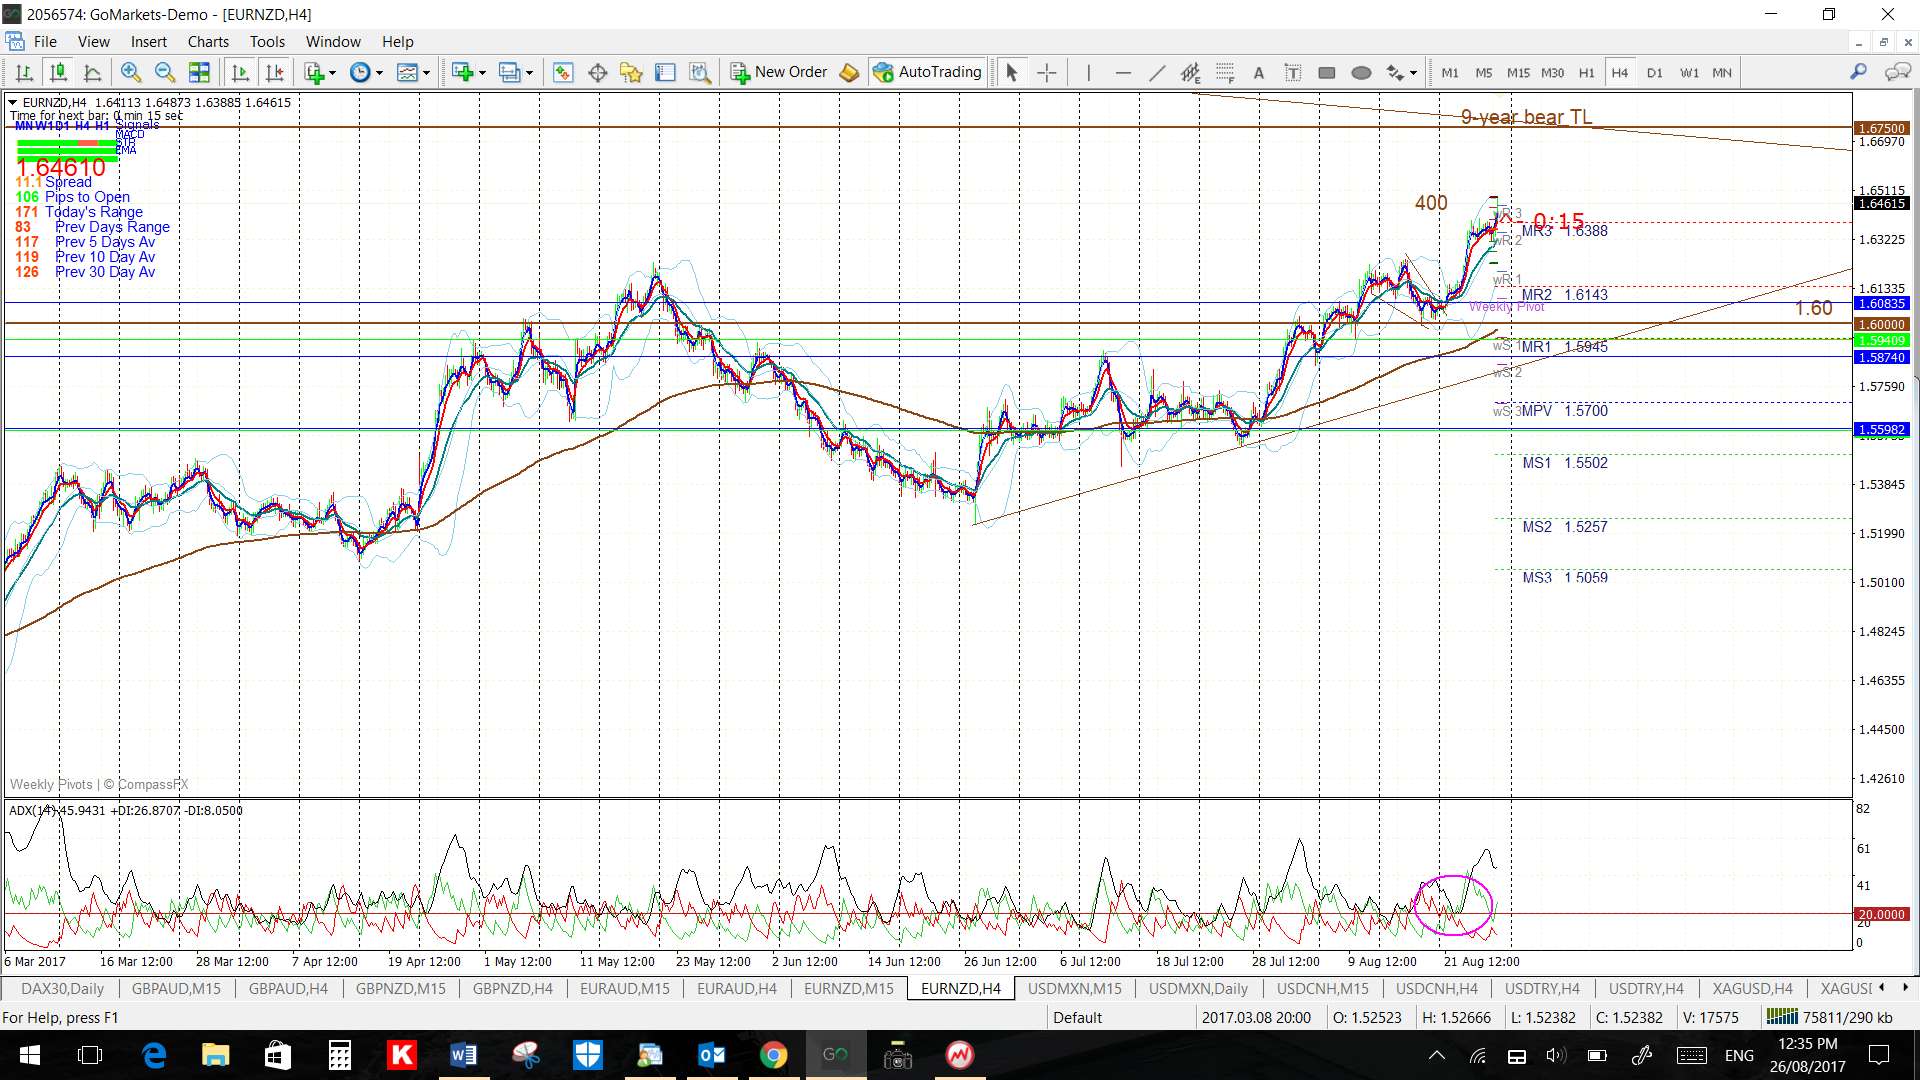
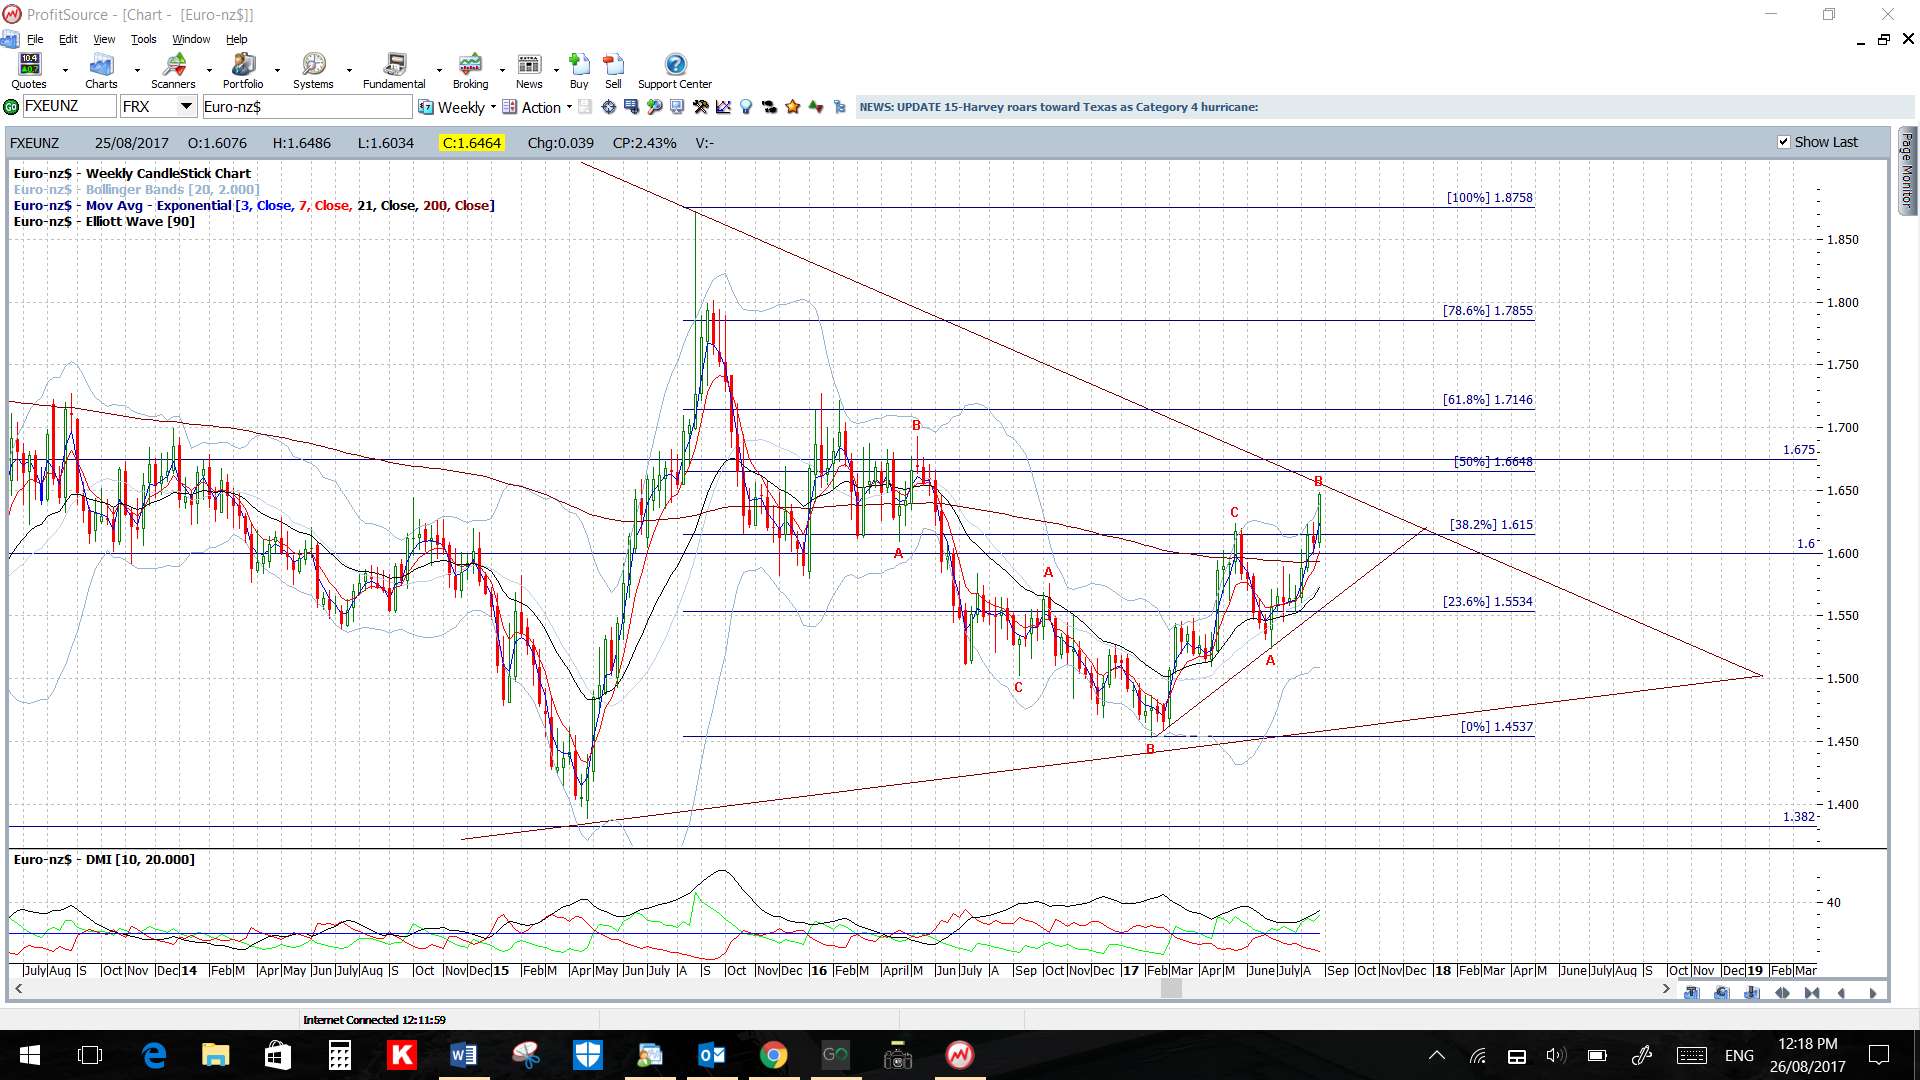
- EUR/NZD: 400 pips.
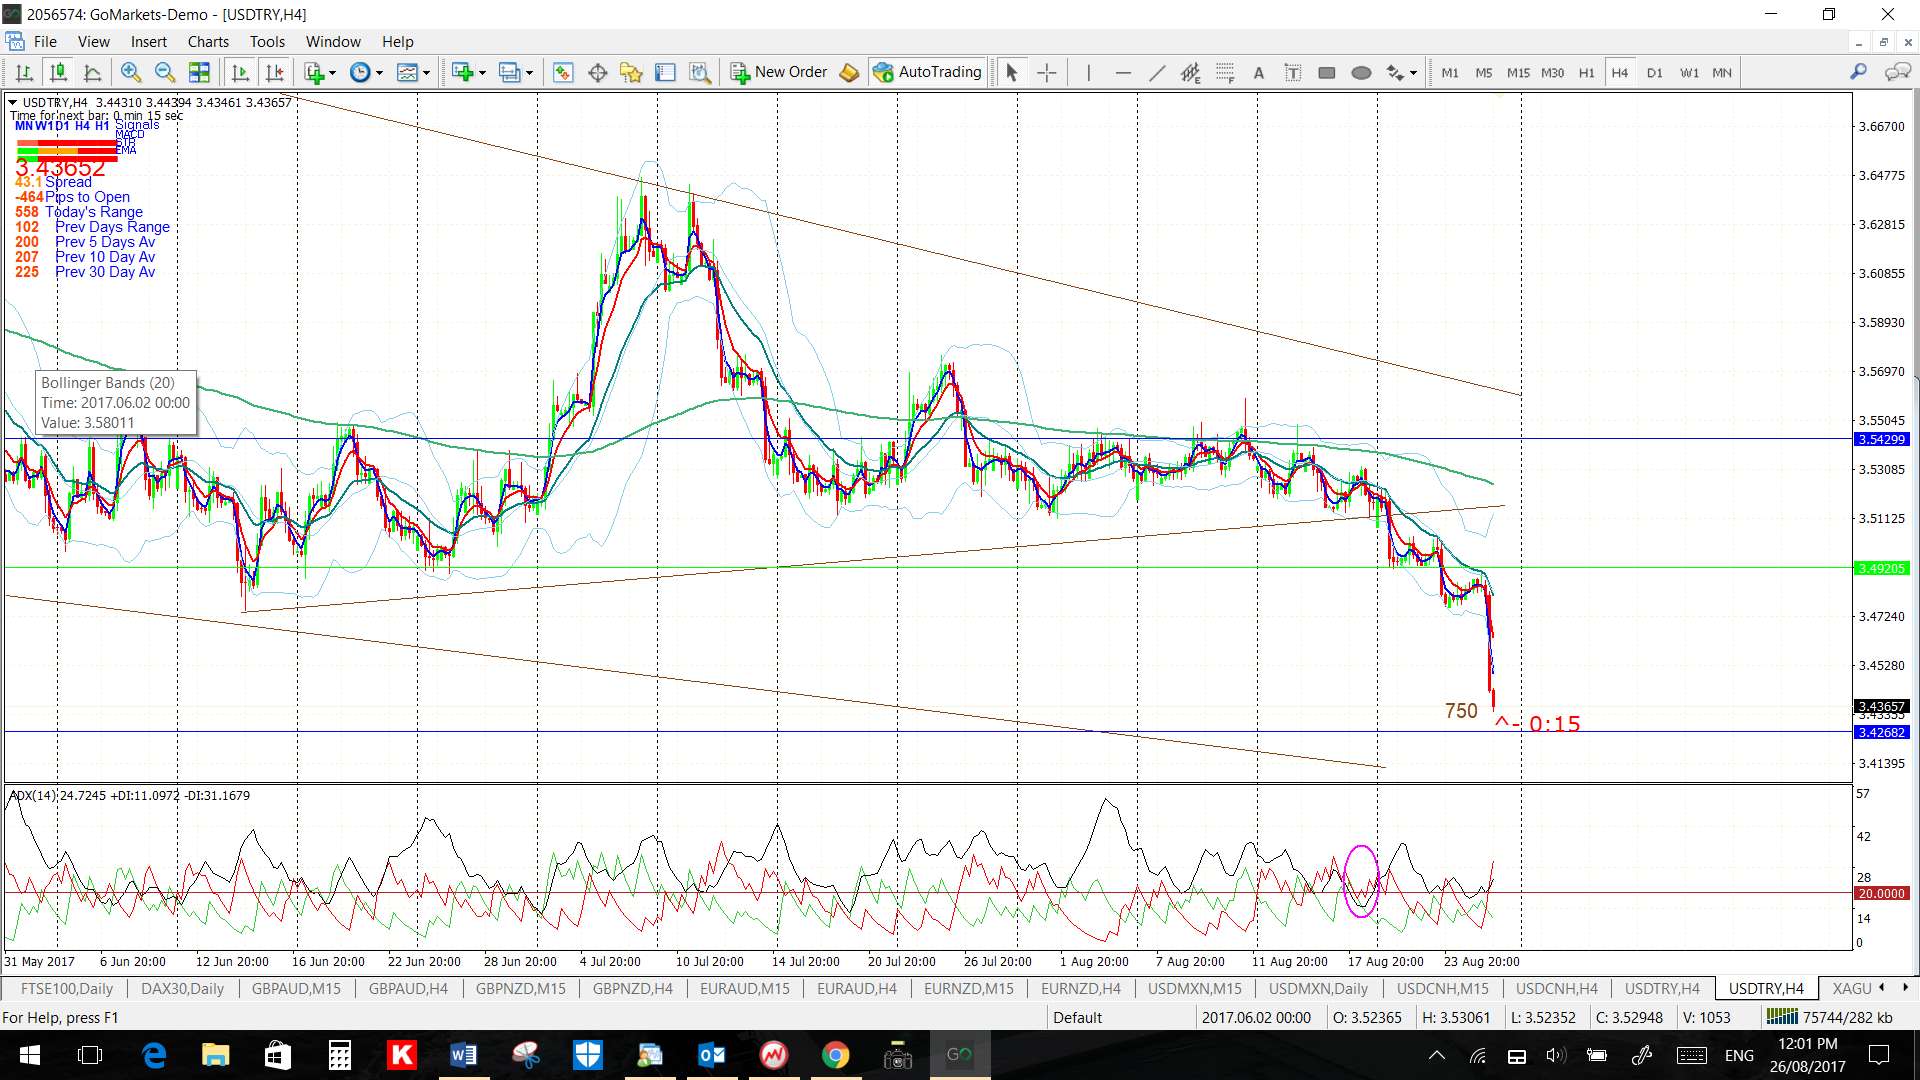
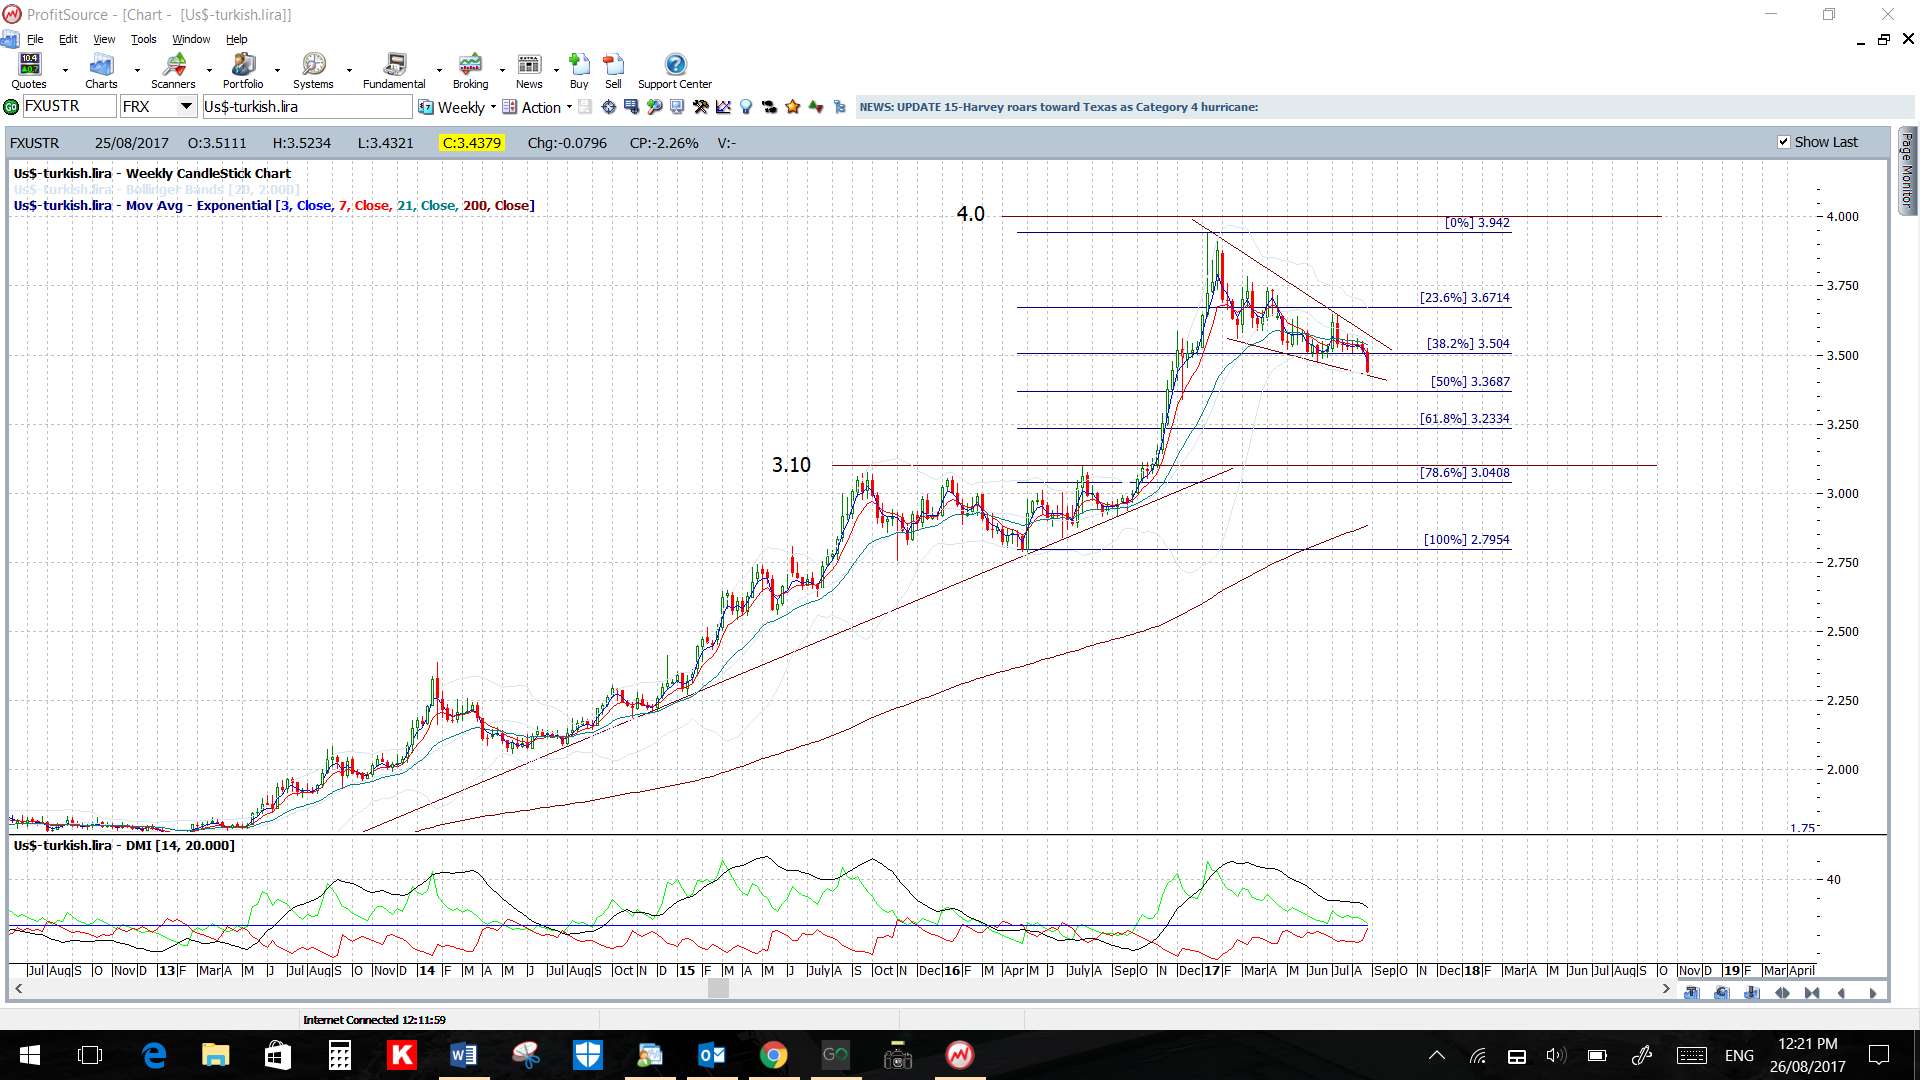
- USD/TRY: 750 pips.
- EUR/AUD: 80 pips.
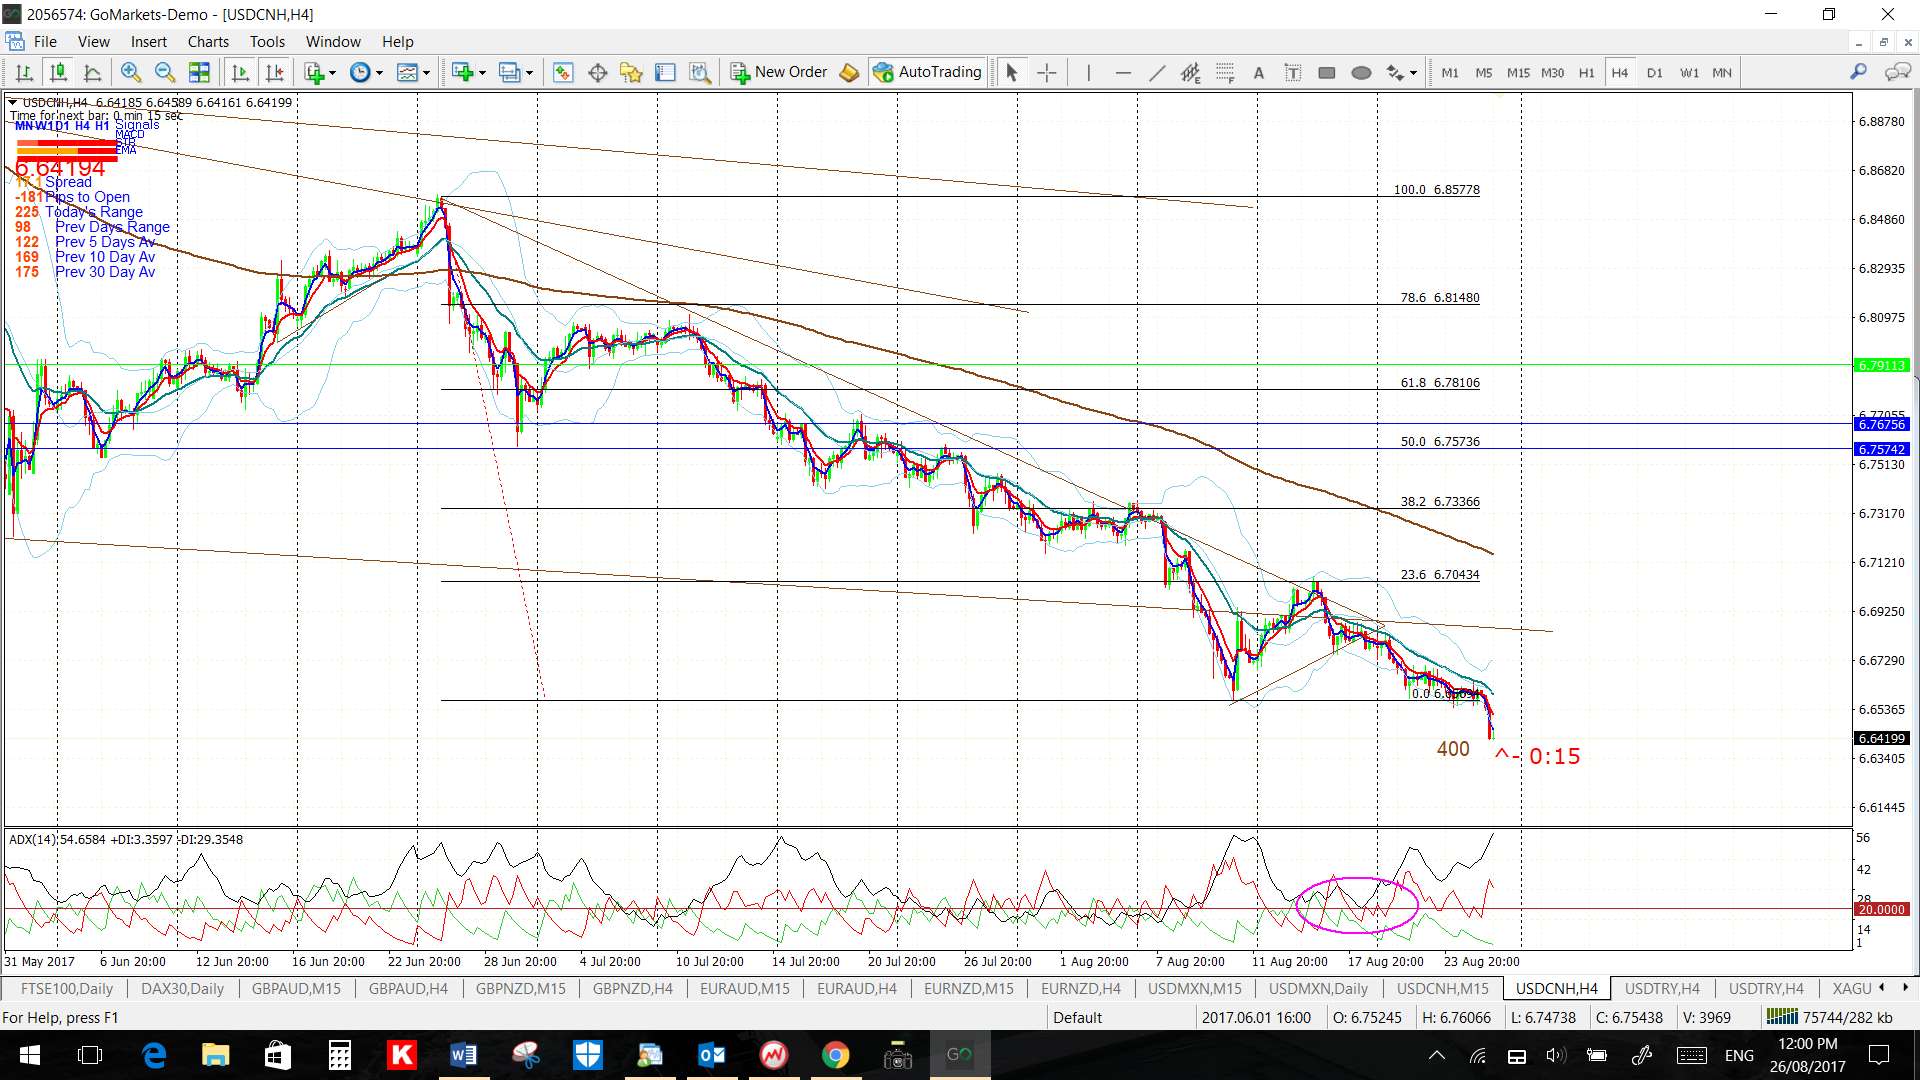
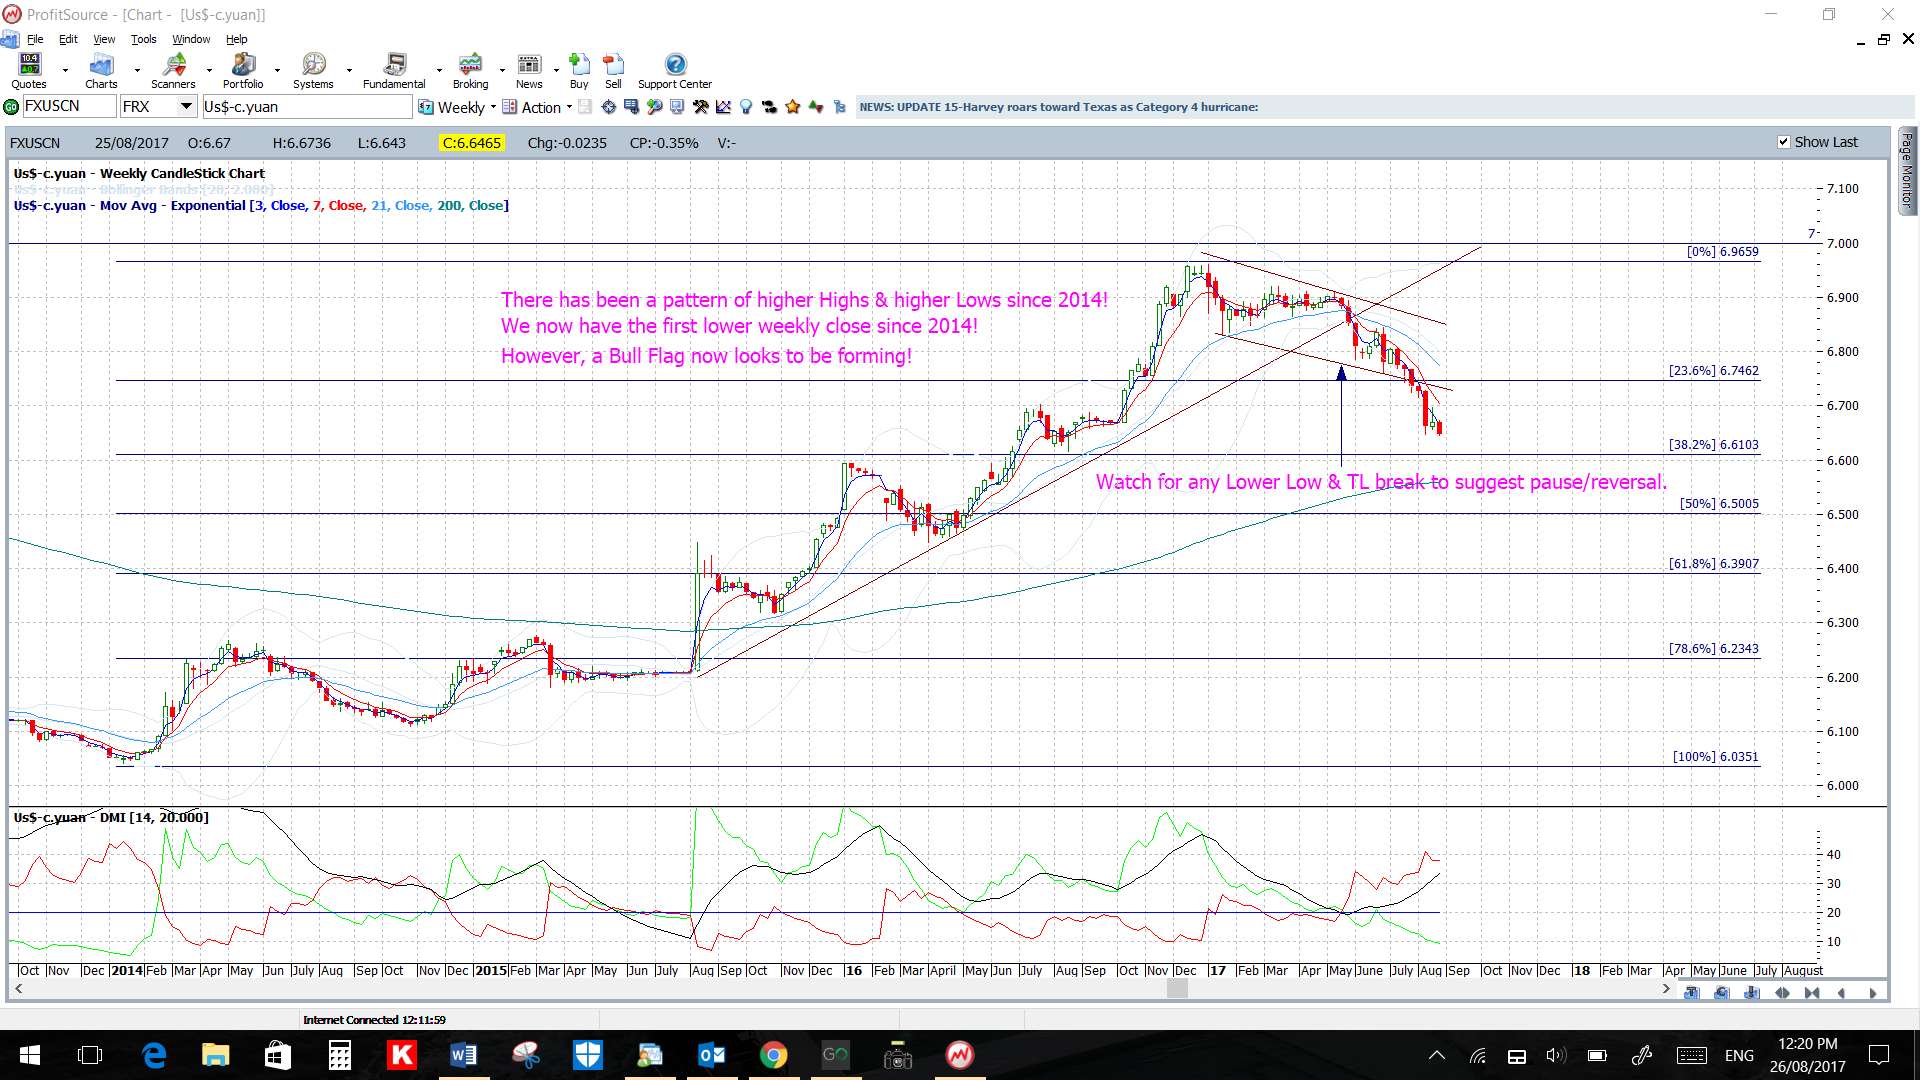
- USD/CNH: 400 pips from last week’s triangle pattern: not updated during the week though.
- EUR/USD: 120 pips on Friday after Draghi’s speech.
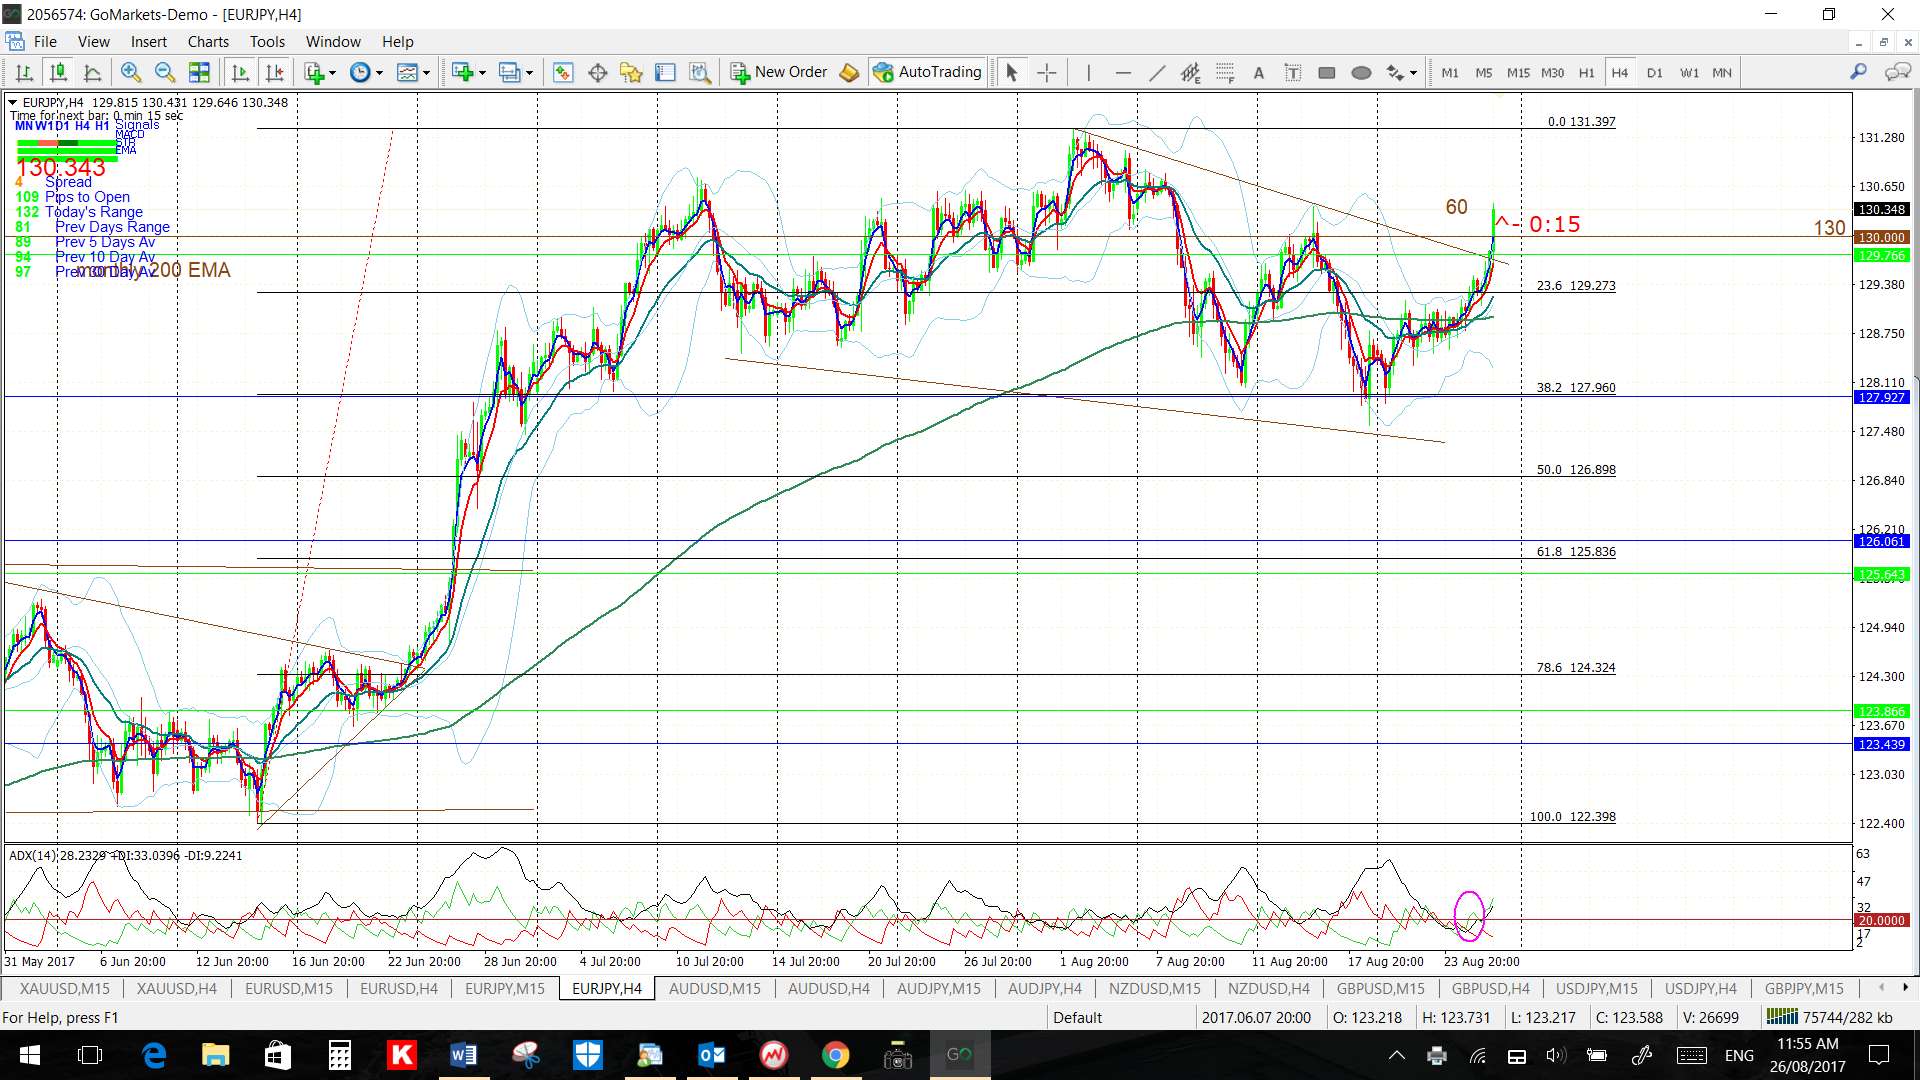
- EUR/JPY: 60 pips on Friday after Draghi’s speech.
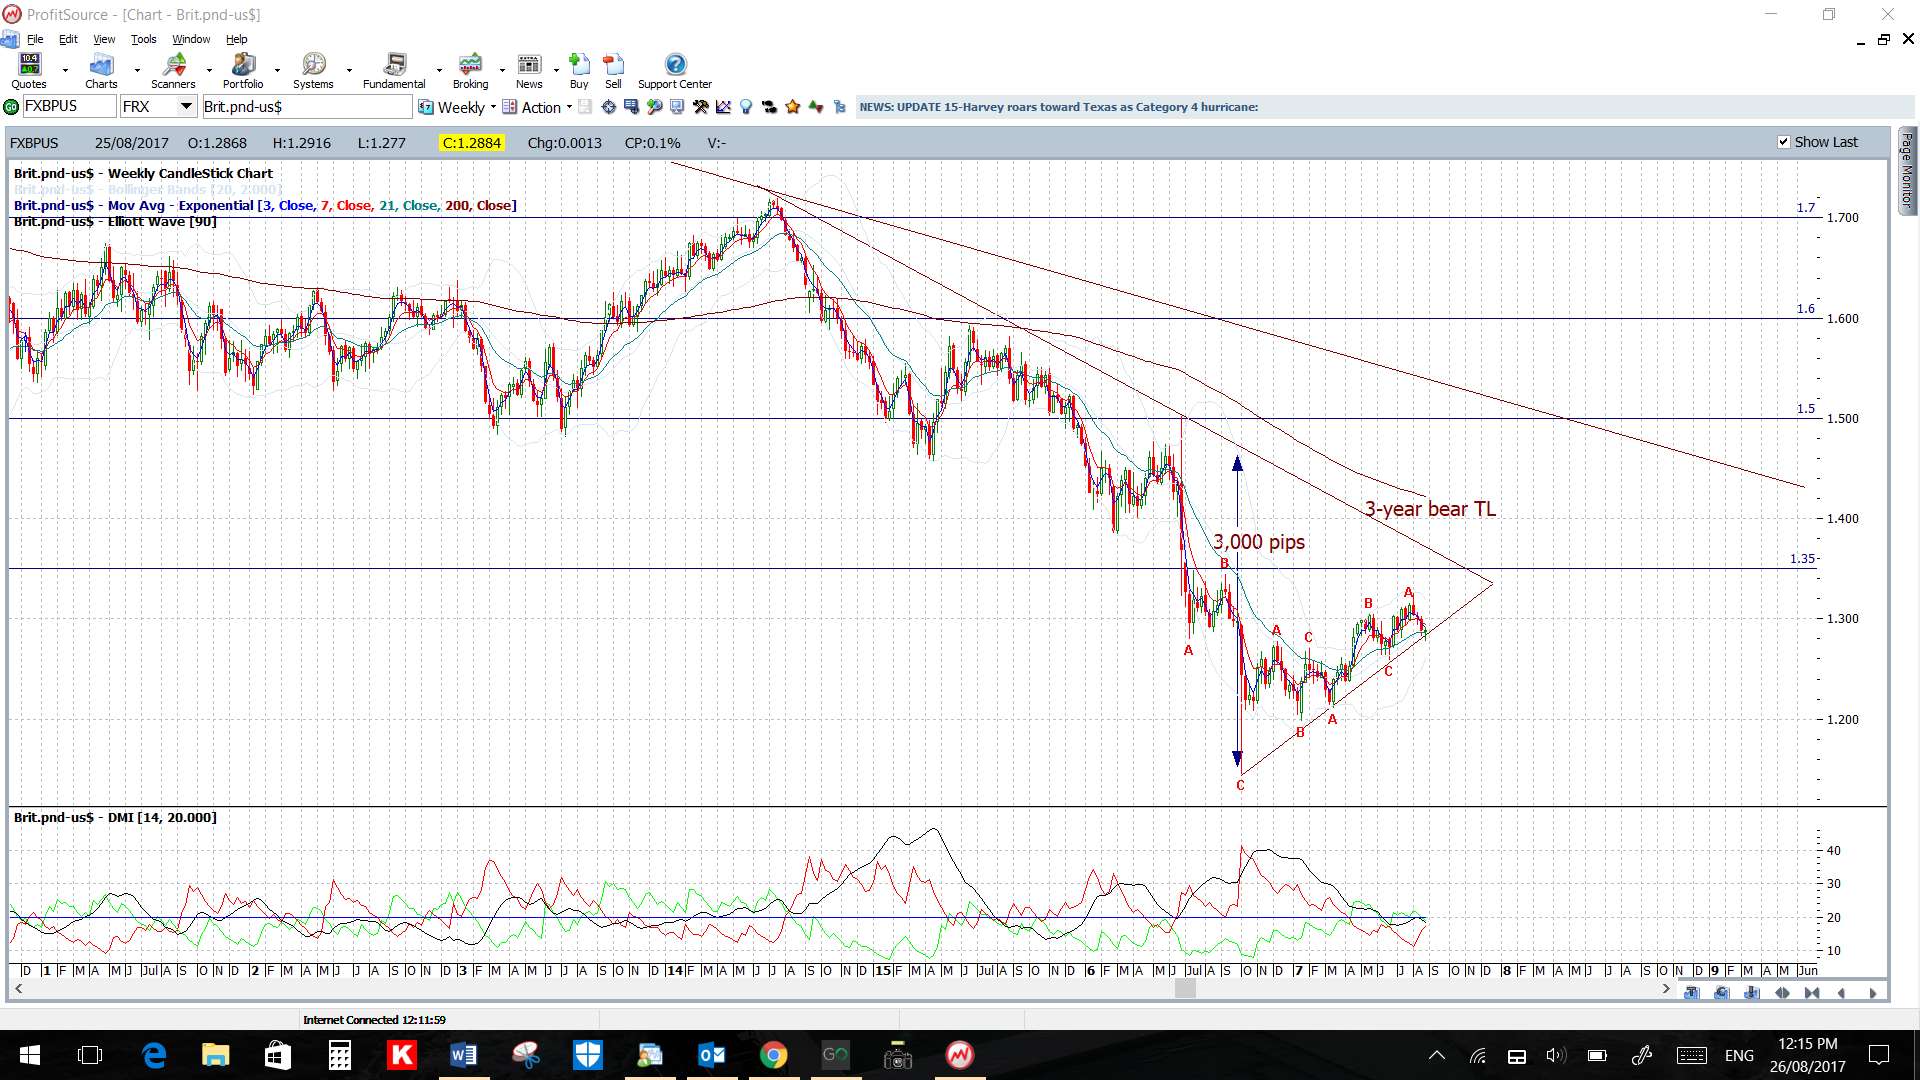
- GBP/USD: 60 pips on Friday after Draghi’s speech.
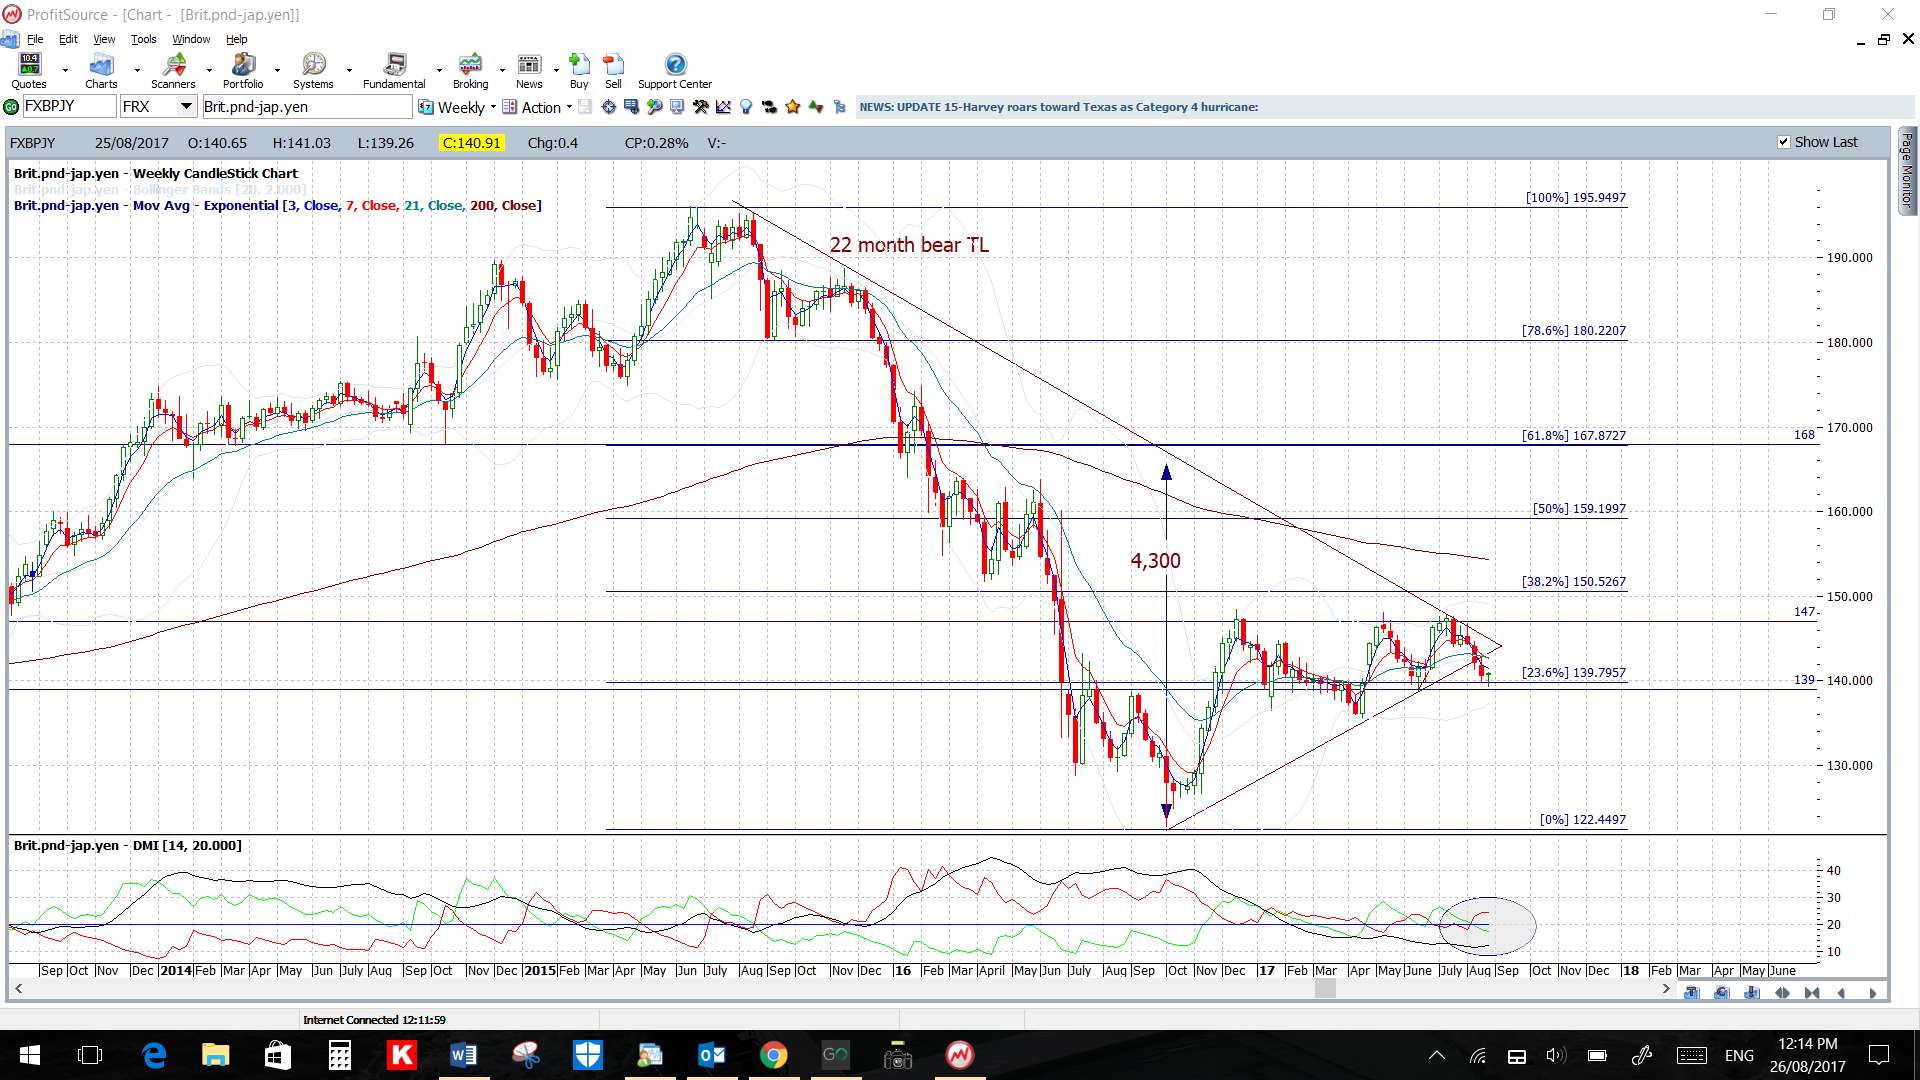
- GBP/JPY: 60 pips on Friday after Draghi’s speech.
- EUR/AUD: 40 pips on Friday after Draghi’s speech.
This week:
- US$: the US$ index closed lower for the week but managed to hold above 92.50 support. A review of the FX Indices can be found through this link. The FX Indices are currently in alignment for LONG EUR$ and SHORT US$ but watch to see if this alignment holds after Jackson Hole.
- Data: there isn’t a lot of High Impact data next week but Friday’s NFP will be in focus.
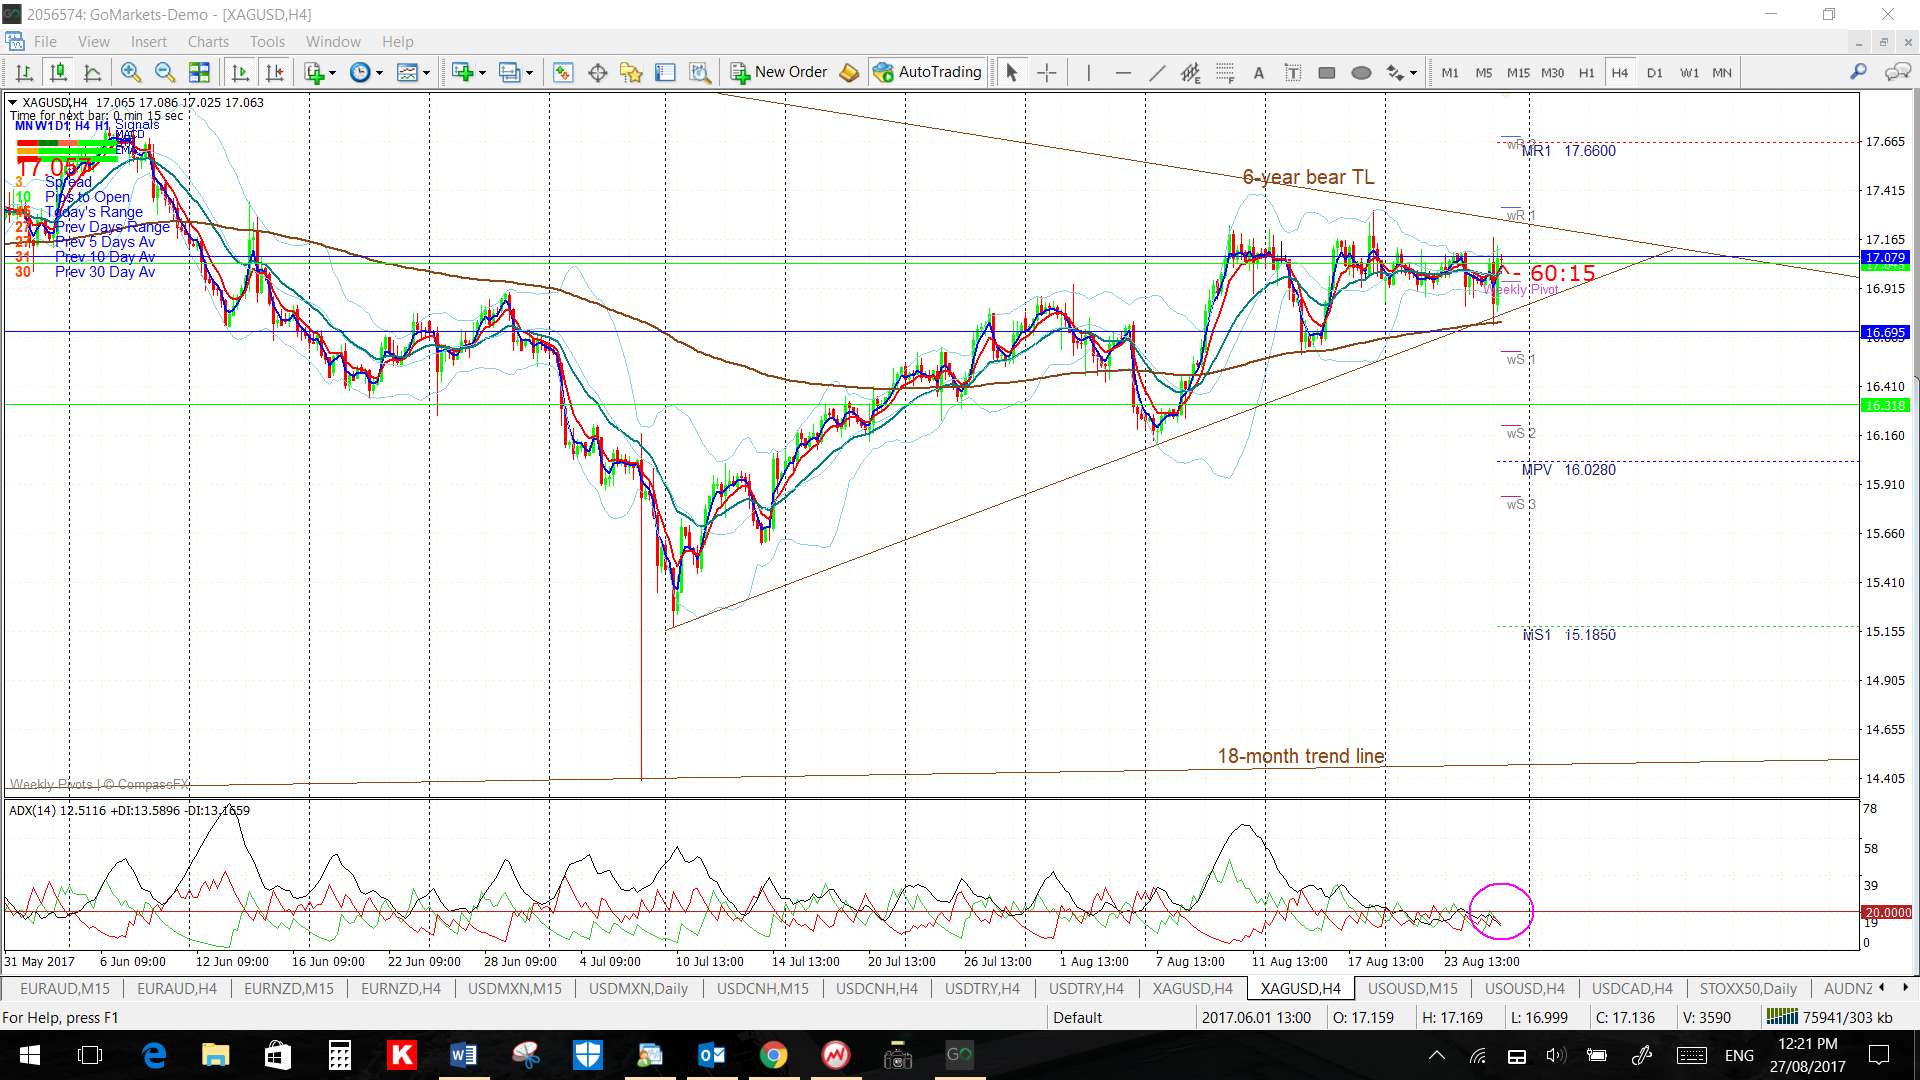
- Gold: is holding up above the recently broken 6-year bear trend line so watch for any continuation move here.
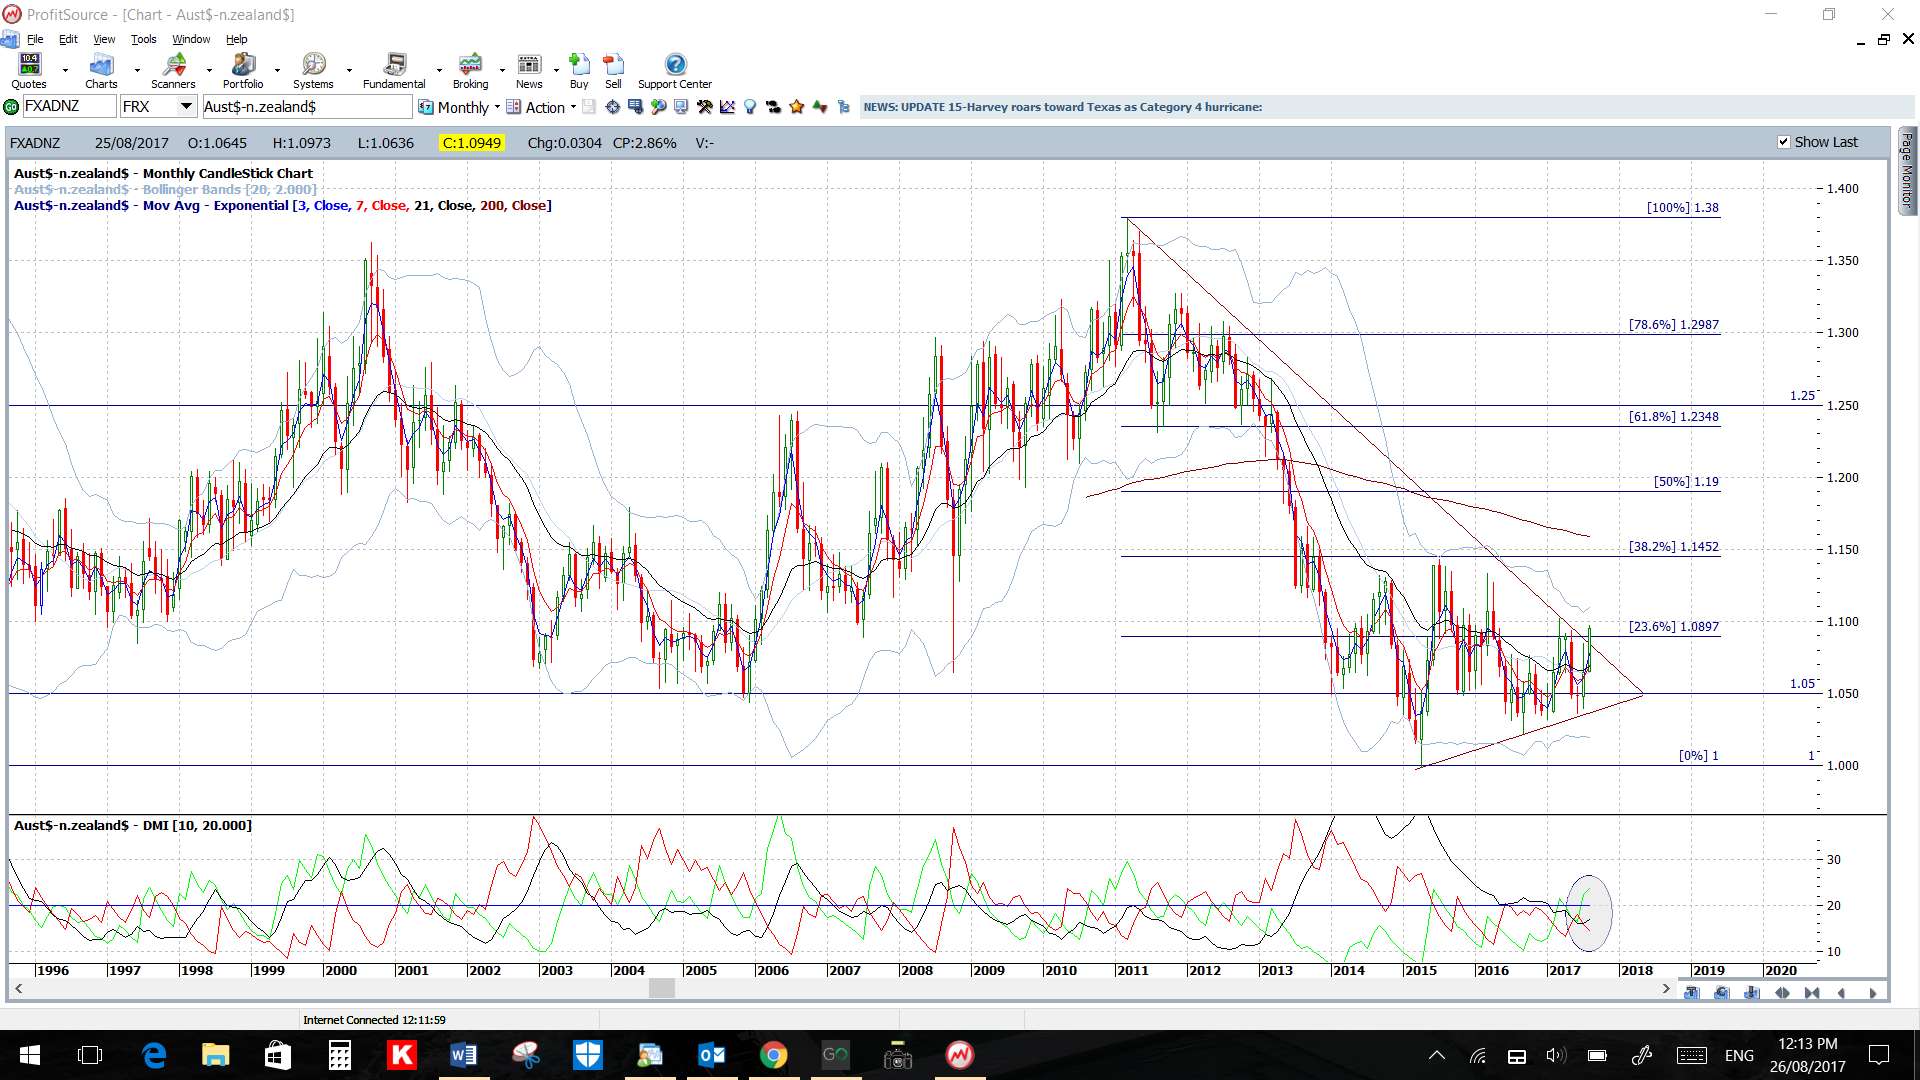
- End of Month: Thursday is the end of month so watch for new monthly pivots and for how the AUD/NZD closes! It is currently shaping up with a trend line breakout and rising bullish momentum!
- Stocks: I am still on the lookout for any healthy correction move across some of the US major stock indices given the lengthy bull run they have enjoyed. What could trigger such a move? Perhaps any challenges to the US tax reform agenda?
- NB: this is just a brief update due to a busy w/e with family commitments.
Calendar:
- Sun 27th: Jackson Hole Day 3.
- Mon 28th: GBP Bank holiday.
- Tue 29th: US CB Consumer Confidence.
- Wed 30th: GBP Inflation Report Hearings. USD ADP NFP, Prelim GDP & Crude Oil Inventories.
- Thurs 31st: CNY Manufacturing & Non-Manufacturing PMI. AUD Private Capital Expenditure. CAD GDP. USD Weekly Unemployment Claims.
- Fri 1st: CNY Caixin Manufacturing PMI. GBP Manufacturing PMI. USD NFP, ISM Manufacturing PMI.
Forex:
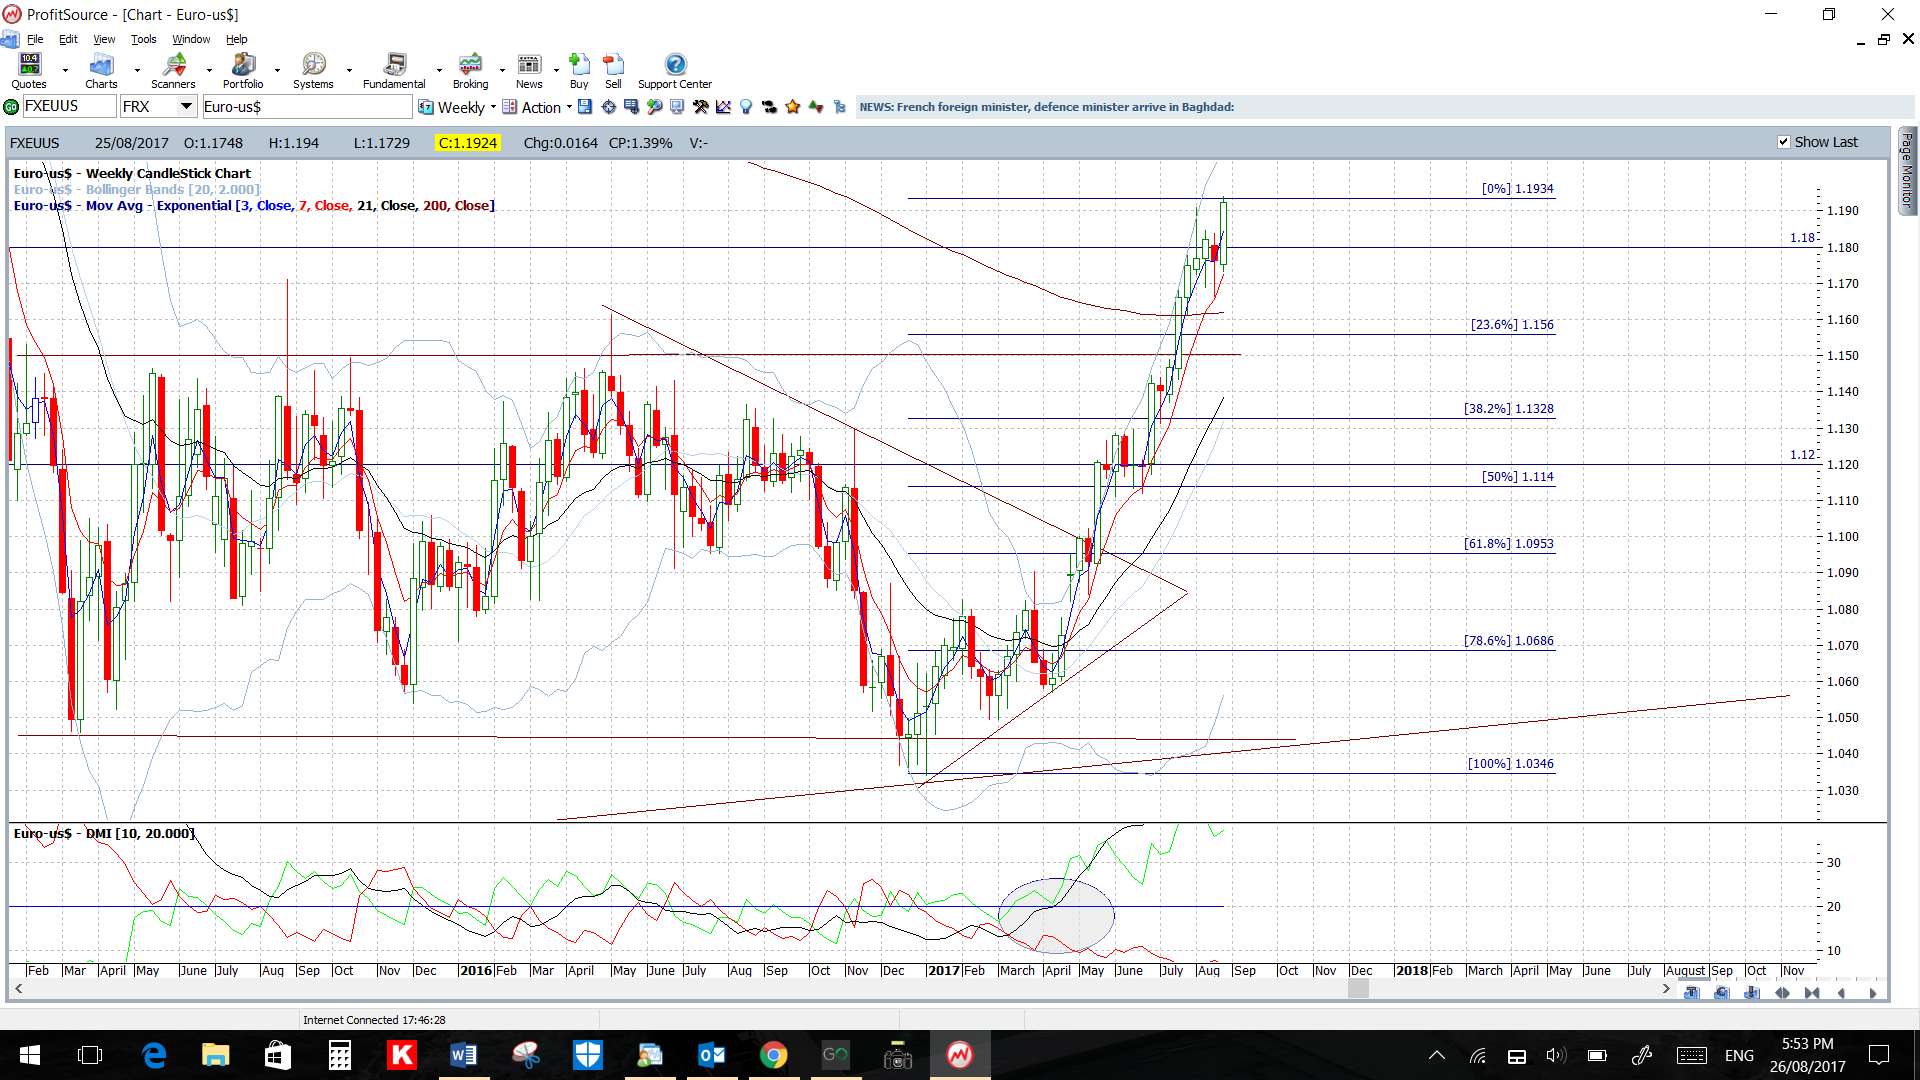
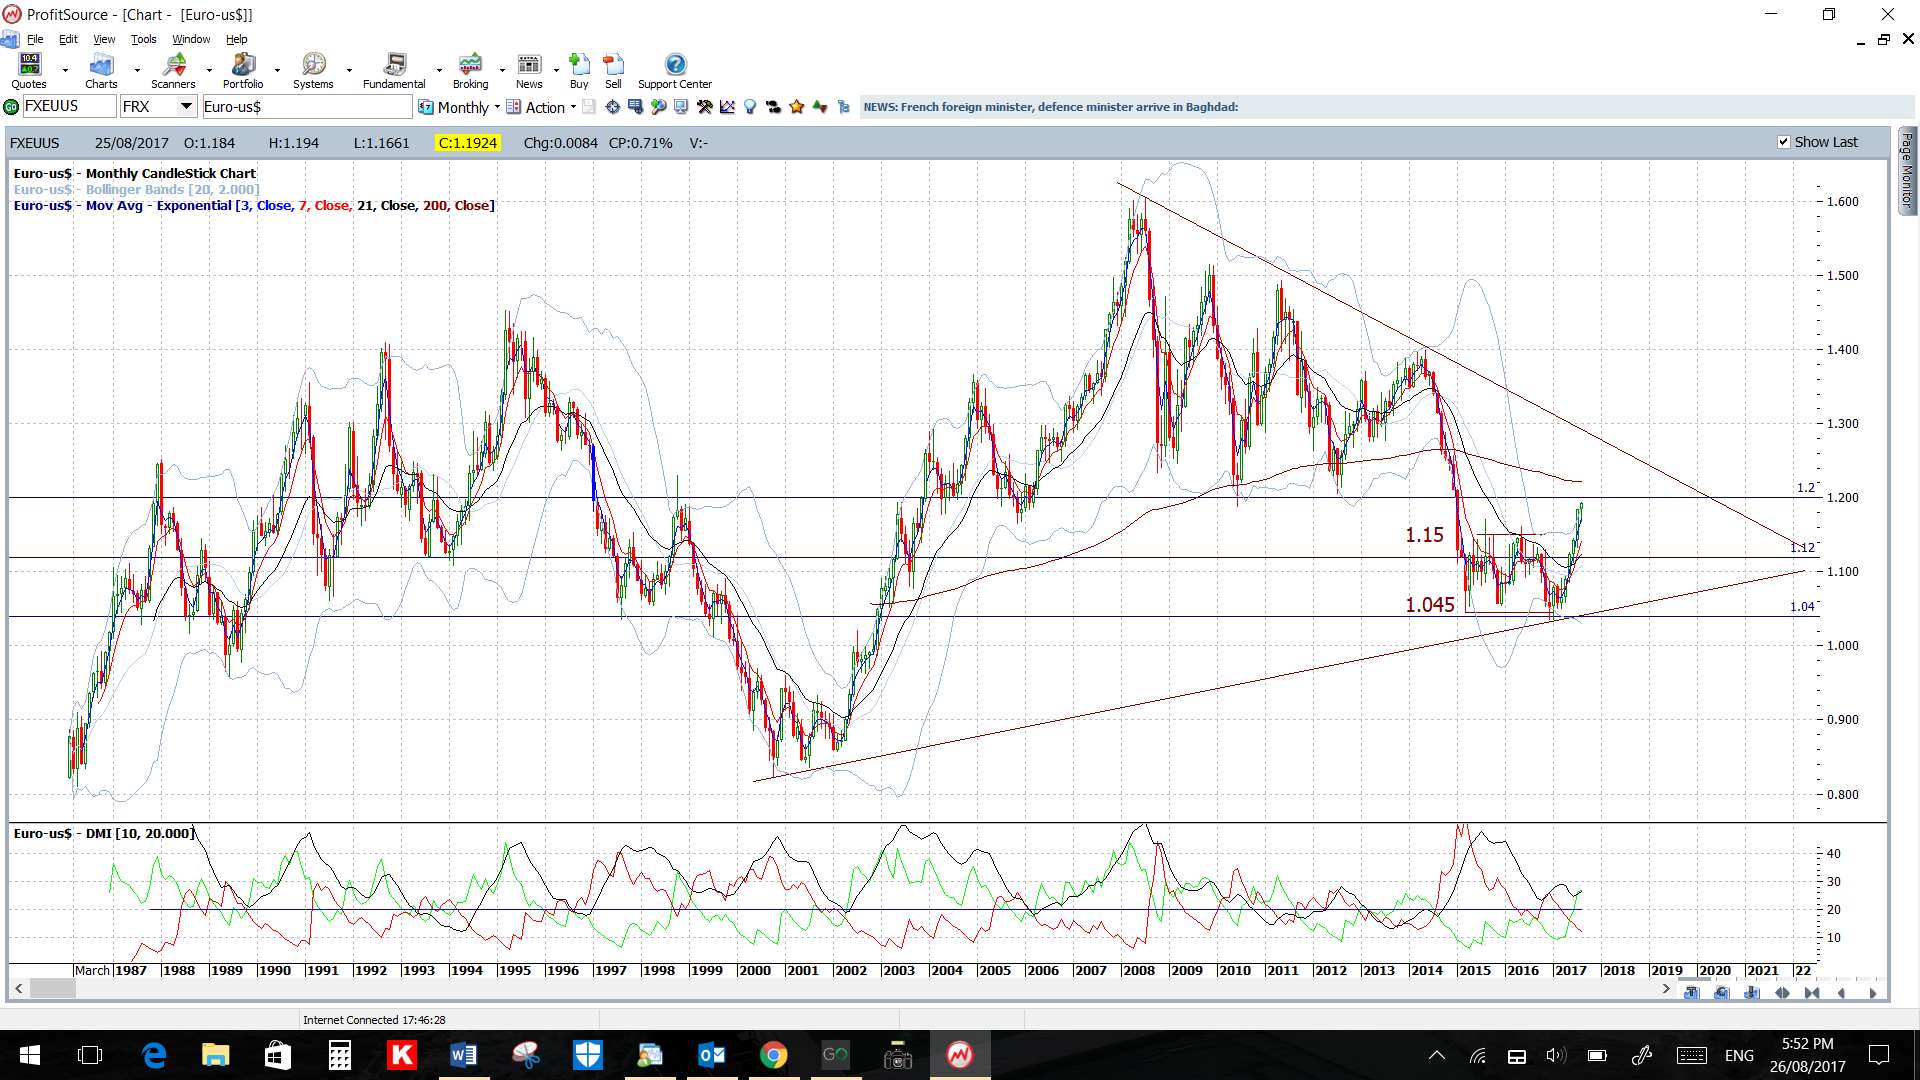
EUR/USD: Watch for any continuation from the 4hr chart’s Bull Flag. The 1.20 level is just above current price and any continuation beyond there would bring the weekly chart’s 61.8% fib, that is right near 1.25 and the monthly bear trend line, into focus.
Any pullback however would bring the 50% fib of the recent swing high move, down near 1.12 previous S/R, into focus.


EUR/JPY: Watch for any continuation from the 4hr chart’s Bull Flag. Price finally closed out from this Flag and above the S/R level of 130.
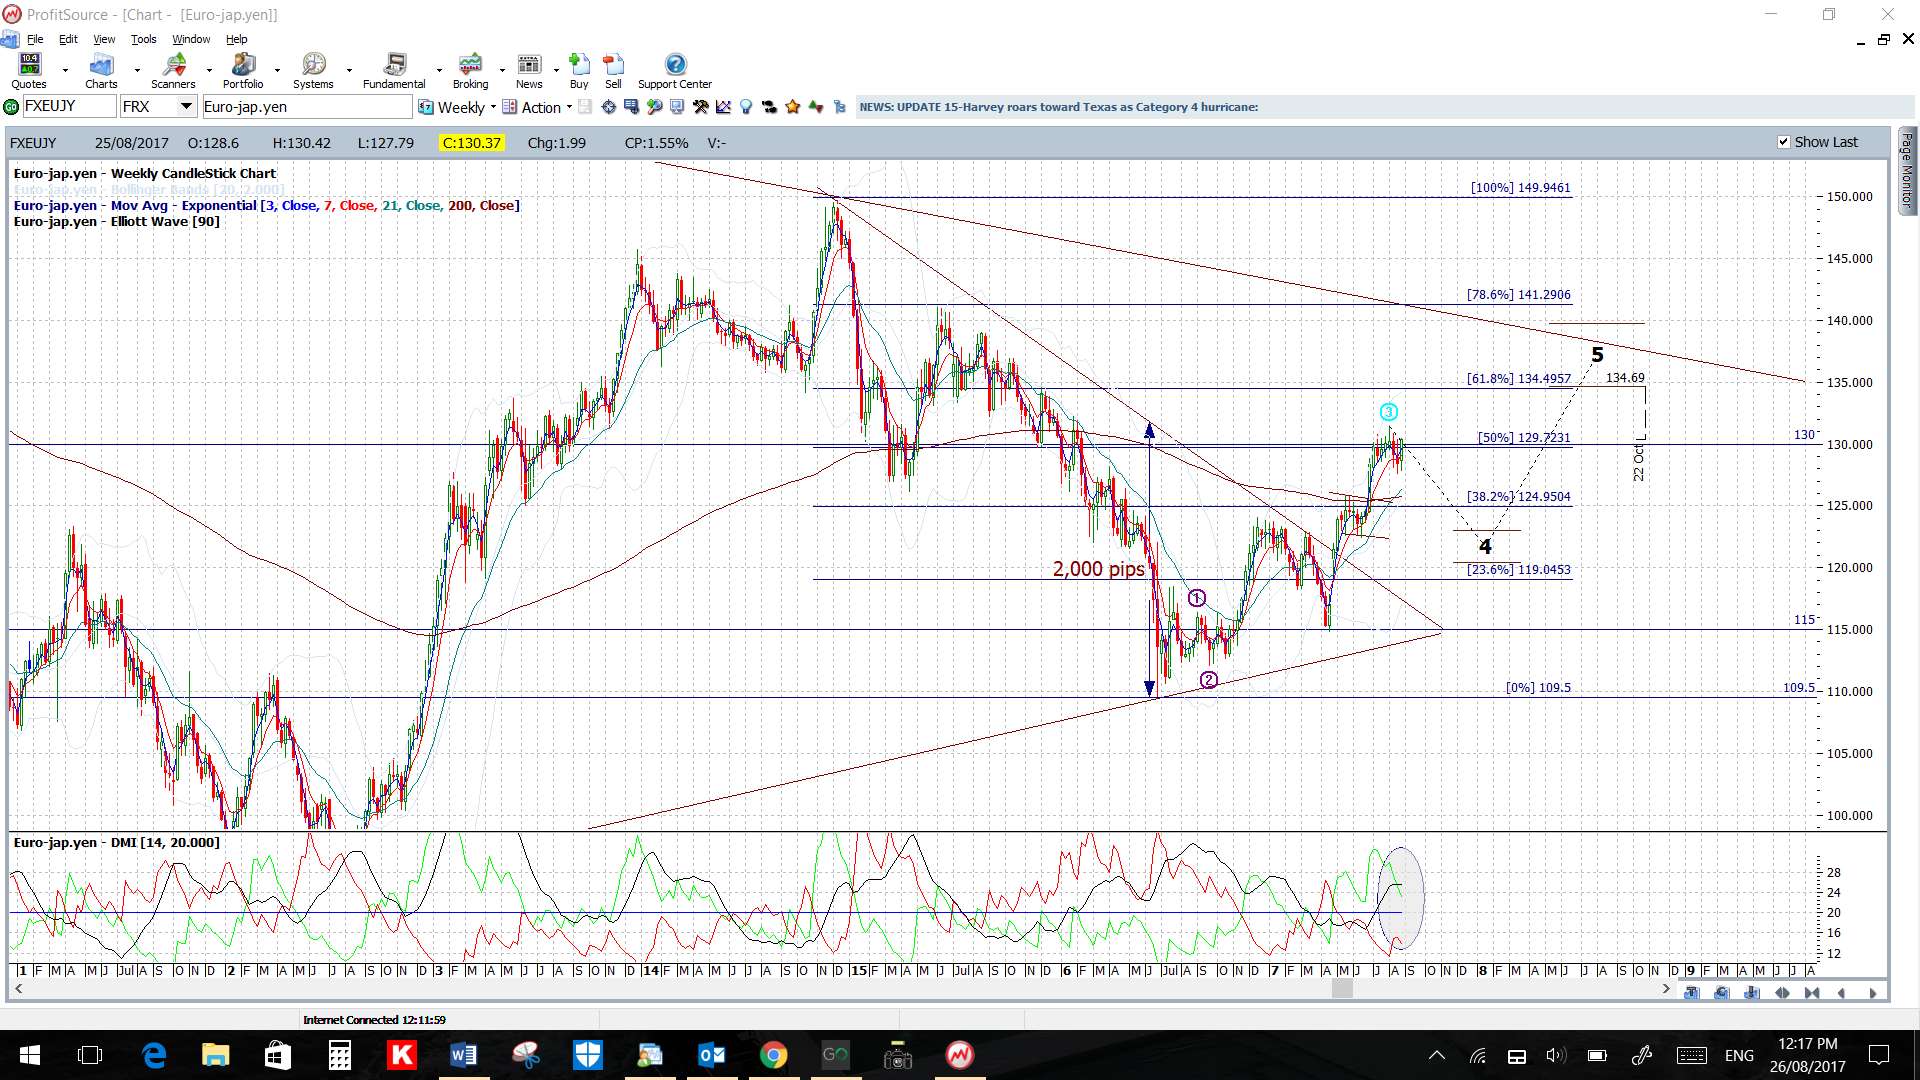
Bullish continuation would bring the weekly chart’s 61.8% fib, up near 135, into focus.
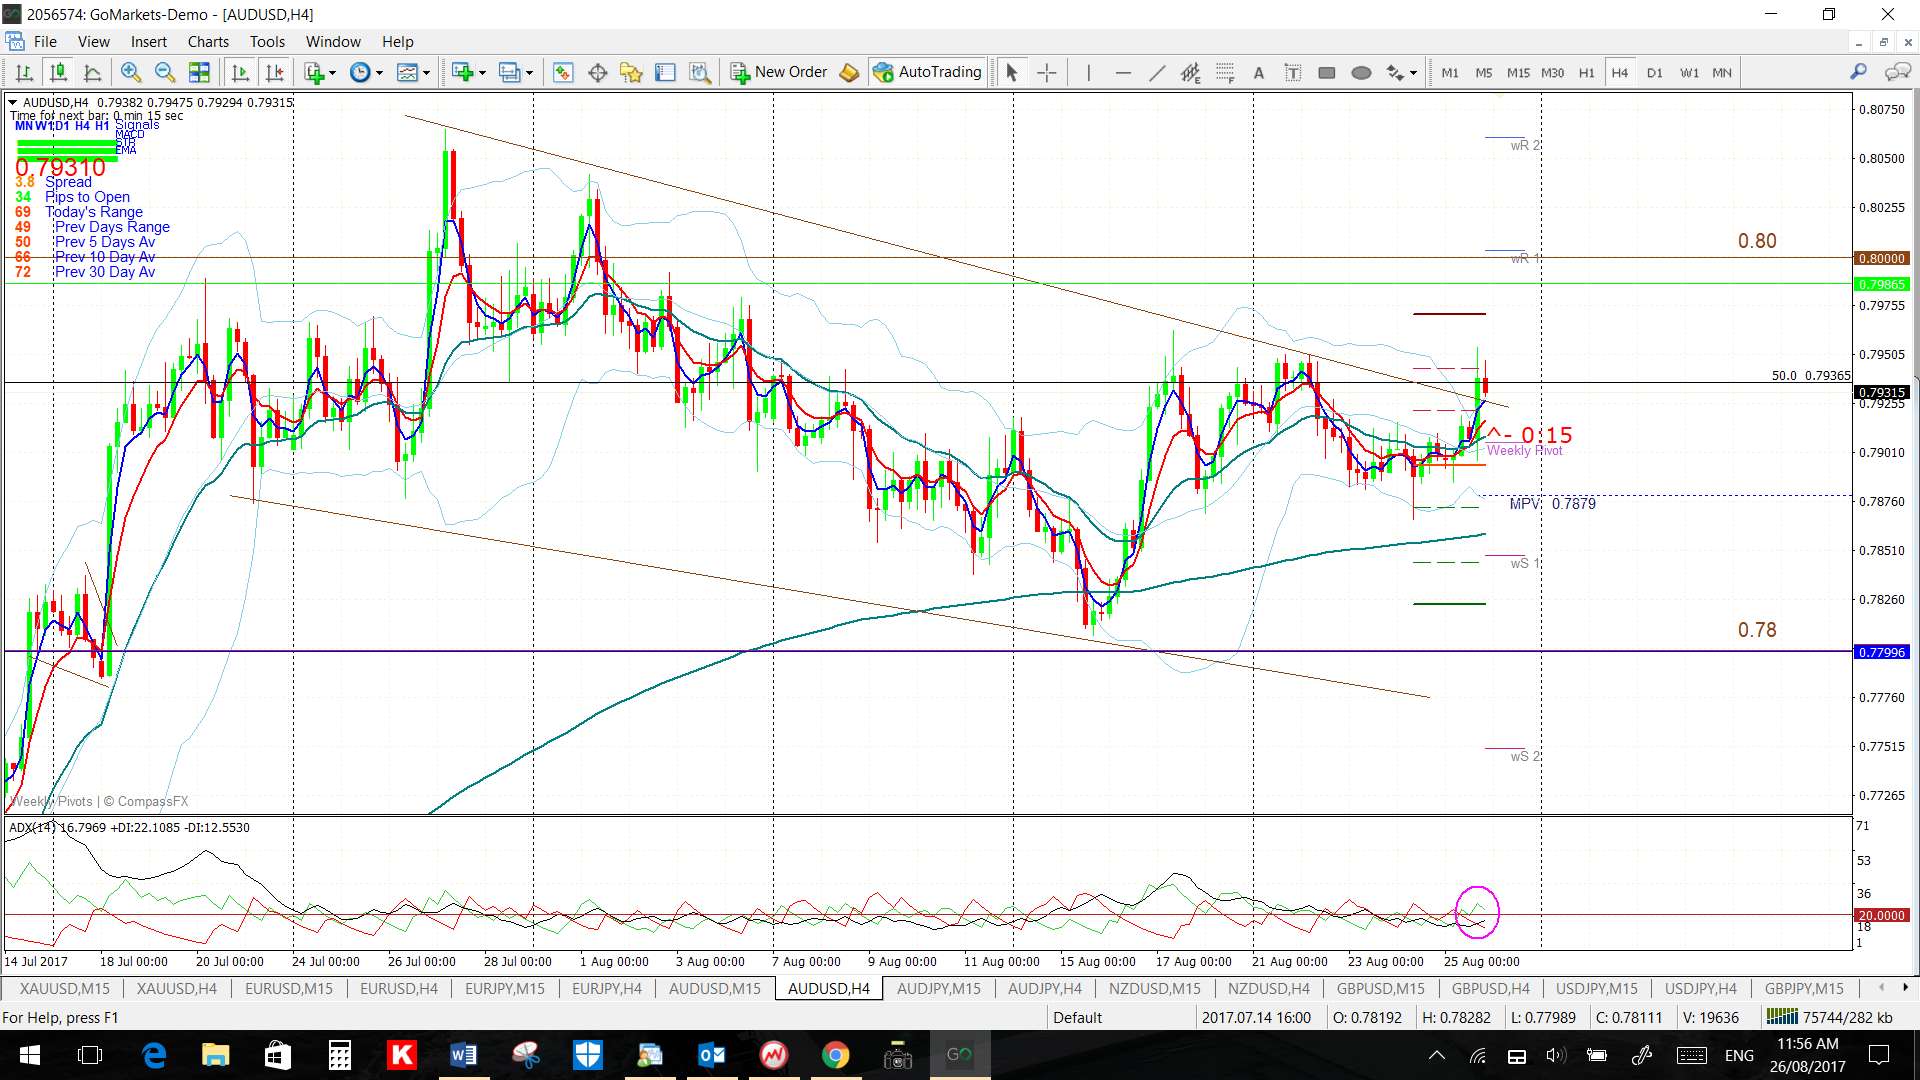
AUD/USD: Watch for any continuation from the 4hr chart’s Bull Flag. The 0.80 S/R level is about 70 pips above current price and would be the first target for any continuation move here. After that, the weekly chart’s 50% fib, up near 0.90.

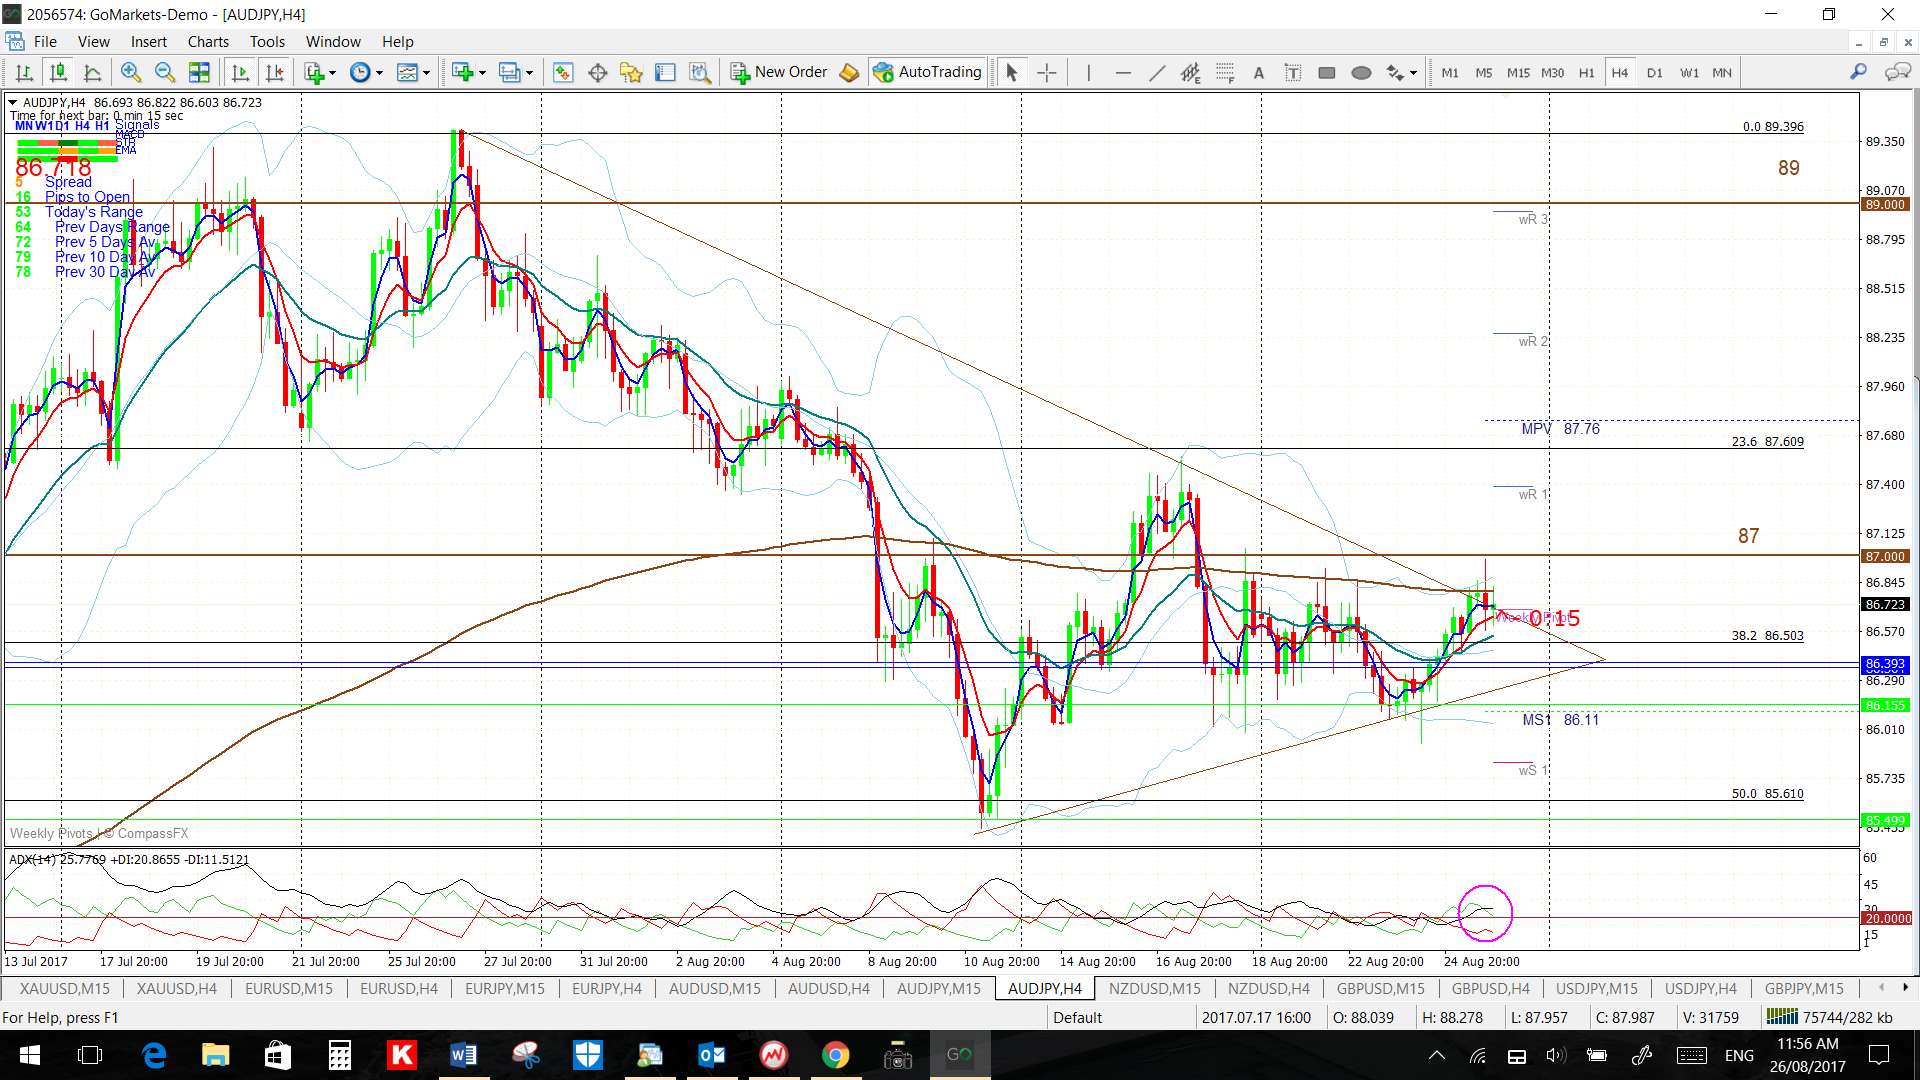
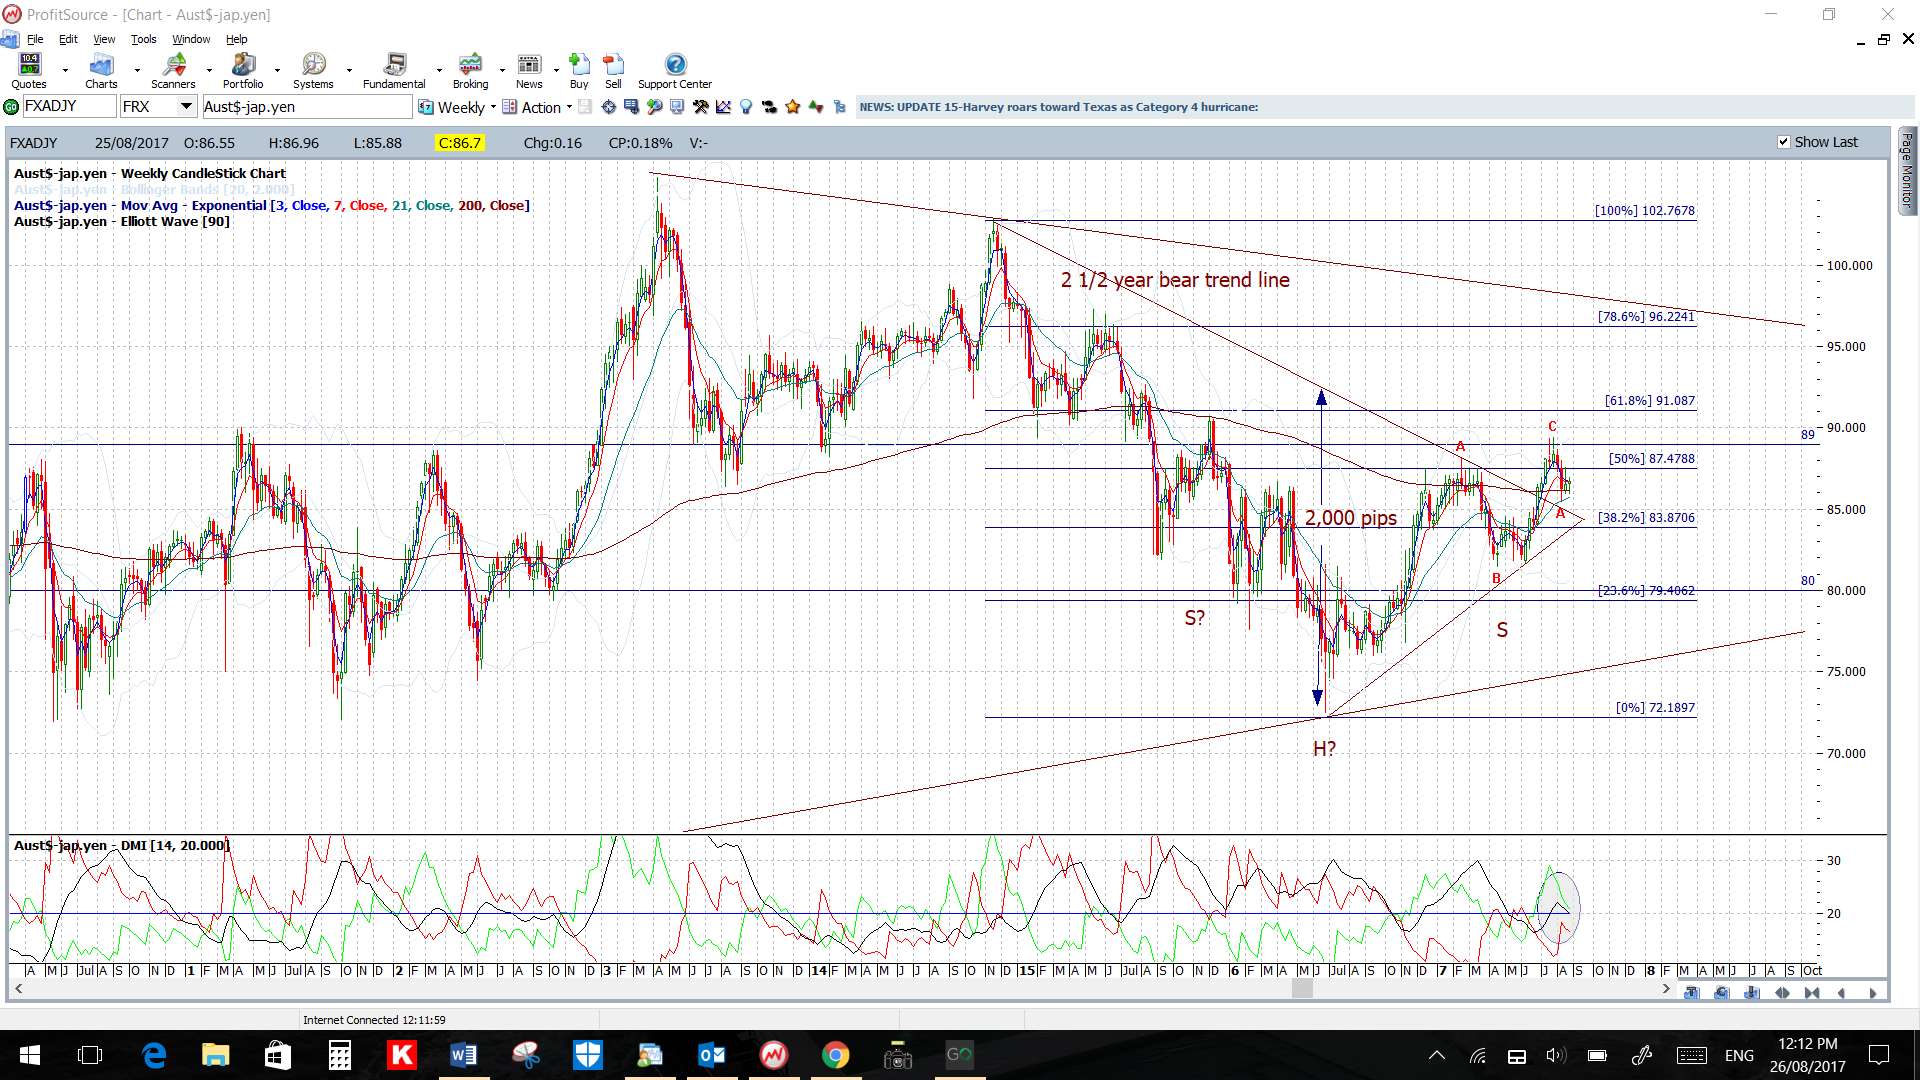
AUD/JPY: Watch for any continuation from the 4hr chart’s triangle. The 87 level is just above current price but any continuation move would bring the S/R level of 89 into focus.
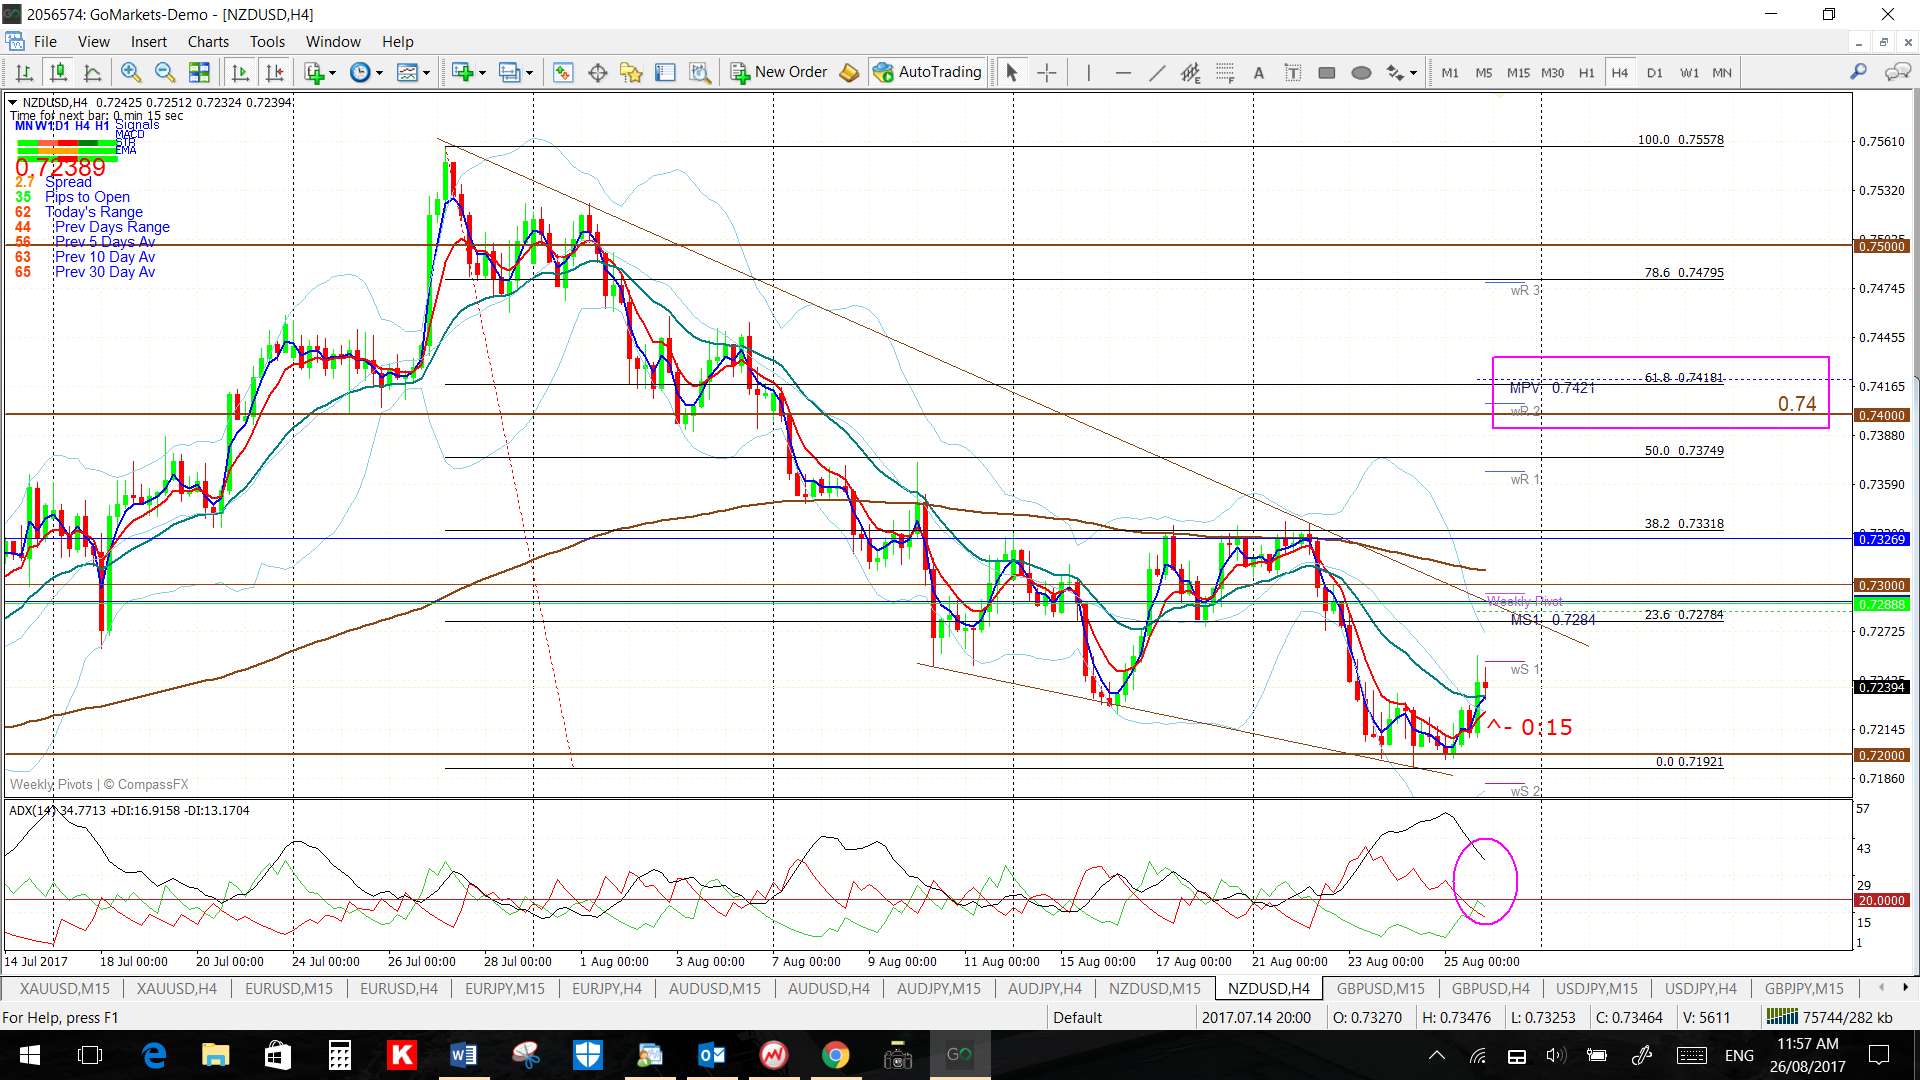
NZD/USD: The 0.72 level has held here and price looks to be shaping up into a bullish descending wedge so watch the wedge trend lines for any new breakout. Any bullish breakout would bring the 4hr chart’s 61.8% fib, near 0.74 S/R, into focus:
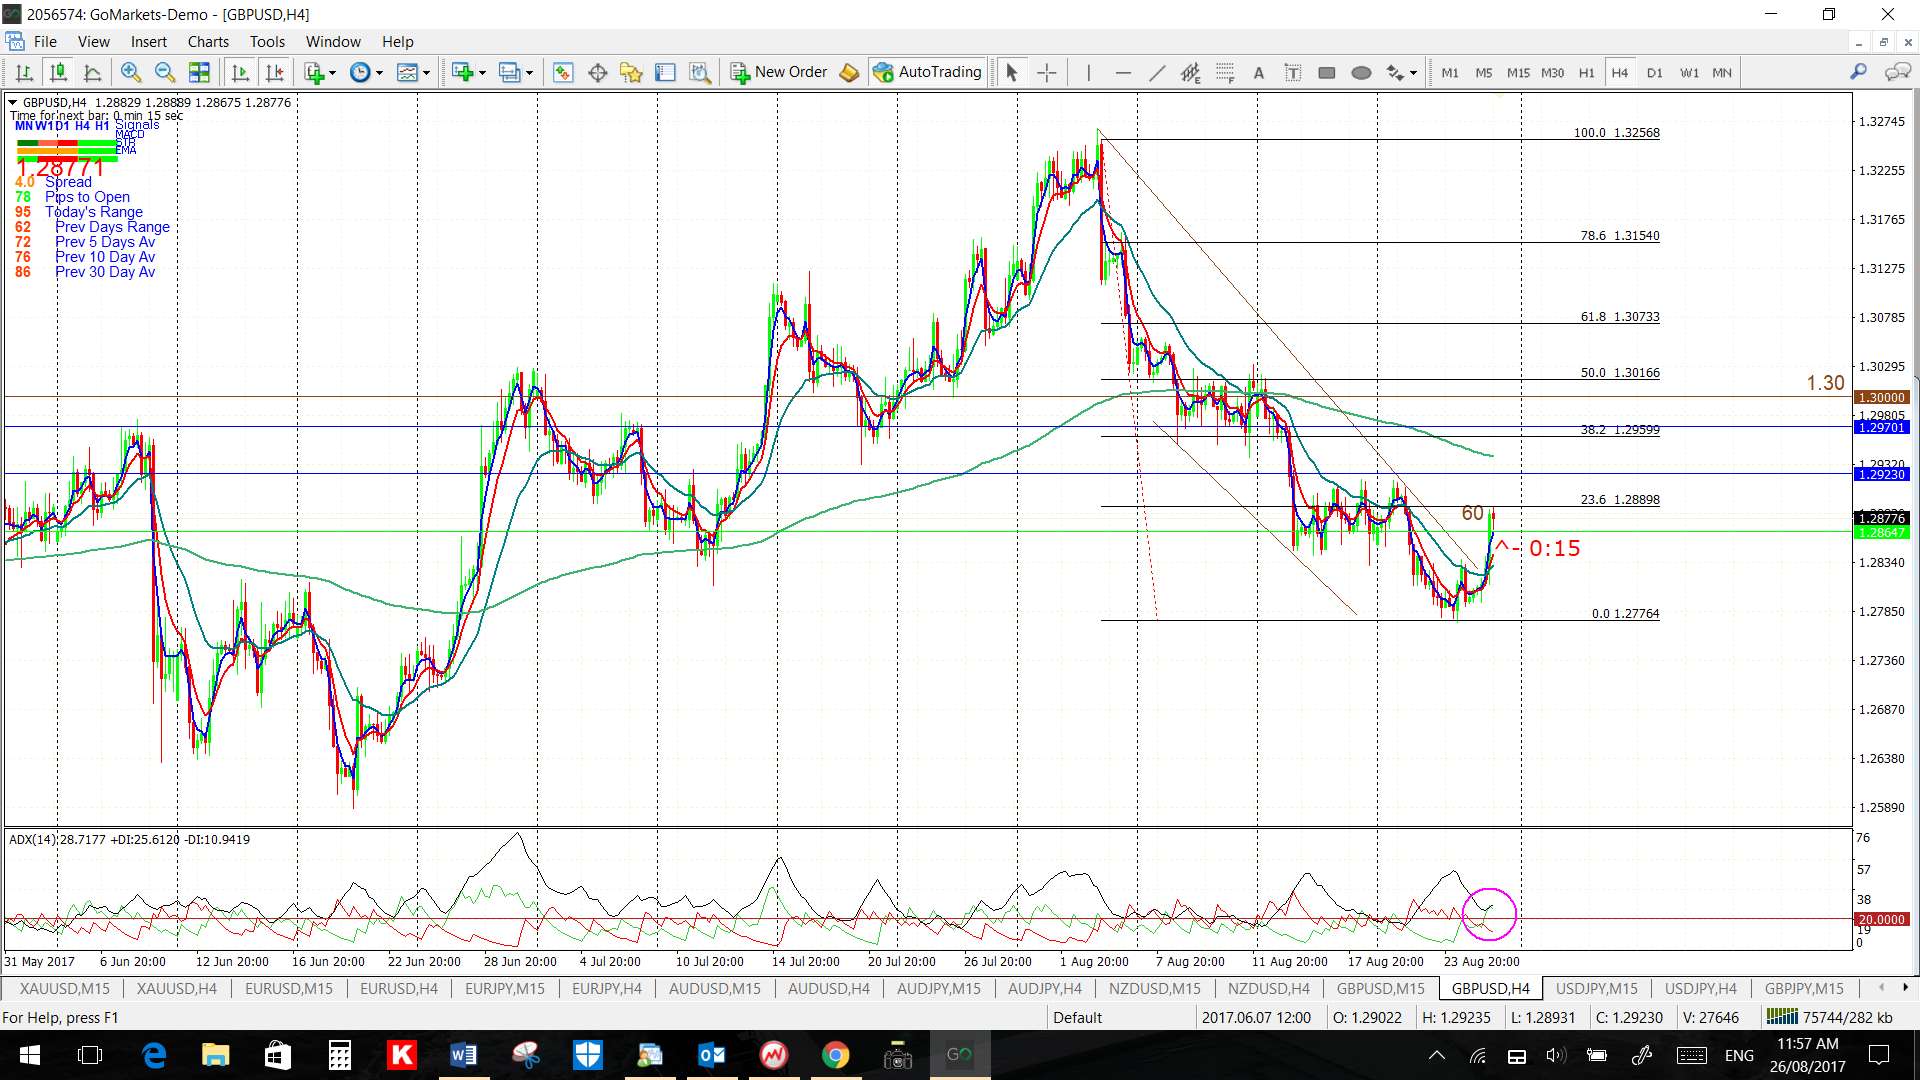
GBP/USD: Watch for any continuation from the 4hr chart’s bullish descending wedge. The previous S/R level of 1.30 is up near the 4hr chart’s 50% fib and over 100 pips away and would be in focus here if so.
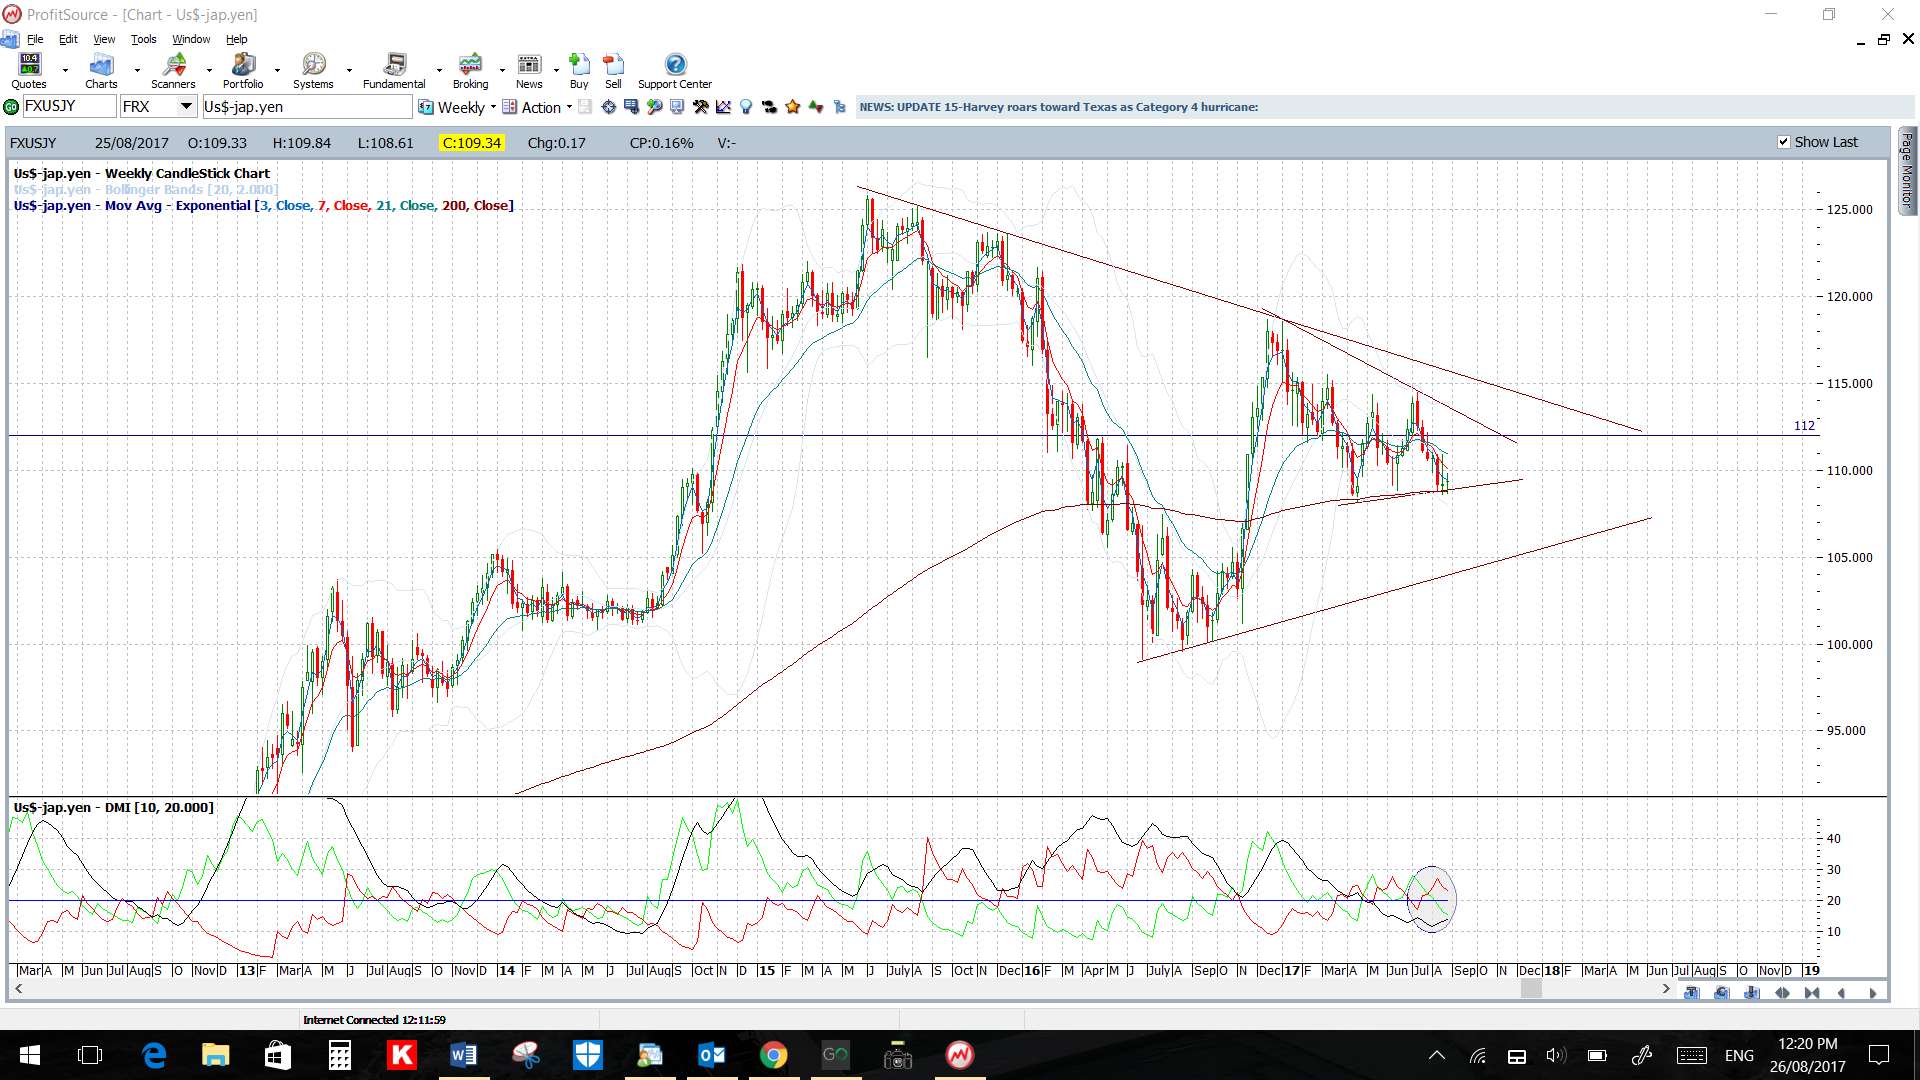
USD/JPY: Watch the 4hr chart’s triangle trend lines for any breakout.

GBP/JPY: Watch for any continuation from the 4hr chart’s bullish descending wedge.

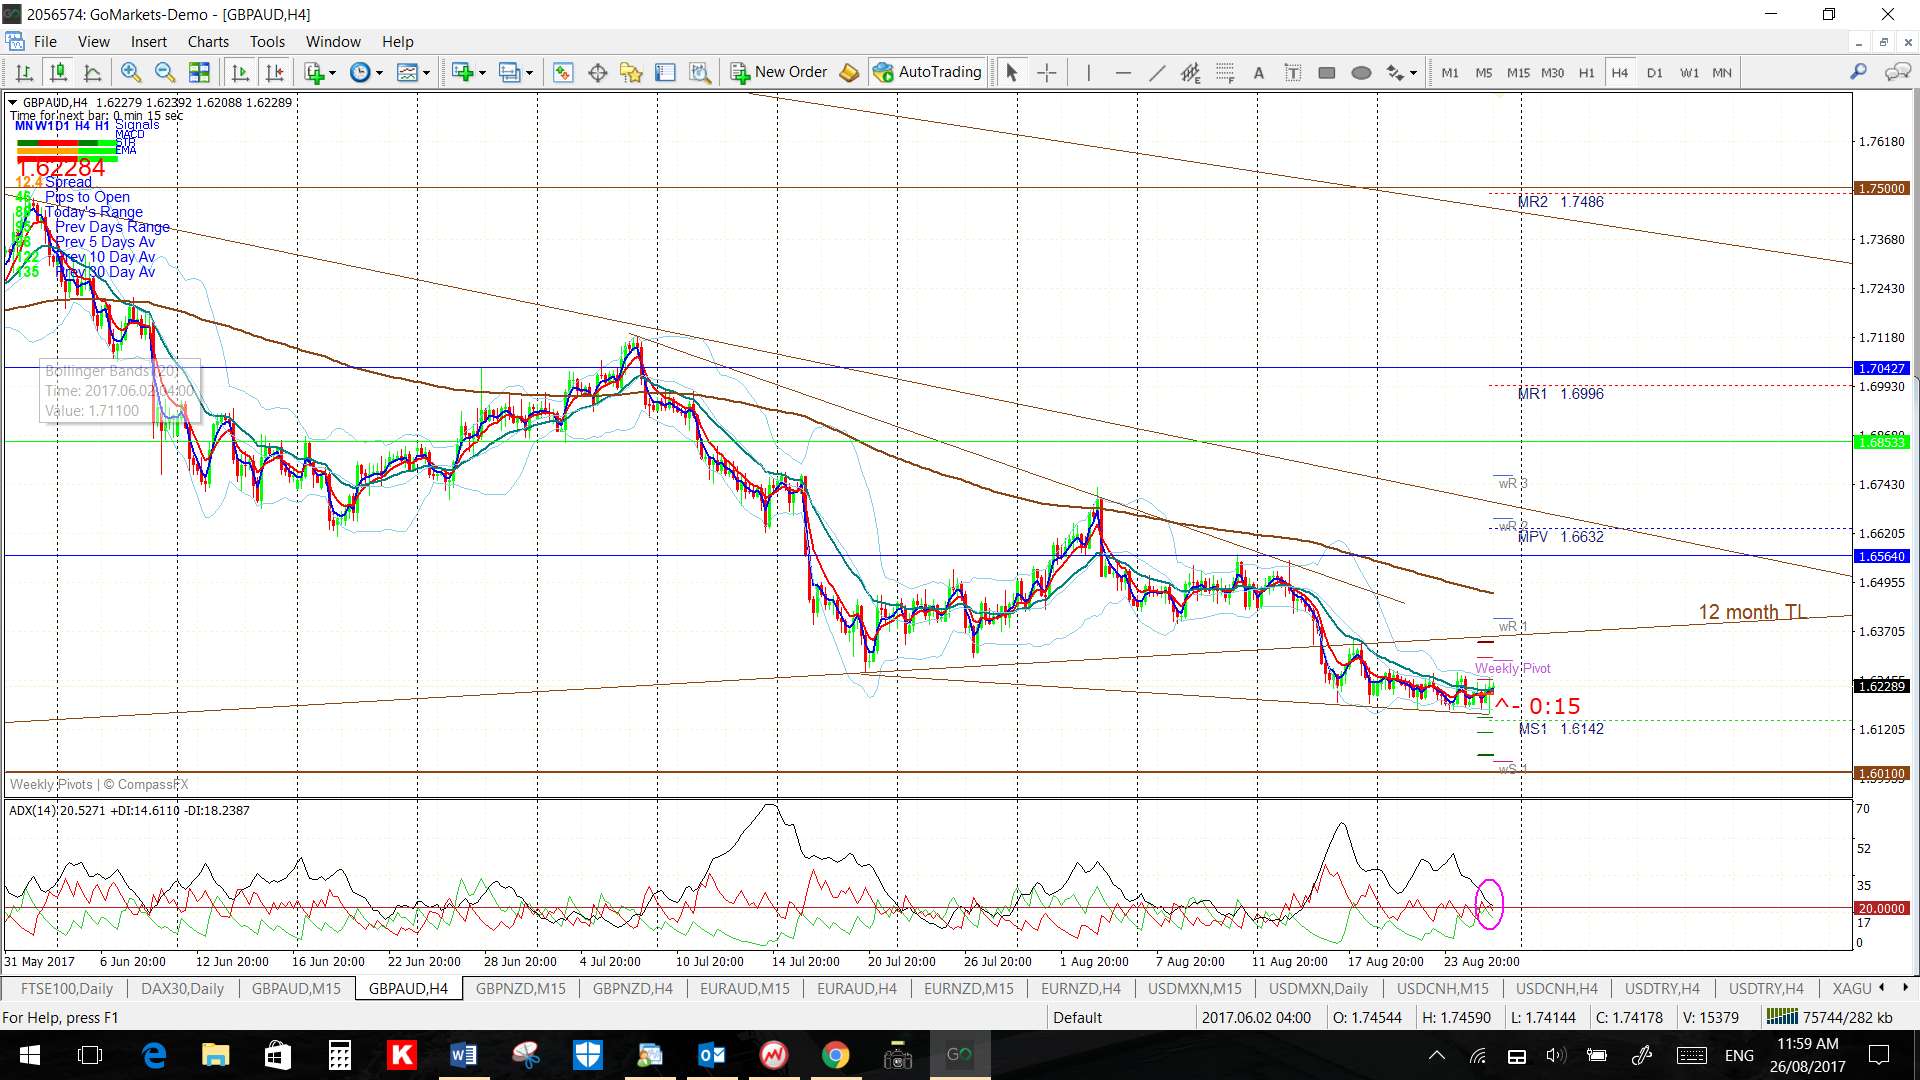
GBP/AUD: Watch the 4hr chart’s wedge trend lines for any new breakout:

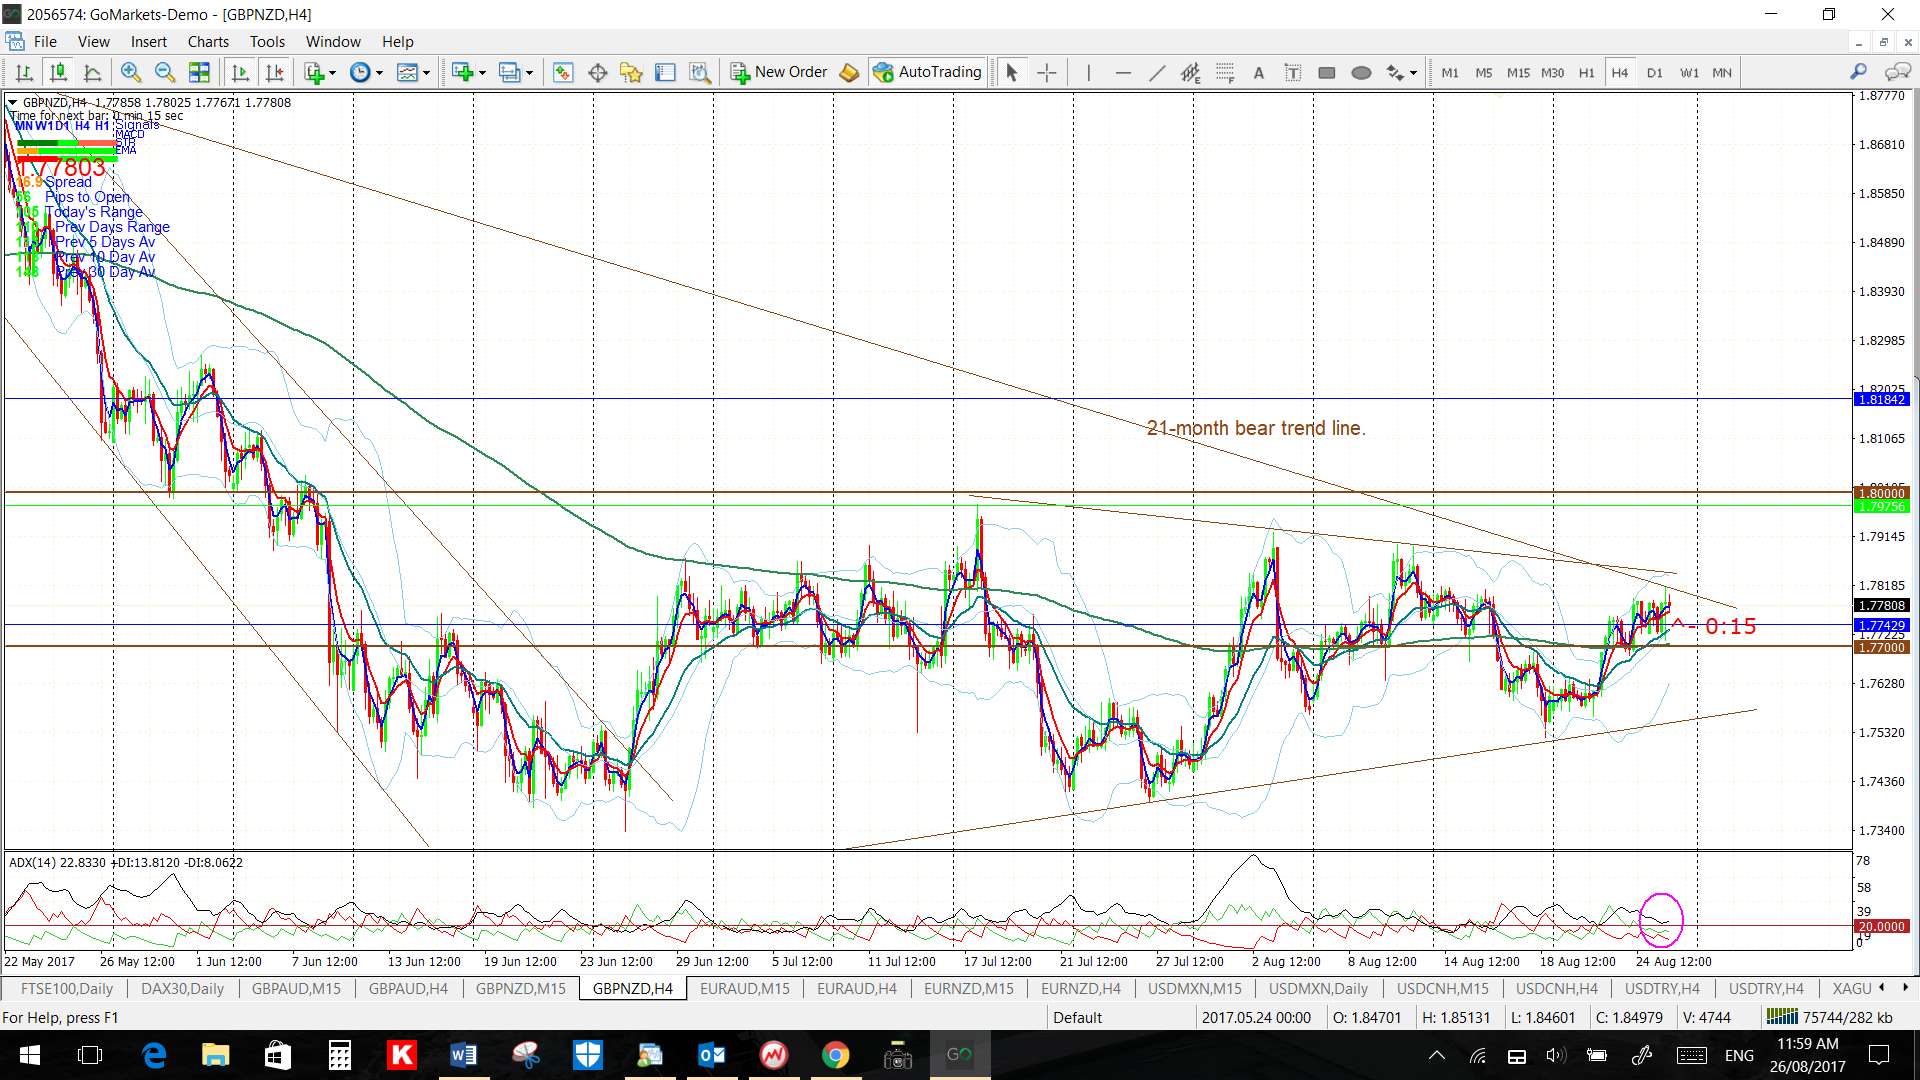
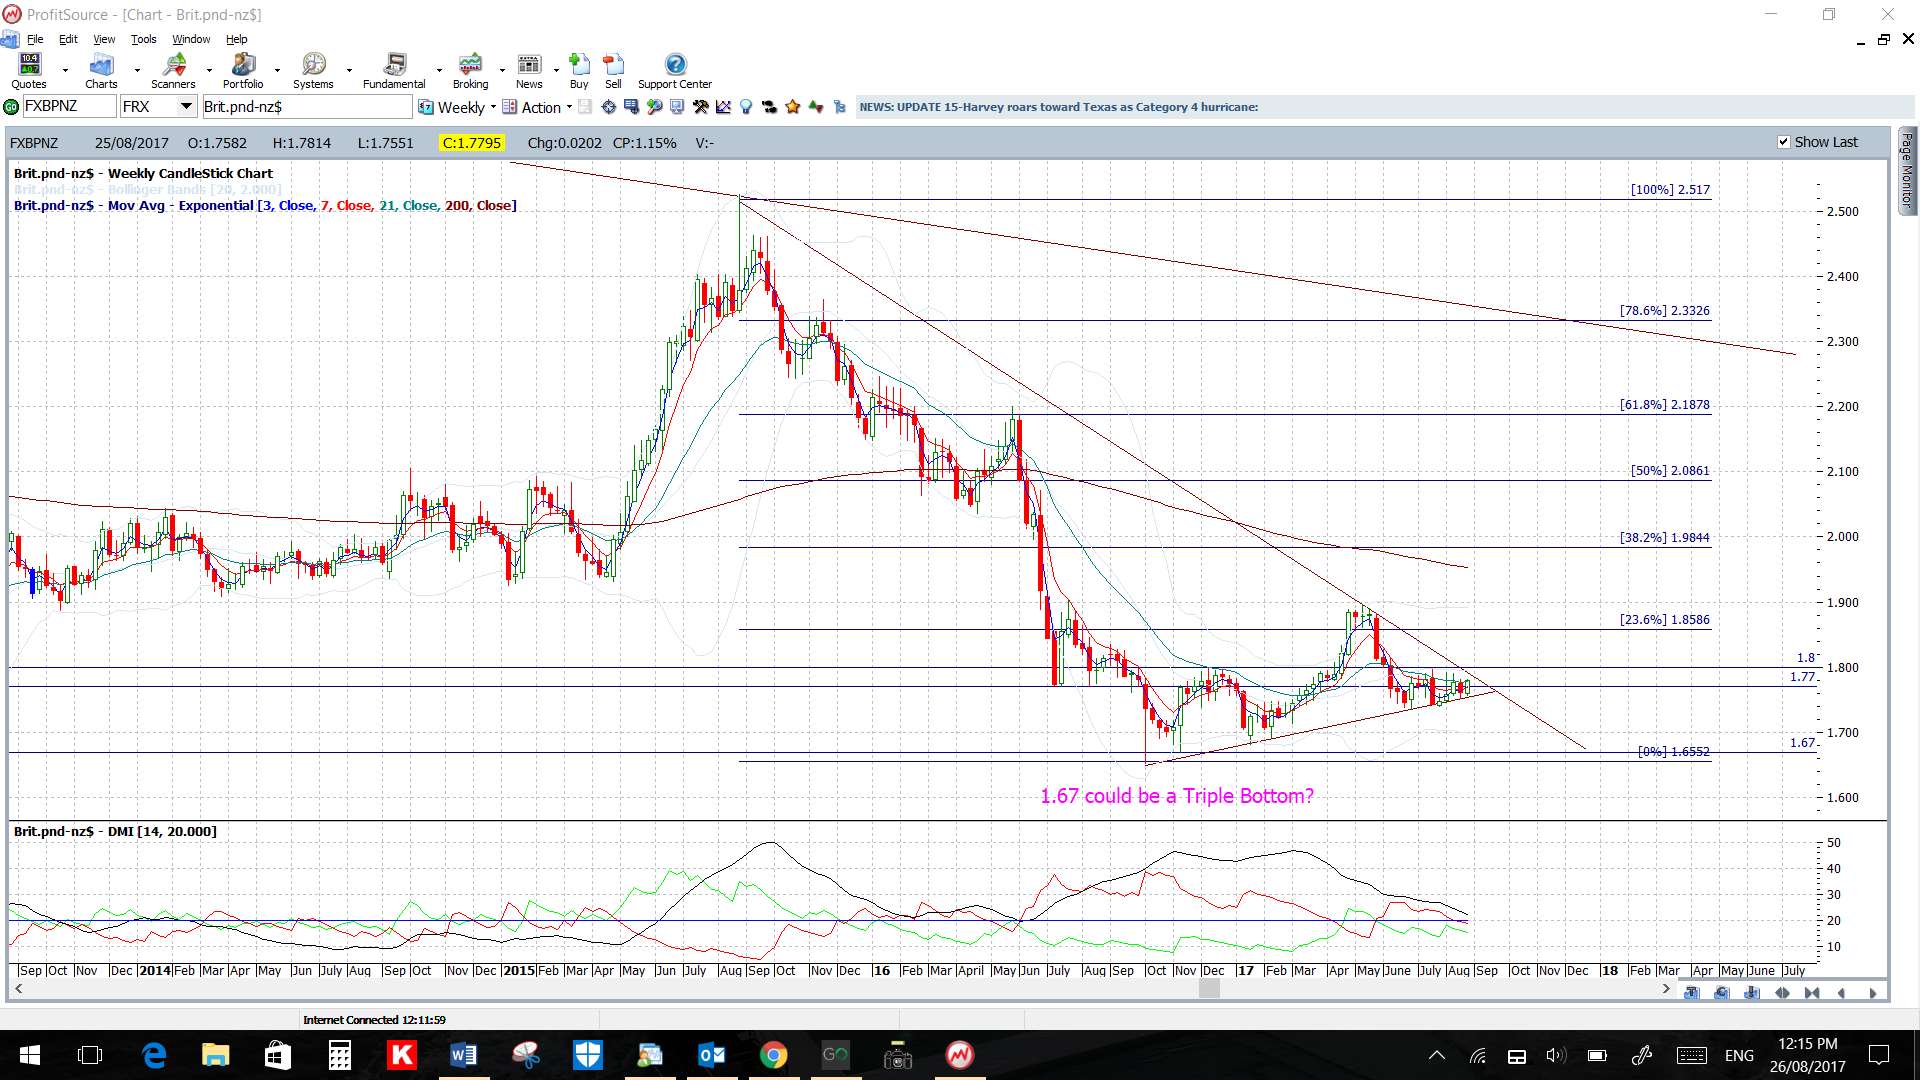
GBP/NZD: Watch the 4hr chart’s triangle/wedge trend lines for any new breakout:
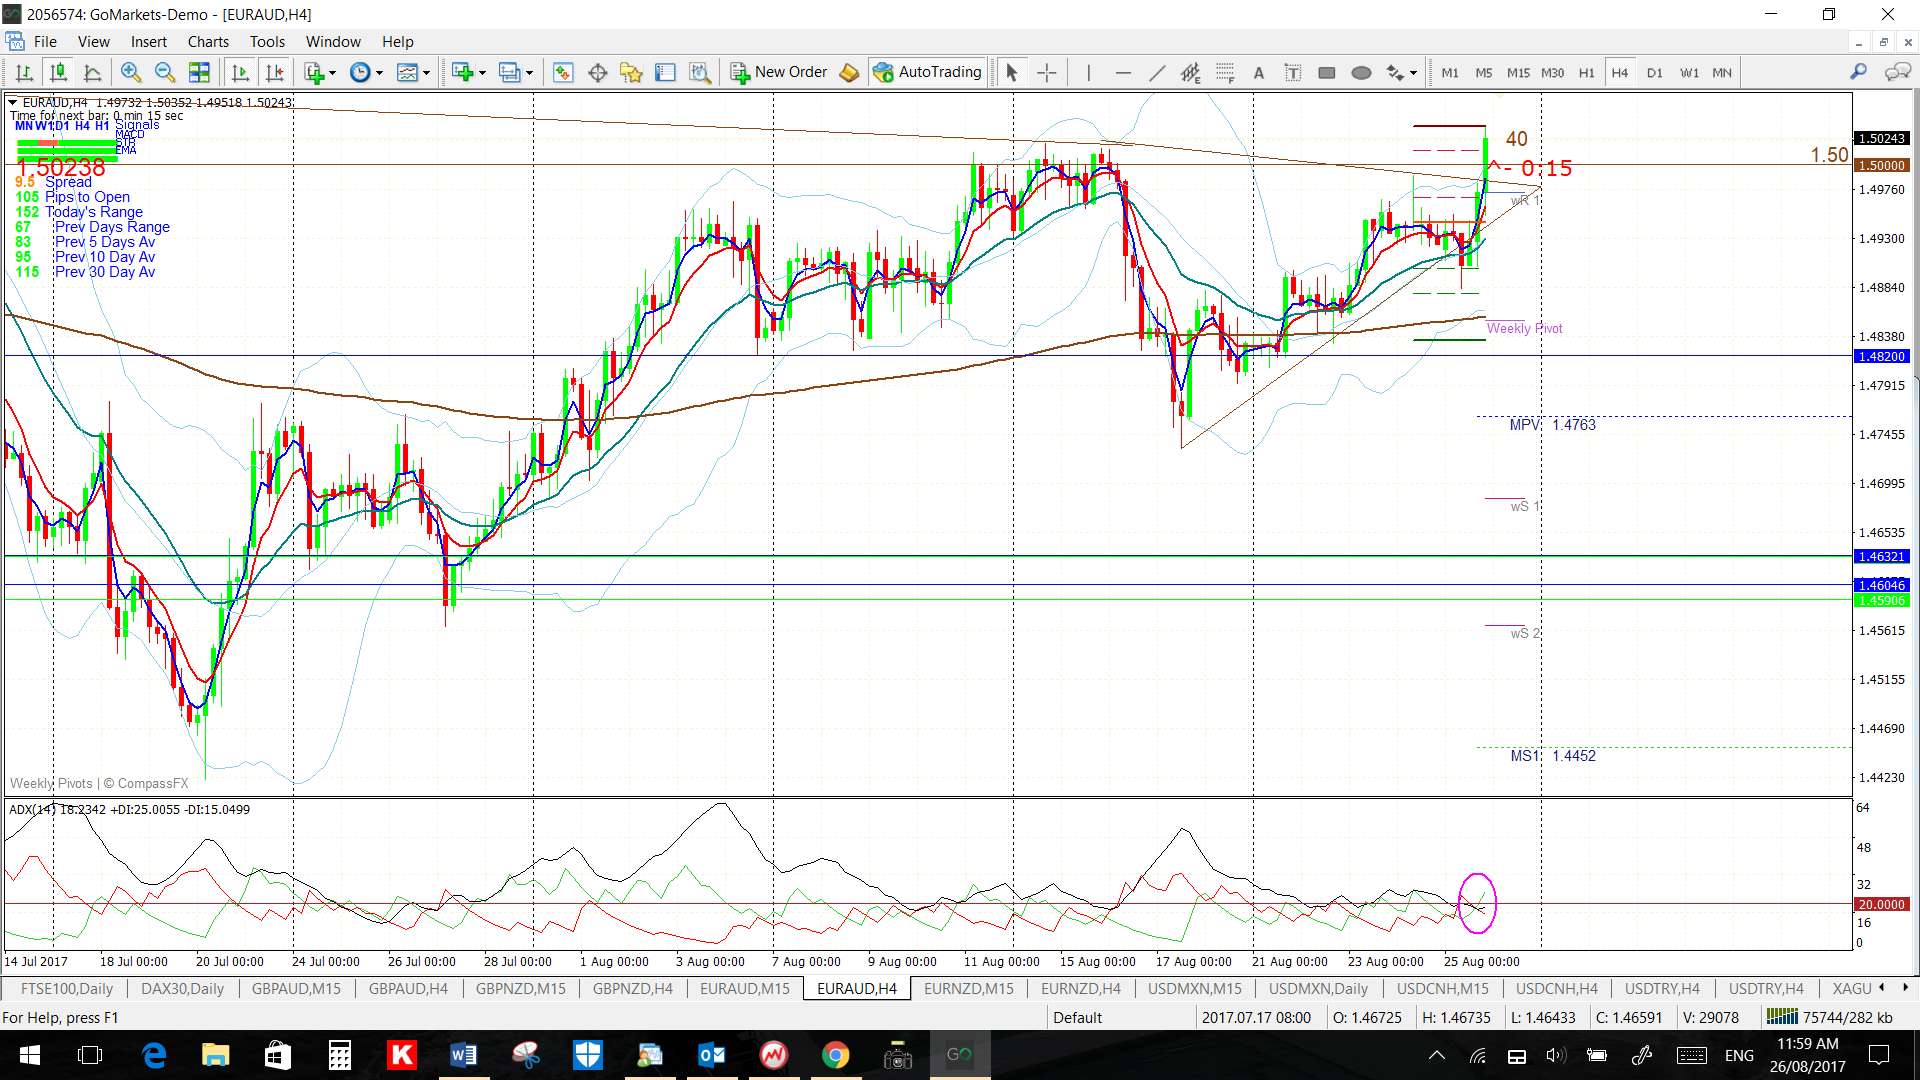
EUR/AUD: Watch for any continuation from this 4hr chart triangle breakout:

EUR/NZD: This has been on a lengthy run bit note the 9-year bear trend line looming above current price. Watch for any new make or break if price reaches up this far:

USD/CNH: This continues within a pattern of ‘lower Highs and lower Lows’.Watch for any move down to the weekly 50% fib near 6.50:
USD/TRY: Watch for any new make or break at the weekly chart’s support wedge trend line:
Commodities:
Gold: Gold remains above the brpken 6-year bear trend line so watch for any continuation move to the upside. Price is currently trapped in a bit of a triangle under $1,300 resistance so watch for any 4hr chart triangle breakout:


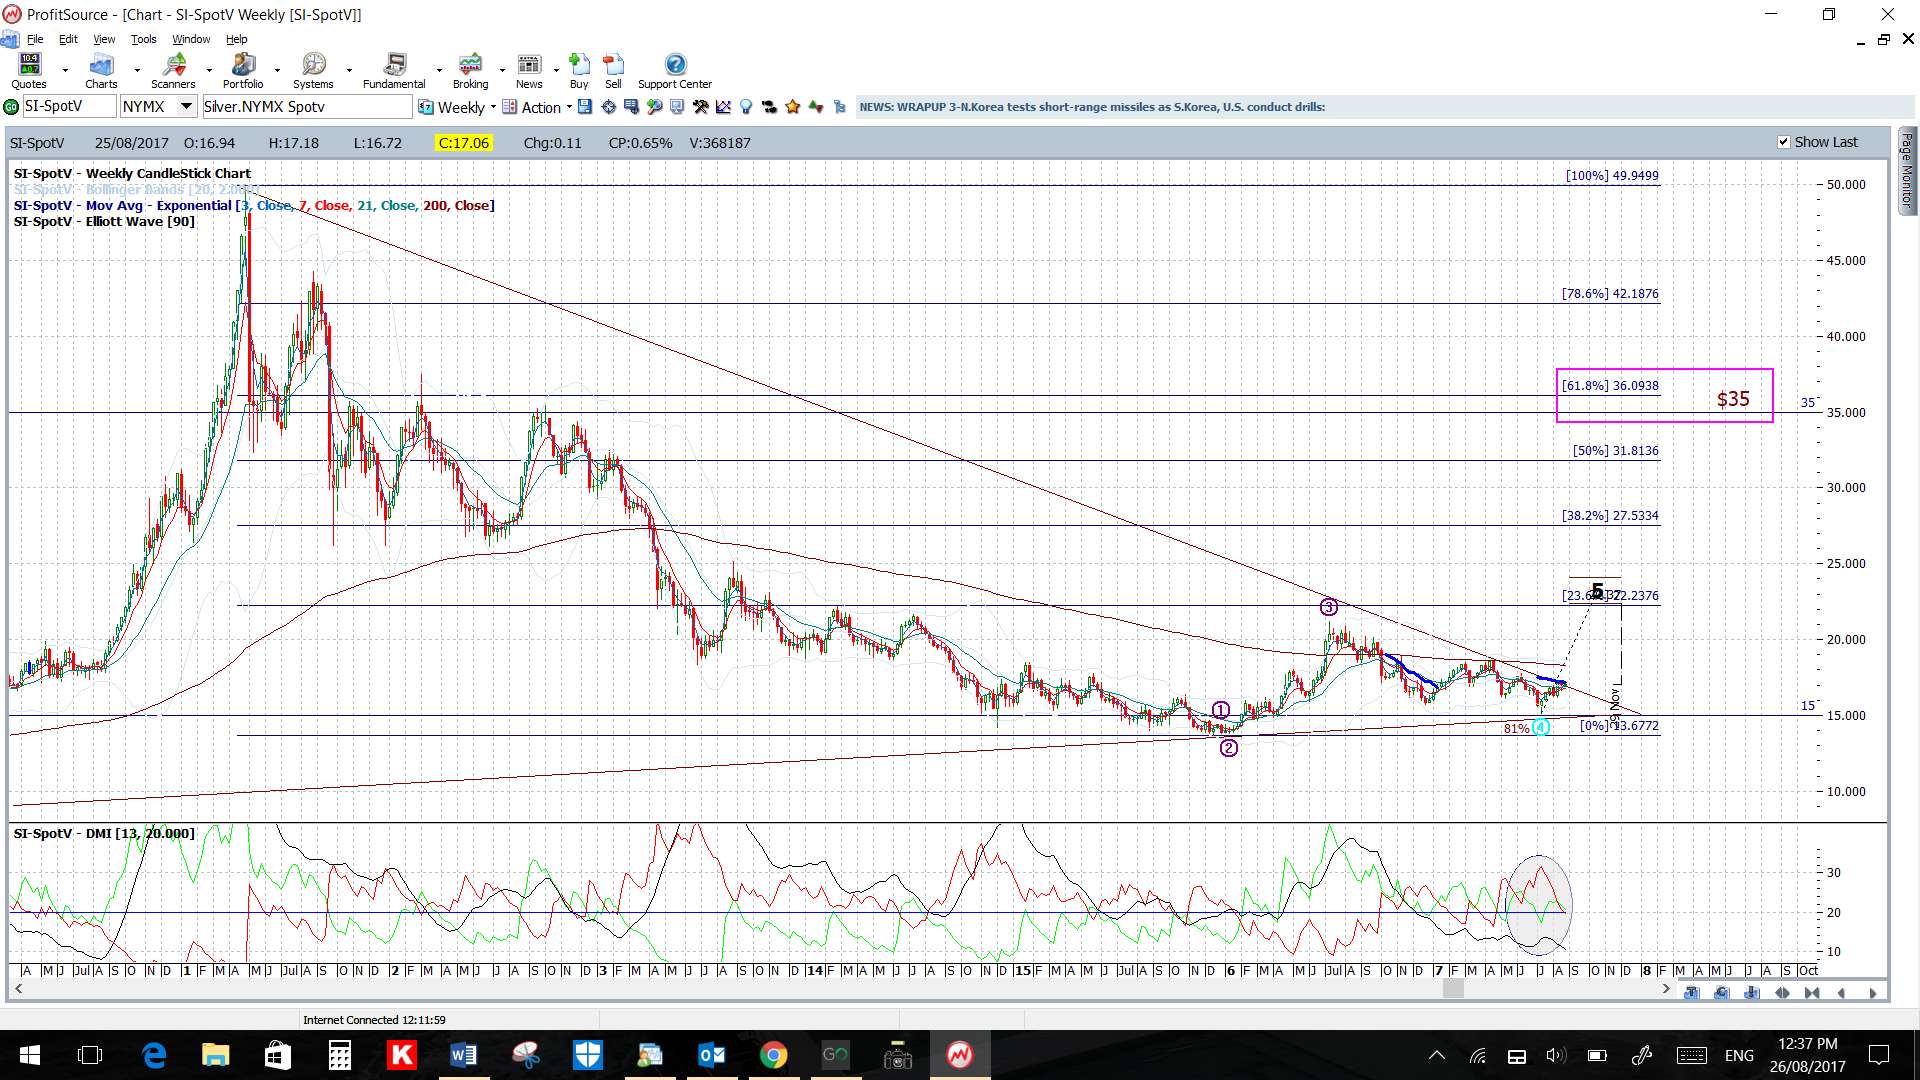
Silver: Price action is very closer to a major 6 year bear trend line here too! Watch for any 4hr chart triangle breakout:
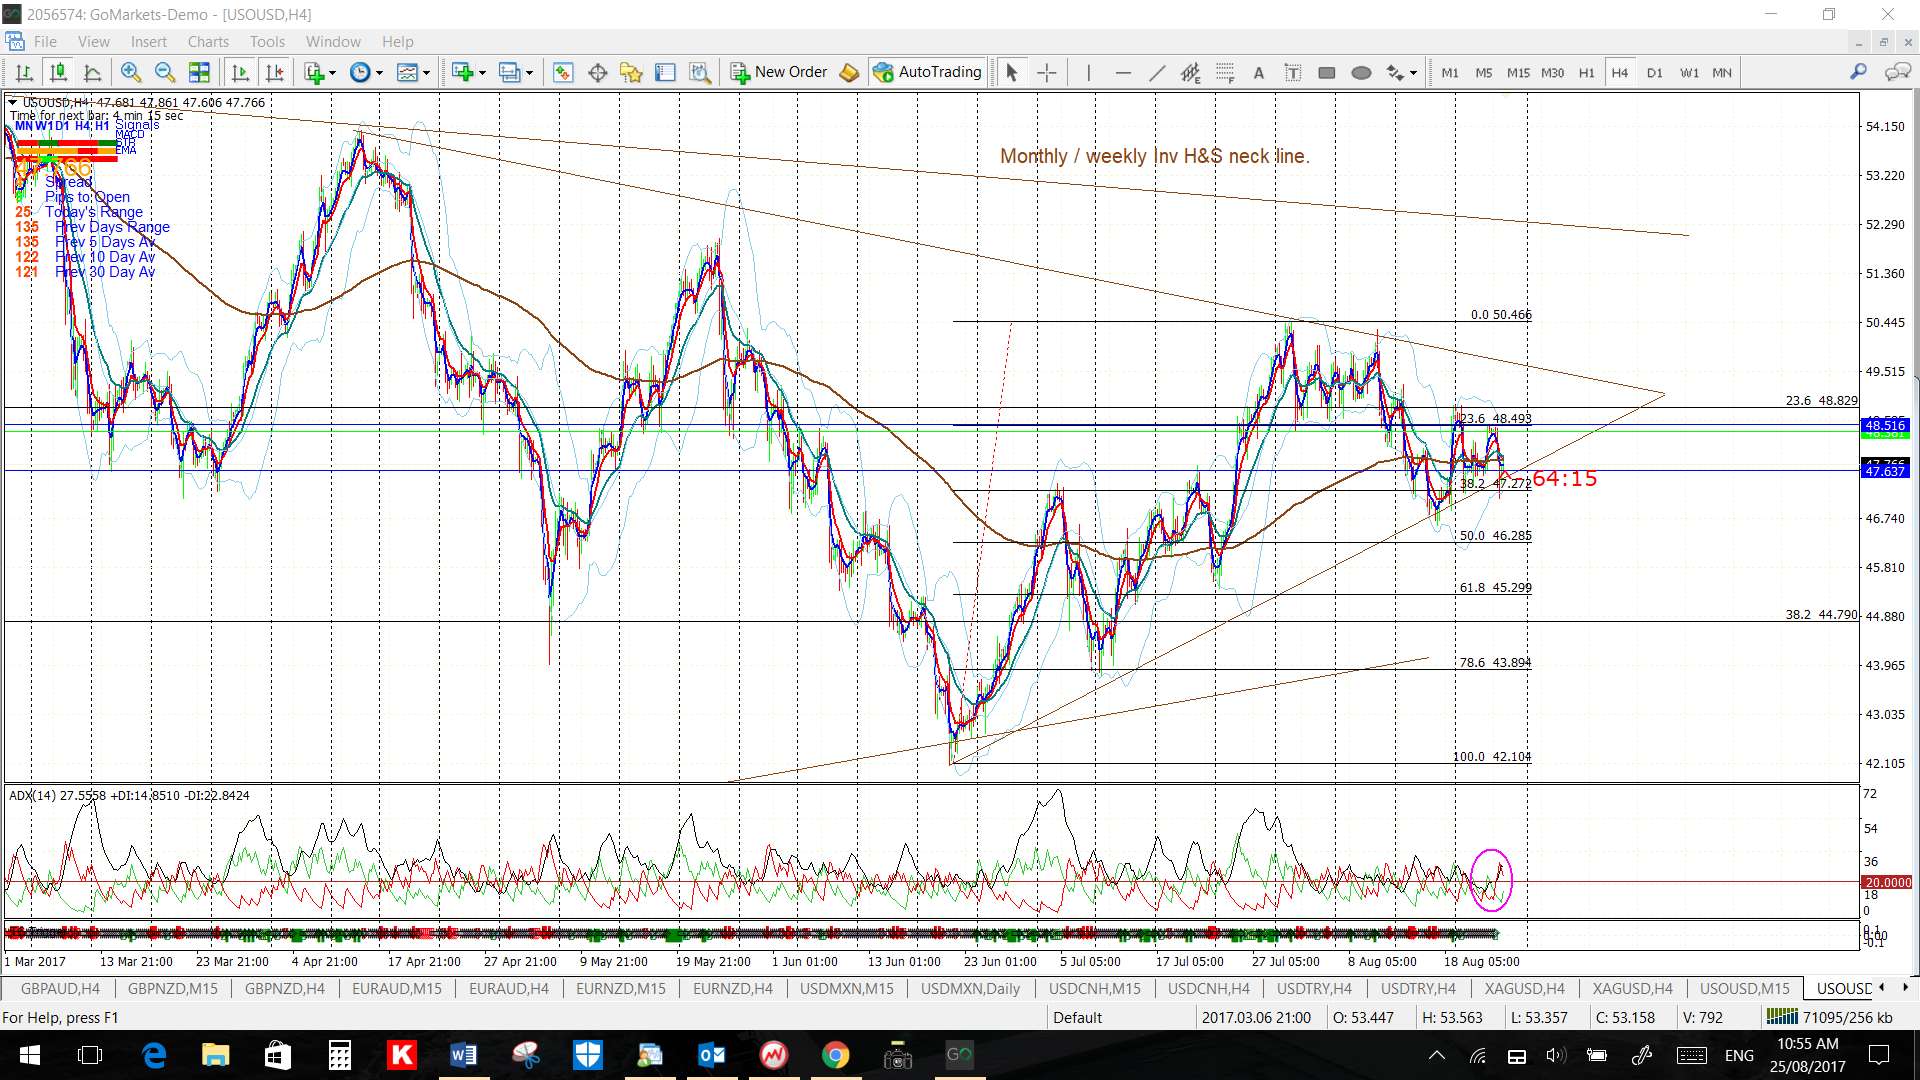
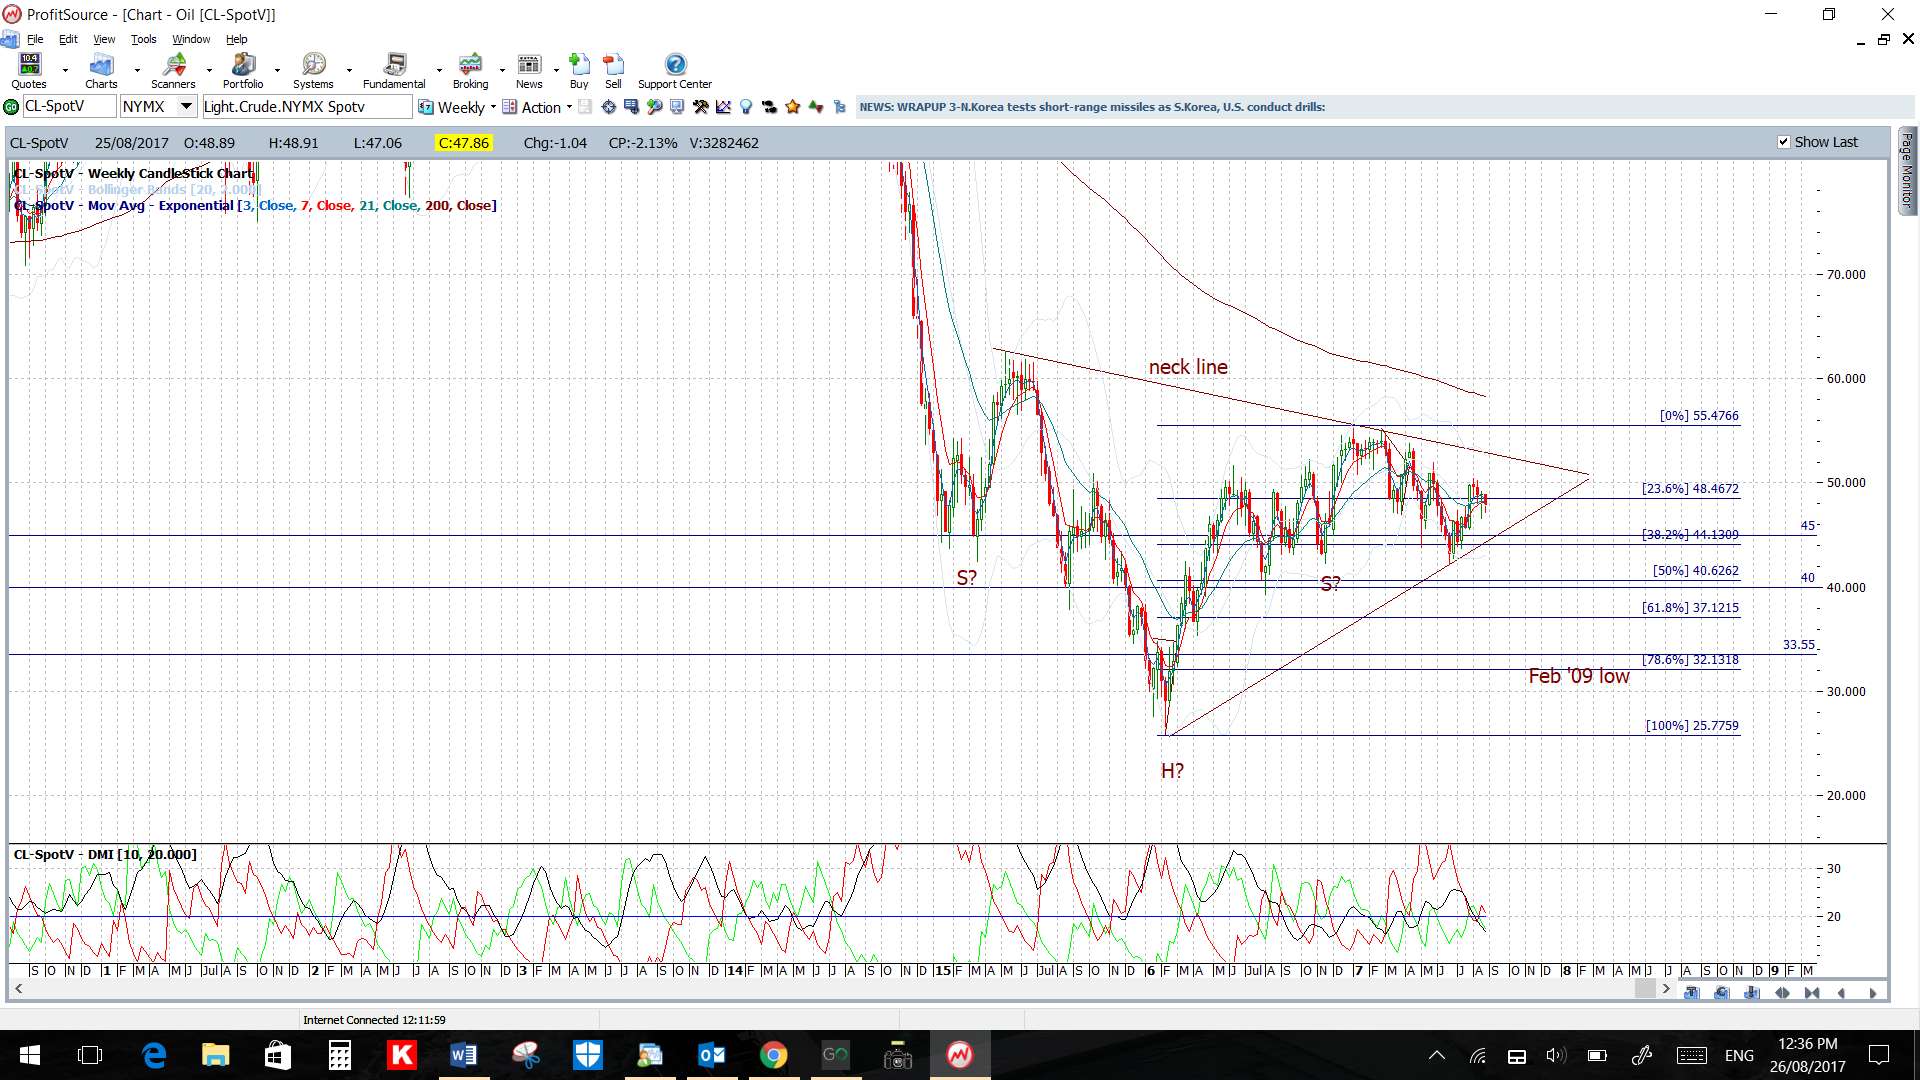
Oil 4hr: Watch for any 4hr chart triangle breakout:
Stock Indices:
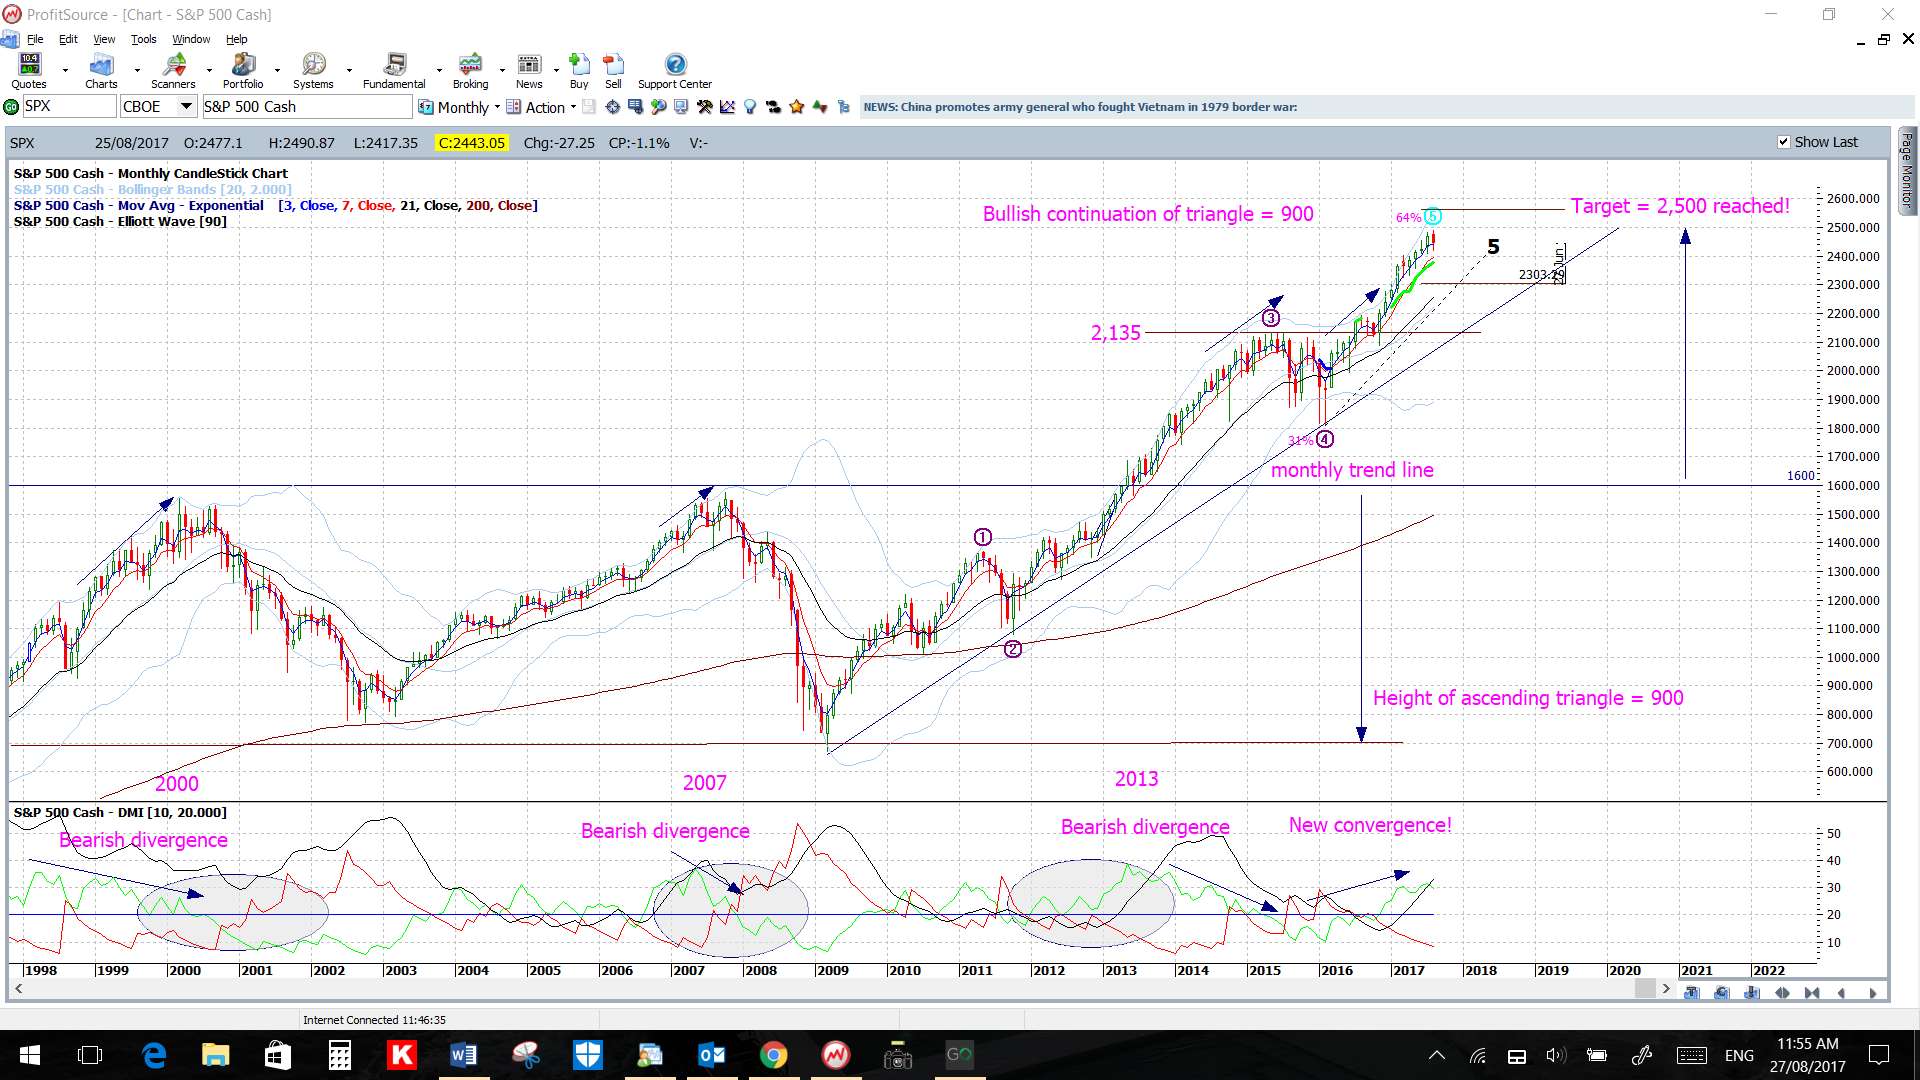
S&P500: This index has achieved the target for the bullish ascending triangle breakout and I’m now on the lookout for any pause or pullback given the lengthy bullish run this index has enjoyed. I believe a pullback to test previously broken resistance would be healthy, albeit painful, and wrote an article about this last week. I am bullish over the longer term with this index but trends do not travel in straight lines forever, hence the lookout for any pullback.
S&P500 monthly:
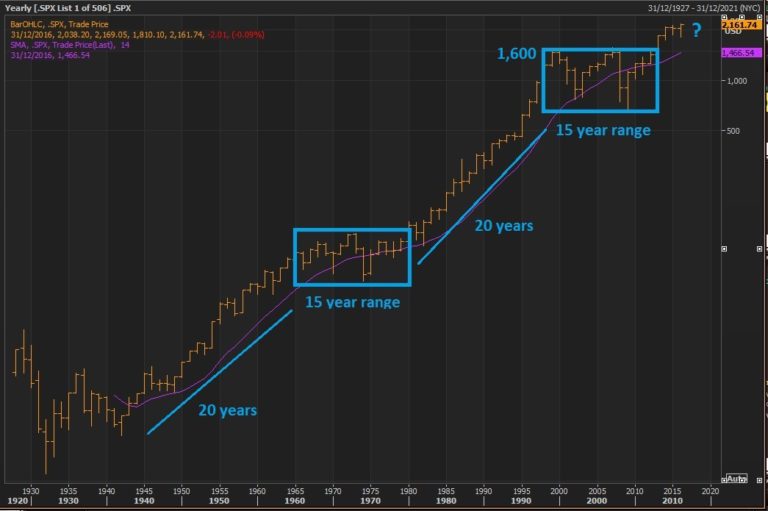
S&P500 yearly: the 1,600 level is the top of the last 15 years of trading range for the S&P500 and, I believe, this level will form up the bottom of the next multi year trading range. However, a test of this level before any potential continuation would not surprise me. In fact, I’d LOVE it!
S&P500 monthly: I note a 50% pullback of the recent bull run would bring price down to this 1,600 level:

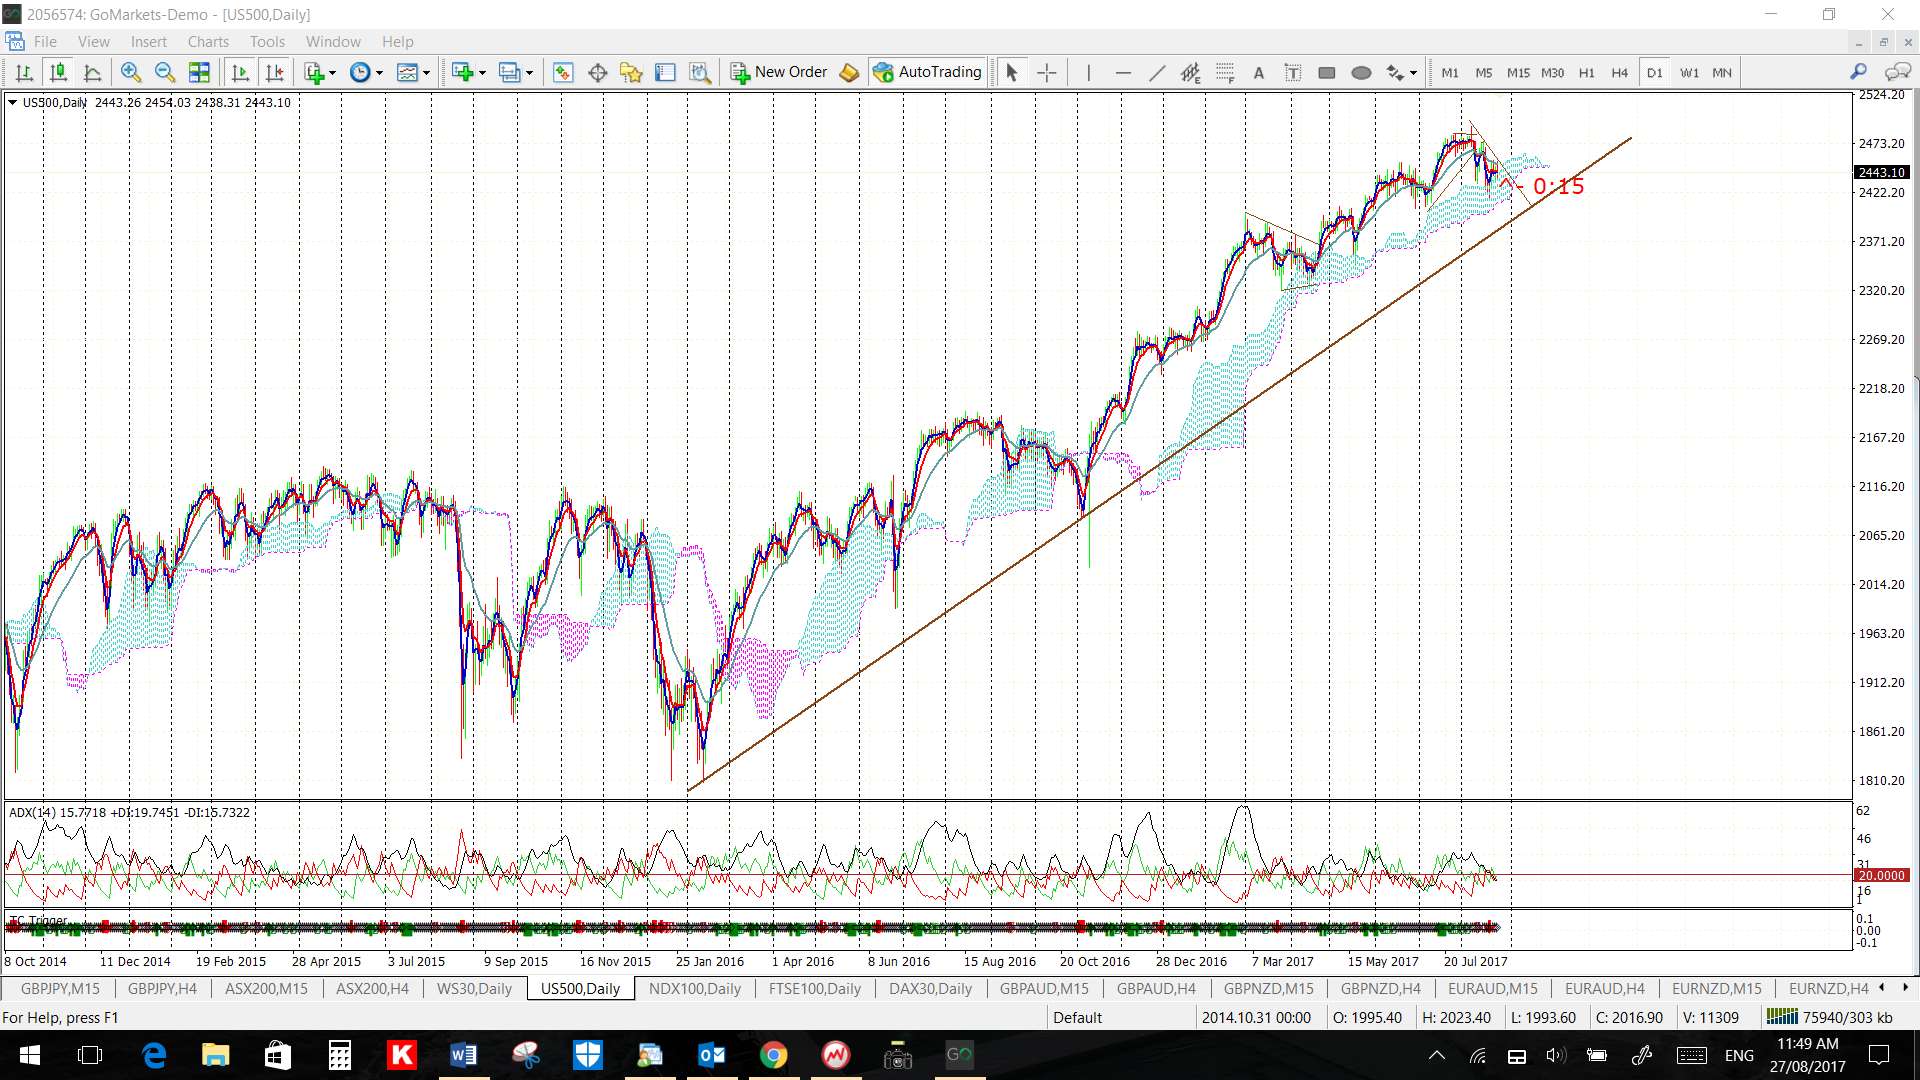
S&P500 daily: watch this trend line for any new make or break:
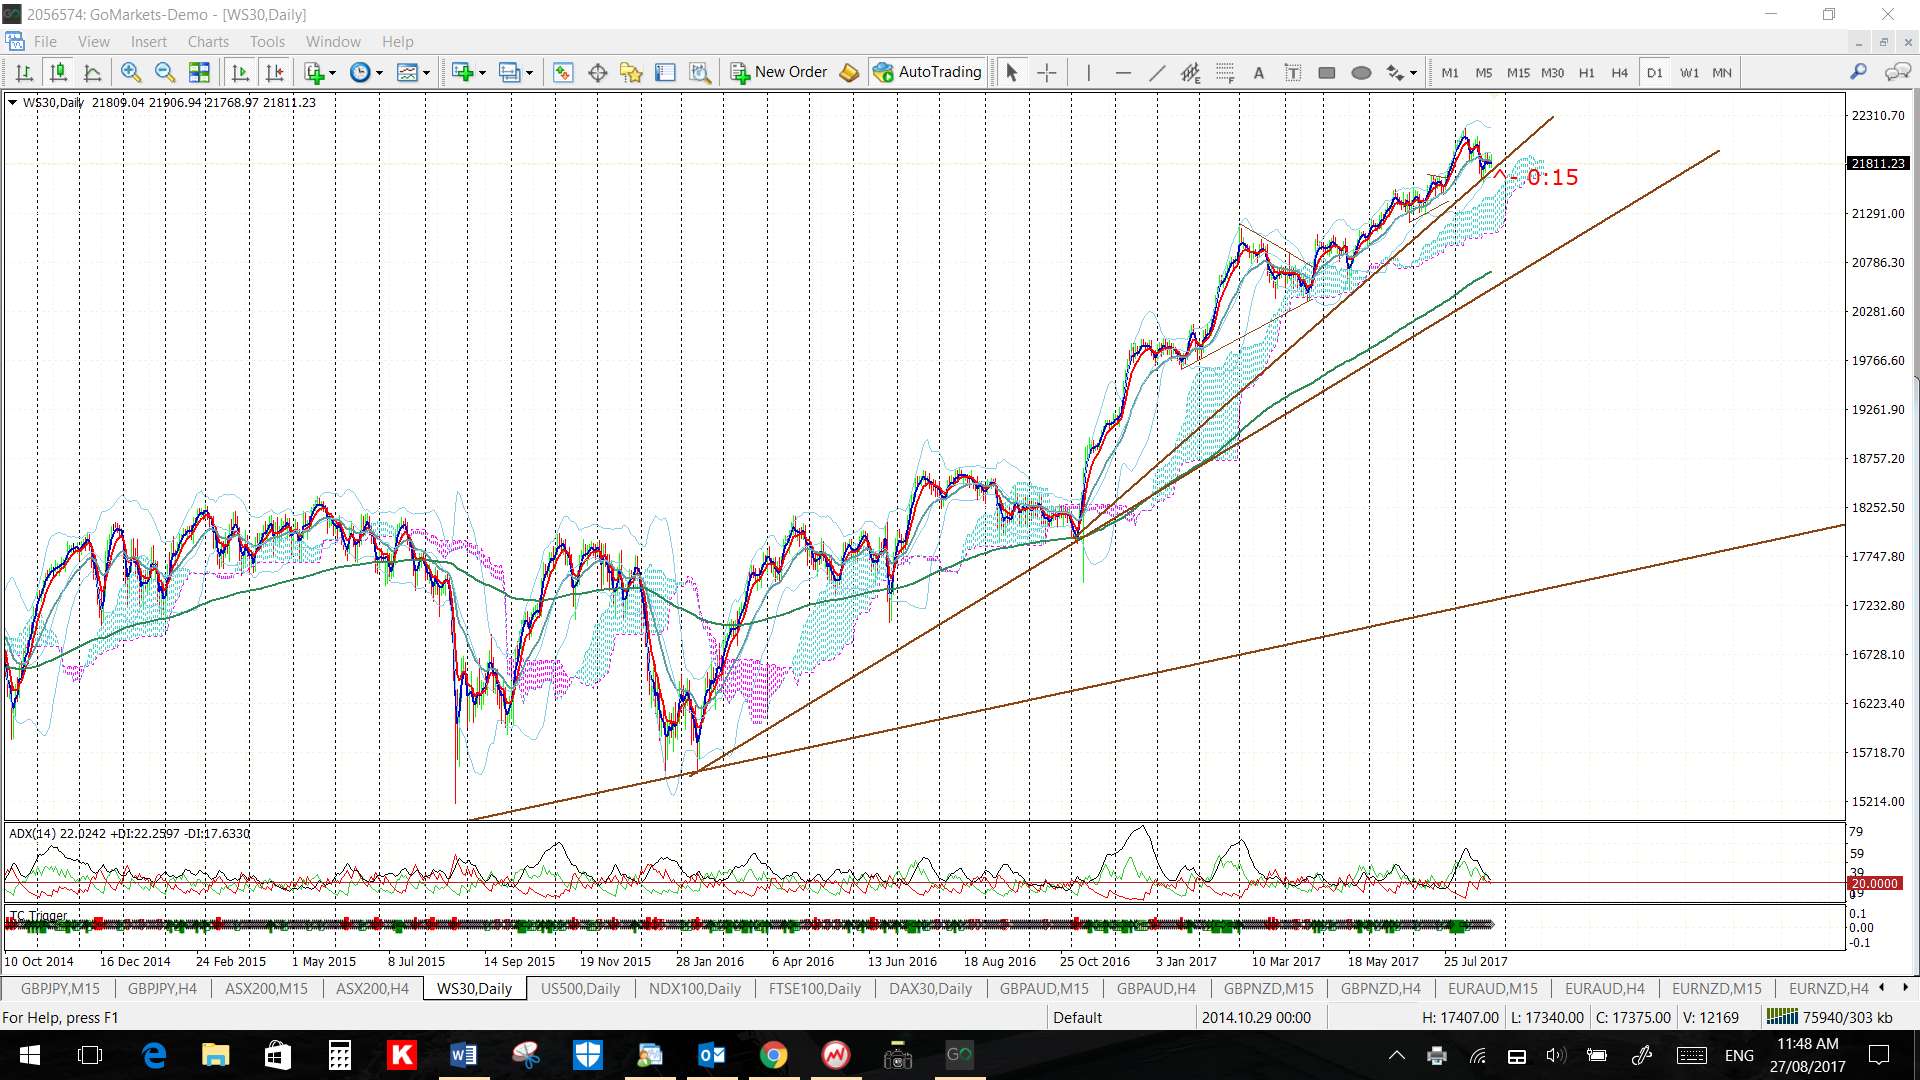
DJIA daily: watch this trend line for any new make or break:
NDX daily: NASDAQ-100: watch these trend lines for any new make or break:

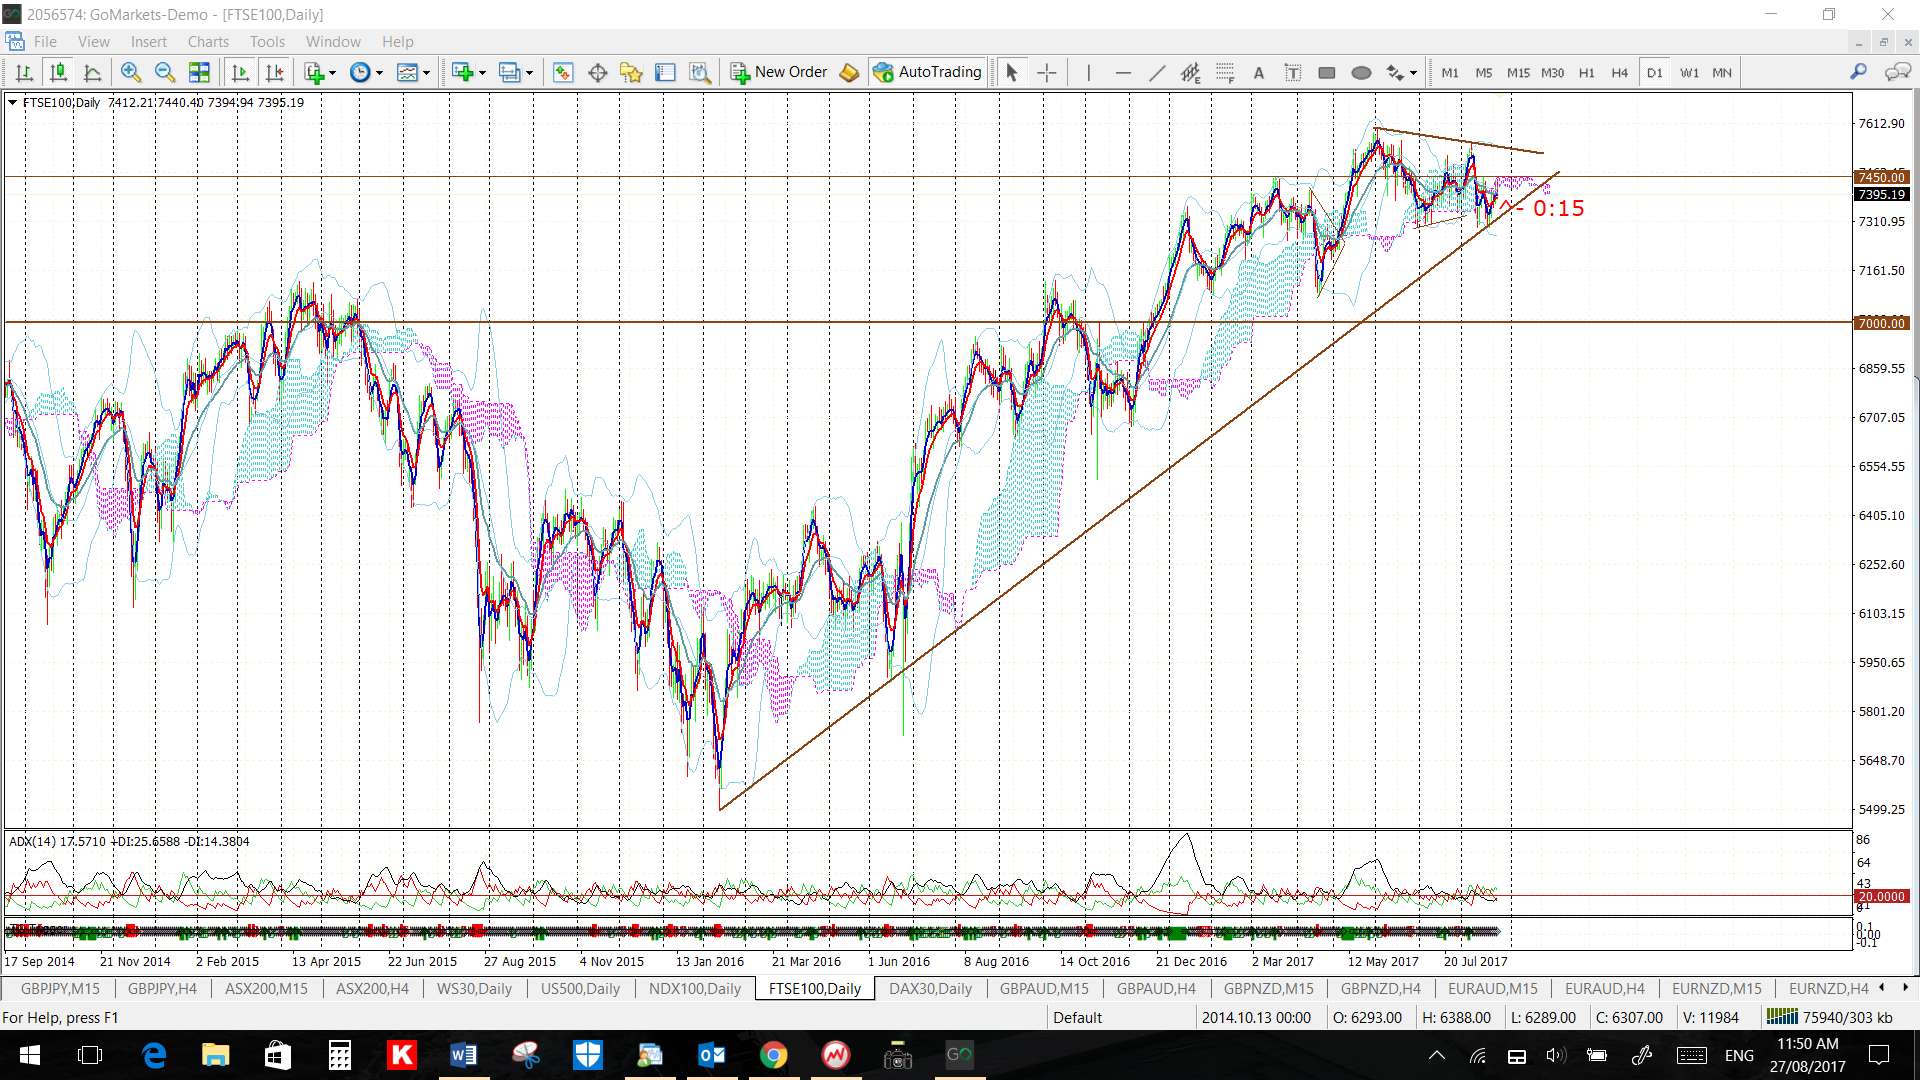
FTSE daily: watch these trend lines for any new make or break:
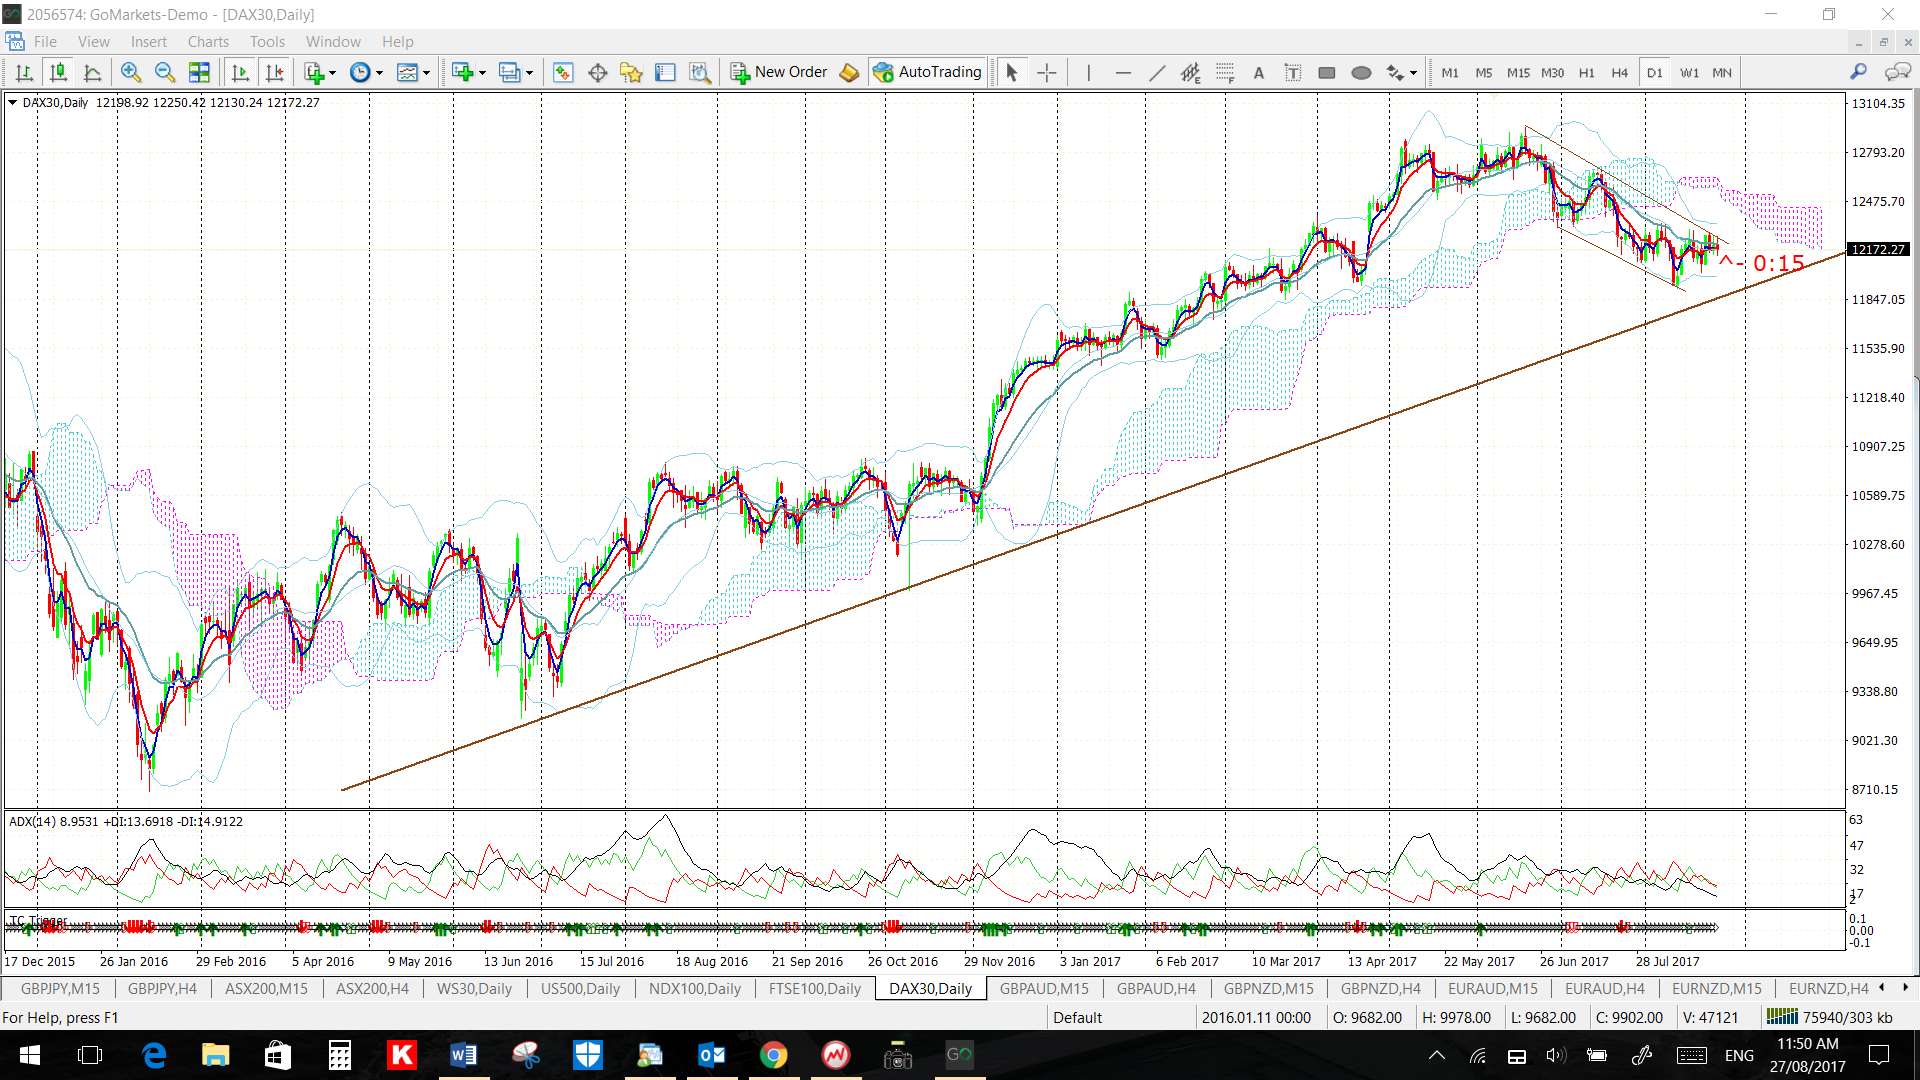
DAX-30 daily: watch these trend lines for any new make or break:
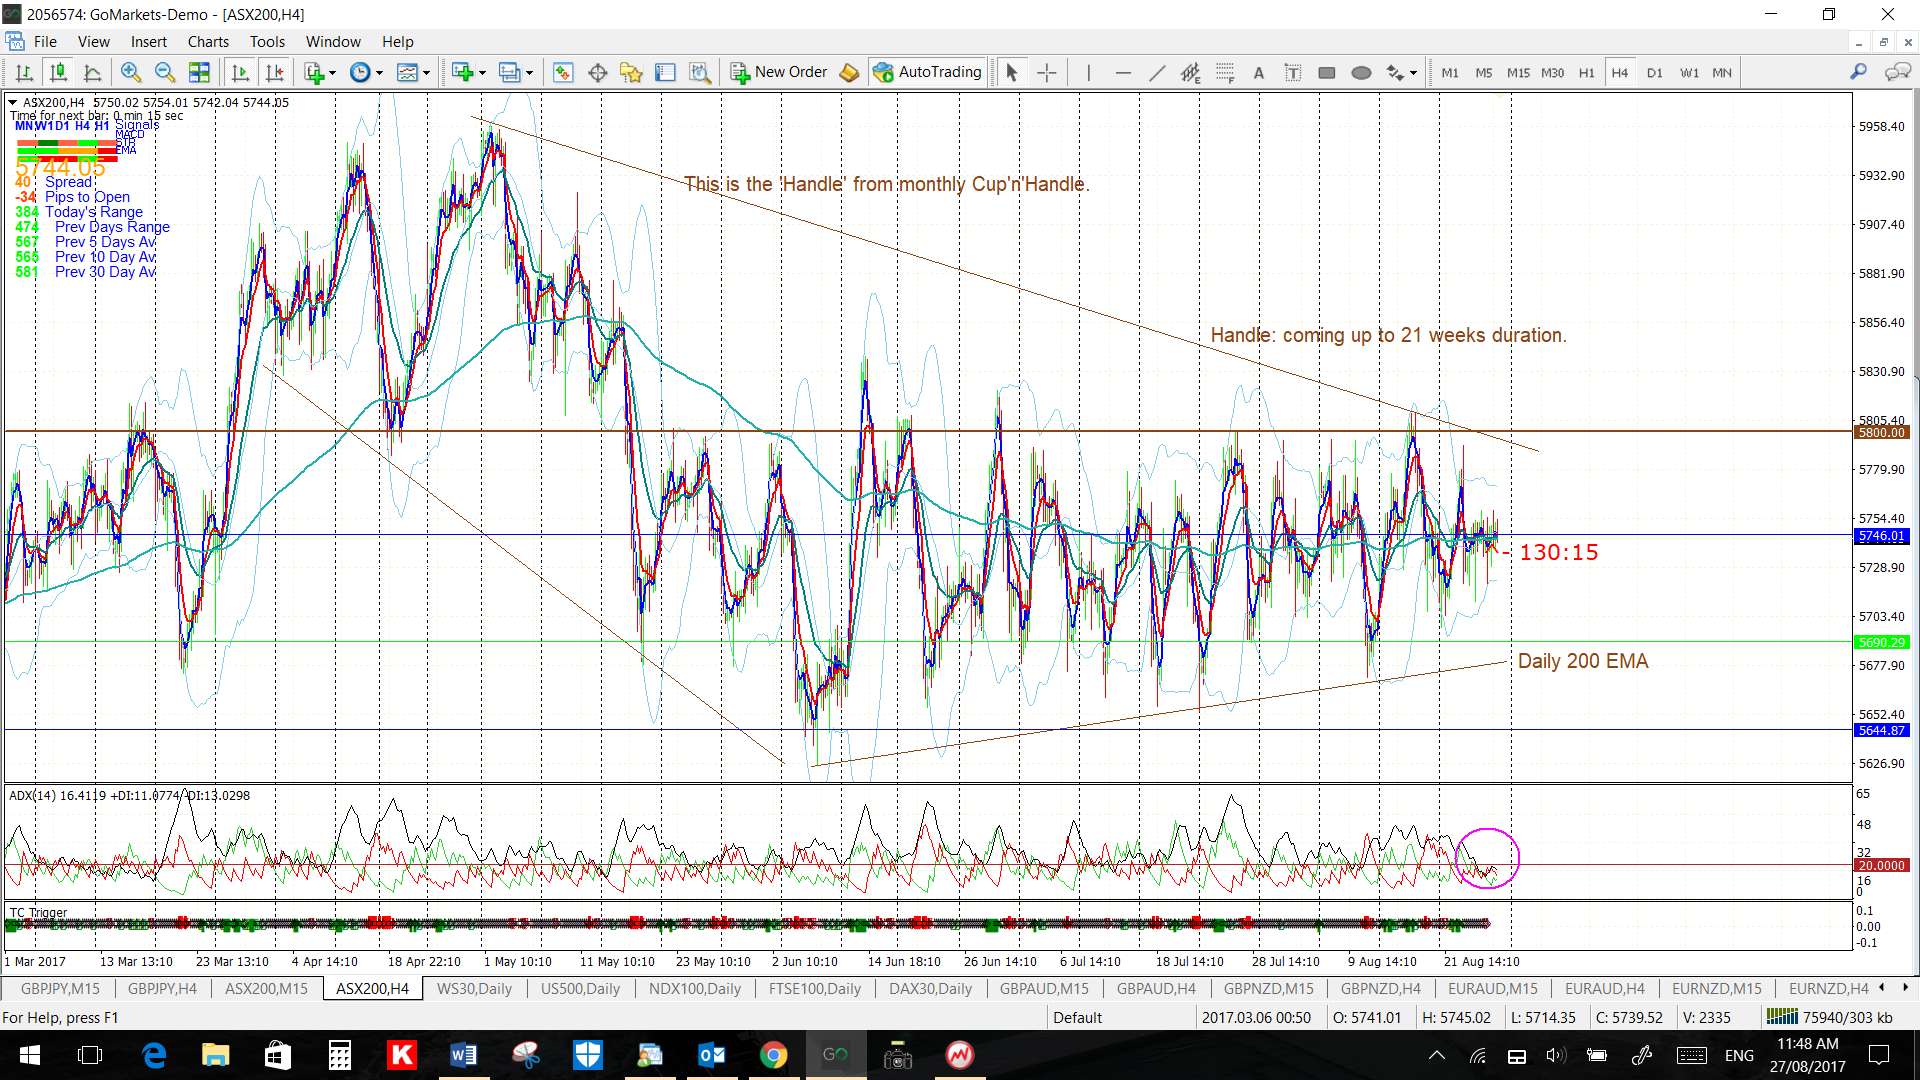
ASX-200 4hr: watch these trend lines for any new make or break: