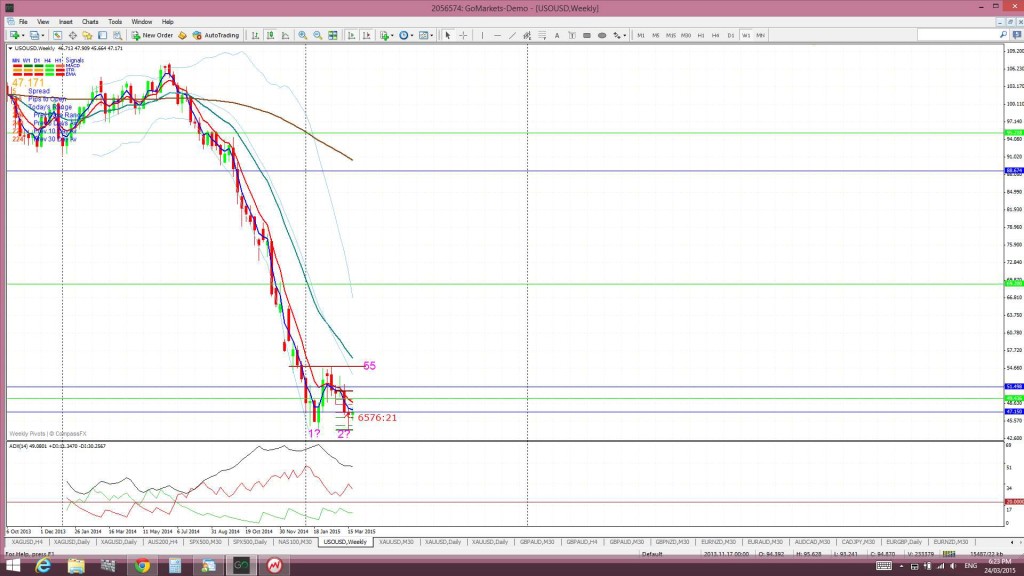
I have been noting in my w/e analysis how Oil looks like it may be trying to form a bullish ‘Double Bottom’ above $40 support. This post is a closer look at the commodity using my FX charting platform and with the help of the Ichimoku Cloud.
Oil weekly: Oil has been on a lengthy decline but if US$ weakness continues then this might help to form a bullish ‘Double Bottom’ above $40 support:
Oil daily: the daily chart reveals that the ‘neck line’ for any developing ‘Double Bottom’ would be at around the $55 level:
Oil 4hr: price action is choppy at the moment:
Oil Weekly Cloud: Price is a long way below the Ichimoku Cloud and, so, some reversion to the mean would not surprise here. The 61.8% fib retracement of this recent bear move is back near $83 and might be a target for any pullback here:
Oil Daily Cloud: Note how price has not been back above the Cloud since the start of this long decline. It is now edging back up towards the Daily Cloud though and a move back above the this would be rather bullish. The Cloud is angled downwards and so the top of this resistance zone might tie in with a break of the $55 ‘neck line’:
Oil 4hr Cloud: price is stuck in the 4hr Cloud and so it is not surprising that price action is choppy at the moment.
Summary: watch for any close and hold back above the daily Cloud and / or $55 region to support a bullish ‘Double Bottom’ move on Oil. Fib levels suggest a target up near $83 for any potential pull back move.
The post Oil: a look at the FX charts here. appeared first on www.forextell.com.


